Article

Active Faults, Kinematics, and Seismotectonic Evolution during Tajogaite Eruption 2021 (La Palma, Canary Islands, Spain)

by
Miguel Ángel Rodríguez-Pascua
1,*,
Raúl Perez-Lopez
1,
María Ángeles Perucha
1,
Nieves Sánchez
2,
Julio López-Gutierrez
1,
José F. Mediato
1,
David Sanz-Mangas
2,
Gonzalo Lozano
1,
Inés Galindo
2,
Juan Carlos García-Davalillo
1,
Carlos Lorenzo Carnicero
1 and
Marta Béjar
1
1
Instituto Geológico y Minero de España (IGME-CSIC), Ríos Rosas, 23, 28003 Madrid, Spain
2
Instituto Geológico y Minero de España (IGME-CSIC), Unidad Territorial de Canarias, C/Alonso Alvarado, 43, 2A, 35003 Las Palmas de Gran Canaria, Spain
*
Author to whom correspondence should be addressed.
Appl. Sci. 2024, 14(7), 2745; https://doi.org/10.3390/app14072745
Submission received: 30 January 2024 / Revised: 13 March 2024 / Accepted: 21 March 2024 / Published: 25 March 2024
(This article belongs to the Special Issue New Challenges in Seismic Hazard Assessment)

Abstract

:
During the 2021 La Palma strombolian and fissure eruption, two faults were identified that controlled the spatial distribution of earthquake hypocenters and effusive eruptive vents. One of these faults has a NW-SE trend (Tazacorte Fault: TZF) and the other one shows an ENE-WSW trend (Mazo Fault: MZF). Previous works on fault structural analysis in La Palma indicated that the eruption zone was compatible with an extensional tectonic strain ellipsoid which activated normal-strike-slip directional faults at the confluence of TZF and MZF. These fractures were activated during the 2021 Tajogaite eruption, determining the NW-SE and WSW-ENE spatial distribution of vents. Both faults were mapped in real time during the volcanic eruption from fieldwork and remote sensing imagery (aerial drone images). We have collected more than 300 fracture data associated with the effusive vents and post-eruption seismic creep. Since the affected area was densely inhabited, most of these fractures affect houses and infrastructures. Some of the houses affected by the TZF were damaged 9 months after the eruption, although they were not damaged during the eruption. Surprisingly, these houses already had repairs made to the same fractures since 1980, giving information of previous fault creep movement. During the 2021 Tajogaite eruption, shallow seismicity was spatially related to both faults, suggesting a seismic behavior instead of the precedent creep movement. However, the lack of seismicity after the eruption indicates that the faults went back to creep aseismic behavior, similarly to 1980. The mapping and monitoring of these faults (TZF and MZF) is relevant bearing in mind that they have been active since 1980 and the post-eruptive phase of the 2021 volcanic eruption, which has to be included in the land use planning in areas affected by the volcanic eruption and creep movement. Furthermore, both faults could act as seismogenic sources triggering volcanic earthquakes with potential high macroseismic intensities and mass movements. The data presented here show the importance of having this type of study before the onset of the eruption, thus allowing a better interpretation of seismic data during volcanic unrest.

1. Introduction

The 2021 Tajogaite eruption was a subaerial fissure eruption with both effusive and explosive styles. The activity was mainly strombolian with episodic phreatomagmatic phases. The eruption opened along a NW-SE-oriented fissure, which was conditioned by previous fracturing. This fracturing has been acting aseismically (creep), affecting houses and infrastructure. Examples of fracturing in volcanic environments with seismic and aseismic movement appear in the works of [1,2,3,4], on the geodynamics of Etna eruptions and the activation of faults with effects on buildings and infrastructure.
The previous structural geology work based on the population analysis of faults [1,2] constitutes the geodynamic framework used in this work to enable an interpretation of the seismicity data recorded by the Instituto Geográfico Nacional (IGN: https://www.ign.es/web/ign/portal/sis-area-sismicidad; accessed on 15 January 2024) and its relationship with the 2021 Tajogaite eruption. These authors calculated the surface deformation tensor from kinematic markers on fault planes in the field, after which they applied brittle deformation criteria based on the Anderson fracturing model [5,6]. Subsequently, these authors prepared maps of the shape of the strain tensor (K’), which represent the average characteristics of the strain tensor throughout the island. This spatial distribution of tectonic deformation makes it possible to estimate the average orientation of active faults by sector, as described from their kinematics: their direction, their dip, and the movement striation on the fault plane. Based on the study of the kinematics of active faults and the depth distribution of earthquakes during the Tajogaite eruption, this work presents two master faults that have been active since before the 2021 eruption: the Tazacorte Fault (TZF) and the Mazo Fault (MZF). In addition, these faults are noted at present for a creep movement that is producing deformations and structural damage in homes and anthropogenic constructions. Finally, in this work, we show that both faults are still moving aseismically after the 2021 eruption and could be future sources of earthquakes of low magnitude but high macroseismic intensity.

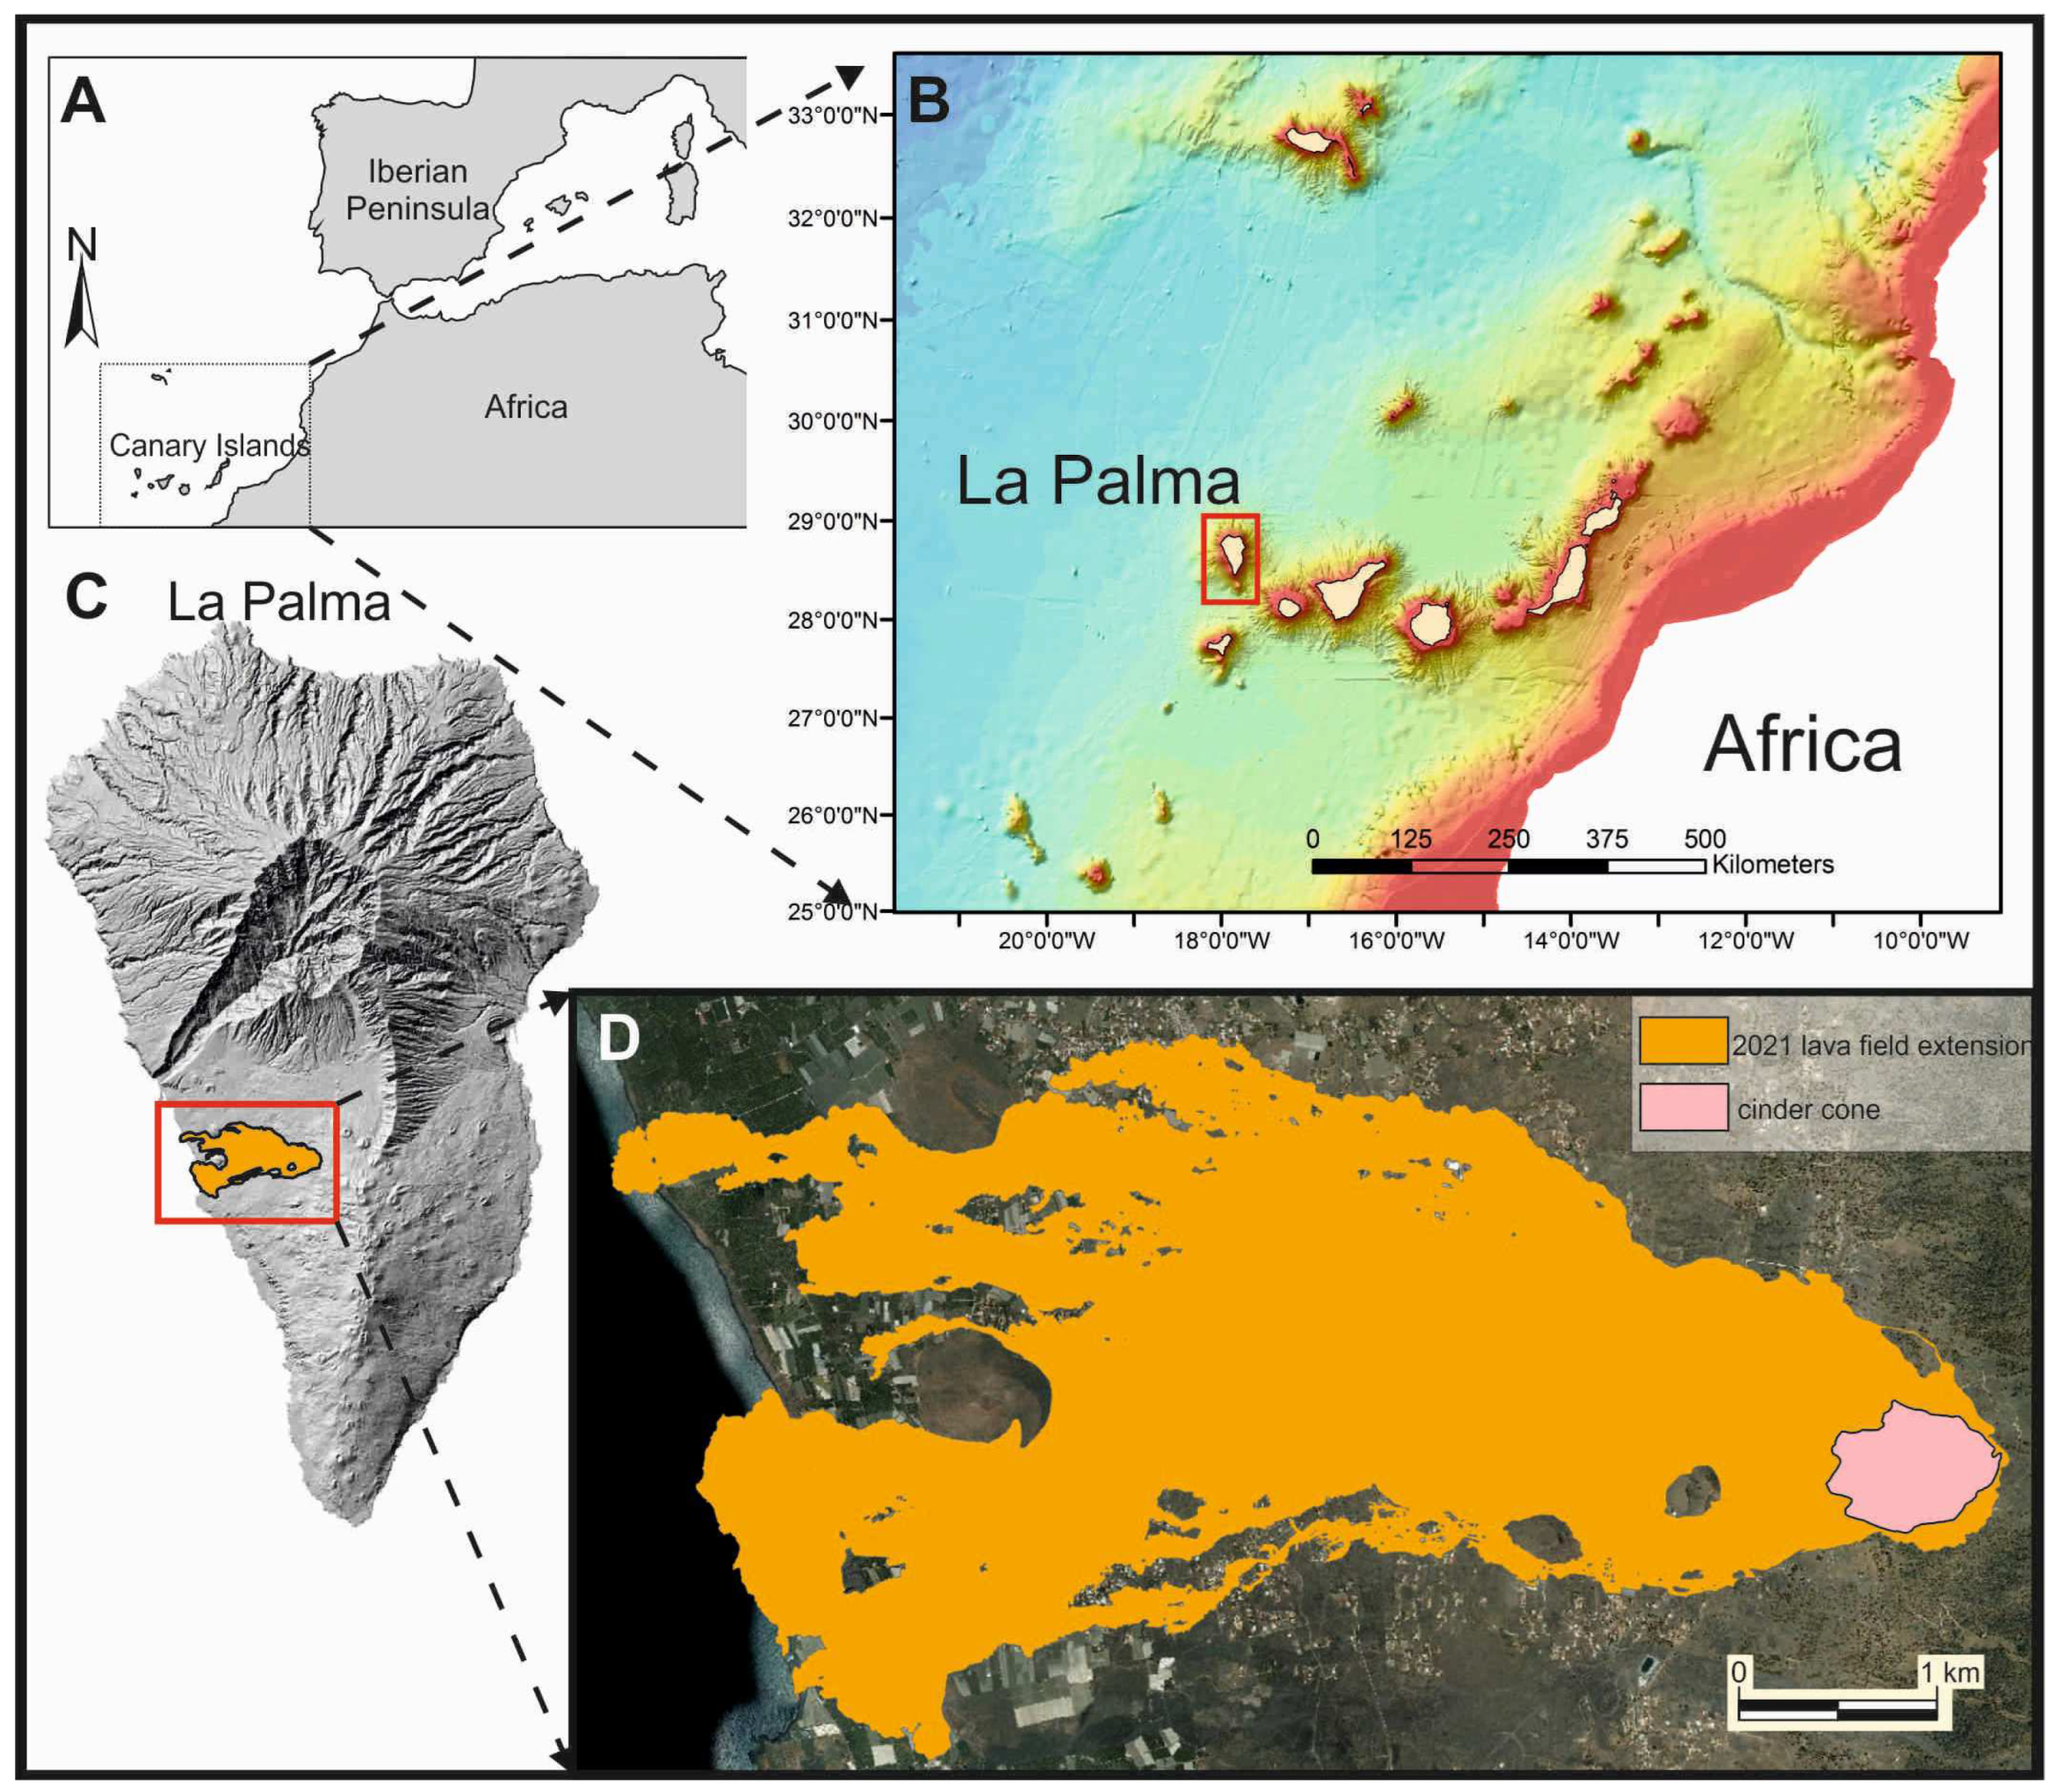
2. Geographical and Geological Setting

La Palma Island (Figure 1), located at 28°39′59″ N–17°51′59″ W, is one of the main eight emerged volcanic islands that comprises the Canary archipelago. The Canary Islands are an intraplate archipelago that was formed from the Miocene to the Holocene in a passive margin [7] on an oceanic lithosphere [8,9,10] of Jurassic age [11,12]. The geological history of each island has been different over time, with activity beginning on each of them at different times and each one evolving differently, which makes it difficult to establish a general evolutionary model for all of them [13,14,15]. In the Canary Islands, the plate-scale stress field is conditioned by the Mid-Atlantic Ridge, the kinematics between Eurasia and Africa and other tectonic structures, such as regional fault systems [16,17].
The island has a complex geology formed essentially by three volcanic units bound by unconformities: the basal complex, the older volcanic series, and the recent volcanic series [18,19,20]. Debris avalanche deposits appear at the top of the basal complex as do old volcanic sequences related to large flank collapses. The recent volcanic series has taken place in the Cumbre Vieja volcanic ridge (CV) located in the south part of the island. CV is a large rift-type volcano trending in a N-S direction, its main eruptive vents being aligned on the rift axis with more than 125 Ka, and it is predominantly composed of basaltic lavas and pyroclasts [20,21]. CV had at least seven of the fourteen historical eruptions that occurred in the Canary Islands. On 19 September 2021, a new eruption opened on the west of the island after 50 years of dormancy with the eruption of Teneguía in 1971 in the southern part of the island [18,19,20,21].
The Tajogaite 2021 volcanic eruption had a violent strombolian style (Volcanic Explosivity Index 3 (VEI)) with high effusive activity. During the first stages of lava emission, the La Palma volcano issued basanite–tephrite lavas, developing mostly a’a flows that eventually increased in basanite composition, increasing fluidity [22]. The eruption lasted more than 85 days and the lava field covered an area over 1200 ha, reaching a maximum thickness of up to 70 m and affecting almost 3000 buildings (Cabildo de La Palma https://volcan.lapalma.es/ (accessed on 15 January 2024), PEVOLCA, Copernicus Emergency, ref. [23]).

3. Methods and Data

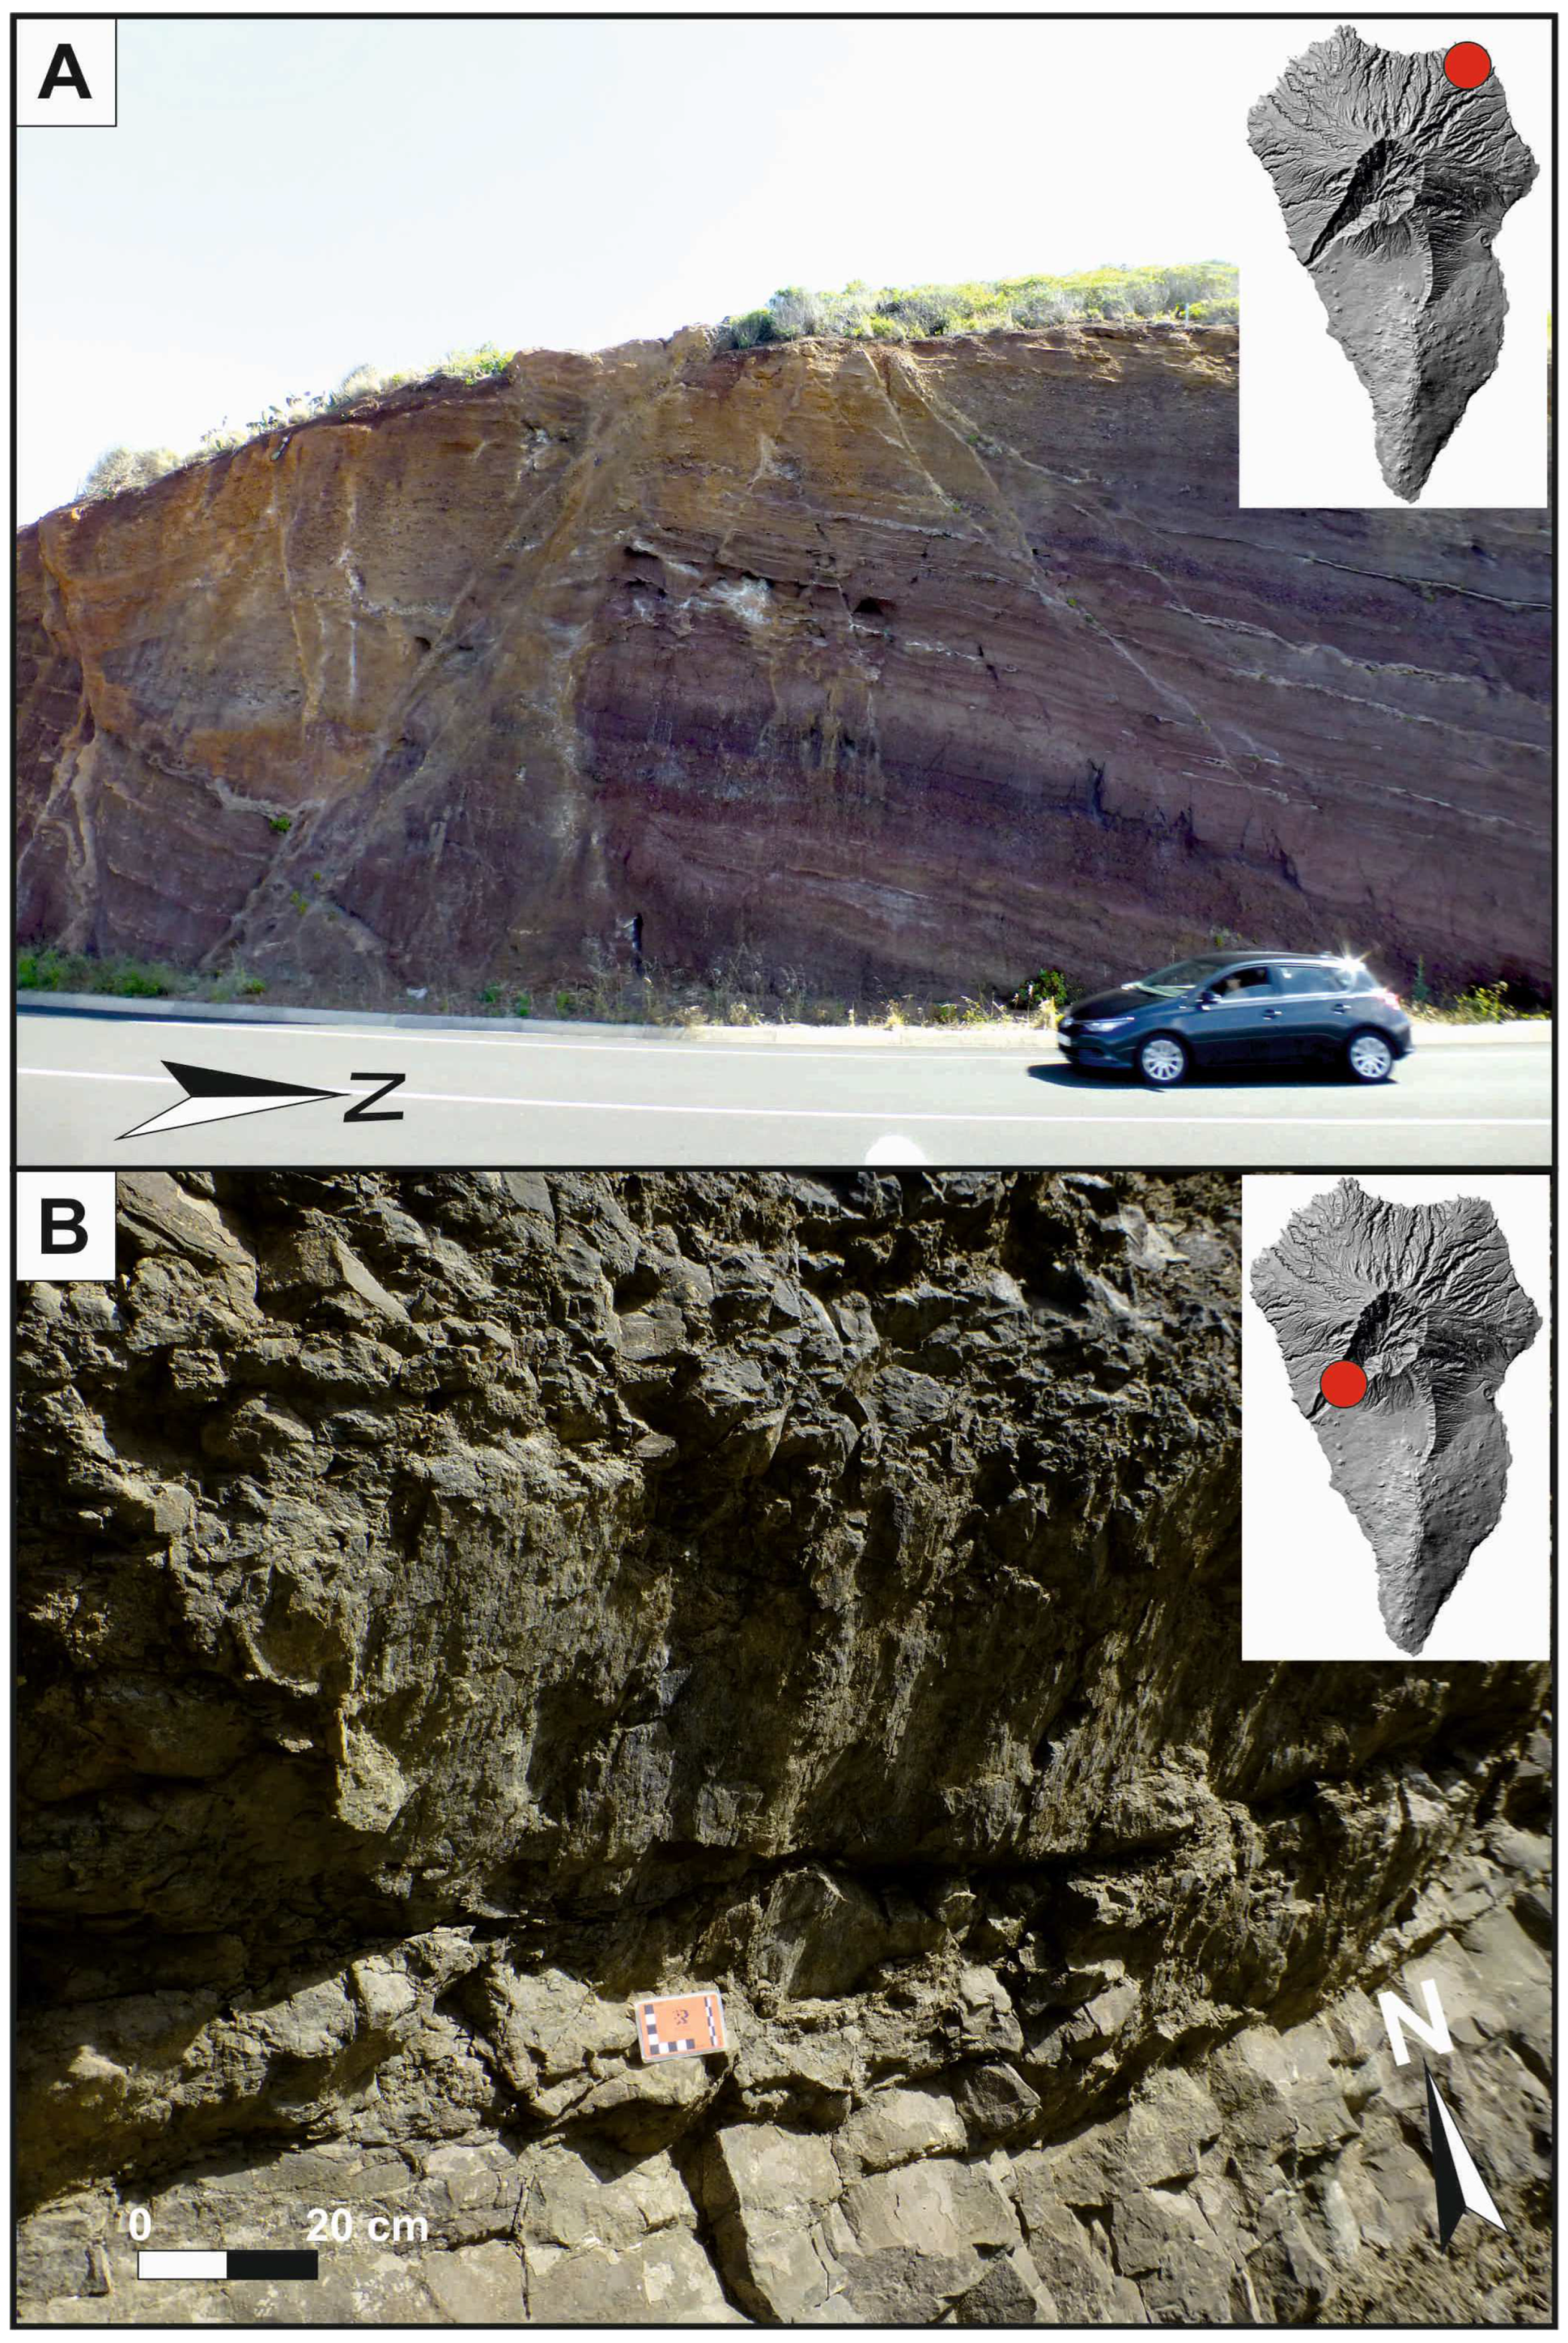
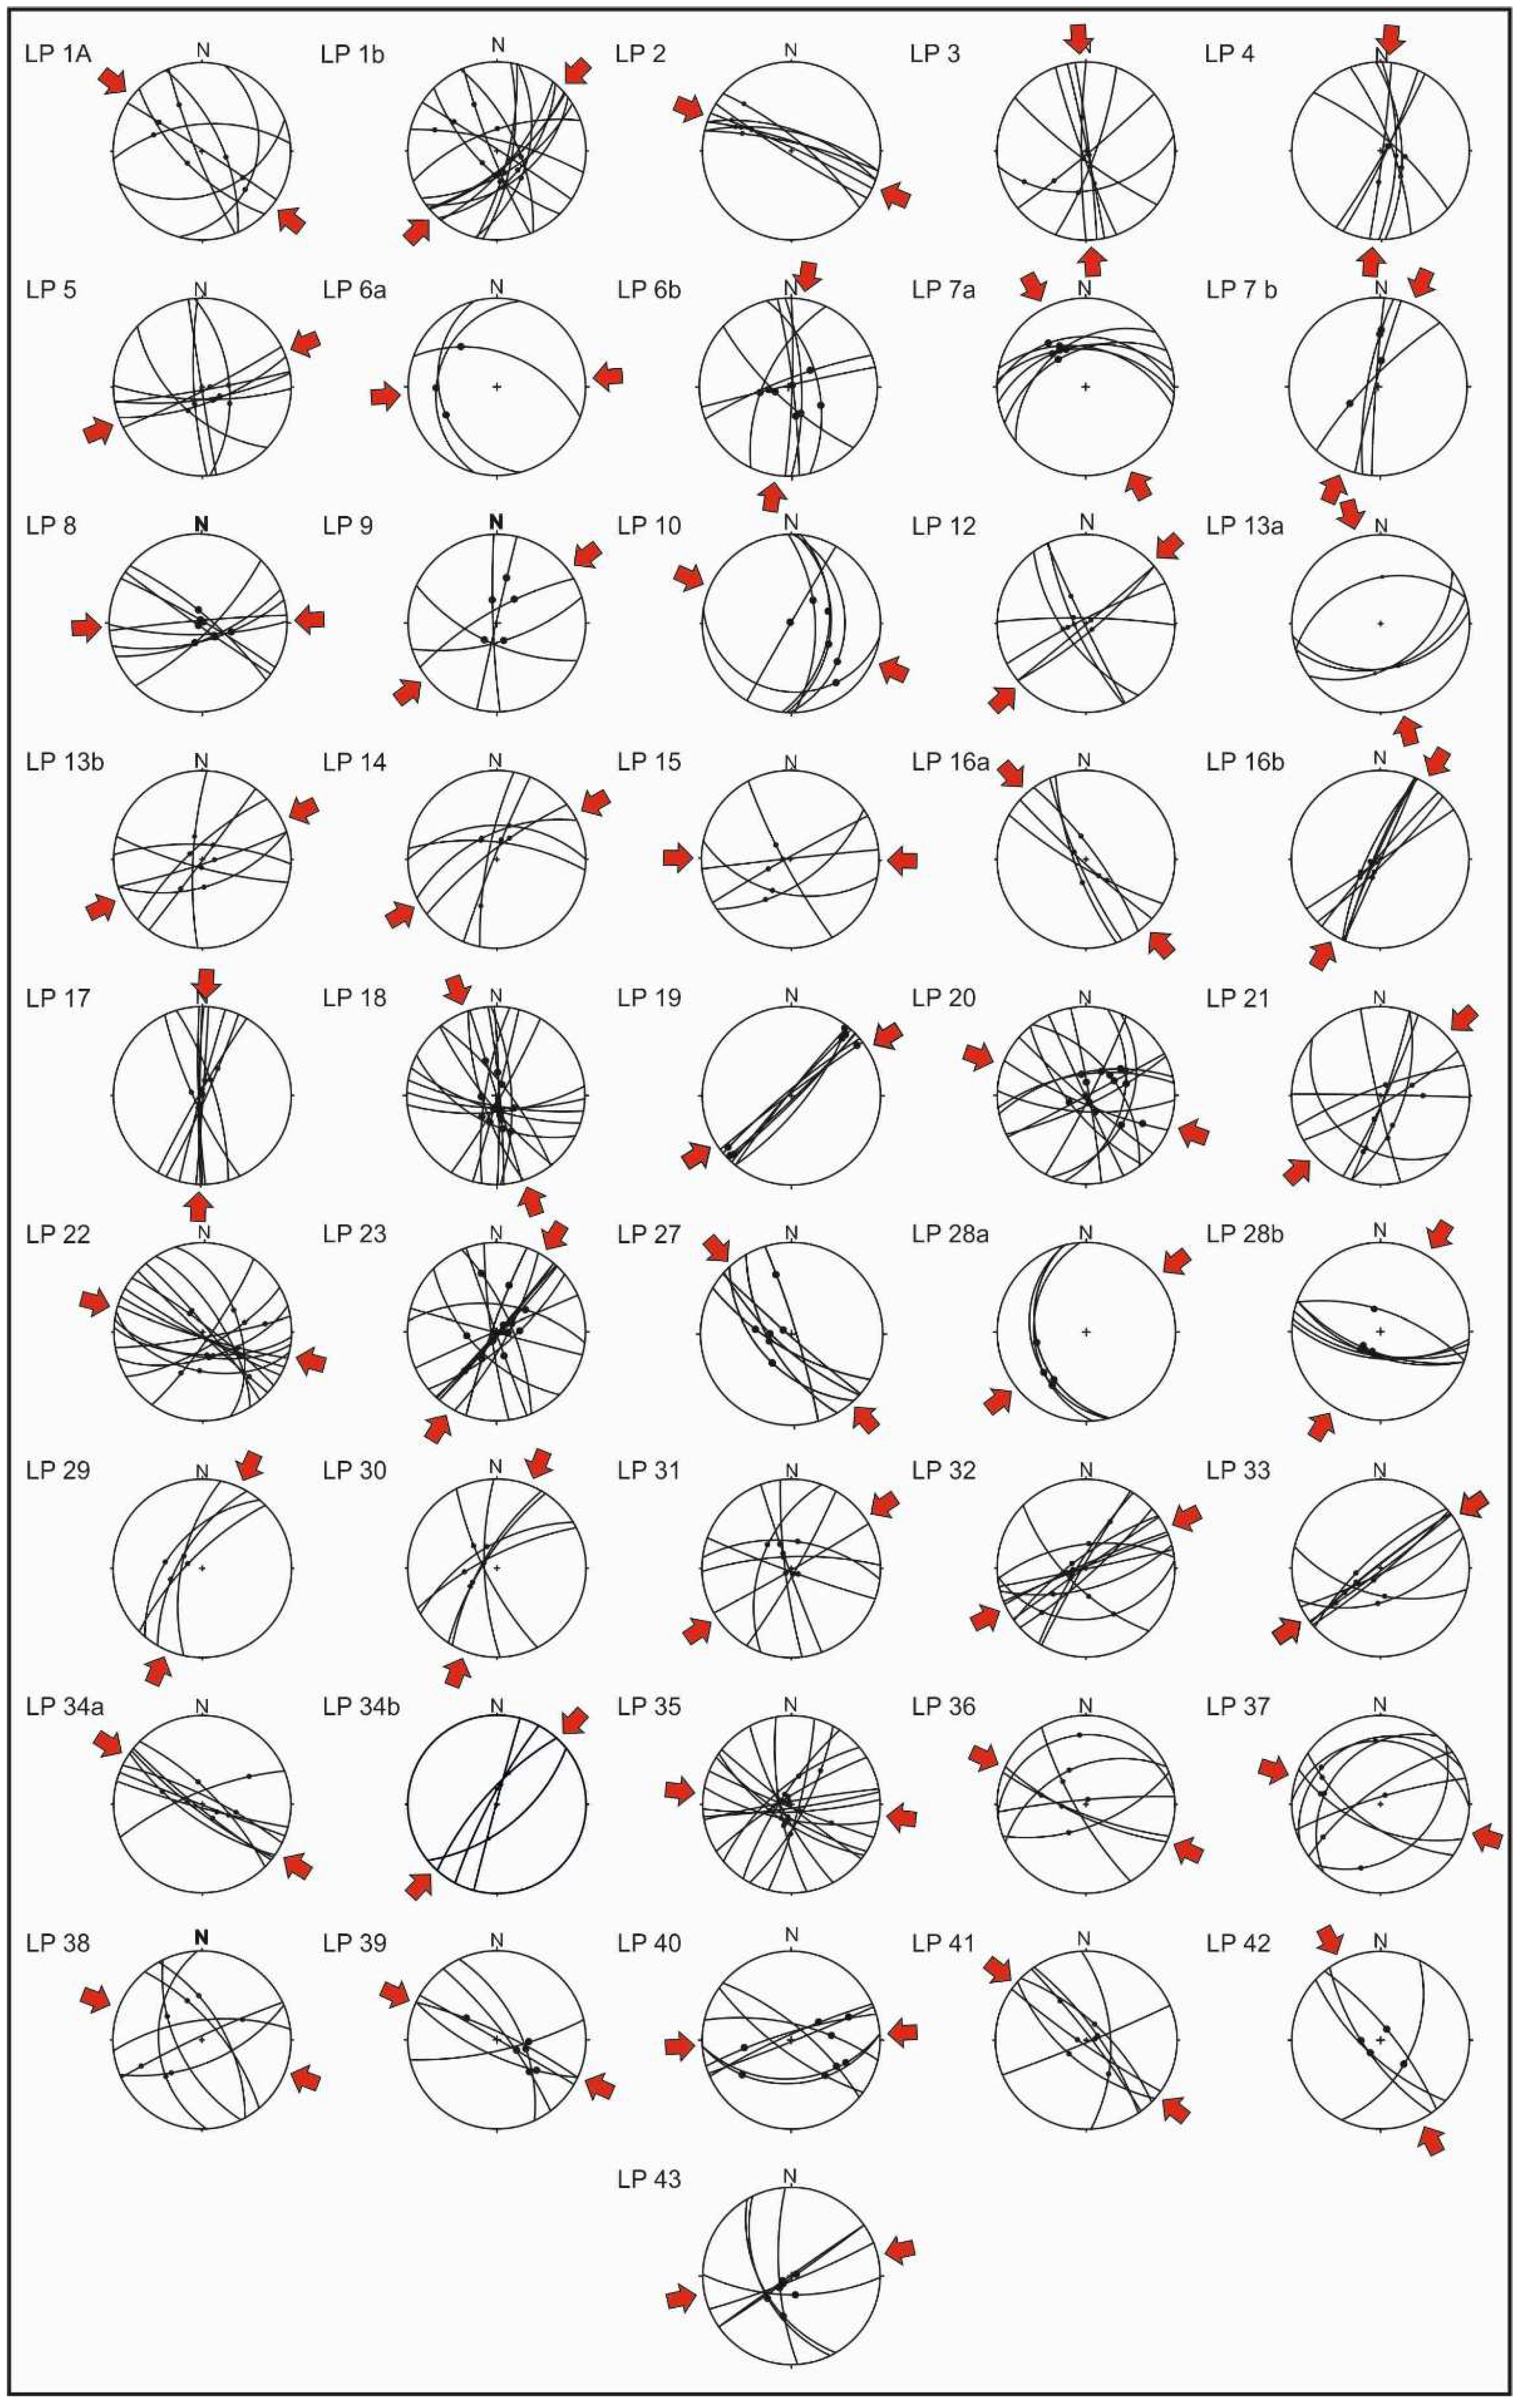
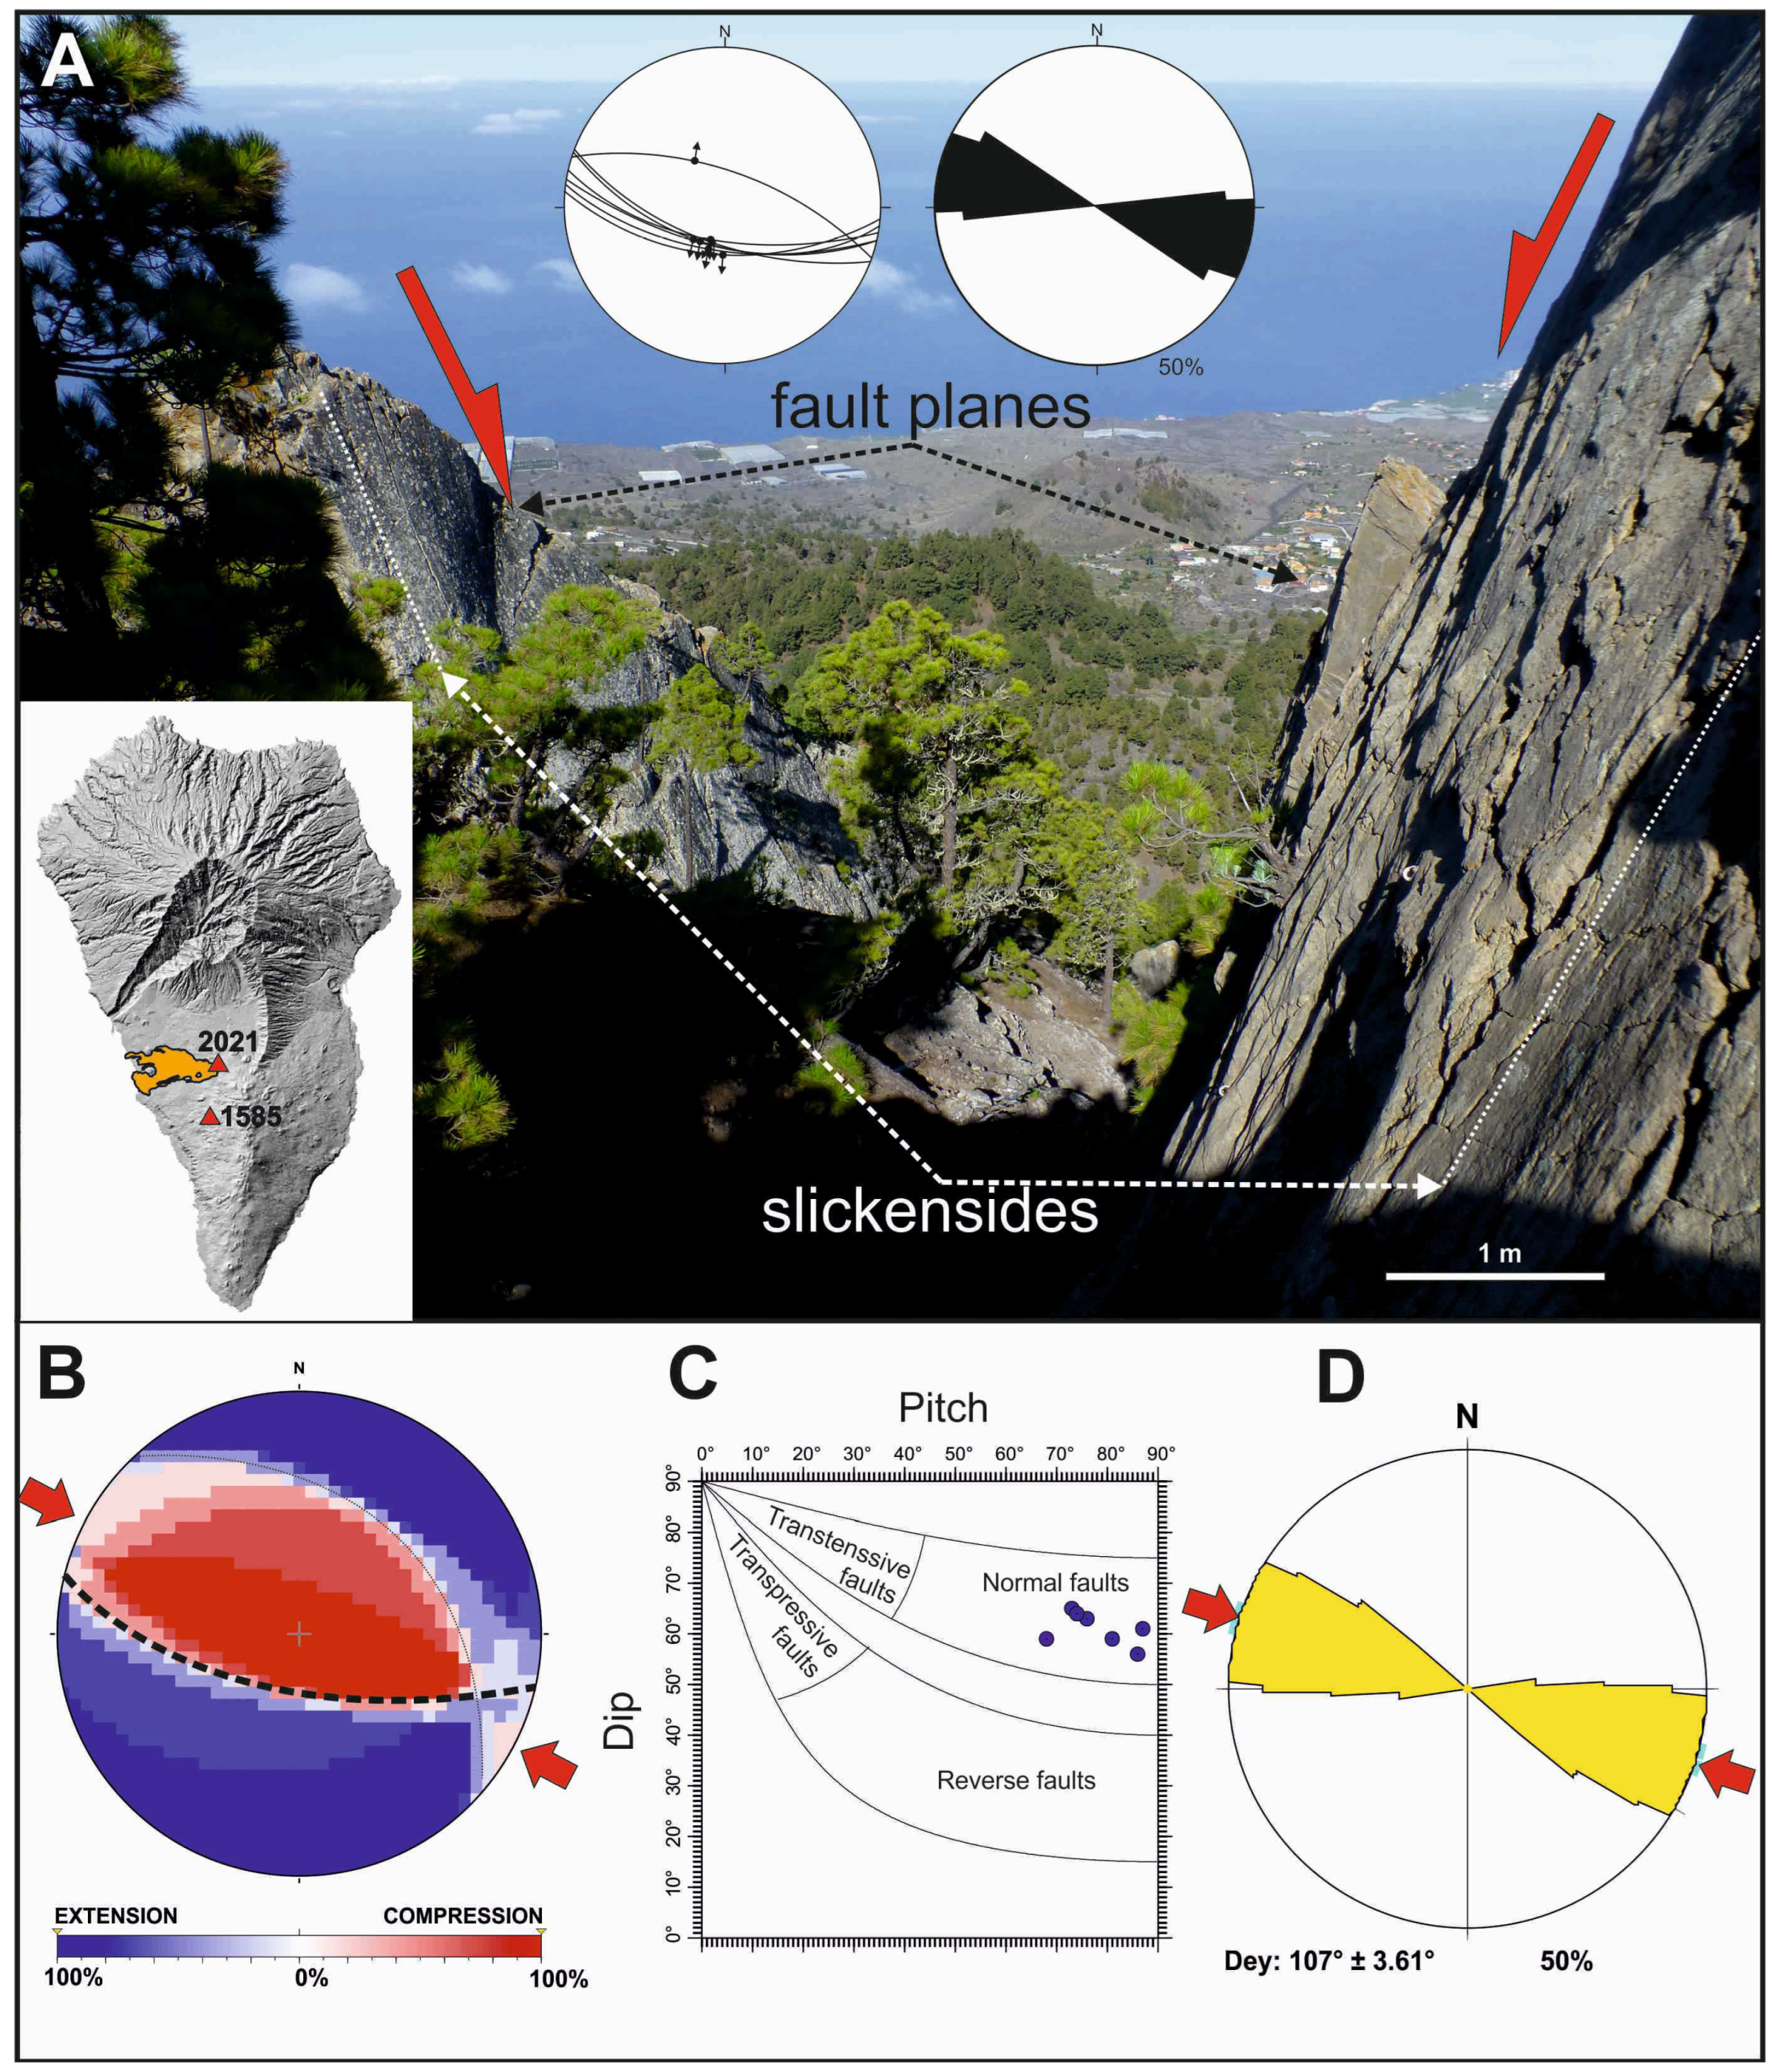
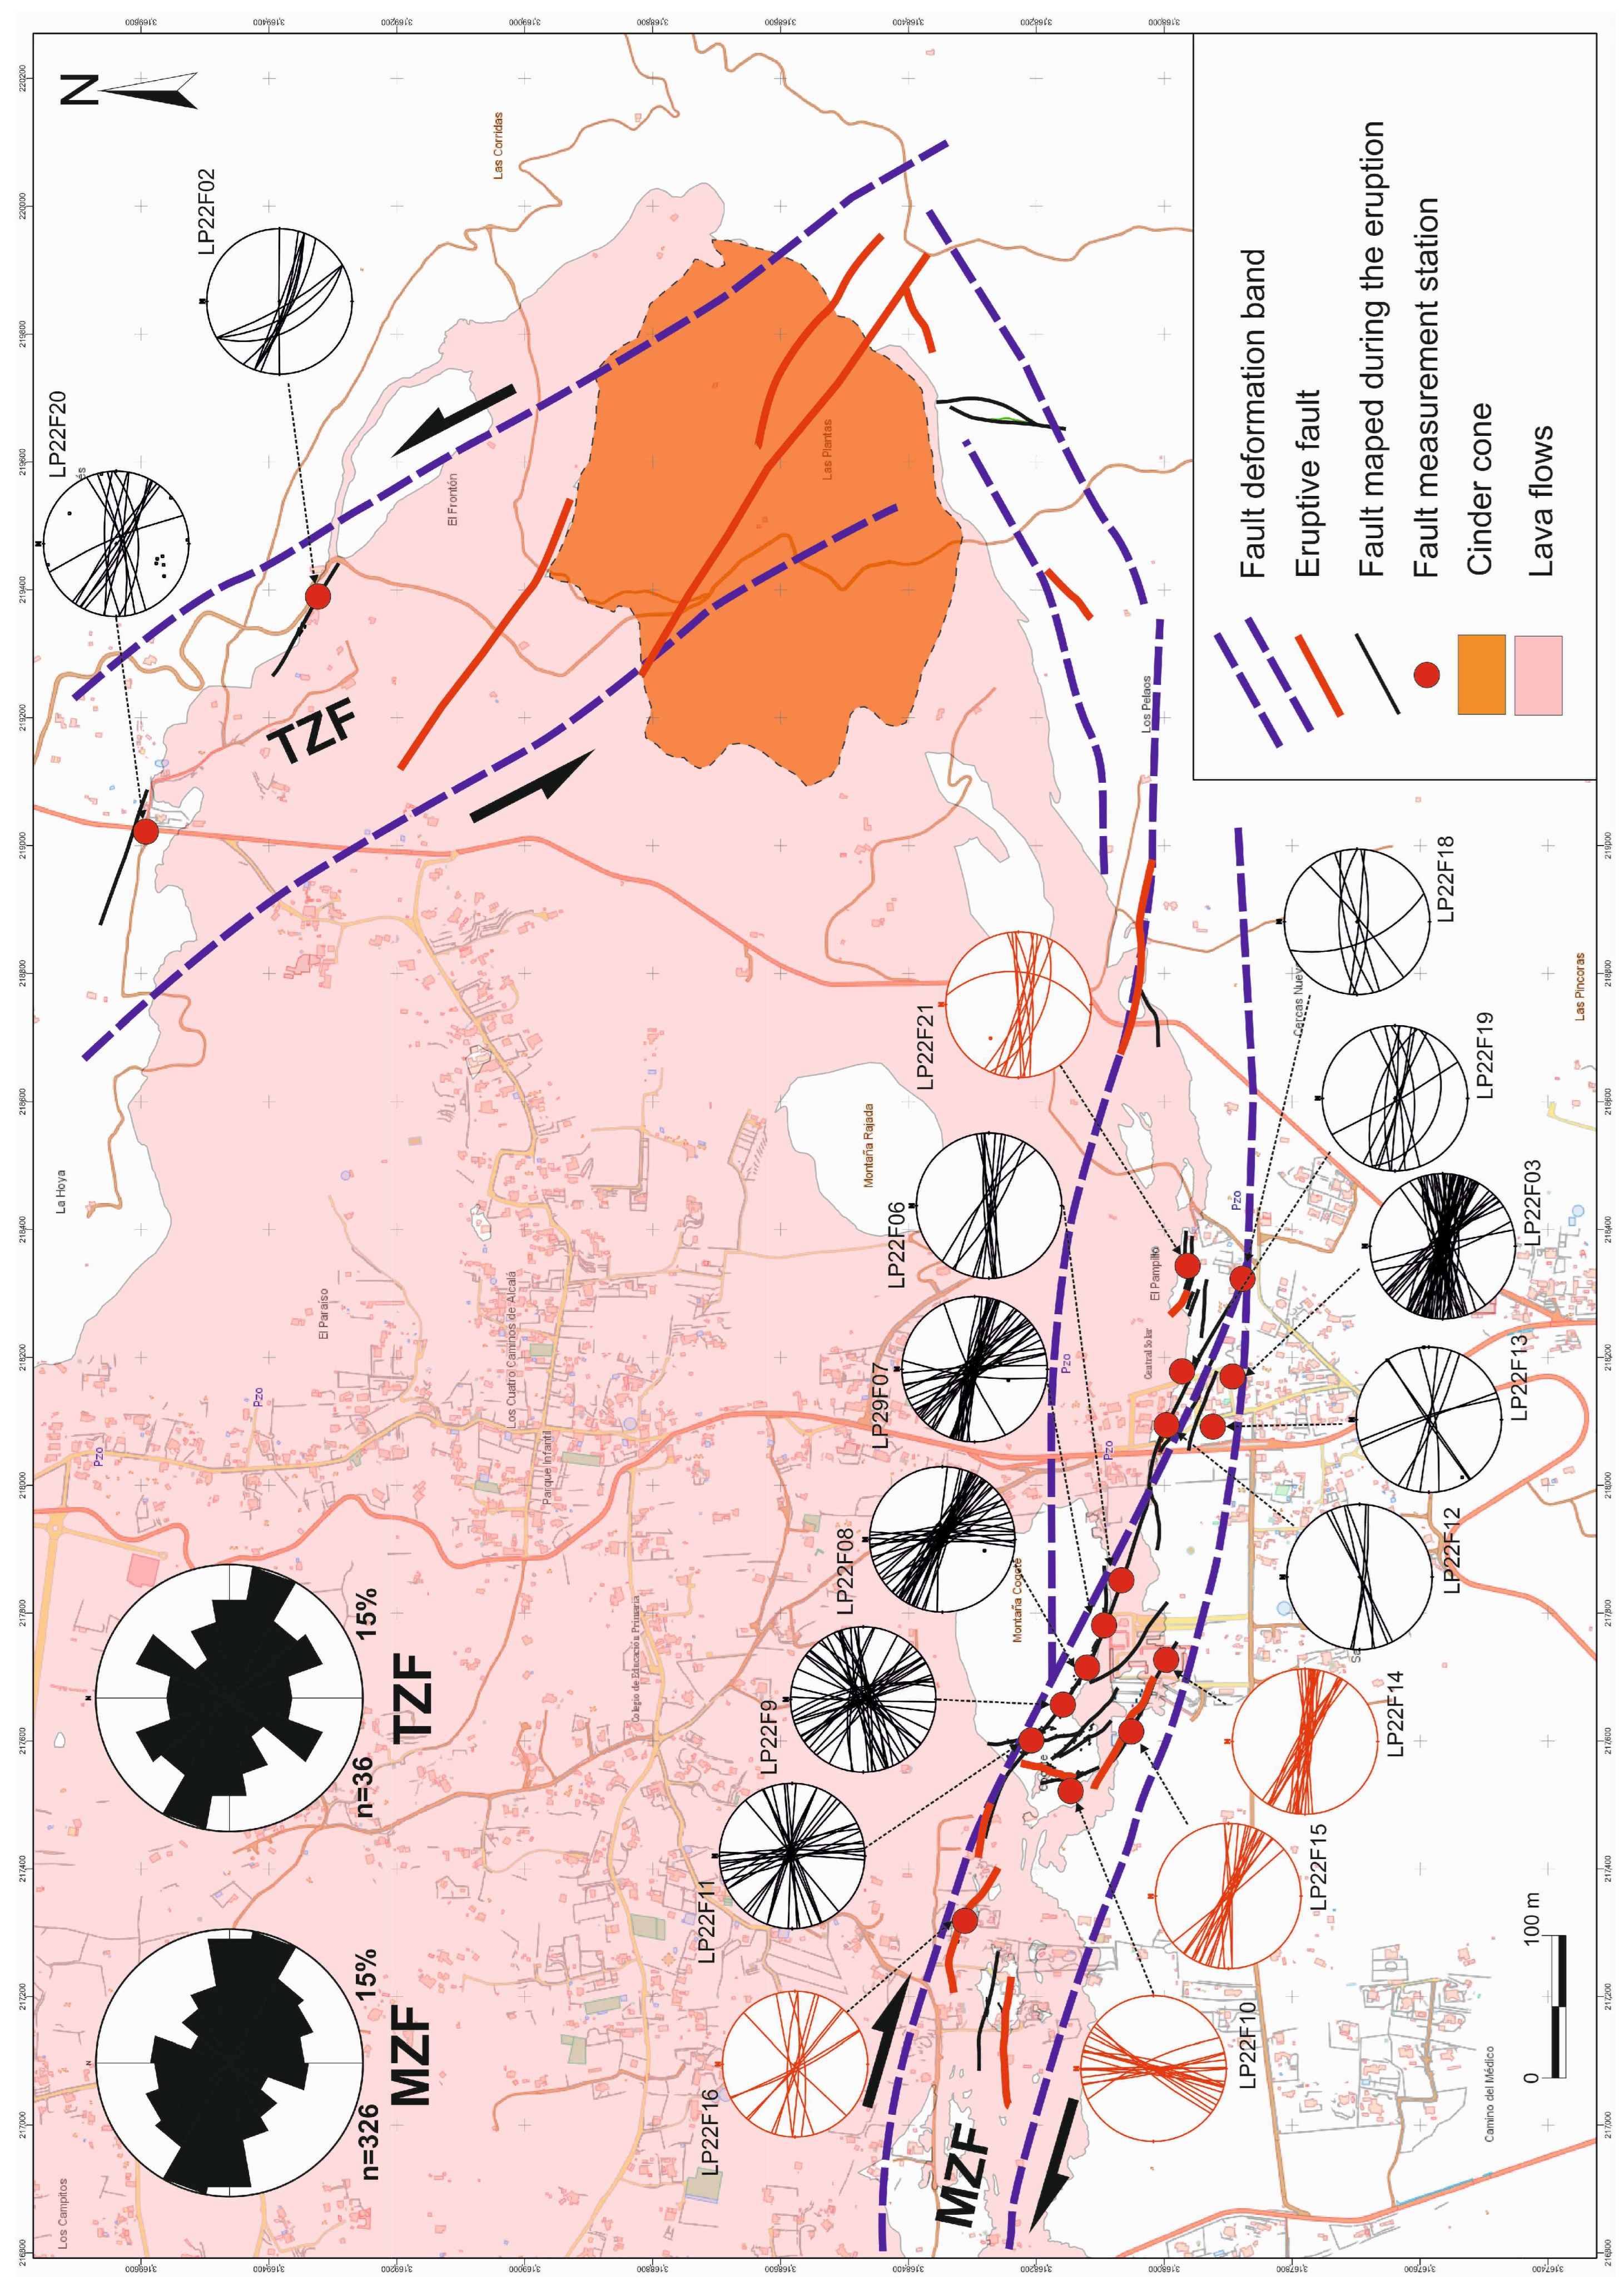
3.1. Structural Analysis of Faults in La Palma

The study of tectonic stress and strain deformation fields in active zones makes it possible to describe the role of faults within volcanotectonic processes, which are ultimately those that dominate the geodynamics of volcanic eruptions. In order to establish the orientation of the deformation fields generated by the tectonic stresses, it is necessary in such studies to establish the kinematics of the brittle deformation determined by both the seismic and aseismic movement of the faults. One of the most powerful techniques for determining the stress/strain field is the so-called “fault population analysis” (FPA) based on the geometry of the fracture and the kinematic markers observed on the plane of the microfracture, assuming that this process is self-affine [24,25,26]. Knowledge of the deformation tensors in a tectonically active zone is a necessary tool to establish which faults are preferentially oriented under a tectonic deformation field and, therefore, which are susceptible to being active faults.
Generally speaking, the kinematics of the deformation are obtained from the failure plane and the measurement of its striation (Figure 2). This means that it is necessary in the FPA to take field measurements of pairs of fault plane orientation and striation angle data. In the methods used in this work and described below, the Landslide Model [26,27] and the Straight Dihedral Model [28,29], the data obtained based on a single fault offer a possible solution to the deformation field. However, at least 5 faults would be necessary to make it possible to obtain a deformation field that allows fracturing models such as Anderson’s to be realistically reproduced. In this work, within the fault population analysis (FPA) methods, we have used the following methods due to their simplicity, their graphic solution, and the fact that they have sufficient kinematic data giving credibility to the results:
(a)
The Right-Dihedron Method, RDM, is a geometric and dynamic method for obtaining deformation fields [28,29].
(b)
The Slip Model, SLIPM, is a method for reconstructing paleostresses through stress inversion [25,27].
The main method applied in this work is the Slip Model (SLIPM), as it has several advantages over other paleostress reconstruction methods by means of inverse techniques. (a) It obtains a graphic representation that is applicable to the study of the geodynamics of fracturing by spatial distribution (deformation cluster) and (b) it is a direct method that avoids subsequent manipulations that could be mathematical artifacts. SLIPM, in addition, allows the separation of fault subpopulations that are compatible with different maximum horizontal shortening directions (Dey), which defines homogeneous deformation areas that can be related to different geodynamic stages. Furthermore, SLIPM also makes it possible to deduce the movement directions in those faults whose kinematics could not be observed from field data [27,30]. SLIPM establishes a series of equations that allow one to calculate the shape of the K’ deformation ellipsoid, which is defined as:
K’ = ey/ez
In which ez is the vertical deformation axis and ey is the maximum horizontal shortening axis.
The Right-Dihedral (RDM) method is a semi-quantitative method based on the overlapping of compressional and extensional zones by means of a stereographic plot [28,29]. The final plot is an interferogram figure which usually defines the strain regime. This method is strongly robust for conjugate fault sets and with different dip values for the same tensor. The RDM has been used to determine the orientation of Dey directions in subpopulations. These subpopulations are obtained by dividing the populations of polyphase stations via the prior application of the SLIPM. However, the RDM does not allow one to solve the problem of eliminating faults belonging to different deformation stages, which forces different deformation phases (polyphase stations) to be classified into subgroups of a single deformation phase (single-phase).
The advantage of applying these methods is that they make it possible to discriminate regional deformation fields, resulting from large tectonic structures such as oceanic ridges or continental collision zones, for example, from local deformation fields resulting from specific volcanic phenomena or the emplacement of magmatic dikes. As for the study of deformation due to regional fields, [31] applies the same methodology in large areas, while [32] applies it to local cases of induced seismicity associated with the injection of fluids, which could be comparable to the injection of magma on previous structures.
Once the population analysis of faults has been carried out and the strain tensor has been calculated, as defined by the K’ shape factor and the Dey orientation, the strain trajectory maps are then prepared for each field that has been deduced at each one of the measurement stations along the island of La Palma. The K’ spatial distribution is obtained from the interpolation of the discrete K’ values obtained at each measurement station, thus generating a map of the spatial distribution of brittle deformation on the island. Furthermore, the spatial distribution of the K’ value allows classifying the geometry and kinematics of the faults on the basis of their location. In this way, it is possible to assign which faults are compatible or not with the deformation trajectories defined by the maximum horizontal shortening direction (Dey).
The calculation and mapping of the strain trajectories have been carried out with the local tensor interpolation method developed by [33] by means of the TRAJECT code. Once the population analysis of faults has been carried out and the strain tensor has been calculated for each measurement station, what follows is preparing deformation trajectory maps for each field deduced.

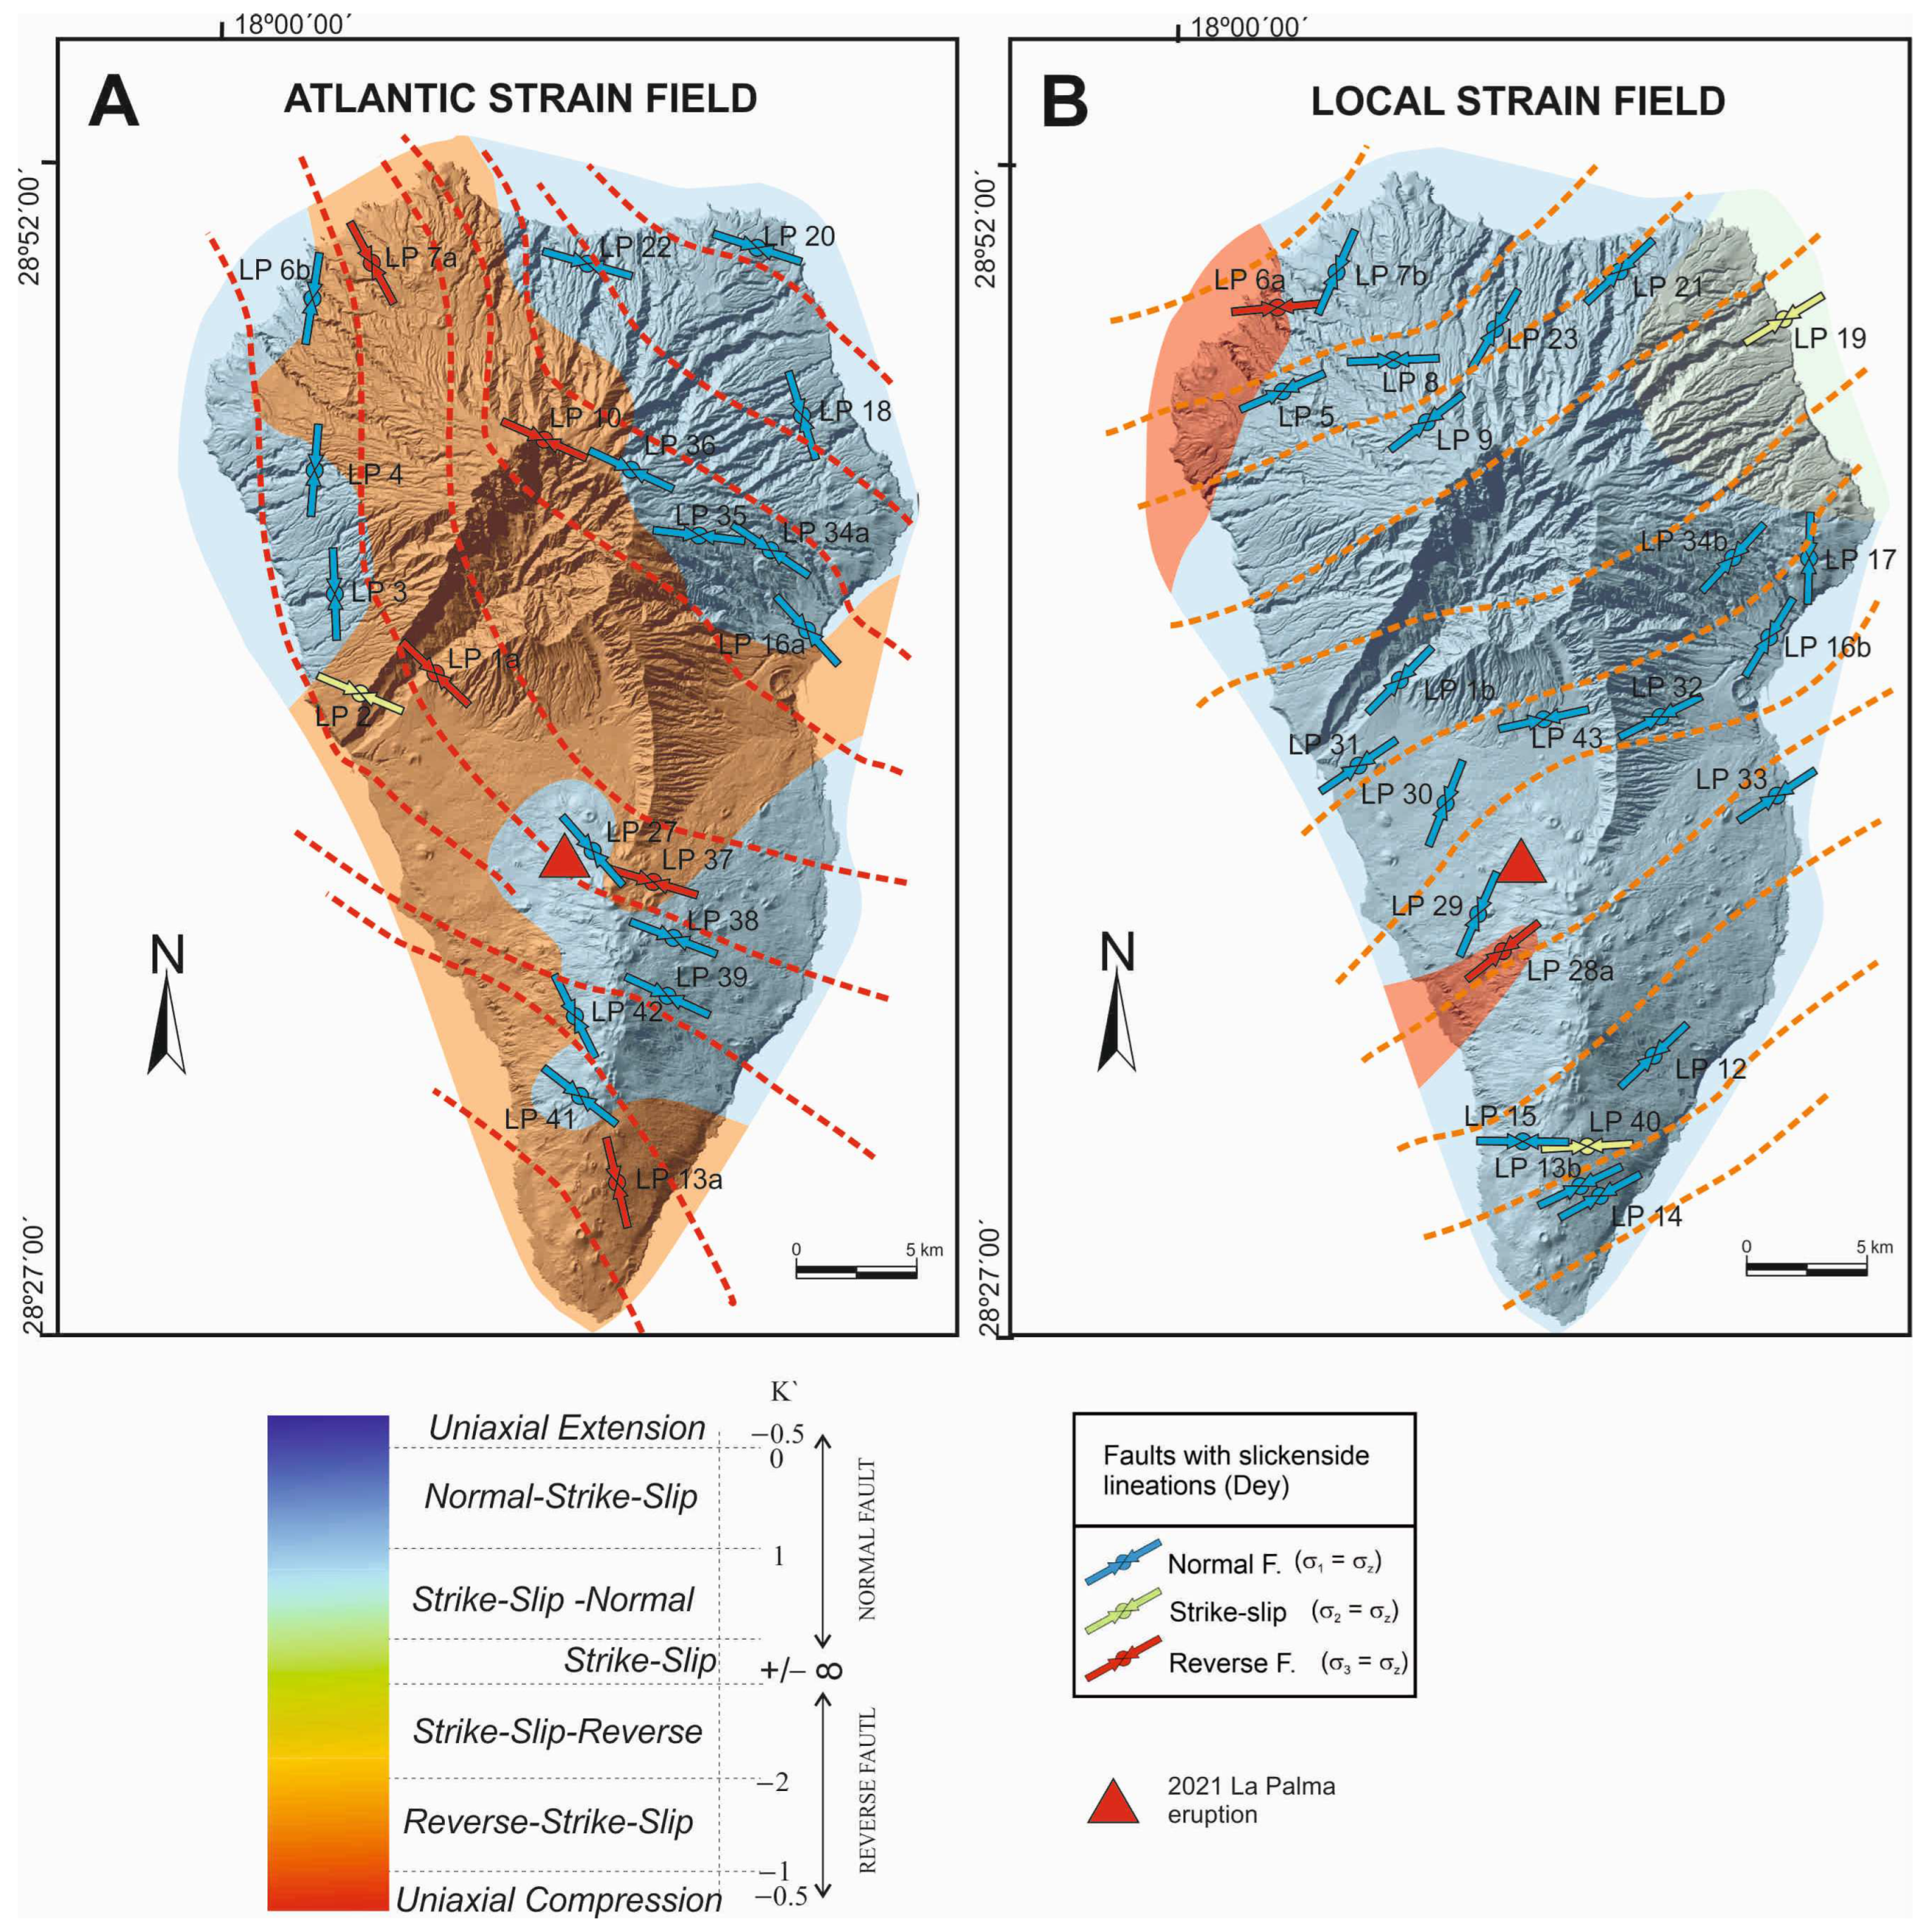
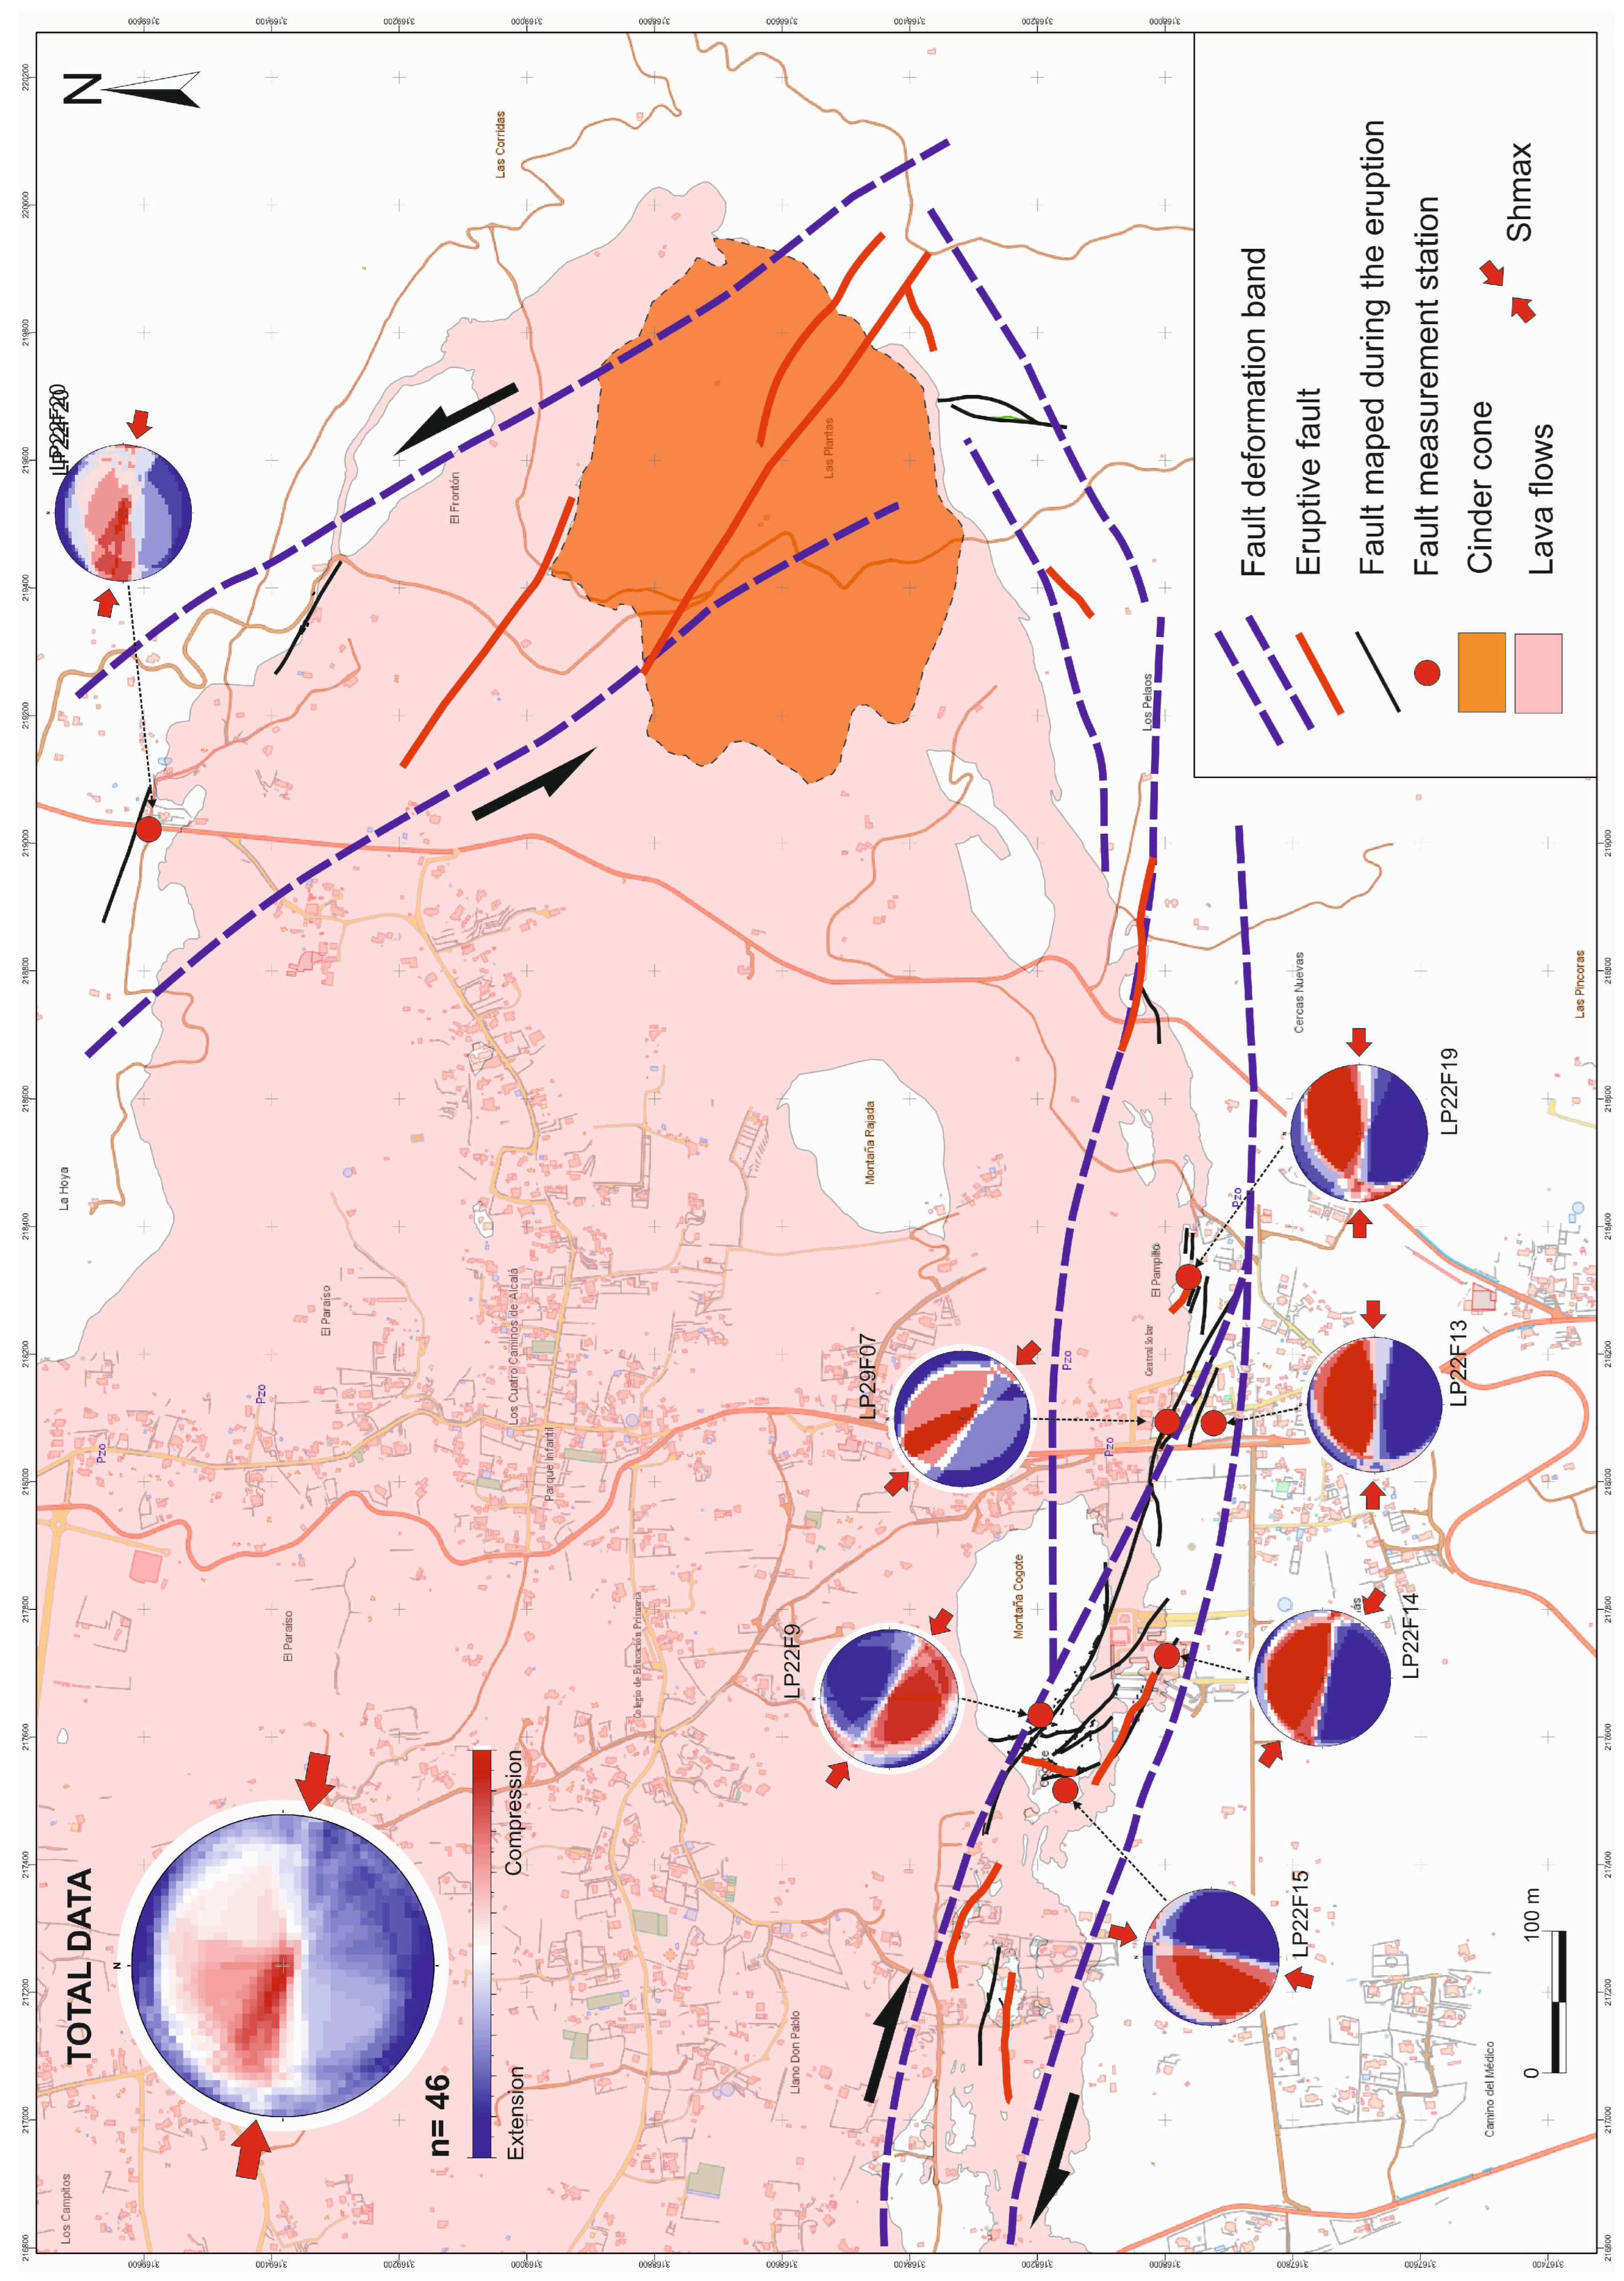
3.2. Strain Analysis in La Palma

A total of 344 faults with slickensides distributed along 39 stations on the island of La Palma have been measured in different field campaigns (Figure 3). The FPA has been used to obtain the Dey directions for each station, with a differentiation for representation purposes between those faults with a reverse component, with a normal component, and those with a direction movement or strike-slip faults (Figure 4). In most of the measurement stations analyzed, two superimposed deformation fields can be observed, showing Dey directions that are perpendicular to each other, one in the NW-SE direction and the other in the NE-SW direction (Figure 4). Taking into account the opening direction of the Mid-Atlantic Ridge defined by an opening in accordance with NW-SE [16,34] and the deformation trajectories obtained by [16], the deformation NW-SE field obtained could be associated with the opening of the ridge with a NW-SE Dey orientation. We have called this field the Strain Atlantic Field, which is compatible with the plate-scale stress field defined by [16]. Moreover, we have called the NE-SW deformation field obtained from the population analysis of faults the Local Strain Field [1,2].
The Atlantic deformation field on the island of La Palma is defined by both reverse fault populations (7 substations) and normal fault populations (16 substations) (Figure 3 and Figure 4A). The areas with extensive K’ are located in the NE and NW areas as well as in the most modern area of the island, the CV ridge in the S. However, the local field is fundamentally extensive (21 substations) with a strike-slip component in the NE and only two compressional stations (in the NW and SW of the island) (Figure 3 and Figure 4B).

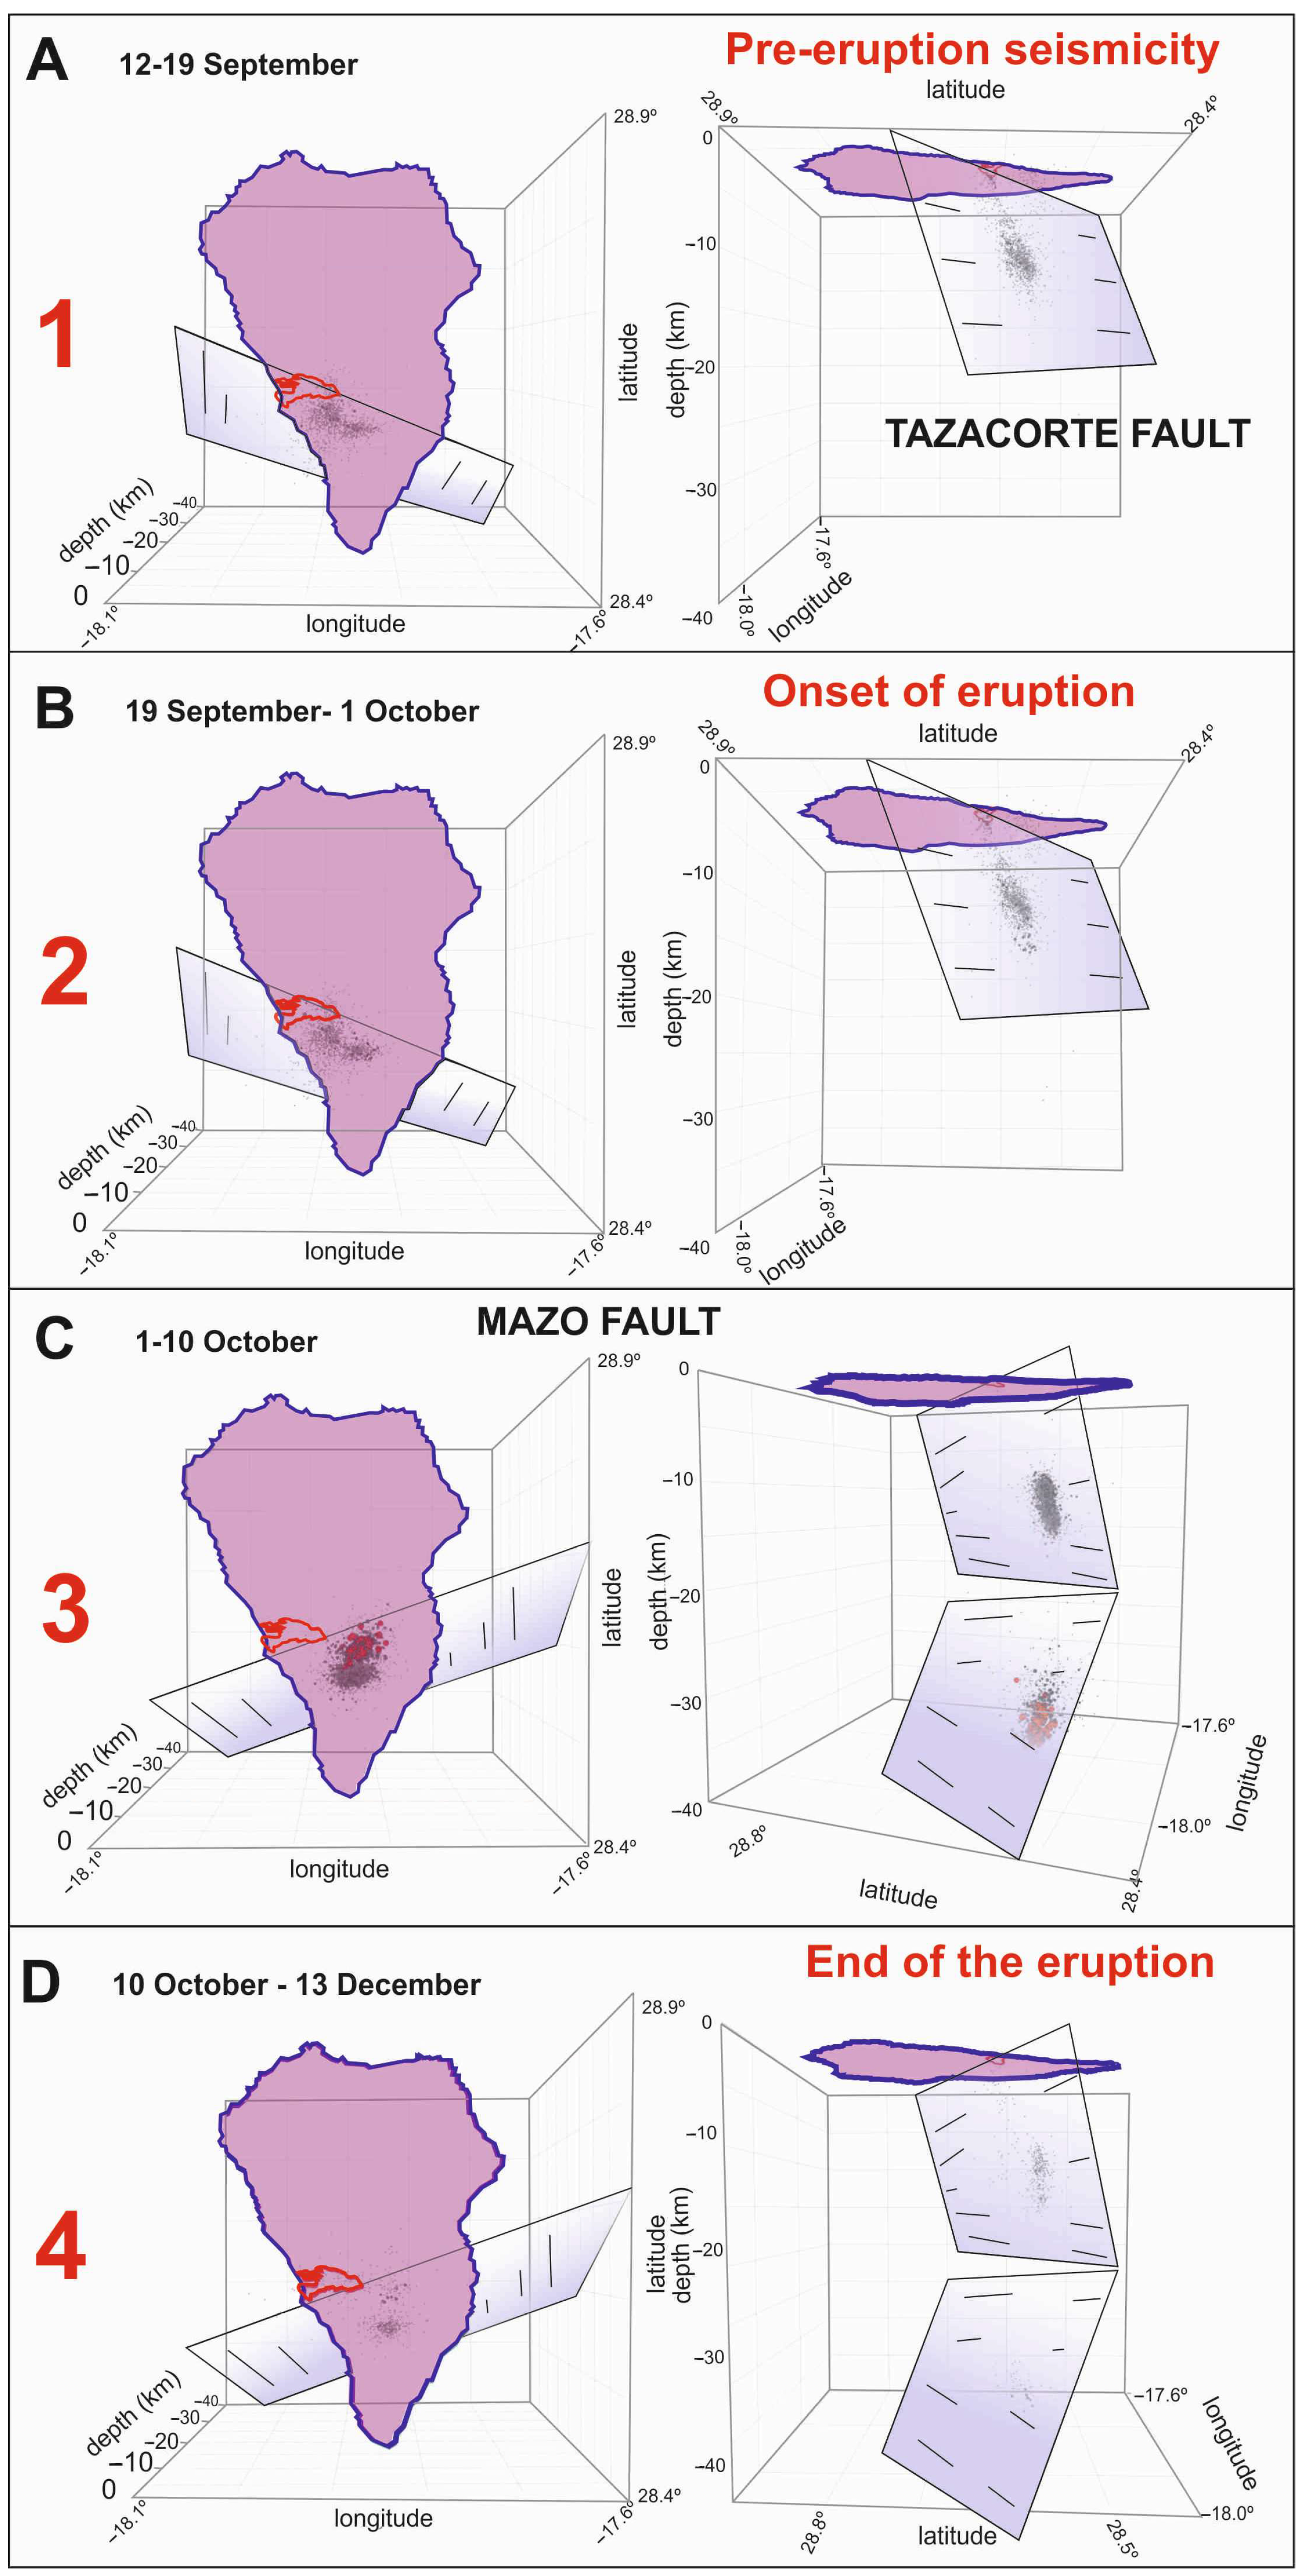
4. Seismic and Fault Temporal Evolution of Tajogaite 2021 Eruption

For monitoring seismicity during the volcanic eruption, hypocenter data from the Instituto Geográfico Nacional (IGN: https://www.ign.es/web/ign/portal/sis-area-sismicidad; accessed on 15 January 2024) have been used. The seismic crisis prior to the eruption began in October 2017 with a seismic swarm of 300 earthquakes with a maximum magnitude of M < 2 [21,35]. The seismic swarms that began in 2017 featured sets of earthquake clusters in the southern half of the island, but they could not fit into regular planes or structures. This seismicity was associated with the location of the magmatic chamber and its rise could take place in areas already subject to extension [1].
In September 2021, earthquakes of M > 3 at a depth of 9 km began to be recorded. Some of these hypocenters showed a NW-SE alignment at a depth of 9 km. This line was probably contained in a fault plane to which the rest of the hypocenters adapted. This plane could be parallel to the one inferred for the Jedey eruption (1585), since our surface microfracturing data measured at this volcano (Figure 5) show a fault plane with a 100°/80° SW orientation and dip that controlled this eruption and the emission of volcanic material [2]. This fault plane could be compatible with a normal fault with a NW-SE direction of mean horizontal shortening (Dey), coinciding with the regional results of [16] and with the Atlantic Deformation Field. Another fault plane with very similar characteristics can be found in the Roques de Jedey with decametric-sized slickenside, also associated with the 1585 eruption (Figure 5A). Such NW-SE direction faults are part of the Tazacorte Fault (TZF) (Figure 6A). In this case, the cut of this plane with the surface would correspond to an area under extension further north, where the 2021 Tajogaite eruption took place (3D online earthquake viewer of the IGME-CSIC: https://info.igme.es/eventos/Erupcion-volcanica-la-palma/sismicidad3d; accessed on 15 January 2024).
Ref. [36] used the paths of the earthquake hypocenters to define the magmatic feeding system of this eruption based on gravity changes produced by mass variations. In this work, we use the spatial evolution of seismicity to study the movement and effects of these two faults MZF and TZF. So, we have divided the earthquakes recorded during the volcanic eruption, on the basis of the spatiotemporal variations in the distribution of hypocenters, into four time intervals, between 12 September and 13 December 2021:
  • 12–19 September (Figure 6A): Seismicity prior to the eruption indicating the rise of magma in a dike towards the surface in an accelerated manner [37]. The hypocentral distribution fits the Tazacorte Fault plane (TZF) with a NW-SE orientation (N100° E/80° SW). The seismicity was mainly concentrated at a depth of 9 km and began its rise to the surface on day 15 [38].
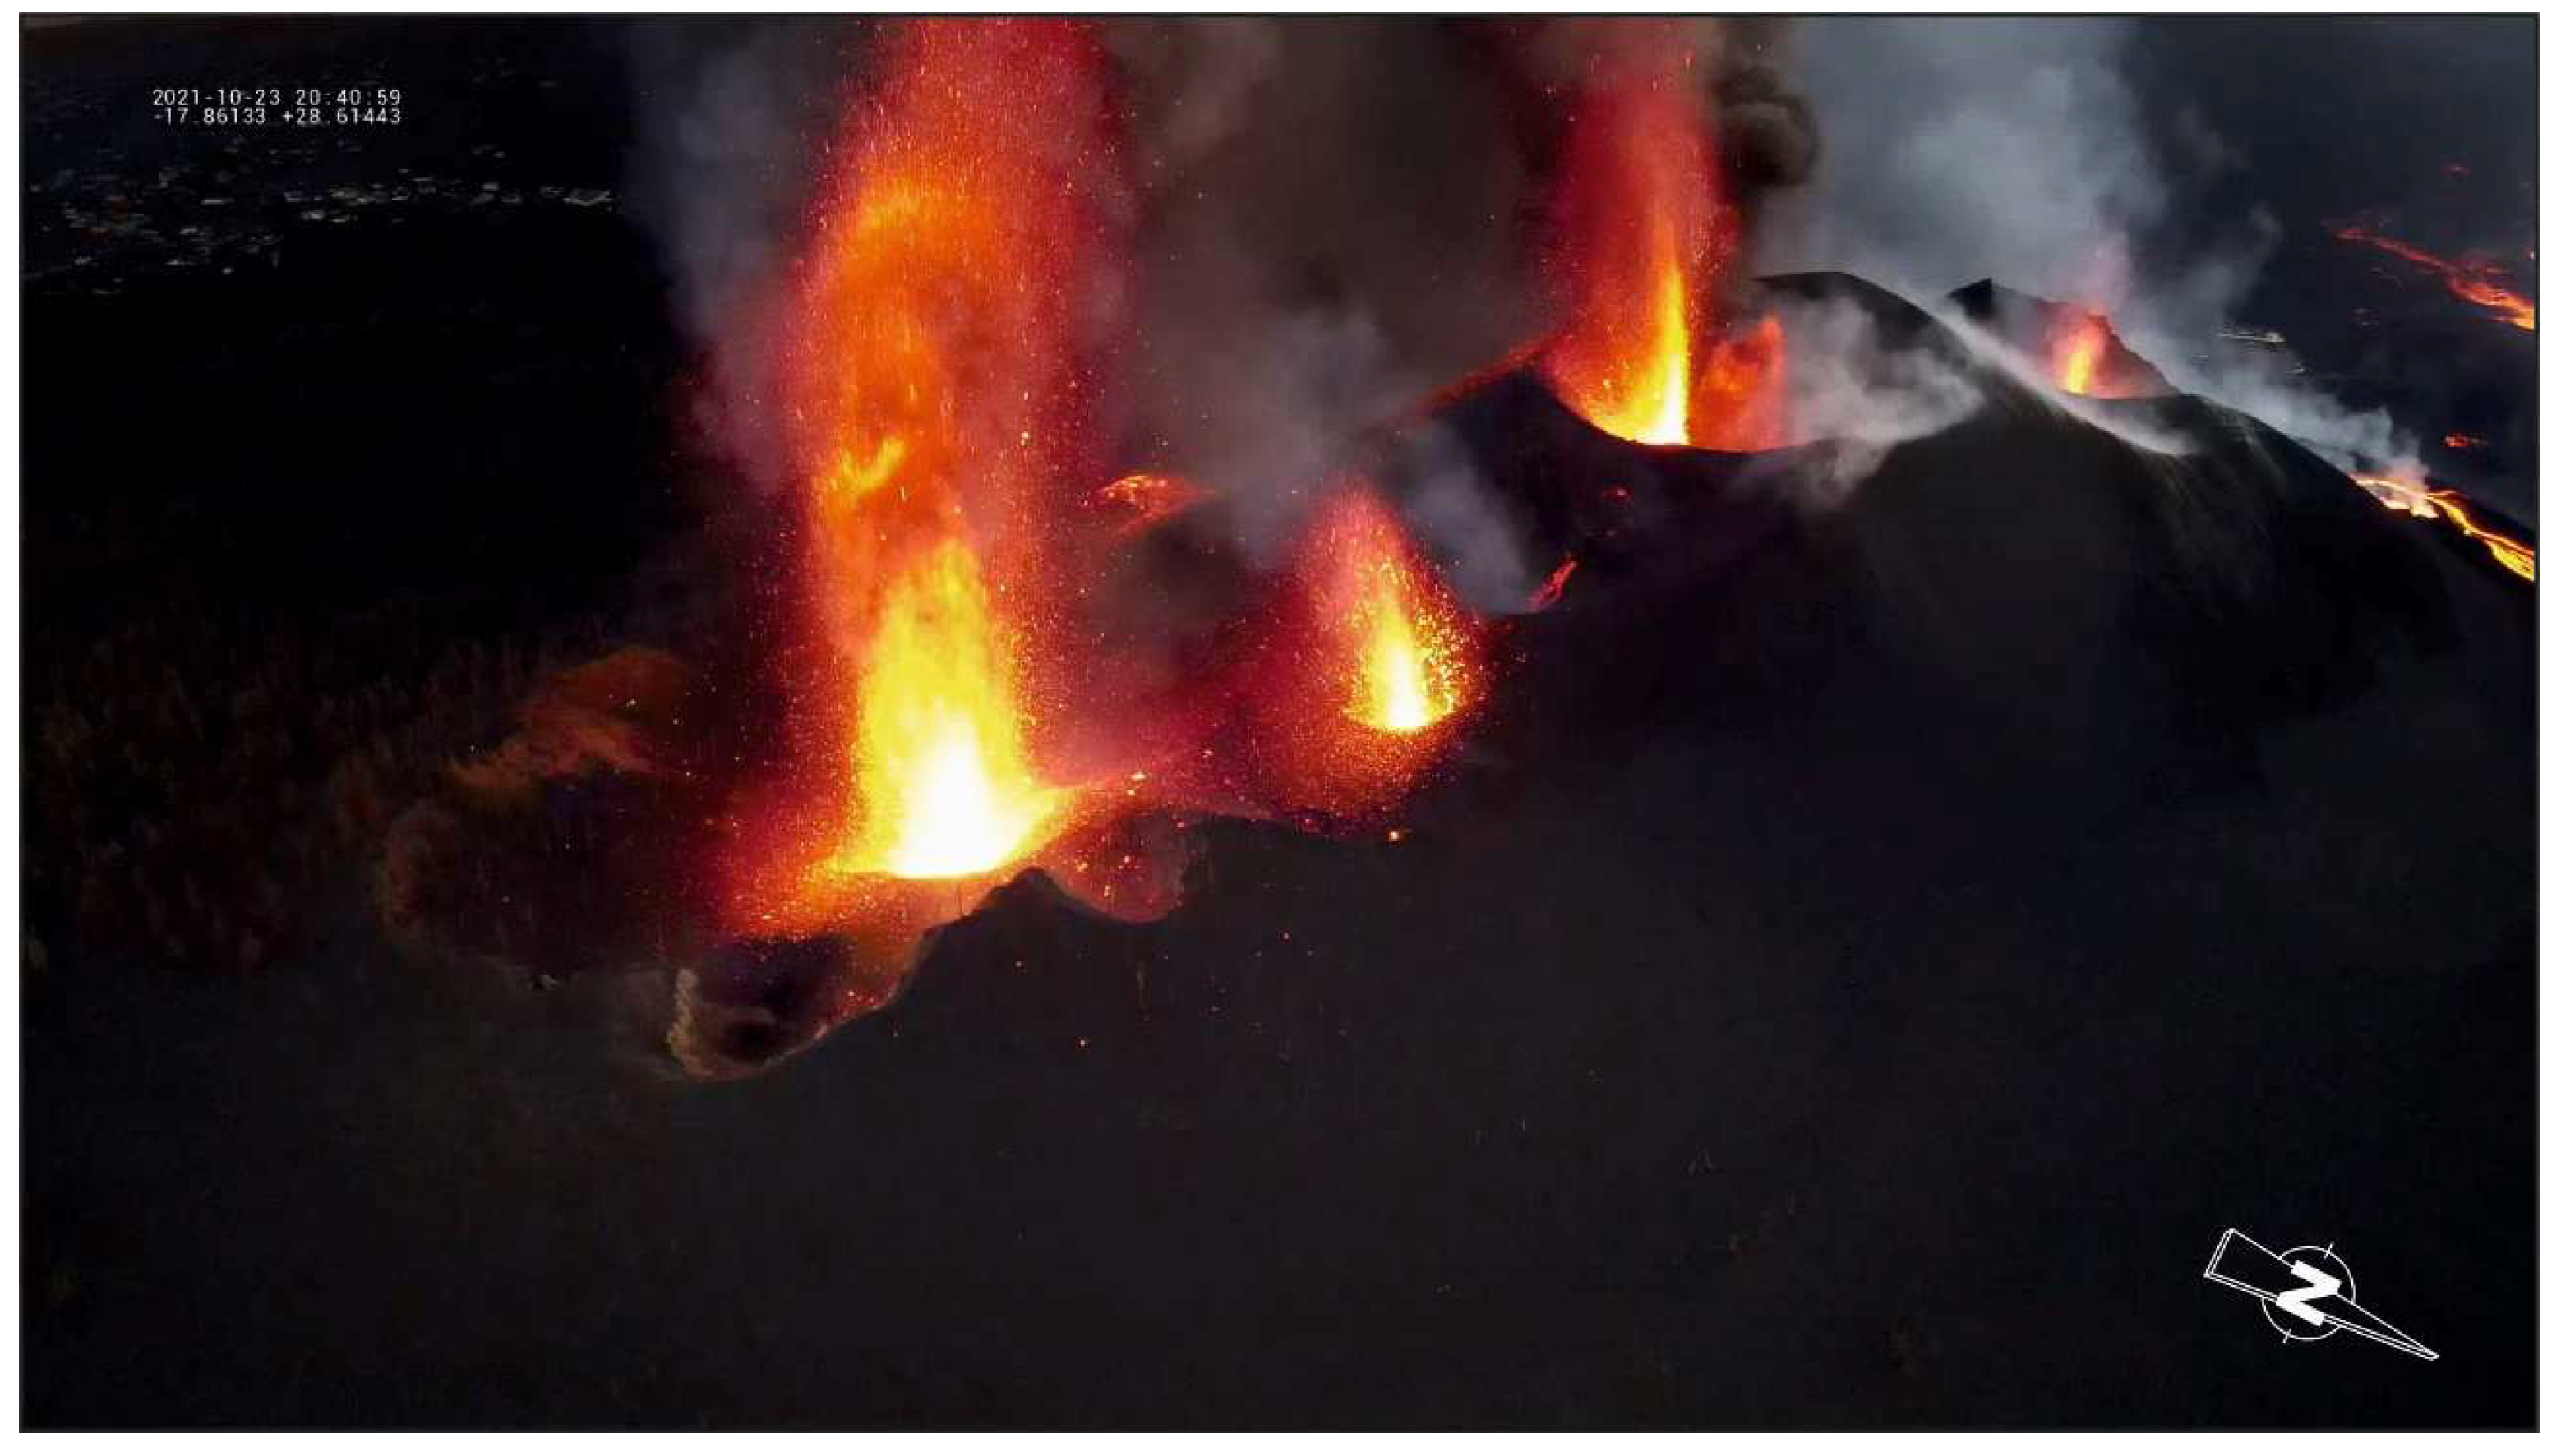
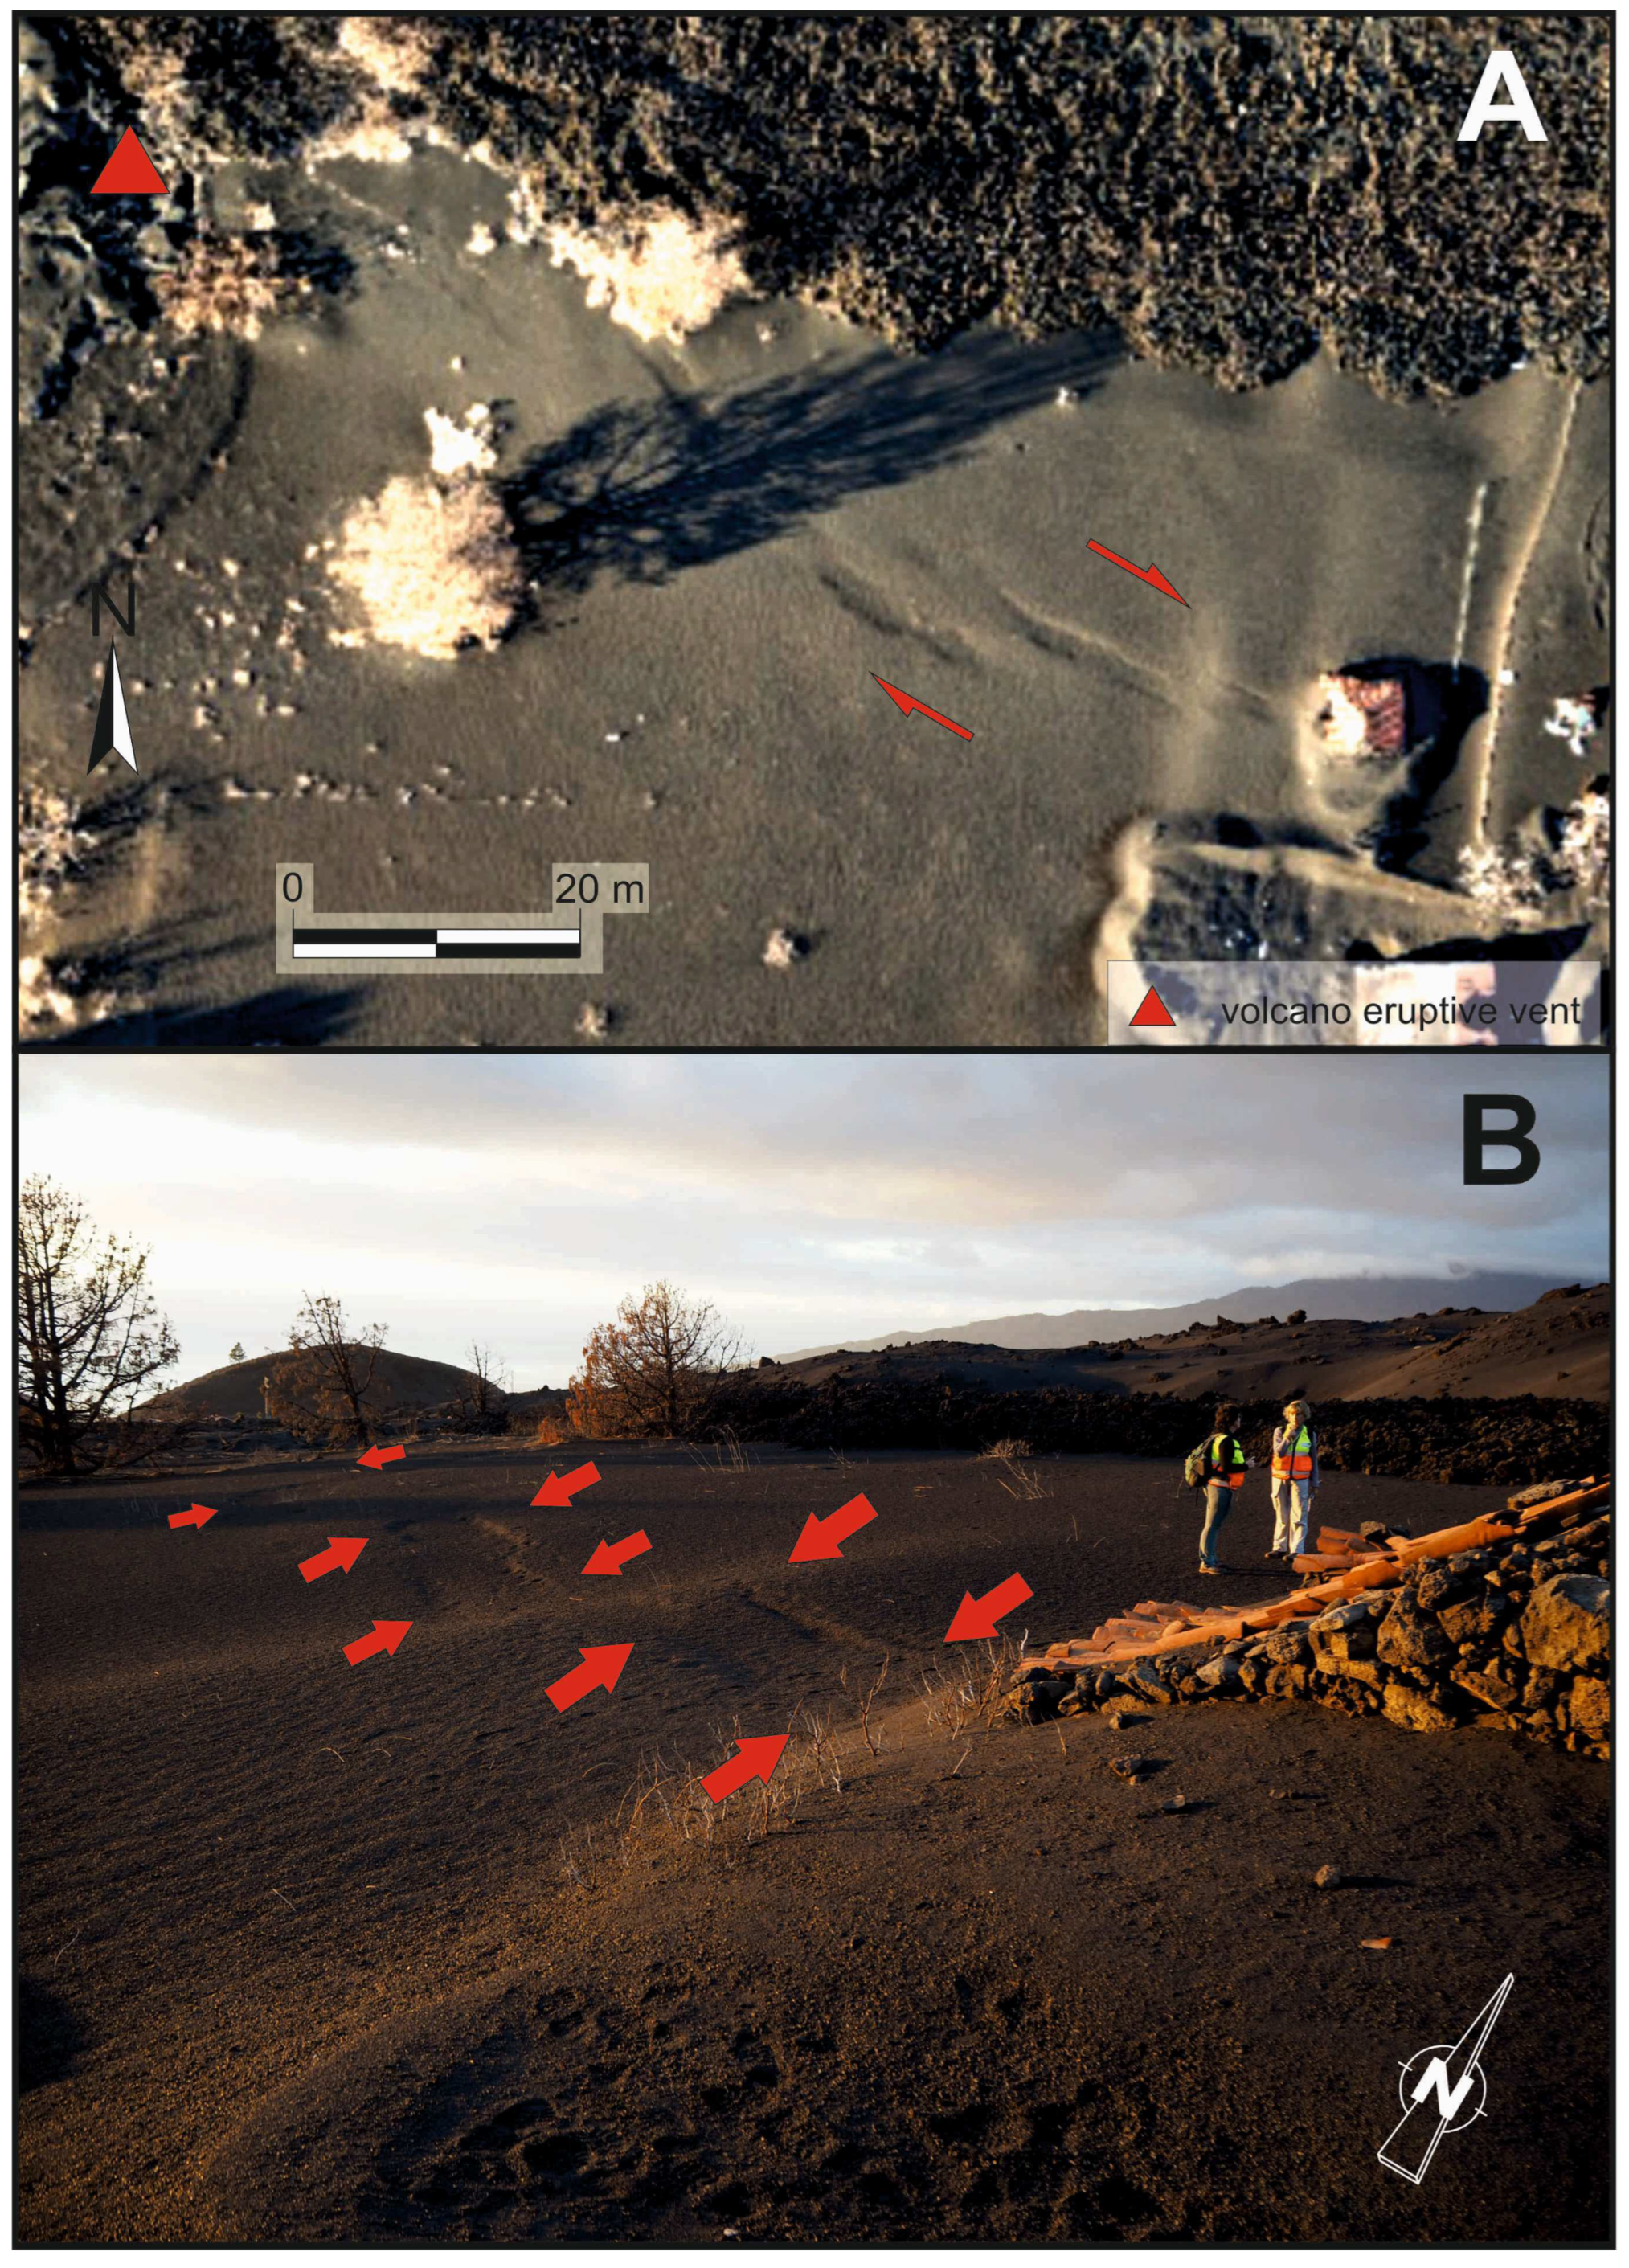
  • 20 September–1 October (Figure 6B): The eruption began on 19 September 2021 at 14:12 h (UTC) in favor of the TZF (NW-SE) with a clear alignment of eruptive vents that rapidly developed a cinder cone. The TZF remained active throughout the eruption with the main vents aligned with this structure (Figure 7). The distribution of the hypocenters adjusted to a fault plane compatible with the TZF, at a depth of mainly between 15 and 5 km. During this entire interval, there was an opening of different eruptive vents aligned in accordance with the TZF [39] and of surface fractures NW of the main vent. During this stage, the distribution of epicenters of stage 1 was maintained, differing only in that the eruption had already occurred.
  • 2 October–25 November (Figure 6C). This time interval marked the change in the orientation of the hypocenter distribution. It went from a NW-SE direction (N100° E) to a WSW-ENE direction (N080° E), adjusting to a 70°–80° SE dip plane that we have called Mazo Fault (MZF). These hypocenters were concentrated at a depth of between 8 and 16 km. There is another concentration of epicenters along this same direction, N080° E, and at a depth of between 25 and 35 km, but in this case with a dip towards the NW [35]. This alignment was reflected in the eruption on 25 November, in which new distal eruptive vents began to open in the southern area of the flows [39]. On 4 December, the last distal emission center opened in this southern area. All these eruptive vents were aligned in accordance with the MZF.
  • 26 November–13 December (Figure 6D): This was the last stage of the eruption, with seismic activity decreasing significantly, but also with the maintenance of the two sets of epicenters defined in the previous stage (MZF). The eruption finished abruptly on 13 December 2021 at 22:21 UTC, its end being officially announced by the authorities on 25 December (https://www3.gobiernodecanarias.org/noticias/wp-content/uploads/2021/12/251221-INFORME-Comit%C3%A9-Cient%C3%ADfico-PDF.pdf; accessed on 15 January 2024).
In summary, the TZF remained active throughout the eruption, generating vents parallel to this route in the main vent zone and N area of the flows (but without significant seismicity from phase 3 onwards). The MZF was activated from 1 October onwards, with the appearance of distal eruptive vents on 25 November, aligned according to the normal echelon faults contained in this fault. In this way, these two fault breaks were revealed, breaking the upper crust and spatially conditioning the distribution of eruptive vents.

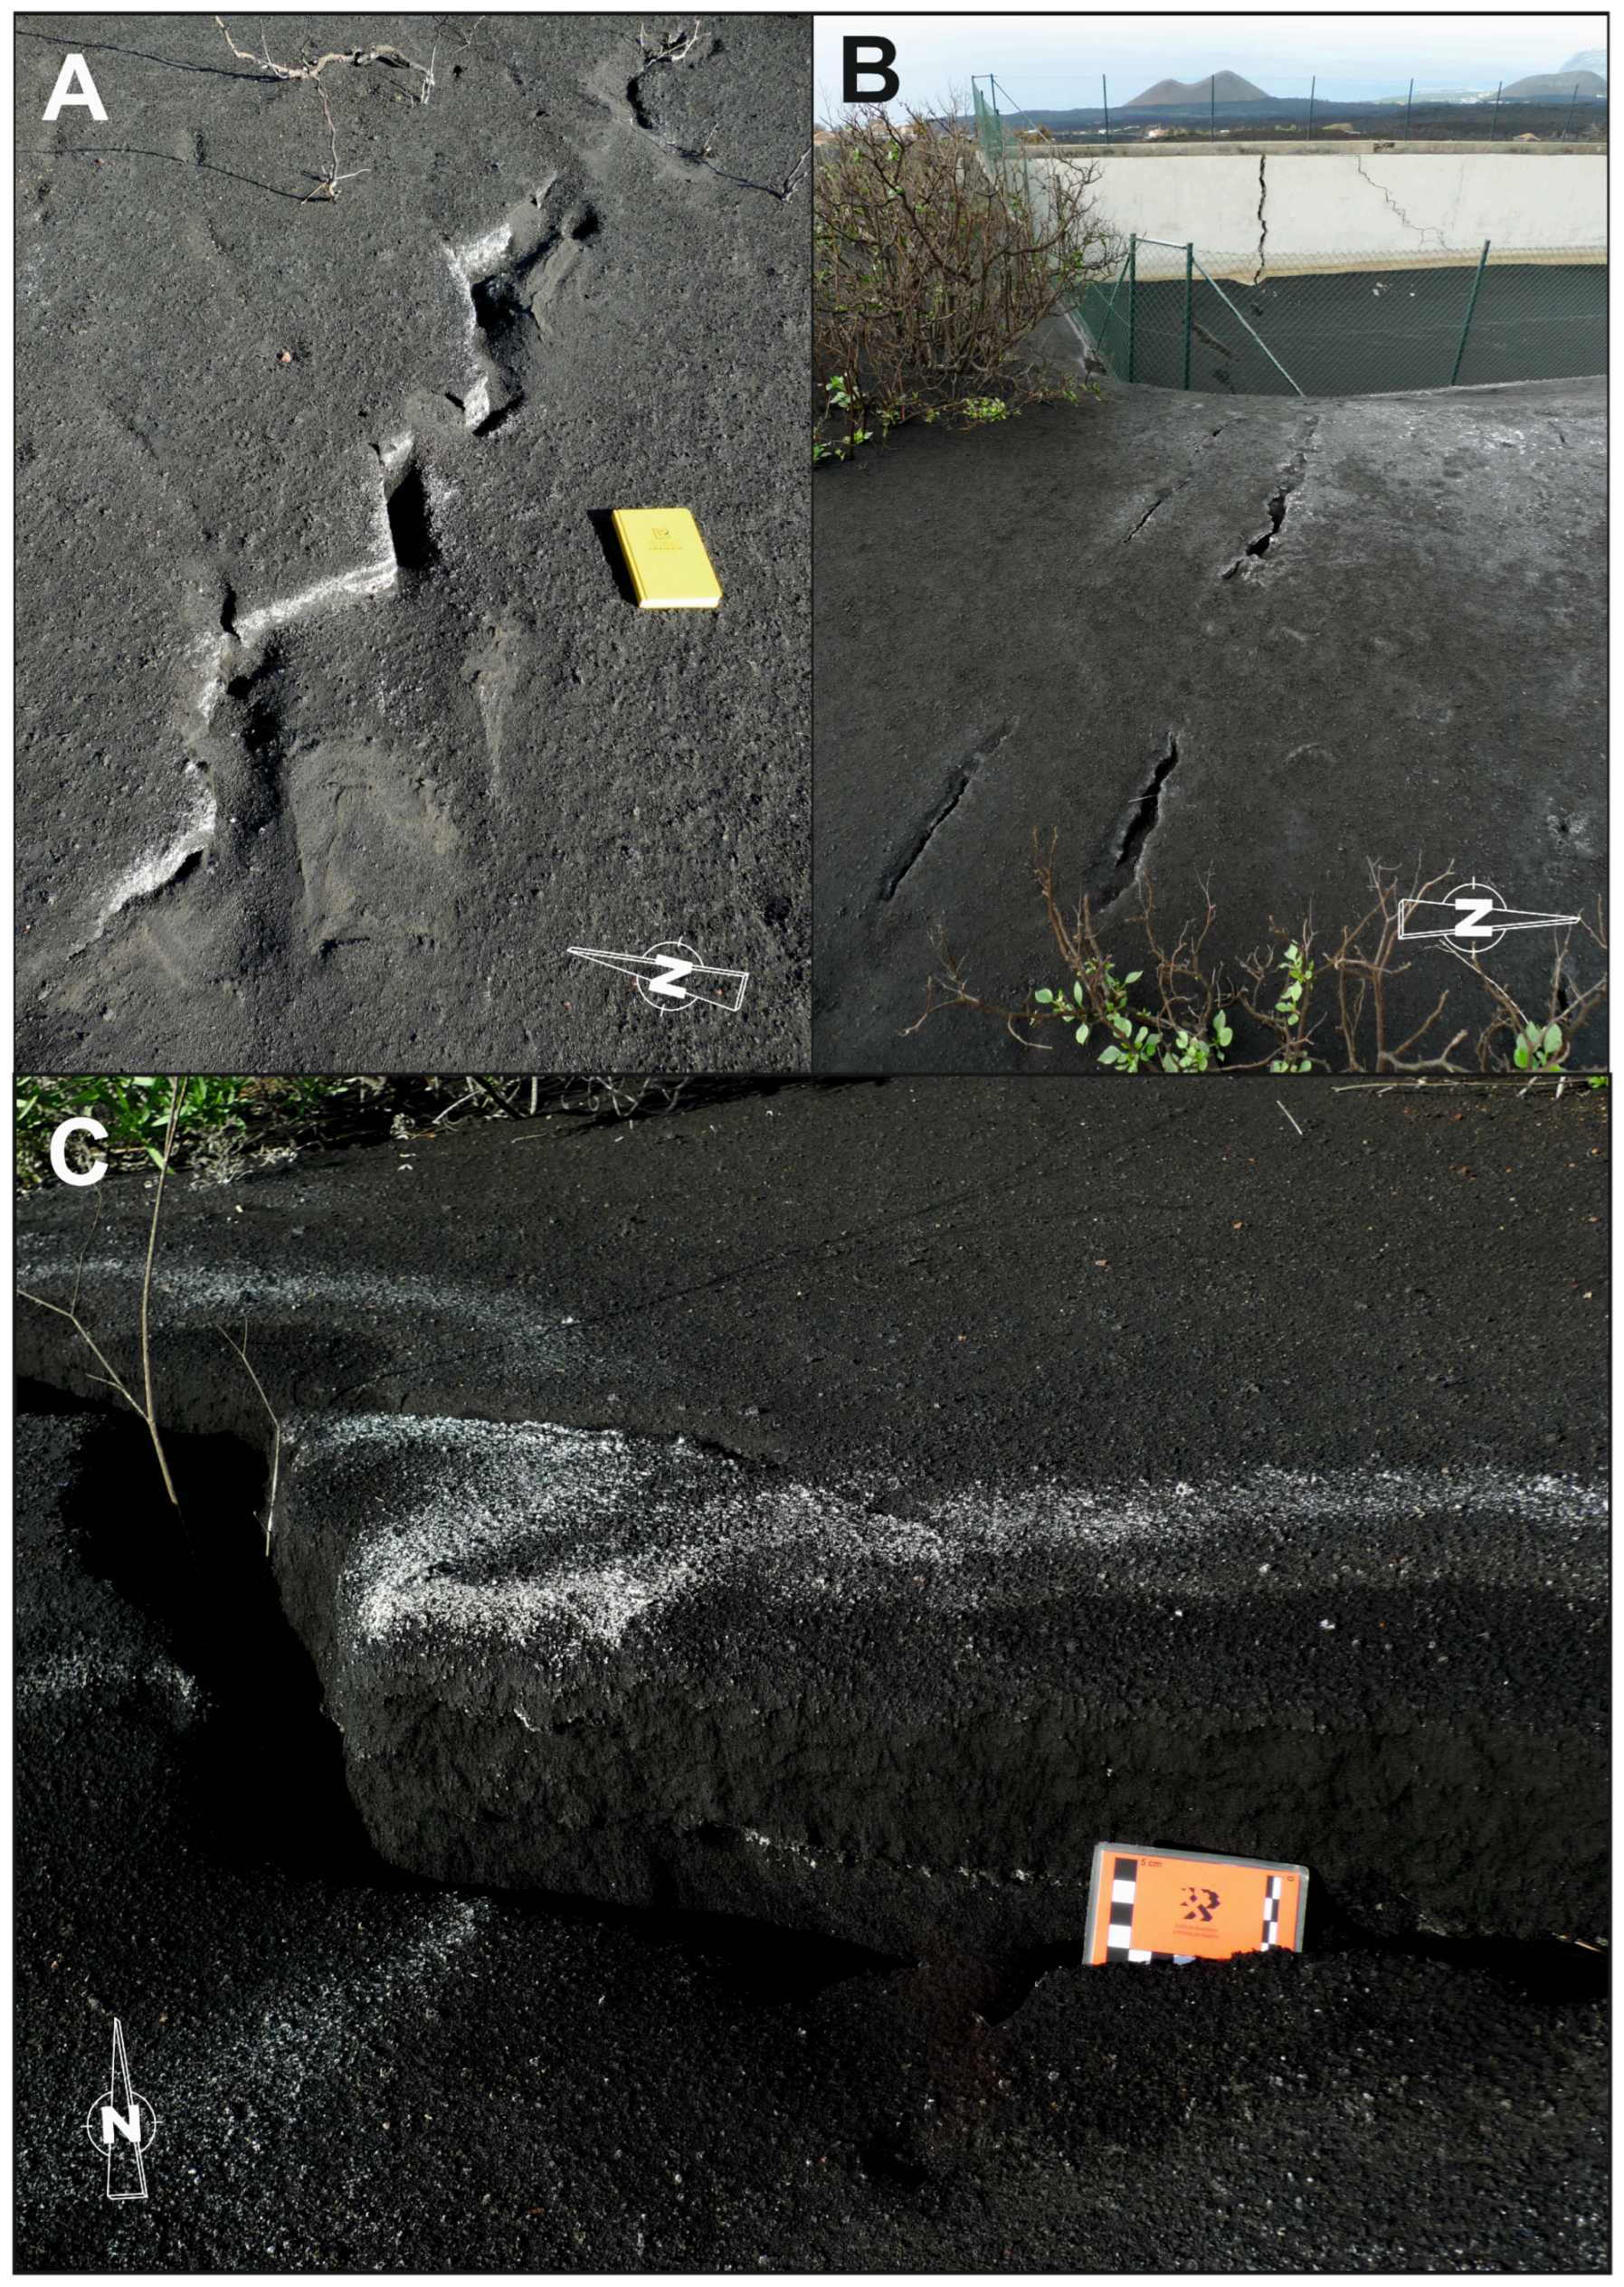
5. Structural Analysis of the Surface Fractures Generated during the Eruption

Both the TZF and the MZF generated a multitude of newly formed surface fractures during the eruption, similar to those mapped by [3], which were associated with the magmatic activity of Etna. Some of them were noted for distal vents issuing fluid pahoehoe-type lavas and, in some cases, forming hornitos. Drone images were very useful throughout the eruption [23] and served as a great source of structural data to identify and map the fractures as well as to analyze their spatial distribution during the eruption. Drone images and fieldwork carried out during the eruption were crucial since some of the fractures were later covered by lava flows or pyroclastic deposits.
The observed faults have lengths that range between tens and hundreds of meters (Figure 8, Figure 9 and Figure 10). The fractures that appear during the eruption have either an extensional or a transtensive character (Figure 8A). Transtensive fractures suggest a movement in the horizontal along the planes and are not related to lava flow emission, thus evidencing a dominant role of tectonics in their geometry and distribution. These faults affect anthropic buildings (Figure 8B), generating significant damage to many of them. During the eruptive process, many of these faults display high temperatures and gas anomalies.
In the TZF and the MZF, there was a development of normal echelon faults that was to be included within two deformation bands corresponding to each of the main faults (Figure 9). This distribution of normal echelon faults could indicate a left-lateral movement direction for TZF and dextral movement direction for MZF and explain the appearance of eruptive vents along these normal fault systems. Therefore, there would appear to have been a transtensive activity of these two faults at least in the eruption area (Figure 10).
A total of 362 measurements of surface faults (Figure 9) and 49 of striated faults (Figure 11) have been made. Figure 9 shows the spatial distribution of the fifteen measurement stations taken in the MZF with their corresponding stereograms and the two stations taken in the TZF in zone N of the lava flows. Following Anderson’s fracturing model, the distribution of conjugate fracture systems appears to indicate a NW-SE shortening direction, which is compatible with the Atlantic strain field associated with the opening of the Atlantic Ridge. It has been possible, at six measuring stations, to collect data on fault striations that allow us to analyze these data to obtain the strain tensor. We have used the Right-Dihedral method, which offers solutions that are compatible with the NW-SE shortening direction related to the Atlantic deformation field (Figure 11).

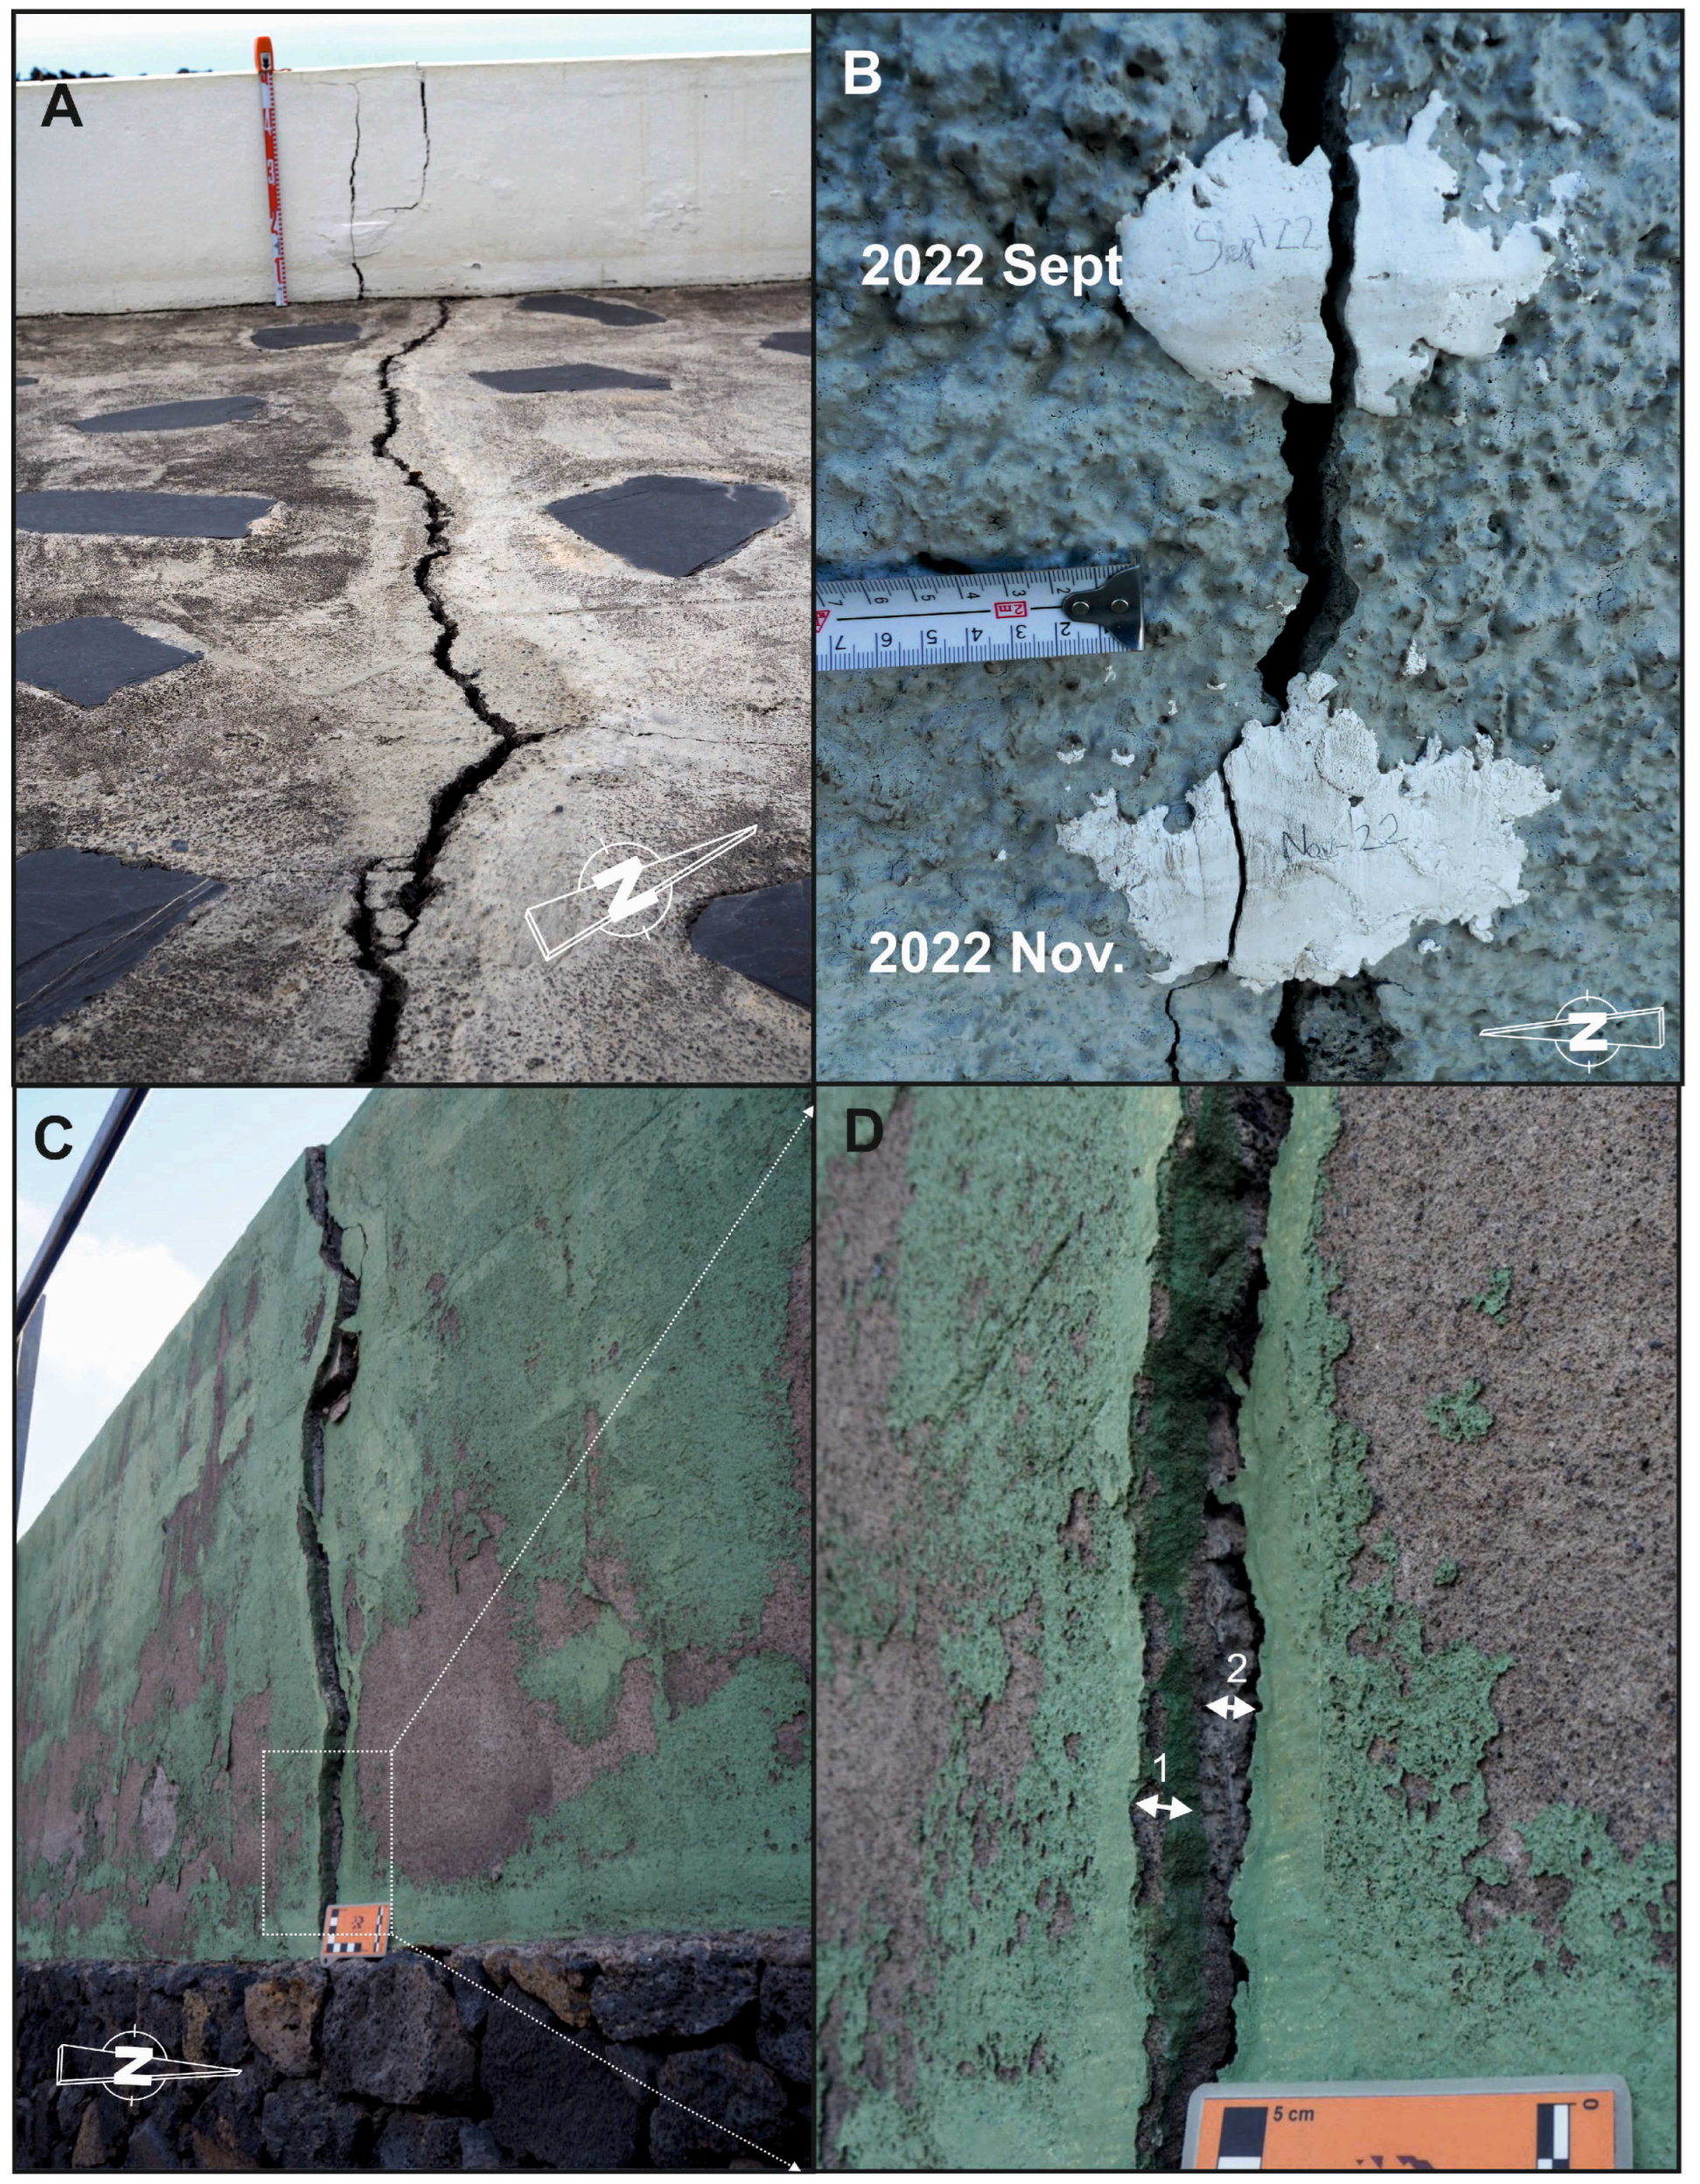
6. Creep Movement of the Tazacorte and Mazo Faults

Monitoring of anthropic construction elements after the eruptive process demonstrates the formation of new fractures. This became evident in March 2022, when houses that had not suffered damage from fractures during the eruption began to fracture in the N area of the lava flows. After the first studies, we also observed that some fractures had been repaired prior to the eruption, suggesting that they had moved before the eruptive process. The information given by the owners of the houses is that these fractures appeared after the 1980s, when these houses were built. These movements have been intermittent, without the owners of the houses being able to determine the intervals at which these fractures moved. These pre-eruption movements have been observed in both the TZF and the MZF (Figure 12).
We are currently monitoring these fractures with a Novatest FIPSG100 precision fissurometer, with a measurement resolution of 0.001 mm and with an error of ±0.003 mm. In order to eliminate measurement errors, displacements of less than 0.1 mm have not been taken into account. This system can be used with fixation of measurement points using steel screws on both sides of the fissure or with perforated steel buttons attached using epoxy resin. In this case, we have chosen the latter option. The measurement points have been preferably placed on concrete sheets affected by fractures on the exterior of the homes, so as to forestall the effects of expansion and contraction of the homes as much as possible. There was previous evidence of movement thanks to plaster cores placed by the homeowners when the fissure movements began in March 2022 (Figure 10A), with accumulated displacements of 11 mm (measurement carried out with a caliper before placing precision fissurometer measurement points) until March 2023. The measurement stations for the precision fissurometer were installed in March 2023, after two data collection campaigns, one in May and another in November 2023. We have 15 measurement stations in the TZF and 25 in the MZF. The results obtained offer maximum displacement speeds in both the TZF and the MZF of 2.80 mm/year and minimum speeds of 0.24 mm/year. No notable seismic activity has been detected, so these movements must be associated with aseismic creep. This study is in the preliminary phase and will require mid- and long-term monitoring to obtain results that give an idea of the temporal evolution of both faults.

7. Discussion

The fracturing of the island of La Palma has played an important role in the Tajogaite eruptive process of 2021. The data available before the eruption revealed the areas subject to extension that could be susceptible to hosting volcanic eruptions (344 data on fault/striation pairs distributed into 39 measurement stations [1,2]). Two average orientations of maximum horizontal shortening (Dey) have been obtained: NW-SE and NE-SW. We have called the former the Atlantic Strain Field, related to the opening of the Atlantic Ridge [16,34], and the latter the Local Strain Field, related to faults with a mainly normal component and which are perpendicular to the former. The average orientations of the faults obtained from micro-fracturing on the surface allowed us to estimate the orientation of the possible eruptive fissures when they broke on the surface. The eruption occurred in one of these zones in which the Atlantic Strain Field and the Local Deformation Field coincide with areas undergoing extension. This is the first time that this method has been used to infer the site where an eruption could start. Although it must be tested in other volcanic reactivations, the good results obtained suggest this methodology as a new tool for forecasting the place of the beginning of an eruption, as well as the evolution of the eruptive vents during the eruption. The only requirement is that the tensor strain in the area must be known. Therefore, volcanotectonic studies are needed in order to better interpret seismic data during volcanic reactivations.
From these results, one can infer that both fields have coexisted since the beginning of the volcanism that generated the Canary Islands archipelago, since the two data populations can be observed from materials belonging to the ancient massifs to the most modern materials. The Atlantic Field may be linked to the opening of the ridge and the drag of the oceanic crust, while the local one might be conditioned by the great lines of weakness in a NE-SW direction (abyssal hills parallel to the ridge axis), generated by the opening of the ridge in the oceanic crust.
On the other hand, the combination of surface fracture data generated after and during the eruption and the seismicity data made it possible to identify two active faults that conditioned the eruption during the three months it lasted. The first fault to which seismicity is adapted is in the NW-SE direction and we have called it Tazacorte Fault (TZF). On 1 October, there began to be a variation in the orientation of the distribution of hypocenters, adapting to a fault with a mean ENE-WSW direction that we have called Mazo Fault (MZF) and which generated the first distal lava emission centers on 25 November. Surface fractures were mapped with field and drone work throughout the eruption. There are 326 data on faults associated with the MZF and 36 with the TZF. The emission centers of the main cone zone were then placed parallel to echelon fractures of the TZF, with the appearance of more distal centers distributed on these relay faults indicating dextral movement of the TZF. The same occurred in the MZF, in which the distal lava emission centers opened on normal-directional echelon faults associated with the dextral movement of the MZF. In both cases, this seems to be transtensive activity on the part of these two faults (Figure 13). The movement of these two faults could be compatible with the deformation field called the Atlantic Strain Field.
Aerial photographs of the 1946–1956 American flight have been used to study the fracturing prior to the 2021 Tajogaite eruption and contemporary with the San Juan eruption (1949). From these images, 191 lineations that are compatible with surface fractures have been identified (Figure 13). The average orientation of these fractures is E-W, which is fundamentally compatible with the MZF, although in the N zone of Tajogaite lava flows, the orientations of the fractures tend to be parallel to the TZF. This seems to indicate a prior conditioning of surface fracturing by both active faults. The route of the TZF in a NW-SE direction can be extended with the eruptive fractures that gave rise to the eruption of the San Juan volcano in 1949. These eruptive fractures of the San Juan volcano have the same NW-SE orientation [40], so the 2021 eruption associated with the TZF could be related to a propagation of this fault towards the NW.
The activity of the TZF and the MZF has continued after the eruption, with creep movement without associated seismicity. Deformations in houses and human constructions have been observed in the surface route of these two faults. It has been confirmed that these fractures have been repaired before the 2021 eruption, so their activity has been continuous over time. In order to quantify these displacements, precision fissurometer measurement stations have been installed. There are 15 measurement stations in the TZF and 25 in the MZF. This study should be extended in the mid and long term, but to date, the data available provide maximum movement speeds of 2.80 mm/year and minimum speeds of 0.24 mm/year. This gives an idea of the intense activity of these faults, which has persisted over time, as well as the possibility of a flank eruption on the western flank of the area of the last eruption of 2021, with a movement of blocks towards the W or the SW, similar to that interpreted by [4] in Etna volcano or [41] for this eruption.

8. Conclusions

Utilizing structural analysis of tectonic strain fields in active volcanic regions enables us to forecast areas with a high likelihood of volcanic center formation and potential dike emplacement orientations.
Two primary tectonic strain fields have been identified on La Palma island: a regional Atlantic extensional tectonic field trending NW-SE, and a local tectonic field characterized by a NE-SW trend.
The Atlantic tectonic field plays a crucial role in the eruption dynamics of La Palma, as evidenced by the orientation of the main dike emplacement (NW-SE) during eruptions, constrained by an extensional tectonic regime.
The Cumbre Vieja eruption and the formation of the Tajogaite volcanic edifice were primarily influenced by two main faults: the NW-SE-trending Tazacorte Fault and the ENE-WSW-trending Mazo Fault. Both faults have the potential to trigger moderate earthquakes. Additionally, post-eruption creep movements have been mapped, underscoring the continuous volcanic activity beyond the eruptive phase. This information is critical for post-disaster reconstruction efforts and for restoring normalcy for the island’s inhabitants between volcanic eruptions.

Author Contributions

Field campaign for data record: M.Á.R.-P., M.Á.P., R.P.-L., N.S., J.L.-G., I.G. and M.B.; Structural analysis (Fault Population Analysis): M.Á.R.-P. and R.P.-L.; Photointerpretation of historical aerial photography: J.F.M., M.Á.R.-P. and G.L.; Contextualization and bibliographic compilation: M.Á.P. and D.S.-M.; Drone work: J.C.G.-D. and C.L.C.; Mapping and GIS (Geographic Information System), G.L., M.Á.R.-P. and J.F.M.; Model proposed: M.Á.R.-P., R.P.-L., M.Á.P., N.S. and I.G. The final model was approved by all the authors, and the manuscript and figures as well. Manuscript redaction: M.Á.R.-P., R.P.-L., M.Á.P. and N.S.; Figures: M.Á.R.-P., M.Á.P. and G.L. All authors have read and agreed to the published version of the manuscript.

Funding

This research was funded by the Spanish National Research Council (CSIC) (CSIC-LA PALMA-12- 20223PAL002) and by the Government of the Canary Islands and the Spanish Ministry of Ecological Transition and Demographic challenge (227G0165-GEOPALMA).

Data Availability Statement

The data presented in this study are available on request from the corresponding author. The data are not publicly available due to the project is currently under implementation.

Acknowledgments

We greatly thank the Cabildo de La Palma (La Palma Regional Government), the Dirección General de Emergencias (Directorate General for Emergencies of the Government of the Canary Islands), and the Ayuntamiento de El Paso (El Paso City Council) for their collaboration during the field work collecting data. Thanks to Mayte Pedrosa for her help in the elaboration of the figures.

Conflicts of Interest

The authors declare no conflicts of interest.

References

  1. Rodríguez-Pascua, M.A.; Sánchez, N.; Perucha, M.A.; Galindo, I.; Pérez López, R.; Romero, C. Caracterización espacial de la deformación frágil de en la isla de La Palma (Islas Canarias, España). In Avances en el Estudio de Fallas Activas, Terremotos y Peligrosidad Sísmica de Iberia (Tercera Reunión Ibérica Sobre Fallas Activas y Paleosismología); Canora, C., Martín, F., Masana, E., Pérez, R., Ortuño, M., Eds.; Universidad de Zaragoza: Zaragoza, Spain, 2018; pp. 95–98. [Google Scholar]
  2. Sánchez Jiménez, N.; Rodríguez-Pascua, M.A.; Perucha, M.A.; Pérez López, R.; Romero Ruiz, C.; Galindo Jiménez, I.; Carmona Rodríguez, E.; Martín León, R.M.; Almendros González, F.J.; de Lis Mancilla Pérez, F.; et al. Caracterización volcanotectónica de los parques nacionales de la Caldera de Taburiente, Teide y Timanfaya: Relaciones volcanismo-tectónica-sismicidad-magnetismo. In Proyectos de Investigación en Parques Nacionales; Amengual, P., Ed.; Naturaleza y Parques Nacionales, Serie Investigación en la Red: Madrid, Spain, 2019; pp. 53–77. [Google Scholar]
  3. Tringali, G.; Bella, D.; Livio, F.A.; Ferrario, M.F.; Groppelli, G.; Blumetti, A.M.; Di Manna, P.; Vittori, E.; Guerrieri, L.; Porfido, S.; et al. Fault rupture and aseismic creep accompanying the December 26, 2018, Mw 4.9 Fleri earthquake (Mt. Etna, Italy): Factors affecting the surface faulting in a volcano-tectonic environment. Quat. Int. 2023, 651, 25–41. [Google Scholar] [CrossRef]
  4. Tringali, G.; Bella, D.; Livio, F.; Ferrario, M.F.; Groppelli, G.; Pettinato, R.; Michetti, A.M. Aseismic creep and gravitational sliding on the lower eastern flank of Mt. Etna: Insights from the 2002 and 2022 fault rupture events between Santa Venerina and Santa Tecla. Tectonophysics 2023, 856, 229829. [Google Scholar] [CrossRef]
  5. Anderson, E.M. The Dynamics of Faulting and Dyke Formation with Application to Britain, 2nd ed.; Oliver and Boyd: Edinburgh, UK, 1951; p. 206. [Google Scholar]
  6. Simpson, R.S. Quantifying Anderson’s fault types. J. Geoph. Res. 1997, 102, 909–919. [Google Scholar] [CrossRef]
  7. Schmincke, H.U. Volcanic and Chemical Evolution of the Canary Islands. In Geology of the Northwest African Continental Margin; Von Rad, U., Hinz Sarnthein, K.M., Seibold, E., Eds.; Springer: Berlin/Heidelberg, Germany, 1982. [Google Scholar] [CrossRef]
  8. Dañobeitia, J.J. Reconocimiento geofísico de estructuras submarinas situadas al norte y sur del Archipiélago Canario. Rev. Soc. Geol. España 1988, 1, 143–155. [Google Scholar]
  9. Banda, E.; Dañobeitia, J.J.; Suriñach, B.; Ansorge, J. Features of the crustal structure under the Canary Islands. Earth Planet. Sci. Lett. 1981, 55, 11–24. [Google Scholar] [CrossRef]
  10. Uchupi, E.; Emery, K.O.; Bowin, C.O.; Phillips, J.O. Continental margin off Western Africa. Am. Assoc. Petrol. Geol. Bull. 1976, 60, 809–878. [Google Scholar]
  11. Hayes, D.E.; Rabinowitz, P. Mesozoic magnetic lineations and the Magnetic Quiet Zone off Northwest Africa. Earth Planet. Sci. Lett. 1957, 28, 105–115. [Google Scholar] [CrossRef]
  12. Roest, W.R.; Dañobeitia, J.J.; Verhoef, J.; Colette, B.J. Magnetic anomalies in the Canary basin and the Mesozoic evolution of the central North Atlantic. Mar. Geophys. Res. 1992, 14, 1–24. [Google Scholar] [CrossRef]
  13. Schmincke, H.U. Volcanism; Springer: Berlin/Heidelberg, Germany; New York, NY, USA, 2004; 324p. [Google Scholar]
  14. Llanes, M.P. Estructura de la Litosfera en el Entorno de las Islas Canarias a Partir del Análisis Gravimétrico e Isostático: Implicaciones Geodinámicas. Ph.D. Thesis, Universidad Complutense de Madrid, Madrid, Spain, 2006. [Google Scholar]
  15. Troll, V.R.; Carracedo, J.C. The Geology of La Palma. In The Geology of the Canary Islands; Troll, V.R., Carracedo, J.C., Eds.; Elsevier: Amsterdam, The Netherlands, 2016; pp. 101–180. [Google Scholar] [CrossRef]
  16. Geyer, A.; Martí, J.; Villaseñor, A. First-order estimate of the Canary Islands plate-scale stress field: Implications for volcanic hazard assessment. Tectonophysics 2016, 679, 125–139. [Google Scholar] [CrossRef]
  17. Mantovani, E.; Viti, M.; Babucci, D.; Albarello, D. Nubia-Eurasia kinematics: An alternative interpretation from Mediterranean and North Atlantic evidence. Ann. Geophys. 2007, 50, 341–366. [Google Scholar] [CrossRef]
  18. Middlemost, E.A.K. Evolution of La Palma, Canary archipelago. Contr. Mineral. Petrol. 1972, 36, 33–48. [Google Scholar] [CrossRef]
  19. Ancochea, E.; Hernán, F.; Cendrero, A.; Cantagrel, J.; Fúster, J.M.; Ibarrola, E.; Coello, J. Constructive and destructive episodes in the building of a young Oceanic Island, La Palma, Canary Islands, and genesis of the Caldera de Taburiente. J. Volc. Geoth. Res. 1994, 60, 243–262. [Google Scholar] [CrossRef]
  20. Carracedo, J.C.; Rodríguez-Badiola, E.R.; Guillou, H.; de la Nuez, J.; Pérez-Torrado, F.J. Geology and volcanology of La Palma and El Hierro, Western Canaries. Estud. Geológicos 2001, 57, 175–273. [Google Scholar]
  21. Fernández, J.; Escayo, J.; Hu, Z.; Camacho, A.G.; Samsonov, S.V.; Prieto, J.F.; Tiampo, K.F.; Palano, M.; Mallorquí, J.J.; Ancochea, E. Detection of volcanic unrest onset in La Palma, Canary Islands, evolution and implications. Sci. Rep. 2021, 11, 2540. [Google Scholar] [CrossRef]
  22. Ubide, T.; Márquez, Á.; Ancochea, E.; Huertas, M.J.; Herrera, R.; Coello-Bravo, J.J.; Sanz-Mangas, D.; Mulder, J.; MacDonald, A.; Galindo, I. Discrete magma injections drive the 2021 La Palma eruption. Sci. Adv. 2023, 9, eadg4813. [Google Scholar] [CrossRef]
  23. Román, A.; Tovar-Sánchez, A.; Roque-Atienza, D.; Huertas, I.E.; Caballero, I.; Fraile-Nuez, E.; Navarro, G. Unmanned aerial vehicles (UAVs) as a tool for hazard assessment: The 2021 eruption of Cumbre Vieja volcano, La Palma Island (Spain). Sci. Total Environ. 2022, 843, 157092. [Google Scholar] [CrossRef]
  24. Angelier, J. Determination of the mean principal directions of stresses for a given fault population. Tectonophysics 1979, 56, T17–T26. [Google Scholar] [CrossRef]
  25. Reches, Z. Faulting of rocks in three-dimensional strain fields, II. Theoretical analysis. Tectonophysics 1983, 95, 133–156. [Google Scholar] [CrossRef]
  26. Reches, Z. Determination of the tectonic stress tensor from slip along faults that obey the Coulomb yield condition. Tectonics 1987, 7, 849–861. [Google Scholar] [CrossRef]
  27. De Vicente, G. Análisis Poblacional de Fallas. El Sector de Enlace Sistema Central-Cordillera Ibérica. Ph.D. Thesis, Universidad Complutense de Madrid, Madrid, Spain, 1988. [Google Scholar]
  28. Pegoraro, O. Applicattion de la Microtectonique à un Étude de Neotectonique. Le Golfe Maliaque (Grèce Centrale). Ph.D. Thesis, Thèse IIIème Cycle, U.S.T.L., Montpellier, France, 1972. [Google Scholar]
  29. Angelier, J.; Mechler, P. Sur une metode graphique de recherche des contraintes principales egalement utilisable en tectonique et en seismologie: La methode des diedres droites. Bull. Soc. Geol. Fr. 1977, 7, 1309–1318. [Google Scholar] [CrossRef]
  30. Capote, R.; De Vicente, G.; González-Casado, J.M. An application of the slip model of brittle deformations to focal mechanism analysis in three different plate tectonics situations. Tectonophysics 1991, 191, 399–409. [Google Scholar] [CrossRef]
  31. Olaiz, A.J.; Muñoz-Martín, A.; De Vicente, G.; Vegas, R.; Cloetingh, S. European continuous active tectonic strain–stress map. Tectonophysics 2009, 474, 33–40. [Google Scholar] [CrossRef]
  32. Pérez-López, R.; Mediato, J.F.; Rodríguez-Pascua, M.A.; Giner-Robles, J.L.; Ramos, A.; Martín-Velázquez, S.; Martínez-Orío, R.; Fernández-Canteli, P. An active tectonic field for CO2 storage management: The Hontomín onshore case study (Spain). Solid Earth 2020, 11, 719–739. [Google Scholar] [CrossRef]
  33. Lee, J.C.; Angelier, J. Paleostress trajectory maps based on the results of local determinations: The “lissage” program. Comp. Geosci. 1994, 20, 161–191. [Google Scholar] [CrossRef]
  34. Arnoso, J.; Riccardi, U.; Benavent, M.; Tammaro, U.; Montesinos, F.G.; Blanco-Montenegro, I.; Vélez, E. Strain Pattern and Kinematics of the Canary Islands from GNSS Time Series Analysis. Remote Sens. 2020, 12, 3297. [Google Scholar] [CrossRef]
  35. Del Fresno, C.; Cesca, S.; Klügel, A.; Domínguez Cerdeña, I.; Díaz-Suárez, E.A.; Dahm, T.; García-Cañada, L.; Meletlidis, S.; Milkereit, C.; Valenzuela-Malebrán, C.; et al. Magmatic plumbing and dynamic evolution of the 2021 La Palma eruption. Nat. Commun. 2023, 14, 358. [Google Scholar] [CrossRef]
  36. Montesinos, F.G.; Sainz-Maza, S.; Gómez-Ortiz, D.; Arnoso, J.; Blanco-Montenegro, I.; Benavent, M.; Vélez, E.; Sánchez, N.; Martín-Crespo, T. Insights into the Magmatic Feeding System of the 2021 Eruption at Cumbre Vieja (La Palma, Canary Islands) Inferred from Gravity Data Modeling. Remote Sens. 2023, 15, 1936. [Google Scholar] [CrossRef]
  37. D’Auria, L.; Koulakov, I.; Prudencio, J.; Cabrera-Pérez, I.; Ibáñez, J.M.; Barrancos, J.; García-Hernández, R.; Martínez van Dorth, D.; Padilla, G.D.; Przeor, M.; et al. Rapid magma ascent beneath La Palma revealed by seismic tomography. Sci. Rep. 2022, 12, 17654. [Google Scholar] [CrossRef]
  38. Romero, J.E.; Burton, M.; Cáceres, F.; Taddeucci, J.; Civico, R.; Ricci, T.; Pankhurst, M.J.; Hernández, P.A.; Bonadonna, C.; Llewellin, E.W.; et al. The initial phase of the 2021 Cumbre Vieja ridge eruption (Canary Islands): Products and dynamics controlling edifice growth and collapse. J. Volc. Geoth. Res. 2022, 431, 107642. [Google Scholar] [CrossRef]
  39. Sanz-Mangas, D.; Galindo, I.; Pérez-López, R.; García-Davalillo, J.C.; Sánchez, N.; Rodríguez Pascua, M.A.; Perucha, M.A. Distal Magmatic Pulse Injections at La Palma Eruption 2021 (Oral Communication). In Proceedings of the 10th Spanish-Portuguese Assembly of Geodesy and Geophysics, Toledo, Spain, 23 November 2022; Available online: https://congreso.ign.es/AsambleaHPGG-heme/resources/docs/Programa_detallado_ingles.pdf (accessed on 15 January 2024).
  40. Barde-Cabuson, S.; Finizola, A.; Torres, P.; Villasante-Marcos, V.; Abella, R.; Aragó, S.; Berthod, C.; Ibarra, P.; Lamolda, H.; Meletlidis, S.; et al. New structural, hydrogeological and hydrothermal insinghts on Cumbre Vieja (La Palma, Canary Islands, Spain). AGU 2013, 511D, 2715. [Google Scholar]
  41. González, P.J. Volcano-tectonic control of Cumbre Vieja. Science 2022, 375, 1348–1349. Available online: https://www.science.org/doi/10.1126/science.abn5148 (accessed on 15 January 2024). [CrossRef] [PubMed]
Figure 1. Geographical and geological setting: (A) geographic location of the Canary Islands archipelago; (B) location of La Palma island within the Canary Islands archipelago; (C) digital elevation model (DEM) of the island of La Palma and the location of the area covered by lava flows from the 2021 Tajogaite volcanic eruption; (D) detailed view of the extent of the lava flows and cinder cone of the 2021 Tajogaite eruption.
Applsci 14 02745 g001
Figure 2. Examples of normal faults in La Palma (DEM of La Palma with the photograph location): (A) conjugate normal faults affecting pyroclastic deposits (Taburiente volcanic edifice (superior), Barlovento, La Palma); (B) slickensides on normal fault plane affecting basaltic lava flows (Bejenado volcanic edifice, Barranco de las Angustias, La Palma).
Applsci 14 02745 g002
Figure 3. Stereonet of fault measuring stations (Wulff net, lower hemisphere) and representation of Dey obtained from the Slip Model (red arrows).
Applsci 14 02745 g003
Figure 4. Data points and results for the fault population analysis in La Palma Island (the dashed lines represent Dey’s mean trajectories.): (A) Atlantic Strain Field and (B) Local Strain Field.
Applsci 14 02745 g004
Figure 5. Normal fault planes of the Roques of Jedey, Jedey eruption (1585), and FPA analysis: (A) fault planes and slickensides; (B) Right-Dihedron Method solution; (C) Slip Model solution; (D) average direction of maximum horizontal shortening (Dey) obtained from the Slip Model.
Applsci 14 02745 g005
Figure 6. Spatial evolution of the hypocenter distribution during the 2021 eruption: (A) 12–19 September; (B) 19 September–1 October; (C) 1–10 October; (D) 10 October–13 December. See text for further explanation.
Applsci 14 02745 g006
Figure 7. Photograph of the cinder cone with the main eruptive vents aligned according to the TZF orientation (NW-SE), from RPA aerial view (23 October 2021).
Applsci 14 02745 g007
Figure 8. Surface reflection of fracturing development: (A) strike-slip fault with pull-apart basins to the south of the lava field; (B) strike-slip fault affecting an agricultural irrigation pond; (C) normal fault on Cogote Mountain.
Applsci 14 02745 g008
Figure 9. Fault mapping of TZF and MZF and spatial distribution of stations for measuring surface fractures of endogenous origin generated during the eruption. The red color represents the measurement stations operated in lava emission centers.
Applsci 14 02745 g009
Figure 10. Transtensional strike-slip fault (MZF) with development of normal faults in echelon, in the southern sector of the lava flows: (A) orthoimage by drone (the red arrows indicate the sense of movement of the fault) and (B) field view of (A), normal faults in echelon affecting ash fallout deposits from the eruption itself (the red arrows indicate the surface fault trace).
Applsci 14 02745 g010
Figure 11. Fault mapping of TZF and MZF and spatial distribution of Right-Dihedron Method solution (pair of data fault plane/slickenside) stations for measuring surface fractures of endogenous origin generated during the eruption.
Applsci 14 02745 g011
Figure 12. Faults suggesting creep movement of the TZF and MZF, before and after the volcanic eruption. Northern sector of the lava flows: (A) faults in the houses repaired since 1980 with the same orientation as the TZF; (B) close view of the plaster cores on fractures generated in houses; at present it continues its creep movement after the volcanic eruption. Southern sector of the lava flows: (C) fracture repaired before the eruption (1) and reactivated during the volcanic eruption (2); (D) close view of the fracture with reparation marks.
Applsci 14 02745 g012
Figure 13. Structural map of the main deformation bands associated with the TZF and MZF. The rose diagram represents the average orientation of previous fractures obtained from aerial photography of 1946–1956.
Applsci 14 02745 g013
Disclaimer/Publisher’s Note: The statements, opinions and data contained in all publications are solely those of the individual author(s) and contributor(s) and not of MDPI and/or the editor(s). MDPI and/or the editor(s) disclaim responsibility for any injury to people or property resulting from any ideas, methods, instructions or products referred to in the content.

