Article

A New Surrogate Safety Measure Considering Temporal–Spatial Proximity and Severity of Potential Collisions

1
Key Laboratory of Road and Traffic Engineering of Ministry of Education, Tongji University, Shanghai 201804, China
2
China Railway Siyuan Survey and Design Group Co., Ltd., Wuhan 430063, China
*
Authors to whom correspondence should be addressed.
Appl. Sci. 2024, 14(7), 2711; https://doi.org/10.3390/app14072711
Submission received: 25 February 2024 / Revised: 14 March 2024 / Accepted: 20 March 2024 / Published: 23 March 2024
(This article belongs to the Special Issue Vehicle Safety and Crash Avoidance)

Abstract

:
Accurate identification and analysis of traffic conflicts through surrogate safety measures (SSMs) are crucial for safety evaluation in road systems. Existing SSMs for conflict identification and analysis mostly consider the temporal–spatial proximity of conflicts without taking into account the severity of potential collisions. This makes SSMs unsuitable for traffic safety evaluation in complex road environments. In order to address the shortcomings above, this study first introduces a new SSM called the Potential Conflict Risk Index (PCRI). To validate the effectiveness of PCRI, the inD dataset is adopted for conflict identification comparison between time-to-collision (TTC) and PCRI. Using PCRI, this study conducts a conflict analysis in the freeway merging areas based on the data from the Outer Ring Expressway Dataset (ORED), accounting for differences between cars and trucks. The comparative results between TTC and PCRI show that PCRI can provide a more comprehensive identification of conflicts and a more accurate identification of the moment with the highest conflict risk. The results of conflict analysis suggest that conflicts occur more frequently in situations involving trucks, and these conflicts commonly occur in closer proximity to the on-ramp at freeway merging areas. The findings from this study can improve the accuracy of conflict identification under different conflict patterns, enhancing the specificity of traffic safety measures and ultimately ensuring the safety of road systems.

1. Introduction

Road safety constitutes a critical concern for traffic authorities worldwide [1]. Despite the significant advancements achieved, there is still serious concern regarding more than 1.35 million people dying each year around the world in road accidents and over 50 million people suffering injury [2,3]. This critical situation highlights the urgent need for robust traffic safety evaluation methods, designed to deeply understand the underlying causes and recurring patterns of road accidents. In this context, surrogate safety measures (SSMs) emerge as a pivotal approach for safety assessment, prioritizing the analysis of more readily observable traffic conflicts over actual crashes. The application of SSMs to identify and analyze conflicts under particular circumstances serves as an effective means to assess road safety scenarios. This work informs the development and implementation of preventive safety interventions designed to mitigate the risk of collisions on the roads [4].

1.1. Surrogate Safety Measures

In recent years, traffic safety evaluation has emerged as a pivotal research focus, with the aim of identifying potential safety hazards and proposing targeted enhancements to elevate road traffic safety. This focus underscores the critical importance of proactive measures in mitigating risks and ensuring safer travel for all road users [5,6]. Two primary methods for traffic safety evaluation are methods based on statistical models and methods based on conflicts [7].
Traditional statistical models focus on the analysis of crash frequency and draw upon extensive historical data on accidents as foundational evidence [8,9]. However, due to the infrequent occurrence of accidents, the data available for analysis might be constrained in specific situations [10]. Based on the heightened occurrence of conflicts near collision sites, conflict-based methods have garnered widespread attention. As a category of traffic safety evaluation methods based on conflict analysis, SSMs have emerged as a prominent alternative for evaluating traffic safety. Existing SSMs can be divided into two primary categories: those based on evasive actions and those based on proximity [11]. In the definition of evasive action-based measures, conflicts have been associated with such occurrences as the appearance of brake lights or the unexpected changing of lanes or direction [12]. Several identified evasive actions, such as braking or lane-changing, are often precautionary measures rather than indicators of imminent danger for collisions [13,14,15]. Consequently, a strong correlation between collisions and conflicts might not be established if conflicts are only defined based on observed evasive actions. Moreover, in scenarios where vehicles in two incidents share similar driving states but differ significantly in vehicle proximity, they could be assigned the same level of conflict risk based on the assessment of evasive actions taken. This approach could result in scenarios where vehicles, being far apart and unlikely to collide, are nonetheless categorized as possessing a high conflict risk [11].
A fundamental strength of proximity-based measures resides in the assumption that every collision is preceded by a conflict. This results in a strong correlation between collisions and conflicts. Various proximity measures have been developed to quantify the temporal or spatial proximity of collisions for interactions among road users. The most commonly employed measure is time-to-collision (TTC) [16]. Hayward first proposed TTC, which is defined as the time remaining before a collision occurs between a leading and a following vehicle if two vehicles maintain their speed at that moment [17]. Many scholars have conducted traffic conflict analysis using TTC [18,19]. A method that combines TTC with a multi-level random parameter logistic regression model to calculate the collision risk between merging vehicles and surrounding vehicles was proposed by Gu et al. [20]. However, traditional TTC can only be calculated when the speed of the following vehicle exceeds the leading vehicle. To address the limitation, some studies made relevant improvements based on the conventional TTC. Ozbay et al. proposed the modified TTC (MTTC) to estimate the collision risk in situations when the following vehicle’s speed is lower than the leading vehicle’s speed [21]. Ge et al. proposed the work zone time-to-collision (WTTC) based on TTC. This measure factored in the influence of speed limits in freeway work zones and constructed a rear-end conflict identification model based on WTTC and deceleration rate thresholds [22]. Other improved measures based on TTC include time-exposed TTC (TET), time-integrated TTC (TIT), and time-to-lane crossing (TLC) [23,24]. These aforementioned measures accurately assess conflict risk from specific perspectives in the proximity of collisions. The proximity-based measures assume that proximity serves as a surrogate indicator for conflict severity [25]. However, this assumption is not applicable to reflect the severity of potential collisions. Some studies have adopted the consequences of the risk resulting from conflicts to define the severity of potential collisions. Dijkstra and Drolenga utilized potential collision energy (PCE) to reflect the impact of a conflict via the potential collision energy [26]. This type of SSM can better reflect conflict severity. Moreover, some studies have proved that proximity-based measures are not suitable in congested road conditions and less organized traffic environments [27,28].
Therefore, an effective SSM should reflect the correlation between conflicts and collisions, accurately assess the severity of potential collisions, and be applicable to complex road environments.

1.2. Conflict Analysis in Freeway Merging Areas
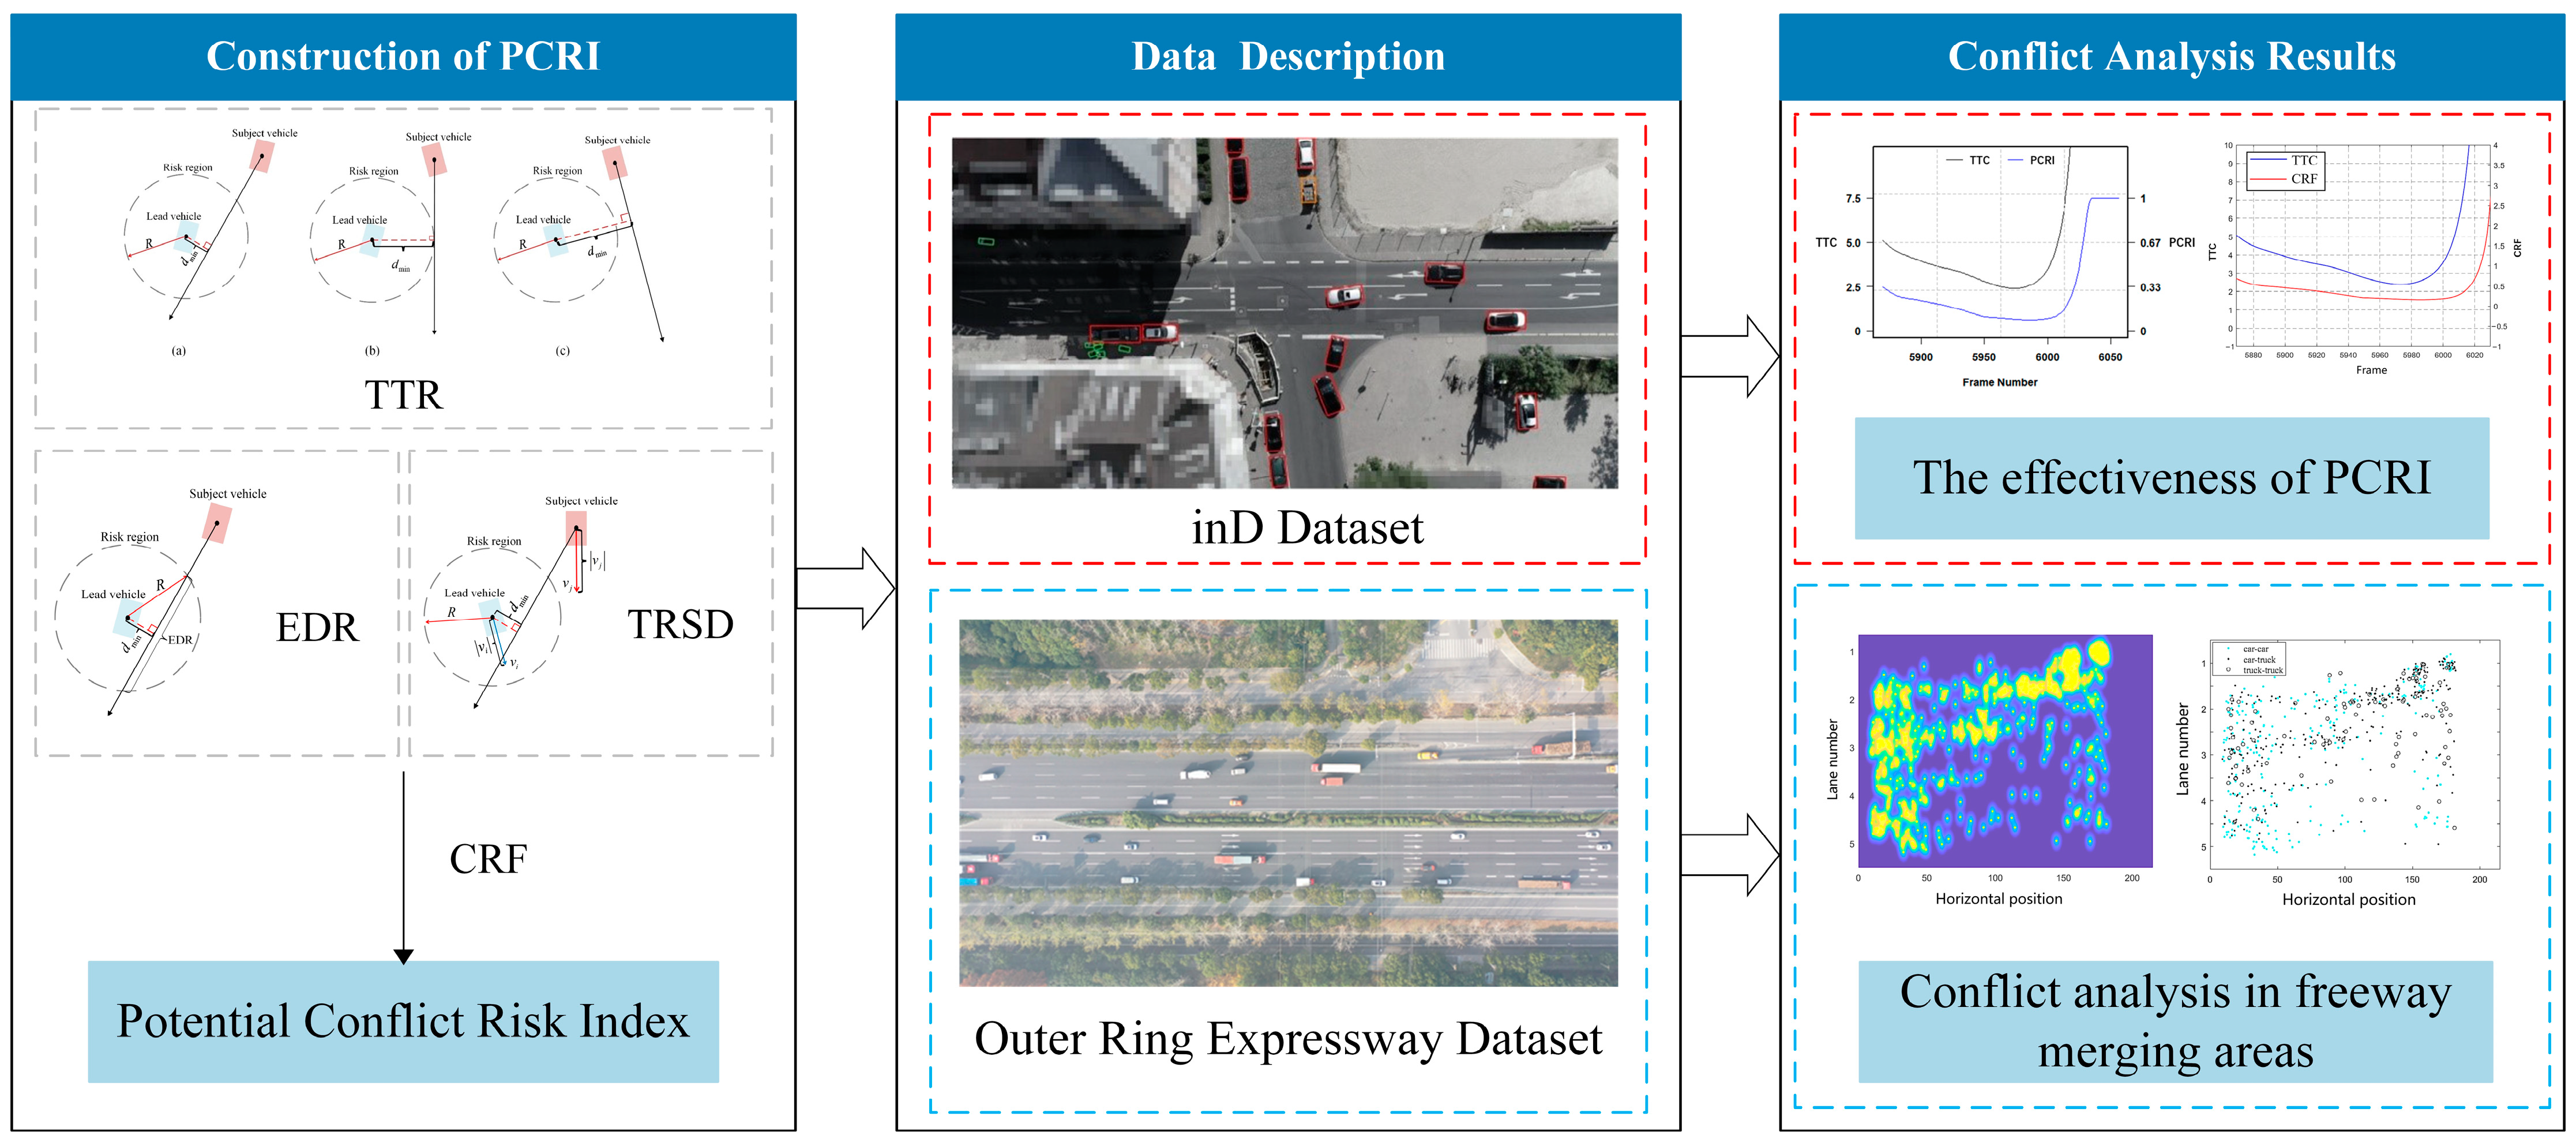
Considering the inherent road features, freeway merging areas represent complex traffic environments characterized by frequent merging behavior [29,30,31,32]. The merging behavior is a high-risk driving behavior that involves interactions among different vehicles, thereby exacerbating conflicts in merging areas [33,34]. Analyzing traffic conflicts occurring in merging areas helps to understand the traffic patterns in these areas, which in turn contributes to preventing traffic accidents on the road.
Many previous studies explored different factors influencing the risk of conflicts in freeway merging areas [35]. Li et al. [18] analyzed the influence of different traffic conditions on the conflict characteristics in freeway merging areas. Xu et al. [36] utilized a simulation platform using virtual reality technology to analyze the relationship between conflict risk and traffic flow or ramp metering. Other factors, including drivers’ driving preferences, were also investigated [37]. Most of these studies primarily analyze the impact of traffic flow conditions and road conditions on conflict characteristics. However, related research has indicated that the type of vehicle also significantly affects the safety in freeway merging areas.
Some research explored conflicts involving different vehicle types. A study considered the impact of autonomous vehicles and human-driving vehicles on conflicts in merging areas [38]. Wang et al. [39] found that the probability of severe conflicts occurring for large vehicles in freeway merging areas is 4.765 times that of small vehicles. Considering various patterns among different vehicle types, Meng et al. used the deceleration rate to avoid crashes (DRAC) to evaluate the risk of rear-end collisions in work zones [40]. These findings underscore the critical role of vehicle types in conflict analysis. However, most of these studies have not considered the differences between trucks and cars in conflicts, and have only analyzed a specific type of conflicts, such as rear-end conflicts. Trucks, as a type of heavy vehicle, have been indicated by some studies to be more prone to conflict with other vehicles in freeway merging areas. Weng et al. found that vehicle type substantially affects the crash risk for merging vehicles. And the risk increases significantly when the lead vehicle in a merging scenario is a heavy vehicle [32]. Additionally, different types of conflicts also influence the analysis performance of SSMs [40,41].
Consequently, considering the differences between trucks and cars, and analyzing the conflict characteristics of trucks and cars in merging areas of various conflict types is crucial for understanding the conflict patterns in freeway merging areas.
Previous SSMs have rarely considered both the proximity of conflicts and the severity of potential collisions simultaneously. Furthermore, the current conflict analysis in freeway merging areas does not consider the differences in conflict characteristics between trucks and cars under various types of conflicts. These limitations compromise the accuracy of conflict identification and analysis within road systems and affect the reliability of traffic safety assessments. As a result, such deficiencies may affect the effectiveness of traffic management strategies and undermine overall road safety. To bridge these gaps, this paper proposes a new SSM that considers time to region (TTR), exposure distance in region (EDR), and time related to speed and direction (TRSD) for conflict identification and analysis. TTR and EDR reflect the temporal and spatial proximity of conflicts, while TRSD reflects the severity of potential collisions. This innovative SSM is called the Potential Conflict Risk Index (PCRI). Video trajectory data are utilized to validate the effectiveness of this index. Based on PCRI, this paper conducts an analysis of conflict characteristics in freeway merging areas. It focuses on the distinctions between trucks and cars across different conflict types to comprehensively understand conflict patterns in these areas.
The contributions of this study can be described as follows: (1) A SSM based on the temporal–spatial proximity of conflicts, and the severity of potential collisions is introduced for conflict identification. Video trajectory data are processed and utilized to validate the effectiveness and generalizability of PCRI in different conflict types. The results indicate that PCRI can more comprehensively identify different types of conflicts and more accurately pinpoint the highest risk moments of conflicts compared with TTC. (2) An analysis of conflict characteristics between trucks and cars in freeway merging areas is performed using PCRI. These insights can help transportation management agencies comprehend the characteristics of conflicts in complex traffic settings and formulate effective traffic management and control strategies.
The remainder of this paper is arranged as follows: Section 2 introduces the whole framework and the construction of TTC and PCRI. Section 3 outlines the data sources. Section 4 shows the results of the validation for PCRI’s effectiveness and the conflict analysis results of freeway merging areas with different vehicle types. Finally, Section 5 provides conclusions and future work for this study.

2. Methodology

2.1. Whole Framework

Figure 1 displays the whole framework of this study. Initially, PCRI is constructed to identify conflicts from three aspects. Second, video trajectory data from the inD dataset and the Outer Ring Expressway Dataset (ORED) are introduced and processed, laying the groundwork for the calculation of SSMs. Third, through comparison with the conflict identification results of TTC, the effectiveness of PCRI is substantiated. Finally, the study delves into an examination of conflict characteristics within freeway merging areas, categorizing conflicts by types, and considering the impact of different vehicle types on different conflict scenarios.

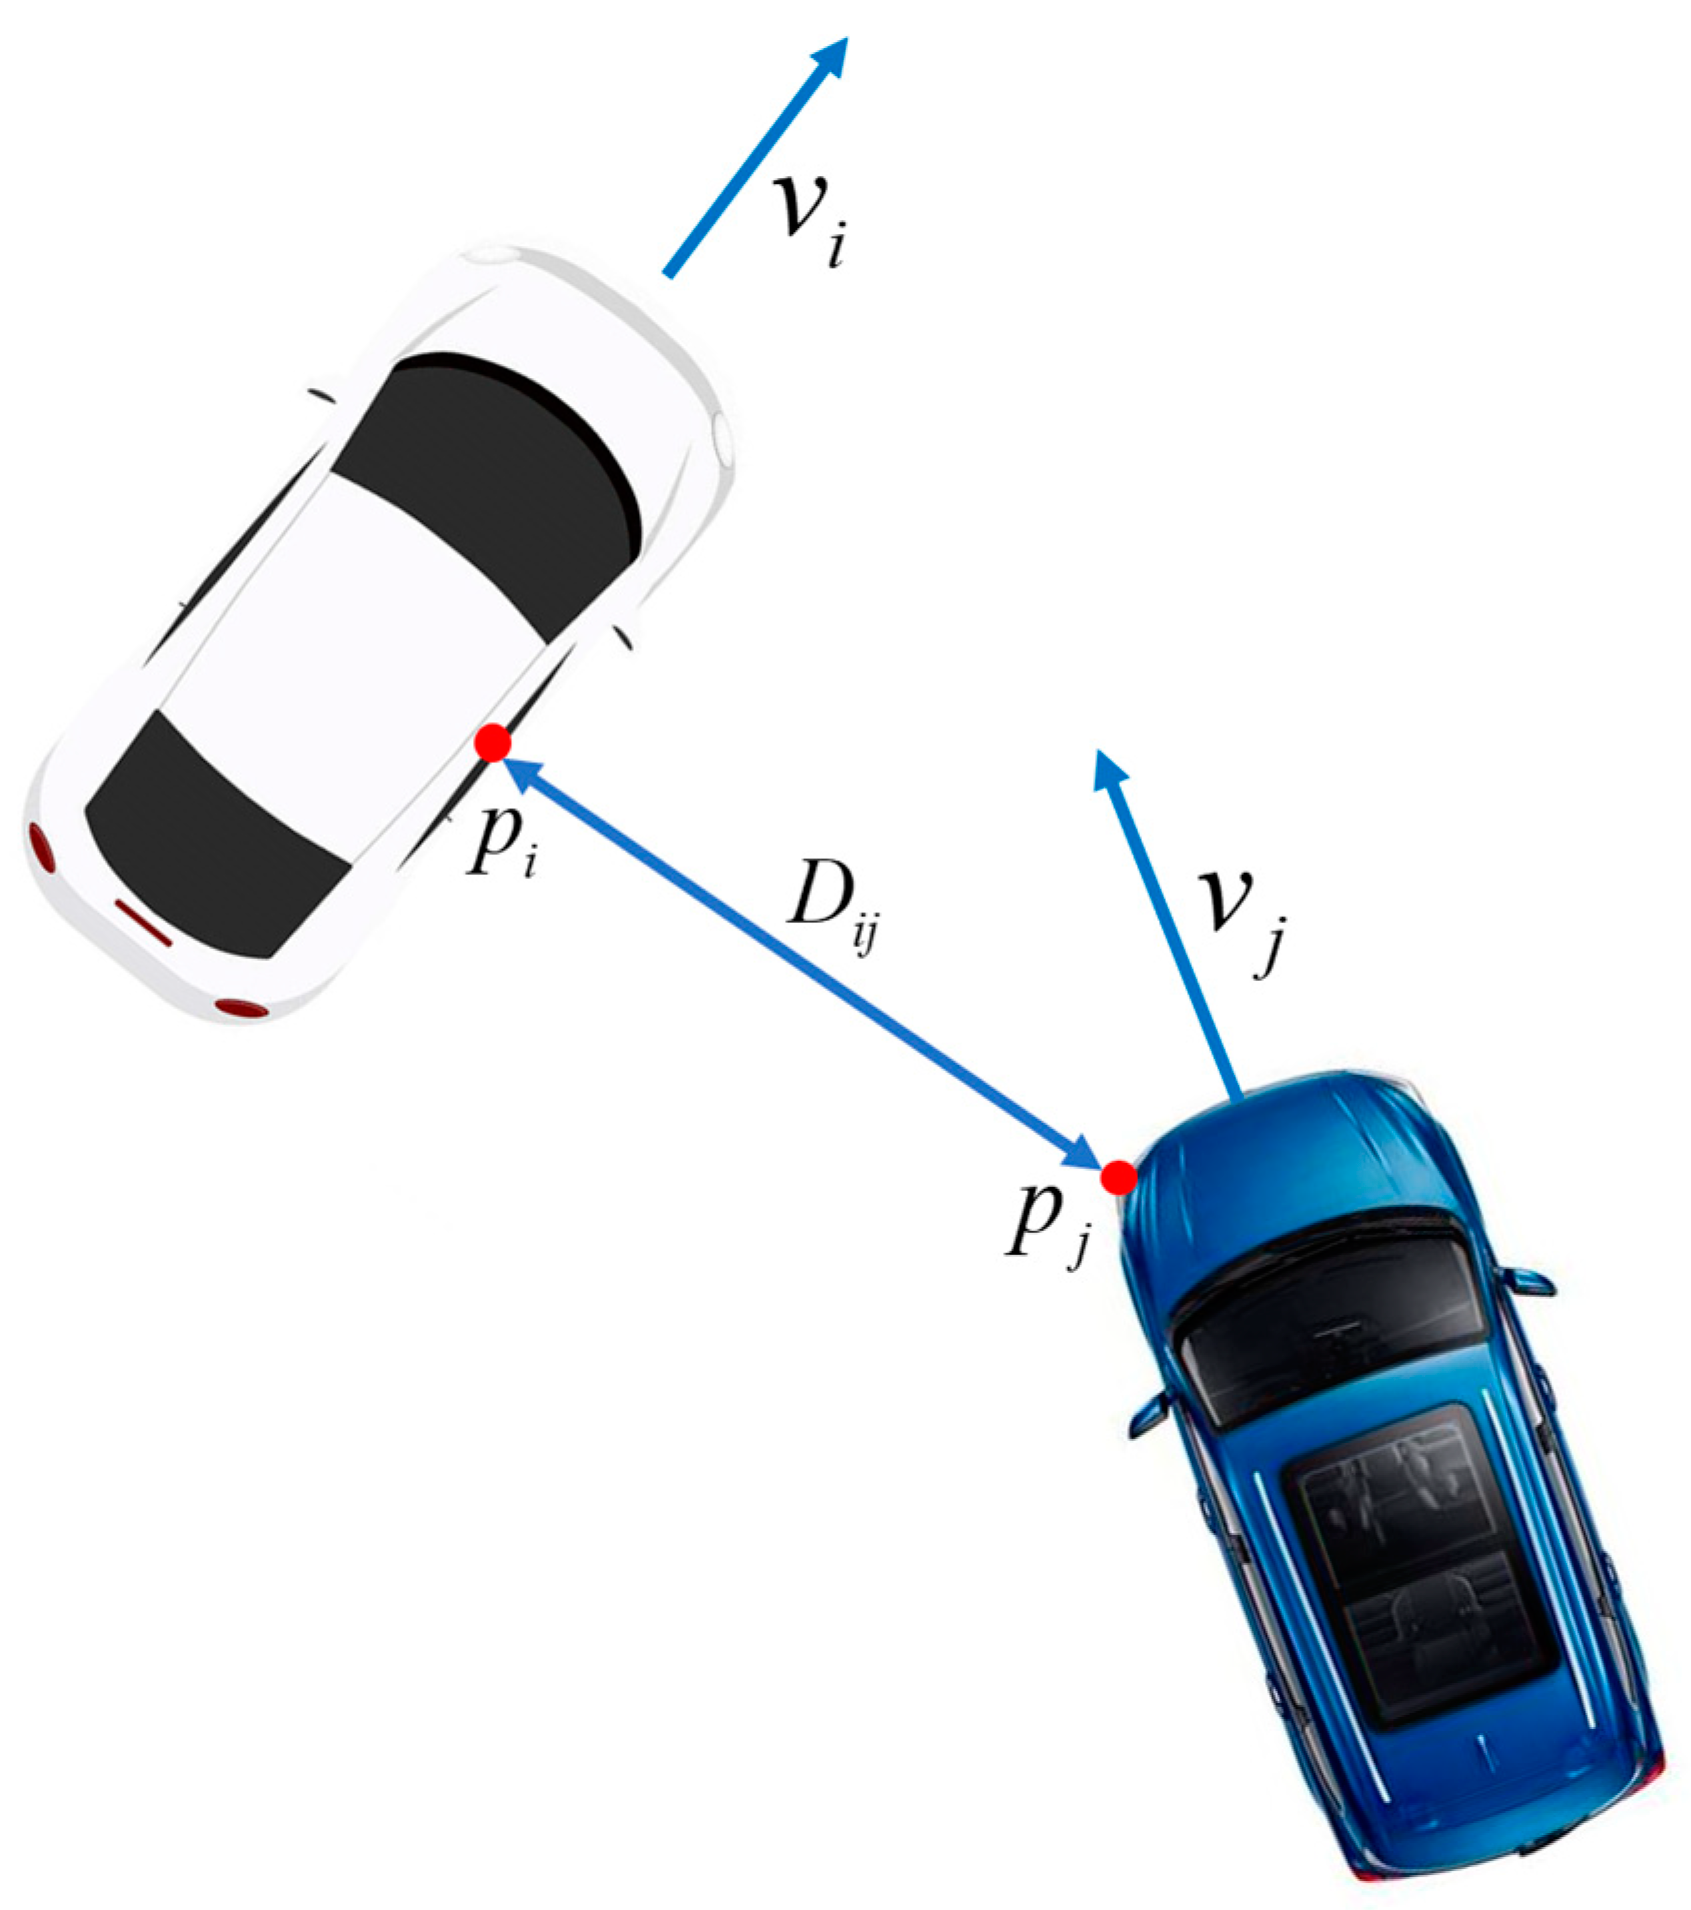
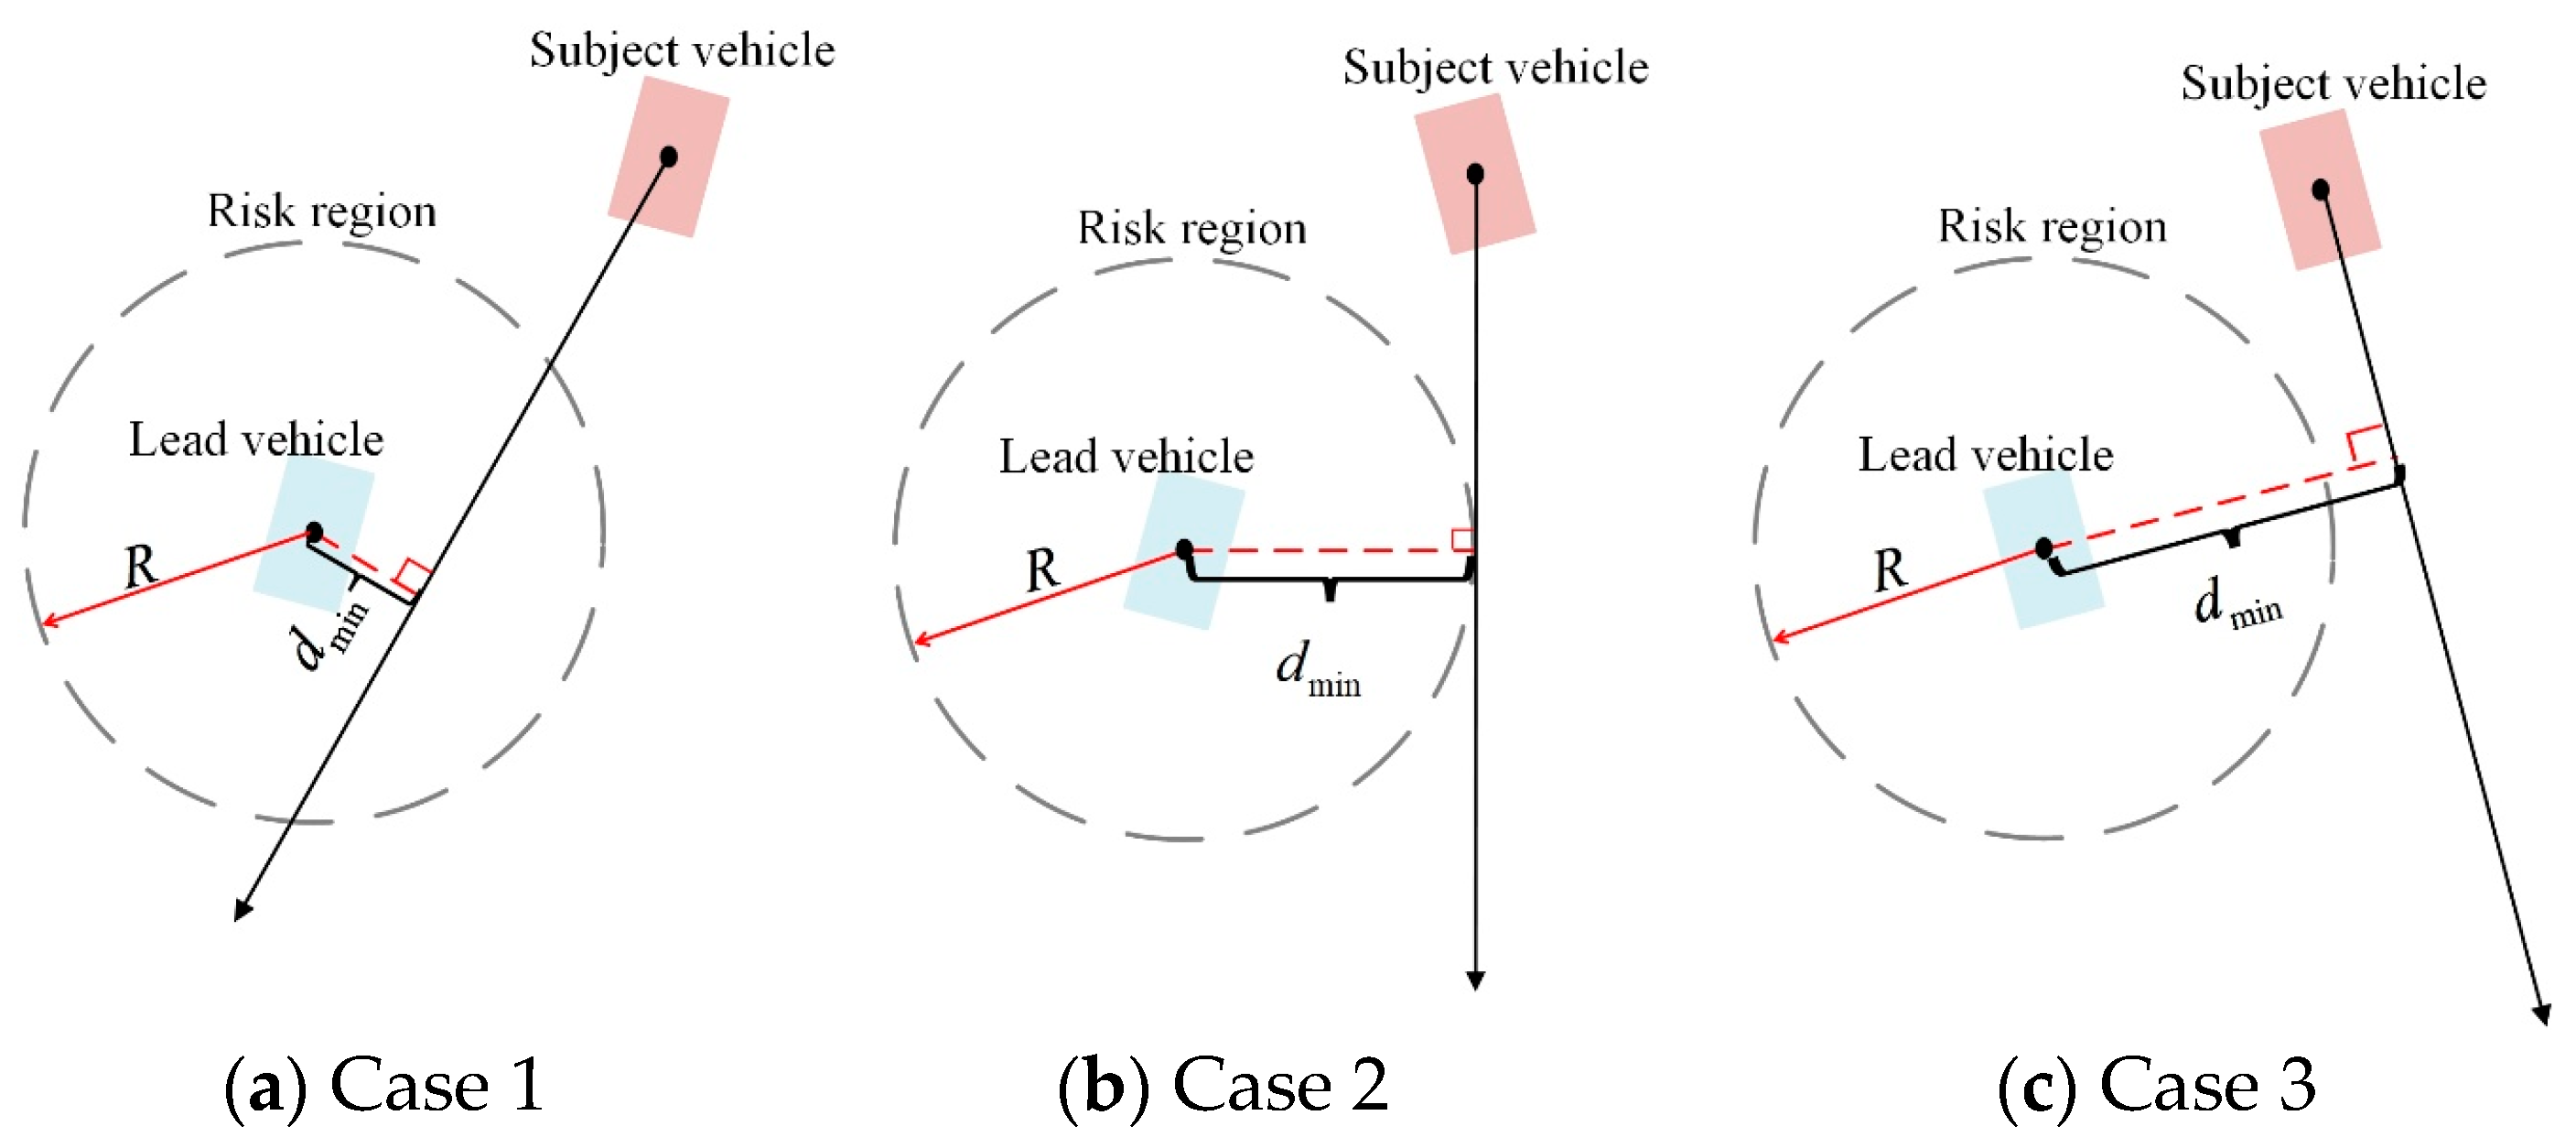
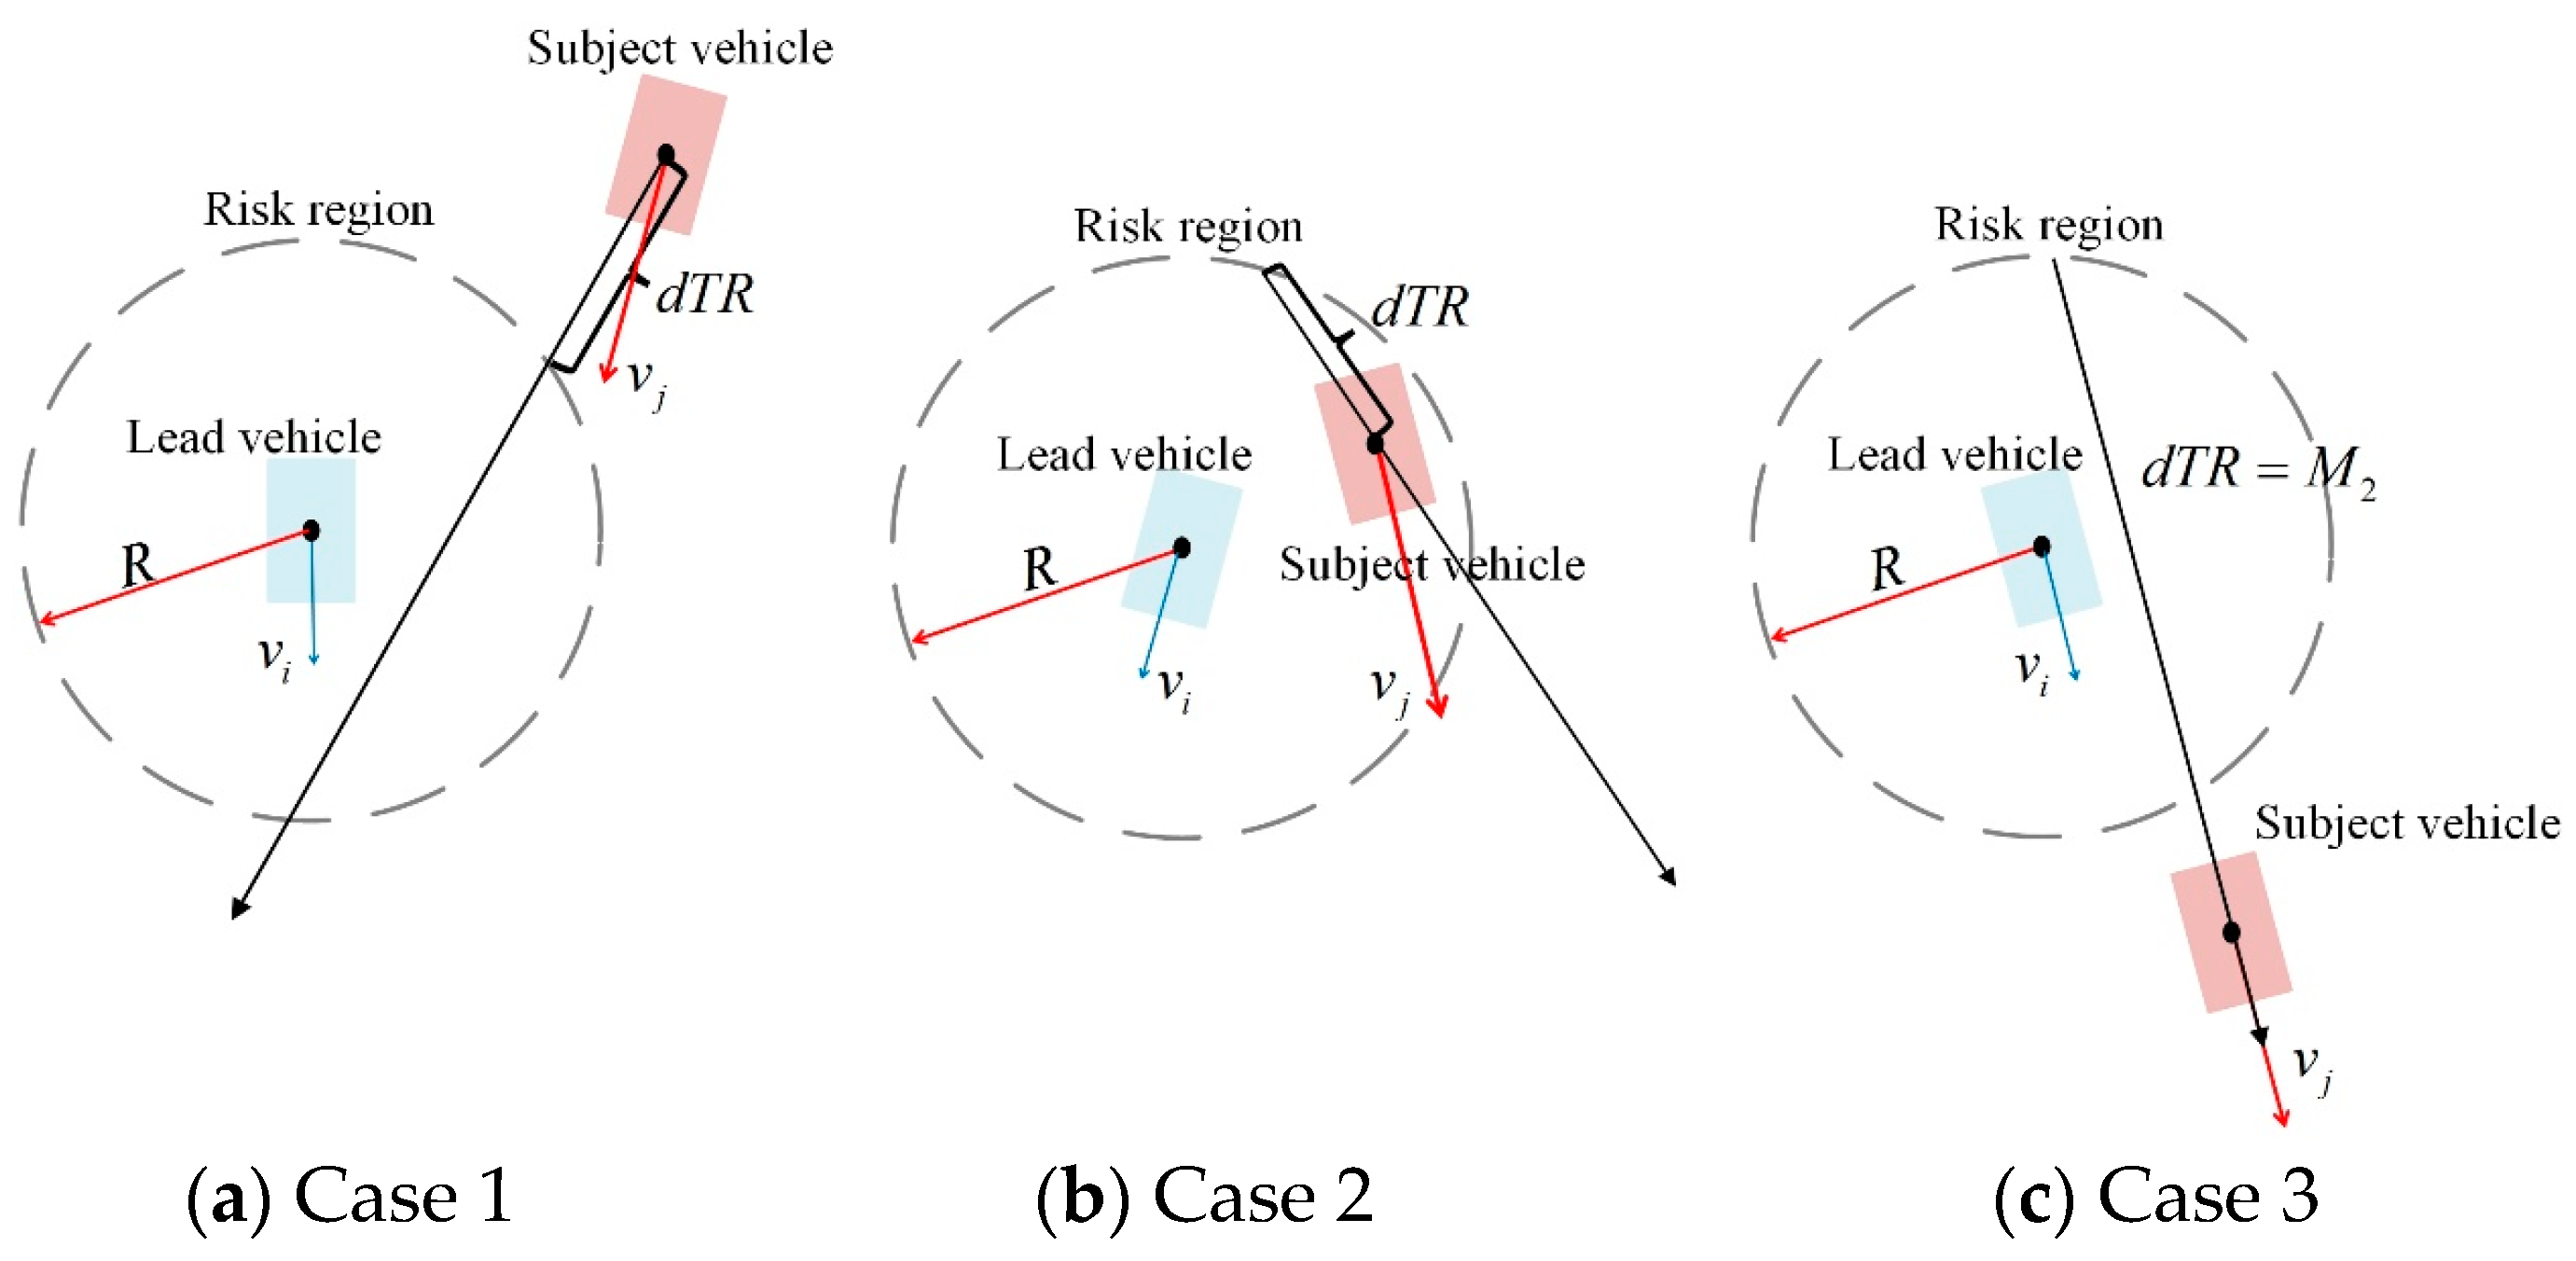
2.2. Time-to-Collison

Vehicle movement is not strictly limited to one-dimensional paths. In this part, we employ the method mentioned in [42] to calculate TTC in two dimensions.
The position vectors of two vehicles are p i and p j , respectively, representing the positions of the points on each vehicle that are closest to the other vehicle at a specified time step. Speeds of two vehicles are denoted as v i and v j , while accelerations are defined as a i and a j . All the definitions of variables related to TTC are shown in Figure 2. In this paper, to facilitate calculations of TTC, p i and p j are simplified to the positions of the geometric center of the two vehicles, respectively.
The D i j can be calculated in Equation (1). Differentiating both sides of Equation (1) yields Equation (2). Continuing the differentiation based on Equation (2), Equation (3) can be obtained.
D i j = p i p j 2
D i j D i j · = ( p i p j ) T ( v i v j )
D i j 2 · + D i j D i j · · = ( v i v j ) T ( v i v j ) + ( p i p j ) T ( a i a j )
Over a very short time interval, the vehicles move at almost constant speeds, during which the accelerations a i and a j are sufficiently small that it can be considered negligible. Based on Equations (1)–(3), TTC in two dimensions considering the changes in closure rate, can be calculated as follows.
T T C = D i j D i j · i f D i j · · = 0 D i j · D i j · · i f Δ = D i j 2 2 D i j · · D i j < 0 min ( D i j · ± D i j · · ) i f min ( D i j · ± D i j · · ) 0 max ( D i j · ± D i j · · ) i f min ( D i j · ± D i j · · ) < 0

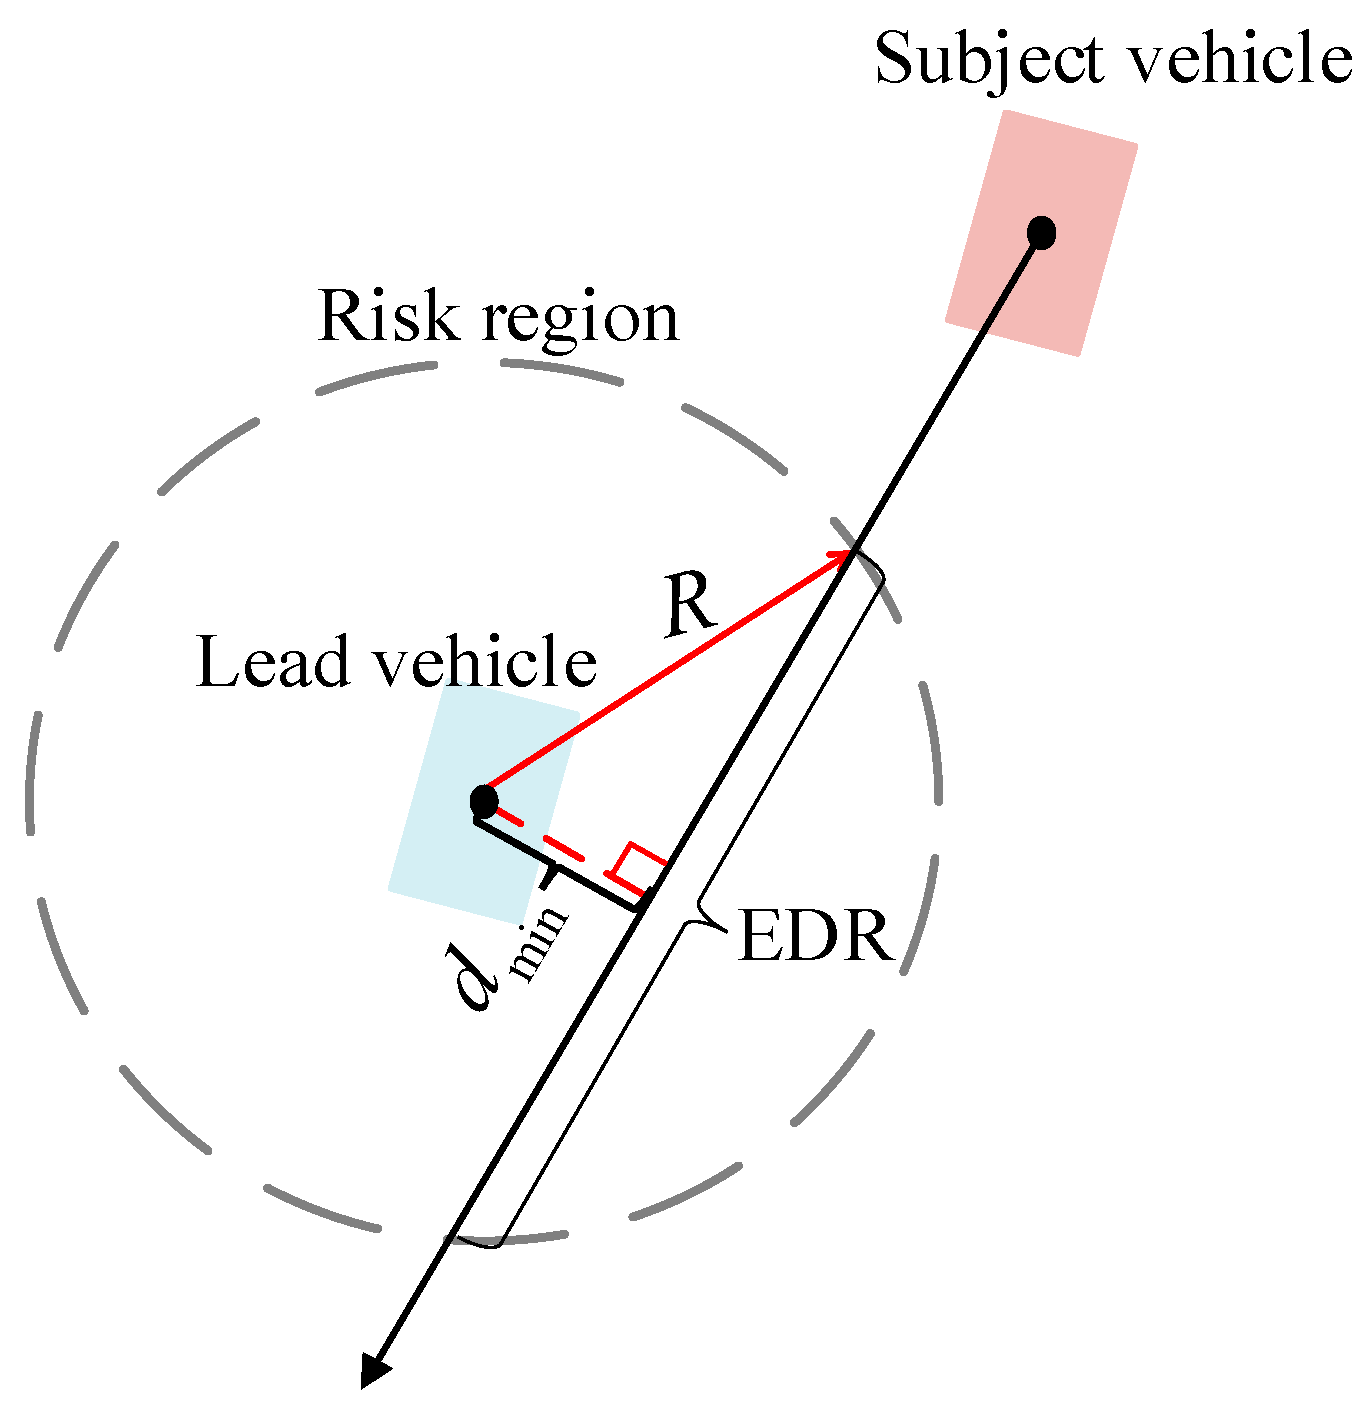
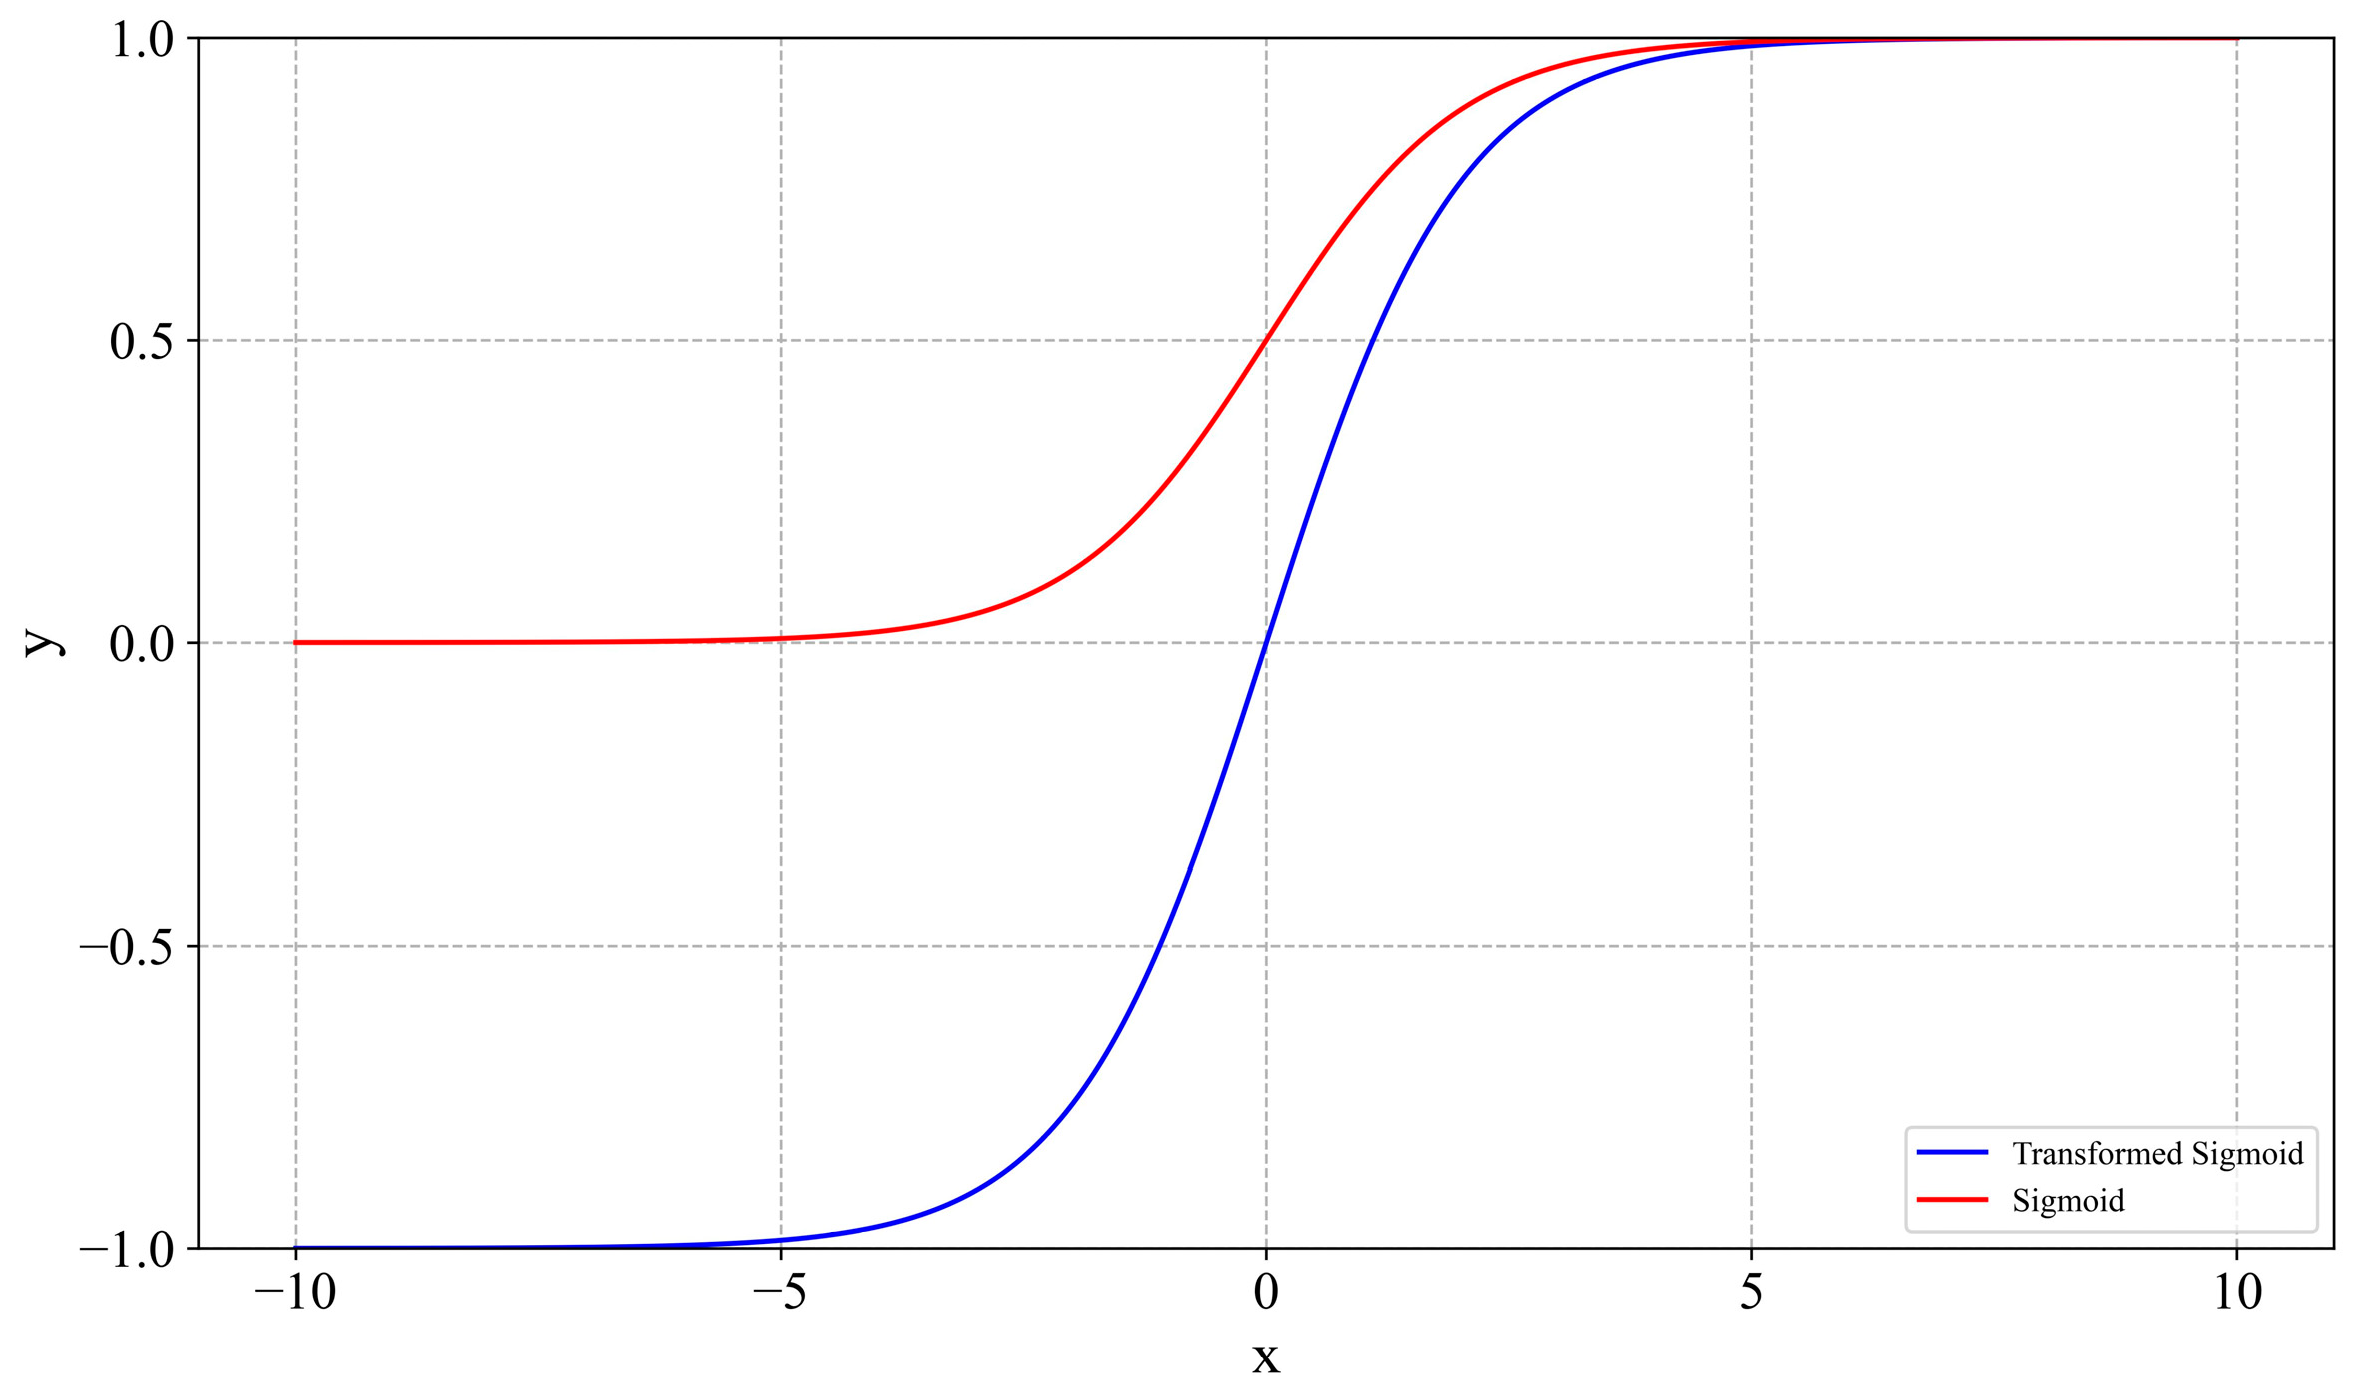
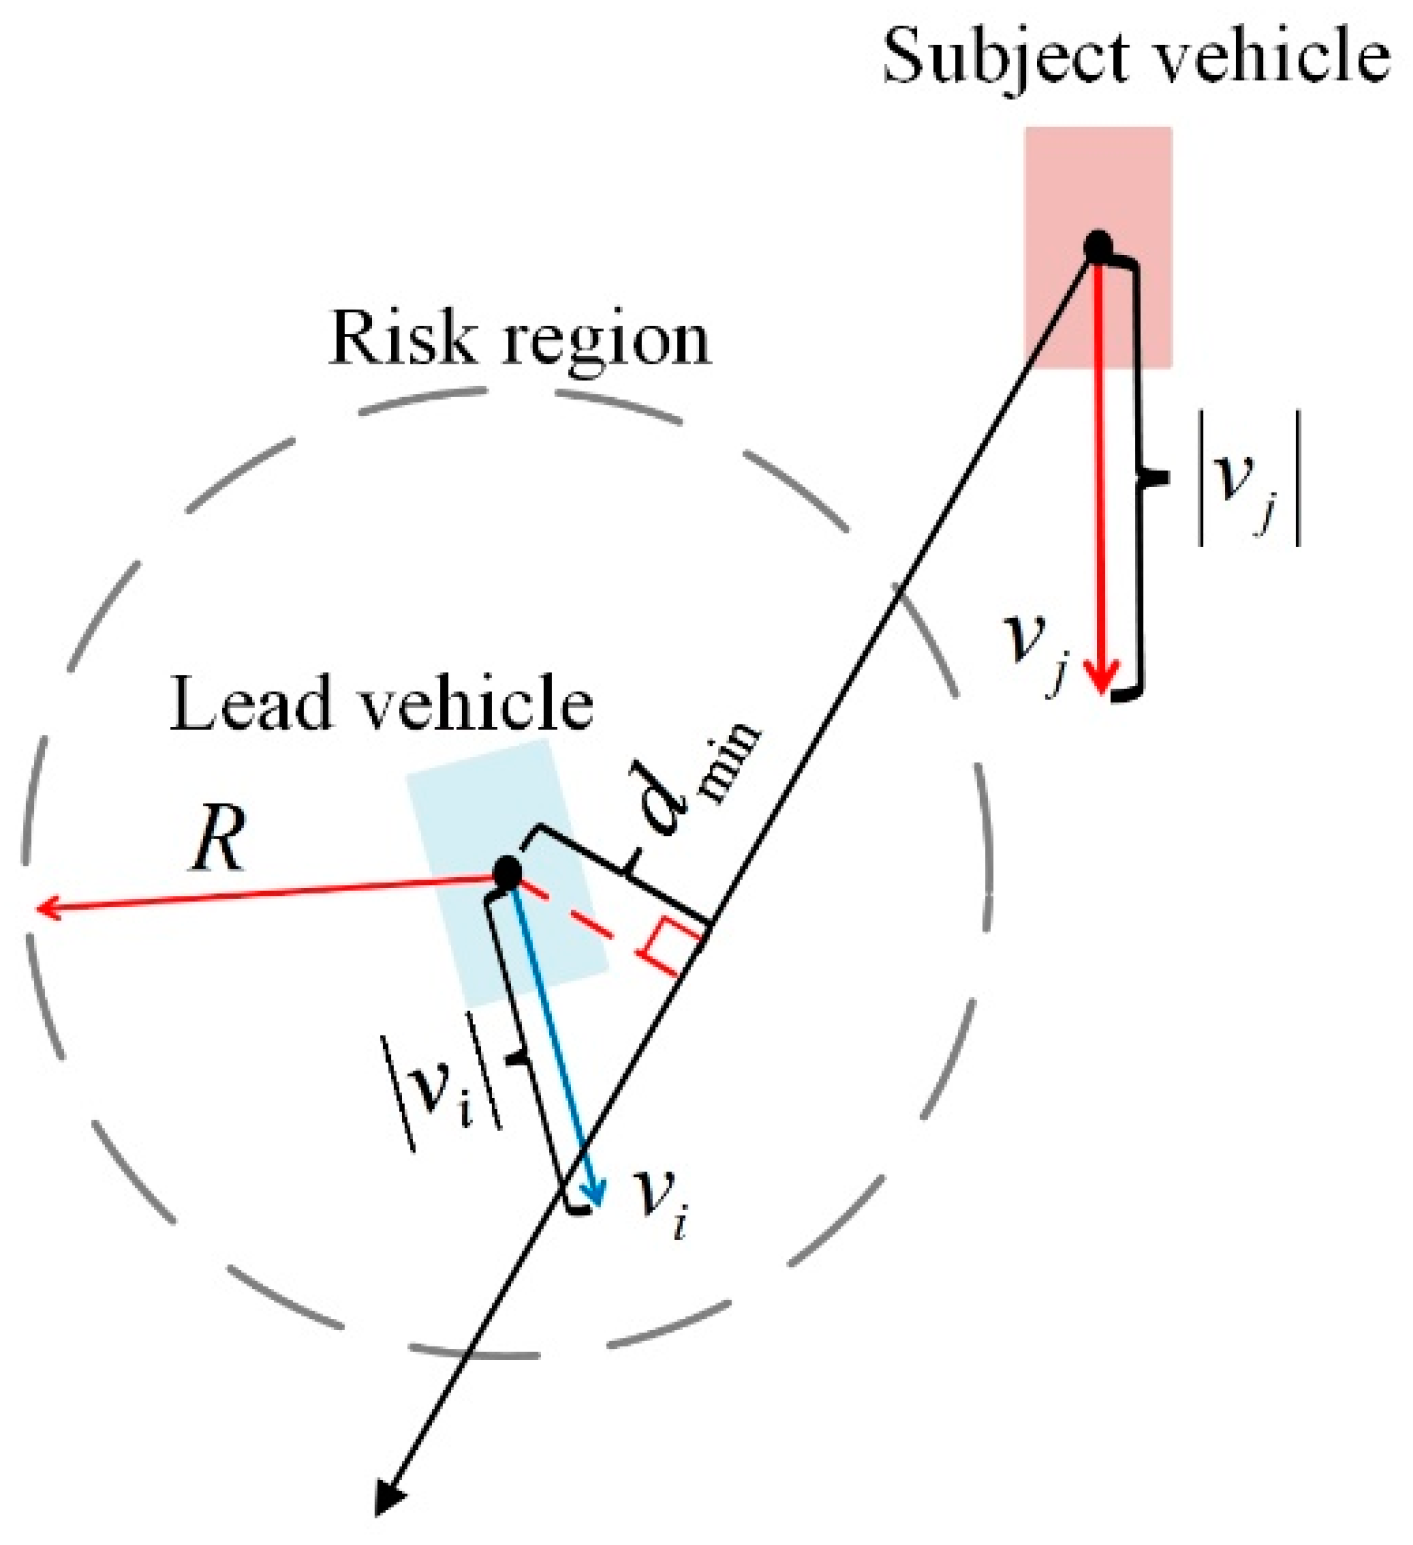
2.3. Potential Conflict Risk Index
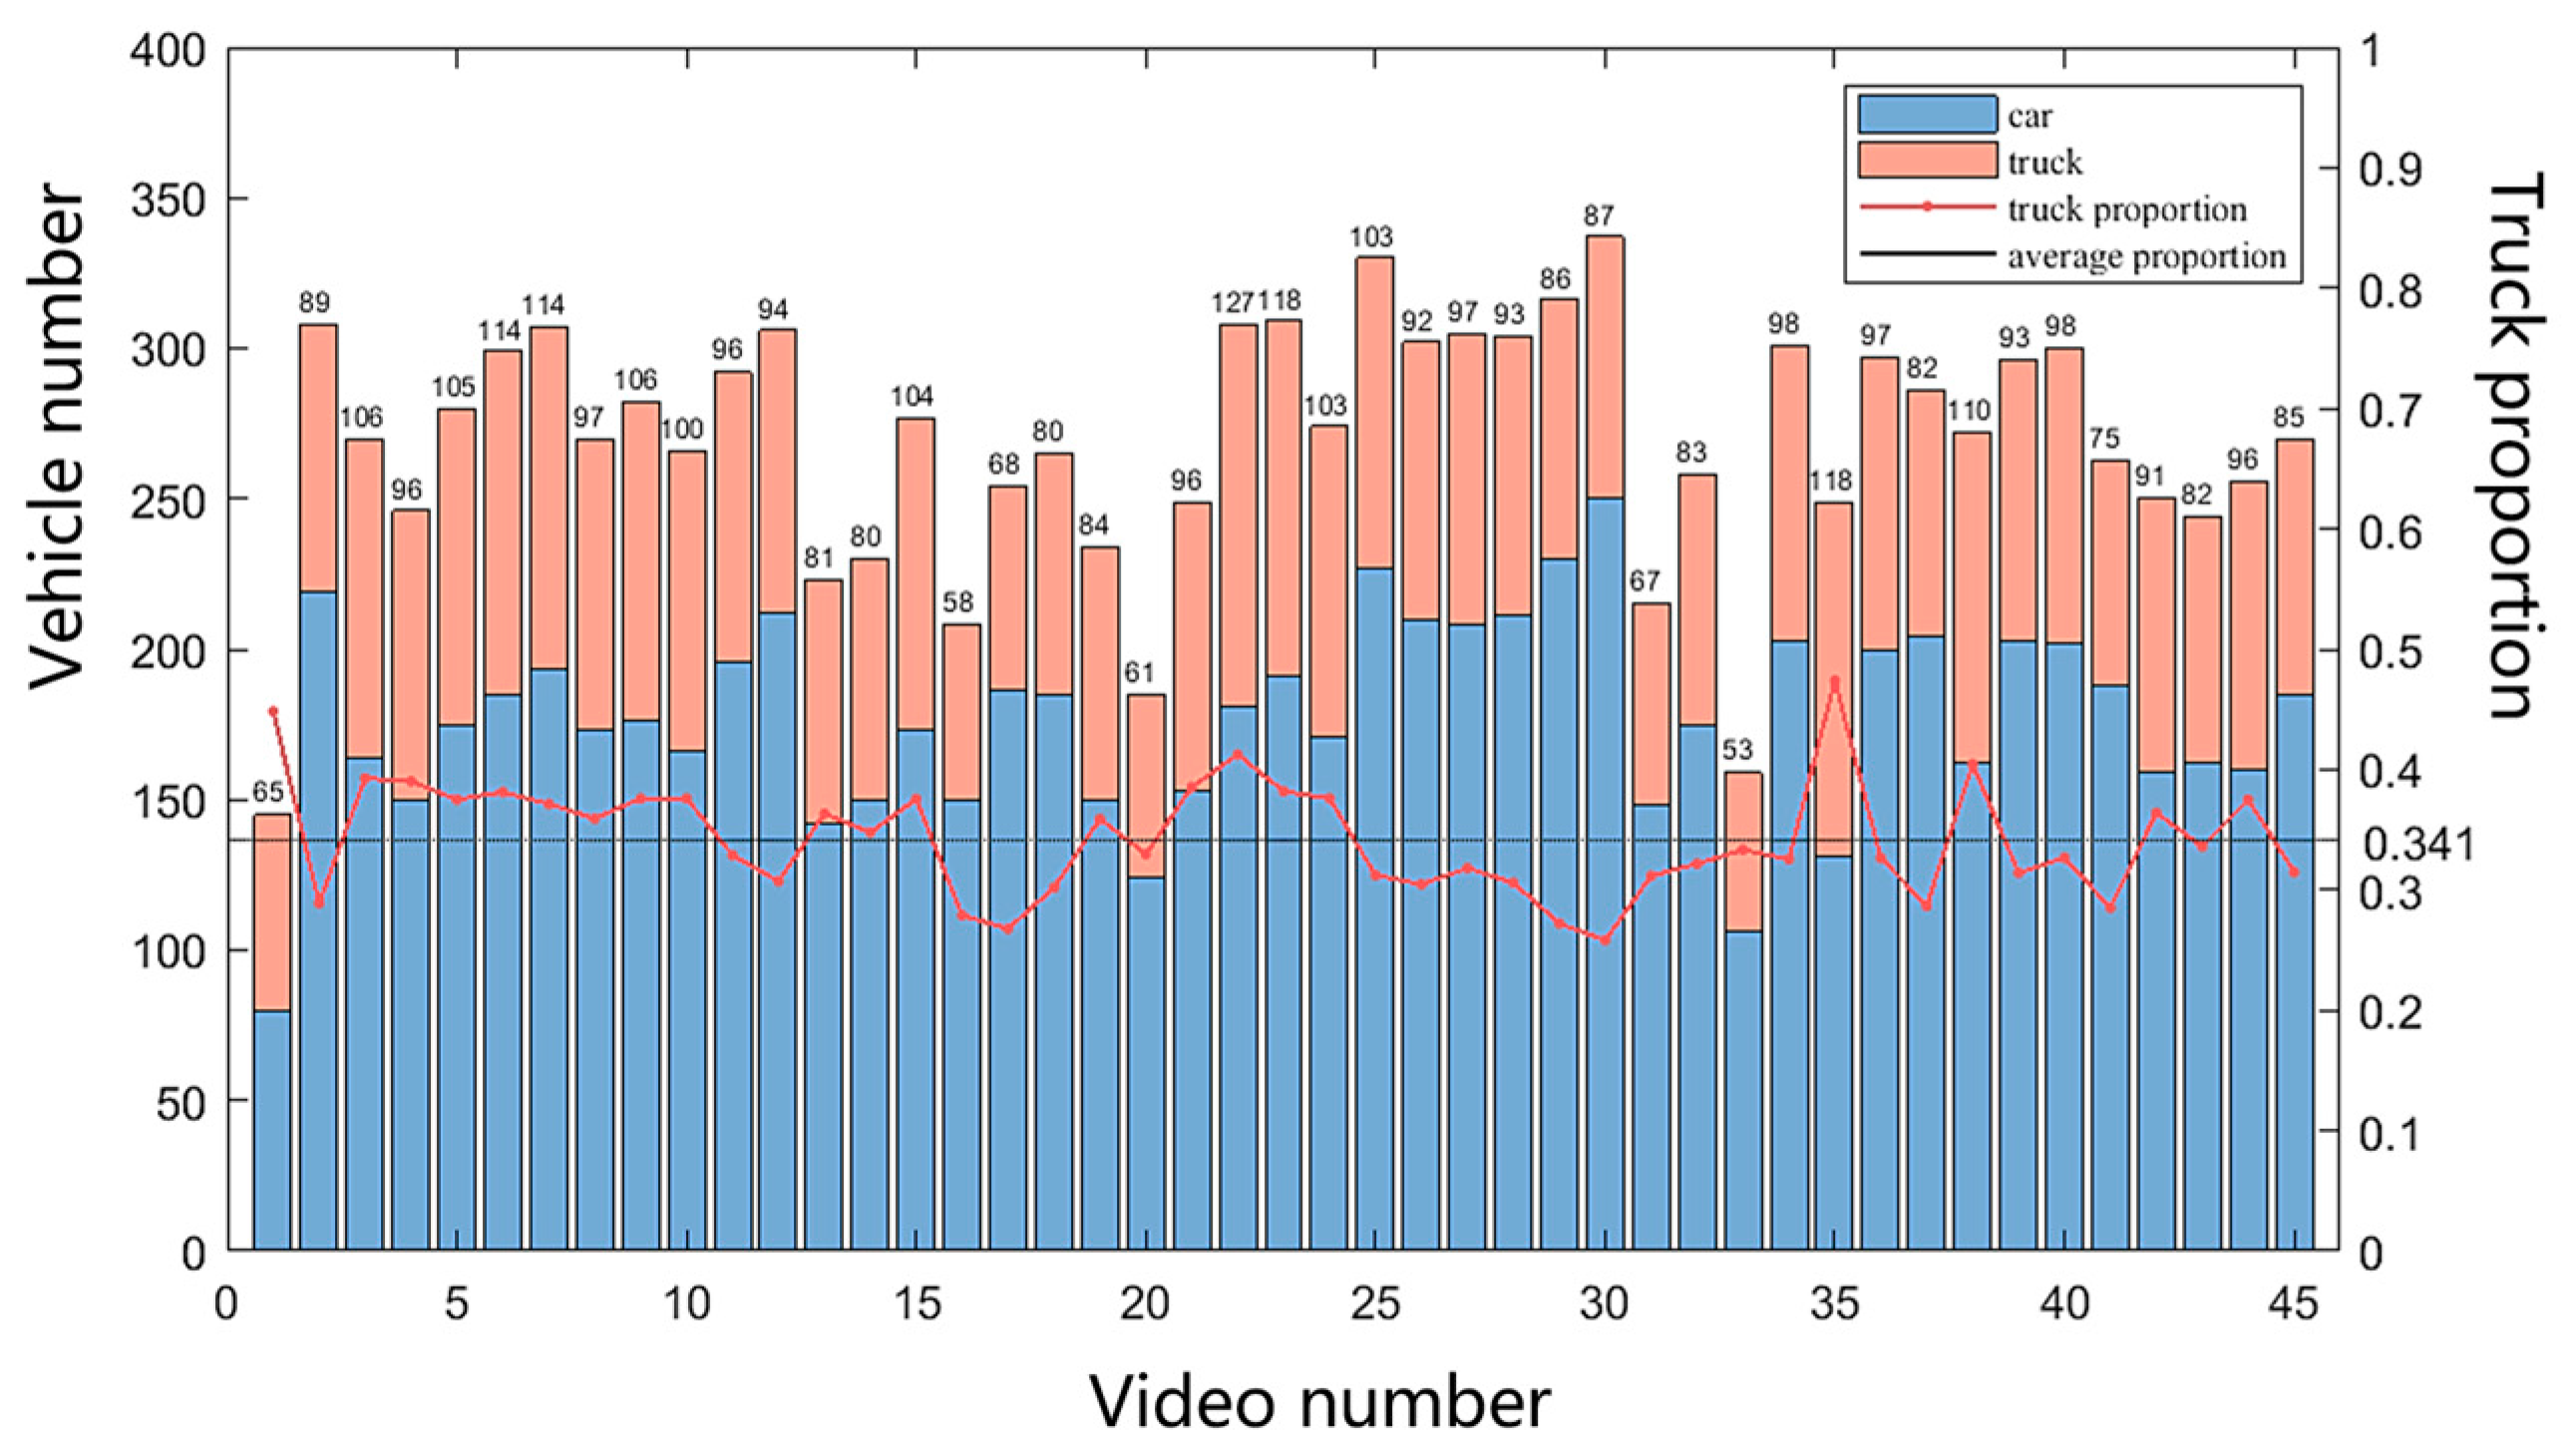
The design of an SSM should consider the temporal–spatial proximity of conflicts and the severity of potential collisions. In this paper, PCRI quantifies the proximity of conflicts and the severity of potential collisions from three aspects: time to region, exposure distance in region, and time related to speed and direction. By incorporating these variates, PCRI offers a comprehensive framework for evaluating vehicle conflict risk under different conflict types.
Before constructing different variates, it is essential to initially define the conflict risk region. In this study, a circular risk region centered around the lead vehicle is conceptualized. At any time, the potential scenarios concerning the positional relationship between the subject vehicle‘s trajectory relative to the lead vehicle and the risk region can be described in Figure 3. As Figure 3 shows, both the lead vehicle and the subject vehicle are simplified to a point by considering the geometric center of the vehicle. The ray with an arrow signifies the subject vehicle‘s trajectory relative to the lead vehicle. The direction of this ray corresponds to the speed vector of the subject vehicle relative to the lead vehicle.
And R is the radius of the risk region, d min represents the minimum distance between the subject vehicle‘s trajectory relative to the lead vehicle and the position of the lead vehicle. In Figure 3a, if the subject vehicle continues at its current speed and direction, it will enter the risk region after a period of time and subsequently exit it, indicating a great conflict risk between the two vehicles in this condition. Figure 3b shows that the subject vehicle will reach the boundary of the risk region and then immediately move away from it, indicating there is no conflict risk between the two vehicles. Figure 3c illustrates that the subject vehicle will neither enter the risk region nor reach its boundary, indicating no conflict risk. In events where the subject vehicle‘s trajectory relative to the lead vehicle intersects the risk region at multiple points, it indicates that the subject vehicle is projected to intrude into the defined risk region. This situation suggests a potential risk for conflicts under the condition that d min < R . Conversely, if the trajectory intersects with the risk region at only one point or does not intersect at all, the lead vehicle will not invade the risk region, corresponding to the condition d min R .
TTR considers the elapsed time before a conflict occurred, which can reflect the initial conditions of an event by the temporal proximity. This enables the interpretation of the temporal proximity of conflicts to indicate the probability of a potential conflict, even in the absence of an actual collision [21]. The calculation of TTR is governed by Equation (5).
T T R = d T R v i v j , d min < R M , d min R
where v i and v j represent the speed vectors of the lead and subject vehicles, respectively. M is a sufficiently large positive value and d T R is the distance to the boundary of the risk region.
If d min < R , there are still three possible positional relationships between the subject vehicle and the risk region, and these relationships will affect the value of d T R . Figure 4 shows these three possible positional relationships between the subject vehicle and the risk region. The longer a vehicle remains in the risk region, the more time it has to make a reasonable evasive maneuver, thereby reducing the risk of conflicts. For the definition of TTR in Equation (5), a larger value of TTR indicates a lower conflict risk. Thus, the magnitude of TTR can reflect the conflict risk conditions of a specific scenario.
EDR reflects the extent of conflict exposure by measuring the exposure distance between the subject vehicle’s trajectory and the risk region of the lead vehicle [43]. It reflects the risk of conflicts by characterizing the spatial proximity. Figure 5 shows the geometric schematic of the exposure distance of the subject vehicle within the risk region. The calculation for EDR is shown in Equation (6). The longer the subject vehicle stays within this risk region, the greater the risk of conflict, and consequently, the higher the value of EDR. Therefore, the magnitude of the EDR value can quantify the conflict risk associated with the exposure distance.
E D R = 2 R 2 d min 2 , d min < R 0 , d min R
In this paper, the severity of potential collisions refers to the consequences if collisions happen. During the relative motion of two vehicles, the higher their speeds, the more severe the consequences of potential collisions will be. Thus, TRSD is proposed to quantify the severity of potential collisions. The calculation for TRSD is shown in Equation (7). Figure 6 shows the variables related to TRSD for two vehicles.
T R S D = β d min ( v i + v j 2 ) = β 2 d min v i + v j
where v i and v j represent the speed of the lead and subject vehicles, respectively. v i and v j are introduced to reflect the severity of potential collisions. And d min represents the minimum distance between the subject vehicle’s trajectory and the lead vehicle, which further reflects the risk of a collision between two vehicles. If the distance between two vehicles is large enough, it is impossible for vehicles to collide. In this case, the severity of the potential collisions should be low, even if the speed of the two vehicles is high. The introduction of d min makes TRSD better meet the needs of such situations. β is a scaling factor that takes into account the size and mass of the vehicles. β can be defined based on the attributes and characteristics of data. Commonly, trajectory datasets do not contain information on vehicle mass and precise vehicle size. And information on these dimensions is not the focus of this study. Therefore, we defined β = 1 [44].
The higher the average absolute speed difference between two vehicles, the greater the conflict risk. Conversely, a higher TRSD value indicates a less severe potential collision, signifying a reduced risk of conflict.
The aforementioned variates are capable of reflecting the temporal and spatial proximity of conflicts and the severity of the potential collision through their magnitudes and signs. In the framework of TTC, signs represent the relative motion between two vehicles, where the numerical magnitude reflects the conflict risk level. Lower values are indicative of a heightened risk of conflicts. By aligning with the format of TTC and integrating the three variates with the risk level, a conflict risk factor (CRF) can be derived that characterizes the level of conflict risk. The expression of CRF is presented in Equation (8).
C R F = d 2 · d 2 · × 1 E D R T T R + T R S D
where d 2 · represents the change rate for the square of the distance between the two vehicles. The calculation for d 2 · is shown in Equation (9).
d 2 · = lim Δ t 0 + d t + Δ t 2 d t 2 Δ t = 2 v x x t + v y y t
where time t, δ t denotes a sufficiently small time interval, d 2 is the square of the relative distance between the two vehicles at a given moment. v x and v y , respectively, represent the relative speeds in the x and y directions, x t and y t correspond to the relative positions in the x and y directions.
In the actual calculation process, the value range of CRF varies significantly with different driving conditions. To enhance its applicability in reflecting conflict risk and facilitating the identification of conflict events, the CRF is normalized. In this study, the sigmoid function is chosen for normalization. The CRF is input into this function, and the output is used as the final measure, which is named the Potential Conflict Risk Index. In normal sigmoid function, the output values are limited to a range between 0 and 1. By multiplying it with an exponential term, this range is expanded, and the rate of change in the sigmoid function near the central point is accelerated, making the function more sensitive around the center. This enhances the distinction of PCRI for evaluating different conflict risks. The form of the sigmoid function and the transformed sigmoid function are shown in Equations (10) and (11). Figure 7 illustrates the plot of the sigmoid function and the transformed sigmoid function.
y = 1 1 + e x
y = 1 e x 1 + e x
Finally, the expression for PCRI is shown as follows:
P C R I = 1 e C R F 1 + e C R F
The sign of PCRI reflects the relative motion state of two vehicles. A positive sign indicates that the vehicles are approaching each other, while a negative sign indicates they are moving apart. The numerical value of PCRI represents the magnitude of conflict risk; closer to 0 indicates higher risk, whereas closer to 1 indicates lower risk. A special case is that PCRI equals 0, indicating a genuine collision between two vehicles.

3. Data Description

3.1. The inD Dataset

Data compilation for the inD dataset involved meticulous drone video recordings at multiple urban intersections in Aachen, Germany, over the period from 2017 to 2019. It captures the movements of 13,599 road participants, encompassing a diverse mix of 8233 vehicles (including cars, trucks, and buses) and 5366 vulnerable road users, such as pedestrians and bicyclists. This rich collection of trajectory data spans across various urban traffic scenarios [45].
The data collection was conducted at four different locations, with each session typically lasting approximately 20 min. The scope of these recordings varied from intersection areas of 80 × 40 m to 140 × 70 m. In this dataset, each video record includes a background image, a map, and three trajectory information files. The files encompass trajectory information with the type of road user, position, direction, speed, and acceleration. A sample frame from the inD dataset is illustrated in Figure 8. As video data are collected at complex traffic intersections, the inD dataset is frequently used in the research of traffic conflict techniques. Due to the complex environment and traffic flow characteristics of urban intersections, they usually have more types and numbers of conflicts. Therefore, this study uses the inD dataset for the effective verification of PCRI in Section 4.

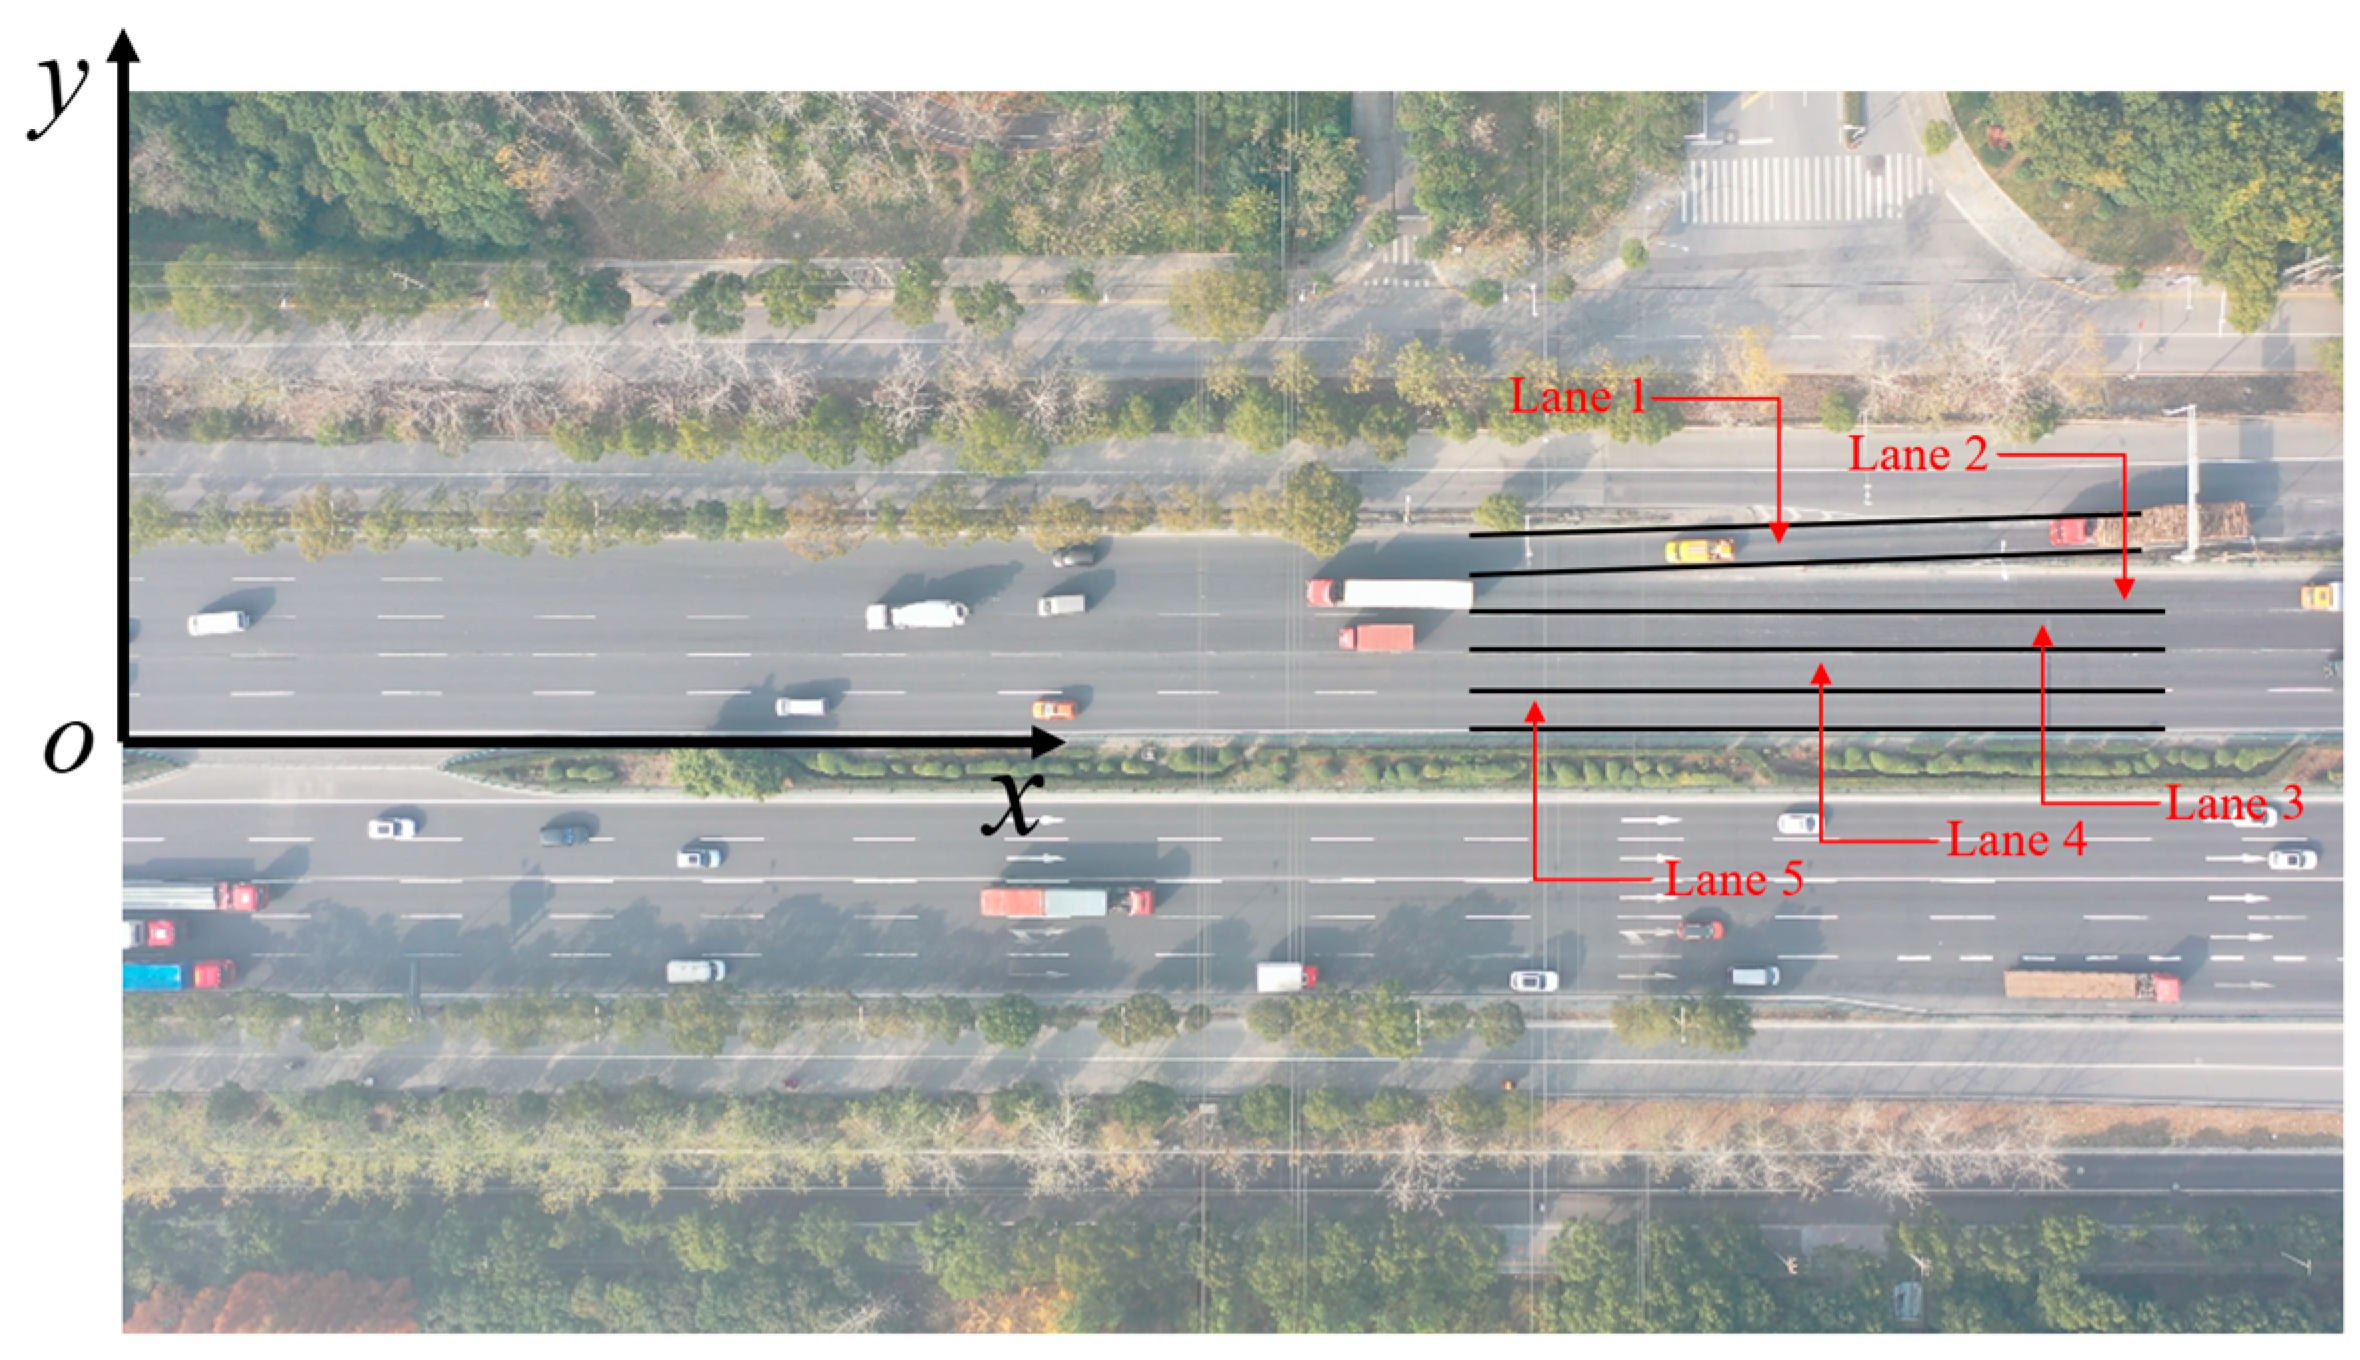
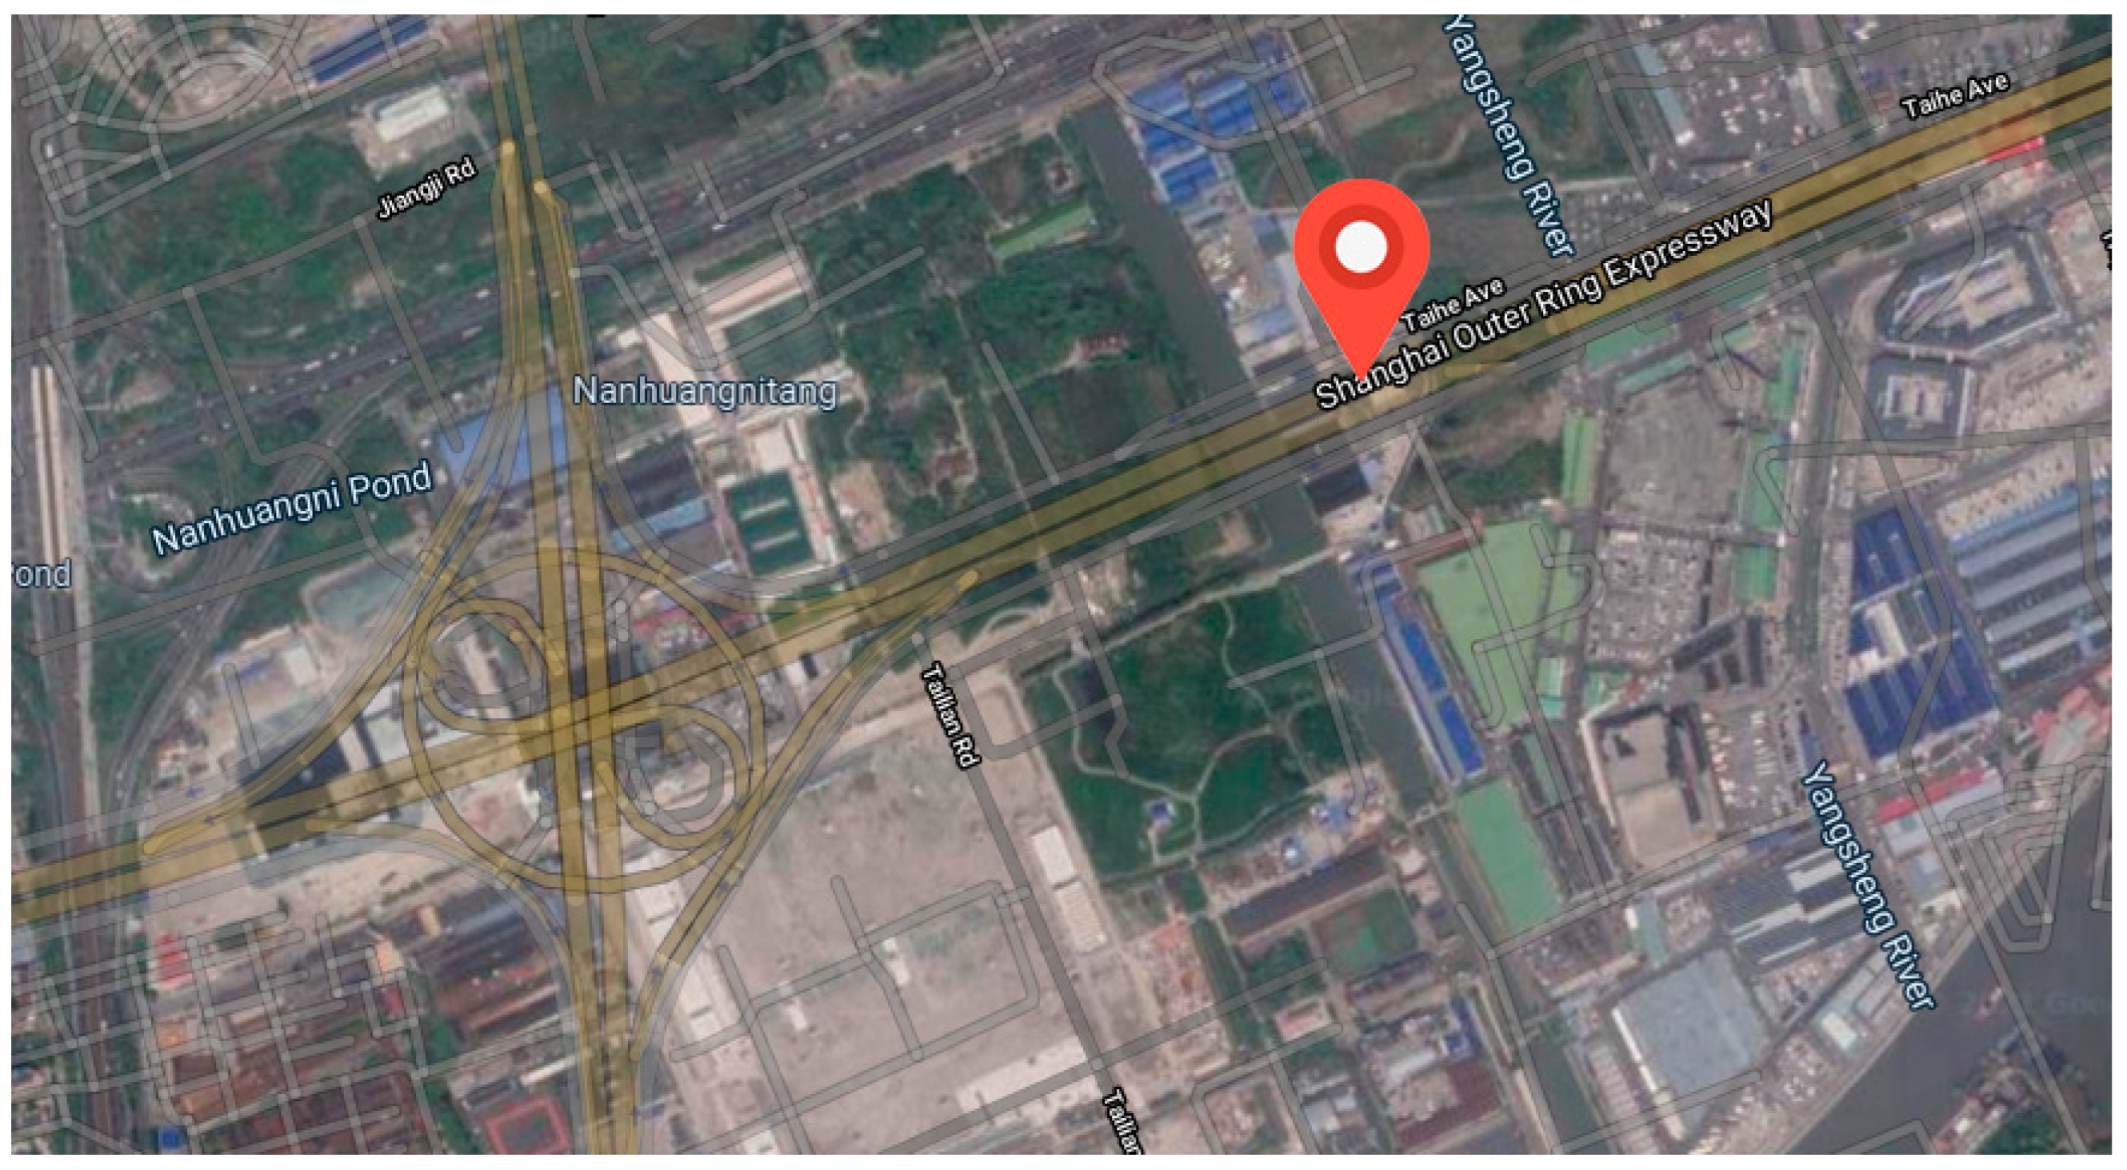
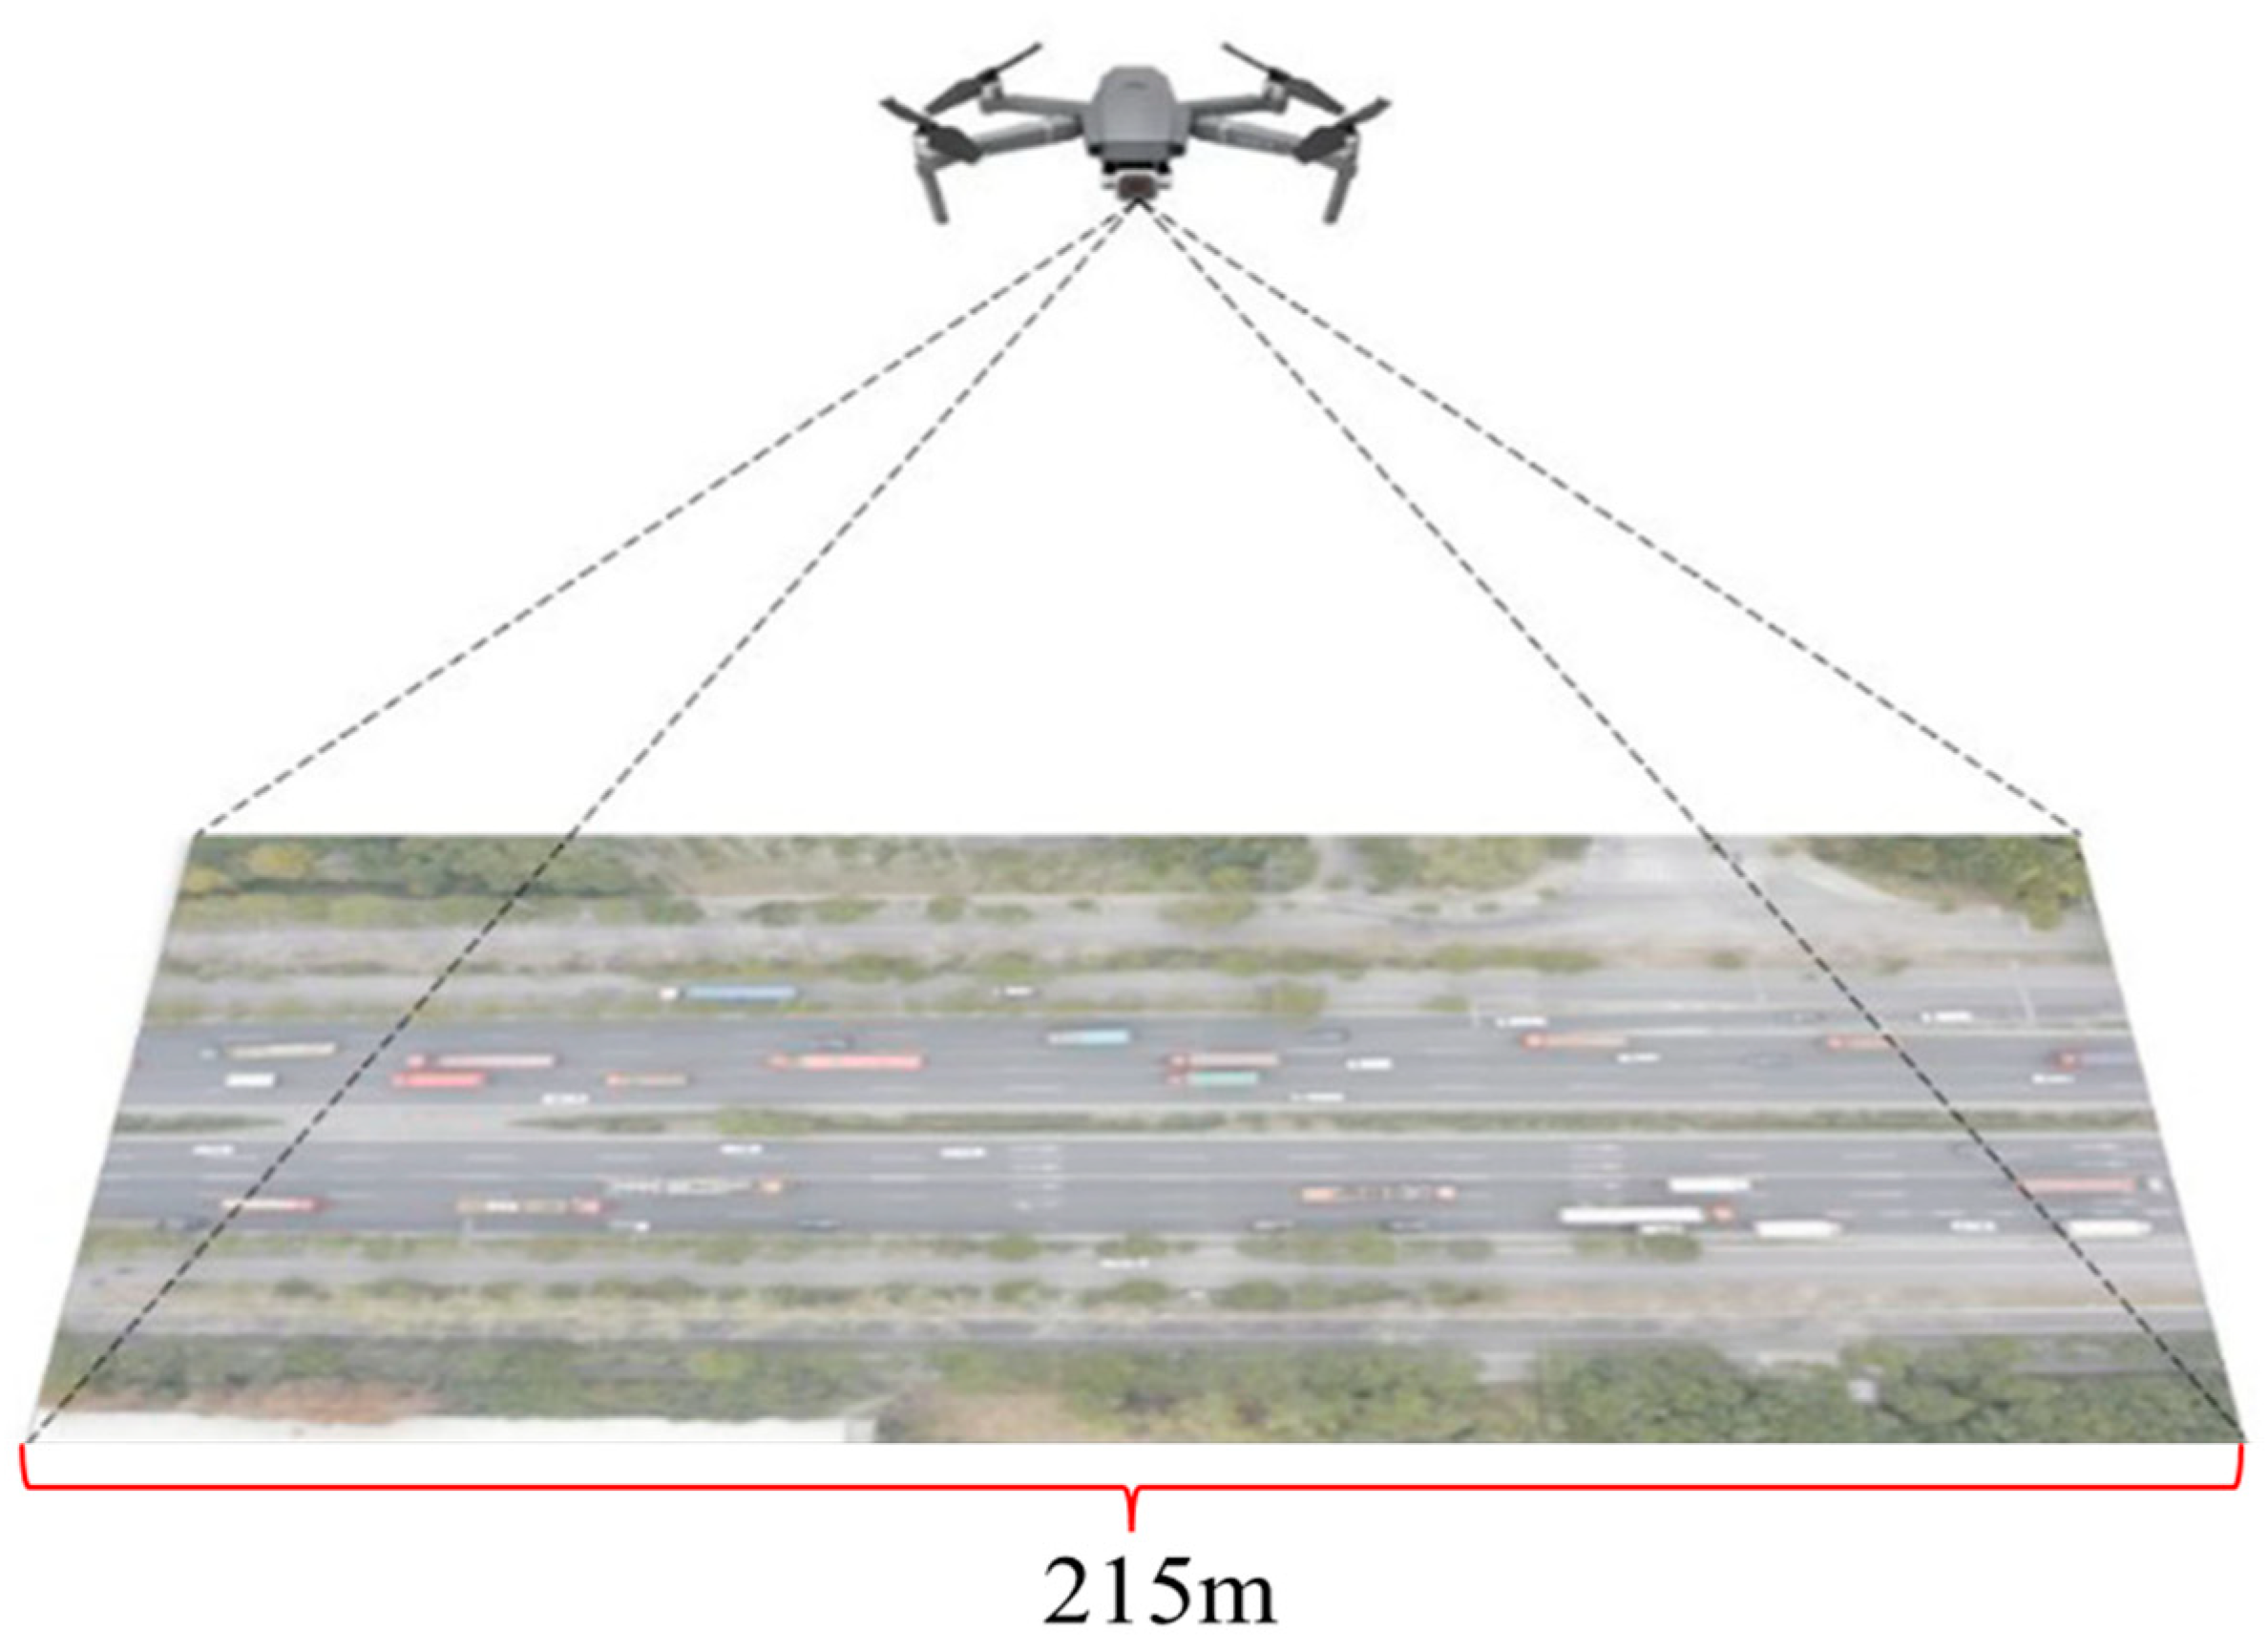
3.2. The Outer Ring Expressway Dataset

The Outer Ring Expressway Dataset is collected from a field investigation that was carried out at the merging areas of the Outer Ring Expressway in Shanghai, China. The location of this study field is shown in Figure 9. As illustrated in Figure 10, the data gathered and examined pertains to the westbound traffic flow at a merging section. This particular location comprises an on-ramp, an additional lane on the right, and the primary roadway. The video was captured using a DJI Mavic 2 Pro drone on 26 December 2020. Several prerequisites are taken into account for the data acquisition, such as overcast skies, adequate lighting, and wind speeds not exceeding 4 m per second. Furthermore, the drone was operated at an altitude of 250 m, covering a road stretch of 215 m in the recordings. The videos are shot in 4K resolution (4096 × 2160 pixels) at a frame rate of 25 Hz, totaling 3 h, 38 min, and 6 s of footage. In this analysis, the vehicles are categorized into two groups: cars and trucks, with the latter being defined as vehicles exceeding 6 m in length [46].
The vehicle trajectory processing, as outlined by Chen et al. [47], encompasses three stages. Initially, vehicles are identified using a Canny-based ensemble detector. This is followed by the application of the kernelized correlation filter algorithm for tracking the vehicles. The process culminates with the implementation of wavelet transformation for the purpose of trajectory denoising. Figure 11 shows the study area, the coordinate system, and a schematic diagram of five lanes. The origin of the coordinates is O. The horizontal direction on the video frame represents the direction parallel to the lanes, whereas the vertical direction on the video frame corresponds to the direction perpendicular to the lanes.
Lane 1 includes the on-ramp and its merge with the mainline, and lanes 2 through 5 extend from the freeway’s outermost part inward.

4. Results

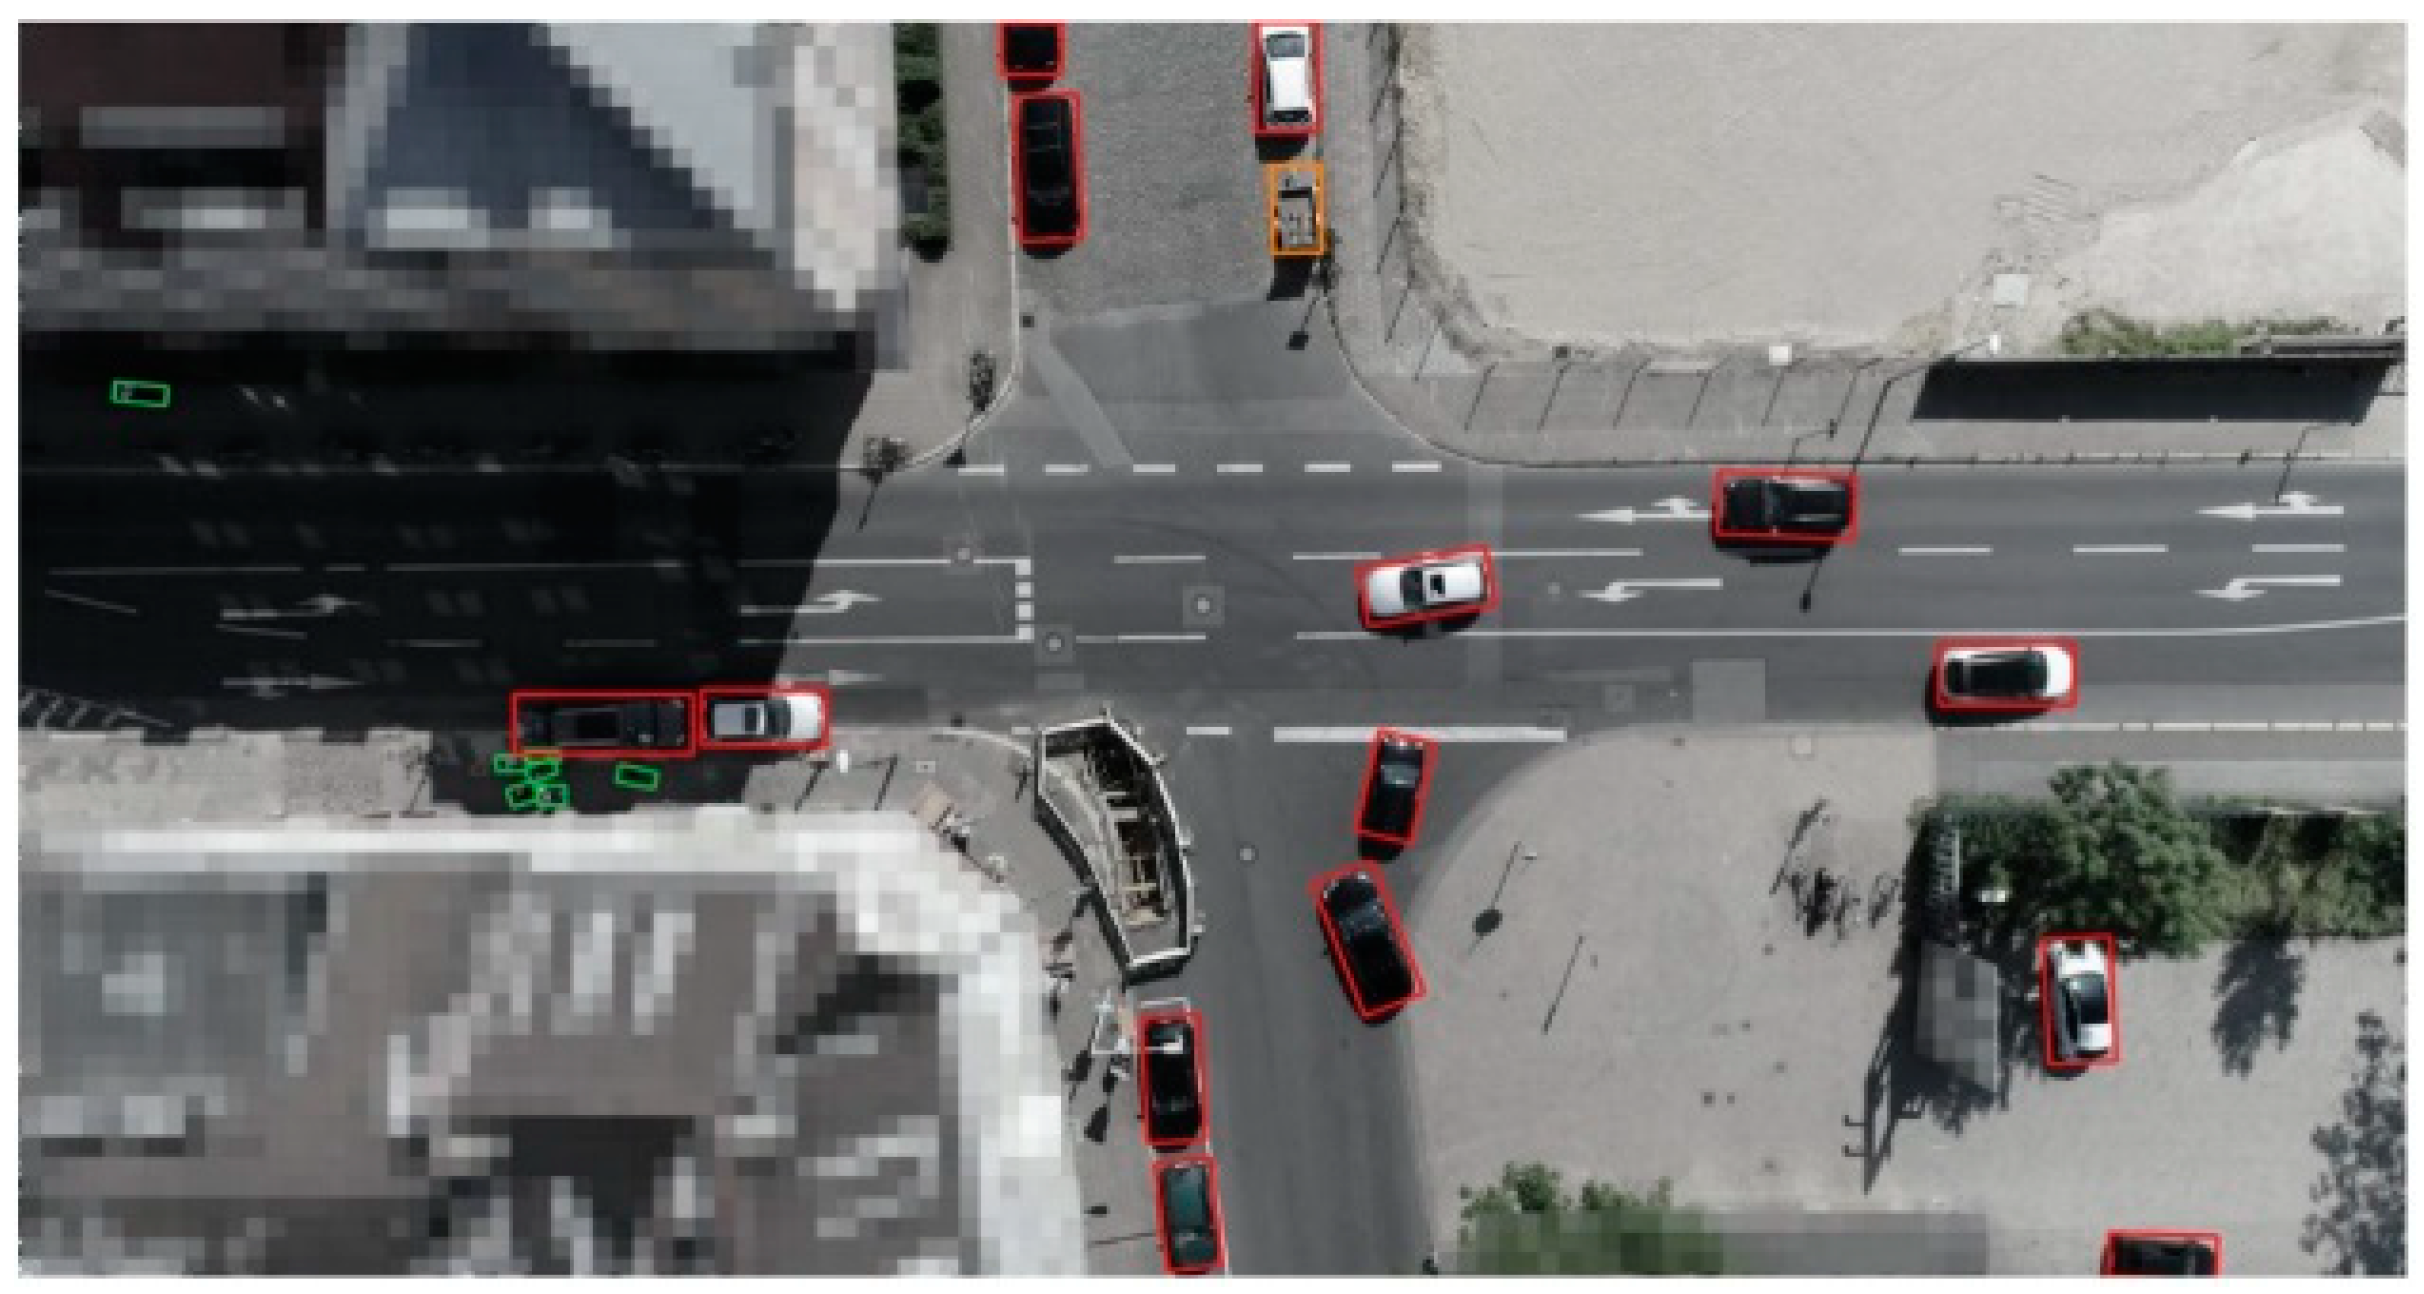
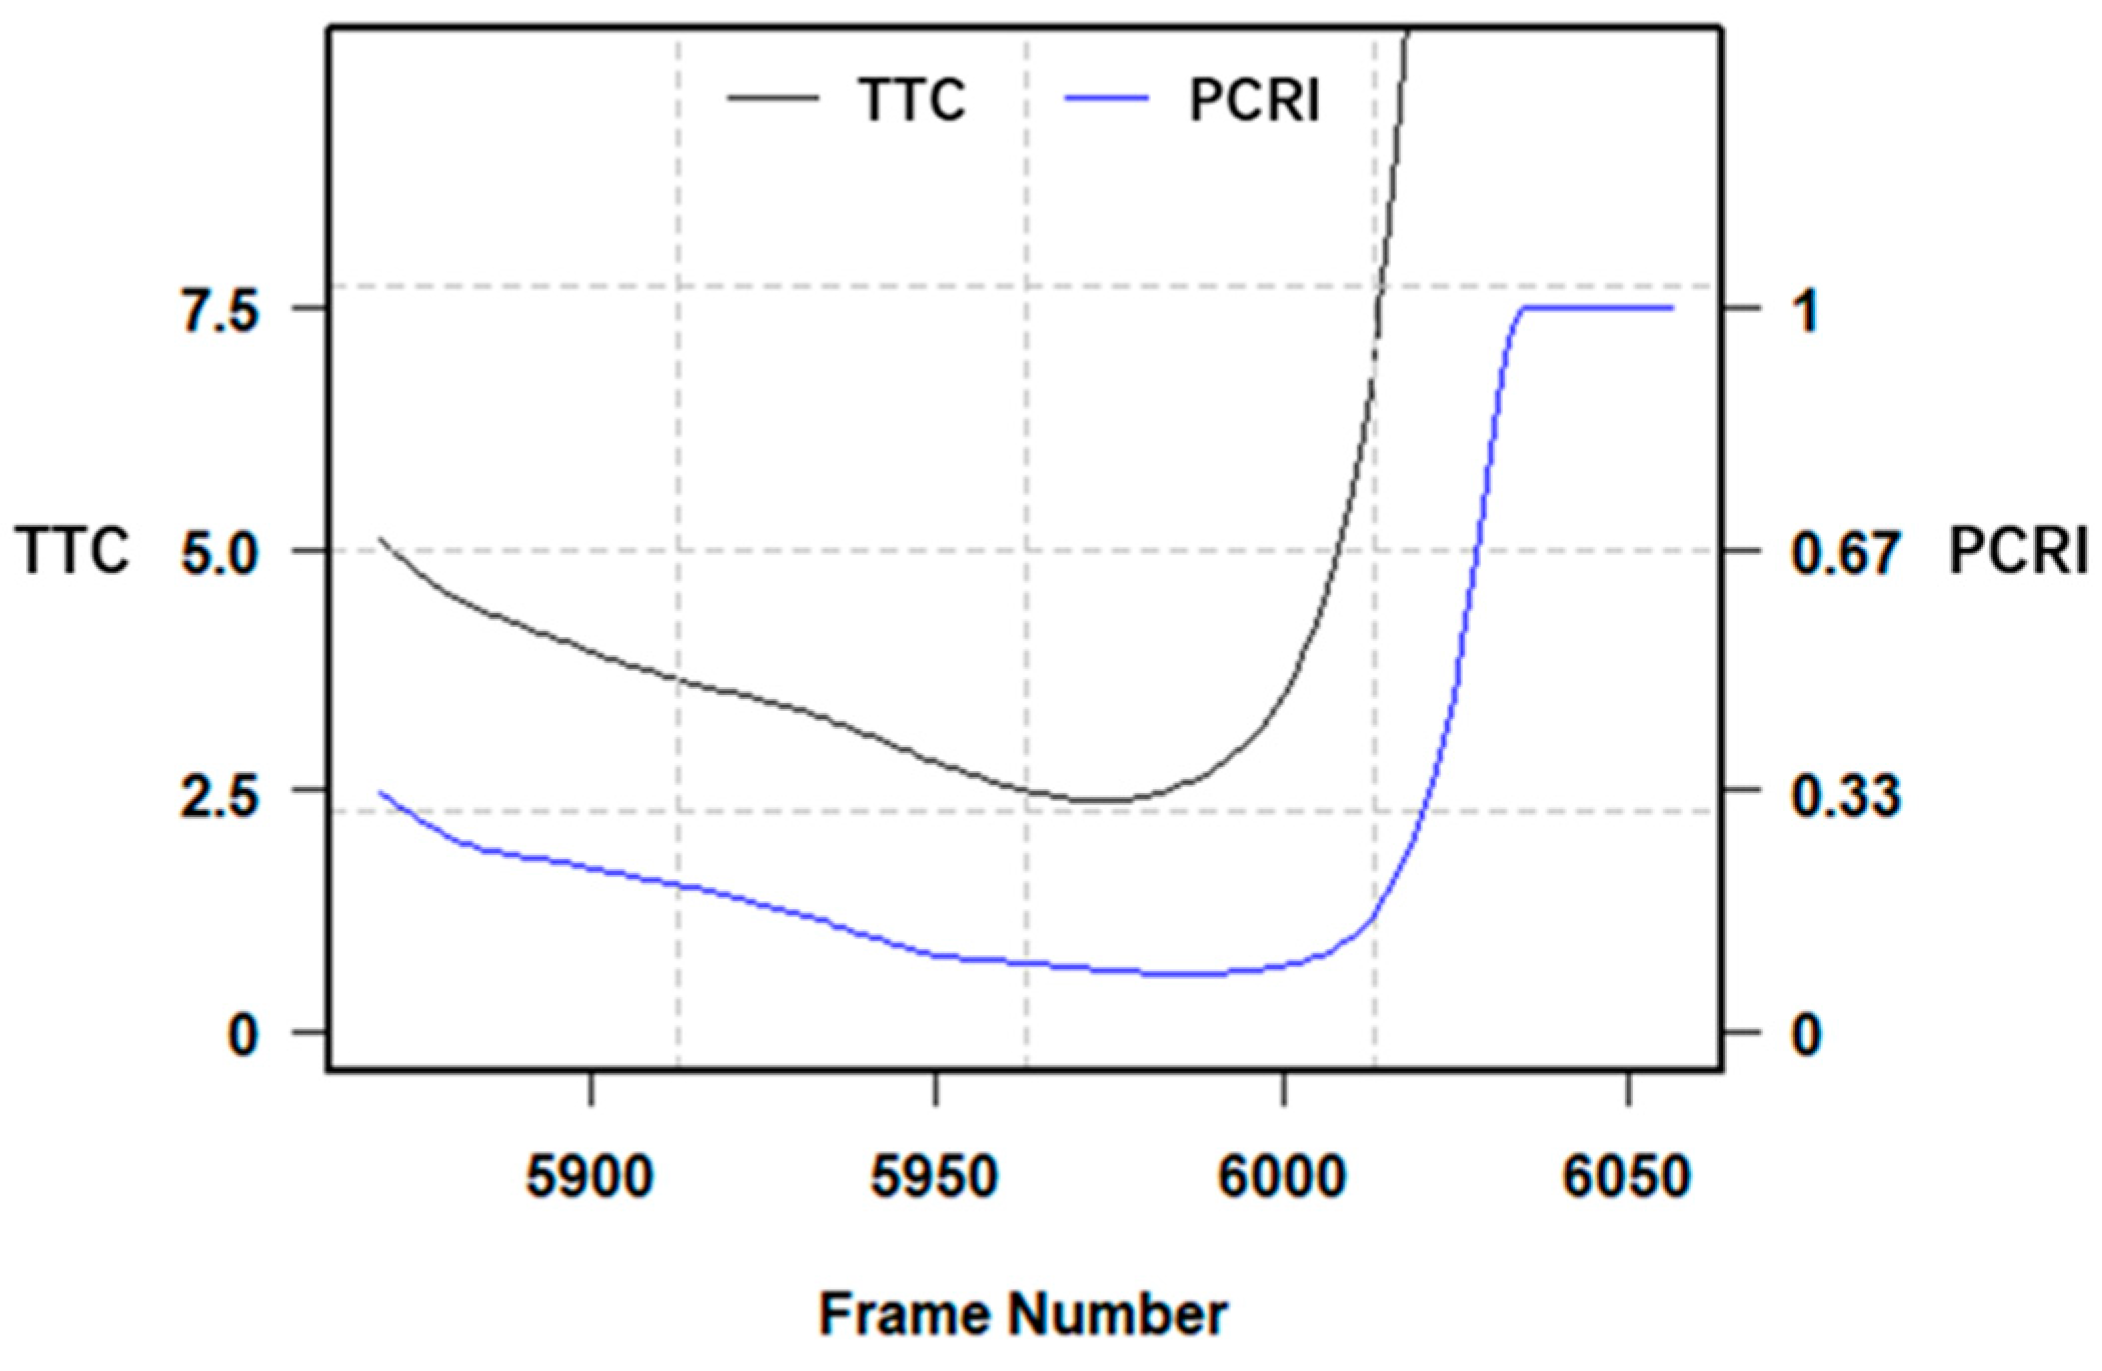
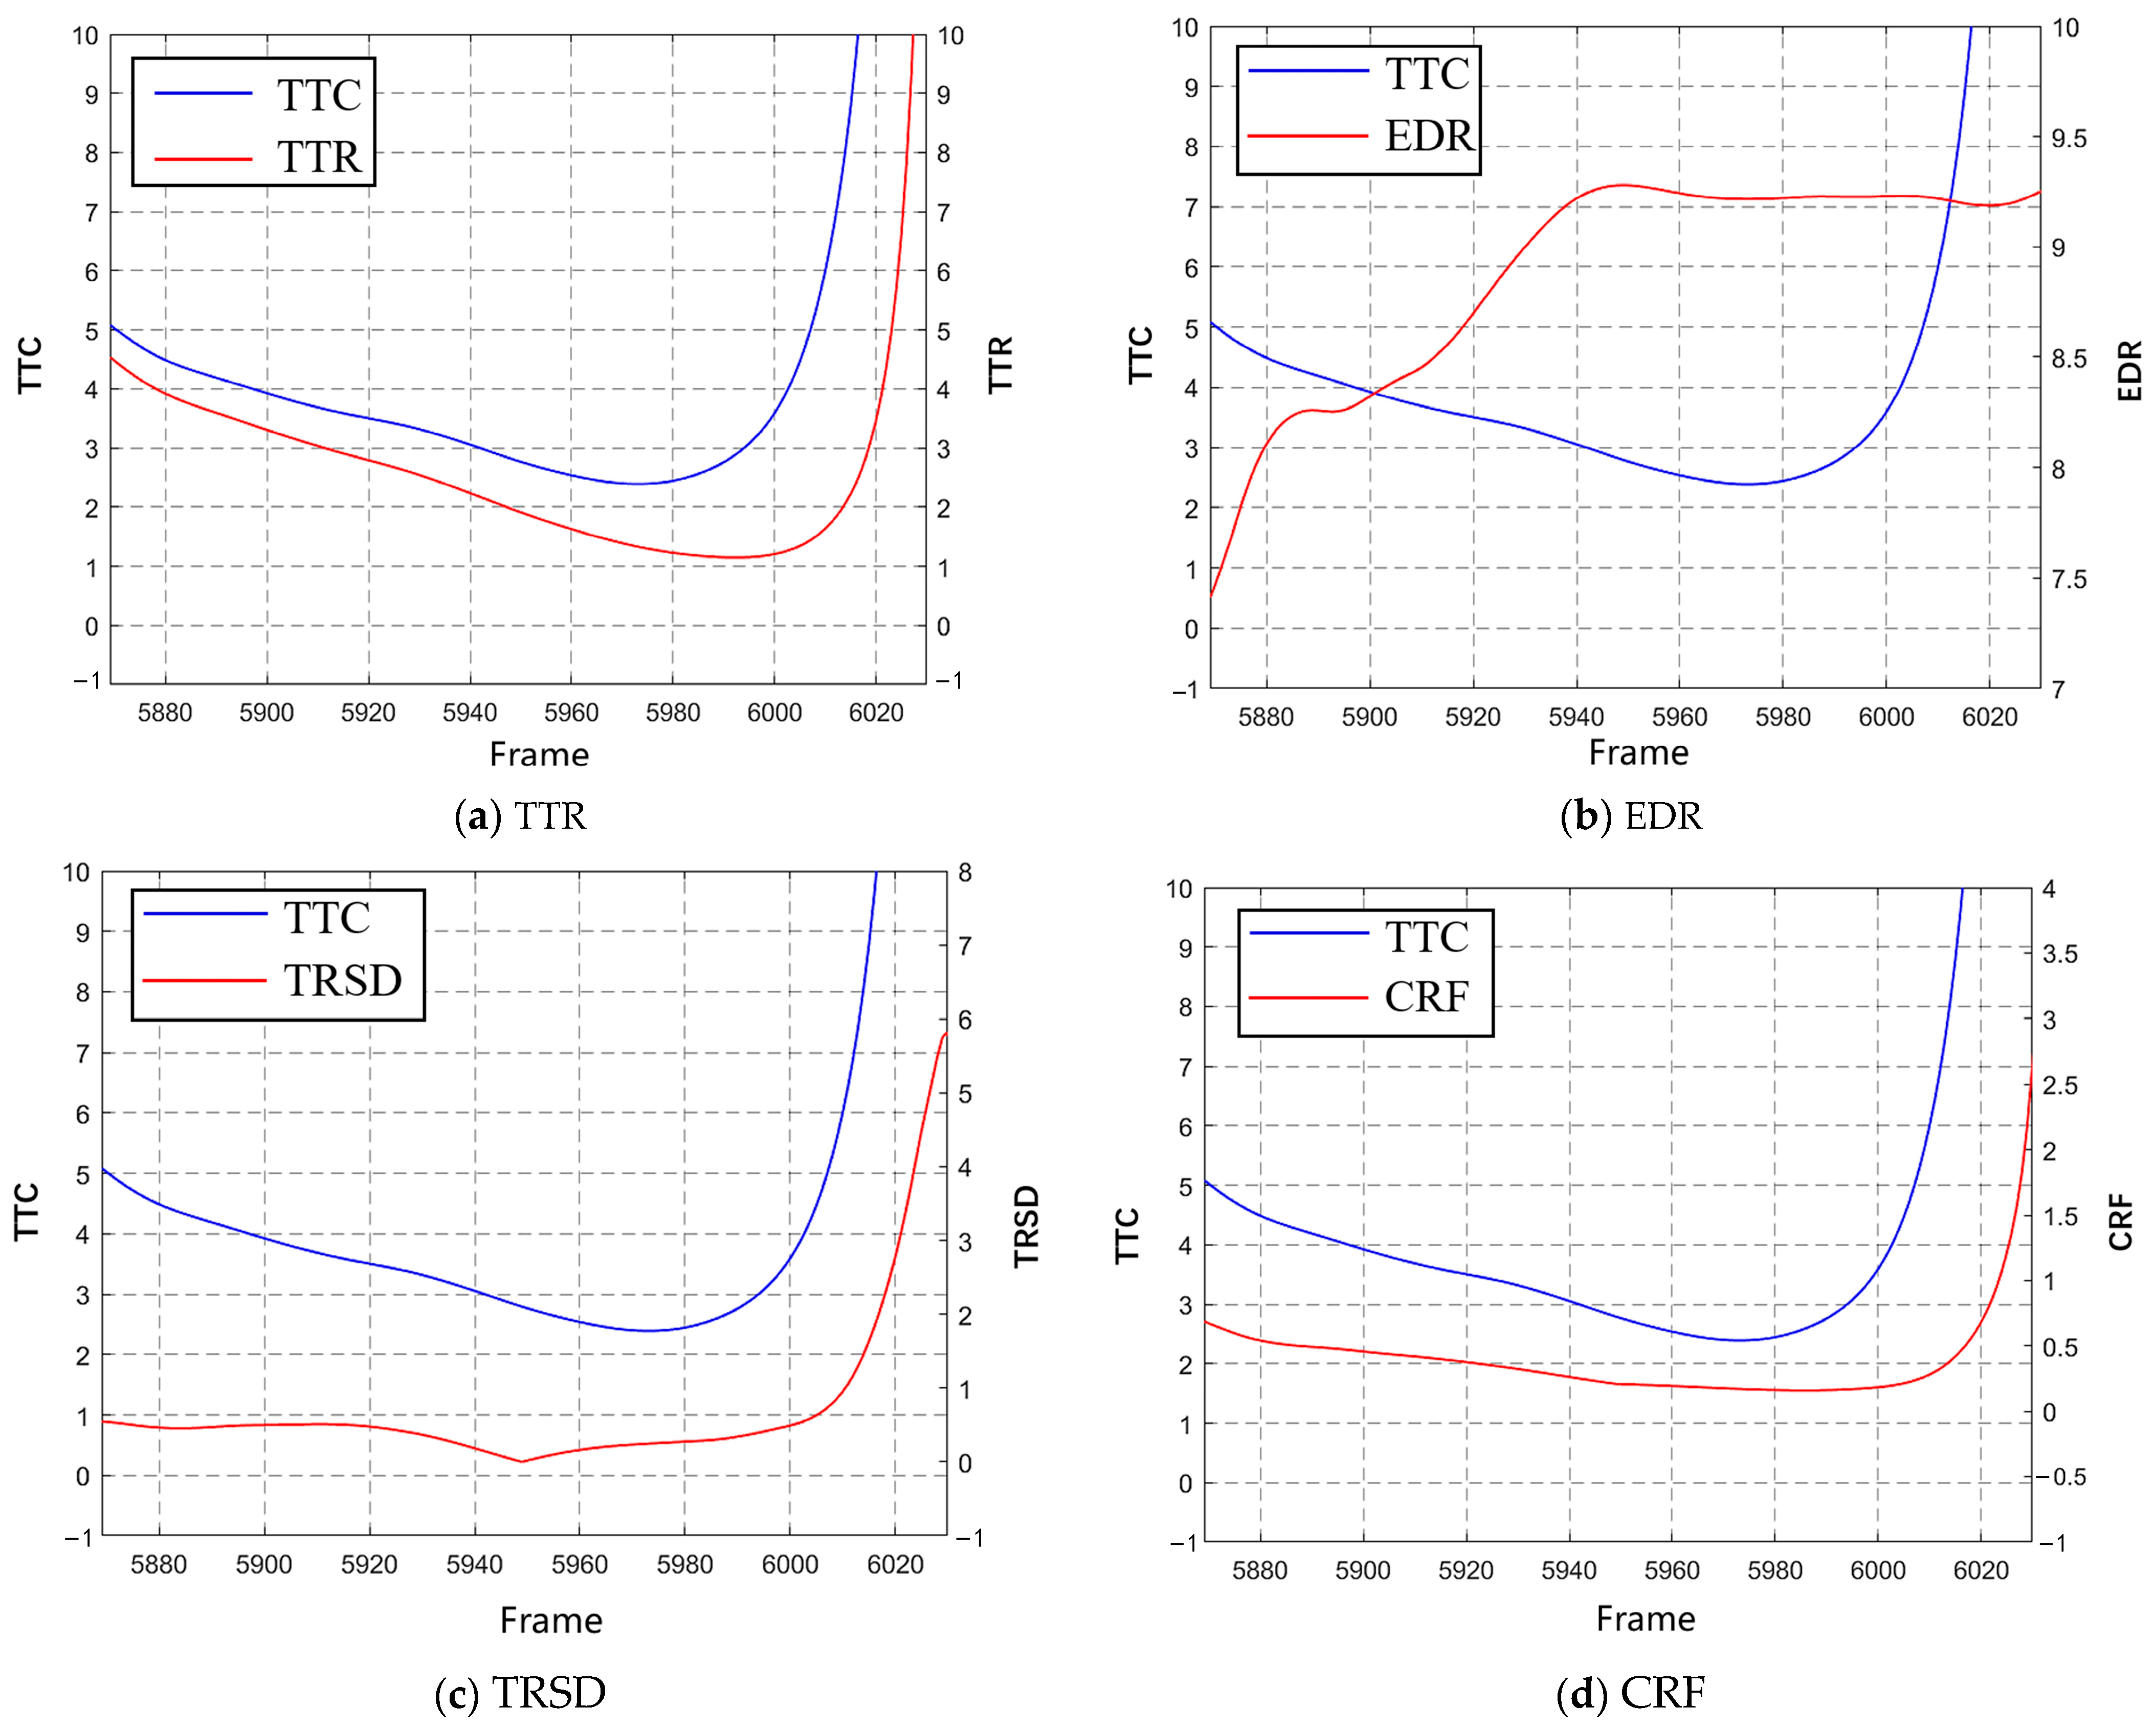
4.1. The Validation of PCRI’s Effectiveness Using the inD Dataset

In this part, we perform calculations of TTC and PCRI for the inD dataset. Before conflict identification, it is necessary to determine the conflict thresholds for TTC and PCRI. In some studies, the threshold of TTC is 1.5 s [48,49]. Therefore, we also use 1.5 s as the threshold of TTC. For PCRI, the threshold for EDR is set to one lane width. TTR threshold is based on drivers’ braking reaction time of 1.14 s, and the risk region’s radius is also one lane width [50]. If the distance from the lead vehicle to the subject vehicle’s trajectory relative to the lead vehicle exceeds one lane width, or if the exposed distance within the risk region is less than one lane width, or if the time to reach the boundary of the risk region allows for sufficient driver reaction, the scenario is classified as conflict-free. Otherwise, a conflict is identified. According to the general calculation results, when TTC corresponds to 1.5 s, the calculated PCRI results fall within the range of 0.165 to 0.170. In this paper, the threshold of PCRI is set to be 0.167, and the conflict type is classified based on SSAM developed by FWHA [51]. The type is classified as a rear-end conflict if the absolute value of the conflict angle is less than 30°, a crossing conflict if the absolute value of the conflict angle is greater than 85°, or otherwise a lane-changing conflict. TTC and PCRI are calculated by frames. A conflict is identified between vehicles if any measure’s minimum value in this event is below its specified threshold. The visualization tools provided by the inD dataset are used to manually observe and analyze vehicle actions, aiming to retain valid conflict frames. A total of 362 conflicts are obtained in the inD dataset, including 61 rear-end conflicts, 66 lane-changing conflicts, and 235 crossing conflicts. Thus, the average missing rates in identification for different types of conflict based on TTC and PCRI are shown in Table 1. In lane-changing conflicts, TTC and PCRI exhibit comparable accuracy with the lowest average missing rates in three conflict types. However, PCRI demonstrates superior performance over TTC in the identification of rear-end and crossing conflicts with both lower missing rates. The average missing rate of PCRI is 65% lower than the result of TTC across all conflict types. Therefore, compared to TTC, PCRI is more effective in identifying different types of conflicts with a lower identification missing rate.
According to the results presented in Table 1, rear-end and crossing conflicts are identified as two critical conflict types with high rates of missed identifications for one or both measures. To demonstrate the different performance between TTC and PCRI in identifying conflicts in these conflict types, this paper selects typical conflicts of rear-end and crossing conflicts for frame-by-frame analysis.
First, a car-following event with the rear-end conflict between vehicle #139 and vehicle #141 recorded in video No.22 of the inD dataset is selected. This conflict responds to the high missing rate in identification for rear-end conflict using TTC. Figure 12 shows the changes in TTC and PCRI in this event. In this scenario, PCRI and TTC exhibit similar trends with slight temporal deviations at their respective minima. TTC identifies a heightened rear-end conflict risk between frames #5930 to #6000, pinpointing frame #5973 as the most dangerous moment with the highest risk level. PCRI marks its high-risk points between frames #5960 to #6010, with frame #5986 as the critical moment of highest risk. In this video, the subject vehicle continuously decelerates upon approaching the intersection. Through the examination of acceleration magnitudes, the proactive collision avoidance actions of the vehicle can be assessed at various time points, allowing for the identification of the critical moment of increased conflict risk. A larger value of deceleration indicates more intense braking actions by the driver at that moment, suggesting more aggressive evasive maneuvers, which in turn implies a greater risk of conflicts. Table 2 illustrates the deceleration of the subject vehicle in this event. The bolded rows in the table represent the frame number and deceleration information at the moments of maximum deceleration. In Table 2, the absolute acceleration exceeds 1m/s² starting at frame #5959 and 2m/s² from frame #5978, reaching a peak at frame #5992. The alignment of PCRI’s conflict risk identification with these acceleration trends demonstrates its superior performance over TTC in conflict identification. Therefore, in rear-end conflict, PCRI can more accurately identify the moment of highest conflict risk.
To validate the necessity of integrating three variables within PCRI, the variations in each variate during conflicts are plotted and compared against TTC individually. From Figure 13a, the trends of TTC and TTR are essentially consistent, and the lowest trough of TTR occurs near frame #5992, indicating that TTR effectively represents different conflict risks. In Figure 13b, the change in EDR does not completely align with that of TTC, indicating that EDR alone cannot summarize the risk in conflicts. It merely reflects the risk associated with the subject vehicle’s trajectory moving through the risk region. As the relative motion of the vehicles shifts away from the risk region, the value of EDR decreases. And if the subject vehicle does not cross the risk region again, its value will approach 0. According to Figure 13c, the overall trend of TRSD is similar to that of TTC, but the variation in TRSD between frames #5940 and #5960 differs from that of TTC. In Figure 13d, the trend of CRF changes is essentially consistent with that of TTC because CRF is the pre-normalization version of PCRI. However, the key shortcoming is that CRF can exhibit extreme values, leading to significant spikes in the trend.
Another event selected is taken from video No.21, featuring a crossing conflict between vehicle #527 and vehicle #528. In this scenario, the minimum value of PCRI is 0.162, which can identify the conflict, whereas the minimum value of TTC is 3.324 s, failing to identify the conflict. Figure 14 shows the changes in PCRI and TTC. In this event, PCRI and TTC exhibit differing trends. TTC reaches its lowest value from frames #30066 to #30085, with the most critical moment at frame #30075, and the lowest point of PCRI is between frames #29996 and #30015, with the peak risk at frame #30007. Table 3 presents the deceleration at key frames. The bolded row in the table represents the frame number and deceleration information at the moments of maximum deceleration. It shows that the subject vehicle maintains a high acceleration value between frames #29996 and #30008, and after frame #30066, the vehicle begins to accelerate rather than decelerate. Thus, the moments of highest risk in this scenario are near frames #29996 to #30008. Therefore, PCRI can effectively and accurately identify the crossing conflicts.
In the rear-end conflict, TTR and TRSD demonstrate a certain level of rationality. The change trends of both in crossing conflict are shown in Figure 15. From Figure 15a, a sudden change in TTR occurs around frame #30040. However, there are still many moments after frame #30040 with small TTC values. This indicates that relying solely on TTR might miss the identification of moments with higher potential conflict risk. In Figure 15b, the minimum value of TRSD occurs around frame #29960, but through video analysis, the most dangerous moment is identified at frame #29992, showing a significant discrepancy from the TRSD detection result. Therefore, relying solely on TRSD is also insufficient for accurately identifying the most dangerous moment.
Based on the frame-by-frame analysis methods described above, for the four intersections in the inD dataset, two videos with the highest number of conflict events are selected. The accuracy of PCRI and TTC in identifying conflict risk is compared for these selected videos. These videos contain 175 conflict events, out of which 88 conflicts exhibit significant differences in identifying the most critical moments between the two measures. For conflicts in determining the highest risk moment with differences, the deceleration of the subject vehicle is utilized to determine the critical moments of risk. The results reveal that PCRI significantly outperformed TTC in identifying dangerous moments in rear-end and lane-changing scenarios, with 12 and 32 instances more accurately identified, respectively. In crossing scenarios, PCRI (15 instances more accurate) also slightly outperformed TTC (10 instances more accurate). Additionally, there are a few cases where the identification results based on PCRI and TTC thresholds showed differences, but the frames are close to the ground truth. These instances are not included in the count of accurate conflict moment identifications for either variate.
According to these comparisons, PCRI exhibits a lower missing rate of conflict identification and performs better than TTC in identifying critical moments for different conflict types. Furthermore, a single variate from PCRI cannot accurately reflect changes in conflict risk, while the comprehensive measures PCRI provide a better representation of conflict risk variations.

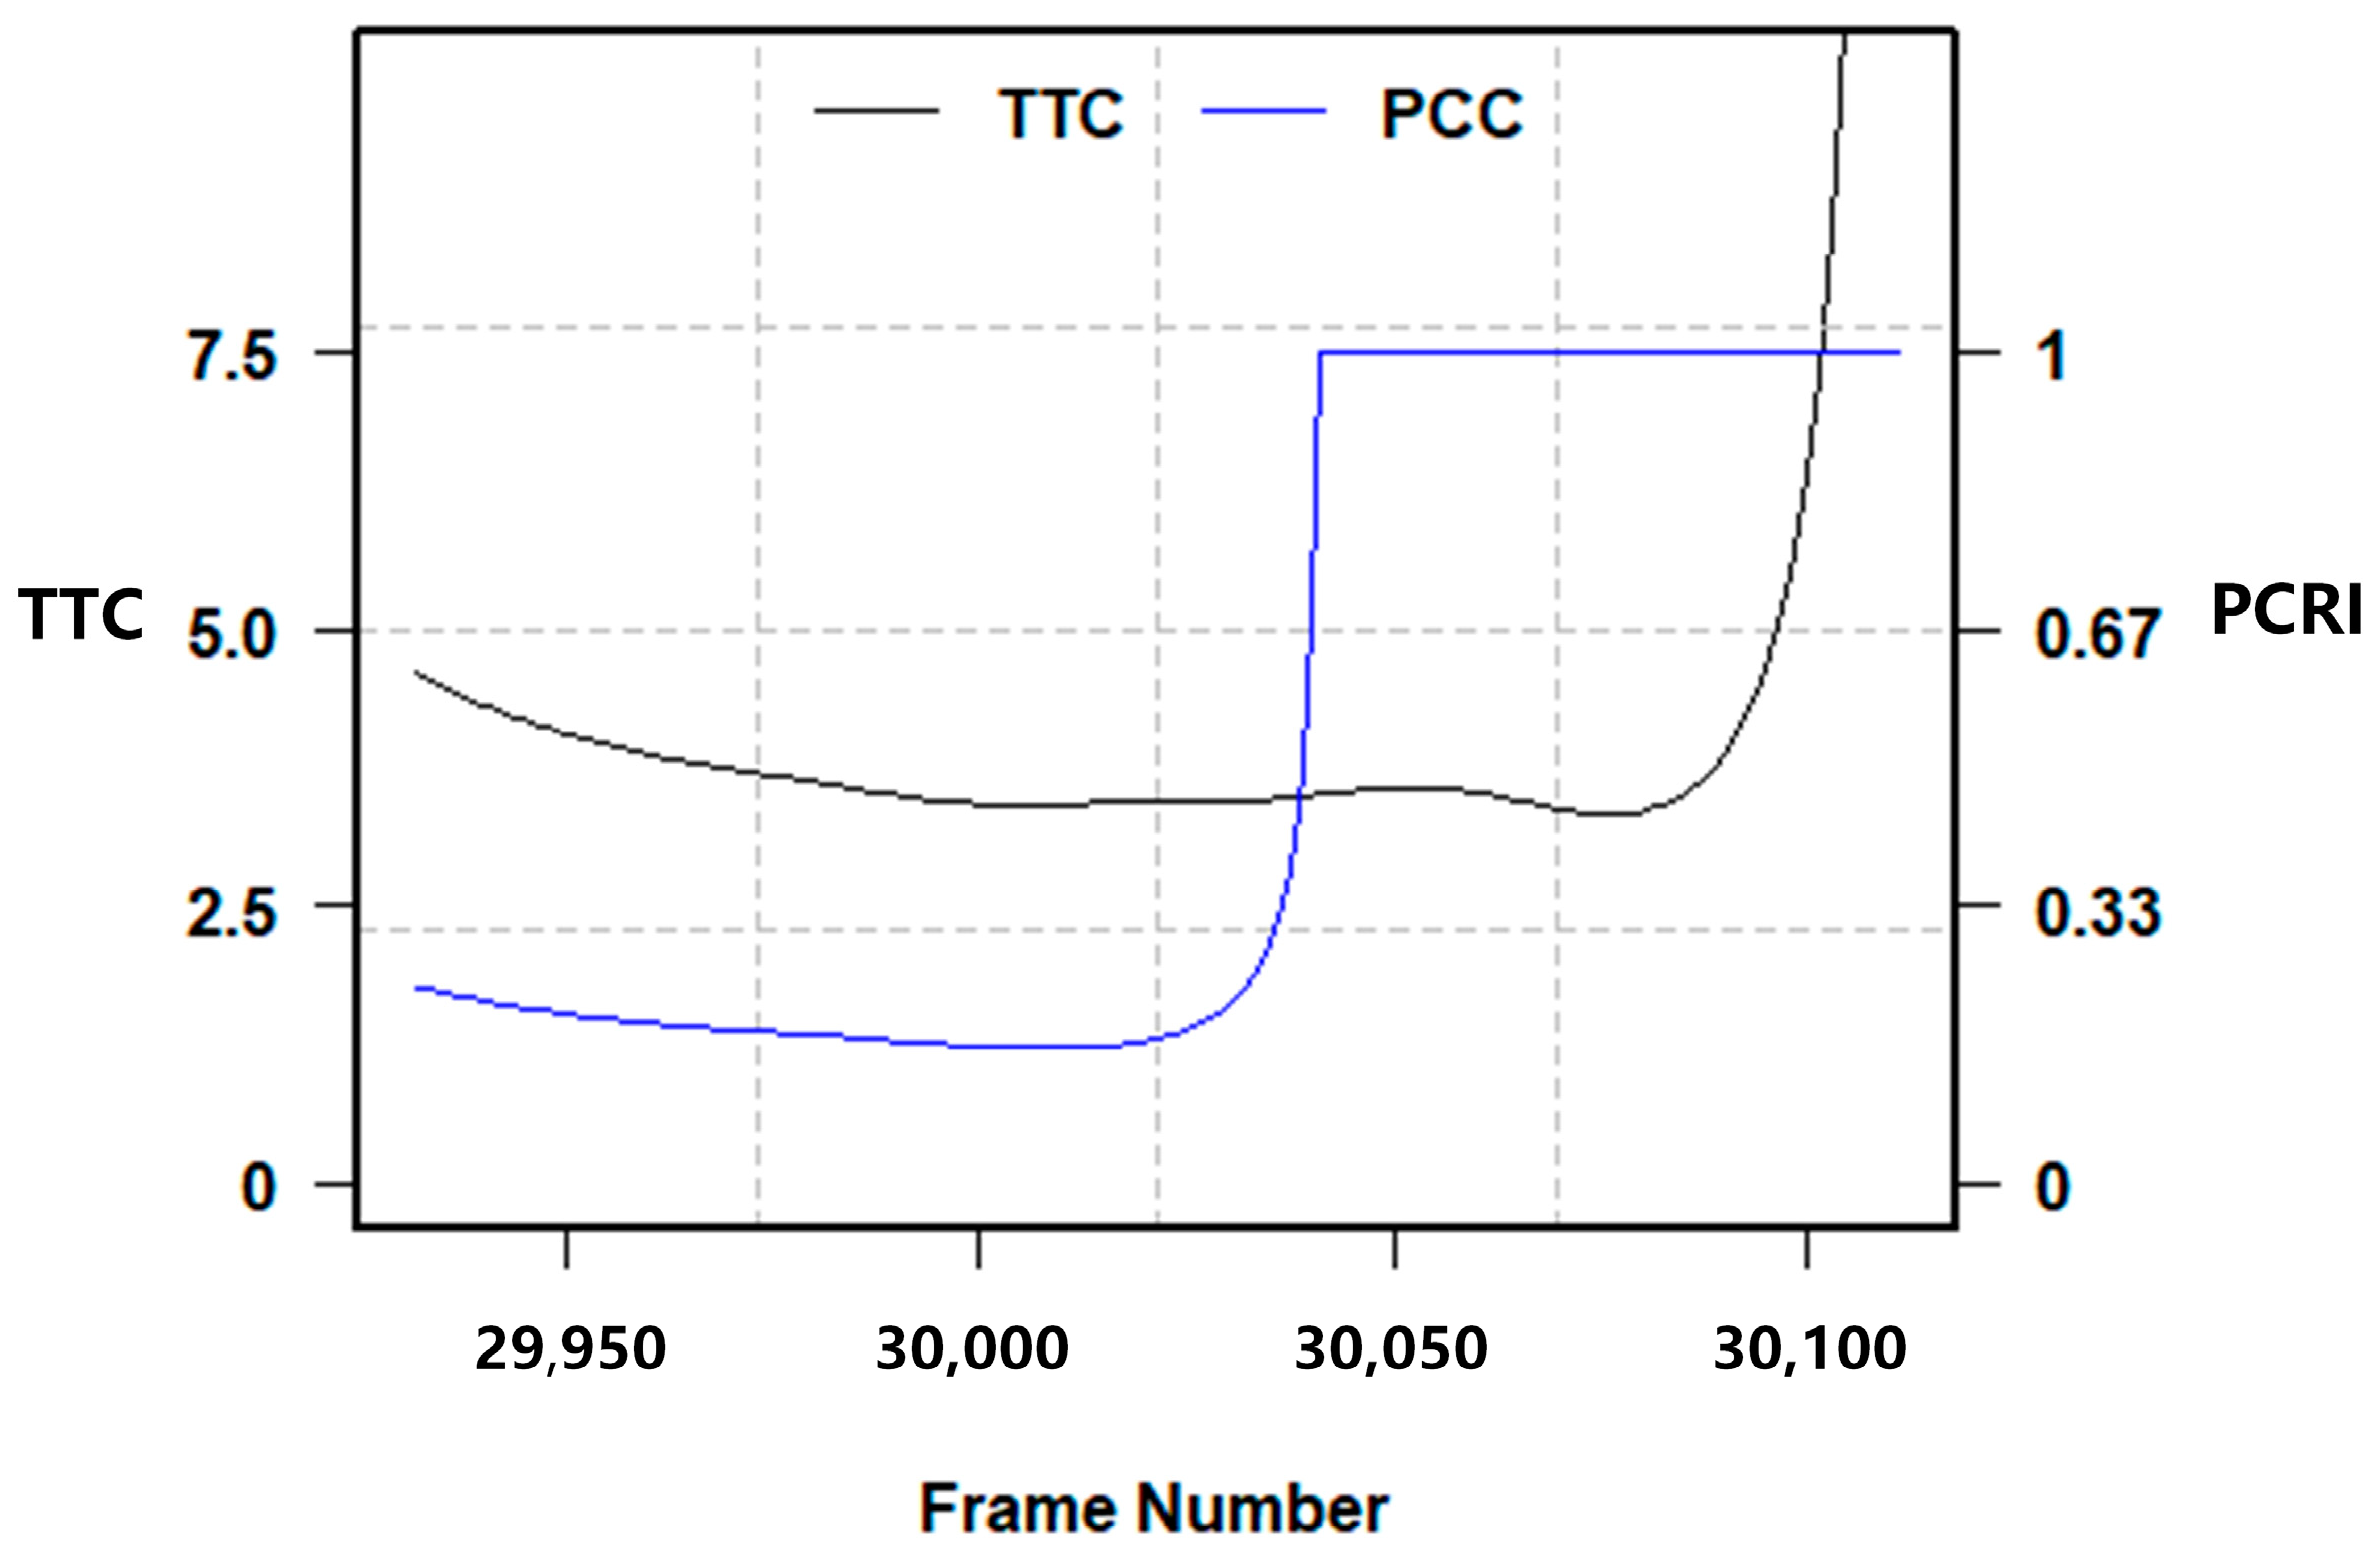
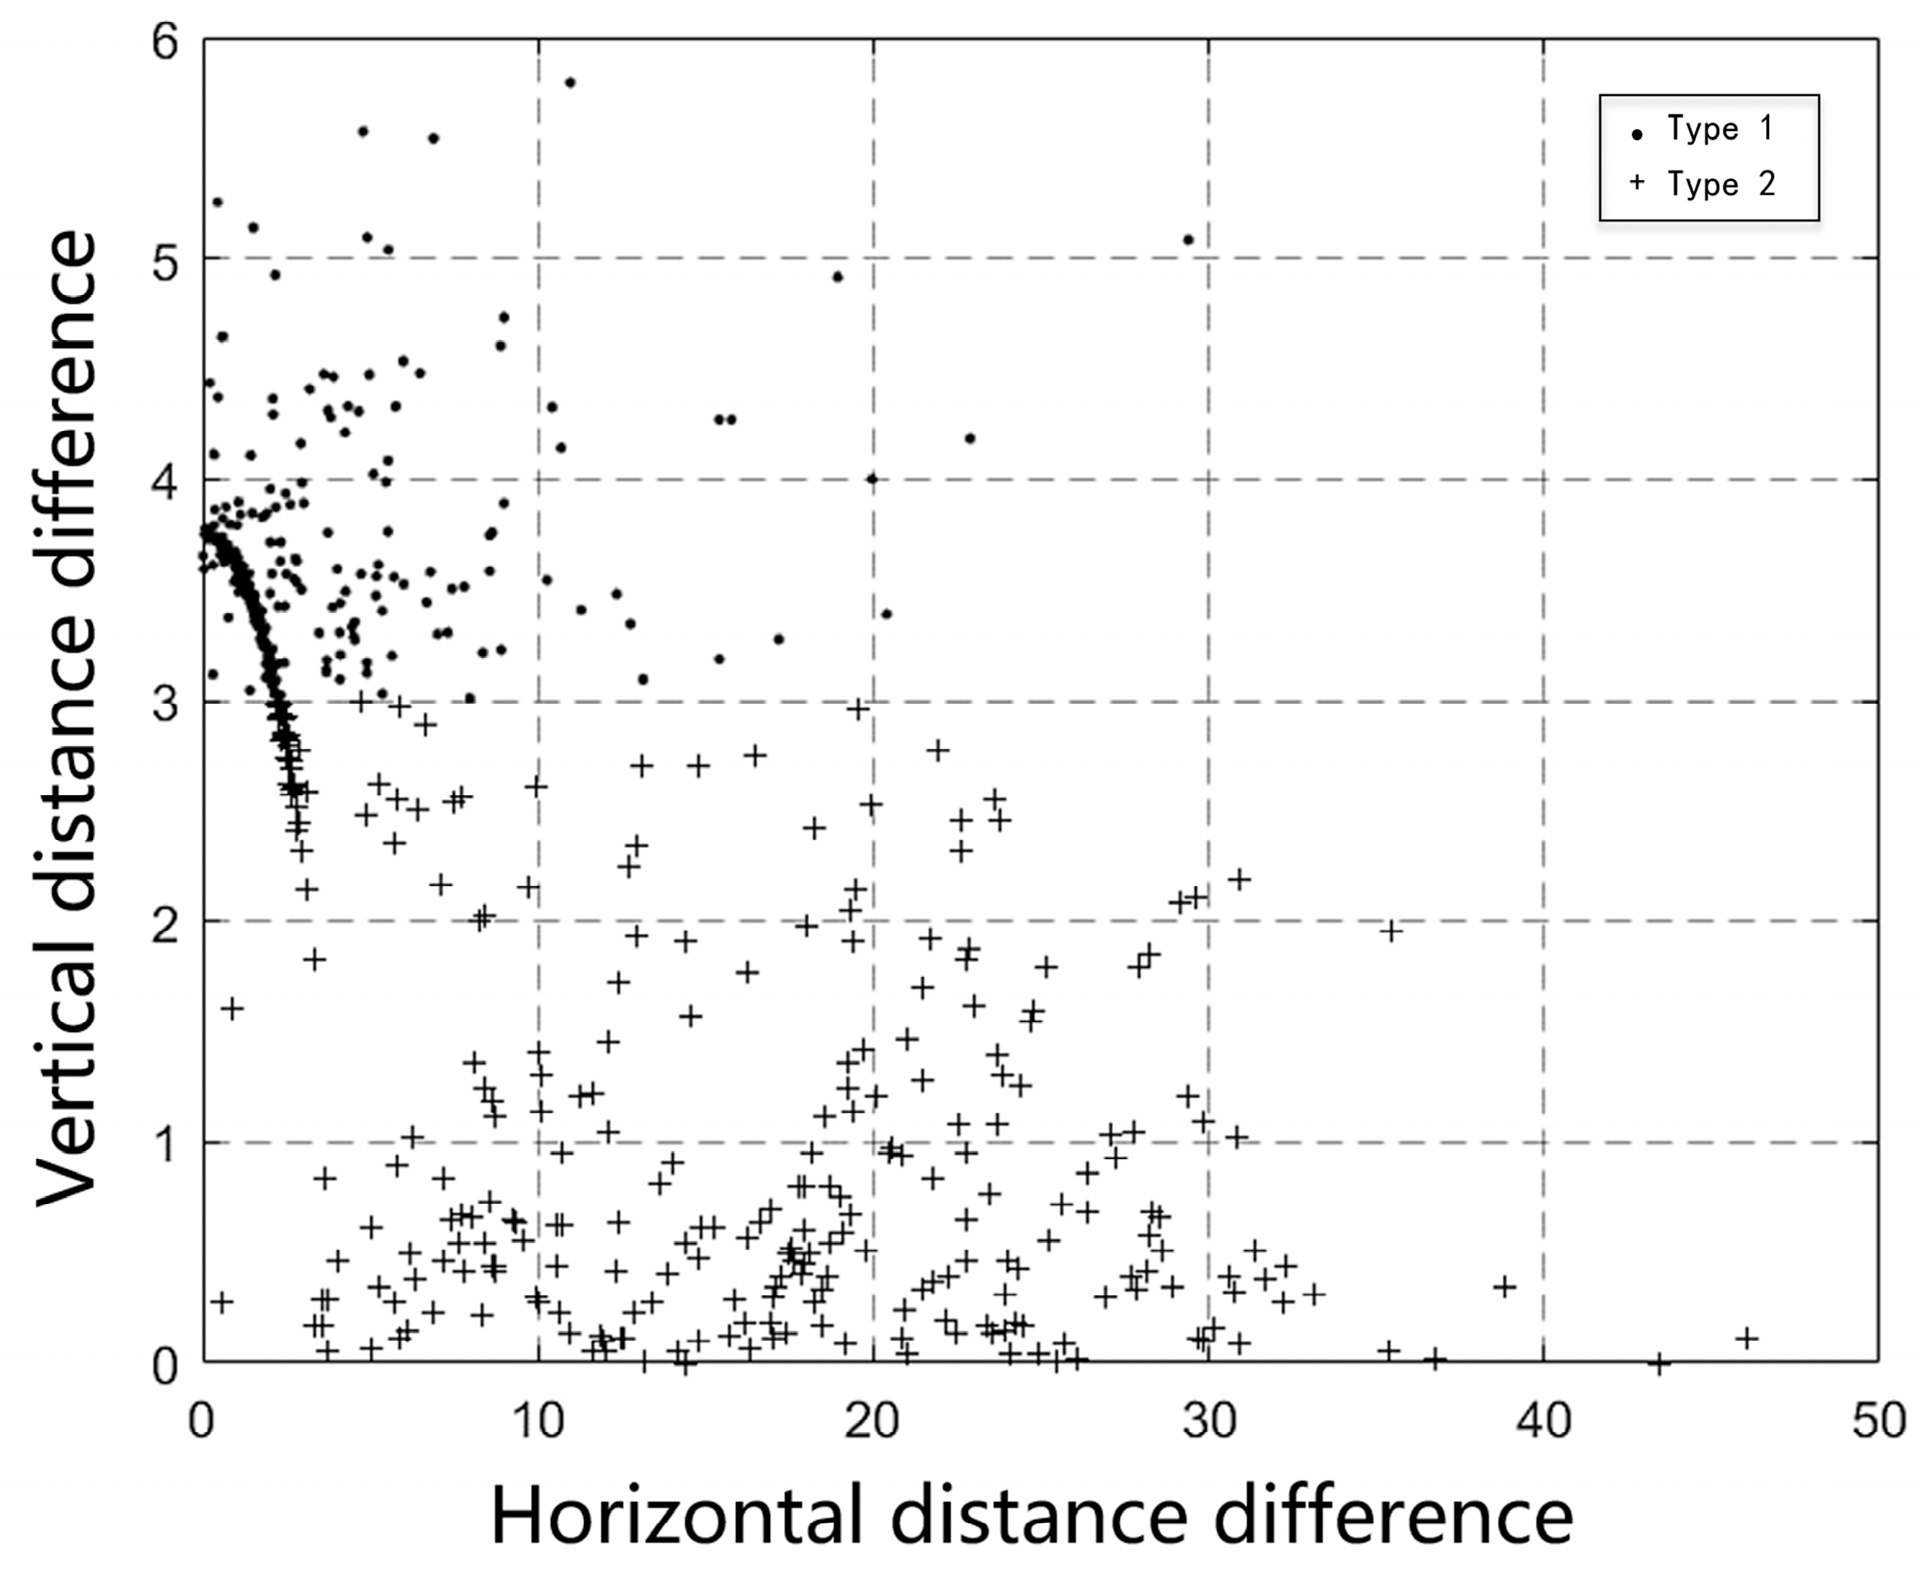
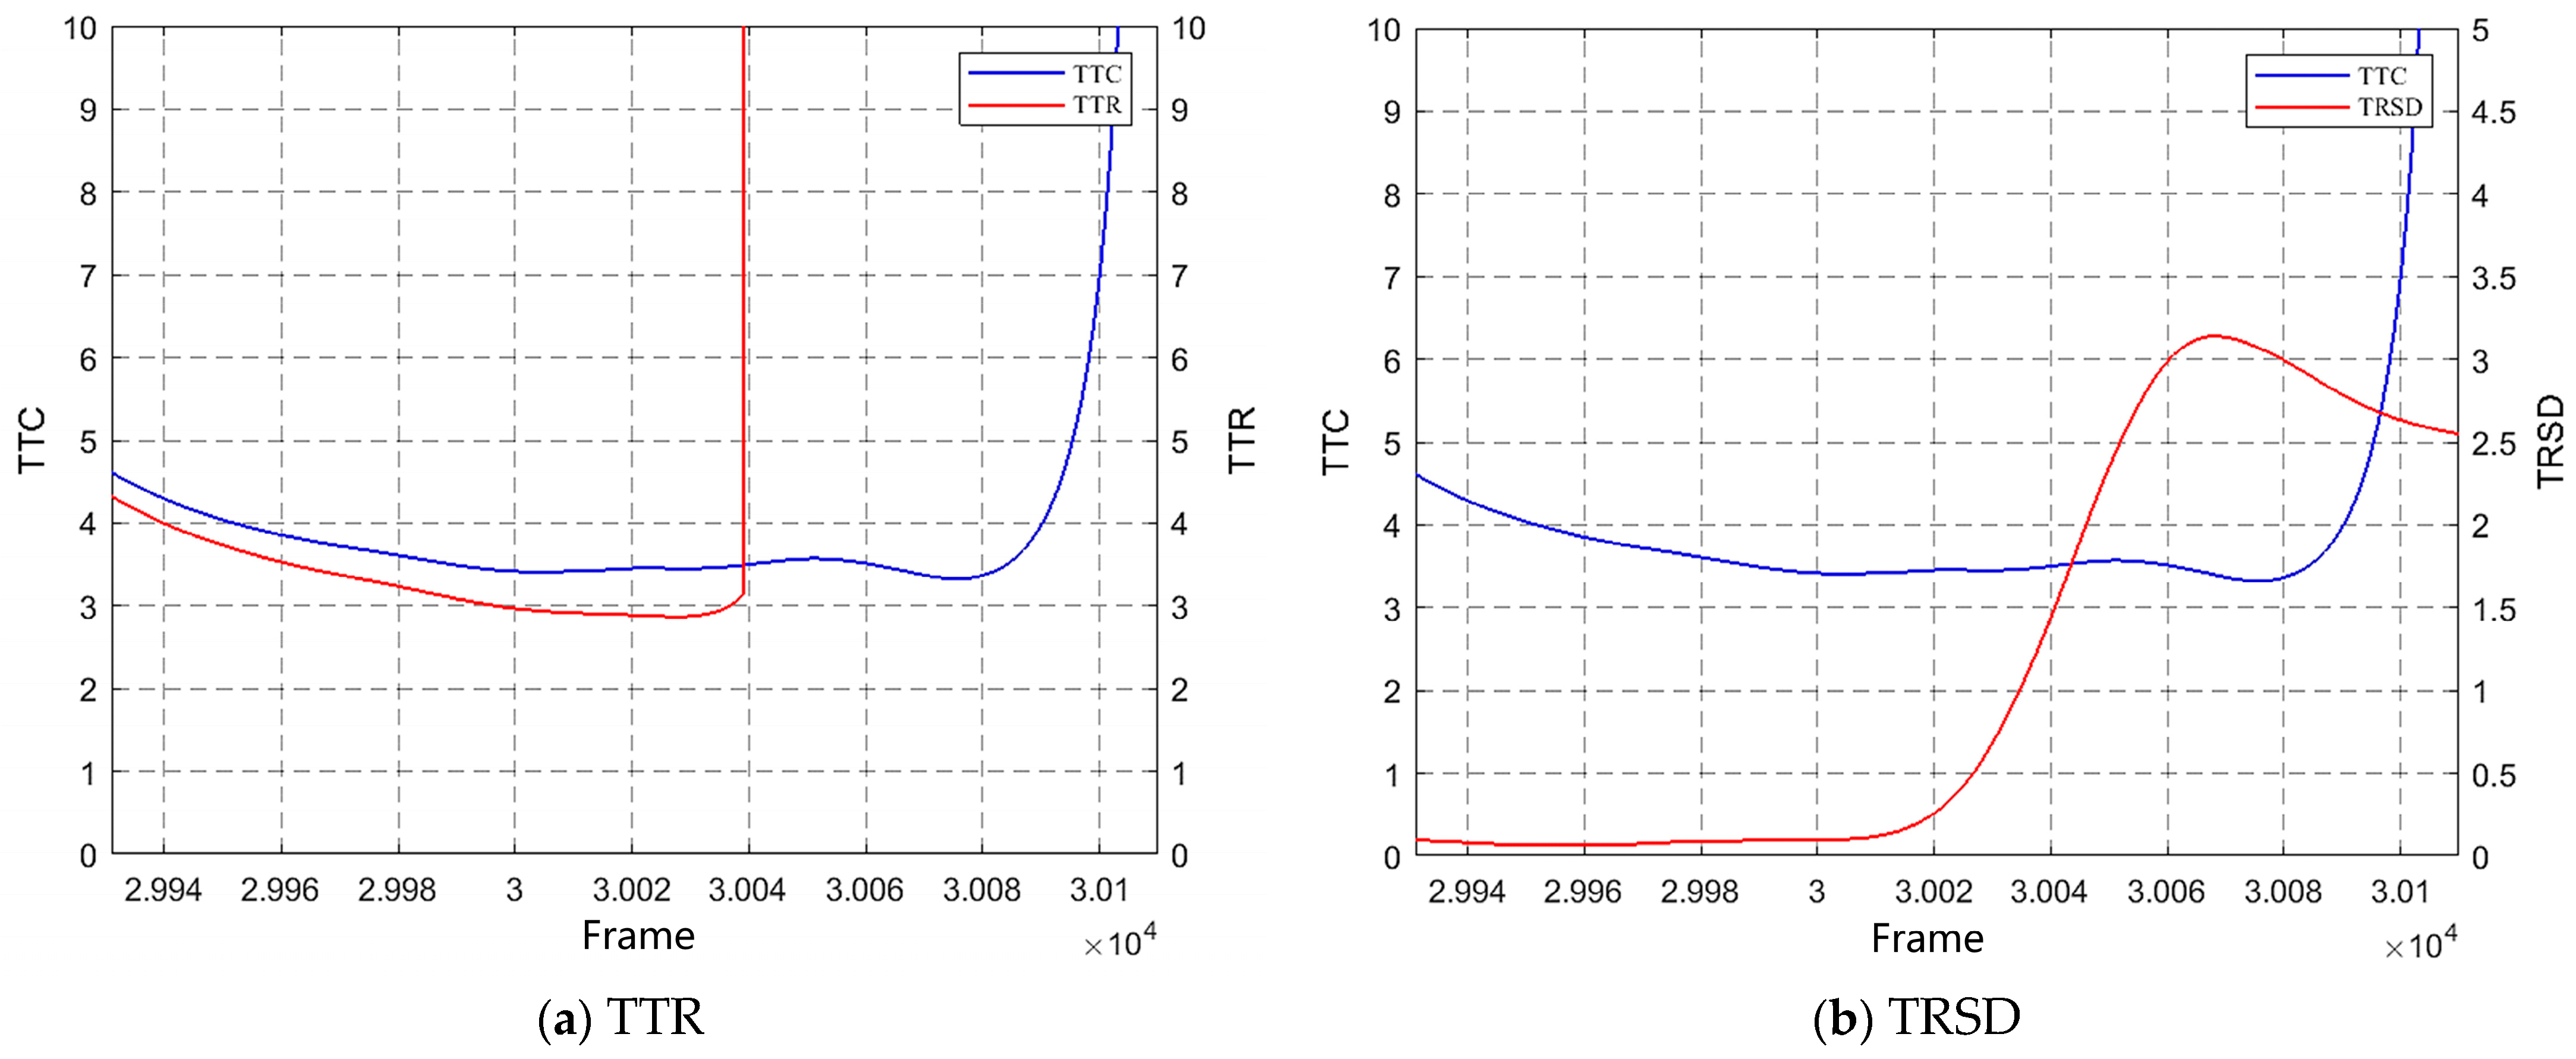
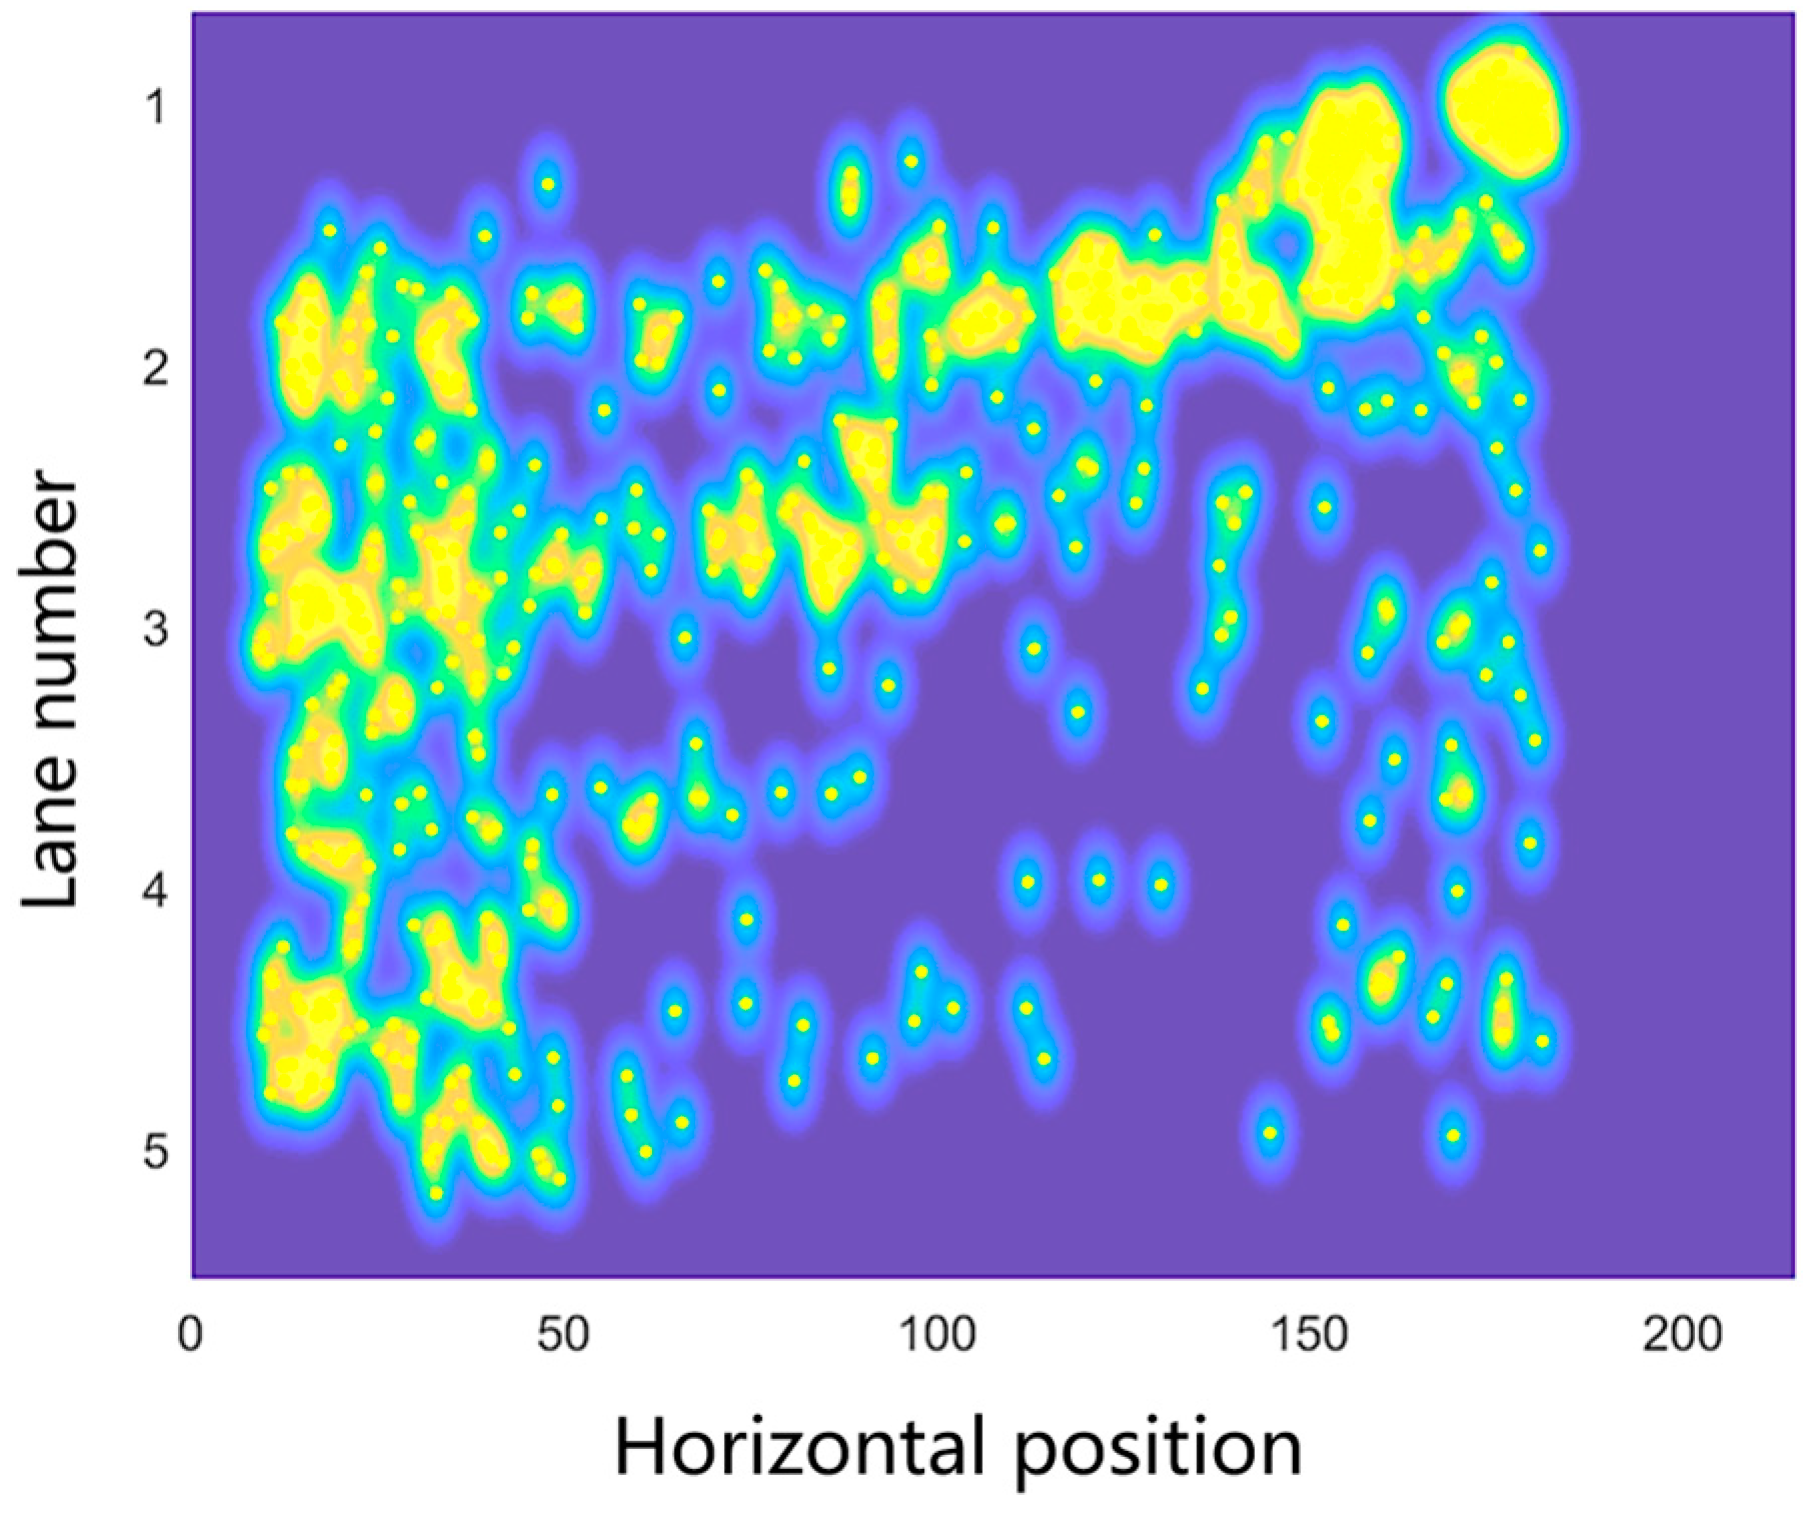
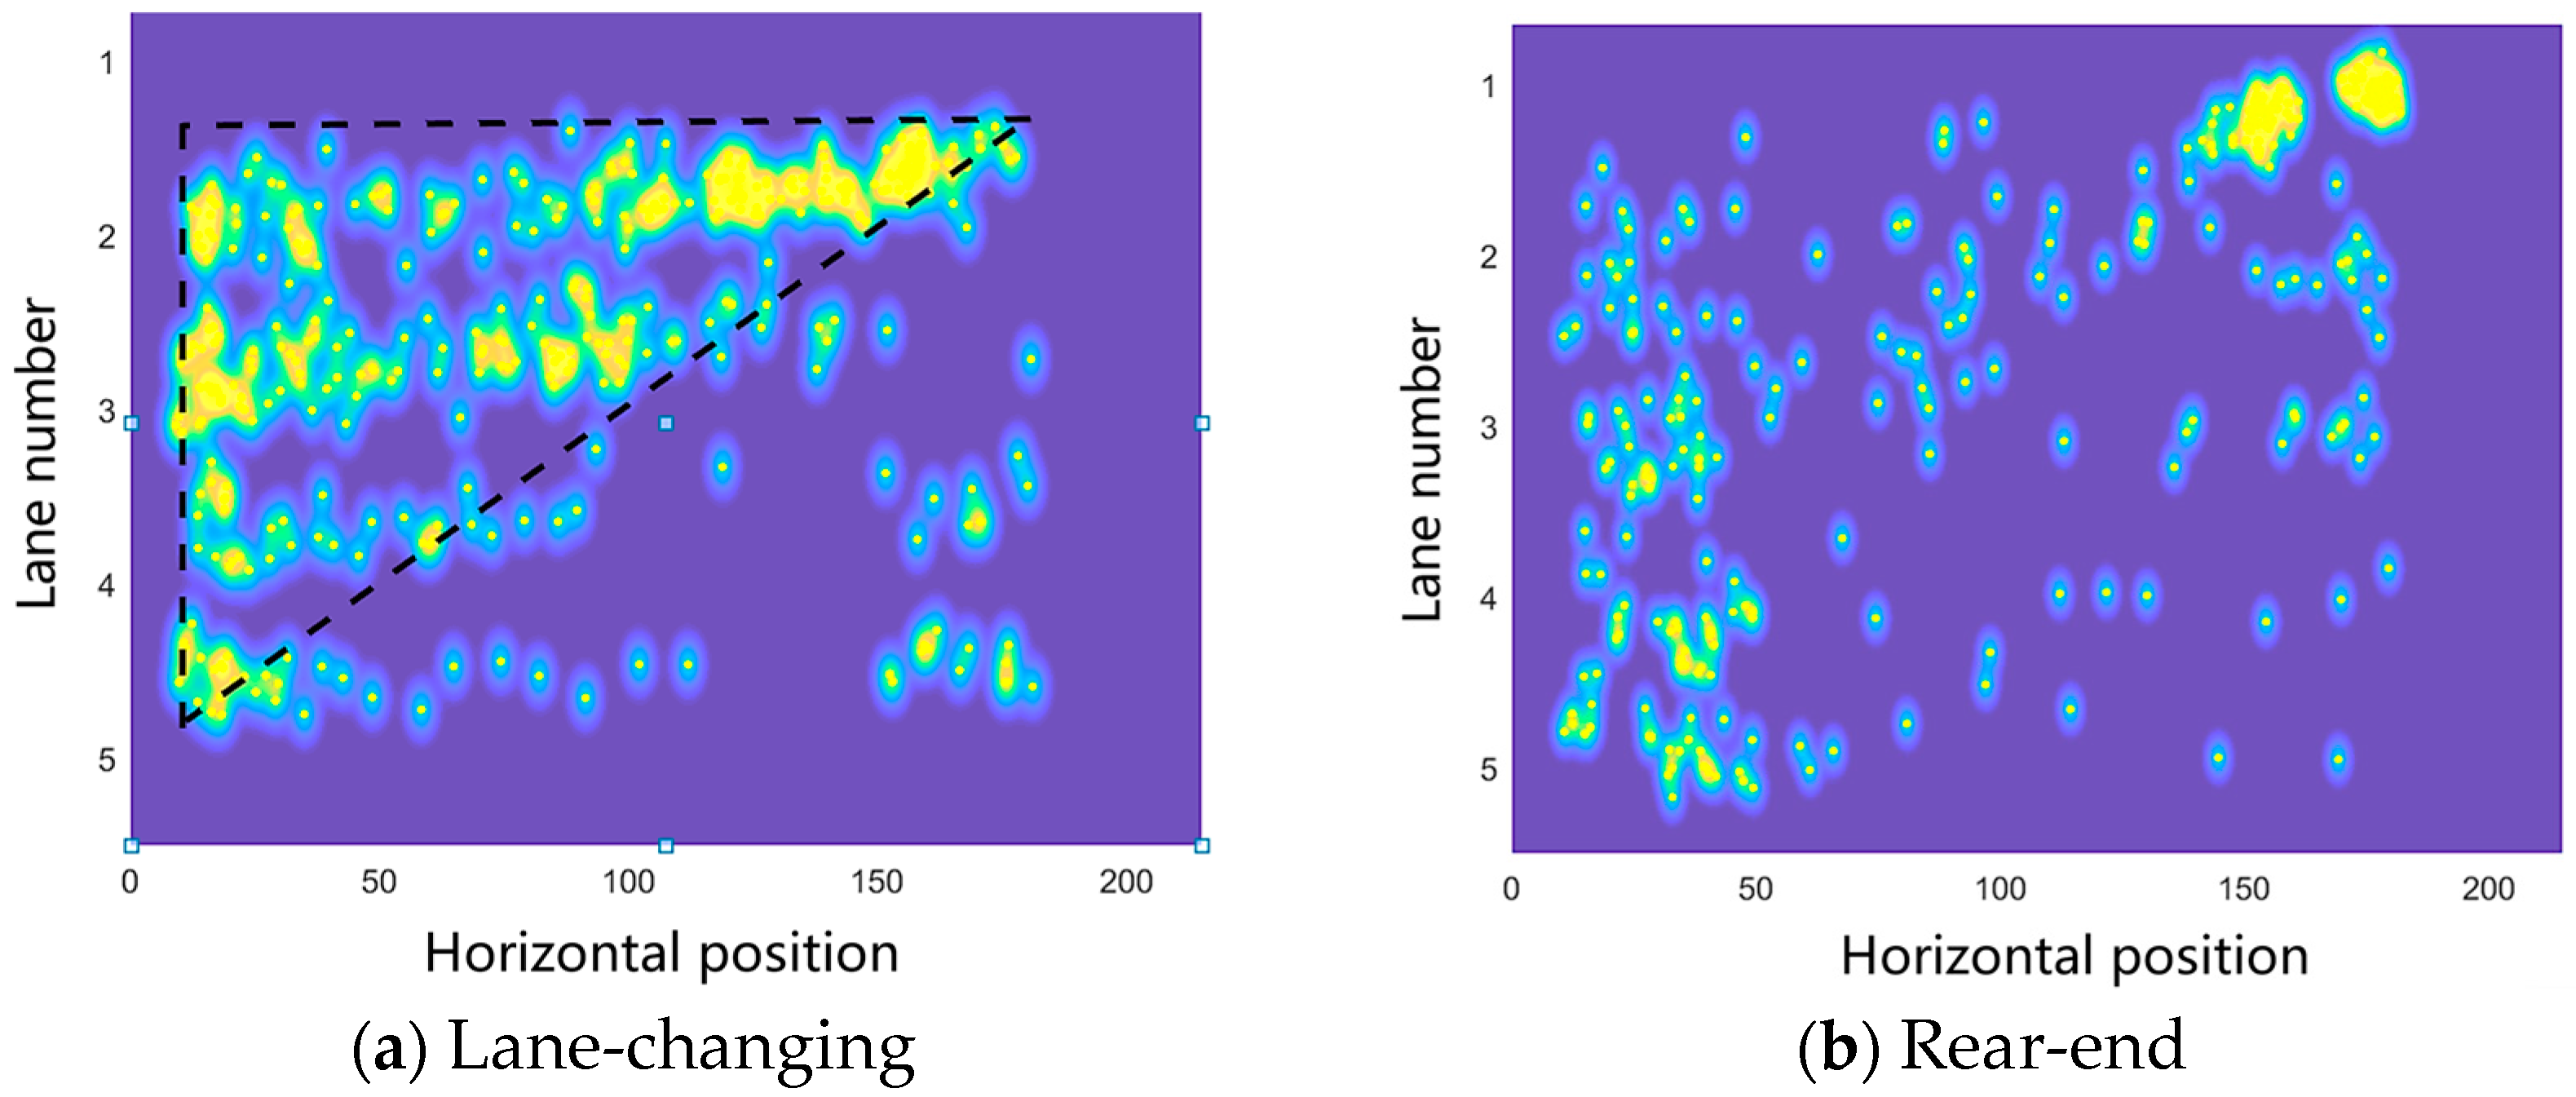
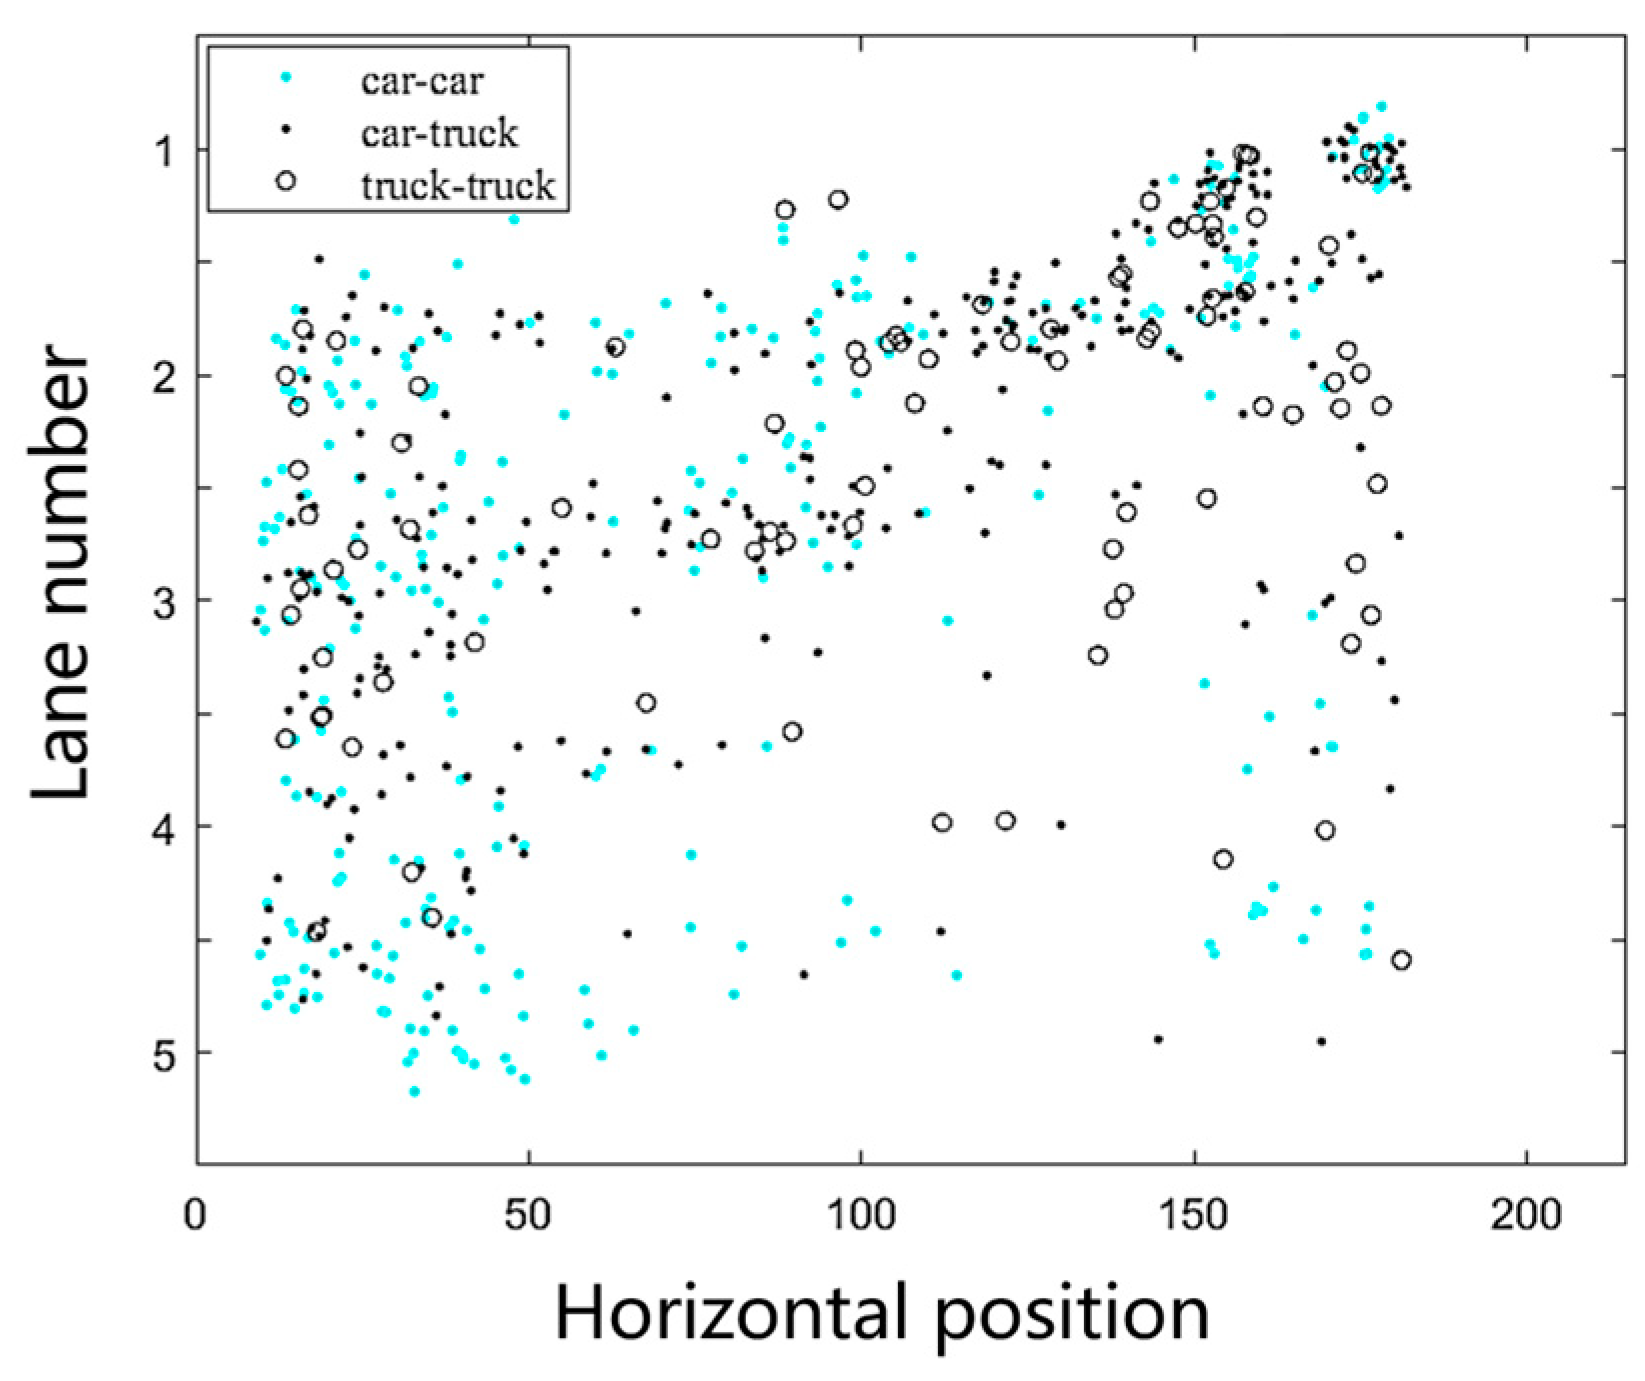
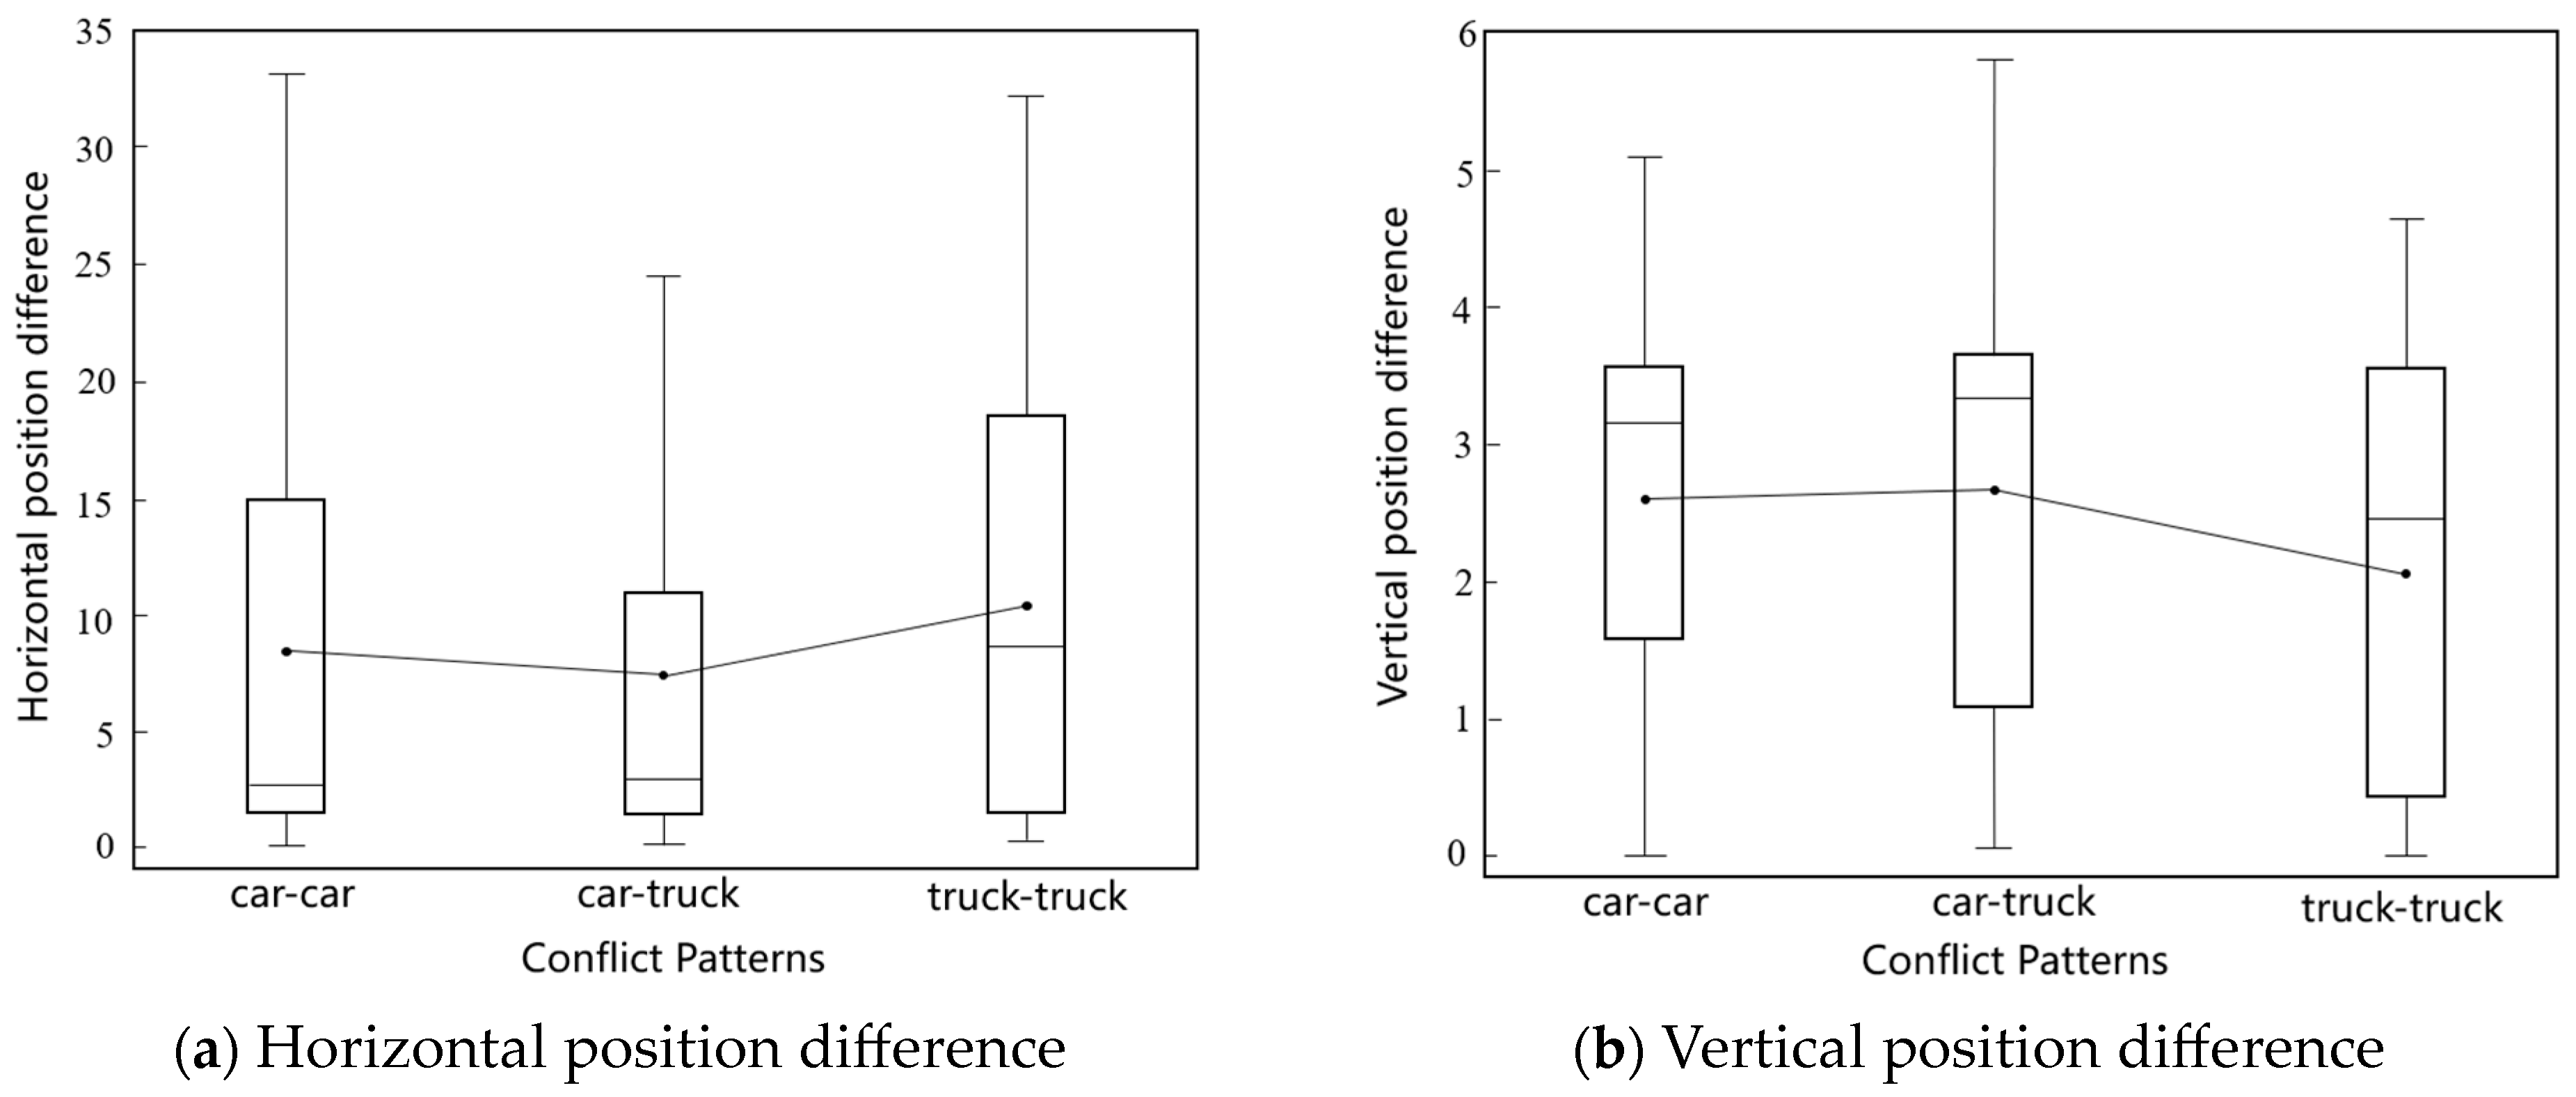
4.2. Conflict Analysis through PCRI Using the ORED

Due to the significant disparities in weight, size, and braking characteristics between trucks and cars, distinct differences in their driving behaviors and traffic flow characteristics emerge. By analyzing conflicts differentiated by vehicle type, insights into the varying behaviors and risks across vehicle types in traffic incidents can be gained. Authorities can tailor traffic management and control strategies to conflict characteristics of different vehicle types, thereby optimizing traffic policies and urban planning. The conflict analysis considering cars and trucks in this part utilizes the ORED. The number of cars in each video, along with the proportion of trucks, is illustrated in Figure 16. The proportion of trucks mostly ranges between 0.3 and 0.4. The average proportion of trucks across all videos is 0.341. Compared to other datasets, such as highD where trucks constitute 23%, this dataset has a higher truck proportion of 34.1%, indicating a more substantial representation of trucks. Table 4 displays the proportion of trucks on each lane in all videos. The distribution of trucks across different lanes follows a certain pattern, with a higher proportion of trucks on the middle lanes, slightly lower on the inner lanes, and the proportion of trucks nearly zero on the innermost lane. Therefore, conflicts between trucks and other vehicles are more likely to occur in the middle lanes.
A total of 646 conflicts are identified from the OREDS using PCRI, with an average of 14 conflicts detected per video. Additionally, the frame number that aligns with the lowest PCRI value is pinpointed, indicating the highest risk moment between the two vehicles. At the moment of highest risk, the continuous midpoint coordinates of the two vehicles’ positions are considered as the location where the conflict occurs, on the video frame, the difference in horizontal and vertical coordinates between the two vehicles reflects the proximity of the conflict. The difference in vehicle speeds along the lane direction at that moment is also calculated.
Figure 17 depicts the spatial distribution of conflict locations. In this Figure, conflicts most frequently occur at the intersection of the on-ramp and the mainline, as well as on the section of road between 0 m to 100 m on lanes 2 and 3. This is because, at the merging area, the vehicles from the on-ramp merge into the mainline, leading to conflicts with vehicles on the mainline. Additionally, due to the high volume of vehicles merging from the on-ramp, queuing and overtaking behavior occur as vehicles enter the mainline, resulting in frequent conflicts among vehicles merging from the on-ramp as well. And lane 3, characterized by the highest truck density, encounters increased conflict risk attributed to trucks’ longer stopping distances relative to cars, particularly under similar speed conditions. Figure 18 shows the distribution of the difference in horizontal and vertical coordinates between two conflict patterns. Analysis of the scatter distribution in this figure allows for the classification of conflict into two primary types. The first type is predominantly clustered around the coordinate (0, 4), indicating that conflicts occur when both vehicles are on the same road section yet maintain a horizontal separation of about 4 m. This suggests that these conflicts arise when vehicles are closely aligned along the roadway but with a notable gap in the perpendicular direction to the traffic lane. The cause of such conflicts is more likely due to the lead vehicle overtaking and changing lanes in the process, leading to potential lane-changing conflicts [52,53]. There are a total of 368 instances in this category, accounting for 56.9% of the total. The second type is concentrated around the coordinate (15, 0), likely occurring in scenarios where vehicles are following each other on the same lane, or the lead vehicle changes lanes to the lane of the front vehicle without overtaking. In this case, it can be assumed that both vehicles are essentially on the same lane, making rear-end conflicts more probable. There are a total of 278 instances in this category, accounting for 43.1% of the total.
For the two most likely conflict types involving cars and trucks, further analysis is conducted on the distribution of locations where these conflicts occur. Figure 19 shows the spatial distribution of the locations of lane-changing (type 1) and rear-end (type 2) conflicts. Based on Figure 19a, the horizontal position of conflicts on the video frame gradually shifts downstream with lane sequence, progressing from 150 m to 110 m, then to 70 m, and finally to 30 m. This demonstrates the lag in lane-changing conflicts. In Figure 19b, rear-end conflicts mainly occur on the sections of the on-ramp that are about to merge into the mainline. This is due to the high volume of traffic merging from the entrance ramp onto the mainline, leading to numerous rear-end conflicts. Additionally, on each lane from 20 m to 70 m, rear-end conflicts also occur, possibly because vehicles conflict with the other vehicles in the same lane after completing a lane change.
Considering the vehicle types, there are three different conflict patterns: car–car, car–truck, and truck–truck. The statistical indicators of conflict are summarized by different conflict patterns as shown in Table 5. Apart from the horizontal position on the video frame, the differences between the average indicators for different conflict patterns are minimal. The average PCRI for truck–truck conflicts tends to be slightly higher. The distribution of conflict locations under different conflict patterns is shown in Figure 20. As depicted in Figure 20, car–car conflicts are mostly distributed on the left side of the study area, which is related to the frequent lane-changing behavior of small cars downstream of the merging area. Car–truck conflicts are mostly distributed on the left side as well, but compared to the former, this kind of conflict is concentrated to some extent in the area where the entrance ramp traffic merges with the mainline traffic (approximately at the 150 m mark). As for truck–truck conflicts, their locations are mostly distributed in the merging area and on lane 3, indicating that conflicts between trucks are more likely to occur in the downstream section of the mainline merging area, attributed to the lane-changing behavior of trucks at the entrance and the higher proportion of trucks on lane 3. In Figure 21a, when car–truck conflicts occur, the horizontal distance difference on the video frame between two vehicles is smaller than that of truck–truck conflicts due to the difference in vehicle sizes and braking performance between trucks and cars. Meanwhile, according to Figure 21b, the vertical distance difference on the video frame in car–truck conflicts is higher than that in truck–truck conflicts. This is because the proportion of lane-changing conflicts between cars and trucks is 61.7% which is higher than lane-changing conflicts between two trucks with a proportion of 45.0%.

5. Conclusions

This paper proposes a new SSM for conflict identification and analysis based on the temporal and spatial proximity of conflicts and the severity of potential collisions. The novel SSM is called PCRI, and the comprehensive evaluation from multiple aspects enables PCRI to adequately measure conflict risk, achieving precise conflict identification. TTC is employed to compare the conflict identification performance with PCRI in different conflict types from the inD dataset. Results show that PCRI can identify conflicts more comprehensively, and the identification of the most dangerous moments is more accurate than that of TTC. Based on PCRI, the characteristics of conflicts in freeway merging areas considering the difference between trucks and cars are analyzed through the ORED. The results demonstrate that conflicts occur more frequently when trucks are involved, and the conflict locations are closer to the on-ramp. In summary, the proposed SSM can provide accurate conflict identification and analysis for traffic safety evaluation, especially in complex traffic environments. The conflict analysis results for freeway merging areas can better capture the differences in conflicts between trucks and cars, thereby providing a basis for the formulation of safety management strategies. For future work, PCRI can be extended to conflict scenarios involving a greater variety of vehicle types, such as the mixed traffic flow with human vehicles and autonomous vehicles.

Author Contributions

Conceptualization, Y.L. (Yichen Lu) and K.C.; methodology, S.T., Y.L. (Yankun Liao) and K.C.; software, S.T. and Y.L. (Yankun Liao); validation, S.T., Y.L. (Yankun Liao) and Y.L. (Yichen Lu); formal analysis, S.T., Y.L. (Yichen Lu) and Y.Z.; investigation, K.C. and Y.L. (Yichen Lu); resources, Y.L. (Yankun Liao) and Y.Z.; data curation, K.C. and Y.L. (Yichen Lu); writing—original draft preparation, S.T., K.C. and Y.L. (Yankun Liao); writing—review and editing, S.T., Y.L. (Yichen Lu) and Y.L. (Yankun Liao); visualization, S.T.; supervision, Y.Z.; project administration, Y.Z.; funding acquisition, Y.Z. All authors have read and agreed to the published version of the manuscript.

Funding

This research received no external funding.

Institutional Review Board Statement

Not applicable.

Informed Consent Statement

Not applicable.

Data Availability Statement

The data presented in this study are available on request from the corresponding author. The data are not publicly available due to privacy.

Conflicts of Interest

Author Kai Cheng was employed by the company China Railway Siyuan Survey and Design Group Co., Ltd. The remaining authors declare that the research was conducted in the absence of any commercial or financial relationships that could be construed as a potential conflict of interest.

References

  1. Zou, Y.; Han, W.; Zhang, Y.; Tang, J.; Zhong, X. Analyzing Freeway Traffic Incident Clearance Time Using a Deep Survival Model. J. Transp. Eng. Part A Syst. 2023, 149, 04023101. [Google Scholar] [CrossRef]
  2. Zheng, L.; Sayed, T.; Mannering, F. Modeling Traffic Conflicts for Use in Road Safety Analysis: A Review of Analytic Methods and Future Directions. Anal. Methods Accid. Res. 2021, 29, 100142. [Google Scholar] [CrossRef]
  3. Tselentis, D.I.; Papadimitriou, E. Driver Profile and Driving Pattern Recognition for Road Safety Assessment: Main Challenges and Future Directions. IEEE Open J. Intell. Transp. Syst. 2023, 4, 83–100. [Google Scholar] [CrossRef]
  4. Uchiyama, A.; Hiromori, A.; Akikawa, R.; Yamaguchi, H.; Higashino, T.; Suzuki, M.; Hiehata, Y.; Kitahara, T. Risky Traffic Situation Detection and Classification Using Smartphones. IEEE Open J. Intell. Transp. Syst. 2023, 4, 846–857. [Google Scholar] [CrossRef]
  5. Du, Z.; Deng, M.; Lyu, N.; Wang, Y. A Review of Road Safety Evaluation Methods Based on Driving Behavior. J. Traffic Transp. Eng. (Engl. Ed.) 2023, 10, 743–761. [Google Scholar] [CrossRef]
  6. Shen, X.; Zhang, Y.; Zhang, X.; Raksincharoensak, P.; Hashimoto, K. Robust Optimal Braking Policy for Avoiding Collision With Front Bicycle. IEEE Open J. Intell. Transp. Syst. 2023, 4, 943–954. [Google Scholar] [CrossRef]
  7. Mohammadian, S.; Haque, M.M.; Zheng, Z.; Bhaskar, A. Integrating Safety into the Fundamental Relations of Freeway Traffic Flows: A Conflict-Based Safety Assessment Framework. Anal. Methods Accid. Res. 2021, 32, 100187. [Google Scholar] [CrossRef]
  8. Lord, D.; Mannering, F. The Statistical Analysis of Crash-Frequency Data: A Review and Assessment of Methodological Alternatives. Transp. Res. Part A Policy Pract. 2010, 44, 291–305. [Google Scholar] [CrossRef]
  9. Ash, J.E.; Zou, Y.; Lord, D.; Wang, Y. Comparison of Confidence and Prediction Intervals for Different Mixed-Poisson Regression Models. J. Transp. Saf. Secur. 2021, 13, 357–379. [Google Scholar] [CrossRef]
  10. Svensson, Å.; Hydén, C. Estimating the Severity of Safety Related Behaviour. Accid. Anal. Prev. 2006, 38, 379–385. [Google Scholar] [CrossRef]
  11. Arun, A.; Haque, M.M.; Washington, S.; Sayed, T.; Mannering, F. A Systematic Review of Traffic Conflict-Based Safety Measures with a Focus on Application Context. Anal. Methods Accid. Res. 2021, 32, 100185. [Google Scholar] [CrossRef]
  12. Mahmud, S.M.S.; Ferreira, L.; Hoque, S.; Tavassoli, A. Reviewing Traffic Conflict Techniques for Potential Application to Developing Countries. J. Eng. Sci. Technol. 2018, 13, 1869–1890. [Google Scholar]
  13. Chin, H.-C.; Quek, S.-T. Measurement of Traffic Conflicts. Saf. Sci. 1997, 26, 169–185. [Google Scholar] [CrossRef]
  14. Tageldin, A.; Sayed, T. Developing Evasive Action-based Indicators for Identifying Pedestrian Conflicts in Less Organized Traffic Environments. J. Adv. Transp. 2016, 50, 1193–1208. [Google Scholar] [CrossRef]
  15. Wang, C.; Xu, C.; Dai, Y. A Crash Prediction Method Based on Bivariate Extreme Value Theory and Video-Based Vehicle Trajectory Data. Accid. Anal. Prev. 2019, 123, 365–373. [Google Scholar] [CrossRef] [PubMed]
  16. Laureshyn, A.; Svensson, Å.; Hydén, C. Evaluation of Traffic Safety, Based on Micro-Level Behavioural Data: Theoretical Framework and First Implementation. Accid. Anal. Prev. 2010, 42, 1637–1646. [Google Scholar] [CrossRef] [PubMed]
  17. Hayward, J.C. Near Miss Determination through Use of a Scale of Danger. Highway Res. Rec. 1972, 384, 24. [Google Scholar]
  18. Li, S.; Xiang, Q.; Ma, Y.; Gu, X.; Li, H. Crash Risk Prediction Modeling Based on the Traffic Conflict Technique and a Microscopic Simulation for Freeway Interchange Merging Areas. Int. J. Environ. Res. Public Health 2016, 13, 1157. [Google Scholar] [CrossRef]
  19. Zhang, S.; Abdel-Aty, M. Real-Time Pedestrian Conflict Prediction Model at the Signal Cycle Level Using Machine Learning Models. IEEE Open J. Intell. Transp. Syst. 2022, 3, 176–186. [Google Scholar] [CrossRef]
  20. Gu, X.; Cai, Q.; Lee, J.; Xiang, Q.; Ma, Y.; Xu, X. Proactive Crash Risk Prediction Modeling for Merging Assistance System at Interchange Merging Areas. Traffic Inj. Prev. 2020, 21, 234–240. [Google Scholar] [CrossRef]
  21. Ozbay, K.; Yang, H.; Bartin, B.; Mudigonda, S. Derivation and Validation of New Simulation-Based Surrogate Safety Measure. Transp. Res. Rec. 2008, 2083, 105–113. [Google Scholar] [CrossRef]
  22. Ge, H.; Xia, R.; Sun, H.; Yang, Y.; Huang, M. Construction and Simulation of Rear-End Conflicts Recognition Model Based on Improved TTC Algorithm. IEEE Access 2019, 7, 134763–134771. [Google Scholar] [CrossRef]
  23. Minderhoud, M.M.; Bovy, P.H.L. Extended Time-to-Collision Measures for Road Traffic Safety Assessment. Accid. Anal. Prev. 2001, 33, 89–97. [Google Scholar] [CrossRef]
  24. Van Winsum, W.; Brookhuis, K.A.; De Waard, D. A Comparison of Different Ways to Approximate Time-to-Line Crossing (TLC) during Car Driving. Accid. Anal. Prev. 2000, 32, 47–56. [Google Scholar] [CrossRef]
  25. Hydén, C. Traffic conflict techniques: Some data to supplement accident analysis. In Transport Planning & Traffic Safety: Making Cities, Roads & Vehicles Safer; CRC Press: Boca Raton, FL, USA, 2016; pp. 89–108. [Google Scholar]
  26. Dijkstra, A.; Drolenga, H. Safety effects of route choice in a road network: Simulation of changing route choice. Research in the Framework of the European Research Programme in-Safety, R-2008-10, Institute for Road Safety Research (SWOV): Leidschendam, Netherlands, 2008.
  27. Park, H.; Oh, C.; Moon, J.; Kim, S. Development of a Lane Change Risk Index Using Vehicle Trajectory Data. Accid. Anal. Prev. 2018, 110, 1–8. [Google Scholar] [CrossRef] [PubMed]
  28. Tageldin, A.; Sayed, T.; Shaaban, K. Comparison of time-proximity and evasive action conflict measures: Case studies from five cities. Transp. Res. Rec. 2017, 2661, 19–29. [Google Scholar] [CrossRef]
  29. Yang, H.; Zou, Y.; Wang, Z.; Wu, B. A Hybrid Method for Short-Term Freeway Travel Time Prediction Based on Wavelet Neural Network and Markov Chain. Can. J. Civ. Eng. 2018, 45, 77–86. [Google Scholar] [CrossRef]
  30. Yang, X.; Zou, Y.; Chen, L. Operation Analysis of Freeway Mixed Traffic Flow Based on Catch-up Coordination Platoon. Accid. Anal. Prev. 2022, 175, 106780. [Google Scholar] [CrossRef] [PubMed]
  31. Wu, S.; Zou, Y.; Wu, L.; Zhang, Y. Application of Bayesian Model Averaging for Modeling Time Headway Distribution. Phys. A: Stat. Mech. Its Appl. 2023, 620, 128747. [Google Scholar] [CrossRef]
  32. Weng, J.; Xue, S.; Yang, Y.; Yan, X.; Qu, X. In-Depth Analysis of Drivers’ Merging Behavior and Rear-End Crash Risks in Work Zone Merging Areas. Accid. Anal. Prev. 2015, 77, 51–61. [Google Scholar] [CrossRef] [PubMed]
  33. An, G.; Bae, J.H.; Talebpour, A. An Optimized Car-Following Behavior in Response to a Lane-Changing Vehicle: A Bézier Curve-Based Approach. IEEE Open J. Intell. Transp. Syst. 2023, 4, 682–689. [Google Scholar] [CrossRef]
  34. Wang, W.; Yao, X.; Yan, Y.; Wu, B.; Wang, Z.; Zhang, H. Development and Performance of a Connected Car-Following Model. J. Transp. Eng. Part A Syst. 2023, 149, 04023079. [Google Scholar] [CrossRef]
  35. Zheng, L.; Huang, Y.; Sayed, T.; Wen, C. Validating the Bayesian Hierarchical Extreme Value Model for Traffic Conflict-Based Crash Estimation on Freeway Segments with Site-Level Factors. Accid. Anal. Prev. 2021, 159, 106269. [Google Scholar] [CrossRef]
  36. Xu, Z.; Zou, X.; Oh, T.; Vu, H.L. Studying Freeway Merging Conflicts Using Virtual Reality Technology. J. Saf. Res. 2021, 76, 16–29. [Google Scholar] [CrossRef]
  37. Wu, B.; Zou, C.; Li, Y.; Fan, D.; Zhu, S. Impact of Road Environment on Drivers’ Preference to Merging Location Selection in Freeway Work Zone Merging Areas. J. Adv. Transp. 2022, 2022, 2996081. [Google Scholar] [CrossRef]
  38. Zhu, J.; Tasic, I. Safety Analysis of Freeway On-Ramp Merging with the Presence of Autonomous Vehicles. Accid. Anal. Prev. 2021, 152, 105966. [Google Scholar] [CrossRef]
  39. Wang, P.; Zhu, S.; Zhao, X. Identification and Factor Analysis of Traffic Conflicts in the Merge Area of Freeway Work Zone. Sustainability 2023, 15, 11314. [Google Scholar] [CrossRef]
  40. Meng, Q.; Weng, J. Evaluation of Rear-End Crash Risk at Work Zone Using Work Zone Traffic Data. Accid. Anal. Prev. 2011, 43, 1291–1300. [Google Scholar] [CrossRef]
  41. Chen, Y.; Zou, Y.; Kong, X.; Wu, L. Investigating the Impact of Influential Factors on Crash Types for Autonomous Vehicles at Intersections. J. Transp. Saf. Secur. 2023, 1–28. [Google Scholar] [CrossRef]
  42. Ward, J.R.; Agamennoni, G.; Worrall, S.; Bender, A.; Nebot, E. Extending Time to Collision for Probabilistic Reasoning in General Traffic Scenarios. Transp. Res. Part C Emerg. Technol. 2015, 51, 66–82. [Google Scholar] [CrossRef]
  43. Venthuruthiyil, S.P. Anticipated Collision Time (ACT): A Two-Dimensional Surrogate Safety Indicator for Trajectory-Based Proactive Safety Assessment. Transp. Res. Part C Emerg. Technol. 2022, 139, 103655. [Google Scholar] [CrossRef]
  44. Mahajan, V.; Katrakazas, C.; Antoniou, C. Crash Risk Estimation Due to Lane Changing: A Data-Driven Approach Using Naturalistic Data. IEEE Trans. Intell. Transport. Syst. 2022, 23, 3756–3765. [Google Scholar] [CrossRef]
  45. Bock, J.; Krajewski, R.; Moers, T.; Runde, S.; Vater, L.; Eckstein, L. The inD Dataset: A Drone Dataset of Naturalistic Road User Trajectories at German Intersections. In Proceedings of the 2020 IEEE Intelligent Vehicles Symposium (IV), Las Vegas, NV, USA, 19 October 2020; pp. 1929–1934. [Google Scholar]
  46. Lu, Y.; Cheng, K.; Zhang, Y.; Chen, X.; Zou, Y. Analysis of Lane-Changing Conflict between Cars and Trucks at Freeway Merging Sections Using UAV Video Data. J. Transp. Saf. Secur. 2023, 15, 943–961. [Google Scholar] [CrossRef]
  47. Chen, X.; Li, Z.; Yang, Y.; Qi, L.; Ke, R. High-Resolution Vehicle Trajectory Extraction and Denoising from Aerial Videos. IEEE Trans. Intell. Transport. Syst. 2021, 22, 3190–3202. [Google Scholar] [CrossRef]
  48. Bagdadi, O.; Várhelyi, A. Development of a Method for Detecting Jerks in Safety Critical Events. Accid. Anal. Prev. 2013, 50, 83–91. [Google Scholar] [CrossRef] [PubMed]
  49. Zheng, L.; Sayed, T. Comparison of Traffic Conflict Indicators for Crash Estimation Using Peak over Threshold Approach. Transp. Res. Rec. 2019, 2673, 493–502. [Google Scholar] [CrossRef]
  50. El-Shawarby, I.; Amer, A.; Rakha, H. Driver Stopping Behavior on High-Speed Signalized Intersection Approaches. Transp. Res. Rec. 2008, 2056, 60–69. [Google Scholar] [CrossRef]
  51. Gettman, D.; Pu, L.; Sayed, T.; Shelby, S.G.; Energy, S. Surrogate Safety Assessment Model and Validation (No. FHWA-HRT-08-051); Turner-Fairbank Highway Research Center: McLean, VA, USA, 2008. [Google Scholar]
  52. Zhang, Y.; Zou, Y.; Xie, Y.; Chen, L. Identifying Dynamic Interaction Patterns in Mandatory and Discretionary Lane Changes Using Graph Structure. Comput. Aided Civ. Eng. 2023, 39, 638–655. [Google Scholar] [CrossRef]
  53. Zhang, Y.; Zou, Y.; Selpi; Zhang, Y.; Wu, L. Spatiotemporal Interaction Pattern Recognition and Risk Evolution Analysis During Lane Changes. IEEE Trans. Intell. Transp. Syst. 2023, 24, 6663–6673. [Google Scholar] [CrossRef]
Figure 1. The whole framework of this study.
Applsci 14 02711 g001
Figure 2. The definitions of variables related to TTC.
Applsci 14 02711 g002
Figure 3. The relationship between risk region and the subject vehicle’s trajectory.
Applsci 14 02711 g003
Figure 4. Three position relationships between the subject vehicle and the risk region.
Applsci 14 02711 g004
Figure 5. The exposure distance of the subject vehicle within the risk region.
Applsci 14 02711 g005
Figure 6. The variables of time related to speed and direction for two vehicles.
Applsci 14 02711 g006
Figure 7. The sigmoid function and the transformed sigmoid function.
Applsci 14 02711 g007
Figure 8. A sample video frame from the inD dataset.
Applsci 14 02711 g008
Figure 9. The location of the study area of the ORED.
Applsci 14 02711 g009
Figure 10. Shooting videos by a drone.
Applsci 14 02711 g010
Figure 11. The study area with the coordinate system and schematic diagram of five lanes.
Applsci 14 02711 g011
Figure 12. Changes in TTC and PCRI of conflict between vehicle #139 and vehicle #141.
Applsci 14 02711 g012
Figure 13. Comparison of different variates with TTC.
Applsci 14 02711 g013
Figure 14. SSMs’ changes in conflict between vehicle #527 and vehicle #528.
Applsci 14 02711 g014
Figure 15. The change trends of TTR and TRSD.
Applsci 14 02711 g015
Figure 16. The proportion of trucks and cars.
Applsci 14 02711 g016
Figure 17. The distribution of conflict locations.
Applsci 14 02711 g017
Figure 18. The distribution of relative distance between two vehicles.
Applsci 14 02711 g018
Figure 19. The spatial distribution of conflict locations.
Applsci 14 02711 g019
Figure 20. The positions of different conflict patterns.
Applsci 14 02711 g020
Figure 21. The position difference in different conflict patterns.
Applsci 14 02711 g021
Table 1. The average number of conflict missing rate (conflict times/ video).
Rear-EndLane-ChangingCrossingAll
TTC2.70.31.64.6
PCRI00.41.21.6
Table 2. The deceleration of subject vehicle in the rear-end conflict.
FrameDeceleration (m/s2)FrameDeceleration (m/s2)FrameDeceleration (m/s2)FrameDeceleration (m/s2)
59310.8666259510.7454159711.6892359912.25693
59320.8340159520.7716959721.7417259922.25815
59330.8027959530.8003159731.7923259932.25719
59340.7733459540.8314259741.8409259942.25401
59350.7459359550.8651159751.8874159952.24854
59360.7208259560.9015159761.9317159962.24070
59370.6983359570.9406959771.9736059972.23040
59380.6786559580.9826559782.0128559982.21751
59390.6619459591.0275159792.0491859992.20188
59400.6483659601.0753259802.0824360002.18351
59410.6382759611.1259059812.1125860012.16228
59420.6321359621.1789159822.1396460022.13801
59430.6303459631.2339359832.1636260032.11057
59440.6328559641.2904559842.1845260042.07990
59450.6393959651.3478059852.2023760052.04589
59460.6497459661.4055259862.2173560062.00838
59470.6636759671.4634159872.2298160071.96731
59480.6805559681.5212459882.2400160081.92275
59490.6998359691.5786259892.2479360091.87484
59500.7214459701.6348259902.2535560101.82390
Table 3. The deceleration of subject vehicle in this crossing conflict.
FrameDeceleration (m/s2)FrameDeceleration (m/s2)
299961.420030066−0.3856
299971.420430067−0.4021
299981.419330068−0.4159
299991.416430069−0.4271
300001.411330070−0.4357
300011.403930071−0.4421
300021.394330072−0.4462
300031.382830073−0.4485
300041.369630074−0.4495
300051.354830075−0.4494
300061.338630076−0.4484
300071.321430077−0.4464
300081.303430078−0.4432
300091.285330079−0.4386
300101.267630080−0.4326
300111.251630081−0.4253
300121.238330082−0.4168
300131.228430083−0.4073
300141.221330084−0.3970
300151.216030085−0.3859
Table 4. Statistics of truck proportions by lane.
Lane 1Lane 2Lane 3Lane 4Lane 5All
Average29%68%69%35%2.0%34%
Min18%38%46%11%0.0%26%
Max58%86%95%72%10%47%
Table 5. Indicators for conflicts involving different conflict patterns.
Conflict
Patterns
QuantityAverage PCRIHorizontal Position (m)Vertical Position (m)Horizontal Distance (m)Vertical Distance
(m)
Lane-Changing Conflict Ratio
Car–car2650.0877.4772.418.472.5955.8%
Car–truck2900.0897.1674.487.242.6661.7%
Truck–truck910.09106.8474.5310.412.0645.0%
Disclaimer/Publisher’s Note: The statements, opinions and data contained in all publications are solely those of the individual author(s) and contributor(s) and not of MDPI and/or the editor(s). MDPI and/or the editor(s) disclaim responsibility for any injury to people or property resulting from any ideas, methods, instructions or products referred to in the content.

