Article

Windowed Hamming Distance-Based Intrusion Detection for the CAN Bus

1
School of Computer Engineering and Science, Shanghai University, Shanghai 200444, China
2
Purple Mountain Laboratories, Nanjing 211111, China
*
Authors to whom correspondence should be addressed.
Appl. Sci. 2024, 14(7), 2805; https://doi.org/10.3390/app14072805
Submission received: 27 February 2024 / Revised: 23 March 2024 / Accepted: 25 March 2024 / Published: 27 March 2024
(This article belongs to the Special Issue Vehicle Safety and Crash Avoidance)

Abstract

:
The use of a Controller Area Network (CAN) bus in the automotive industry for connecting electronic control units (ECUs) poses security vulnerabilities due to the lack of built-in security features. Intrusion Detection Systems (IDSs) have emerged as a practical solution for safeguarding the CAN bus. However, developing an effective IDS for in-vehicle CAN buses encounters challenges in achieving high precision for detecting attacks and meeting real-time requirements with limited computational resources. To address these challenges, we propose a novel method for anomaly detection on CAN data using windowed Hamming distance. Our approach utilizes sliding windows and Hamming distance to extract features from time series data. By creating benchmark windows that span at least one cycle of data, we compare newly generated windows with recorded benchmarks using the Hamming distance to identify abnormal CAN messages. During the experimental phase, we conduct extensive testing on both the public car-hack dataset and a proprietary dataset. The experimental results indicate that our method achieves an impressive accuracy of up to 99.67% in detecting Denial of Service (DoS) attacks and an accuracy of 98.66% for fuzzing attacks. In terms of two types of spoofing attacks, our method achieves detection accuracies of 99.48% and 99.61%, respectively, significantly outperforming the methods relying solely on the Hamming distance. Furthermore, in terms of detection time, our method significantly reduces the time consumption by nearly 20-fold compared to the approach using deep convolutional neural networks (DCNN), decreasing it from 6.7 ms to 0.37 ms.

1. Introduction

The Controller Area Network (CAN) bus is widely adopted in the automotive industry for connecting electronic control units (ECUs) due to its simplicity and reliability. However, the CAN bus protocol, designed for efficient and real-time communication, lacks a built-in security mechanism [1]. Hence, the bus is exposed to potential attacks and unauthorized access. The increasing development of the Internet of Vehicles [2] and autonomous driving technology further amplifies the feasibility and severity of CAN bus attacks [3,4]. Therefore, it is crucial to address the security vulnerabilities associated with the CAN bus, as the impact of such attacks can have significant consequences.
Typical attacks of the CAN bus include spoofing attacks, Denial of Service (DoS) attacks, and fuzzy attacks [5,6]. A spoofing attack happens when an attacker can inject unauthorized messages onto the bus. Since the CAN bus does not have a message authentication mechanism, the injected messages can potentially manipulate or deceive the ECUs, leading to unsafe or malicious actions. DoS attacks are a type of common attacks that sends a large amount of high-priority data to the CAN bus, increasing the bus load and affecting the transmission of other normal data. A fuzzy attack means that the attacker may actively send a large number of random data frames to the CAN bus, causing network congestion or arbitration failure and affecting the transmission of normal messages.
A natural choice to defend against these attacks is using a message authentication code (MAC) mechanism such as adding Security Onboard Communication (SecOC), which is a message authentication module, into ECUs. However, this method is far from being widely deployed. The reason for the slow adoption of this new architecture is that any modifications made to a vehicle can potentially impact its functional safety. Additionally, MAC may impose a burden on the CAN network load and increase computational overhead. Therefore, implementing the new software architecture requires a significant amount of time and careful consideration to ensure that it does not compromise the overall functionality and safety of the vehicle.
Intrusion Detection System (IDS) is currently the most practical tool to protect the CAN bus [7]. An IDS for in-vehicle CAN bus works by monitoring the traffic on the bus, analyzing the messages exchanged between ECUs, and identifying any suspicious or anomalous behavior. However, designing an effective IDS for in-vehicle CAN bus is challenging. First, designing an IDS for in-vehicle CAN bus with high enough precision is challenging. Since vehicle manufacturers usually use private communication protocols for in-vehicle communications, it is difficult to distinguish attacks from semantics. If an IDS does not have a high enough precision and recall rate, the majority of the attacker’s attacks will be successful. Second, it is difficult to achieve the real-time requirement with limited computational resources [8]. The CAN bus generates a large volume of data from various ECUs in real time. An effective IDS for the CAN bus needs to handle this large amount of data throughput without introducing significant latency or impacting the real-time nature of the communication. In addition, ECUs in vehicles typically have limited computational resources, including processing power, memory, and energy. This constraint makes it challenging to implement resource-intensive IDS techniques on these ECUs.
Existing IDSs face challenges in achieving high precision without incurring high computation costs or requiring extensive modifications to all ECU modules. For instance, neural network-based methods like DCNNs (Deep Convolutional Neural Networks) [9] demand significant computational resources and parameter storage, making it difficult to meet real-time requirements. IDS approaches based on physical layer ECU fingerprint features [10] or zero-byte CAN frames [11] necessitate additional controllers and/or receivers for each ECU. On the other hand, lightweight and easy-to-deploy IDS methods often sacrifice accuracy and recall. Statistical methods may offer low computation costs [12], but they overlook the time series characteristics of data, limiting their effectiveness across all attack types. For instance, a method relying on the Hamming distance for fuzzy attack detection demonstrates only a 20–30% accuracy rate, lacking robustness.
To overcome the above-mentioned challenges, we propose, in this work, a novel windowed Hamming distance-based IDS for the CAN bus. Our method utilizes the sliding window’s characteristics and Hamming distance to extract features from the time series data. By leveraging window-based detection methods, the robustness of the approach in detecting injection attacks is enhanced. Our experimental results demonstrate the reliability of our model, showcasing its effectiveness in detecting various types of attacks. Specifically, we achieve an impressive accuracy of 99.67% and 99.61% F1-score (FS) in identifying Denial-of-Service (DoS) attacks. For fuzz attacks, our method attains a detection accuracy of 98.66% and an FS of 98.02%. With detection accuracies of 99.48% and 99.61% for the two types of spoofing attacks considered, the corresponding FS values for these attacks reach 99.27% and 99.48%, respectively. Furthermore, our method achieves a detection time of only 0.37 ms per individual data frame. Compared with the deep convolutional neural network (DCNN) [9] method, the time complexity is optimized by nearly 20 times, and the memory footprint is reduced by at least 1000 times, proving its suitability for real-time detection. The accuracy rate is improved by 3.49% when compared to other sliding window methods [13]. We demonstrate the portability of our model by utilizing datasets collected from different vehicles.
Throughout this paper, we make the following specific contributions:
  • We design a method based on windowed Hamming distance, which is lightweight and effective. The data transmitted over the CAN bus exhibit periodicity and a consistent time interval. To establish a baseline, we create benchmark windows that encompass at least one cycle of data. We then compare each newly generated window to all the recorded benchmark windows using the Hamming distance. By comparing the calculated distances with a predefined threshold, we can determine whether the vehicle is in a potentially dangerous state. Due to the design of the sliding windows, our method exhibits enhanced robustness. Moreover, our approach has the capability to identify the detected attack types to a certain extent.
  • We test our method on two datasets, one is a public dataset from car-hacking [14] and the other is our own dataset collected by CAN bus tool USB CAN-2E-U in an autonomous Xiaoyu 2.0 bus produced by Yutong company. We conduct extensive tests on these two datasets, demonstrating the applicability and effectiveness of our IDS. During the experimental phase, we identify the optimal combination of hyperparameters that yields favorable detection performance. Experimental results affirm that our method has strong detection capabilities for DoS attacks, fuzzy attacks, and two types of spoofing attacks, reaching an average accuracy of 99.36% and FS of 99.1%, respectively. We measure the detection time for only 0.37 ms.

Organization

The remainder of this paper is organized as follows. Section 2 reviews the related work. Section 3 provides necessary background information about the CAN bus and attack models. Section 4 describes the proposed windowed Hamming distance-based IDS. Section 5 presents the experimental result. Section 6 discusses limitations and future work. Section 7 concludes this paper.

2. Related Work

In the era of rapid Internet development, automotive CAN buses are becoming increasingly susceptible to attacks. For example, the identifier (ID) information of the vehicle is obtained by the attacker through reverse engineering so as to control the entire vehicle [15] or through injection attacks, which make the brakes of the vehicle fail, the engine act abnormally, etc. [4,6,16]. In [6], the researchers use cyberattacks which triggered the recall of 1.4 million vehicles. Hence, it is an urgent mission to add a security mechanism to the CAN bus.
The solutions to the problems are divided into two types, namely IDS and MAC [17,18,19,20]. For example, in [20], the author proposes a new authentication protocol, MAuth-CAN, that is secure against spoofing attacks. Unfortunately, there are some serious problems with this strategy, such as its impact on performance; most of MAC methods impose a burden on the CAN bus load [11].
Existing IDSs are basically divided into neural network methods [14,21,22,23,24,25,26,27,28,29,30], traditional machine learning methods [31,32,33,34,35], and other efficient statistics methods that utilize the characteristics of the CAN bus [10,13,26,36,37,38,39,40,41,42,43,44,45,46]. In the methods related to neural networks, as in Refs. [14,22], Generative Adversarial Network (GAN) and Long Short-Term Memory (LSTM) methods, two neural networks commonly employed for generation and prediction, are used, respectively, to build an autoencoder to reconstruct new data by learning normal behavior data. They analyze the variances between the reconstructed data and the original data to detect attacks. In [23] Xiao, Liang et al. build a reinforcement learning model against Spoofing attacks using electrical signals from the ECU’s physical layer. In [26], Song et al. use their own simplified Inception-ResNet to obtain amazing results on the CAN bus. The disadvantage of the deep learning method is also obvious, namely in that it cannot meet the requirements of the hardware environment of the vehicle.
In contrast, the time and space complexity of traditional machine learning and other methods that utilize the characteristics of the bus is not very high, which is more practical and can be used in real vehicles. Kang et al. [37] find that the ID has a certain fixed pattern between the loops of an ID. When the car is attacked, the injected data change the inherent pattern between the ID loops. This technique is used primarily for injection assaults to determine whether it has been invaded. However, the study’s results show that this method’s accuracy is only 93.5%. Li, Xinghua et al. [32] propose a machine learning method named support vector domain description (SVDD) and, combined with Markov chains, realize IDS. SVDD is a one-class SVM model; it only needs to learn normal data so the data within its range are not considered abnormal data. In the study conducted by Alalwany et al. [34], the researchers propose the utilization of ensemble methods with Kappa architecture for detecting attacks. However, their method falls short in terms of detection efficiency, with an accuracy of 98.5% and an F-score of 98.5% when compared to the performance of our method.
Certainly, each ID has an almost fixed frequency is an important characteristic of the CAN bus. In studies [26,39,40], researchers use the frequency or time interval methods of ID to detect attacks. When an injection attack occurs, the frequency or time interval of the ID varies, so this is a useful characteristic. Tian, Daxin et al. [31] propose the gradient boosting decision tree (GBDT) model to classify each frame. In [41,42], the authors also use entropy to measure IDS and define the threshold by calculating the entropy change in a fixed ID. The above methods determine whether each packet is a normal packet or not according to CAN bus characteristics. This approach is somewhat contingent, and sometimes it loses the CAN bus time series characteristics.
Correspondingly, the window-based method is more robust. Derhab, Abdelouahid et al. [13] propose the framework for assembling CAN frames into windows and computing their corresponding histograms. It is fed into a multi-class IDS classifier to identify classes of traffic windows. Window-based detection approaches are more robust than packet-based approaches. They capture more robust features and relationships between packets within a window.
This paper uses a window-based detection method combined with the Hamming distance method. Compared with the method that only applies the Hamming distance [12], we use the characteristics of time series to make the model more robust. According to the results of the experiment, the detection effect of our method is also more excellent.

3. Background and Attack Model

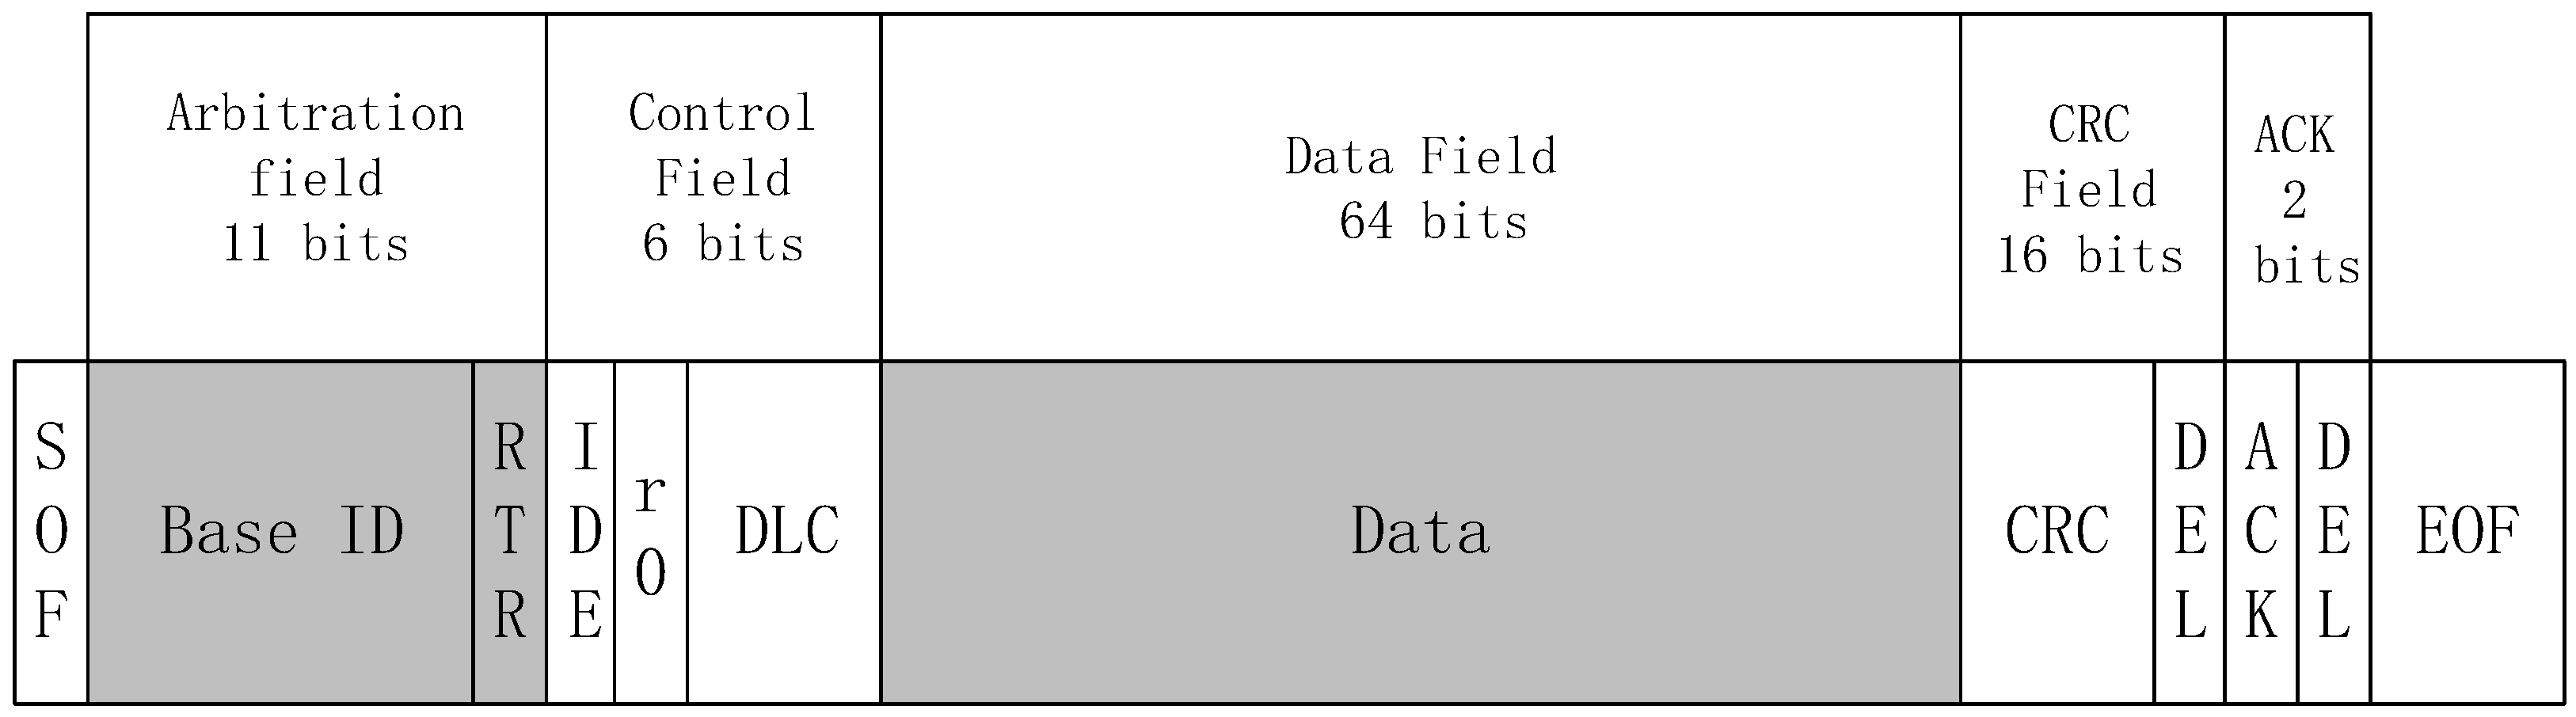
3.1. Background of the CAN Bus

The CAN bus is a multi-master communication protocol based on message passing. The CAN bus was developed by Robert Bosch GmbH and officially published in 1986. The latest specification for the CAN bus is CAN 2.0, published in 1991 [47]. The composition of the CAN bus data frame also follows a certain fixed structure.
The field format of the data frame is shown in Figure 1. The seven segments of the data frame are the following:
  • Start of Frame (SOF): 1 bit, indicating the start of a new data transmission.
  • Arbitration field (ARBITRATION FIELD): 11 or 29 bits, in the CAN 2.0A standard [48]; this field is composed of 11 bits and serves to indicate the purpose of the data frame while also facilitating the CAN network’s arbitration mechanism.
  • Control segment (CONTROL FIELD): 6 bits, including remote transmission request (RTR), extended format flag (IDE), reserved bit (r0), data length code (DLC), and other information.
  • Data field (DATA FIELD): 64 bits, containing the actual data to be transmitted.
  • CRC segment (CRC FIELD): 16 bits, including cyclic redundancy check code and CRC delimiter.
  • Acknowledgment segment (ACKNOWLEDGEMENT FIELD): 2 bits, including the acknowledgment slot and the acknowledgment delimiter.
  • End of frame (EOF): 7 bits, indicating the end of a data transmission.
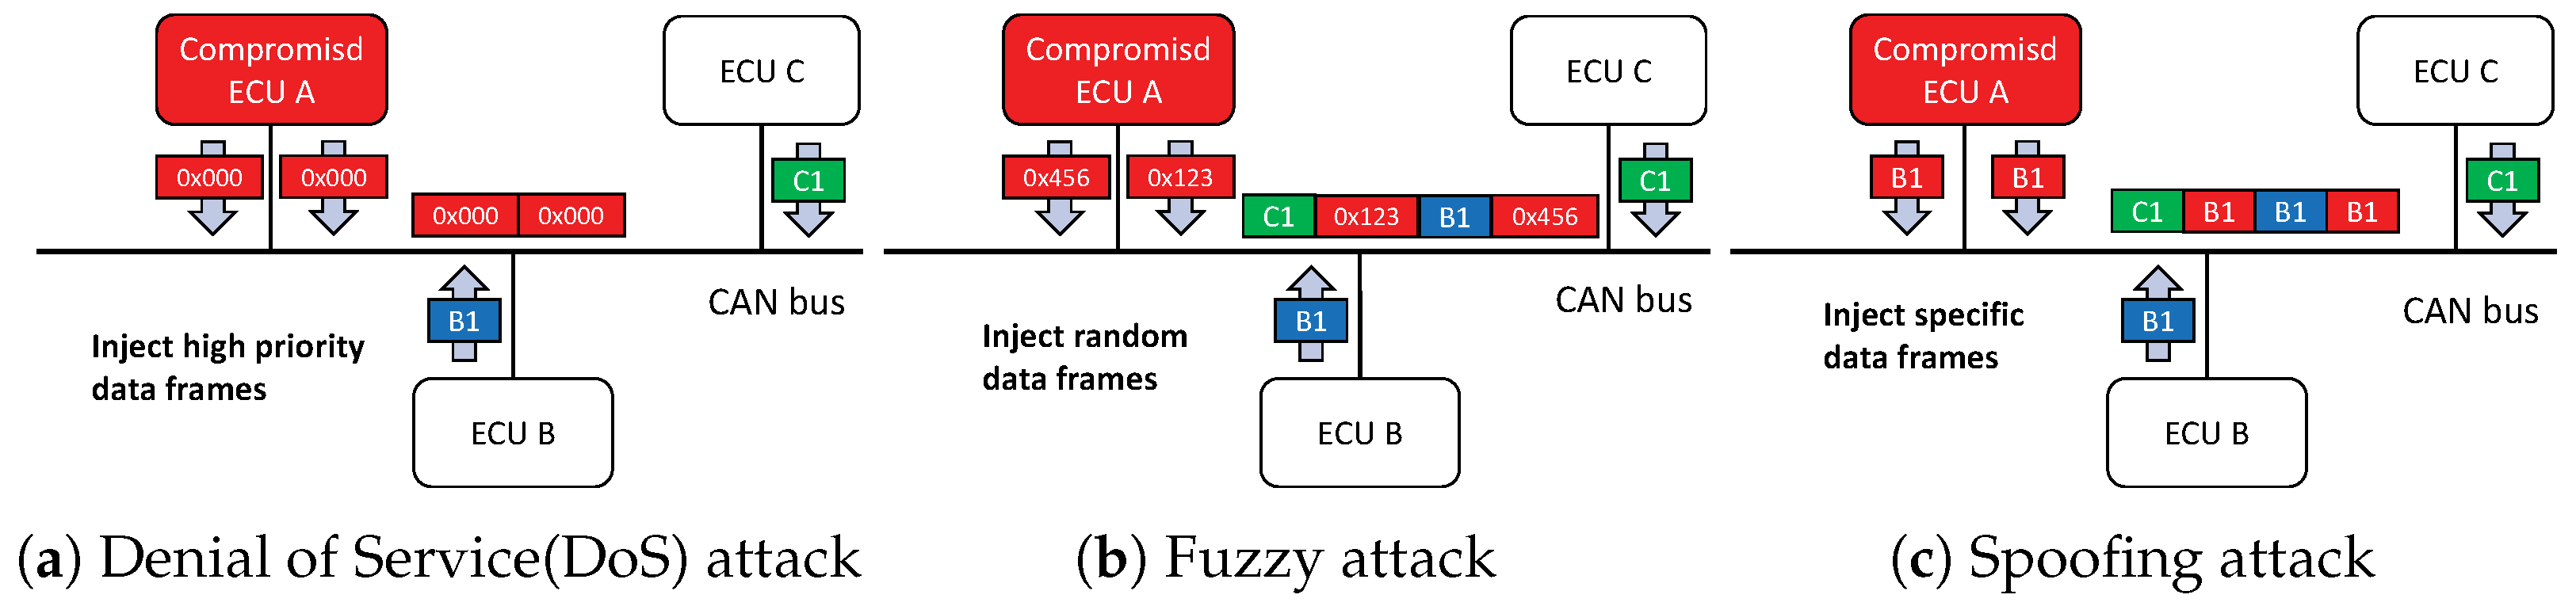
According to the description of the CAN frame, our experiment obtains the information from the ID and data fields because according to the role of this frame represented by the ID, the data field represents the specific data transmitted. These two fields are the ones that contain the most information.
Packets are broadcast to the entire network on the CAN bus, keeping the system consistent as a whole. But because the CAN bus lacks a security mechanism, the ECU can receive all the information on the bus without message authentication. As a result, when the attacker gains access to the bus to transmit messages in some way, the ECU is unable to distinguish between messages coming from the attacker and messages coming from the bus, and is thus tricked by the attacker to control the vehicle.
At the same time, the message arbitration mechanism of the CAN bus is also used to cause DoS attacks. When several ECUs send messages at the same time, it is determined which node has the highest priority by comparing the ID sent by each node so as to obtain the control right of the bus. The arbitration mechanism of the CAN bus is non-destructive; that is to say, during the arbitration process, no node loses data due to losing the arbitration. When an ECU sends zero, it achieves higher priority. Therefore, the node with a smaller ID has a higher priority and thus obtains control of the bus.
The ID of the CAN bus follows a fixed time interval, which may introduce some delays due to conflicts, but generally maintains a consistent timing pattern. Additionally, the transformation of the data area also follows certain rules. This paper also uses this feature because this property makes the data in the window have certain regularity and increases the robustness of the model.

3.2. Threat Model

In this work, we consider three different injection attacks which are considered as the most possible attacks based on vehicle vulnerabilities [5,7,10]. Figure 2 shows a schematic of the three attacks.

3.2.1. DoS Attack

A DoS attack is an attack method that utilizes the message priority of the CAN bus for arbitration. Its purpose is to occupy the resources of the target bus by frequently sending high-priority messages (0x000) to the target bus and to increase the bus load rate so that other normal packets cannot be transmitted. This affects the normal response of the car’s electronic system, and even causes the car to lose control. In the car-hacking dataset, the DoS attack packets are injected into the CAN bus at a time interval of 0.4 ms, with an interval of 10 s. For a period of time, the CAN bus is filled with a large number of DoS attack packets, so that our model can perform detection better.

3.2.2. Fuzzy Attack

Fuzzy attack means that the attacker actively sends a large number of random or forged data frames to the CAN bus, causing network congestion or arbitration failure, affecting the transmission of normal messages. In the car-hacking dataset, the active attack mode is used, the fuzzy data packet is constructed randomly with the ID from 0x000 to 0x7ff, and the fuzzy attack packet is injected into the CAN bus at an interval of 0.3 ms, with an interval of 10 s. Total data collection lasts 5 min.

3.2.3. Spoofing Attack

This attack uses a large number of injected specific IDs to deceive a specific ECU. When an attacker spoofs the key components of the vehicle, it brings great security risks to the driver and passengers in the vehicle. The dataset we use performs this attack on two key parts (gear and rpm). The pre-set data frames are continuously injected into the CAN bus, and various states such as the dashboard of the car are found to change, which illustrates the danger and feasibility of this attack. In the Spoofing attack, each time interval is 2 ms, and we inject CAN IDs 0x316 and 0x43F to the bus, corresponding to gear and rpm, respectively, for 10 s.

4. Proposed Methods

4.1. Work Objectives and Hypothesis

To address the imbalance between time consumption and detection performance observed in previous work, the primary goal of this study is to develop a lightweight intrusion detection method capable of effectively detecting common injection attacks in vehicular networks. Achieving a balance between detection performance and resource efficiency is of utmost importance. In this paper, the Hamming distance method and the sliding window technique are employed to extract the temporal sequence features of CAN network data streams for detecting common and highly impactful injection attacks. This approach can be seamlessly integrated into the CAN network as an additional device or deployed directly on an existing ECU.
Similar to previous works, we assume the attacker can already physically access the CAN bus via the OBD-II port or via Bluetooth, WiFi, etc., and the attacker has some knowledge of some CAN bus protocol contents.

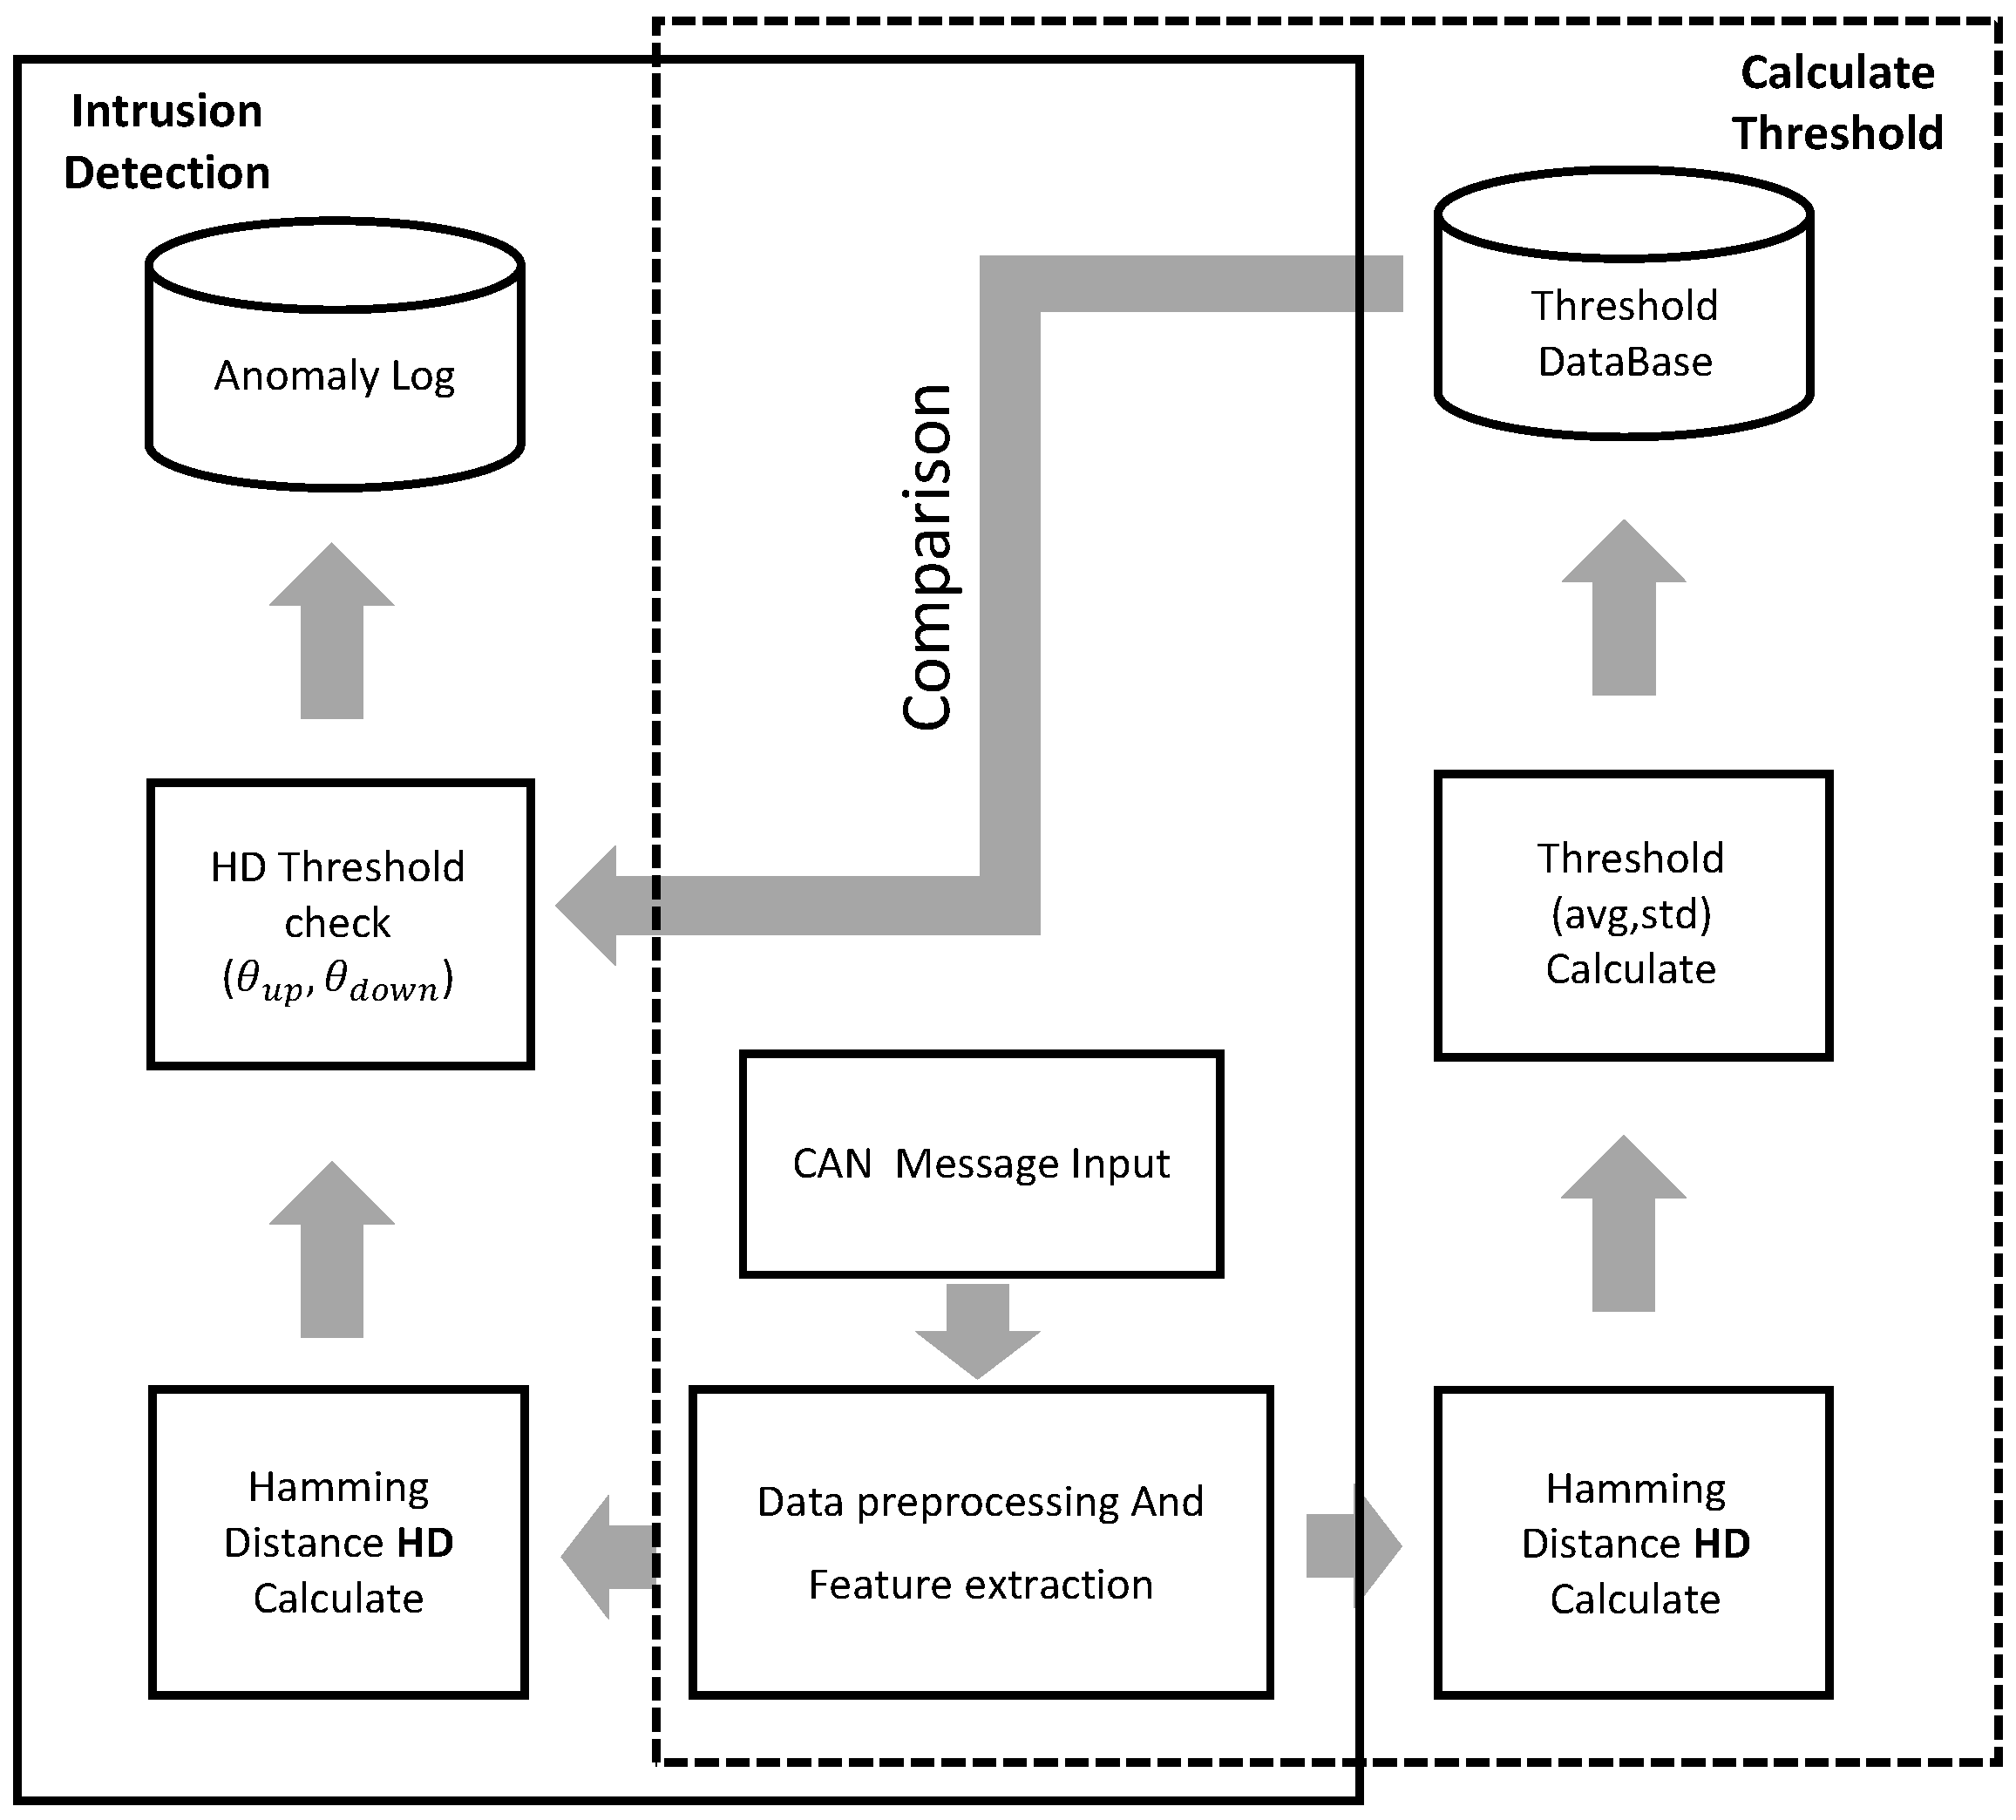
4.2. Overview of Our Proposed Methods

We present an overview in Figure 3 and provide an explanation of the method based on this diagram. In a normal CAN state, we divide the data into windows of size N K and store them for further analysis and comparison. Here, N denotes the number of windows, while K represents the size of each window. We utilize N windows, each with size K, to establish the reference state for normal vehicle behavior.
The system consists of two main modules.
The first module, referred to as the “calculate threshold” module (the dotted area in the figure), is responsible for determining the range of residual similarity in the normal state of the vehicle. During preprocessing and feature extraction, we collect CAN messages and convert them to binary while ensuring consistent message length. To establish the threshold range, we compute the similarity between a sliding window of size K and the data in the normal state. We then calculate the threshold using a three-sigma approach.
The second module, referred to as the “intrusion detection” module (the solid line area in the figure), is dedicated to detecting abnormal conditions using the threshold range obtained from the first module. In this module, we measure the similarity between the test data and the recorded sliding window. Subsequently, we compare the calculated similarity value with a predefined threshold to identify potential attacks.

4.3. Calculation of Threshold

In this section, we outline the method for calculating the detection threshold.

4.3.1. Hamming Distance

The Hamming distance [49] is employed to quantify the dissimilarity between two strings of equal length. It denotes the count of differing characters in corresponding positions between the two strings. The formula for calculating the Hamming distance is typically represented as follows in Equation (1), where x i and y i represent the binary values at the current position i. H d ( x , y ) represents the Hamming distance between the current binary strings x and y.
H d ( x , y ) = i = 1 k | x i y i |
In this paper, we propose a modification to the Hamming distance by transforming it into a normalized value between 0 and 1 using Equation (2). Numerator H d , j ( x , y ) corresponds to the Hamming distance calculated using Equation (1). In normal conditions, H d , j ( x , y ) represents the Hamming distance of the jth data frame within the window. Variable s u m represents the total number of bits in the current window. K represents the sum of frames in windows. From this, we calculate one of the Hamming distances within a window, denoted as p.
p = j = 1 K H d , j ( x , y ) s u m

4.3.2. Preprocessing of Data

Previously, we discussed the data structure of the CAN bus. For our current needs, we only require the ID, Data1, Data2, Data3, Data4, Data5, Data6, Data7, and Data8 fields. In the case of the normal dataset, we divide the data into windows and store the values of N windows of size K as our benchmark. These windows consist of the aforementioned fields from the CAN messages, allowing for us to establish a reference for normal behavior.
To ensure consistency in the data structure, for messages that do not have a length of 8 bytes, we append “00” at the end of the frame content. By doing this, we make all frames the same length, allowing for easier processing and analysis. Each window in our approach consists of K frames. These windows, derived from normal data, serve as the basis for calculating the threshold. The threshold range represents the expected variation in the vehicle’s behavior under normal conditions. It provides a measure of the difference between the normal state and potentially anomalous states. It is important to note that the magnitude of the threshold range can vary depending on the injected data by an attacker.

4.3.3. Calculation of Threshold

We employ Equation (3) to calculate the Hamming distance for a specific window. In the Equation, variable p i represents the Hamming distance between the current test set and the ith window, calculated using Equation (2). Variable N represents the number of recorded windows. By computing the means of the Hamming distances between the window and all benchmarks, we obtain the final Hamming distance for that window. The value α i represents the final Hamming distance of the ith window. To calculate the threshold using the 3-sigma method [50], we need to find the value of a v g using Equation (4) and the standard deviation σ using Equation (5). In these equations, S represents the total number of windows used in calculating the threshold.
α i = p 1 + p 2 + + p N N
a v g = α 1 + α 2 + + α S S
σ = 1 S i = 1 S ( α i a v g ) 2
By using Equations (6) and (7), we can determine the upper and lower bounds of the threshold. According to the 3-sigma method, the value of ρ is typically set to 3. However, in specific models and datasets, the value of ρ can be adjusted according to the specific requirements.
θ u p = a v g + ρ σ
θ d o w n = a v g ρ σ
To illustrate the algorithm flow for threshold calculation, we provide Algorithm 1 below.
In Algorithm 1, Lines 2–8 represent the stage of establishing the benchmark partition window. In Lines 10–14, we iterate through each benchmark window, calculate the Hamming distance using Equation (3), and store the final Hamming distance values in list α s . This list contains the final Hamming distance values for all windows used for training. Lines 16–17 depict the calculation process where we compute the average Hamming distance a v g and standard deviation s t d . In the final stage, we calculate the upper and lower bounds of the threshold.
Figure 4 illustrates the distribution of Hamming distances and the threshold, representing the vehicle under normal conditions. From the figure, we observe that the majority of normal data points fall within the range defined by the upper and lower thresholds. This suggests that the threshold effectively captures the normal behavior of the vehicle. In our experimental results, setting the value of ρ to 3 has shown promising outcomes. However, further exploration and analysis will be conducted in the experimental section to validate and evaluate the effectiveness of this choice.
Algorithm 1 Calculate Threshold
Require: 
T r a i n D a t a s e t
Ensure: 
w i n d o w s , T h r e s h o l d u p , T h r e s h o l d d o w n
1:
w i n d o w s [ ]
2:
for packets in TrainDataset do
3:
   Combine K consecutive packets into a windows W;
4:
    w i n d o w s . a p p e n d ( W ) ;
5:
   if The number of windows is N then
6:
        b r e a k ;
7:
   end if
8:
end for 
9:
α s [ ]
10:
for packets in TrainDataset do
11:
   Combine K consecutive packets into a windows W;
12:
    H s g e t H a m m i n g D i s t a n c e L i s t ( W , w i n d o w s )
13:
    α g e t A v g ( H s )
14:
    α s . a p p e n d ( α ) ;
15:
end for
16:
a v g g e t A v g ( α s )
17:
s t d g e t S t d ( α s )
18:
T h r e s h o l d u p a v g + ρ × σ
19:
T h r e s h o l d d o w n a v g ρ × σ
20:
return  w i n d o w s , T h r e s h o l d u p , T h r e s h o l d d o w n

4.4. Intrusion Detection System

In this section, we discuss the methods for detecting attacks. We utilize the threshold-based approach described earlier to detect DoS, fuzzy, and two types of spoofing attacks. However, due to the unique characteristics of spoofing attacks, they do not significantly impact the normal data field. Therefore, we employ a signature-based method to calculate a specific signature threshold for detecting spoofing attacks. In a previous study [13], a combined approach of anomaly detection and signature-based methods was employed.

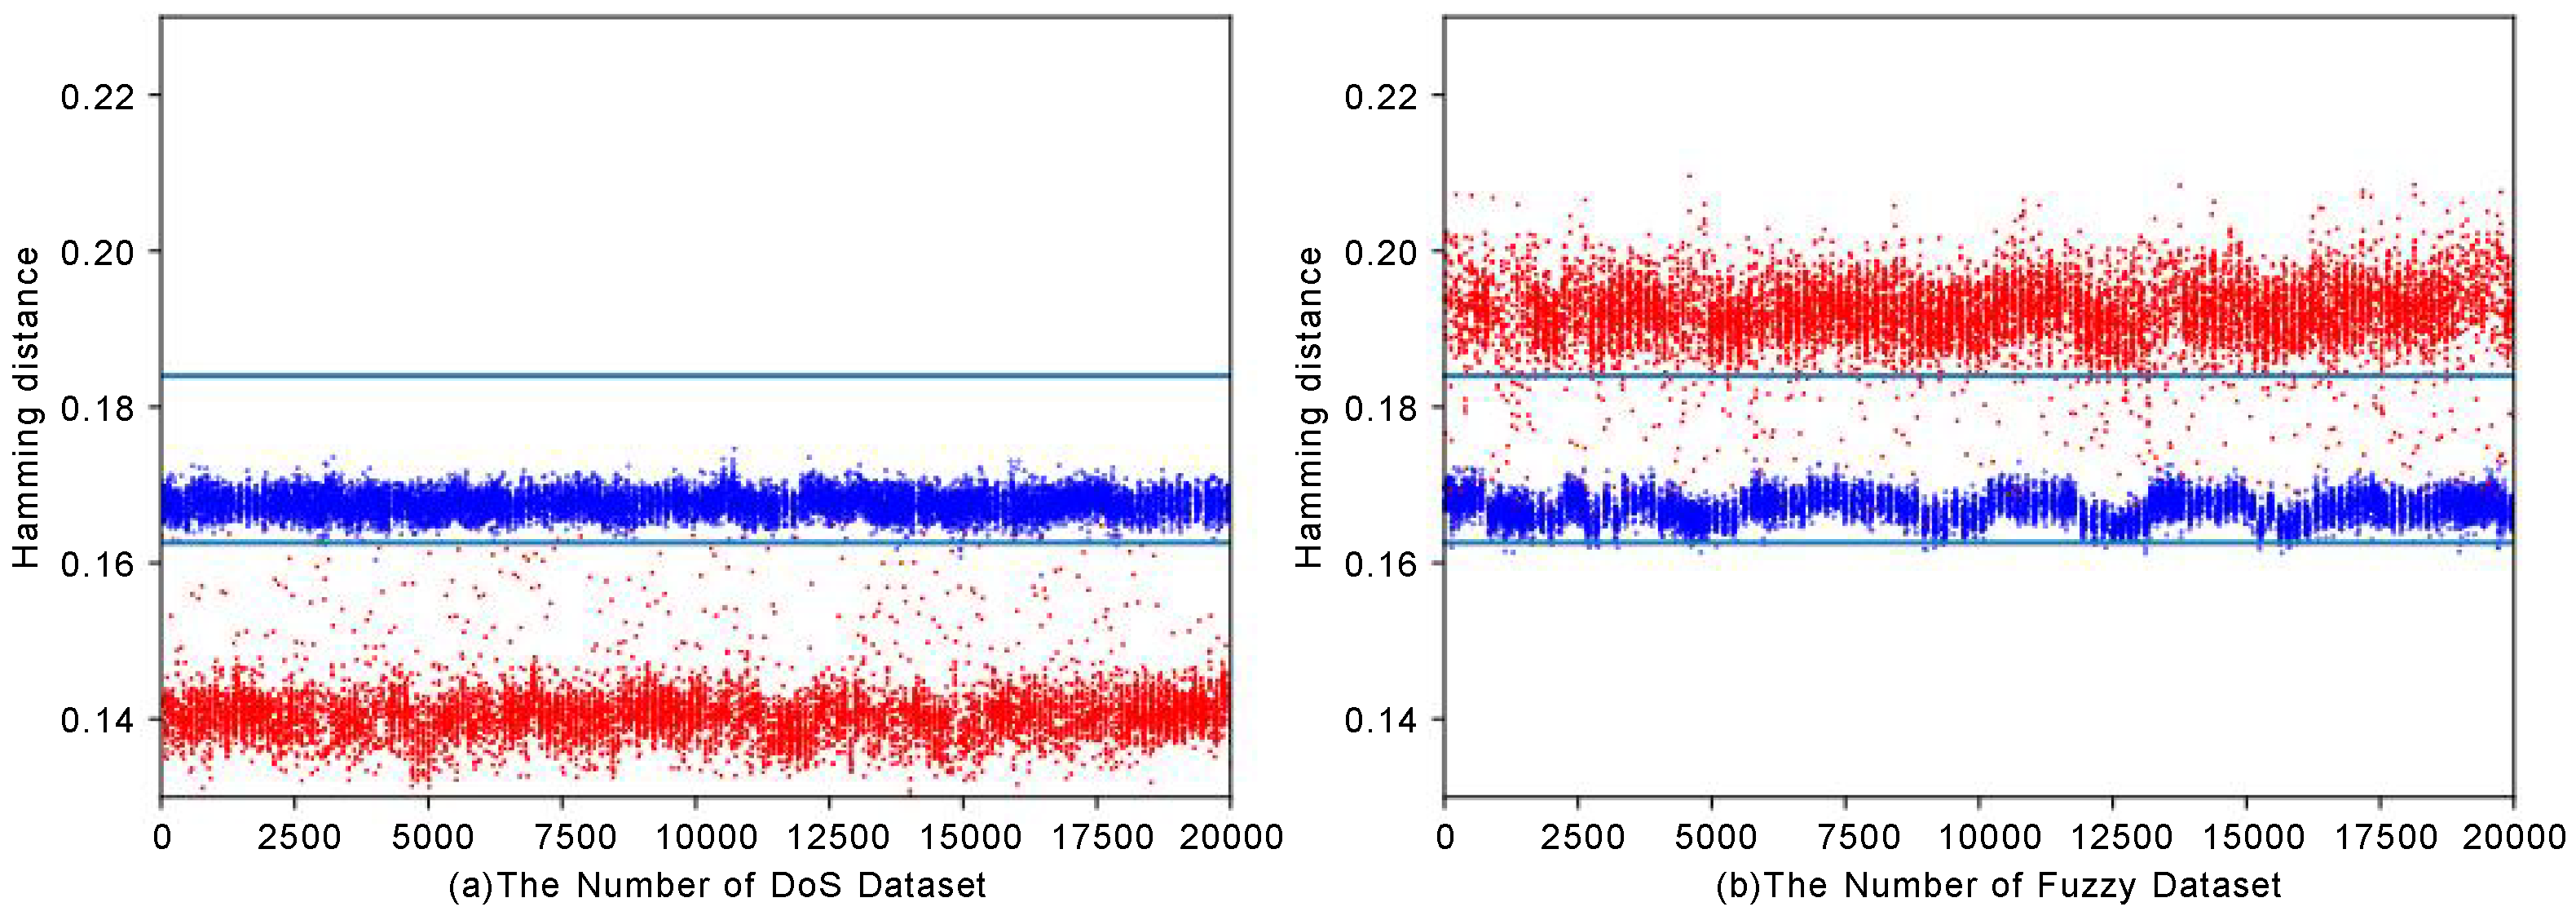
4.4.1. Detect of DoS and Fuzzy Attack

First, we discuss the detection of DoS and fuzzy attacks. DoS attacks involve the injection of a large number of high-priority data frames, which disrupt the normal transmission of data frames. On the other hand, fuzzy attacks entail injecting a substantial volume of randomly generated data frames. This results in the disruption and disturbance of various vehicle functions, leading to a state of chaos within the system.
In our approach, we gather K CAN frames to form a test window. Subsequently, we calculate the similarity between the test window and the normal state. This similarity measure is then compared against the threshold to detect DoS and fuzzy attacks. If it is not within the threshold, an alarm is triggered.
We illustrate the detection of two attacks in Figure 5. Specifically, Figure 5a illustrates the detection of a DoS attack, while Figure 5b demonstrates the detection of a fuzzy attack. The figure depicts the threshold and the distribution of data in two datasets. In this figure, the color blue denotes normal data, while red represents abnormal data. We observe that the blue points are concentrated within the threshold range, while the red points are predominantly located outside the threshold. Notably, the Hamming distance for DoS attacks is found to be below the threshold. Conversely, the Hamming distance for fuzzy attacks exceeds the threshold.
By comparing the calculated Hamming distance with the threshold, we can determine the type of attack based on whether the distance is above or below the threshold. This comparison serves as an attack fingerprint, allowing for us to classify and identify the specific type of attack. Additionally, in the case of zero-day attacks, if they induce significant changes in the data field beyond the threshold range, our model is capable of detecting them.

4.4.2. Detection of Spoofing Attack

In this section, we outline the detection of spoofing attacks. Spoofing attacks involve the injection of a significant number of data frames with specific IDs. As a result, the proper functioning of key ECUs within the vehicle can be compromised. Spoofing attacks aim to deceive the system and disrupt the normal operation of the vehicle by introducing malicious data frames with altered content. We examine two types of spoofing attacks that specifically target critical components of the vehicle: gear and rpm. Both attacks are executed using a similar methodology, with the distinction lying in the specific components they target.
Due to the unique characteristics of spoofing attacks, we establish specific thresholds and benchmarks for these two attack types. Our method is similar to that of study [13] that combines signature-based and threshold-based methods. The signature-based method involves creating signatures for known attacks, and since our dataset already contains these two attack types, we can easily define signatures for them.
However, the benchmark for spoofing attacks differs. We consider the data from the vehicle when subjected to these two types of spoofing attacks as a benchmark and utilize these attack data to compute similarity. Unlike the detection of DoS and fuzzy attacks, where the similarity measure is compared against a threshold, in the case of spoofing attacks, if the computed similarity measure falls within the threshold range, it indicates the occurrence of a specific spoofing attack. We can differentiate between the types of spoofing attacks based on thresholds.
We illustrate the detection for two attack types in Figure 6. Specifically, Figure 6a illustrates a spoofing attack on gear, while Figure 6b represents a spoofing attack on rpm. Similar to above, in both figures, the blue color is indicative of normal data, while the red color signifies abnormal data. However, for detecting spoofing attacks, the attack data fall within the threshold range, whereas the normal data lie outside the threshold range. From the figure, it is evident that our method effectively distinguishes between normal data and attack data.

4.4.3. Detection Process

In this section, we provide a detailed description of the intrusion detection process. The algorithm flow is presented in Algorithm 2. The algorithm takes the test data, base values, and thresholds as input.
In Lines 3–6, the algorithm computes the Hamming distance for the test data. Lines 7–16 outline the detection steps of our algorithm. We compare the Hamming distance with the first threshold to identify DoS and fuzzy attacks. If the Hamming distance is below the threshold, it indicates a DoS attack; otherwise, it suggests a fuzzy attack. If the Hamming distance falls within the threshold range, we proceed to compare it with subsequent thresholds. If the Hamming distance falls within any of the thresholds, it implies the occurrence of the corresponding attack type. Otherwise, the data are considered normal.
Algorithm 2 Intrusion Detection System
Require: 
T e s t D a t a s e t , w i n d o w s , T h r e s h o l d u p , T h r e s h o l d d o w n
Ensure: 
i s A t t a c k
1:
w i n d o w s [ ]
2:
α s [ ]
3:
for packets in Dataset do
4:
   Combine K consecutive packets into a windows W;
5:
    H s g e t H a m m i n g D i s t a n c e L i s t ( W , w i n d o w s [ 0 ] )
6:
    α g e t A v g ( W , w i n d o w s [ 0 ] )
7:
   if  α not in range of T h r e s h o l d u p [ 0 ] and T h r e s h o l d d o w n [ 0 ]  then
8:
      return Attack;
9:
   end if
10:
   for Thresholds except for the first do
11:
      H s g e t H a m m i n g D i s t a n c e L i s t ( W , w i n d o w s [ i ] )
12:
      α g e t A v g ( W , w i n d o w s [ i ] )
13:
     if  α in range of T h r e s h o l d u p [ i ] and T h r e s h o l d d o w n [ i ]  then
14:
        return Attack;
15:
     end if
16:
   end for
17:
   return Normal;
18:
end for

5. Performance Evaluation

5.1. Experimental Environment and Dataset

Our experiments assess the performance of our model using two datasets. The first dataset is the car-hacking dataset obtained from the HCRL lab [14]. It is a labeled dataset captured from the OBD-II port of a real vehicle named Hyundai Sonata. This dataset comprises a total of three injection attacks: DoS attacks, fuzzy attacks, and two types of spoofing attacks.
The second dataset in our experiments is a proprietary dataset collected from real vehicles. We gathered this dataset using a CAN bus tool called USB CAN-2E-U on an autonomous bus named Xiaoyu 2.0, manufactured by Yutong Company. It is important to note that for this dataset, we did not collect any attack data. However, to evaluate the detection of DoS attacks, we simulated a DoS attack by injecting a large number of high-priority data frames into the CAN bus. The details of the two datasets are presented in Table 1.
The experiment is carried out on a PC (Windows 10 64-bit system, i5-9400f with six cores and six threads, main frequency of 4.10 GHz, memory of 8 GB) using the Python language.

5.2. Evaluation Criteria

Similar to any other study [51], for evaluating the performance of an IDS, the four commonly used metrics are accuracy, precision, recall, and F1-score, as shown in (8), (9), (10), and (11), respectively [52].
A c c u r a c y = T P + T N T P + T N + F N + F P
R e c a l l = T P T P + F N
P r e c i s o n = T P T P + F P
F S = 2 × P r e c i s o n × R e c a l l P r e c i s o n + R e c a l l
In our setting, if a normal is identified as a normal, it is considered a true positive (TP), otherwise it is considered a false positive (FP). Under normal circumstances, if an attack is considered to be an attack, it is considered a true negative (TN), otherwise it is a false negative (FN). We can represent these interpretations using a confusion matrix, as shown in Table 2.

5.3. Experimental Results

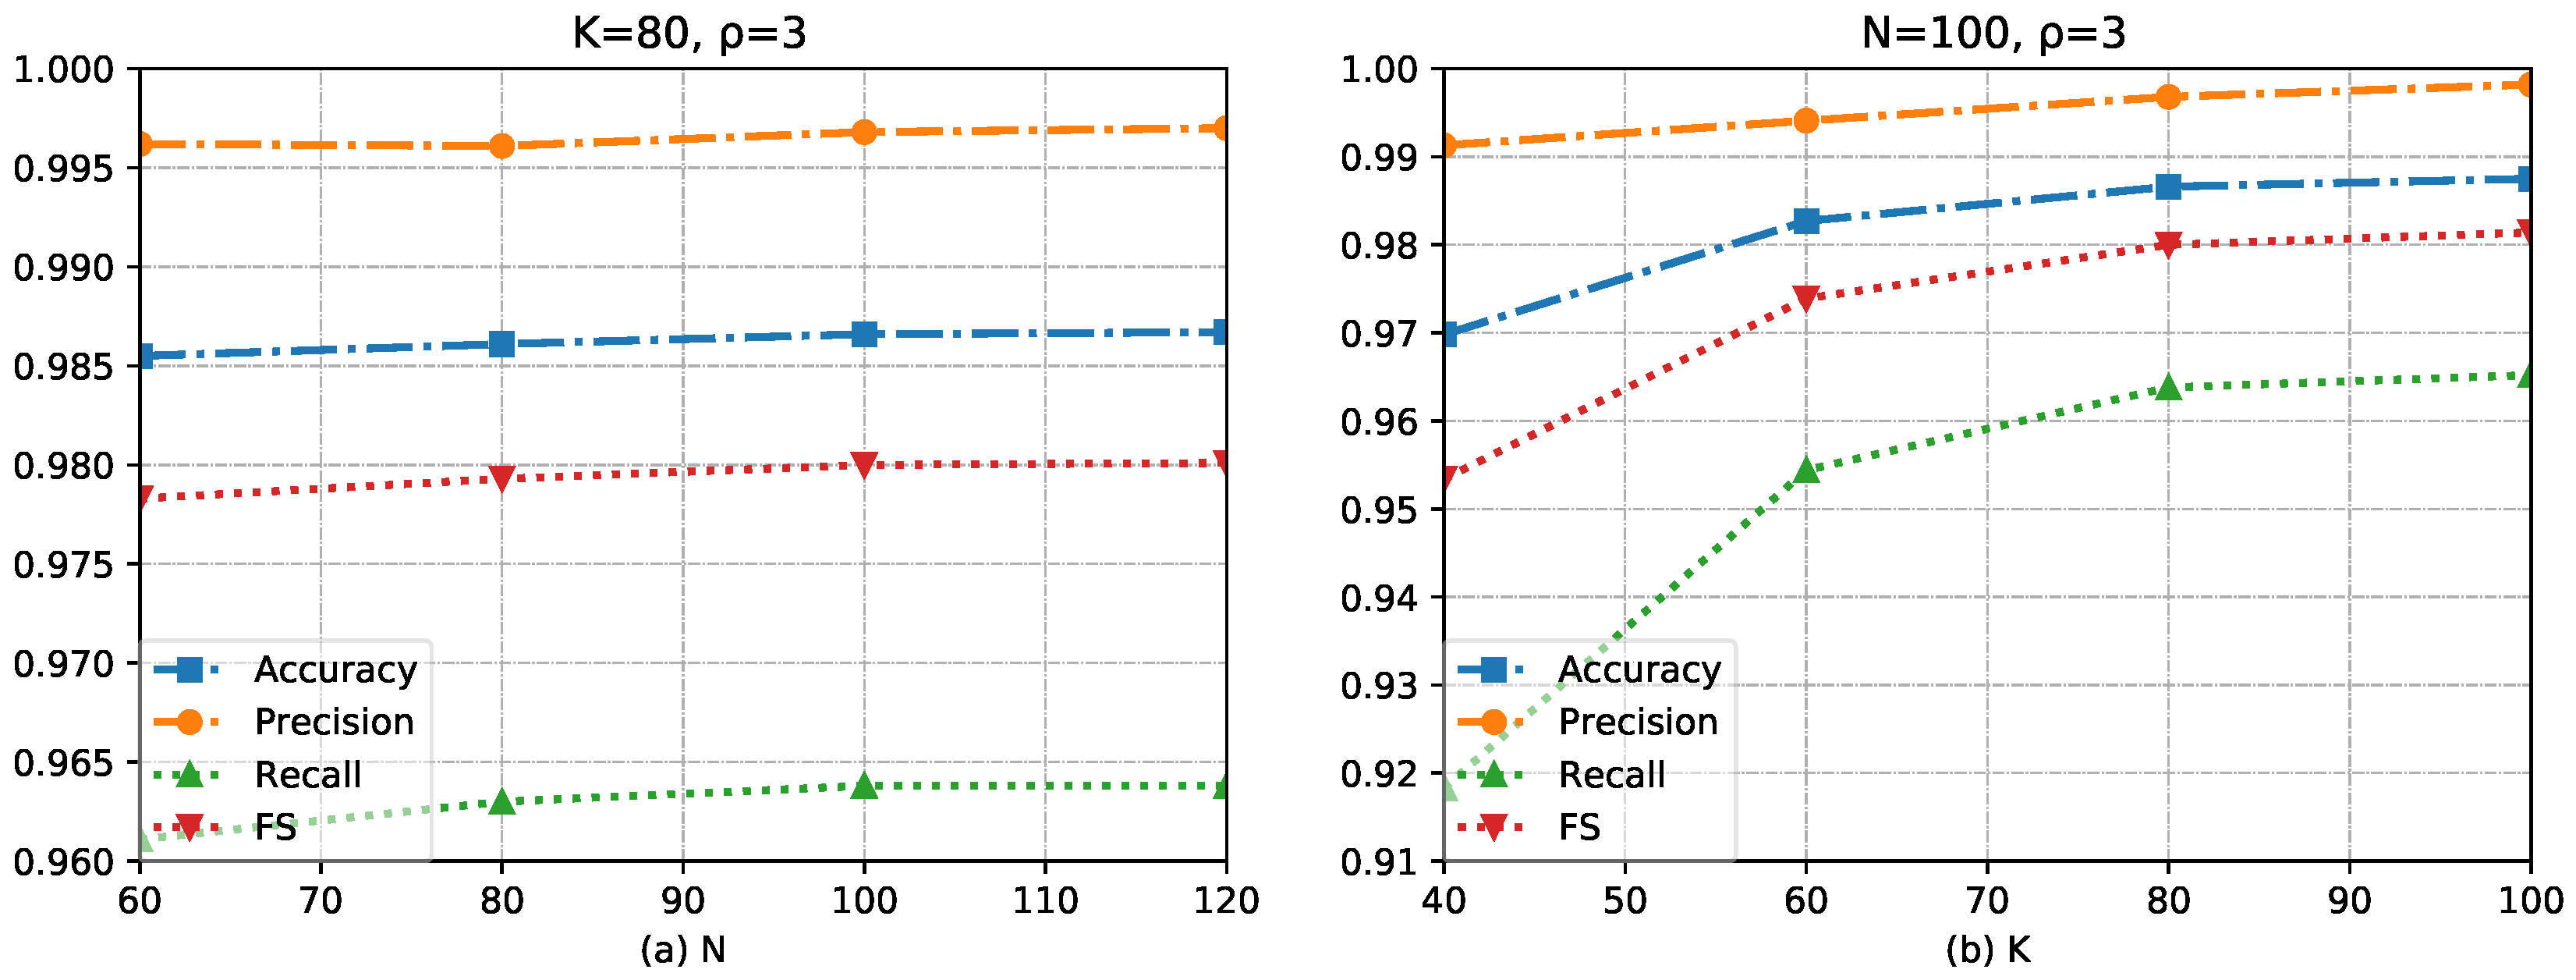
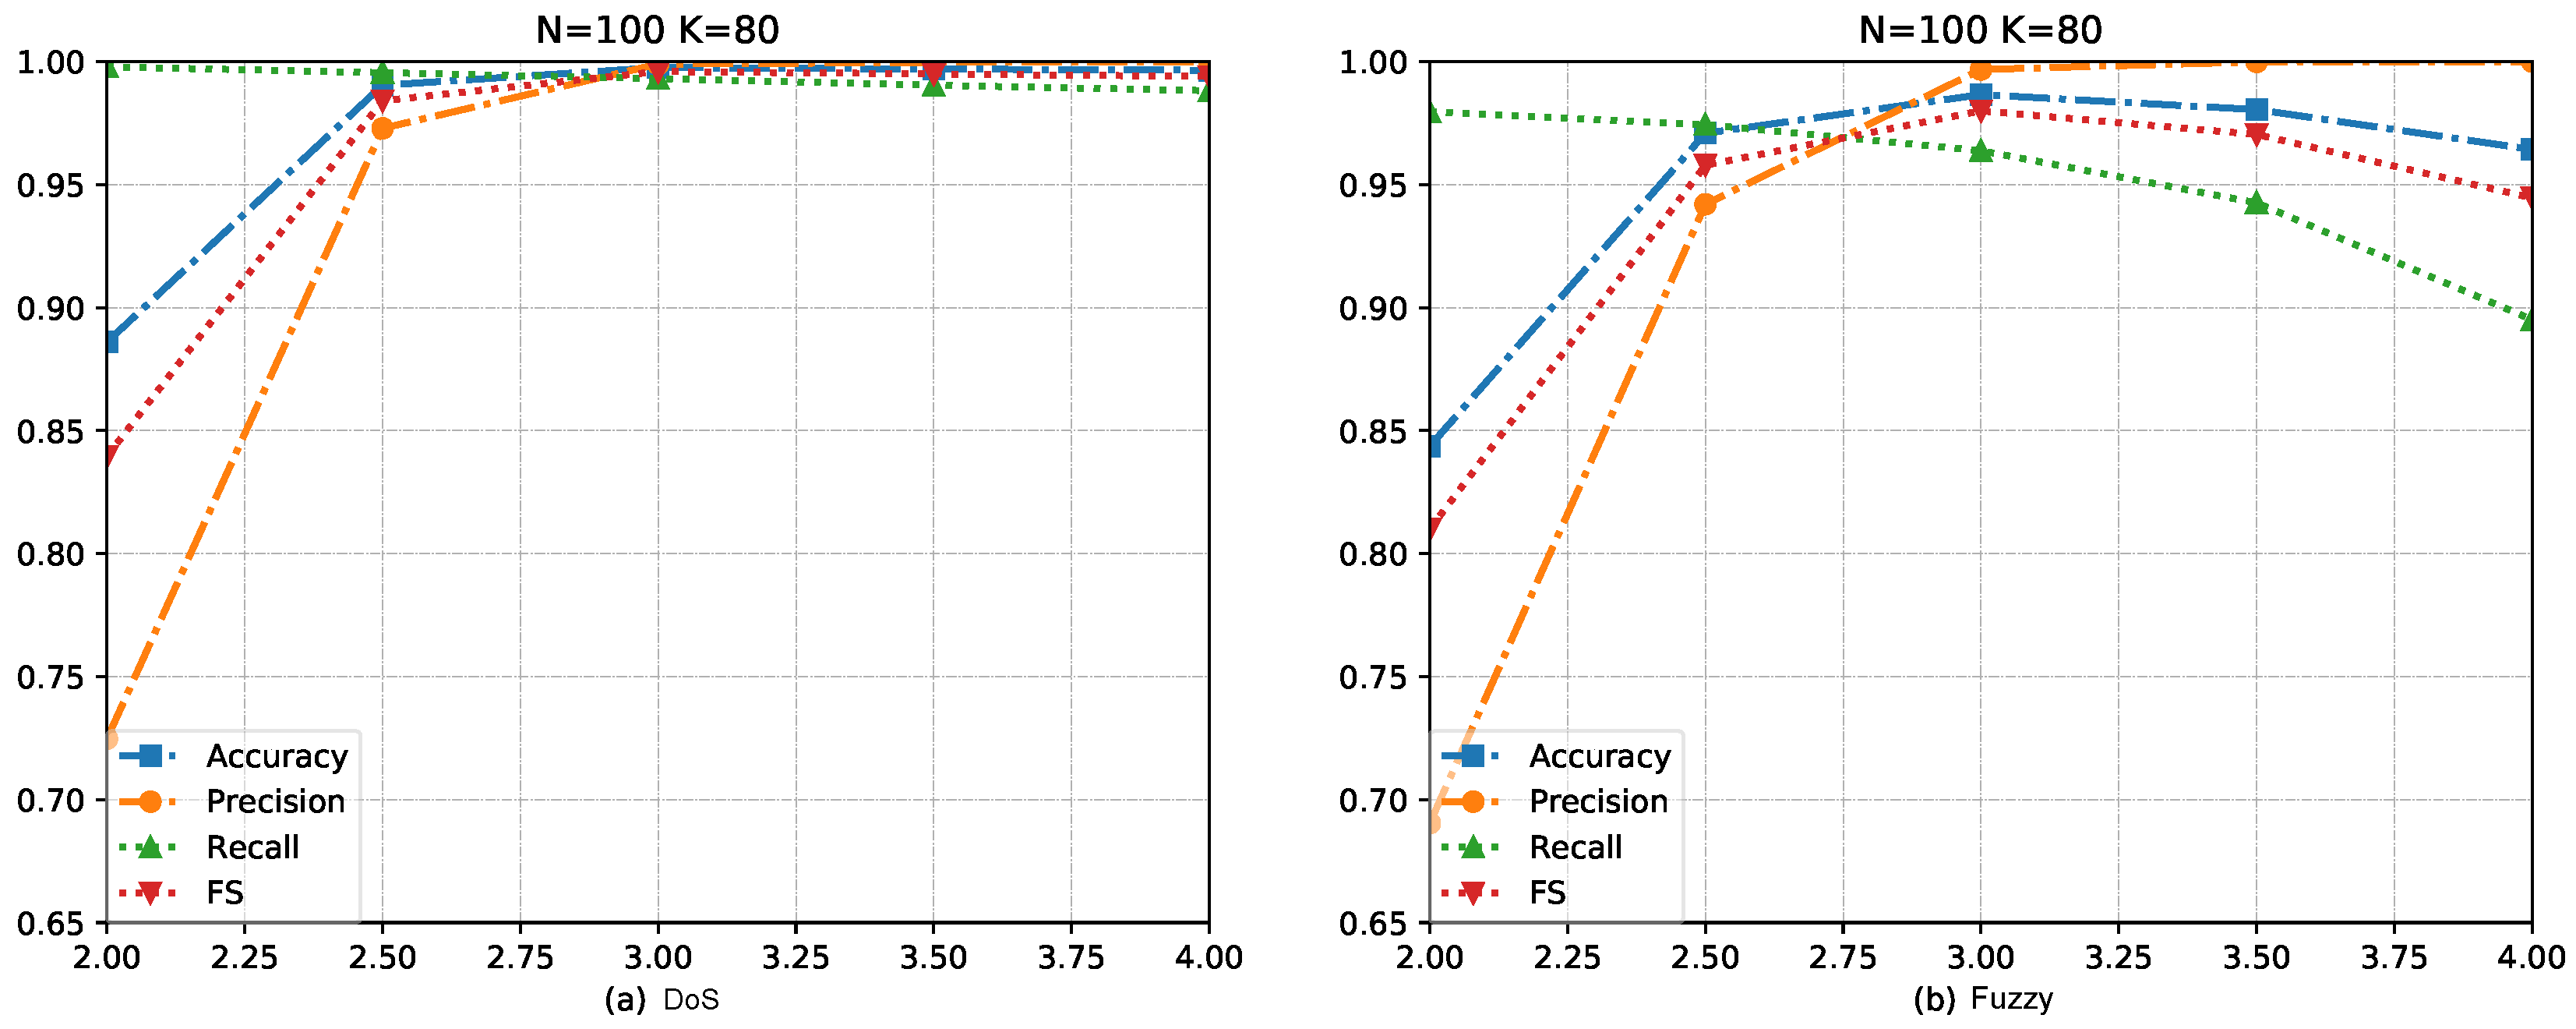
5.3.1. Effect of Hyperparameters

According to our proposed model, we need to discuss three hyperparameters. They are the number N of windows, the size K of the window, and the parameter ρ .
Parameters N and K determine the benchmark in our approach. We utilize this benchmark to establish and record the normal state of the vehicle. We take into account the fact that the vehicle’s normal state is represented by at least one full cycle of all of its IDs. Hence, the selection of N and K aims to ensure that the benchmark includes the car ID for at least one complete cycle. During the analysis of the car-hacking dataset, we conduct a categorization of all messages into five distinct groups based on the number of messages between two identical messages. The results of this analysis are presented in Table 3.
We observe that the interval between two occurrences of the same ID is consistently a multiple of 20. The minimum interval is 20 and the maximum interval is 2000. To ensure that our benchmark meets the required conditions, it is necessary for the benchmark to contain a minimum of 2000 frames. Therefore, when setting the value of K as the minimum interval of 20, the size of N should be at least 100 or greater. To enhance robustness, we increase the number of data frames included in the benchmark. For experimentation purposes, we select various parameter combinations of K and N, namely 40, 60, 80, and 100 for K, and 60, 80, 100, and 120 for N. We aim to identify the parameter combination that yields the best performance in terms of our evaluation metrics. As for the parameter ρ , we choose ρ = 3 based on the three-sigma principle.
We evaluate our optimal choice of N and K through the detection results of DoS and fuzzy attacks. The experimental result is shown in Figure 7 and Figure 8. Figure 7 illustrates the results obtained under a DoS attack, while Figure 8 presents the results obtained under a fuzzy attack. As it is an anomaly detection model, we pay more attention to the recall value and the FS value. The reason is that for the hacker’s attack on the vehicle, the harm of not detecting the attack frame is far greater than the false alarm of the normal frame. We can sacrifice a certain amount of precision under the condition of pursuing high recall.
In Figure 7b, we observe a higher recall value for detecting DoS attacks when the value of K is set to 60. On the other hand, in Figure 8b, a higher F1-score (FS) is achieved in the detection of fuzzy attacks when the value of K is set to 80. When the value of K is set to 80, we observe a decrease in recall for detecting DoS attacks. However, the FS shows only slight changes. Based on these observations, we believe that setting K to 80 would result in good performance for our method. We speculate that the possible reason for the decrease in recall is that in DoS attacks, as K increases, more attack data are required to decrease the Hamming distance below threshold. During the initial stages of an attack, the number of DoS frames injected may be insufficient to be detected, resulting in weaker detection capabilities during this period. The fuzzy attack demonstrates better resistance to this flaw, possibly due to its random nature.
As shown in Figure 7a and Figure 8a, it is shown that for detecting both DoS attacks and fuzzy attacks, the impact of N on the method’s performance is lesser when compared to K. This result could be attributed to the primary role of N, which is to enhance the method’s robustness. It can be observed that when the N is 100, the method exhibits a favorable performance in detecting both types of attacks.
Based on the analysis conducted above, the method yields outstanding results when the parameter values are set to K = 80 and N = 100 in the car-hacking dataset. The ρ determines the range of normal vehicle data. While the three-sigma rule suggests that ρ is optimal when set to three, we acknowledge that variations in the vehicle’s environment can lead to fluctuations in the car’s normal data. Hence, it becomes necessary to evaluate the impact of ρ . In Figure 9, we search for the optimal of ρ . Based on the figure, p significantly influences the accuracy of the method, particularly when ρ is set to two. This observation can be attributed to the fact that a smaller ρ may not encompass most of the normal data, leading to an increased number of false positives. Additionally, it is worth noting that an increase in ρ can also result in a decrease in recall. For instance, in Figure 9b, we observe a gradual decrease in the recall rate as the value of ρ increases. This phenomenon occurs because, as the threshold range expands, attacks that deviate only slightly from the normal state may remain undetected. Based on the observations, we can conclude that in this particular environment, the method achieved its optimal overall performance when the ρ was set to three.
We apply the same method to analyze the Xiaoyu dataset and observe that the majority of ID intervals in this dataset also exhibit a pattern of being multiples of 20, similar to car hacking. Therefore, we decide to conduct experiments on the Xiaoyu dataset using N = 100, K = 80, and ρ = 3. Our method requires a pre-analysis of vehicle data to select the values of N and K. Automobile developers have enough time and conditions to complete this task because the specific data are set by themselves.

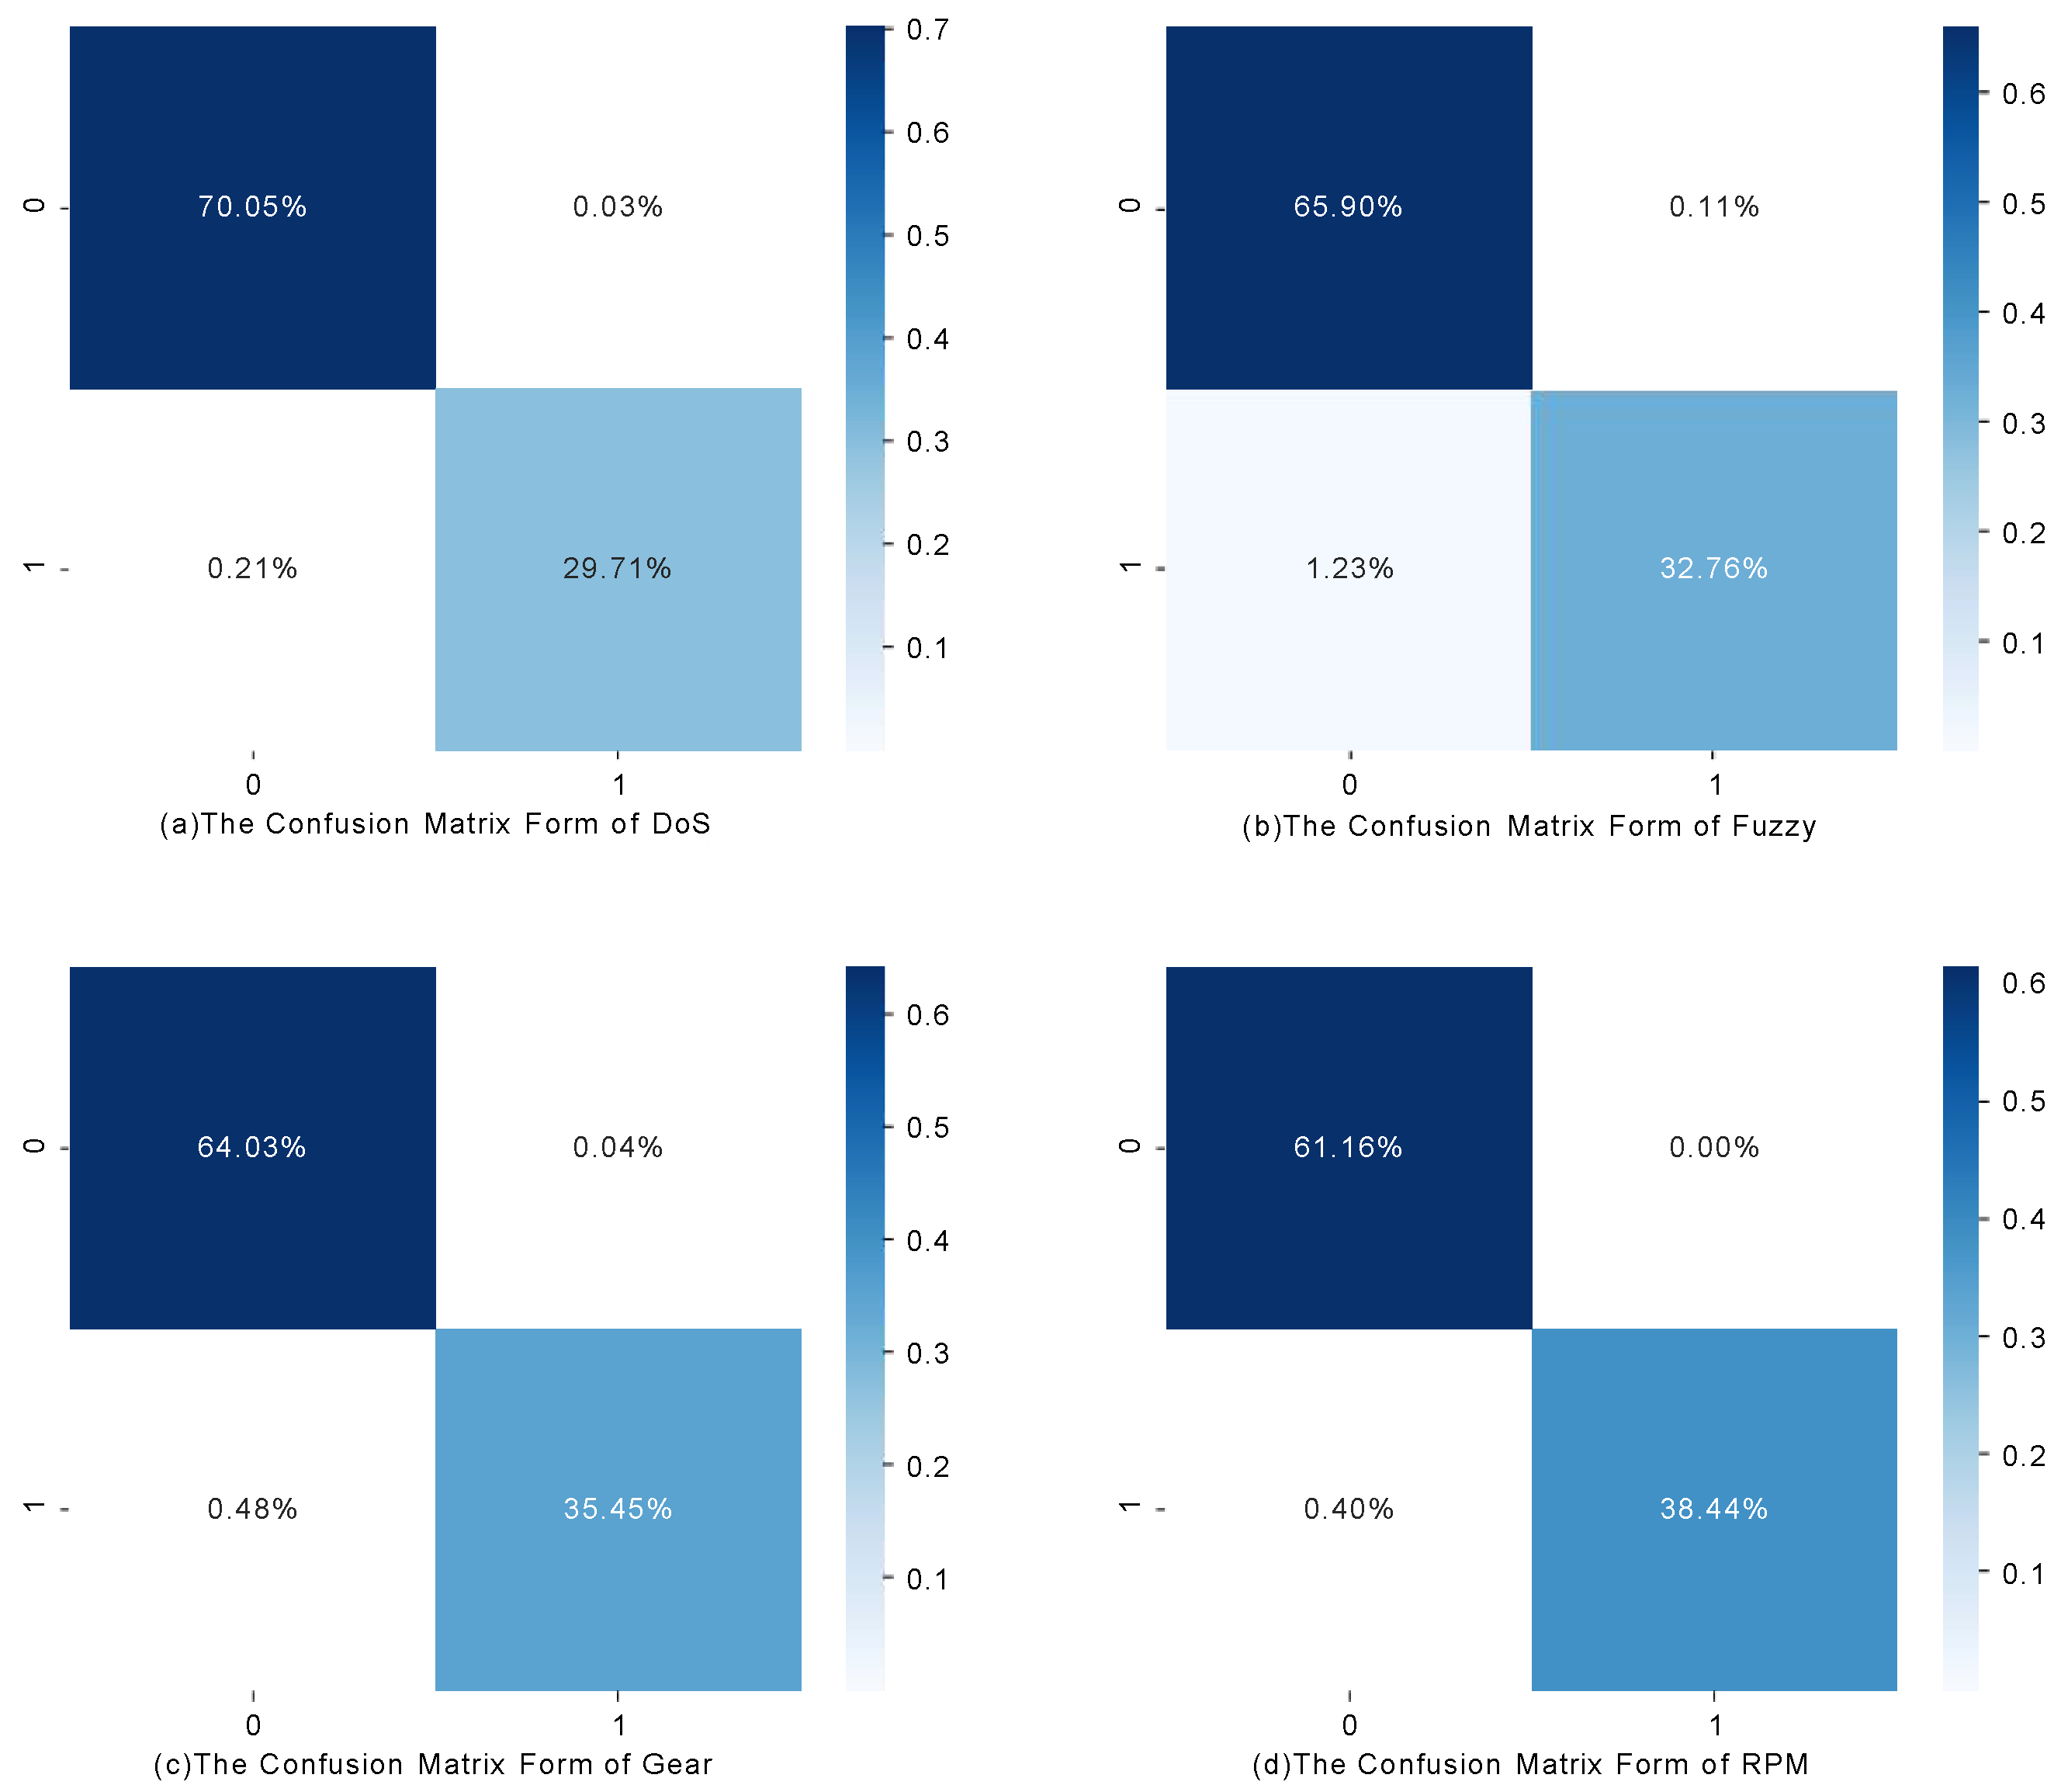
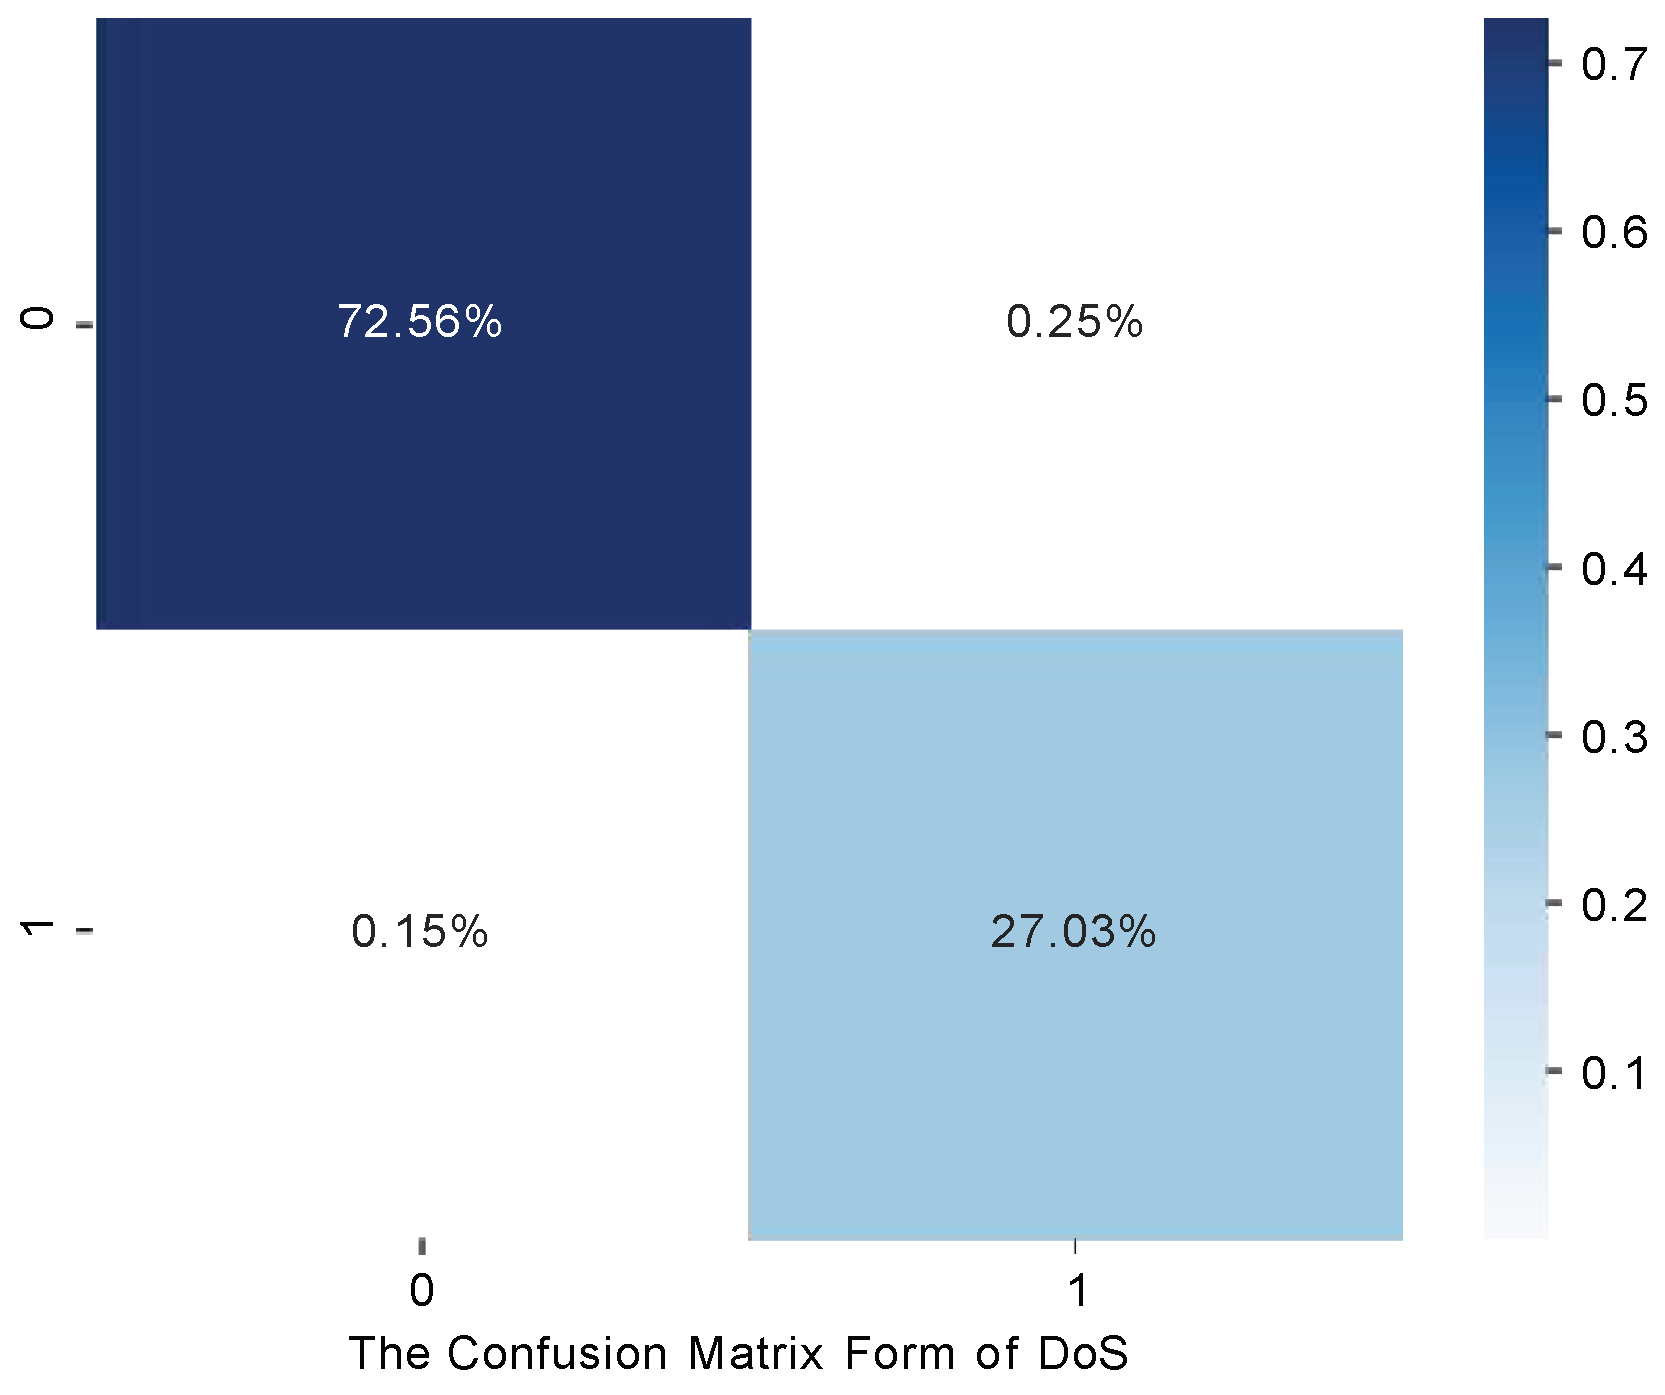
5.3.2. Result in Two Datasets

First, we experiment with our model on car hacking [14]. Figure 10 shows the results of four different attack types in the form of a confusion matrix. Table 4 presents the four evaluation criteria we selected in a tabular form.
Among the four evaluation metrics, accuracy reflects the method’s overall ability to accurately detect anomalies. Precision represents the method’s capability to correctly identify normal data, while recall measures the method’s effectiveness in detecting attacks. The FS provides a comprehensive assessment of the model’s performance by considering the detection of both normal data and attacks, thus capturing the overall effectiveness of the method in anomaly detection. In intrusion detection tasks, particularly in the context of automotive systems, the impact of a missed attack can be significant. Additionally, while the method has the ability to detect attacks, it is equally important to minimize false positives. Hence, in the evaluation of the method’s performance, greater attention is placed on recall and FS.
In Table 4, it is evident that the method exhibits a robust detection capability for DoS attacks, as indicated by the high FS of 99.61%. However, the detection performance for fuzzy attacks is relatively weaker, with an FS of only 98.02%, primarily due to a lower recall rate. Fuzzy attacks employ randomly injecting data frames, resulting in non-fixed patterns for the injected frames. Randomly injected frames within the window cause an increased Hamming distance from the normal state, surpassing the predefined threshold. The method leverages this characteristic to detect fuzzy attacks. However, due to the nature of random injection, partially injected data frames may not have enough impact to increase the Hamming distance above the threshold. As a result, the method exhibits a weakness in detecting fuzzy attacks. However, other types of attacks, such as DoS attacks, exhibit more fixed patterns in their data frames. These fixed patterns result in consistent changes to the Hamming distance, allowing for better detection results. Overall, the method demonstrates high efficiency in detecting the four types of attacks, with FS exceeding 98%. The recall achieves the highest value of 99.31%. Precision, on the other hand, achieves the lowest value of 99.68%. Accuracy ranges from a minimum of 98.66% to a maximum of 99.76%.
In Figure 11, we present the confusion matrix of the method applied to the Xiaoyu dataset. The evaluation metrics for the method are displayed in the last row of Table 4. The Xiaoyu dataset solely consists of normal data. Therefore, to simulate DoS attacks, we introduce a substantial volume of high-priority data into the Xiaoyu dataset over a specific time period. As indicated in Table 4, the method achieves impressive results on the Xiaoyu dataset, with accuracy of 99.60%, precision of 99.65%, recall of 99.45%, and F1-score (FS) of 99.55%. These results demonstrate the method’s strong effectiveness in detecting DoS attacks. Comparing the results between car hacking and the Xiaoyu dataset, we observe a slight decrease of 0.06% in the FS for the Xiaoyu dataset. This discrepancy could be attributed to the greater volatility of normal data within the Xiaoyu dataset, which potentially leads to lower precision (decreased by 0.26%). However, the Xiaoyu dataset achieves a higher recall (increased by 0.14%). We employ two datasets to showcase the effectiveness of our method in detecting DoS attacks on different vehicles.

5.4. Comparison with Other Work

In Table 5, we compare the experimental results of our method with those of other existing methods. To ensure a more scientifically rigorous comparison, all the methods chosen for evaluation are conducted on the car-hacking dataset. We select the following methods for comparison: the histogram-based method proposed by Derhab et al. [13], the support vector classifier (SVC) method introduced by Aksu et al. [53], the DCNN-based method developed by Song et al. [9], the method utilizing the Hamming distance based on ID presented by Stabili et al. [12], and the Ensemble Learning-Based method, which is the latest approach proposed by Alalwany et al. [34]. These selected methods encompass a variety of techniques, including statistical methods, traditional machine learning methods, and neural network methods. Notably, the histogram-based method among the traditional machine learning approaches utilizes the sliding window method. Thus, our chosen comparison approach offers a comprehensive assessment by considering a diverse range of methodologies.
Compared to the DCNN [9] method, our model demonstrates a slight disadvantage, with a maximum reduction in FS of 1.78% and a minimum reduction of 0.34%. However, deep learning methods often increase detection time and memory usage to achieve better performance. To meet real-time monitoring standards, slight performance sacrifices may be accepted. In the subsequent section, we compare the detection time and memory usage between our method and the DCNN method. In comparison to the method utilizing SVC [53], our approach improves by 0.91% in the FS. Moreover, the method [12] solely relying on Hamming distance achieves a minimum accuracy of only 20% to 30% in detecting fuzzy attacks. In contrast, our method, employing a windowing approach, elevates the accuracy of fuzzy attack detection to 98.66%. The histogram-based method [13] also employs the sliding window method. While both methods achieve a perfect 100% F1-Score (FS) against both types of spoofing attacks, our method excels in detecting DoS and fuzzy attacks, showcasing an increased accuracy of 3.49%. Finally, we compare it with the latest method [34], which uses ensemble learning-based and multi-classification model anomaly detection. Judging from the experimental results, our experimental results are significantly ahead.
The above comparison fully demonstrates the stability and superiority of our model, which has a stable effect on any attack type and achieves outstanding results.

5.5. Time for the Detection System

We first calculate the memory footprint. We need to record three benchmark windows; the number of each benchmark window is 100 and the window size is 80. For a CAN frame, the data we need are only the ID and data fields. The size of the data field is 64 bit, and the ID field is only 11 bit but we expanded it to 16 bit. So the size of a data frame is 10 B. After calculation, the memory footprint we need is about 240 KB, which does not burden us at all. If we need to record more windows in the future, we only need to add 80 KB of memory for each window.
Regarding the time complexity, we do not calculate the time complexity of the training, because that can be calculated elsewhere; we only discuss the detection time. For a window, we need to calculate the Hamming distance for N windows of size K and calculate the threshold for comparison. The time complexity of the Hamming distance for a pair of strings is O( l o g n ), so the overall time complexity is O( N K l o g n ), where n equal to 80 represents the string length of a data frame.
We conduct a comparison between our method and the DCNN method in terms of detection time and memory consumption. The DCNN method’s average detection time is presented for the minimum batch size, considering both GPU and CPU. The results of these two methods are presented in Table 6. As shown in Table 6, DCNN [9] has nearly 9.8 million parameters in space complexity, and our model optimizes at least 1000 times the space size. In terms of time, our model runs about 20 times faster.

6. Discussion

6.1. Identify Attack Types

Our method is able to detect four types of attacks. It leverages the changes in the Hamming distance between the car data domain and the benchmark under attack conditions to identify attacks. Specifically, we observe that DoS attacks tend to decrease the Hamming distance, while fuzzy attacks tend to increase the Hamming distance. Therefore, we can differentiate between different types of attacks by comparing the calculated Hamming distance with a threshold. If the Hamming distance is greater than the threshold, it indicates a fuzzy attack. Otherwise, it suggests a DoS attack. Furthermore, to detect the two types of spoofing attacks, we establish specific thresholds as signatures. If the calculated Hamming distance falls within the range defined by one of the thresholds, it indicates the presence of the corresponding attack. Therefore, we can infer the type of attack based on the analysis of the comparison result.

6.2. Other Attacks

The proposed method adopts unsupervised learning, which helps limit zero-day attacks to some extent, and has excellent detection performance against injection attacks. Moreover, in addition to considering changes in the ID field, our method also takes into account variations in the data field. So in theory, our method has the capability to detect attacks that specifically target and modify the data field.

6.3. Limitations and Future Work

Our model is very effective against large-scale injection attacks or tampering attacks. The influence of the small-batch attack model remains to be verified; however, we believe that small-batch, high-period injection attacks will not cause a significant influence on or harm to the car because the second normal ID of the vehicle would quickly overwrite the previous information.
The selection of appropriate benchmarks plays a critical role in our method. Consequently, it is necessary to conduct prior analysis on the car’s data to carefully choose a benchmark that accurately represents the normal state of the vehicle. This selection process may require significant time and testing to ensure its effectiveness. As the number of complex attack types continues to grow, our method may require the inclusion of additional signature thresholds to detect these new attack types. This expansion of signature thresholds may introduce an increased computational burden.
In our future work, we aim to enhance the benchmark selection process, identify more efficient methods for benchmark acquisition, or create a standardized benchmark that caters to all types of vehicles. In addition, our objective is to develop an adaptive sliding window method capable of dynamically adjusting the window size based on variations in the scale and nature of attacks. Lastly, we will focus on refining our methodology to enhance its ability to detect a broader range of attack types, thereby bolstering the comprehensiveness of our intrusion detection system.

7. Conclusions

The primary objective of this research was to develop an intrusion detection method specifically designed for the Internet of Vehicles. We accomplished this by analyzing the data frames of the vehicle network which undergo significant changes when injected with malicious data. By calculating the Hamming distance between the vehicle data in the attacked state and the benchmark that records the original state of the vehicle, we were able to quantify the differences. To optimize resource usage, we established a threshold-based approach to determine whether a vehicle is under attack.
We validated the effectiveness of our methodology by conducting experiments on two datasets: one publicly available dataset and another dataset that we collected and simulated attacks on. The experimental results demonstrate that our method exhibits robust detection capabilities for DoS attacks, fuzzy attacks, and two types of spoofing attacks, achieving high accuracies of 99.67%, 98.66%, 99.4%, and 99.61%, respectively. Furthermore, it demonstrates strong F1 scores of 99.61%, 98.02%, 99.27%, and 99.48% for these attack categories. In comparison to other methods that utilize sliding windows [13], our method achieves a notable improvement in accuracy, surpassing it by 3.49%. Furthermore, in terms of resource consumption, our method outperforms the DCNN method [9]. Specifically, our method significantly reduces the detection time by nearly 20 times, optimizing it from 6.7 ms to 0.37 ms. Additionally, it substantially reduces the memory footprint by almost 1000 times. Our method effectively detects common injection attacks on CAN buses while minimizing memory usage and time consumption.
Lastly, we discussed how our approach can recognize different kinds of attacks and has some extra abilities. In our future work, we aim to enhance several aspects of our methodology, including the facilitation of benchmark selection, bolstering method robustness, and expanding the repertoire of reliably detectable attack types.

Author Contributions

Preliminary research, methodology, experiments, and draft preparation: S.F.; Data provision and methodological guidance: G.Z.; Draft revision: J.L.; Supervision and funding acquisition: Y.L. All authors have read and agreed to the published version of the manuscript.

Funding

This work was supported by Henan Science and Technology Major Project (No. 221100240100), National Science Foundation of China (No. 62002213), Shanghai Sailing Program (21YF1413800 and 20YF1413700), Shanghai Science and Technology Innovation Action Plan (No. 21511102500), and Science and Technology on Communication Security Laboratory Foundation (No. 6142103022208).

Institutional Review Board Statement

Not applicable.

Informed Consent Statement

Not applicable.

Data Availability Statement

The car-hacking dataset utilized in our experiments originates from the HCRL (Highly Confidential Research Lab). The dataset can be acquired at https://ocslab.hksecurity.net/Datasets/car-hacking-dataset. The XiaoYu dataset presented in this study are available on request from the corresponding author due to privacy.

Conflicts of Interest

The authors declare no conflict of interest.

References

  1. Santhi, M.; Deepthi, K.; NVL, C.S.K.; Prasanna, P.L. Security Issues on Inter-Vehicle Communications. Int. J. Comput. Sci. Inf. Technol. 2011, 2, 2579–2583. [Google Scholar]
  2. Contreras-Castillo, J.; Zeadally, S.; Guerrero-Ibañez, J.A. Internet of vehicles: Architecture, protocols, and security. IEEE Internet Things J. 2017, 5, 3701–3709. [Google Scholar] [CrossRef]
  3. Zeng, W.; Khalid, M.A.; Chowdhury, S. In-vehicle networks outlook: Achievements and challenges. IEEE Commun. Surv. Tutor. 2016, 18, 1552–1571. [Google Scholar] [CrossRef]
  4. Checkoway, S.; McCoy, D.; Kantor, B.; Anderson, D.; Shacham, H.; Savage, S.; Koscher, K.; Czeskis, A.; Roesner, F.; Kohno, T. Comprehensive experimental analyses of automotive attack surfaces. In Proceedings of the 20th USENIX Conference on Security, SEC’11, San Francisco, CA, USA, 8–12 August 2011; p. 6. [Google Scholar]
  5. Foster, I.; Prudhomme, A.; Koscher, K.; Savage, S. Fast and vulnerable: A story of telematic failures. In Proceedings of the 9th USENIX Workshop on Offensive Technologies (WOOT 15), Washington, DC, USA, 10–11 August 2015. [Google Scholar]
  6. Miller, C.; Valasek, C. Remote exploitation of an unaltered passenger vehicle. Black Hat USA 2015, 2015, 1–91. [Google Scholar]
  7. Lokman, S.F.; Othman, A.T.; Abu-Bakar, M.H. Intrusion detection system for automotive Controller Area Network (CAN) bus system: A review. EURASIP J. Wirel. Commun. Netw. 2019, 2019, 184. [Google Scholar] [CrossRef]
  8. Aliwa, E.; Rana, O.; Perera, C.; Burnap, P. Cyberattacks and countermeasures for in-vehicle networks. Acm Comput. Surv. (CSUR) 2021, 54, 1–37. [Google Scholar] [CrossRef]
  9. Song, H.M.; Woo, J.; Kim, H.K. In-vehicle network intrusion detection using deep convolutional neural network. Veh. Commun. 2020, 21, 100198. [Google Scholar] [CrossRef]
  10. Cho, K.T.; Shin, K.G. Fingerprinting electronic control units for vehicle intrusion detection. In Proceedings of the USENIX Security Symposium, Austin, TX, USA, 10–12 August 2016; Volume 40, pp. 911–927. [Google Scholar]
  11. Serag, K.; Bhatia, R.; Faqih, A.; Ozmen, M.O.; Kumar, V.; Celik, Z.B.; Xu, D. ZBCAN: A zero-byte CAN defense system. In Proceedings of the 32nd USENIX Conference on Security Symposium, SEC’23, Anaheim, CA, USA, 9–11 August 2023. [Google Scholar]
  12. Stabili, D.; Marchetti, M.; Colajanni, M. Detecting attacks to internal vehicle networks through Hamming distance. In Proceedings of the 2017 AEIT International Annual Conference, IEEE, Cagliari, Italy, 20–22 September 2017; pp. 1–6. [Google Scholar]
  13. Derhab, A.; Belaoued, M.; Mohiuddin, I.; Kurniawan, F.; Khan, M.K. Histogram-based intrusion detection and filtering framework for secure and safe in-vehicle networks. IEEE Trans. Intell. Transp. Syst. 2021, 23, 2366–2379. [Google Scholar] [CrossRef]
  14. Seo, E.; Song, H.M.; Kim, H.K. GIDS: GAN based intrusion detection system for in-vehicle network. In Proceedings of the 2018 16th Annual Conference on Privacy, Security and Trust (PST), IEEE, Belfast, Ireland, 28–30 August 2018; pp. 1–6. [Google Scholar]
  15. Koscher, K.; Czeskis, A.; Roesner, F.; Patel, S.; Kohno, T.; Checkoway, S.; McCoy, D.; Kantor, B.; Anderson, D.; Shacham, H.; et al. Experimental security analysis of a modern automobile. In Proceedings of the 2010 IEEE symposium on security and privacy, IEEE, Oakland, CA, USA, 16–19 May 2010; pp. 447–462. [Google Scholar]
  16. Hoppe, T.; Kiltz, S.; Dittmann, J. Security threats to automotive CAN networks—Practical examples and selected short-term countermeasures. Reliab. Eng. Syst. Saf. 2011, 96, 11–25. [Google Scholar] [CrossRef]
  17. Lin, C.W.; Sangiovanni-Vincentelli, A. Cyber-security for the controller area network (CAN) communication protocol. In Proceedings of the 2012 International Conference on Cyber Security, IEEE, Alexandria, VA, USA, 14–16 December 2012; pp. 1–7. [Google Scholar]
  18. Nilsson, D.K.; Larson, U.E.; Jonsson, E. Efficient in-vehicle delayed data authentication based on compound message authentication codes. In Proceedings of the 2008 IEEE 68th Vehicular Technology Conference, IEEE, Calgary, AB, Canada, 21–24 September 2008; pp. 1–5. [Google Scholar]
  19. Van Herrewege, A.; Singelee, D.; Verbauwhede, I. CANAuth-a simple, backward compatible broadcast authentication protocol for CAN bus. In Proceedings of the ECRYPT Workshop on Lightweight Cryptography, ECRYPT, Louvain-la-Neuve, Belgium, 28 November 2011; Volume 2011, p. 20. [Google Scholar]
  20. Jo, H.J.; Kim, J.H.; Choi, H.Y.; Choi, W.; Lee, D.H.; Lee, I. Mauth-can: Masquerade-attack-proof authentication for in-vehicle networks. IEEE Trans. Veh. Technol. 2019, 69, 2204–2218. [Google Scholar] [CrossRef]
  21. Longari, S.; Valcarcel, D.H.N.; Zago, M.; Carminati, M.; Zanero, S. CANnolo: An anomaly detection system based on LSTM autoencoders for controller area network. IEEE Trans. Netw. Serv. Manag. 2020, 18, 1913–1924. [Google Scholar] [CrossRef]
  22. Taylor, A. Anomaly-Based Detection of Malicious Activity in in-Vehicle Networks. Ph.D. Thesis, Université d’Ottawa/University of Ottawa, Ottawa, ON, Canada, 2017. [Google Scholar]
  23. Xiao, L.; Lu, X.; Xu, T.; Zhuang, W.; Dai, H. Reinforcement learning-based physical-layer authentication for controller area networks. IEEE Trans. Inf. Forensics Secur. 2021, 16, 2535–2547. [Google Scholar] [CrossRef]
  24. Zhou, A.; Li, Z.; Shen, Y. Anomaly detection of CAN bus messages using a deep neural network for autonomous vehicles. Appl. Sci. 2019, 9, 3174. [Google Scholar] [CrossRef]
  25. Kang, M.J.; Kang, J.W. Intrusion detection system using deep neural network for in-vehicle network security. PLoS ONE 2016, 11, e0155781. [Google Scholar] [CrossRef] [PubMed]
  26. Song, H.M.; Kim, H.R.; Kim, H.K. Intrusion detection system based on the analysis of time intervals of CAN messages for in-vehicle network. In Proceedings of the 2016 International Conference on Information Networking (ICOIN), IEEE, Kota Kinabalu, Malaysia, 13–15 January 2016; pp. 63–68. [Google Scholar]
  27. Hoang, T.N.; Kim, D. Supervised contrastive ResNet and transfer learning for the in-vehicle intrusion detection system. Expert Syst. Appl. 2024, 238, 122181. [Google Scholar] [CrossRef]
  28. Nguyen, T.P.; Nam, H.; Kim, D. Transformer-based attention network for in-vehicle intrusion detection. IEEE Access 2023, 11, 55389–55403. [Google Scholar] [CrossRef]
  29. Zhang, H.; Zeng, K.; Lin, S. Federated graph neural network for fast anomaly detection in controller area networks. IEEE Trans. Inf. Forensics Secur. 2023, 18, 1566–1579. [Google Scholar] [CrossRef]
  30. Hamming, R.W. Error detecting and error correcting codes. Bell Syst. Tech. J. 1950, 29, 147–160. [Google Scholar] [CrossRef]
  31. Tian, D.; Li, Y.; Wang, Y.; Duan, X.; Wang, C.; Wang, W.; Hui, R.; Guo, P. An intrusion detection system based on machine learning for CAN-bus. In Proceedings of the Industrial Networks and Intelligent Systems: 3rd International Conference, INISCOM 2017, Ho Chi Minh City, Vietnam, 4 September 2017; Proceedings 3. Springer: Cham, Switzerland, 2018; pp. 285–294. [Google Scholar]
  32. Li, X.; Zhang, H.; Miao, Y.; Ma, S.; Ma, J.; Liu, X.; Choo, K.K.R. Can bus messages abnormal detection using improved svdd in internet of vehicles. IEEE Internet Things J. 2021, 9, 3359–3371. [Google Scholar] [CrossRef]
  33. Yang, L.; Moubayed, A.; Shami, A. MTH-IDS: A multitiered hybrid intrusion detection system for internet of vehicles. IEEE Internet Things J. 2021, 9, 616–632. [Google Scholar] [CrossRef]
  34. Alalwany, E.; Mahgoub, I. An Effective Ensemble Learning-Based Real-Time Intrusion Detection Scheme for an In-Vehicle Network. Electronics 2024, 13, 919. [Google Scholar] [CrossRef]
  35. Avatefipour, O.; Al-Sumaiti, A.S.; El-Sherbeeny, A.M.; Awwad, E.M.; Elmeligy, M.A.; Mohamed, M.A.; Malik, H. An intelligent secured framework for cyberattack detection in electric vehicles’ CAN bus using machine learning. IEEE Access 2019, 7, 127580–127592. [Google Scholar] [CrossRef]
  36. Islam, R.; Refat, R.U.D.; Yerram, S.M.; Malik, H. Graph-based intrusion detection system for controller area networks. IEEE Trans. Intell. Transp. Syst. 2020, 23, 1727–1736. [Google Scholar] [CrossRef]
  37. Kang, L.; Shen, H. Abnormal message detection for CAN bus based on message transmission behaviors. In Proceedings of the 2020 IEEE 40th International Conference on Distributed Computing Systems (ICDCS), IEEE, Singapore, 29 November–1 December 2020; pp. 432–441. [Google Scholar]
  38. Lee, H.; Jeong, S.H.; Kim, H.K. OTIDS: A novel intrusion detection system for in-vehicle network by using remote frame. In Proceedings of the 2017 15th Annual Conference on Privacy, Security and Trust (PST), IEEE, Calgary, AB, Canada, 28–30 August 2017; pp. 57–5709. [Google Scholar]
  39. Taylor, A.; Japkowicz, N.; Leblanc, S. Frequency-based anomaly detection for the automotive CAN bus. In Proceedings of the 2015 World Congress on Industrial Control Systems Security (WCICSS), IEEE, London, UK, 14–16 December 2015; pp. 45–49. [Google Scholar]
  40. Moore, M.R.; Bridges, R.A.; Combs, F.L.; Starr, M.S.; Prowell, S.J. Modeling inter-signal arrival times for accurate detection of can bus signal injection attacks: A data-driven approach to in-vehicle intrusion detection. In Proceedings of the 12th Annual Conference on Cyber and Information Security Research, Oak Ridge, TN, USA, 4–6 April 2017; pp. 1–4. [Google Scholar]
  41. Marchetti, M.; Stabili, D.; Guido, A.; Colajanni, M. Evaluation of anomaly detection for in-vehicle networks through information-theoretic algorithms. In Proceedings of the 2016 IEEE 2nd International Forum on Research and Technologies for Society and Industry Leveraging a Better Tomorrow (RTSI), IEEE, Bologna, Italy, 7–9 September 2016; pp. 1–6. [Google Scholar]
  42. Müter, M.; Asaj, N. Entropy-based anomaly detection for in-vehicle networks. In Proceedings of the 2011 IEEE Intelligent Vehicles Symposium (IV), IEEE, Baden-Baden, Germany, 5–9 June 2011; pp. 1110–1115. [Google Scholar]
  43. Groza, B.; Murvay, P.S. Efficient intrusion detection with bloom filtering in controller area networks. IEEE Trans. Inf. Forensics Secur. 2018, 14, 1037–1051. [Google Scholar] [CrossRef]
  44. Kneib, M.; Huth, C. Scission: Signal characteristic-based sender identification and intrusion detection in automotive networks. In Proceedings of the 2018 ACM SIGSAC Conference on Computer and Communications Security, Toronto, ON, Canada, 15–19 October 2018; pp. 787–800. [Google Scholar]
  45. Choi, W.; Joo, K.; Jo, H.J.; Park, M.C.; Lee, D.H. Voltageids: Low-level communication characteristics for automotive intrusion detection system. IEEE Trans. Inf. Forensics Secur. 2018, 13, 2114–2129. [Google Scholar] [CrossRef]
  46. Han, M.L.; Kwak, B.I.; Kim, H.K. Anomaly intrusion detection method for vehicular networks based on survival analysis. Veh. Commun. 2018, 14, 52–63. [Google Scholar] [CrossRef]
  47. Cho, K.T.; Shin, K.G. Error handling of in-vehicle networks makes them vulnerable. In Proceedings of the 2016 ACM SIGSAC Conference on Computer and Communications Security, Vienna, Austria, 24–28 October 2016; pp. 1044–1055. [Google Scholar]
  48. Specification CAN 2.0; Bosch. Robert Bosch GmbH: Gerlingen, Germany, 1991.
  49. Norouzi, M.; Fleet, D.J.; Salakhutdinov, R.R. Hamming distance metric learning. Adv. Neural Inf. Process. Syst. 2012, 2, 1061–1069. [Google Scholar]
  50. Park, J.W.; Tumanov, A.; Jiang, A.; Kozuch, M.A.; Ganger, G.R. 3sigma: Distribution-based cluster scheduling for runtime uncertainty. In Proceedings of the Thirteenth EuroSys Conference, Porto, Portugal, 23–26 April 2018; pp. 1–17. [Google Scholar]
  51. Ding, W.; Alrashdi, I.; Hawash, H.; Abdel-Basset, M. DeepSecDrive: An explainable deep learning framework for real-time detection of cyberattack in in-vehicle networks. Inf. Sci. 2024, 658, 120057. [Google Scholar] [CrossRef]
  52. Fürnkranz, J.; Flach, P.A. An analysis of rule evaluation metrics. In Proceedings of the 20th International Conference on Machine Learning (ICML-03), Washington, DC, USA, 21–24 August 2003; pp. 202–209. [Google Scholar]
  53. Aksu, D.; Aydin, M.A. MGA-IDS: Optimal feature subset selection for anomaly detection framework on in-vehicle networks-CAN bus based on genetic algorithm and intrusion detection approach. Comput. Secur. 2022, 118, 102717. [Google Scholar] [CrossRef]
Figure 1. CAN bus 2.0A structure.
Applsci 14 02805 g001
Figure 2. Three attack models on the in-vehicle network.
Applsci 14 02805 g002
Figure 3. Overview.
Figure 3. Overview.
Applsci 14 02805 g003
Figure 4. Thresholds and normal data.
Applsci 14 02805 g004
Figure 5. DoS and fuzzy detection.
Applsci 14 02805 g005
Figure 6. Gear (spoofing) and rpm (spoofing) detection.
Applsci 14 02805 g006
Figure 7. The influence of hyperparameters K and N on the experimental results under DoS attack.
Applsci 14 02805 g007
Figure 8. The influence of hyperparameters K and N on the experimental results under fuzzy attack.
Applsci 14 02805 g008
Figure 9. The influence of hyperparameter ρ on experimental results.
Applsci 14 02805 g009
Figure 10. All attack types of confusion matrix result in car hacking.
Applsci 14 02805 g010
Figure 11. DoS Attack of confusion matrix result in Xiaoyu.
Applsci 14 02805 g011
Table 1. Datasets.
Table 1. Datasets.
DatasetAttack TypeTotal MessagesNormal MessagesInjected Messages
Car-HackingDoS Attack3,665,7713,078,250587,521
Fuzzy Attack3,838,8603,347,013491,847
Spoofing Attack(Gear)4,443,1423,845,890597,252
Spoofing Attack(Rpm)4,621,7023,966,805654,897
Normal988,987988,987
XiaoyuDoS Attack699,055582,546116,509
Normal1,359,27413,592,74
Table 2. Confusion matrix.
PredictedNormalAttack
Actual
NormalTNFP
AttackFNTP
Table 3. Analysis of id intervals.
ID TypeIntervalNumber
A2017
B404
C1001
D2002
E20002
Table 4. Result of model under two datasets.
DatasetAttack TypesAccuracyPrecisionRecallF-score
Car HackingDoS99.76%99.91%99.31%99.61%
Fuzzy98.66%99.68%96.38%98.02%
Spoofing Gear99.48%99.89%98.66%99.27%
Spoofing Rpm99.61%99.99%98.98%99.48%
XiaoyuDoS99.60%99.65%99.45%99.55%
Table 5. Comparison with other works employing car hacking.
ModelTypeAccuracyPrecisionRecallFS
DCNN [9]DoS99.97%100%99.89%99.95%
Fuzzy99.82%99.95%99.65%99.80%
Spoofing Gear99.95%99.99%99.89%99.94%
Spoofing Rpm99.97%99.99%99.94%99.96%
SVC(MGA) [53]Multicalss98.7%98.7%98.7%98.7%
Stacking [34]Multicalss98.5%98.7%98.5%98.5%
H-IDFS [13]OCSVM-DoS97.28%100%96.20%98.06%
OCSVM-Fuzzy95.17%99.55%94.93%97.18%
OCSVM-Gear100%100%100%100%
OCSVM-RPM100%100%100%100%
Hamming distance [12]Fuzzy-NoRange98%---
Fuzzy-SmallRange96%---
Fuzzy-MidRange20–30%---
OursDoS99.76%99.91%99.31%99.61%
Fuzzy98.66%99.68%96.38%98.02%
Spoofing Gear99.48%99.89%98.66%99.27%
Spoofing Rpm99.61%99.99%98.98%99.48%
Table 6. Model complexity comparsion.
ModelParameters (million)Time (ms)
DCNN [9]9.86.70
Ours0.0080.32
Disclaimer/Publisher’s Note: The statements, opinions and data contained in all publications are solely those of the individual author(s) and contributor(s) and not of MDPI and/or the editor(s). MDPI and/or the editor(s) disclaim responsibility for any injury to people or property resulting from any ideas, methods, instructions or products referred to in the content.

