
Effects of Electroporation on the Function of Sarco/Endoplasmic Reticulum Ca2+-ATPase and Na+,K+-ATPase in H9c2 Cells


Abstract
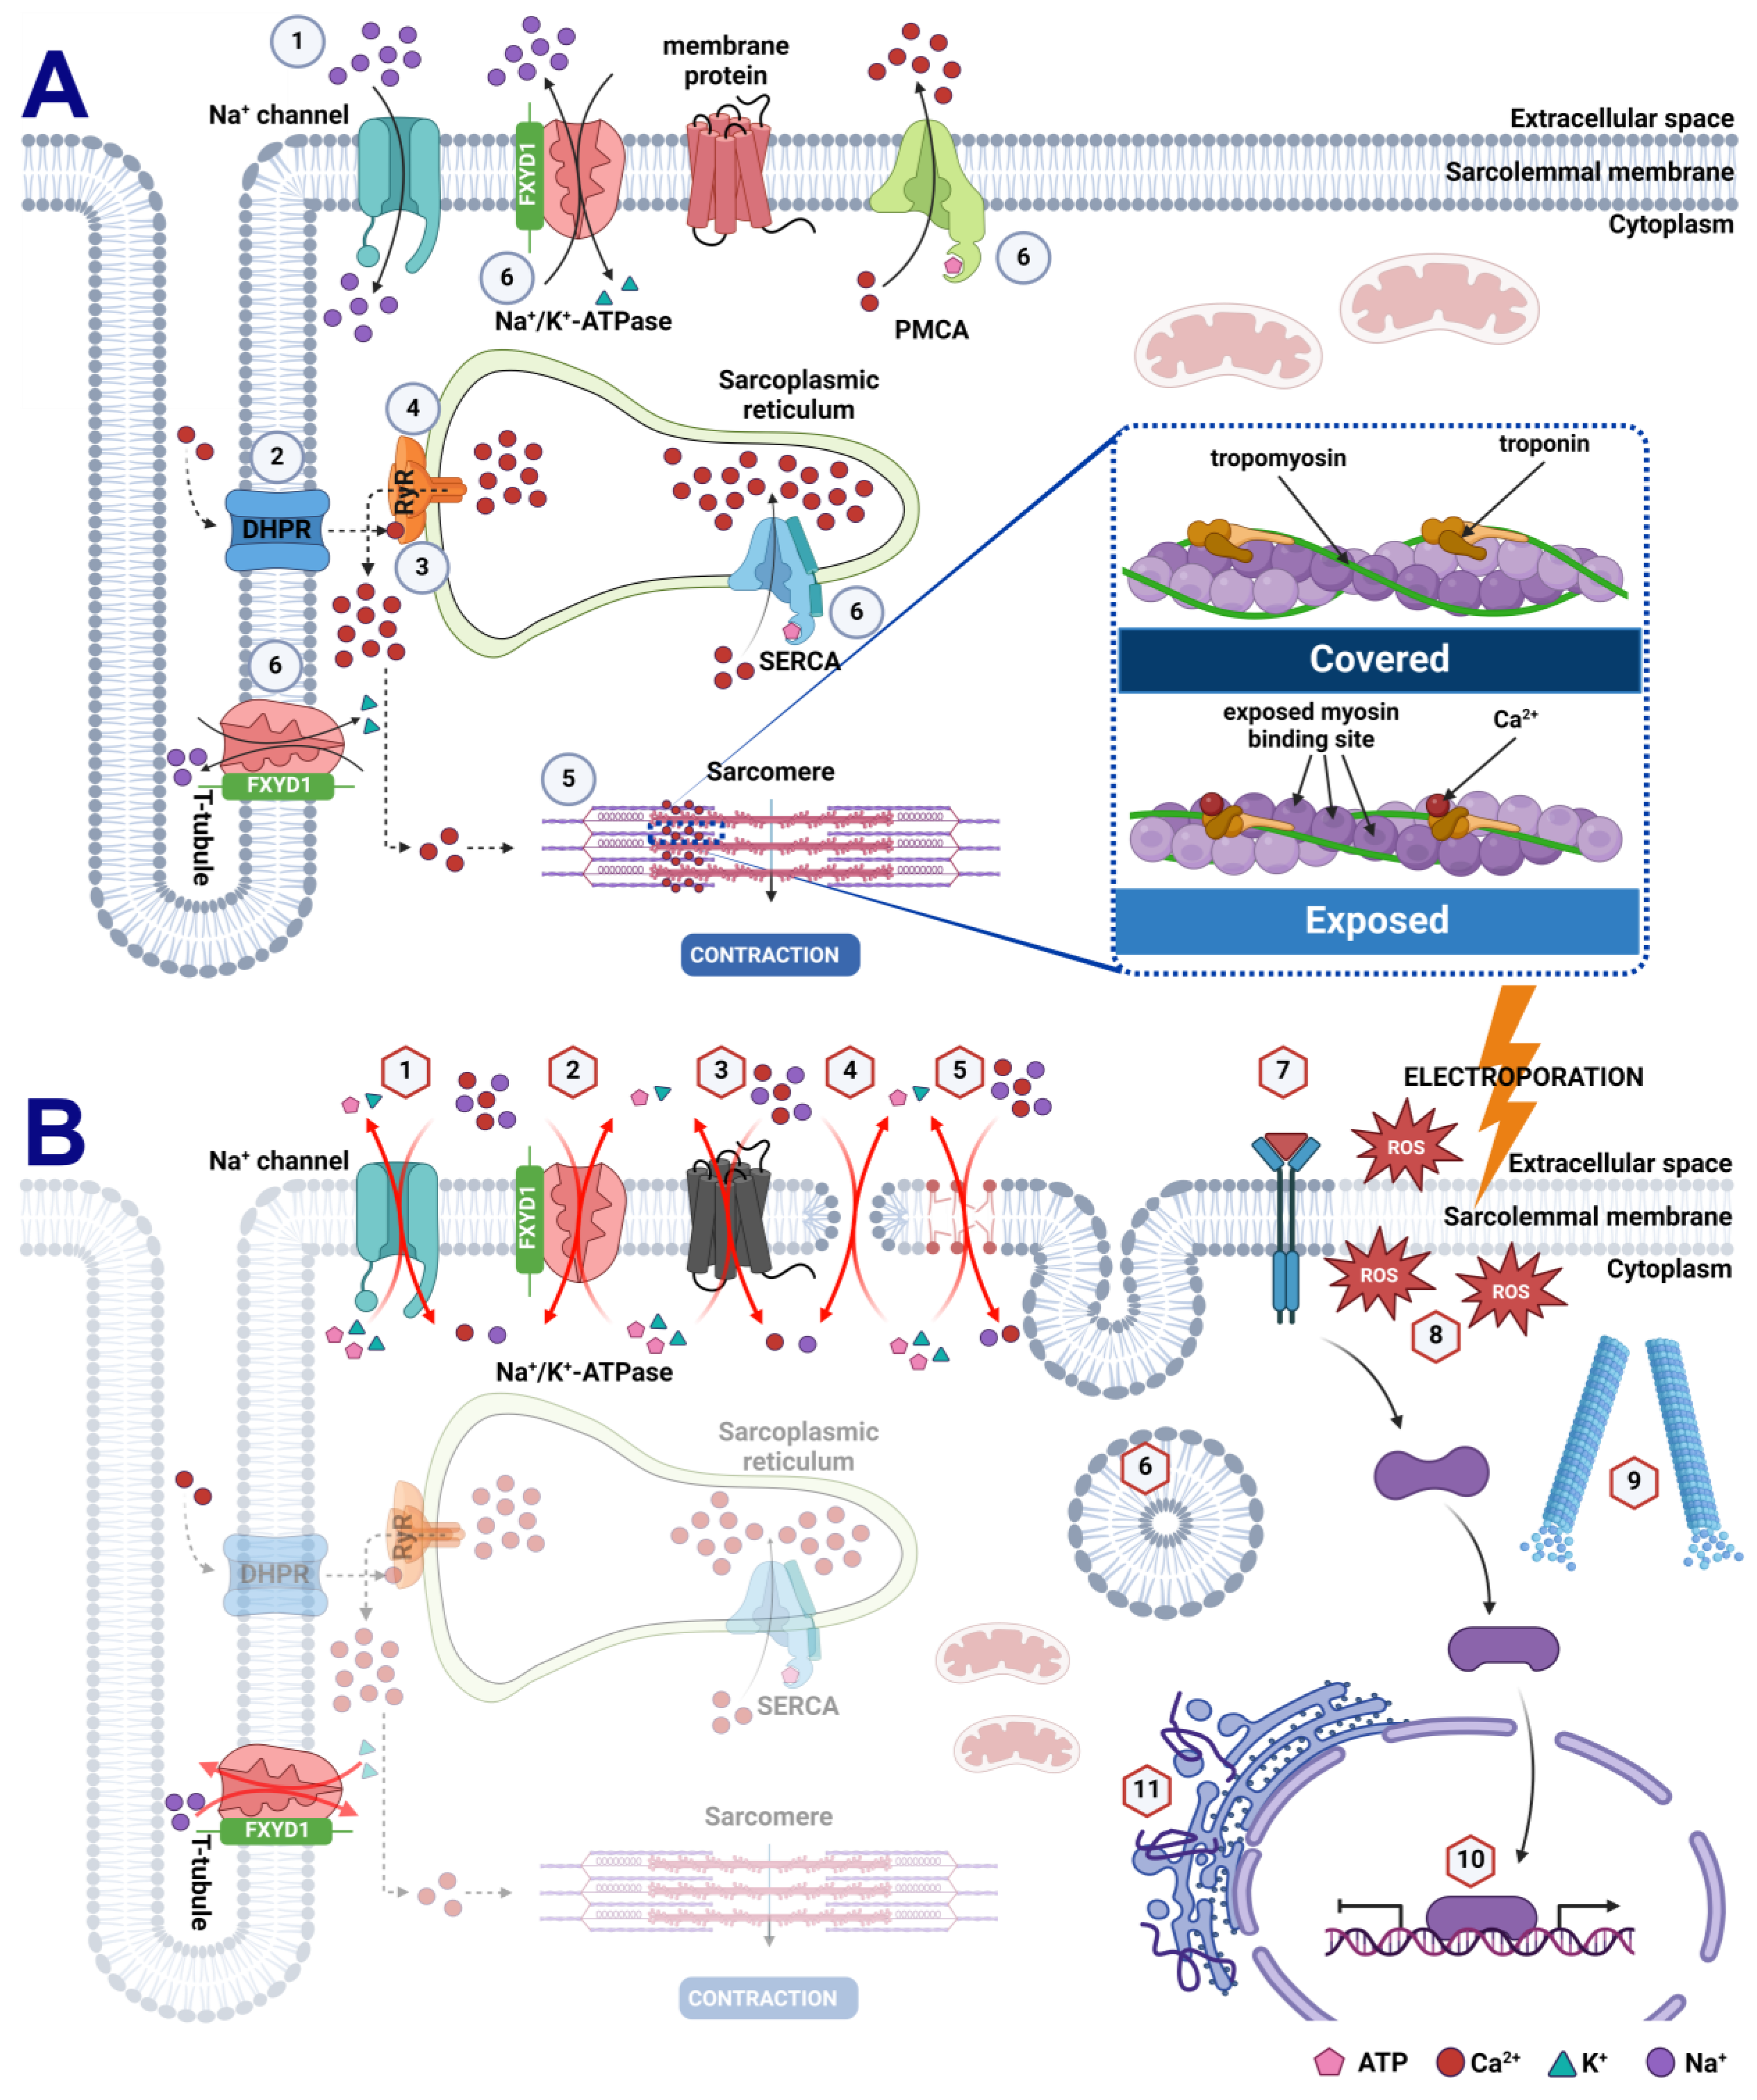
1. Introduction
2. Materials and Methods
2.1. Cells
2.2. Electric Pulse Generation and Electrodes
2.3. Determining Plasma Membrane Permeability and Resealing
2.4. Determining Cell Survival Following Electroporation
2.5. Cell Treatments for qPCR and Immunoblotting Analyses
2.6. Quantitative Real-Time PCR (qPCR)
2.7. Immunoblotting
2.8. Statistical Analyses
3. Results
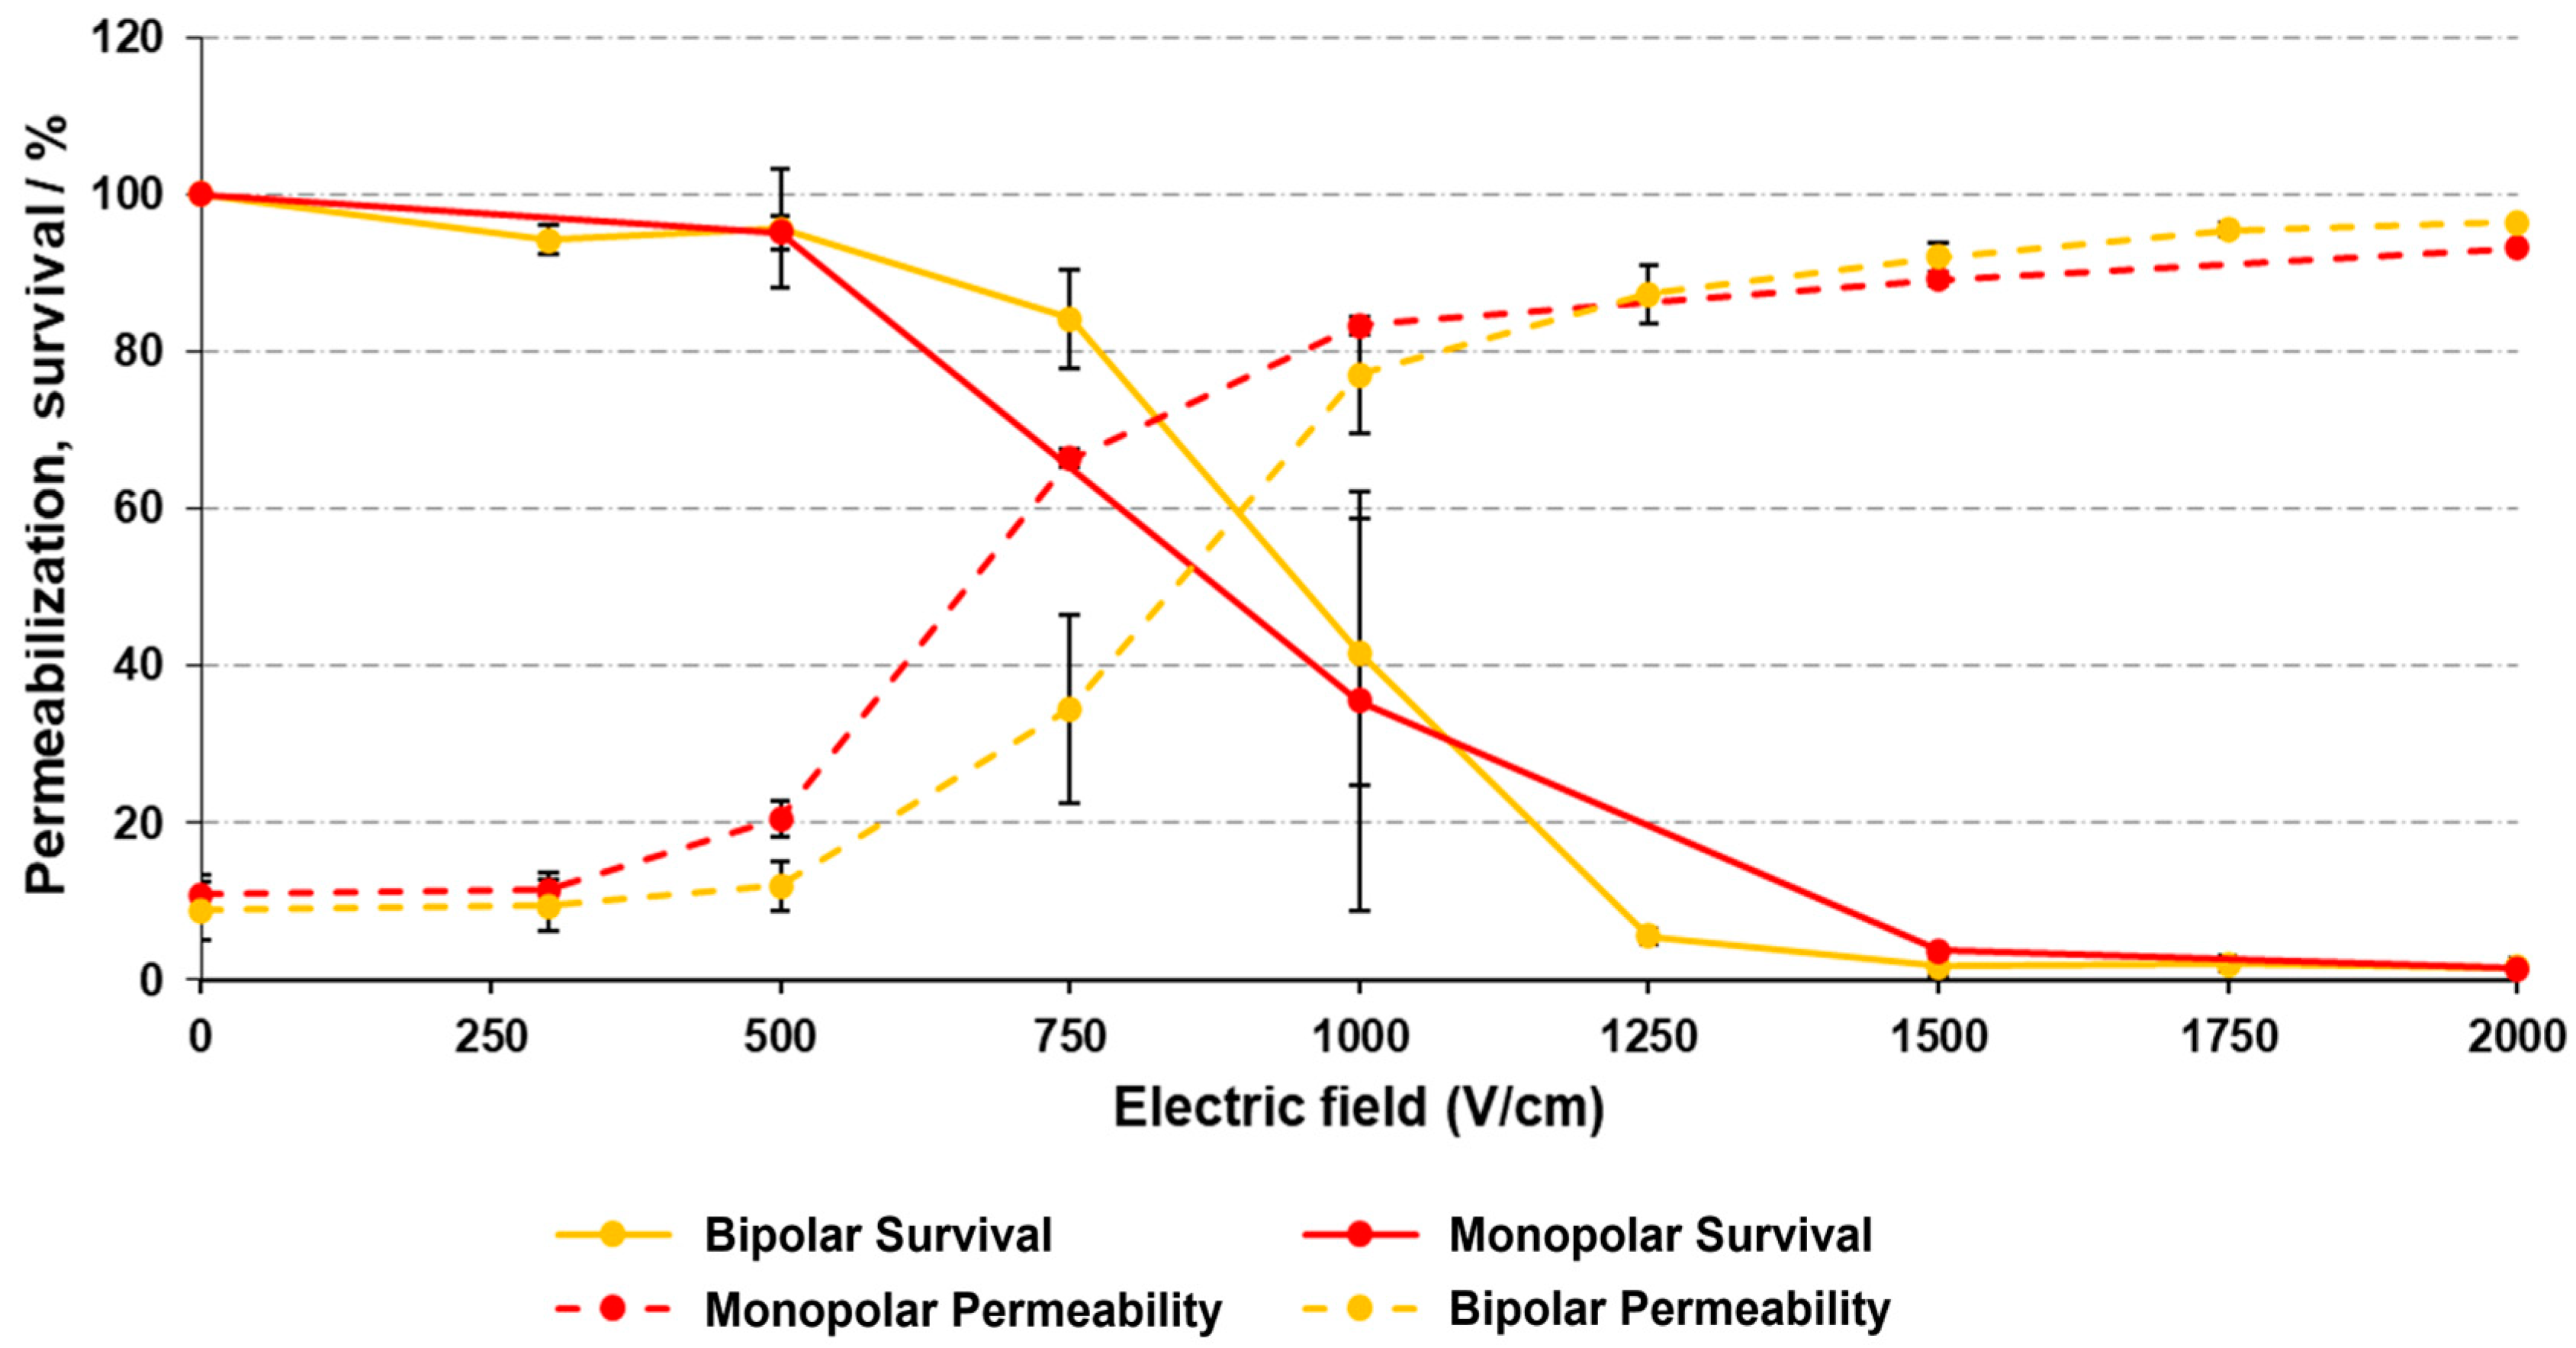
3.1. Plasma Membrane Permeability and Survival of H9c2 Cells after Electroporation
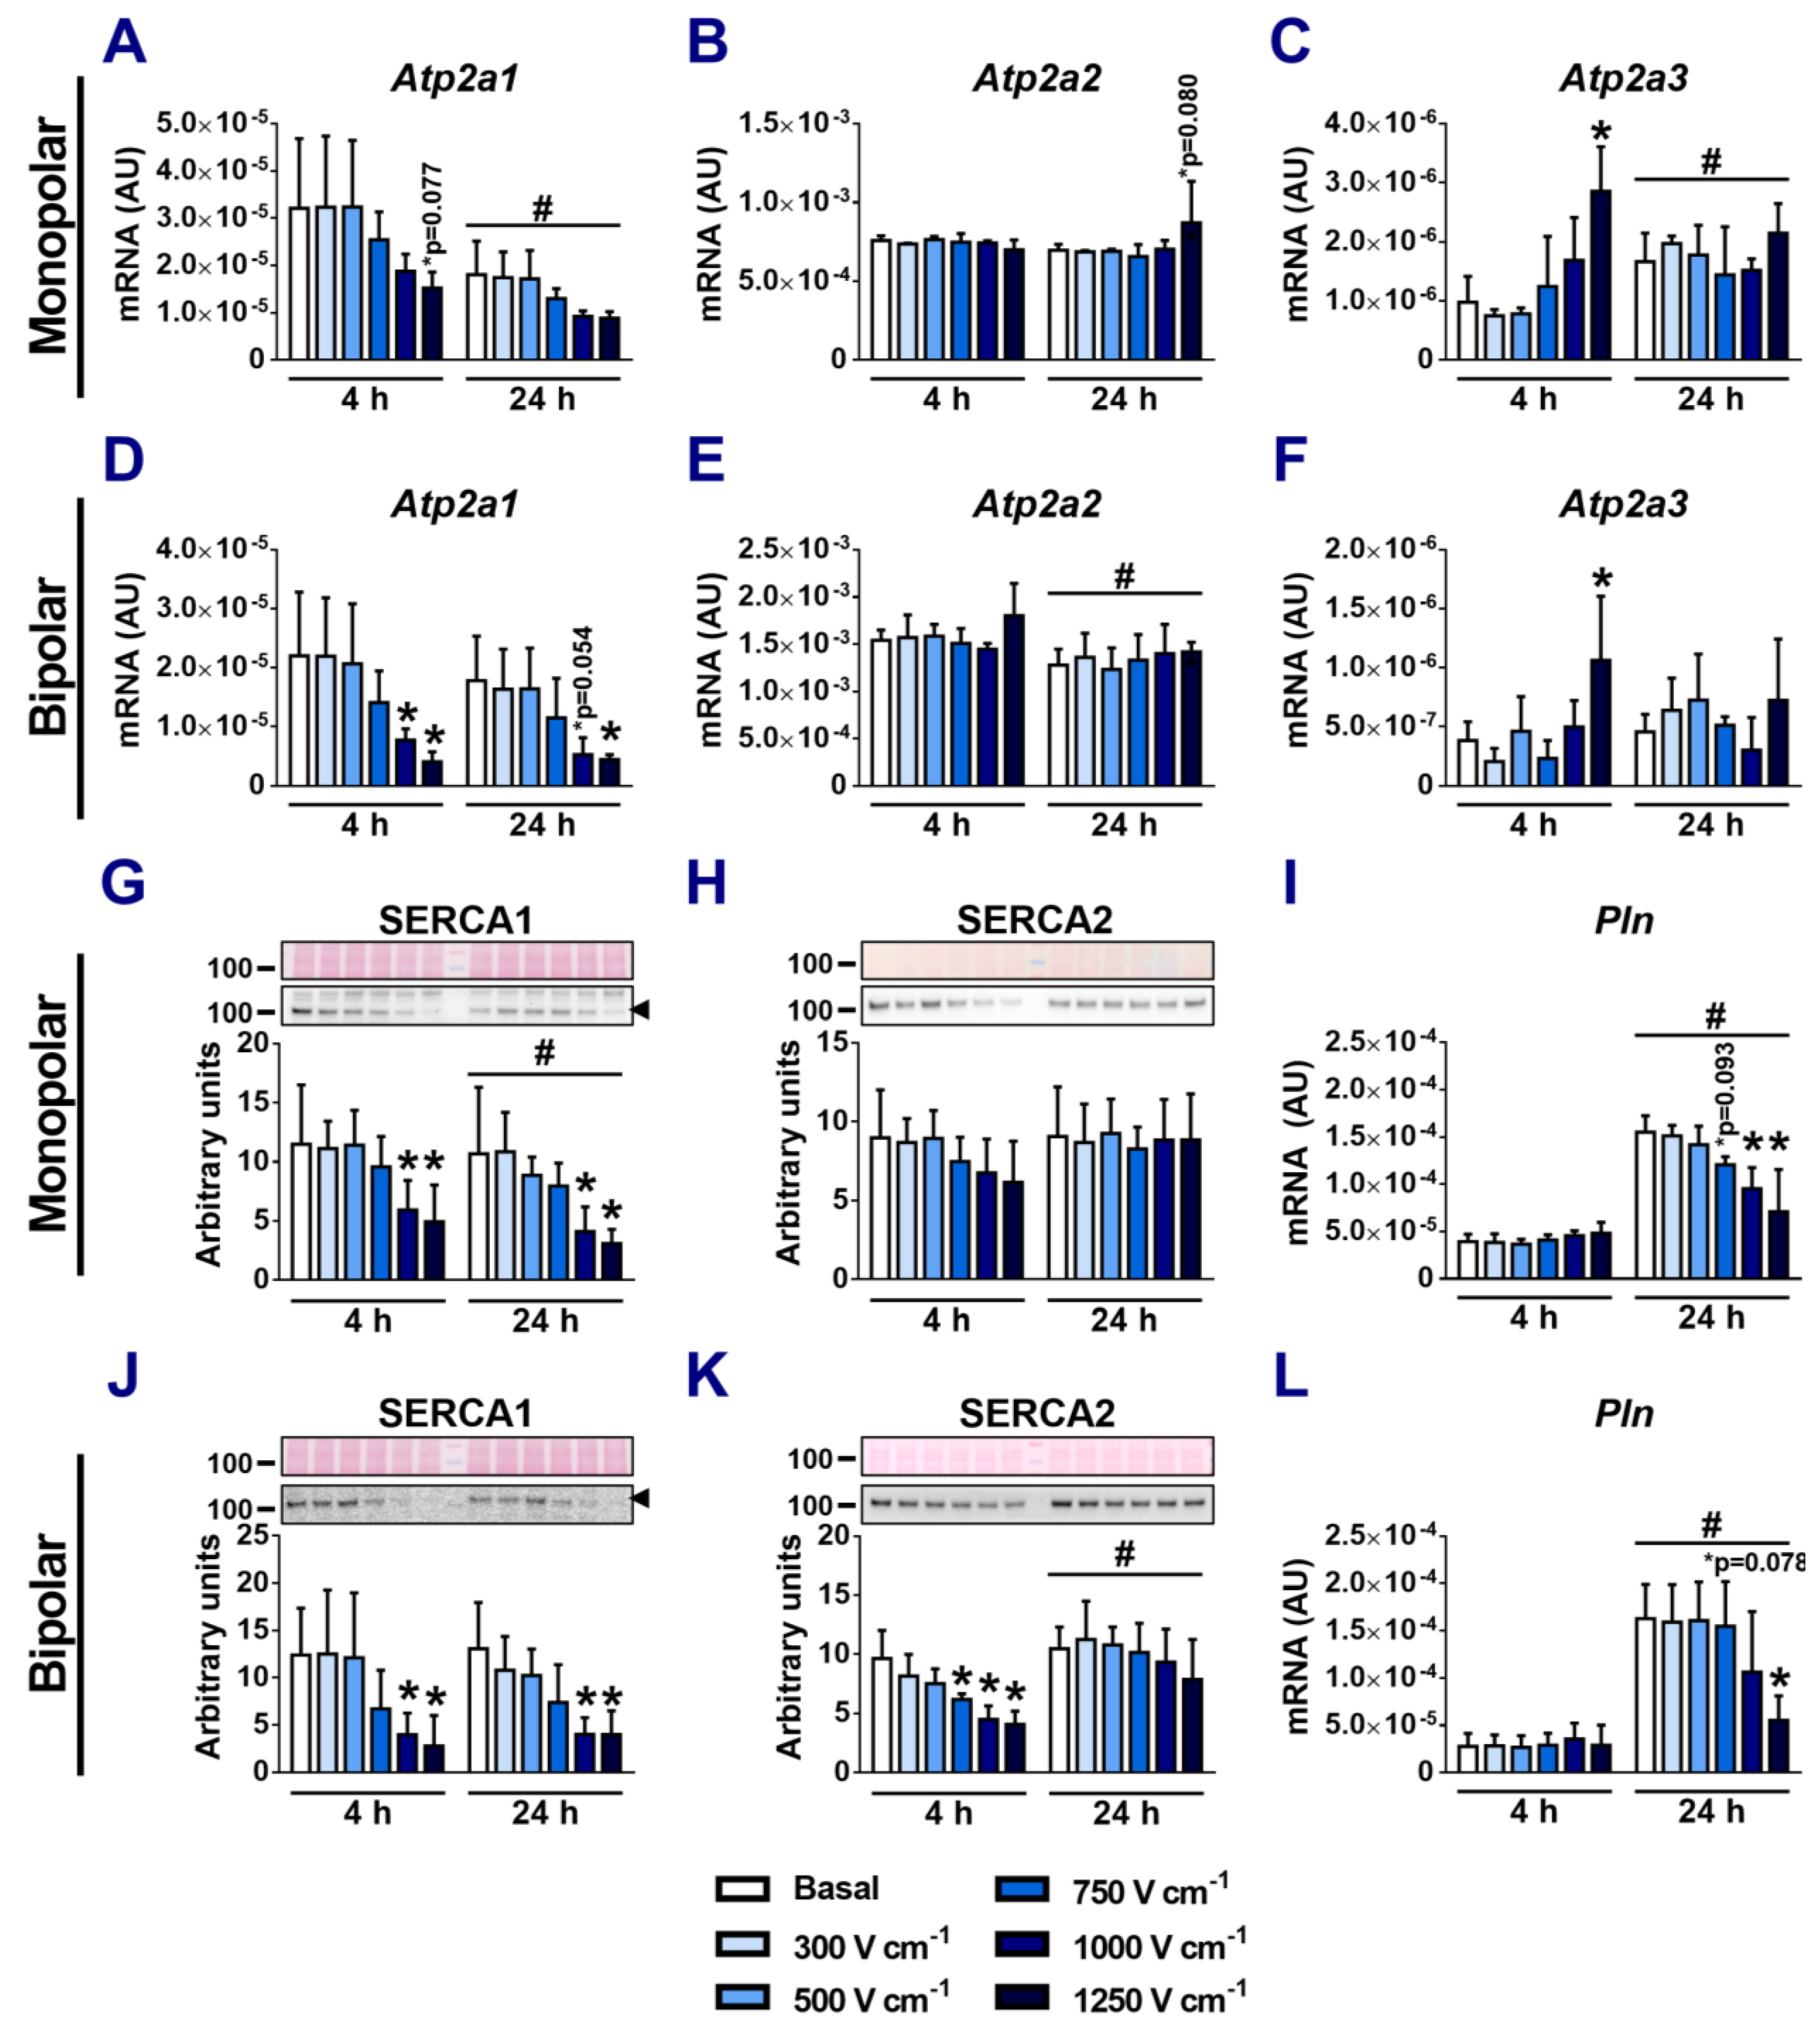
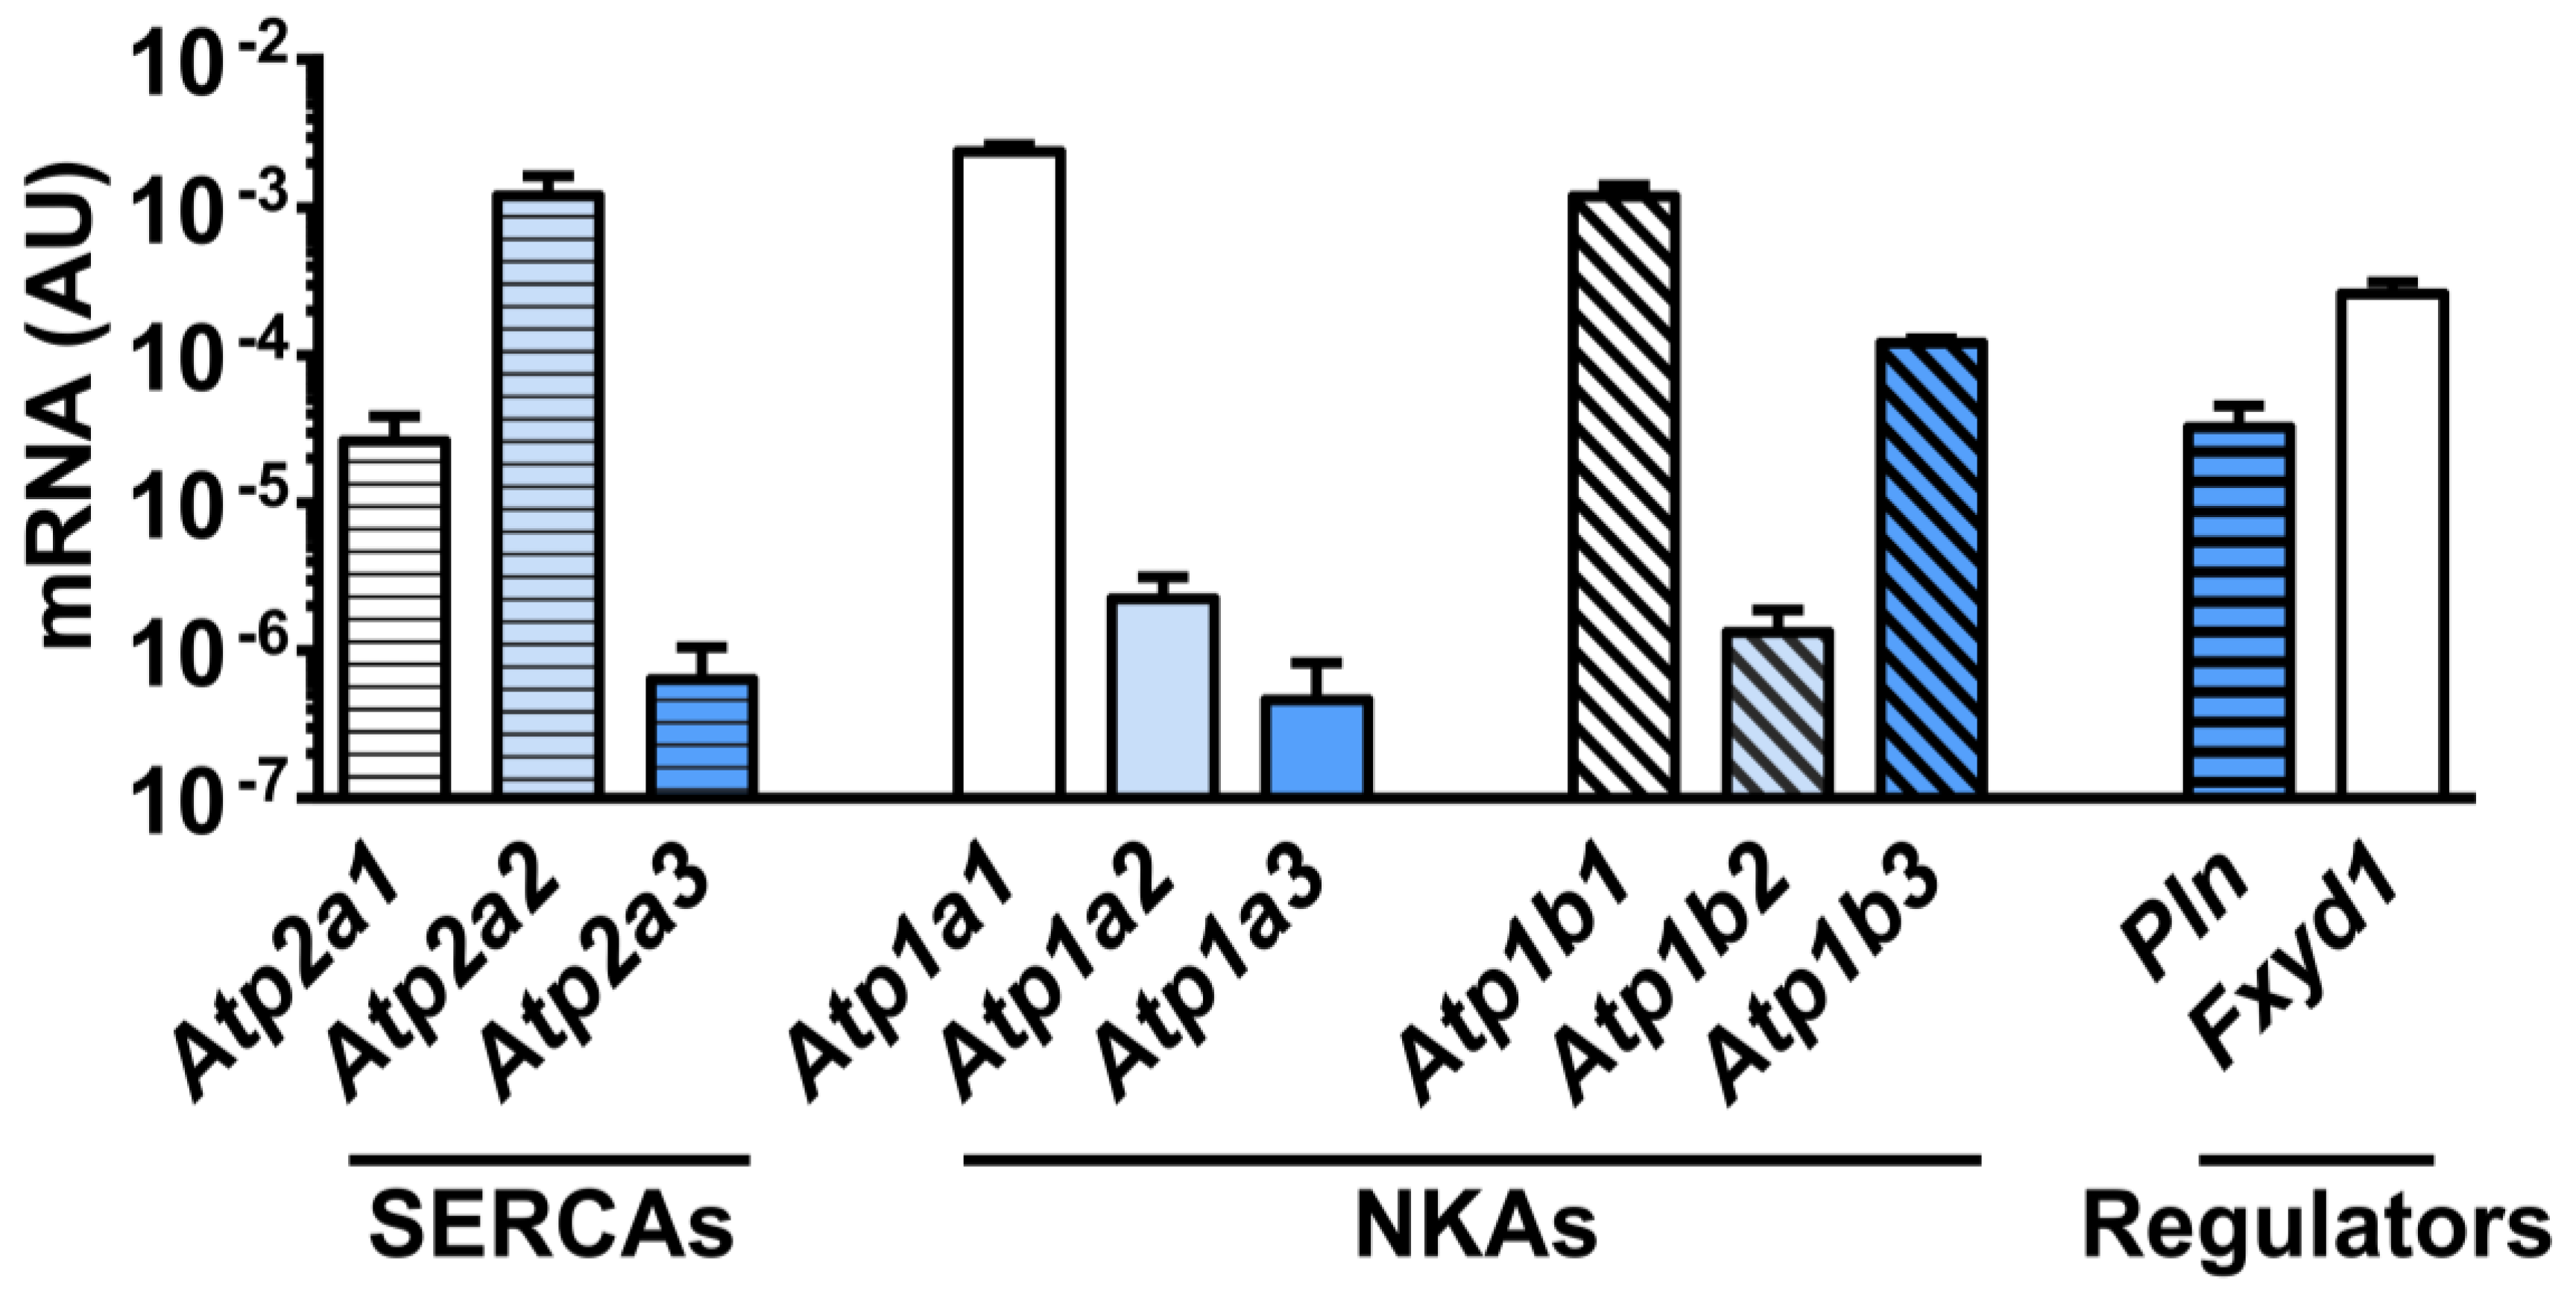
3.2. Effect of Electroporation on SERCA mRNA and Protein Expression
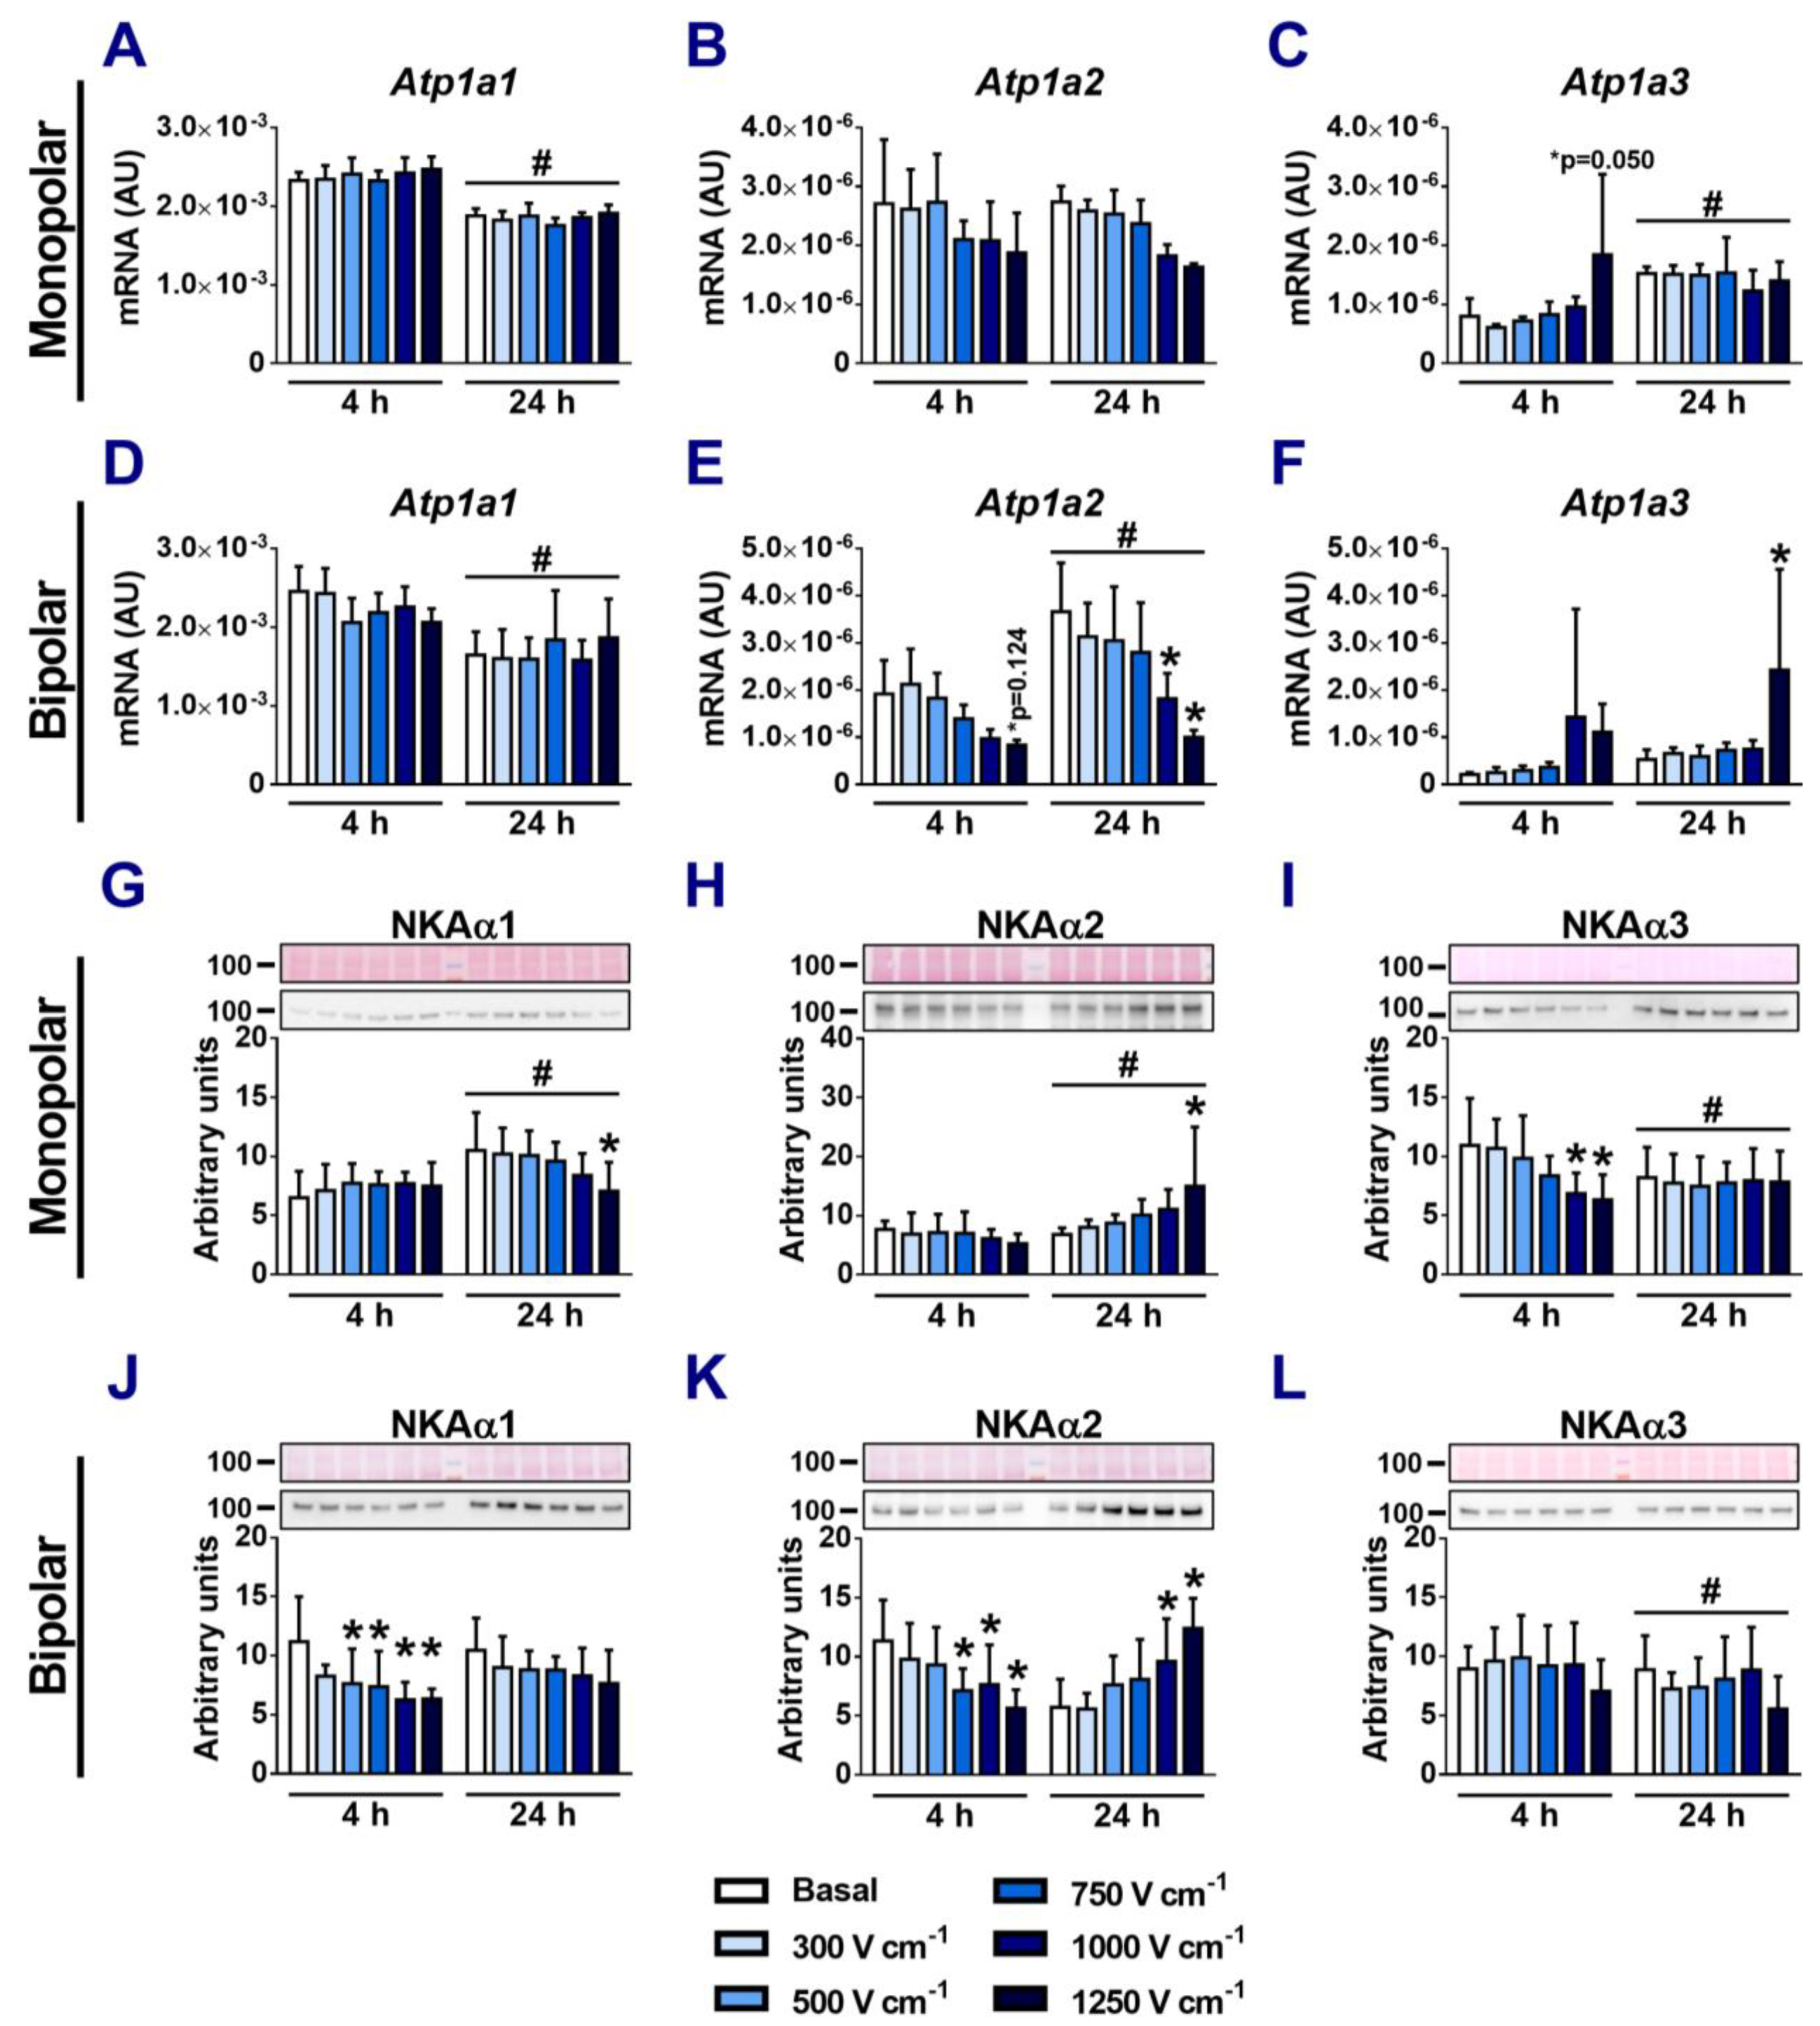
3.3. Effects of Electroporation on the Expression of NKA α-Subunits
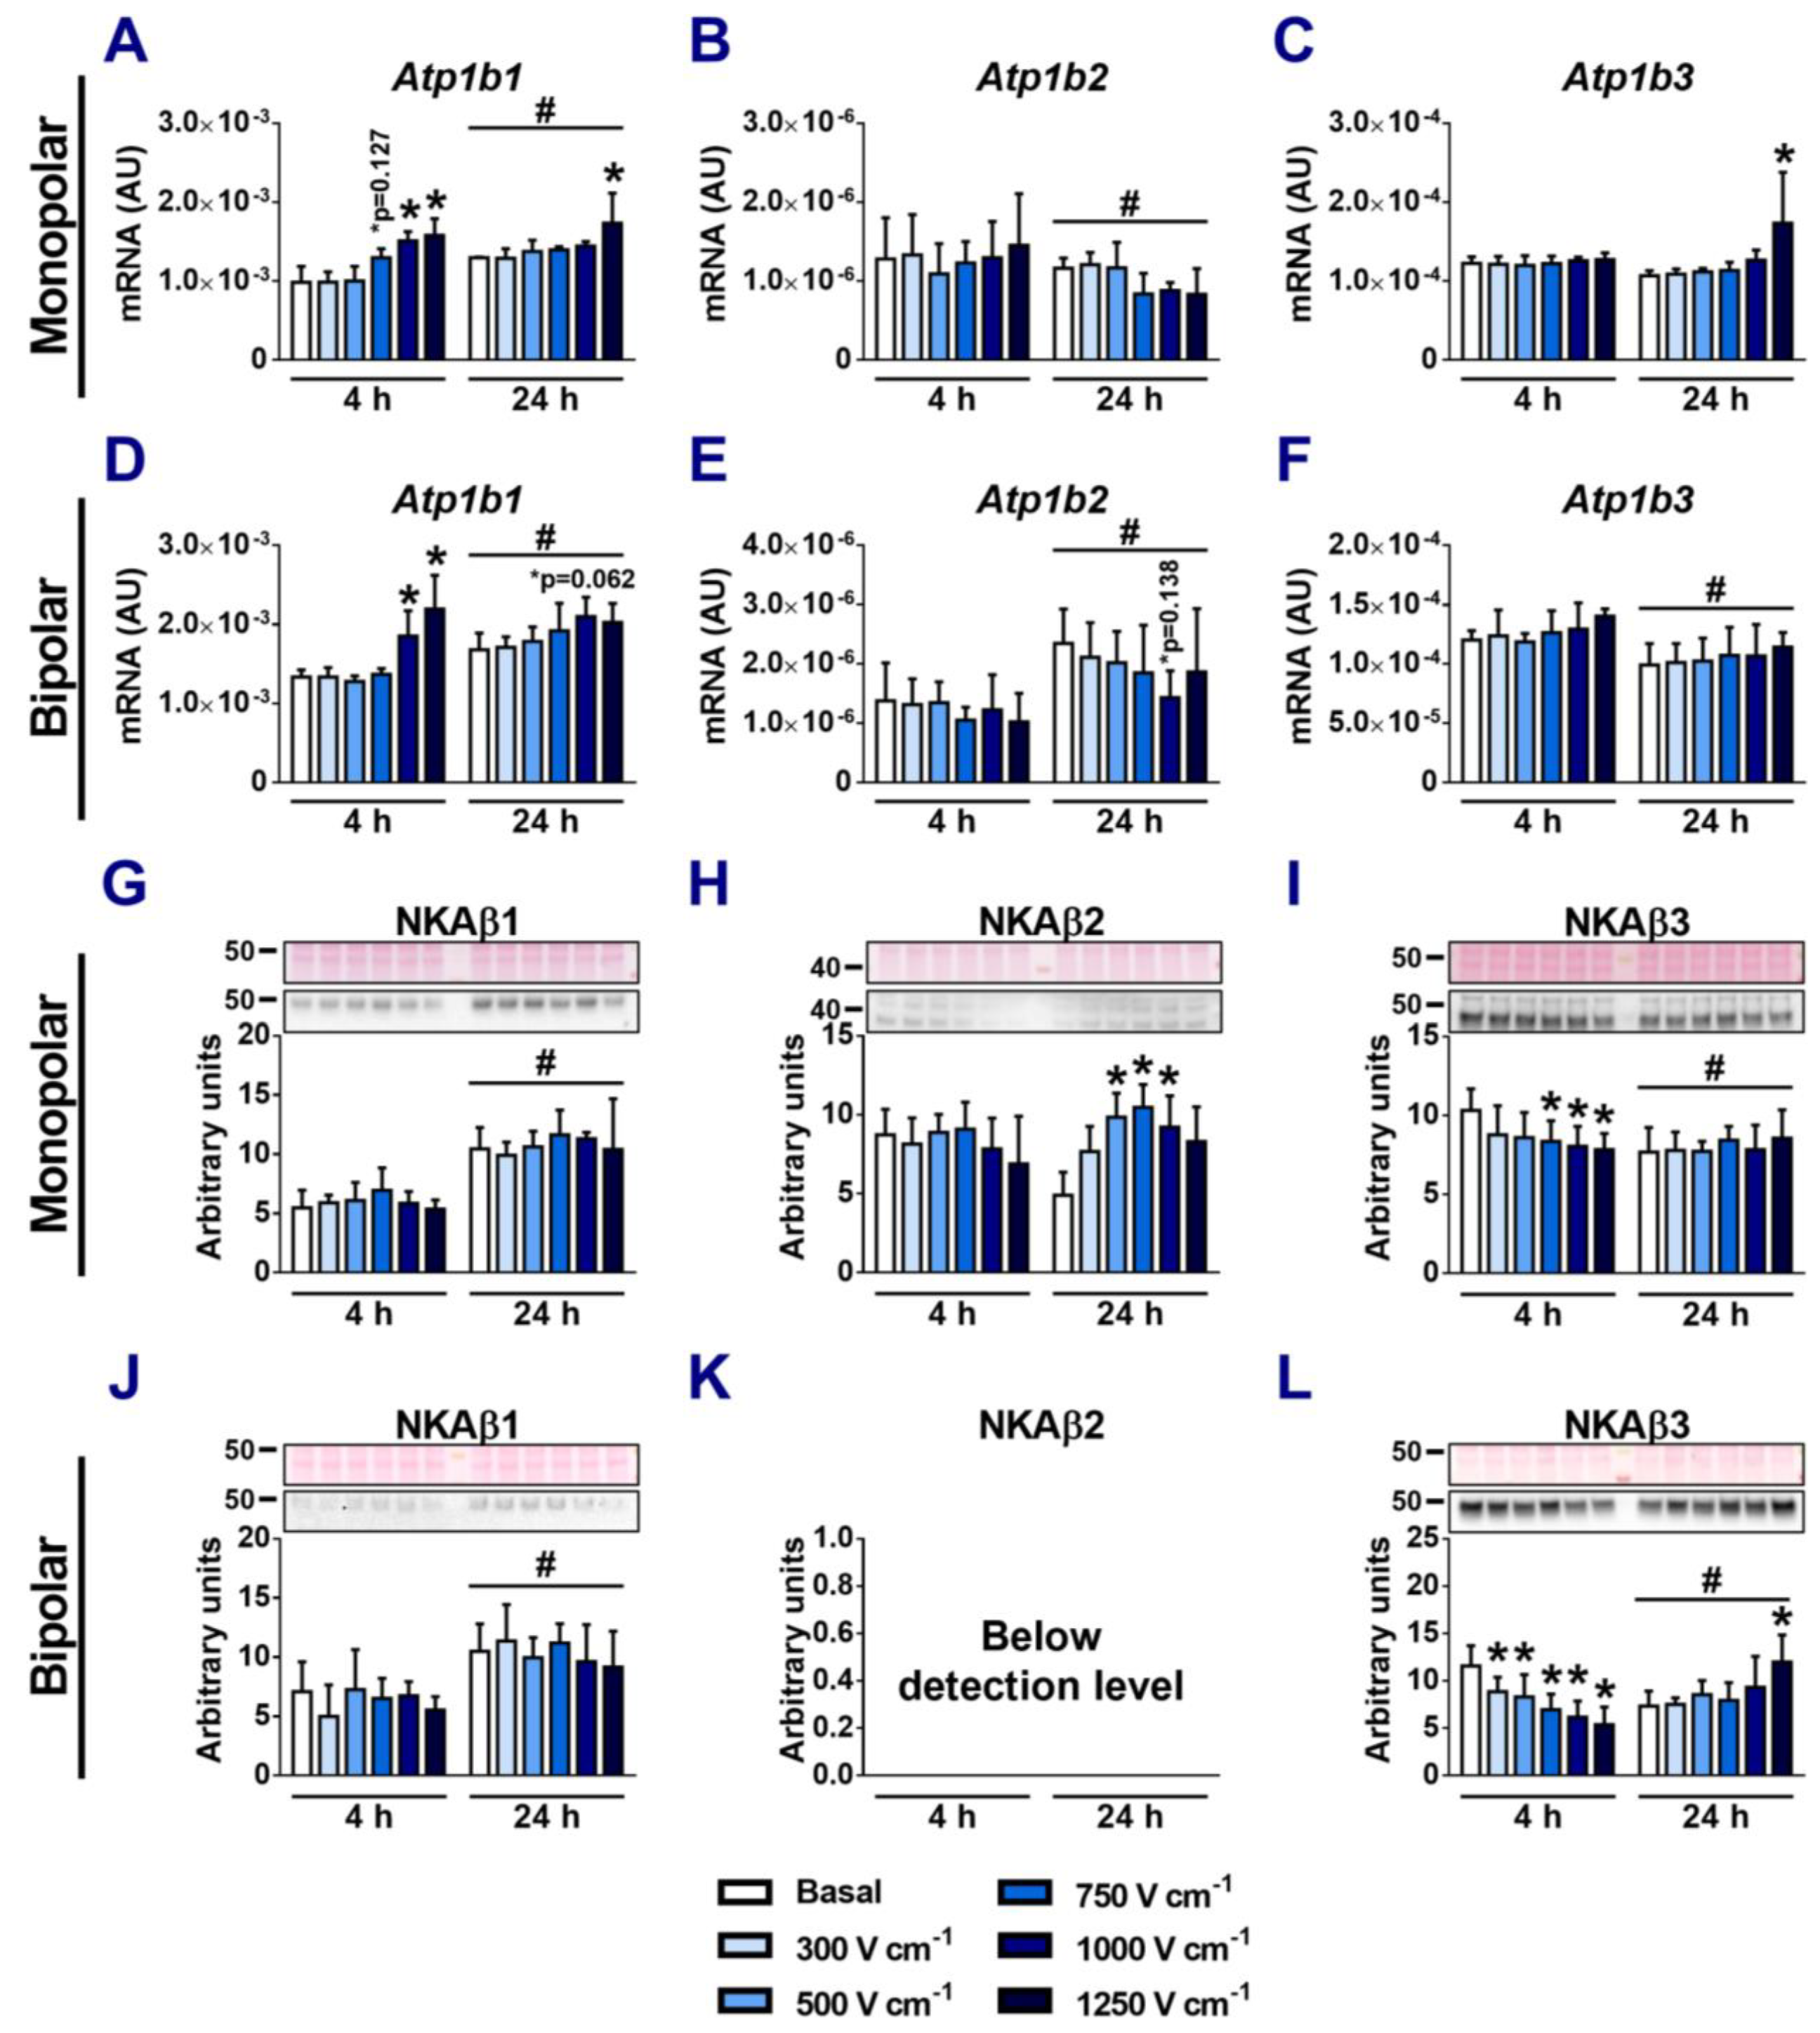
3.4. Effects of Electroporation on the Expression of NKA β-Subunits
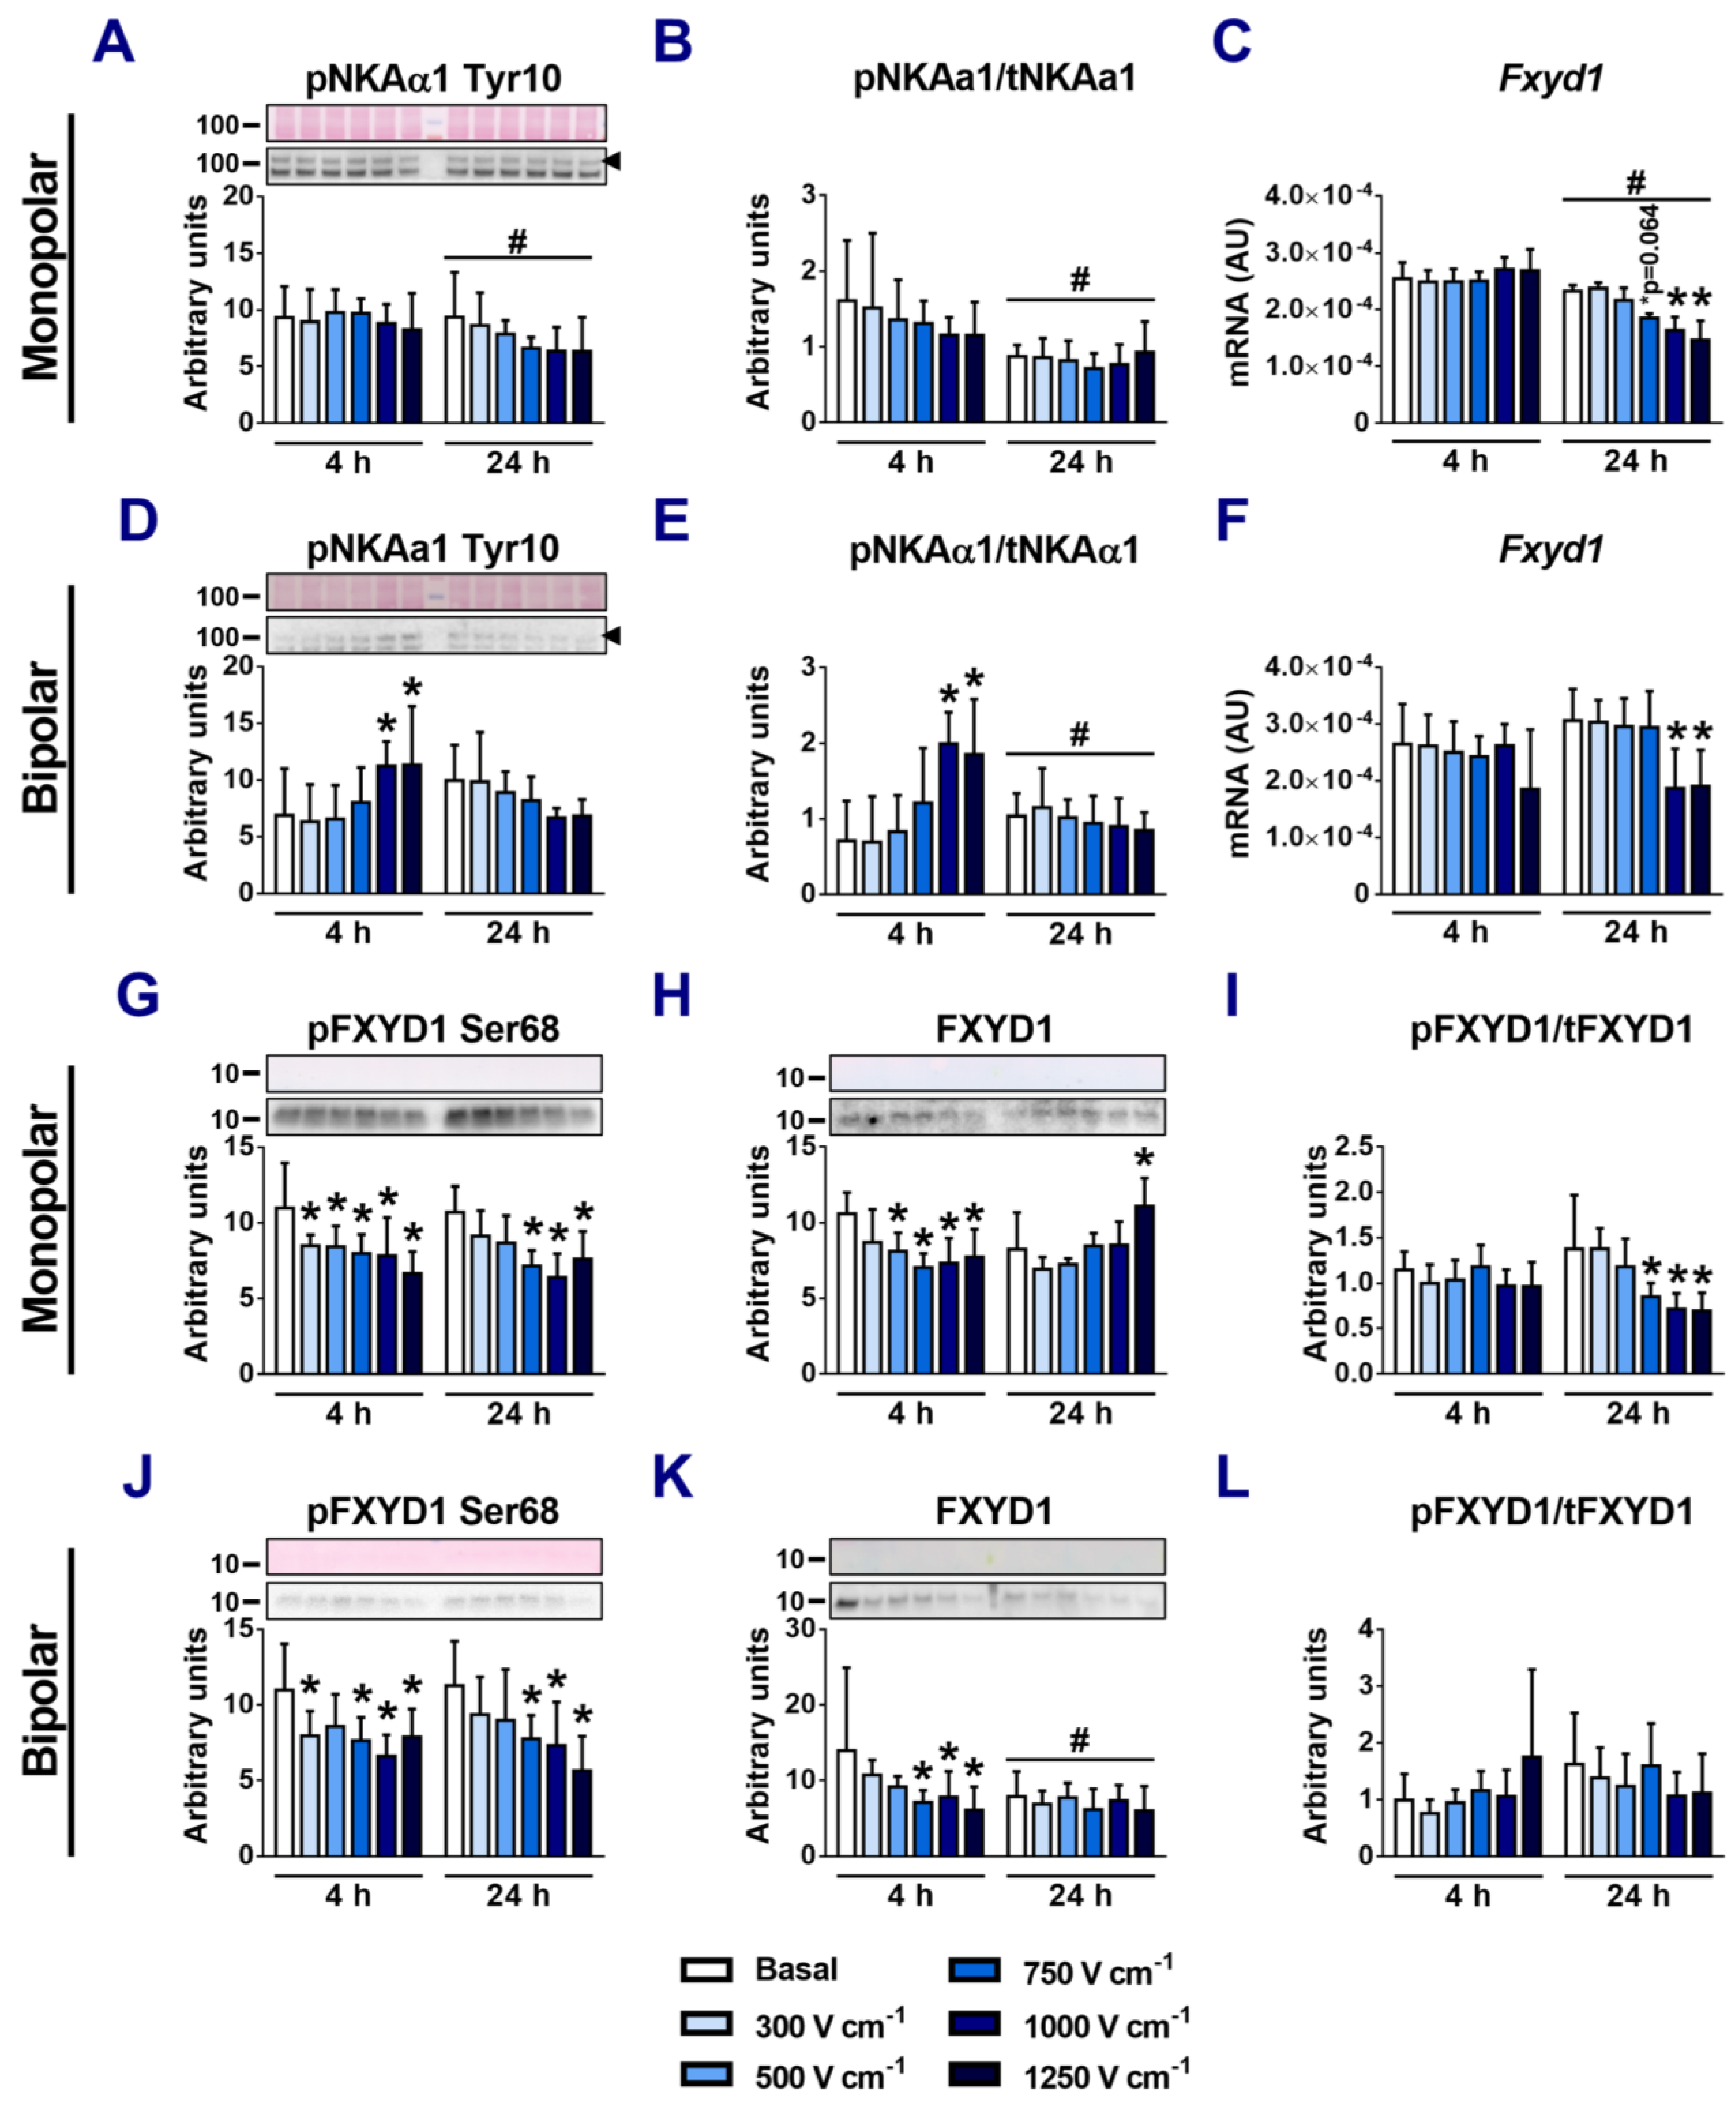
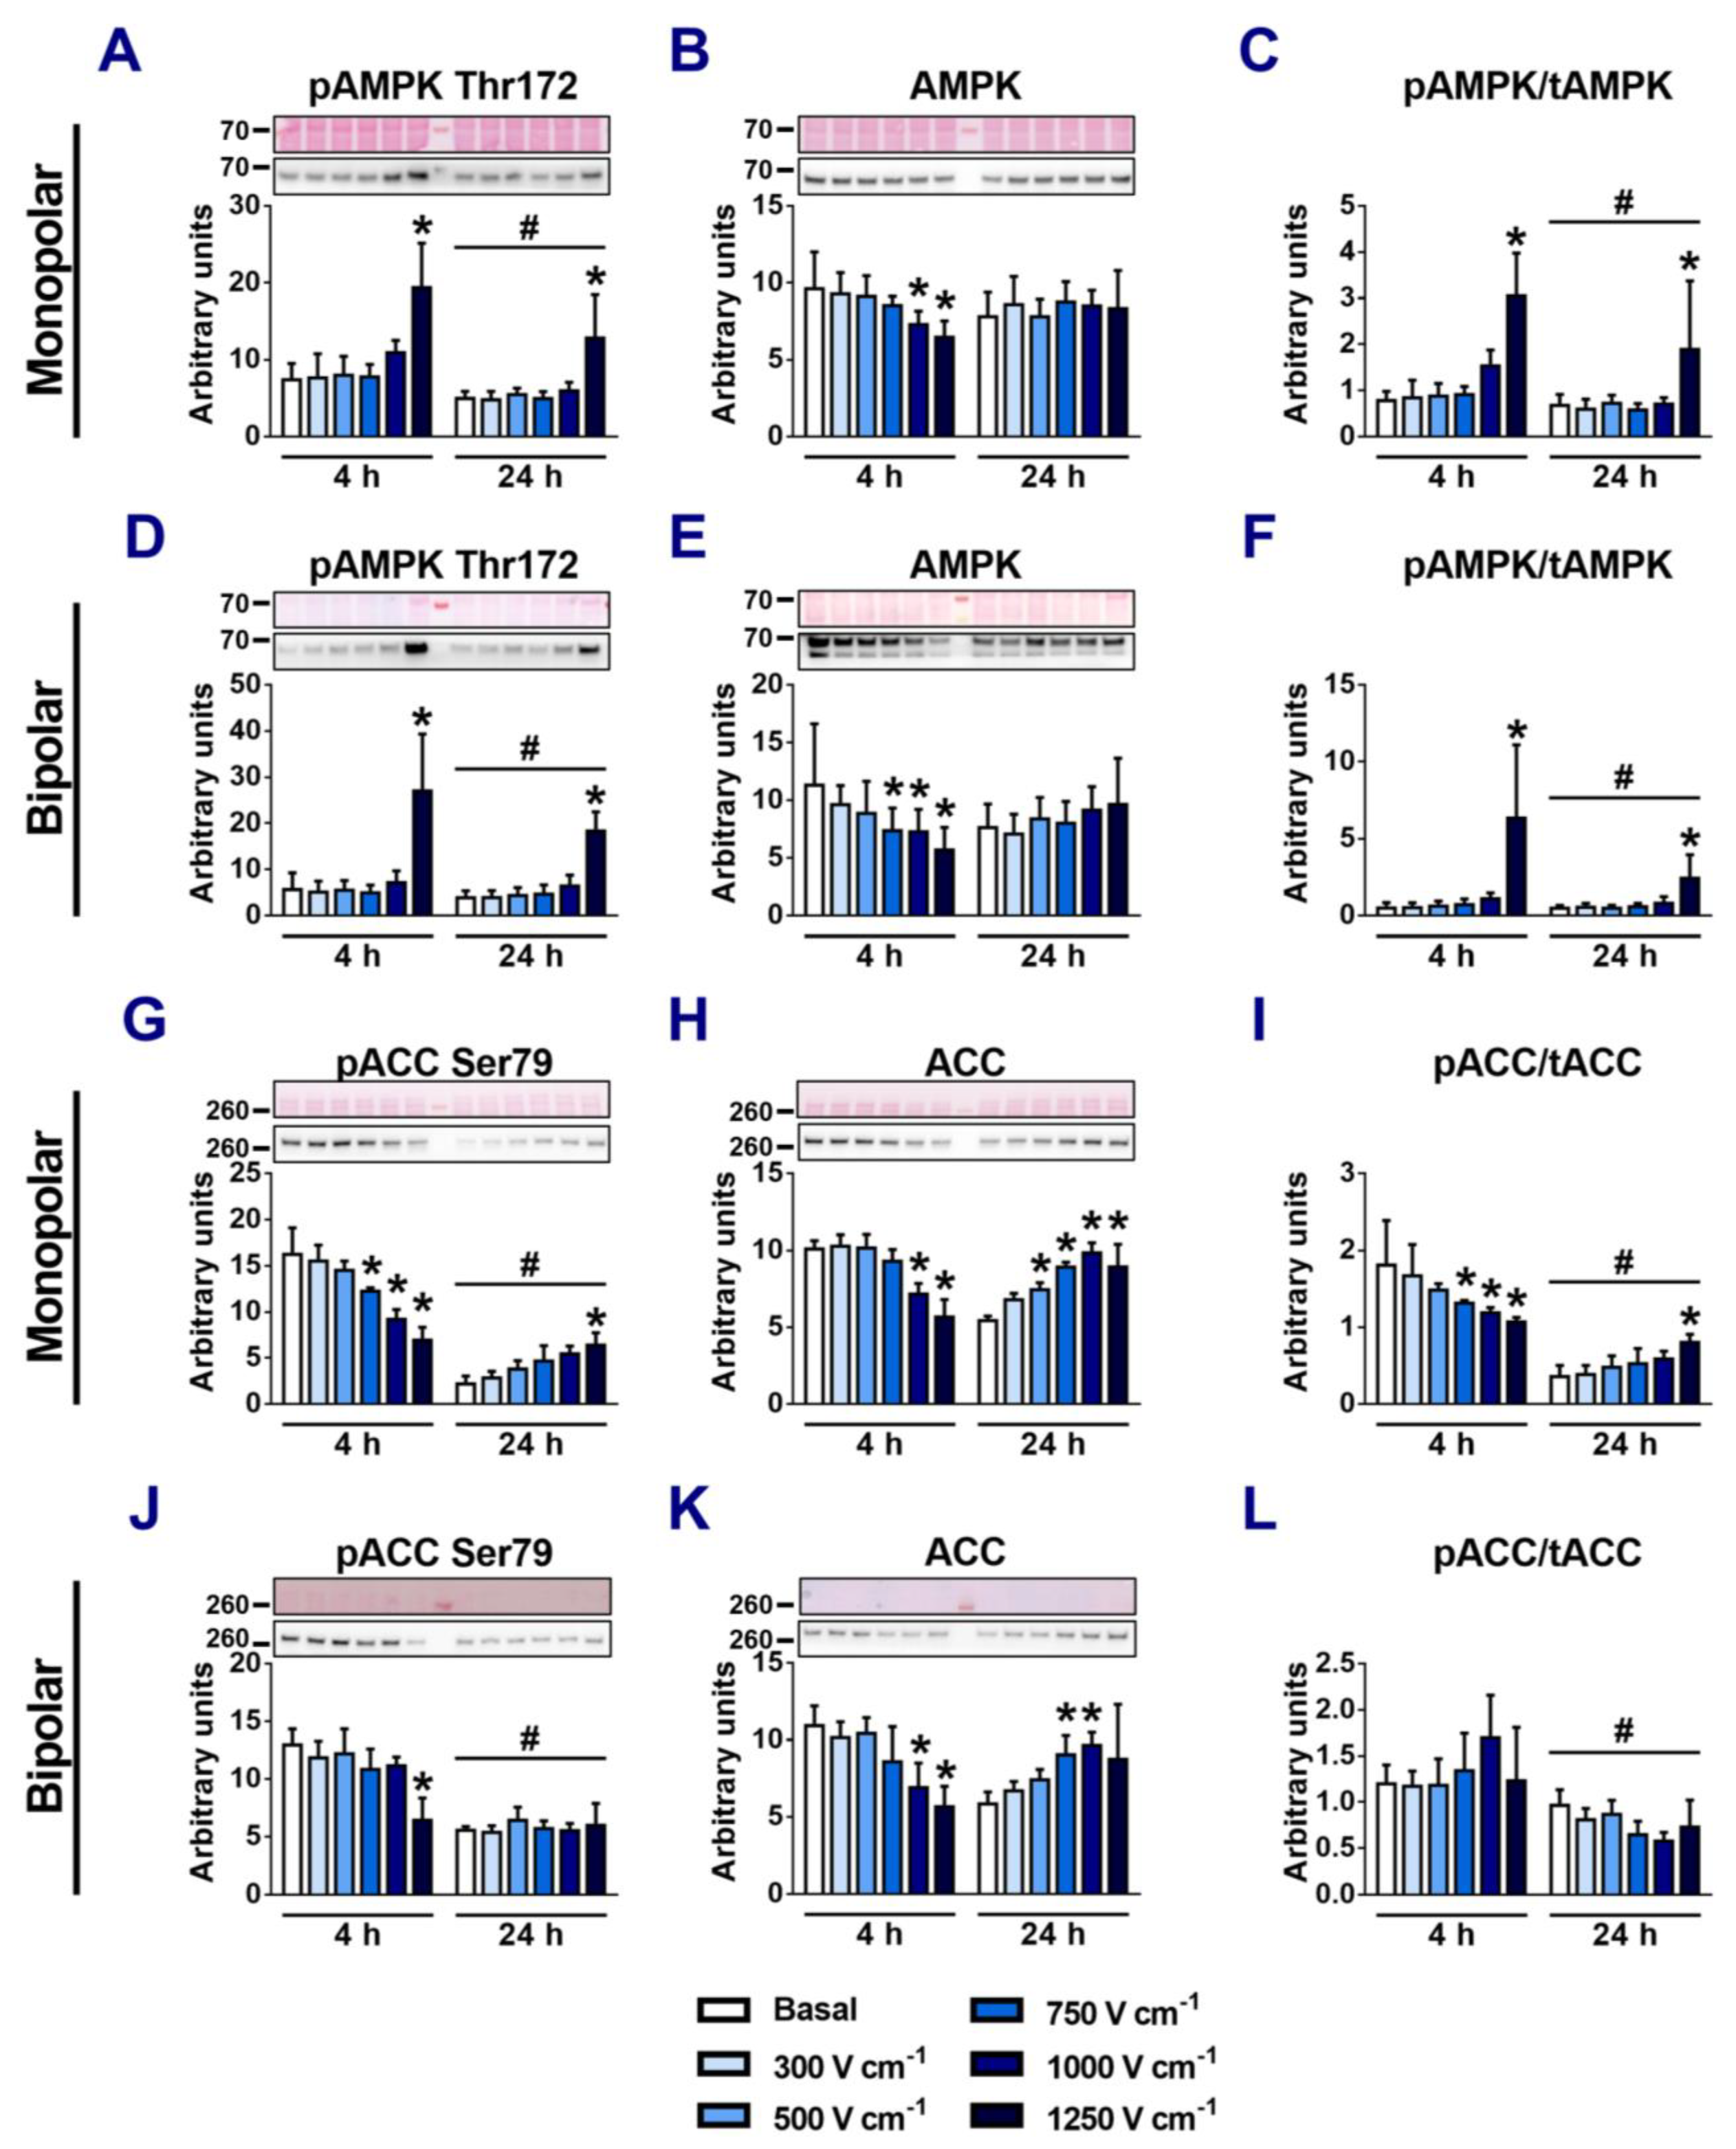
3.5. Effects of Electroporation on Phosphorylation of NKAα1 and FXYD1
3.6. The Role of AMPK in Regulation of NKA Ion Pump Activity in Electroporated Cells
4. Discussion
5. Conclusions
Supplementary Materials
Author Contributions
Funding
Institutional Review Board Statement
Informed Consent Statement
Data Availability Statement
Acknowledgments
Conflicts of Interest
References
- Padfield, G.J.; Steinberg, C.; Swampillai, J.; Qian, H.; Connolly, S.J.; Dorian, P.; Green, M.S.; Humphries, K.H.; Klein, G.J.; Sheldon, R.; et al. Progression of Paroxysmal to Persistent Atrial Fibrillation: 10-Year Follow-up in the Canadian Registry of Atrial Fibrillation. Heart Rhythm 2017, 14, 801–807. [Google Scholar] [CrossRef]
- Hindricks, G.; Potpara, T.; Dagres, N.; Arbelo, E.; Bax, J.J.; Blomström-Lundqvist, C.; Boriani, G.; Castella, M.; Dan, G.-A.; Dilaveris, P.E.; et al. 2020 ESC Guidelines for the Diagnosis and Management of Atrial Fibrillation Developed in Collaboration with the European Association for Cardio-Thoracic Surgery (EACTS). Eur. Heart J. 2021, 42, 373–498. [Google Scholar] [CrossRef]
- Verma, A.; Asivatham, S.J.; Deneke, T.; Castellvi, Q.; Neal, R.E. Primer on Pulsed Electrical Field Ablation: Understanding the Benefits and Limitations. Circ. Arrhythmia Electrophysiol. 2021, 14, e010086. [Google Scholar] [CrossRef] [PubMed]
- Bradley, C.J.; Haines, D.E. Pulsed Field Ablation for Pulmonary Vein Isolation in the Treatment of Atrial Fibrillation. Cardiovasc. Electrophysiol. 2020, 31, 2136–2147. [Google Scholar] [CrossRef] [PubMed]
- Reddy, V.Y.; Neuzil, P.; Koruth, J.S.; Petru, J.; Funosako, M.; Cochet, H.; Sediva, L.; Chovanec, M.; Dukkipati, S.R.; Jais, P. Pulsed Field Ablation for Pulmonary Vein Isolation in Atrial Fibrillation. J. Am. Coll. Cardiol. 2019, 74, 315–326. [Google Scholar] [CrossRef] [PubMed]
- Reddy, V.Y.; Koruth, J.; Jais, P.; Petru, J.; Timko, F.; Skalsky, I.; Hebeler, R.; Labrousse, L.; Barandon, L.; Kralovec, S.; et al. Ablation of Atrial Fibrillation With Pulsed Electric Fields. JACC Clin. Electrophysiol. 2018, 4, 987–995. [Google Scholar] [CrossRef] [PubMed]
- Nakagawa, H.; Castellvi, Q.; Neal, R.; Girouard, S.; Laughner, J.; Ikeda, A.; Sugawara, M.; An, Y.; Hussein, A.A.; Nakhla, S.; et al. Effects of Contact Force on Lesion Size During Pulsed Field Catheter Ablation: Histochemical Characterization of Ventricular Lesion Boundaries. Circ. Arrhythmia Electrophysiol. 2024, 17, e012026. [Google Scholar] [CrossRef]
- Tan, N.Y.; Ladas, T.P.; Christopoulos, G.; Sugrue, A.M.; Van Zyl, M.; Ladejobi, A.O.; Lodhi, F.K.; Hu, T.Y.; Ezzeddine, F.M.; Agboola, K.; et al. Ventricular Nanosecond Pulsed Electric Field Delivery Using Active Fixation Leads: A Proof-of-Concept Preclinical Study. J. Interv. Card. Electrophysiol. 2022. [Google Scholar] [CrossRef] [PubMed]
- Sandhu, U.; Alkukhun, L.; Kheiri, B.; Hodovan, J.; Chiang, K.; Splanger, T.; Castellvi, Q.; Zhao, Y.; Nazer, B. In Vivo Pulsed-Field Ablation in Healthy vs. Chronically Infarcted Ventricular Myocardium: Biophysical and Histologic Characterization. EP Eur. 2023, 25, 1503–1509. [Google Scholar] [CrossRef]
- Ouss, A.; Van Stratum, L.; Van Der Voort, P.; Dekker, L. First in Human Pulsed Field Ablation to Treat Scar-Related Ventricular Tachycardia in Ischemic Heart Disease: A Case Report. J. Interv. Card. Electrophysiol. 2022, 66, 509–510. [Google Scholar] [CrossRef]
- Younis, A.; Zilberman, I.; Krywanczyk, A.; Higuchi, K.; Yavin, H.D.; Sroubek, J.; Anter, E. Effect of Pulsed-Field and Radiofrequency Ablation on Heterogeneous Ventricular Scar in a Swine Model of Healed Myocardial Infarction. Circ. Arrhythmia Electrophysiol. 2022, 15, e011209. [Google Scholar] [CrossRef]
- Im, S.I.; Higuchi, S.; Lee, A.; Stillson, C.; Buck, E.; Morrow, B.; Schenider, K.; Speltz, M.; Gerstenfeld, E.P. Pulsed Field Ablation of Left Ventricular Myocardium in a Swine Infarct Model. JACC Clin. Electrophysiol. 2022, 8, 722–731. [Google Scholar] [CrossRef]
- Sugrue, A.; Vaidya, V.R.; Livia, C.; Padmanabhan, D.; Abudan, A.; Isath, A.; Witt, T.; DeSimone, C.V.; Stalboerger, P.; Kapa, S.; et al. Feasibility of Selective Cardiac Ventricular Electroporation. PLoS ONE 2020, 15, e0229214. [Google Scholar] [CrossRef] [PubMed]
- Kotnik, T.; Rems, L.; Tarek, M.; Miklavčič, D. Membrane Electroporation and Electropermeabilization: Mechanisms and Models. Annu. Rev. Biophys. 2019, 48, 63–91. [Google Scholar] [CrossRef] [PubMed]
- Hartl, S.; Reinsch, N.; Füting, A.; Neven, K. Pearls and Pitfalls of Pulsed Field Ablation. Korean Circ. J. 2023, 53, 273. [Google Scholar] [CrossRef] [PubMed]
- Batista Napotnik, T.; Polajžer, T.; Miklavčič, D. Cell Death Due to Electroporation—A Review. Bioelectrochemistry 2021, 141, 107871. [Google Scholar] [CrossRef] [PubMed]
- Reddy, V.Y.; Gerstenfeld, E.P.; Natale, A.; Whang, W.; Cuoco, F.A.; Patel, C.; Mountantonakis, S.E.; Gibson, D.N.; Harding, J.D.; Ellis, C.R.; et al. Pulsed Field or Conventional Thermal Ablation for Paroxysmal Atrial Fibrillation. N. Engl. J. Med. 2023, 389, 1660–1671. [Google Scholar] [CrossRef]
- Verma, A.; Haines, D.E.; Boersma, L.V.; Sood, N.; Natale, A.; Marchlinski, F.E.; Calkins, H.; Sanders, P.; Packer, D.L.; Kuck, K.-H.; et al. Pulsed Field Ablation for the Treatment of Atrial Fibrillation: PULSED AF Pivotal Trial. Circulation 2023, 147, 1422–1432. [Google Scholar] [CrossRef]
- Howard, B.; Haines, D.E.; Verma, A.; Packer, D.; Kirchhof, N.; Barka, N.; Onal, B.; Fraasch, S.; Miklavčič, D.; Stewart, M.T. Reduction in Pulmonary Vein Stenosis and Collateral Damage With Pulsed Field Ablation Compared With Radiofrequency Ablation in a Canine Model. Circ. Arrhythmia Electrophysiol. 2020, 13, e008337. [Google Scholar] [CrossRef]
- Stewart, M.T.; Haines, D.E.; Miklavčič, D.; Kos, B.; Kirchhof, N.; Barka, N.; Mattison, L.; Martien, M.; Onal, B.; Howard, B.; et al. Safety and Chronic Lesion Characterization of Pulsed Field Ablation in a Porcine Model. J. Cardiovasc. Electrophysiol. 2021, 32, 958–969. [Google Scholar] [CrossRef]
- Cvetkoska, A.; Maček-Lebar, A.; Polajžer, T.; Reberšek, M.; Upchurch, W.; Iaizzo, P.A.; Sigg, D.C.; Miklavčič, D. The Effects of Interphase and Interpulse Delays and Pulse Widths on Induced Muscle Contractions, Pain and Therapeutic Efficacy in Electroporation-Based Therapies. JCDD 2023, 10, 490. [Google Scholar] [CrossRef]
- Koruth, J.S.; Neuzil, P.; Kawamura, I.; Kuroki, K.; Petru, J.; Rackauskas, G.; Funasako, M.; Aidietis, A.; Reddy, V.Y. Reversible Pulsed Electrical Fields as an In Vivo Tool to Study Cardiac Electrophysiology: The Advent of Pulsed Field Mapping. Circ. Arrhythmia Electrophysiol. 2023, 16, e012018. [Google Scholar] [CrossRef]
- Chaigne, S.; Sigg, D.C.; Stewart, M.T.; Hocini, M.; Batista Napotnik, T.; Miklavčič, D.; Bernus, O.; Benoist, D. Reversible and Irreversible Effects of Electroporation on Contractility and Calcium Homeostasis in Isolated Cardiac Ventricular Myocytes. Circ. Arrhythm Electrophysiol. 2022, 15, e011131. [Google Scholar] [CrossRef] [PubMed]
- Hunter, D.W.; Kostecki, G.; Fish, J.M.; Jensen, J.A.; Tandri, H. In Vitro Cell Selectivity of Reversible and Irreversible: Electroporation in Cardiac Tissue. Circ. Arrhythmia Electrophysiol. 2021, 14, e008817. [Google Scholar] [CrossRef] [PubMed]
- Tung, L.; Tovar, O.; Neunlist, M.; Jain, S.K.; O’Neill, R.J. Effects of Strong Electrical Shock on Cardiac Muscle Tissuea. Ann. N. Y. Acad. Sci. 1994, 720, 160–175. [Google Scholar] [CrossRef] [PubMed]
- Rems, L.; Kasimova, M.A.; Testa, I.; Delemotte, L. Pulsed Electric Fields Can Create Pores in the Voltage Sensors of Voltage-Gated Ion Channels. Biophys. J. 2020, 119, 190–205. [Google Scholar] [CrossRef]
- Doenst, T.; Nguyen, T.D.; Abel, E.D. Cardiac Metabolism in Heart Failure: Implications Beyond ATP Production. Circ. Res. 2013, 113, 709–724. [Google Scholar] [CrossRef] [PubMed]
- Gibbs, C.L. Cardiac Energetics. Physiol. Rev. 1978, 58, 174–254. [Google Scholar] [CrossRef]
- Suga, H. Ventricular Energetics. Physiol. Rev. 1990, 70, 247–277. [Google Scholar] [CrossRef]
- Frandsen, S.K.; Vissing, M.; Gehl, J. A Comprehensive Review of Calcium Electroporation—A Novel Cancer Treatment Modality. Cancers 2020, 12, 290. [Google Scholar] [CrossRef]
- Frandsen, S.K.; Gissel, H.; Hojman, P.; Tramm, T.; Eriksen, J.; Gehl, J. Direct Therapeutic Applications of Calcium Electroporation to Effectively Induce Tumor Necrosis. Cancer Res. 2012, 72, 1336–1341. [Google Scholar] [CrossRef]
- Polajžer, T.; Miklavčič, D. Immunogenic Cell Death in Electroporation-Based Therapies Depends on Pulse Waveform Characteristics. Vaccines 2023, 11, 1036. [Google Scholar] [CrossRef]
- Teissie, J.; Tsong, T.Y. Evidence of Voltage-Induced Channel Opening in Na/K ATPase of Human Erythrocyte Membrane. J. Membrain Biol. 1980, 55, 133–140. [Google Scholar] [CrossRef]
- Hardie, D.G.; Hawley, S.A. AMP-Activated Protein Kinase: The Energy Charge Hypothesis Revisited. Bioessays 2001, 23, 1112–1119. [Google Scholar] [CrossRef]
- Hardie, D.G. Molecular Pathways: Is AMPK a Friend or a Foe in Cancer? Clin. Cancer Res. 2015, 21, 3836–3840. [Google Scholar] [CrossRef] [PubMed]
- Hardie, D.G.; Ross, F.A.; Hawley, S.A. AMPK: A Nutrient and Energy Sensor That Maintains Energy Homeostasis. Nat. Rev. Mol. Cell Biol. 2012, 13, 251–262. [Google Scholar] [CrossRef]
- Ono, H.; Suzuki, N.; Kanno, S.; Kawahara, G.; Izumi, R.; Takahashi, T.; Kitajima, Y.; Osana, S.; Nakamura, N.; Akiyama, T.; et al. AMPK Complex Activation Promotes Sarcolemmal Repair in Dysferlinopathy. Mol. Ther. 2020, 28, 1133–1153. [Google Scholar] [CrossRef] [PubMed]
- Grahame Hardie, D. Regulation of AMP-Activated Protein Kinase by Natural and Synthetic Activators. Acta Pharm. Sin. B 2016, 6, 1–19. [Google Scholar] [CrossRef]
- Benziane, B.; Björnholm, M.; Pirkmajer, S.; Austin, R.L.; Kotova, O.; Viollet, B.; Zierath, J.R.; Chibalin, A.V. Activation of AMP-Activated Protein Kinase Stimulates Na+,K+-ATPase Activity in Skeletal Muscle Cells. J. Biol. Chem. 2012, 287, 23451–23463. [Google Scholar] [CrossRef]
- Schneider, H.; Schubert, K.M.; Blodow, S.; Kreutz, C.-P.; Erdogmus, S.; Wiedenmann, M.; Qiu, J.; Fey, T.; Ruth, P.; Lubomirov, L.T.; et al. AMPK Dilates Resistance Arteries via Activation of SERCA and BK Ca Channels in Smooth Muscle. Hypertension 2015, 66, 108–116. [Google Scholar] [CrossRef] [PubMed]
- Morotomi-Yano, K.; Akiyama, H.; Yano, K. Nanosecond Pulsed Electric Fields Activate AMP-Activated Protein Kinase: Implications for Calcium-Mediated Activation of Cellular Signaling. Biochem. Biophys. Res. Commun. 2012, 428, 371–375. [Google Scholar] [CrossRef]
- Dermol-Černe, J.; Miklavčič, D.; Reberšek, M.; Mekuč, P.; Bardet, S.M.; Burke, R.; Arnaud-Cormos, D.; Leveque, P.; O’Connor, R. Plasma Membrane Depolarization and Permeabilization Due to Electric Pulses in Cell Lines of Different Excitability. Bioelectrochemistry 2018, 122, 103–114. [Google Scholar] [CrossRef]
- Raso, J.; Frey, W.; Ferrari, G.; Pataro, G.; Knorr, D.; Teissie, J.; Miklavčič, D. Recommendations Guidelines on the Key Information to Be Reported in Studies of Application of PEF Technology in Food and Biotechnological Processes. Innov. Food Sci. Emerg. Technol. 2016, 37, 312–321. [Google Scholar] [CrossRef]
- Cemazar, M.; Sersa, G.; Frey, W.; Miklavcic, D.; Teissié, J. Recommendations and Requirements for Reporting on Applications of Electric Pulse Delivery for Electroporation of Biological Samples. Bioelectrochemistry 2018, 122, 69–76. [Google Scholar] [CrossRef] [PubMed]
- Campana, L.G.; Clover, A.J.P.; Valpione, S.; Quaglino, P.; Gehl, J.; Kunte, C.; Snoj, M.; Cemazar, M.; Rossi, C.R.; Miklavcic, D.; et al. Recommendations for Improving the Quality of Reporting Clinical Electrochemotherapy Studies Based on Qualitative Systematic Review. Radiol. Oncol. 2016, 50, 1–13. [Google Scholar] [CrossRef] [PubMed]
- Peng, W.; Polajžer, T.; Yao, C.; Miklavčič, D. Dynamics of Cell Death Due to Electroporation Using Different Pulse Parameters as Revealed by Different Viability Assays. Ann. Biomed. Eng. 2023, 52, 22–35. [Google Scholar] [CrossRef] [PubMed]
- Ruijter, J.M.; Ramakers, C.; Hoogaars, W.M.H.; Karlen, Y.; Bakker, O.; Van Den Hoff, M.J.B.; Moorman, A.F.M. Amplification Efficiency: Linking Baseline and Bias in the Analysis of Quantitative PCR Data. Nucleic Acids Res. 2009, 37, e45. [Google Scholar] [CrossRef] [PubMed]
- Tuomi, J.M.; Voorbraak, F.; Jones, D.L.; Ruijter, J.M. Bias in the Cq Value Observed with Hydrolysis Probe Based Quantitative PCR Can Be Corrected with the Estimated PCR Efficiency Value. Methods 2010, 50, 313–322. [Google Scholar] [CrossRef] [PubMed]
- Frandsen, S.K.; Gehl, J. Effect of Calcium Electroporation in Combination with Metformin in Vivo and Correlation between Viability and Intracellular ATP Level after Calcium Electroporation in Vitro. PLoS ONE 2017, 12, e0181839. [Google Scholar] [CrossRef] [PubMed]
- Periasamy, M.; Kalyanasundaram, A. SERCA Pump Isoforms: Their Role in Calcium Transport and Disease. Muscle Nerve 2007, 35, 430–442. [Google Scholar] [CrossRef]
- Dally, S.; Corvazier, E.; Bredoux, R.; Bobe, R.; Enouf, J. Multiple and Diverse Coexpression, Location, and Regulation of Additional SERCA2 and SERCA3 Isoforms in Nonfailing and Failing Human Heart. J. Mol. Cell. Cardiol. 2010, 48, 633–644. [Google Scholar] [CrossRef]
- Bhupathy, P.; Babu, G.J.; Ito, M.; Periasamy, M. Threonine-5 at the N-Terminus Can Modulate Sarcolipin Function in Cardiac Myocytes. J. Mol. Cell. Cardiol. 2009, 47, 723–729. [Google Scholar] [CrossRef]
- McDonough, A.A.; Velotta, J.B.; Schwinger, R.H.G.; Philipson, K.D.; Farley, R.A. The Cardiac Sodium Pump: Structure and Function. Basic Res. Cardiol. 2002, 97, I19–I24. [Google Scholar] [CrossRef]
- Skogestad, J.; Aronsen, J.M. Regulation of Cardiac Contractility by the Alpha 2 Subunit of the Na+/K+-ATPase. Front. Physiol. 2022, 13, 827334. [Google Scholar] [CrossRef] [PubMed]
- Silkuniene, G.; Mangalanathan, U.M.; Pakhomov, A.G.; Pakhomova, O.N. Silencing of ATP1A1 Attenuates Cell Membrane Disruption by Nanosecond Electric Pulses. Biochem. Biophys. Res. Commun. 2023, 677, 93–97. [Google Scholar] [CrossRef] [PubMed]
- Han, F.; Tucker, A.L.; Lingrel, J.B.; Despa, S.; Bers, D.M. Extracellular Potassium Dependence of the Na+-K+-ATPase in Cardiac Myocytes: Isoform Specificity and Effect of Phospholemman. Am. J. Physiol.-Cell Physiol. 2009, 297, C699–C705. [Google Scholar] [CrossRef]
- Stanley, C.M.; Gagnon, D.G.; Bernal, A.; Meyer, D.J.; Rosenthal, J.J.; Artigas, P. Importance of the Voltage Dependence of Cardiac Na/K ATPase Isozymes. Biophys. J. 2015, 109, 1852–1862. [Google Scholar] [CrossRef]
- Pakhomov, A.G.; Kolb, J.F.; White, J.A.; Joshi, R.P.; Xiao, S.; Schoenbach, K.H. Long-lasting Plasma Membrane Permeabilization in Mammalian Cells by Nanosecond Pulsed Electric Field (nsPEF). Bioelectromagnetics 2007, 28, 655–663. [Google Scholar] [CrossRef] [PubMed]
- Batista Napotnik, T.; Kos, B.; Jarm, T.; Miklavčič, D.; O’Connor, R.P.; Rems, L. Genetically Engineered HEK Cells as a Valuable Tool for Studying Electroporation in Excitable Cells. Sci. Rep. 2024, 14, 720. [Google Scholar] [CrossRef] [PubMed]
- Ackermann, U.; Geering, K. Mutual Dependence of Na,K-ATPase A- and Β-subunits for Correct Posttranslational Processing and Intracellular Transport. FEBS Lett. 1990, 269, 105–108. [Google Scholar] [CrossRef]
- Therien, A.G.; Blostein, R. Mechanisms of Sodium Pump Regulation. Am. J. Physiol.-Cell Physiol. 2000, 279, C541–C566. [Google Scholar] [CrossRef] [PubMed]
- Crambert, G.; Füzesi, M.; Garty, H.; Karlish, S.; Geering, K. Phospholemman (FXYD1) Associates with Na,K-ATPase and Regulates Its Transport Properties. Proc. Natl. Acad. Sci. USA 2002, 99, 11476–11481. [Google Scholar] [CrossRef] [PubMed]
- Pirkmajer, S.; Chibalin, A.V. Na,K-ATPase Regulation in Skeletal Muscle. Am. J. Physiol.-Endocrinol. Metab. 2016, 311, E1–E31. [Google Scholar] [CrossRef]
- Gusarova, G.A.; Trejo, H.E.; Dada, L.A.; Briva, A.; Welch, L.C.; Hamanaka, R.B.; Mutlu, G.M.; Chandel, N.S.; Prakriya, M.; Sznajder, J.I. Hypoxia Leads to Na,K-ATPase Downregulation via Ca2+ Release-Activated Ca2+ Channels and AMPK Activation. Mol. Cell. Biol. 2011, 31, 3546–3556. [Google Scholar] [CrossRef] [PubMed]
- Buchanan, R.; Nielsen, O.B.; Clausen, T. Excitation- and β2-agonist-induced Activation of the Na+−K+ Pump in Rat Soleus Muscle. J. Physiol. 2002, 545, 229–240. [Google Scholar] [CrossRef]
- Clausen, T.; Gissel, H. Role of Na+, K+ Pumps in Restoring Contractility Following Loss of Cell Membrane Integrity in Rat Skeletal Muscle. Acta Physiol. Scand. 2005, 183, 263–271. [Google Scholar] [CrossRef]
- Cindrič, H.; Kos, B.; Miklavčič, D. Electrodes and Electric Field Distribution in Clinical Practice. In Electroporation in Veterinary Oncology Practice; Impellizeri, J.A., Ed.; Springer International Publishing: Cham, Switzerland, 2021; pp. 21–59. ISBN 978-3-030-80667-5. [Google Scholar]
- Kuznetsov, A.V.; Javadov, S.; Sickinger, S.; Frotschnig, S.; Grimm, M. H9c2 and HL-1 Cells Demonstrate Distinct Features of Energy Metabolism, Mitochondrial Function and Sensitivity to Hypoxia-Reoxygenation. Biochim. Et Biophys. Acta (BBA)-Mol. Cell Res. 2015, 1853, 276–284. [Google Scholar] [CrossRef]


| Antibody | Host | Type | Dilution | Supplier | Cat. No. |
|---|---|---|---|---|---|
| NKAα1 Tyr10 | Rabbit | Monoclonal | 1:500 | CST | 13566 |
| NKAβ1 | Rabbit | Monoclonal | 1:1000 | CST | 62849 |
| NKAβ2 | Rabbit | Polyclonal | 1:500 | TFS | PA5-121248 |
| NKAβ3 (CD298) | Rabbit | Monoclonal | 1:1000 | Invitrogen | MA5-37934 |
| SERCA1 | Rabbit | Polyclonal | 1:1000 | CST | 4219 |
| SERCA2 | Rabbit | Monoclonal | 1:1000 | CST | 9580 |
| Pln | Rabbit | Monoclonal | 1:500 | CST | 14562 |
| Pln Ser16/Thr17 | Rabbit | Polyclonal | 1:1000 | CST | 8496 |
| ACC | Rabbit | Monoclonal | 1:1000 | CST | 3676 |
| AMPKα | Rabbit | Polyclonal | 1:1000 | CST | 2532 |
| pAMPKα Thr172 | Rabbit | Monoclonal | 1:1000 | CST | 2535 |
| pACC Ser79 | Rabbit | Polyclonal | 1:1000 | CST | 3661 |
| NKAα1 | Mouse | Monoclonal | 1:2000 | Merck | 05-369 |
| NKAα2 | Rabbit | Polyclonal | 1:4000 | Merck | AB9094-I |
| NKAα3 | Mouse | Monoclonal | 1:1000 | TFS | MA3-915 |
| FXYD1 | Rabbit | Polyclonal | 1:1000 | Invitrogen | PA5-79288 |
| pFXYD1 Ser68 | Rabbit | Polyclonal | 1:500–2000 | TFS | PA5-99971 |
Disclaimer/Publisher’s Note: The statements, opinions and data contained in all publications are solely those of the individual author(s) and contributor(s) and not of MDPI and/or the editor(s). MDPI and/or the editor(s) disclaim responsibility for any injury to people or property resulting from any ideas, methods, instructions or products referred to in the content. |
© 2024 by the authors. Licensee MDPI, Basel, Switzerland. This article is an open access article distributed under the terms and conditions of the Creative Commons Attribution (CC BY) license (https://creativecommons.org/licenses/by/4.0/).
Share and Cite
Jan, V.; Jusović, M.; Miklavčič, D. Effects of Electroporation on the Function of Sarco/Endoplasmic Reticulum Ca2+-ATPase and Na+,K+-ATPase in H9c2 Cells. Appl. Sci. 2024, 14, 2695. https://doi.org/10.3390/app14072695
Jan V, Jusović M, Miklavčič D. Effects of Electroporation on the Function of Sarco/Endoplasmic Reticulum Ca2+-ATPase and Na+,K+-ATPase in H9c2 Cells. Applied Sciences. 2024; 14(7):2695. https://doi.org/10.3390/app14072695
Chicago/Turabian StyleJan, Vid, Maida Jusović, and Damijan Miklavčič. 2024. "Effects of Electroporation on the Function of Sarco/Endoplasmic Reticulum Ca2+-ATPase and Na+,K+-ATPase in H9c2 Cells" Applied Sciences 14, no. 7: 2695. https://doi.org/10.3390/app14072695
APA StyleJan, V., Jusović, M., & Miklavčič, D. (2024). Effects of Electroporation on the Function of Sarco/Endoplasmic Reticulum Ca2+-ATPase and Na+,K+-ATPase in H9c2 Cells. Applied Sciences, 14(7), 2695. https://doi.org/10.3390/app14072695