Review

Towards Sustainable Agriculture: A Critical Analysis of Agrobiodiversity Assessment Methods and Recommendations for Effective Implementation

by
Sara M. Marcelino
1,
Pedro Dinis Gaspar
1,*,
Arminda do Paço
2,
Tânia M. Lima
1,
Ana Monteiro
3,4,
José Carlos Franco
4,5,
Erika S. Santos
3,4,
Rebeca Campos
3 and
Carlos M. Lopes
3,4
1
C-MAST—Centre for Mechanical and Aerospace Science and Technologies, Department of Electromechanical Engineering, University of Beira Interior, 6201-001 Covilhã, Portugal
2
NECE—Research Unit in Business Sciences, Department of Management and Economics, University of Beira Interior, 6201-001 Covilhã, Portugal
3
LEAF—Linking Landscape, Environment, Agriculture and Food, School of Agriculture, University of Lisbon, 1649-004 Lisboa, Portugal
4
TERRA—Sustainable Land Use and Ecosystem Services, School of Agriculture, University of Lisbon, 1649-004 Lisboa, Portugal
5
CEF—Forest Research Centre, School of Agriculture, University of Lisbon, 1649-004 Lisboa, Portugal
*
Author to whom correspondence should be addressed.
Appl. Sci. 2024, 14(6), 2622; https://doi.org/10.3390/app14062622
Submission received: 27 February 2024 / Revised: 10 March 2024 / Accepted: 19 March 2024 / Published: 21 March 2024
(This article belongs to the Special Issue New Development in Smart Farming for Sustainable Agriculture)

Abstract

:
Agriculture intensification has driven the loss of biodiversity at a global level. The implementation of strategies to conserve and promote biodiversity in agricultural areas can be favoured by adequate assessment methods that foster the awareness of decision makers about the impact of management practices. This paper presents a state-of-the-art review of assessment methods of the overall biodiversity in agricultural systems, focusing on the quantitative methods applied, indicators of biodiversity, and functionalities. It was concluded that compensation effects and difficulties in interpretation are associated with currently common methodologies of composite indicator calculation to assess biodiversity performance. This review allowed for the identification and critical analysis of current methodologies for biodiversity assessments in the agricultural sector, and it highlighted the need for more implementation-oriented approaches. By providing recommendations on what should be considered when formulating biodiversity assessment methods, this study can contribute to the formulation of appropriate assessment frameworks for agricultural management policies and strategies.

1. Introduction

Agrobiodiversity refers to the diversity in the living organisms (plants, animals, microorganisms, etc.) that sustain agricultural systems [1,2], depending on the combination of some system characteristics, such as edaphoclimatic conditions, crop system, and management type.
Agriculture is both a threat to biodiversity and key to its survival [3]. Since the 1900s, around 75% of plant genetic diversity has been lost as farmers worldwide have left behind their multiple local varieties and landraces, preferring genetically uniform, high-yielding varieties [4]. On the other hand, agriculture underpins the variety of crops and food to conserve biodiversity and ensure food security, nutrition, and livelihoods [5]. Agrobiodiversity plays a central role in the productivity and stability of agricultural systems despite the pressure from climate change and soil degradation, since it supplies the genetic resources which allow farmers and plant breeders to adapt crops to changing environments [2,6]. Another important benefit is the provision of ecosystem services such as pollination, nutrient cycling, the enhancement of the available soil amounts of nutrients, the efficiency of nutrient uptake by plants, disease and pest resistance, soil health, soil carbon sequestration, and the consequent regulation of greenhouse gas emissions and water conservation [2,7]. Therefore, agrobiodiversity constitutes the biological underpinning of agriculture [1].
Nevertheless, land use change and agricultural expansion and intensification have been major drivers of biodiversity loss and biotic homogenization worldwide [8]. Consequently, the productive capacity of agricultural systems is jeopardized. It is estimated that, between 2015 and 2019, the world lost at least 100 million hectares of healthy and productive land every year [9]. The over-dependence on a minority of species, varieties, and breeds as well as the consequent disappearance of crucial organisms that support geochemical and edaphic processes, food, and agriculture in general threaten the sustainability of the global food system and affect human and environmental health [7]. The loss of biodiversity represents not only environmental and social hazards but also economic ones. The intrinsic value of this biodiversity loss was valued at 50 billion EUR a year [10], and 50% of the world’s gross domestic profit depends on the biodiversity of ecosystems [11]. Improving the biodiversity of ecosystems is not only strictly related to environmental issues, but it is also crucial for socio-economic development worldwide [11].
Albeit there is a wide scientific evidence of socio-ecological benefits and governmental initiatives, the implementation of biodiversity-friendly strategies in agricultural systems remains a challenge [8]. Appropriate assessment methods of biodiversity performance can support farmers by providing useful information regarding the need to adapt agricultural management practices towards more sustainable options.
Regarding the assessment of biodiversity in agriculture, some studies have focused on topics such as genetic diversity [11,12,13,14,15,16], conservation status or population assessments [6], dietary diversity [17,18,19,20,21,22], and public policies [23]. Less attention has been given to developing methods to comprehensively assess agrobiodiversity.
Elmiger et al. [24] have reviewed biodiversity indicators used in agri-environmental schemes that encourage farmers to implement more biodiversity-friendly practices. However, no article reviews were identified about recently used methods to evaluate agrobiodiversity status.
The present study makes a novel contribution by reviewing proposed methods to assess the overall biodiversity in agricultural systems. This study additionally aims to identify the functionalities that could be integrated into future investigations on agrobiodiversity performance assessment methods to promote the effective enhancement of biodiversity conservation and promotion in agriculture.
After the specification of the methods applied for this review, the Results Section identifies comparative and non-comparative assessment methods, their main goals, indicators of biodiversity, application context, and standardization, aggregation, and weighting methods. In the Discussion Section, the main findings and implications of this review are highlighted. In the Conclusions, a summary of this study and future lines of investigation are presented.

2. Materials and Methods

This review is intended to present the current state of knowledge and priorities for future research concerning agrobiodiversity assessment methods. In contrast with alternative “literature review”’ approaches, a state-of-the-art review may offer new perspectives on an issue or highlight an area needing further research [25]. For this state-of-the-art review, we have followed the six steps recommended by Barry et al. [26], summarized in Figure 1, and described below.
  • Determine the initial research question and field of inquiry. This study aims to answer two main questions in the field of the development of assessment methods for agricultural systems: What methods were recently developed for the assessment of overall agrobiodiversity? And, what functionalities should be integrated in future investigations of agrobiodiversity performance assessment methods?
  • Determine the timeframe. In the resolution taken on the 20 April 2012, for the EU Biodiversity Strategy 2020, the European Parliament gave a lot of attention to agriculture, highlighting the importance of ensuring the conservation of biodiversity and, according to what is feasible, repairing biodiversity damages [27]. For this reason, studies from 2012 to 2023 were selected for our analysis to identify current tendencies in the developed assessment methods.
  • Finalize research questions to reflect the timeframe. The initial research questions were maintained.
  • Develop a search strategy to find relevant manuscripts. The Web of Science database was consulted to select the relevant literature on the 3 January 2024. The search string used was TITLE: (biodiversity) AND (agriculture OR farm OR crop OR agrobiodiversity OR agro-biodiversity) AND (measure OR algorithm OR “decision support system” OR “decision support tool” OR “decision-making system” OR “decision-making tool” OR assessment OR index OR indicator). From the 70 results obtained, 14 references were selected for our analysis, corresponding to the ones mentioned in Results Section. Since the aim of this study is to identify comprehensive assessment methods of agrobiodiversity, studies on the evaluation of the conservation status of populations or exclusively related to the assessment of the diversity of plants, dietary diversity, or governmental initiatives were not included.
  • Analysis of the selected articles. In the Results Section, the similarities across the articles as well as the gaps in the current methods are identified.
  • Reflexivity. A state-of-the-art review should explain the subjectivity of the research team in the interpretation of the data by describing the applications of their expertise. Insights on the limitations of this study are described in the Discussion Section.

3. Results

The assessment methods presented in the literature can be divided into two main groups: (1) comparative methods which allow a relative assessment of biodiversity among different agents; and (2) non-comparative methods which propose the calculation of a single result (composite indicator approach), providing an overview of agrobiodiversity performance which enables the monitoring of its evolution over time, regarding the analysis of one or more agents.

3.1. Comparative Approach

Kikas et al. [28] described for the first time a methodology based on a fully quantitative expert system to map the high nature value of agricultural land. The considered groups of indicators were land use management, nature conservation, landscape diversity, and inherent natural quality. The value of each parameter was determined by expert judgment, following a range of values between zero (for no value) and five (for the highest value). The methodology allowed the comparison of different zones in Estonia and the identification of zones with a high biodiversity, which is useful for policymakers to target agri-environment schemes.
Bassignana et al. [29] made use of a set of indicators and performed a comparative study among different agents. Their study aimed to evaluate planned biodiversity to compare the discrepancy of the indicators’ values in different geographical zones and between stockless and organic livestock farms in Italy. The indicators were clustered in the categories of farm-cultivated land, natural and wild land, plant coverage, crop rotation composition, and livestock. To allow for comparison between the indicators, each indicator value was transformed according to the following formula: (achieved result–desired result)/desired result. The standard deviation from the average of 12 case studies was also used for the comparative analysis of biodiversity performance.

3.2. Composite Indicator Approach

Most of the identified studies on agrobiodiversity assessments (Table 1) present the calculation of a composite indicator through the aggregation of individual indicators, which are considered relevant to describe the biodiversity status in the context of agricultural systems. Table 1 describes the aim and methodology of the studies presenting a composite indicator for biodiversity assessment, the considered aspects of biodiversity, i.e., the categories of the agrobiodiversity variables, the application context, and the selected methods for standardization, aggregation, and weighting of the individual indicators.

3.2.1. Goals of Assessment Methods

Some of the mentioned studies (Table 1) are not strictly related to agrobiodiversity assessment. The study performed by Switek, Sawinska, and Głowicka-Wołoszyn [30] identified socio-economic factors, such as gender and age of the farmer, and the size of the farm, which are associated with higher scores in terms of the natural attractiveness of farms. Additionally, the agrobiodiversity index proposed by Henke and Vaquero-Piñeiro [31] can be used to evaluate farmers’ involvement in activities that enhance biodiversity and verify if one mechanism, captured by a specific dimension of the index, is more relevant than others.
In some cases, the composite indicator calculation is combined with other methodologies. For instance, Ruckli et al. [32] followed the life cycle assessment (LCA) method to quantify the potential environmental impacts of different pig farm types. The LCA is one systematic assessment method used to quantify the potential environmental impacts by considering the environmental impact generated during the entire life cycle of a product in a complex system [32]. For their LCA calculations, the authors considered the impacts from the production of the input materials to the farm gate, covering aspects such as bought-in pigs per annum, sold pigs per annum, feed management, manure management, bedding material, and electric energy [32].
The study of Pépin et al. [33] also considered agricultural LCA and integrated biodiversity as an independent impact category. The authors adapted the SALCA-BD expert system to evaluate the biodiversity of vegetable production systems. SALCA-BD is based on an inventory of the habitats present on a farm and a list of the practices that can be implemented. This methodology allows for the assessment of biodiversity considering the influence of farming practices and the local context. The scores of single indicators can be aggregated into a final biodiversity score at the field, rotation, and farm levels [33].
Due to the significant impact of management practices on biodiversity, the study by Soulé et al. [34] aimed not only to calculate a composite indicator to assess biodiversity but also to assess the impact of certain management practices on the overall biodiversity at the farm level. Xu, Qin, and Zhu [35] also considered, in their analysis, the contribution of farming methods to biodiversity evaluation. The development of a scoring system for agrobiodiversity was based on the Delphi method. The authors collected data through field surveys and assessed the suitability of the composite indicator of biodiversity with input from a panel of experts and end-users. The authors concluded that farms’ geographical location affected biodiversity differently, indicating that the impact of geographic location on bird diversity was more substantial than the one caused by farming methods.

3.2.2. Covered Aspects of Biodiversity

Regarding the variables selected to describe the biodiversity status, it is worth mentioning that the more commonly used indexes for measuring the diversity of fauna and/or flora are the Shannon-Wiener index [7,36] and Simpson’s index [37]. Xu, Qin, and Zhu [35] used multiple diversity indexes, namely, the Simpson index, the Shannon index, and Pielou’s evenness index, to best describe the complexity of the studied agroecosystems. As an alternative, Quintero and Daza-Cruz [38] considered the number of species (species richness) as an indicator of biodiversity.
Some studies used not only diversity indicators to measure biodiversity status but also included management practices as relevant indicators of agrobiodiversity [7,31,34,38].
The most common criteria for indicator selection were an extensive consultation with stakeholders, research institutes, and academia [7], ease of obtaining [35], feasibility, practicability for non-professionals, suitability in covering different aspects of diversity, applicability on different spatial scales [36], review of the literature, and workshops of experts [37]. Ruckli et al. [32] adapted the indicators of a previously developed tool to address the particularities of the analysis unit.
Correlations can represent redundancies between indicators, and it is more appropriate to remove correlated indicators to obtain a more objective assessment of biodiversity [7]. Some of the studies performed correlation tests, namely, Spearman’s rank correlation [7,32] and Pearson’s correlation [35].

3.2.3. Application Context

Concerning the application context, some of the studies carried out at a national or regional level referred to the possibility of adapting the methodology to a farm context. For example, the indicator created by Jones et al. [7], despite being calculated for countries’ agrobiodiversity assessment, can be applied when assessing the performance of companies or to project footprints. Also, the indicator proposed by Tasser et al. [36], despite being conceived for a farm context, can be applied to the single patch, farm (by aggregating the patch values per farm), regional, or inter-regional level (by aggregating the farm values per region).

3.2.4. Standardization Methods

Since a composite indicator can be composed of individual indicators with different measurement units, it is necessary to standardize the values by converting them into a comparable unit. The most common method of normalization applied in the analyzed studies was the min–max scaling method, which is calculated by applying a linear transformation (Equation (1)) [7]:
Sub - indicator   score = X Lower   X   threshold Upper   X   threshold     Lower   X   threshold × 100
where X is the raw sub-indicator value. Suppose that it is not possible to identify theoretical recommended values. In that case, the lower and upper thresholds can be defined according to the minimums and maximums (min–max) of a set of agents, such as countries, regions, projects, or farms, among others [7,30,31,35,36].
This method does not consider the discrepancy between the actual value of an indicator and the desired value. For this reason, some authors used the benchmark method, which defines lower and upper thresholds according to the least-desirable value and most-desirable values pointed out in the scientific literature or targets set by the government or committees [37].
Ruckli et al. [32] used linguistic answers to estimate the values of some key performance indicator (KPI), and the indicators were scaled to values from 0% to 100% by recording “yes”, “maybe”, and “no” answers as 0%, 50%, and 100%, for instance. Category and numerical answers were converted by applying the min–max scaling method, with a threshold definition based on the literature [32]. Soulé et al. [34] also compiled references and expert knowledge to establish quantitative correspondence to the qualitative classes composing their biodiversity indicators. The benchmark method confers the advantage, over other approaches, of making methods more robust and comparable across different agents and periods [37].
Instead of using the min–max scaling method, the agrobiodiversity indicator proposed by Leyva and Lores [39] has also been standardized considering the maximum value possible for each group of indicators. This methodology is based on the mathematical principles followed in calculating the equivalent index of land use and the general index of sustainability. The groups of indicators were standardized by applying Equation (2):
Specific   index   for   each   group = 1 Se Vi Se   ×   ( Vi . max ) × 100
where Vi stands for the value of each component, Vi.max is the maximum possible value of each component, and Se represents the total amount of components of each group of indicators.

3.2.5. Aggregation Methods

The arithmetic mean (Equation (3)) and the addition of sub-indicators (Equation (4)) are the most common aggregation approaches in the analyzed studies.
Overall   Index   Score = i = 1 n X i n × 100
Overall   Index   Score = i = 1 n X i
where n is the number of sub-indicators, and X is the score of the sub-indicator i.
The arithmetic mean aggregation method has a simple calculation, but it implicitly assumes the substitutability of sub-indicators, since lower levels of a given sub-indicator can be compensated by higher levels of a different one, being unable to reveal the most representative values of the situation under study. The consideration of only the aggregated scores can lead to inappropriate decisions on which priority actions should be implemented to enhance biodiversity performance [7]. This limitation can be partially minimized by allowing the user to visualize the scores in each aggregation level [7].
The additive approach with equal weights also assumes that the scores for each indicator are substitutable. Turner et al. [40] followed this approach, and, to measure each indicator, the authors formulated questions for experts. The answers to all the individual questions were translated into six risk levels (from one, no risk, to six, very high risk). The total sums for each question were equally weighted to obtain a single biodiversity impact score. However, the authors reported that the obtained index had little physical meaning. In such cases, it is necessary to guide the results’ interpretation to minimize difficulties. Turner et al. [40] used scores for historic or natural states to give meaning to the proposed indicator. If the BioImpact scores were greater, that would represent a more negative biodiversity impact, and an equal/lower value would represent a more positive biodiversity impact.
Soulé et al. [34] used “if–then” linguistic rules to determine the classification of the aggregated indicator Y. Considering that it is composed of two indicators, X1 and X2, with a low and high qualitative classification, respectively, it can be defined as “if X1 is low and X2 high, then Y is high”. The use of linguistic rules simplifies the understanding of the results. On the one hand, qualitative models are easier to understand. On the other hand, this method lacks sensitivity due to its qualitative form and the uneven frequency distribution on the side of the “low class”. To mitigate this issue, the authors proposed the design of a quantitative indicator based on fuzzy decisions [34].
Switek, Sawinska, and Głowicka-Wołoszyn [30] used the Technique for Order of Preference by Similarity to Ideal Solution (TOPSIS) and the generalized distance measure (GDM) to assess farm biodiversity according to the farmer’s perspective. The elaboration of the synthetic indicator using the TOPSIS method requires the calculation of the distance of each object (farm) from the adopted best and worst condition, obtained through the GDM. According to the index values, the farms were classified into four classes, namely, green farms (high nature value), yellow farms (medium-to-high nature value), grey farms (medium-to-low nature value), and black farms (low nature value). This classification permitted the use of the generalized logit model of ordered categories to identify the socio-economic characteristics associated with a higher assessment of the natural attractiveness of farms, such as the gender and age of the farmer, and the size of the farm [30]. The study of Switek, Sawinska, and Głowicka-Wołoszyn [30] also included farmers’ opinions about the natural value of their farms, specifically regarding the importance of pollinators, the conditionings of game species, and the implications of the species richness of bird, amphibian, reptile, and rodent populations, as well as the species richness of non-crop (wild) plants.

3.2.6. Weighting Methods

Aggregation as well as weighting are critical steps in the calculation of a composite indicator, which can introduce subjectivity [38].
In the analyzed studies, it was frequently the assumption that the indicators were equally important, with no weights being applied in the calculation of composite indicators [7]. Although the study of Roul et al. [37] considered equal weights, it also applied expert weights and principal component analysis (PCA) and factor analysis methodologies to assign weights when the indicators were correlated. It was concluded that PCA is not appropriate when the correlation among the indicators is low. This method is also characterized by difficulty in results’ interpretation, as it is hard for the users to understand how the selection of indicators, weighting criteria, and principal components influence the index’s final value [37].
In the methodology selected by Soulé et al. [34], utility functions, based on linguistic rules, could be set to automatically weight the indicators. However, this could lead to compensation effects between the indicators, since an indicator with a low class and an indicator with a high class corresponded to the same average class as two indicators with a medium class, leading to information loss. To overcome this issue, the authors manually fixed the utility functions by exporting the aggregation rules into Excel and converting the qualitative classes used (low, low-to-medium, medium-to-high, and high) into quantitative values. Then, the authors calculated the mean of each input variable and ranked the decision rules according to their average. Following this procedure, the authors modified the aggregation rules [34].

4. Discussion

Though the industrialization of agriculture has driven the increase in agricultural systems’ productivity, it also has been responsible for serious ecological problems that compromise its sustainability [41]. Biodiversity is crucial for the sustainability and stability of agricultural systems and for coping with the consequences of climate change [42]. Since decision makers in the agricultural sector play a significant role in promoting biodiversity, it is relevant to provide useful information for the enhancement of biodiversity performance when developing appropriate assessment methods.
We have focused on quantitative assessment methods of agrobiodiversity, which influenced the interpretation of articles’ relevance and led to the exclusion of studies exclusively using interviews, geographic information systems (GIS), and other mainly qualitative methodologies. On the other hand, this review allowed the identification of research gaps that can act as guidelines for the theoretical development of innovative assessment methods. Consequently, the expansion of investigations in this research field can enable farmers and other decision makers to have access to useful information for evidence-based decision making and provide clearer and more realistic support for more conscious and sustainable agricultural management.
This review contributed to four main findings, as displayed in Figure 2.
The most recent quantitative methodologies for assessing biodiversity performance in agroecosystems were reviewed. A significant part of the identified studies on agrobiodiversity assessment presented the calculation of a composite indicator for biodiversity assessment, and we analyzed the most common standardization, aggregation, and weighting methods.
Different studies referred as a relevant limitation of the proposed assessment methods the assumption of the additive method of aggregation, according to which the scores of sub-indicators are substitutable [40]. Some weighting methods, namely, the use of utility functions, can also lead to compensation effects between indicators if not manually fixed [34]. To overcome the limitation of the substitutability of sub-indicator scores in additive aggregation, it was suggested to apply multi-criteria analysis (MCA), a combination of biodiversity data, and GIS or open-source spatial statistical computing [40].
According to the literature, it is recommended that the metrics be simple, easy to interpret, and cost-effective [38]. For future works, Turner et al. [40] suggested the use of limits or target situations, as used in restoration ecology, to give meaning to the indicator, making the interpretation of results easier. The difficulty in the interpretation of results and of compensation effects should be avoided in future proposed methodologies, as these characteristics can lead to inappropriate decisions on the need for and priority in implementing corrective actions.
It is recommended that an assessment method transparently communicates what actions should be prioritized. The conception of a decision support system (DSS) that suggests enhancement practices in order of priority can contribute to overcoming communication gaps and effectively encourage the promotion of agrobiodiversity. It could also be useful to add visual alerts to assessment methods to draw users’ attention to areas needing improvement, avoiding the loss of information associated with compensatory effects. The use of DSS is potentially useful to improve agricultural sustainability performance. For example, the use of a DSS contributed successfully to minimizing water quality (salinity) exceedances from irrigated agriculture [43].
To achieve efficacy in the use of DSS for biodiversity enhancement, future research should adapt the functionalities of assessment algorithms providing decision makers with useful information to overcome the main barriers to the implementation of enhancement practices. In this sense, it would be useful to include, in an assessment methodology, the possibility of monitoring the impacts of alternative practices to promote agrobiodiversity. Providing concrete information and feedback about the utility of changing management practices could encourage decision makers to support biodiversity-friendly agriculture [33,36]. However, since the impacts of certain enhancement practices are not perceived in the short term, such monitoring should be quantified over time.
Furthermore, the results show that more investigation is needed to develop assessment methods considering farmers’ opinions and both economic and non-economic motivations [30]. Taking into consideration farmers’ perceptions in future assessment methods can represent a significant contribution towards their effective implementation. Considering social processes that influence decision making can encourage the adoption of more beneficial practices for agrobiodiversity.
Considering farmers’ perceptions can also be useful to fill the communication gaps associated with quantitative methods by adding the experience and knowledge acquired by farmers. This could be achieved by integrating, into a DSS, the lessons learned, the barriers, and the external factors that impact the efficacy of enhancement practices’ implementation. Such information could be useful to adapt future management strategies as necessary.
Theoretically, this study makes a novel contribution, with a state-of-the-art review which allows the identification and critical analysis of current methodologies for biodiversity assessment in the agricultural sector, and it highlights future lines of investigation for more implementation-oriented approaches.
Given the urgency of biodiversity conservation in agriculture, this study provides relevant practical applications by providing recommendations on what should be considered when formulating biodiversity assessment methods. The successful implementation of management policies and strategies to revert the current unprecedented biodiversity loss, such as the Kunming-Montreal Global Biodiversity Framework [44], depends on appropriate assessment methods to monitor the effects of the measures taken. Therefore, the present study gives useful insights for the formulation of assessment frameworks of agricultural management policies and strategies on what can be improved for more implementation-oriented methods.

5. Conclusions

Appropriate assessment methods enable decision makers in the agricultural sector to adopt innovative practices to foster biodiversity performance. In this study, a state-of-the-art review was performed, allowing us to identify the main tendencies in current assessment methods of overall biodiversity. This review summarizes the most common criteria for indicator selection methods for assessing overall biodiversity performance as well as standardization, aggregation, and weighting methods. Further research is needed for the development of more implementation-oriented assessment methodologies with easy-to-interpret outputs. To this end, the following are recommended for future research on the development of assessment methods:
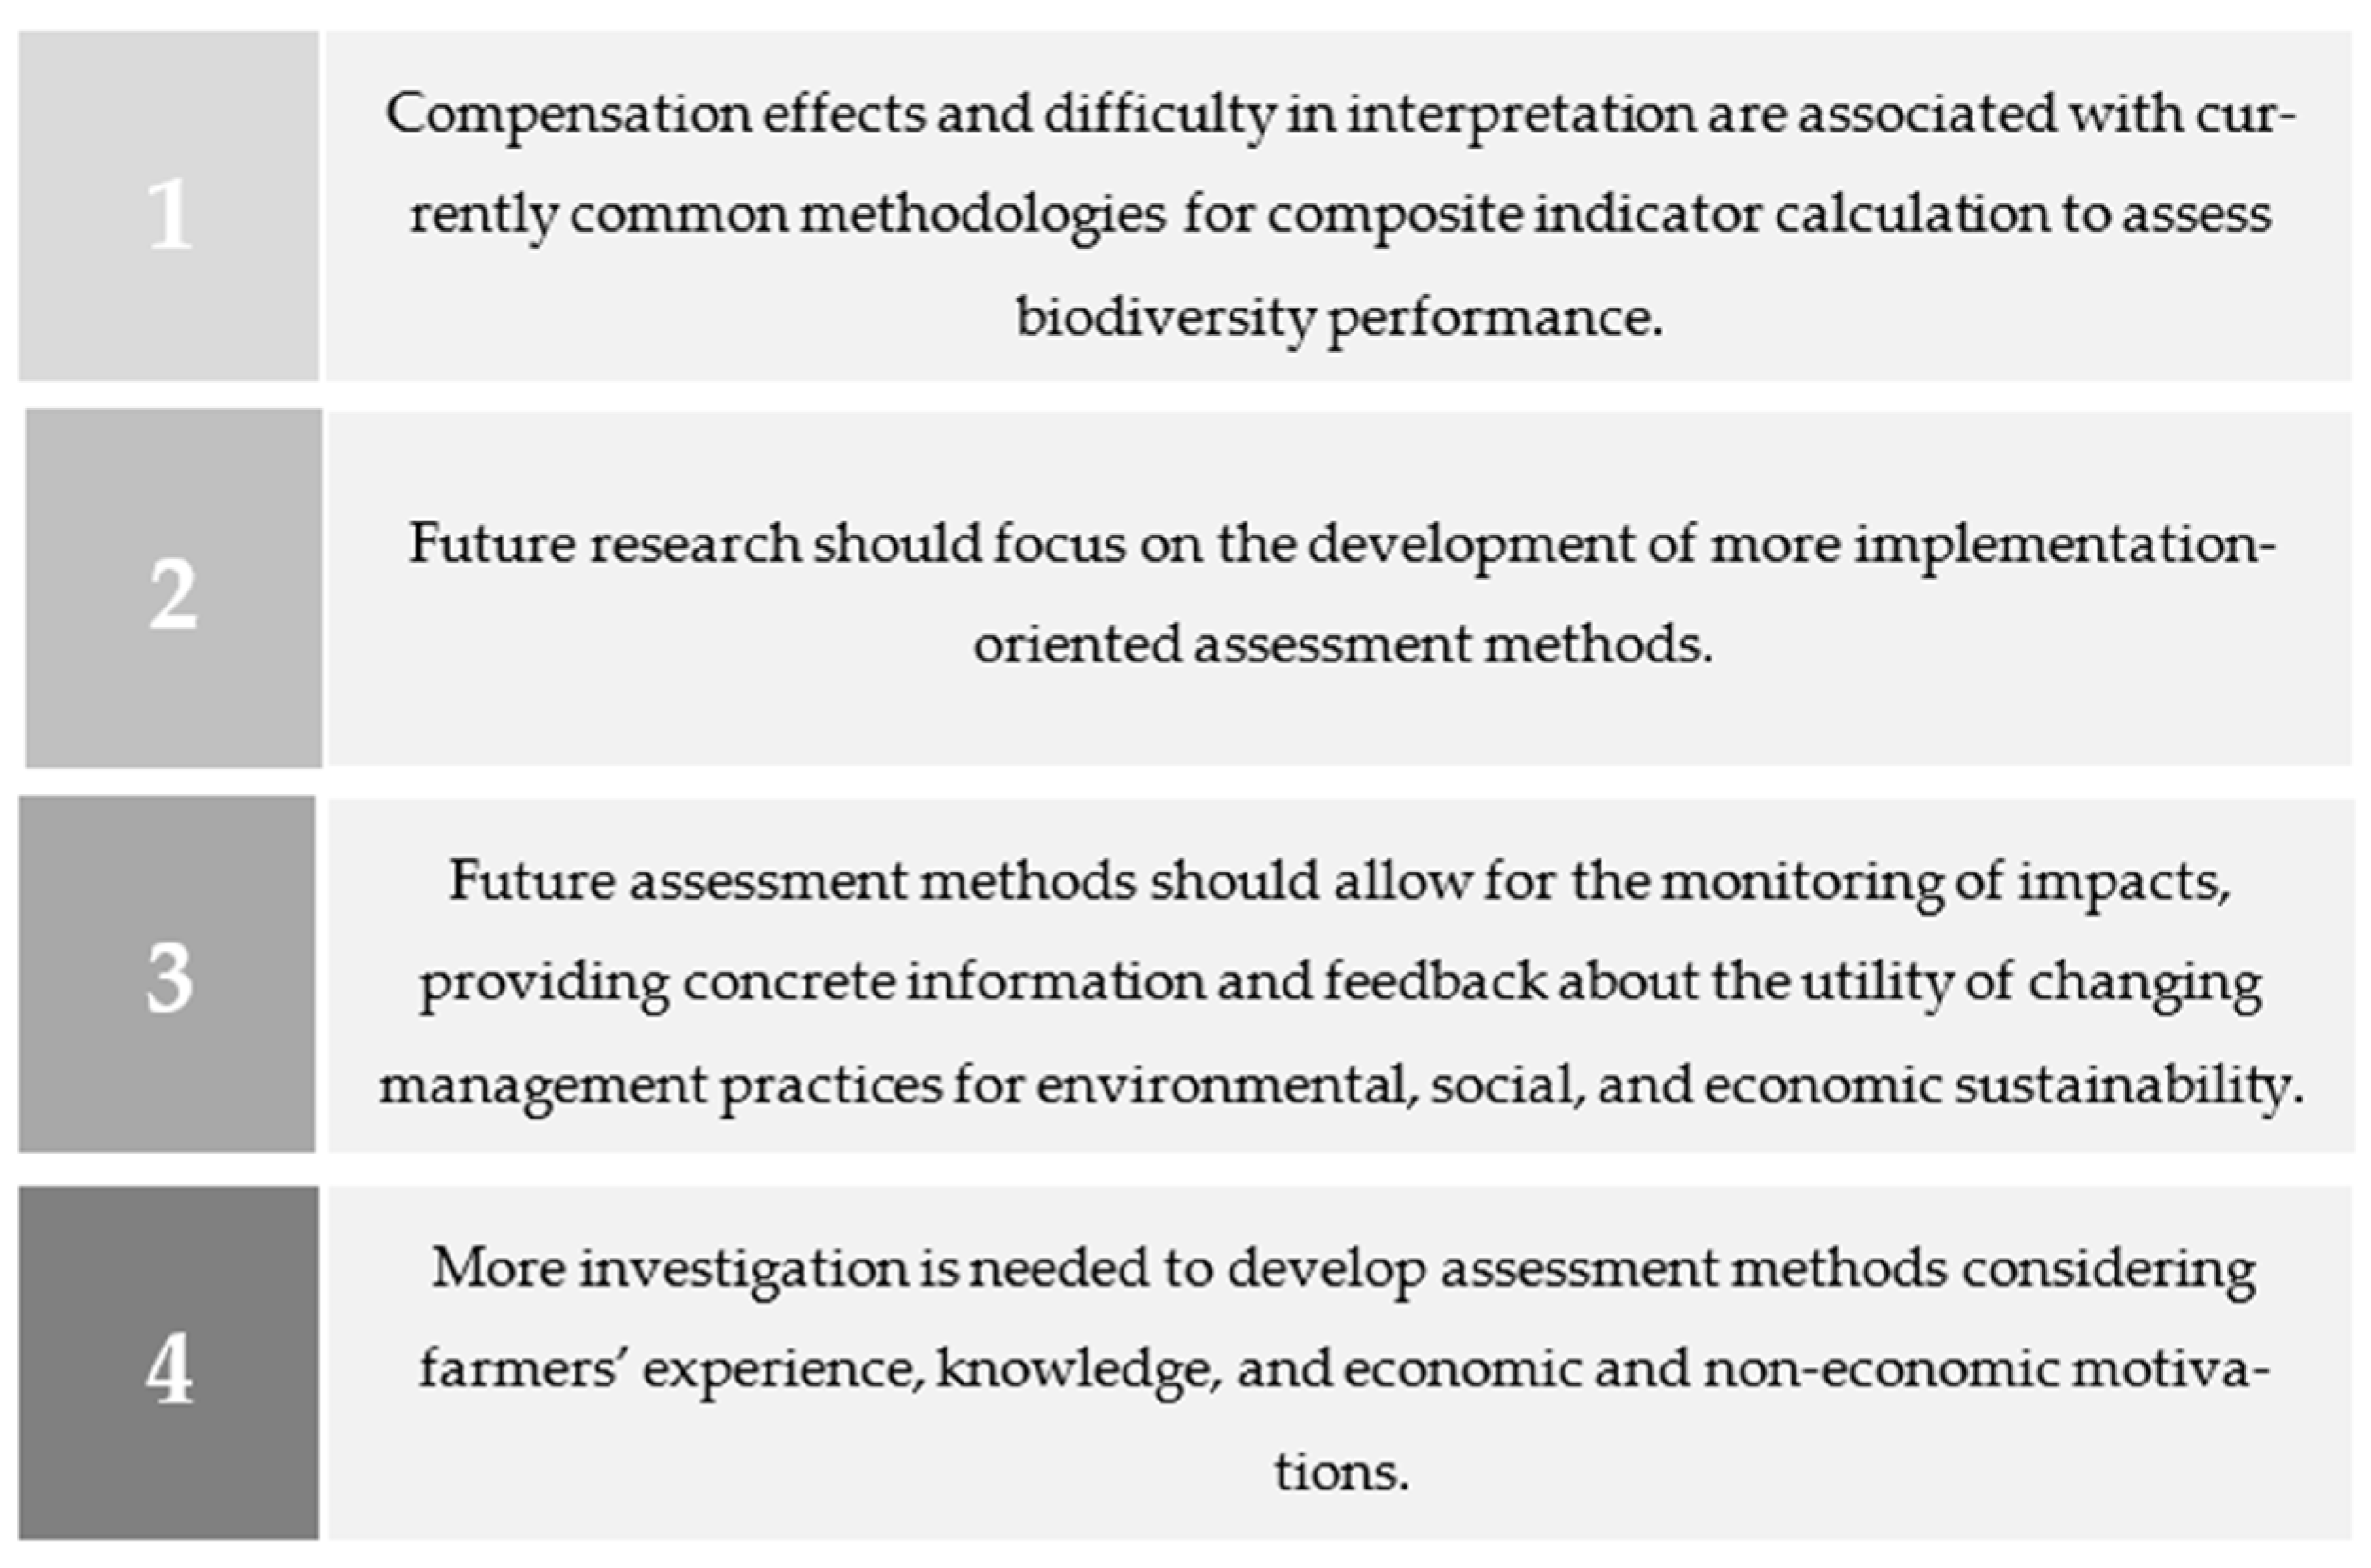
  • The development of DSS, providing suggestions to enhance biodiversity performance to minimize interpretation difficulties regarding indicators’ values and priority action areas.
  • The use of optimization algorithms, considering local constraints, for realistic guidance on sustainable practices’ implementation for the benefit of biodiversity.
  • The inclusion of indicators to monitor the impacts of enhancement practices’ implementation, namely, environmental, social, and economic ones.
  • The integration of users’ perceptions in the conception and operation of DSS to overcome communication gaps associated with quantitative methods by adding the experience and knowledge acquired by farmers. Considering the decision maker’s motivations allows for the identification of the key functionalities that effectively promote the implementation of more sustainable practices.

Author Contributions

Conceptualization, S.M.M., P.D.G. and A.d.P.; methodology, S.M.M., P.D.G. and A.d.P.; software, S.M.M.; validation, S.M.M., P.D.G. and A.d.P.; formal analysis, S.M.M.; investigation, S.M.M.; resources, S.M.M., P.D.G., A.d.P., T.M.L., A.M., C.M.L., J.C.F., E.S.S. and R.C.; data curation, S.M.M.; writing—original draft preparation, S.M.M.; writing—review and editing, S.M.M., P.D.G., A.d.P. and T.M.L.; visualization, S.M.M., P.D.G. and A.d.P.; supervision, A.d.P. and P.D.G.; project administration, P.D.G. and C.M.L.; funding acquisition, P.D.G. and C.M.L. All authors have read and agreed to the published version of the manuscript.

Funding

This work was supported in part by the R&D Project BioD’Agro (PD20-00011), promoted by the Fundação La Caixa and the Fundação para a Ciência e a Tecnologia, at the C-MAST-Centre for Mechanical and Aerospace Sciences and Technology, Department of Electromechanical Engineering of the University of Beira Interior, Covilhã, Portugal. The authors would like to express their gratitude to Fundação para a Ciência e Tecnologia (FCT), C-MAST (Centre for Mechanical and Aerospace Science and Technologies), LEAF (Linking Landscape, Environment, Agriculture and Food research centre), CEF (Forest Research Centre), and the Associate Laboratory “Sustainable Land Use and Ecosystem Services–TERRA” for their support in the form of funding, under projects UIDB/00151/2020 (https://doi.org/10.54499/UIDB/00151/2020; https://doi.org/10.54499/UIDP/00151/2020, accessed on 3 January 2024), UIDB/04129/2020, UIDB/00239/2020, and LA/P/0092/2020.

Institutional Review Board Statement

Not applicable.

Informed Consent Statement

Not applicable.

Data Availability Statement

Not applicable.

Conflicts of Interest

The authors declare no conflicts of interest.

References

  1. Love, B.; Spaner, D. Agrobiodiversity: Its Value, Measurement, and Conservation in the Context of Sustainable Agriculture. J. Sustain. Agric. 2007, 31, 53–82. [Google Scholar] [CrossRef]
  2. Kozicka, M.; Gotor, E.; Ocimati, W.; de Jager, T.; Kikulwe, E.; Groot, J.C.J. Responding to Future Regime Shifts with Agrobiodiversity: A Multi-Level Perspective on Small-Scale Farming in Uganda. Agric. Syst. 2020, 183, 102864. [Google Scholar] [CrossRef]
  3. Jackson, L.E.; Brussaard, L.; de Ruiter, P.C.; Pascual, U.; Perrings, C.; Bawa, K. Agrobiodiversity. Encycl. Biodivers. (Second Ed.) 2013, 1, 126–135. [Google Scholar] [CrossRef]
  4. FAO. What Is Happening to Agrobiodiversity? Available online: https://www.fao.org/3/y5609e/y5609e02.htm (accessed on 3 October 2023).
  5. Kawtrakul, A.; Chanlekha, H.; Waiyamai, K.; Kangkachit, T.; D’Orazio, L.; Kotzinos, D.; Laurent, D.; Spyratos, N. Towards Data-and-Innovation Driven Sustainable and Productive Agriculture: BIO-AGRI-WATCH as a Use Case Study. In Proceedings of the 2021 IEEE International Conference on Big Data, Big Data 2021, Virtually, 15–18 December 2021; pp. 3407–3415. [Google Scholar] [CrossRef]
  6. Vera-Sánchez, K.S.; Parra-Quijano, M.; Nieto-ángel, R.; Barrientos-Pliego, A.F. Multi-Criteria Analysis for the Prioritization of Areas for the in Situ Conservation of Crataegus, L. an Underutilized Fruit Tree in Mexico. Plants 2021, 10, 2561. [Google Scholar] [CrossRef] [PubMed]
  7. Jones, S.K.; Estrada-Carmona, N.; Juventia, S.D.; Dulloo, M.E.; Laporte, M.A.; Villani, C.; Remans, R. Agrobiodiversity Index Scores Show Agrobiodiversity Is Underutilized in National Food Systems. Nat. Food 2021, 2, 712–723. [Google Scholar] [CrossRef] [PubMed]
  8. Maas, B.; Fabian, Y.; Kross, S.M.; Richter, A. Divergent Farmer and Scientist Perceptions of Agricultural Biodiversity, Ecosystem Services and Decision-Making. Biol. Conserv. 2021, 256, 109065. [Google Scholar] [CrossRef]
  9. FAO. Tracking Progress on Food and Agriculture-Related SDG Indicators 2022; FAO: Washington, DC, USA, 2022; ISBN 9789251380130. [Google Scholar]
  10. Cervelli, E.; Pindozzi, S.; Sacchi, M.; Capolupo, A.; Cialdea, D.; Rigillo, M.; Boccia, L. Supporting Land Use Change Assessment through Ecosystem Services and Wildlife Indexes. Land Use Policy 2017, 65, 249–265. [Google Scholar] [CrossRef]
  11. Castillo-Díaz, F.J.; Belmonte-Ureña, L.J.; López-Serrano, M.J.; Camacho-Ferre, F. Assessment of the Sustainability of the European Agri-Food Sector in the Context of the Circular Economy. Sustain. Prod. Consum. 2023, 40, 398–411. [Google Scholar] [CrossRef]
  12. López-Hernández, F.; Cortés, A.J. Whole Transcriptome Sequencing Unveils the Genomic Determinants of Putative Somaclonal Variation in Mint (Mentha L.). Int. J. Mol. Sci. 2022, 23, 5291. [Google Scholar] [CrossRef]
  13. Santillán-Fernández, A.; Salinas-Moreno, Y.; Valdez-Lazalde, J.R.; Bautista-Ortega, J.; Pereira-Lorenzo, S. Spatial Delimitation of Genetic Diversity of Native Maize and Its Relationship with Ethnic Groups in Mexico. Agronomy 2021, 11, 672. [Google Scholar] [CrossRef]
  14. Weise, S.; Lohwasser, U.; Oppermann, M. Document or Lose It—On the Importance of Information Management for Genetic Resources Conservation in Genebanks. Plants 2020, 9, 1050. [Google Scholar] [CrossRef] [PubMed]
  15. Scherf, B.; Baumung, R. Monitoring the Implementation of the Global Plan of Action for Animal Genetic Resources. Biodiversity 2015, 16, 149–156. [Google Scholar] [CrossRef]
  16. Agrawal, R.C.; Archak, S.; Tyagi, R.K. An Overview of Biodiversity Informatics with Special Reference to Plant Genetic Resources. Comput. Electron. Agric. 2012, 84, 92–99. [Google Scholar] [CrossRef]
  17. Chandora, R.; Paul, S.; RC, K.; Kumar, P.; Kumar, P.; Sharma, A.; Kumar, A.; Singh, D.; Negi, N.; Lata, S.; et al. Ecological Survey, Population Assessment and Habitat Distribution Modelling for Conserving Fritillaria Roylei—A Critically Endangered Himalayan Medicinal Herb. S. Afr. J. Bot. 2023, 160, 75–87. [Google Scholar] [CrossRef]
  18. Timler, C.; Alvarez, S.; DeClerck, F.; Remans, R.; Raneri, J.; Estrada Carmona, N.; Mashingaidze, N.; Abe Chatterjee, S.; Chiang, T.W.; Termote, C.; et al. Exploring Solution Spaces for Nutrition-Sensitive Agriculture in Kenya and Vietnam. Agric. Syst. 2020, 180, 102774. [Google Scholar] [CrossRef]
  19. Boedecker, J.; Odhiambo Odour, F.; Lachat, C.; Van Damme, P.; Kennedy, G.; Termote, C. Participatory Farm Diversification and Nutrition Education Increase Dietary Diversity in Western Kenya. Matern. Child Nutr. 2019, 15, 12803. [Google Scholar] [CrossRef]
  20. Ribeiro, J.M.P.; Berchin, I.I.; da Silva Neiva, S.; Soares, T.; de Albuquerque Junior, C.L.; Deggau, A.B.; de Amorim, W.S.; Barbosa, S.B.; Secchi, L.; de Andrade Guerra, J.B.S.O. Food Stability Model: A Framework to Support Decision-Making in a Context of Climate Change. Sustain. Dev. 2021, 29, 13–24. [Google Scholar] [CrossRef]
  21. Santoso, M.V.; Bezner Kerr, R.N.; Kassim, N.; Martin, H.; Mtinda, E.; Njau, P.; Mtei, K.; Hoddinott, J.; Young, S.L. A Nutrition-Sensitive Agroecology Intervention in Rural Tanzania Increases Children’s Dietary Diversity and Household Food Security but Does Not Change Child Anthropometry: Results from a Cluster-Randomized Trial. J. Nutr. 2021, 151, 2010–2021. [Google Scholar] [CrossRef]
  22. Weerasekara, P.C.; Withanachchi, C.R.; Ginigaddara, G.A.S.; Ploeger, A. Understanding Dietary Diversity, Dietary Practices and Changes in Food Patterns in Marginalised Societies in Sri Lanka. Foods 2020, 9, 1659. [Google Scholar] [CrossRef]
  23. Valencia, V.; Wittman, H.; Jones, A.D.; Blesh, J. Public Policies for Agricultural Diversification: Implications for Gender Equity. Front. Sustain. Food Syst. 2021, 5, 718449. [Google Scholar] [CrossRef]
  24. Elmiger, B.N.; Finger, R.; Ghazoul, J.; Schaub, S. Biodiversity Indicators for Result-Based Agri-Environmental Schemes—Current State and Future Prospects. Agric. Syst. 2023, 204, 103538. [Google Scholar] [CrossRef]
  25. Grant, M.J.; Booth, A. A Typology of Reviews: An Analysis of 14 Review Types and Associated Methodologies. Health Inf. Libr. J. 2009, 26, 91–108. [Google Scholar] [CrossRef] [PubMed]
  26. Barry, E.S.; Merkebu, J.; Varpio, L. State-of-the-Art Literature Review Methodology: A Six-Step Approach for Knowledge Synthesis. Perspect. Med. Educ. 2022, 11, 281–288. [Google Scholar] [CrossRef] [PubMed]
  27. Bàrberi, P. Functional Agrobiodiversity. Agric. Sustain. 2013, 3–20. [Google Scholar] [CrossRef]
  28. Kikas, T.; Bunce, R.G.H.; Kull, A.; Sepp, K. New High Nature Value Map of Estonian Agricultural Land: Application of an Expert System to Integrate Biodiversity, Landscape and Land Use Management Indicators. Ecol. Indic. 2018, 94, 87–98. [Google Scholar] [CrossRef]
  29. Bassignana, C.F.; Merante, P.; Belliére, S.R.; Vazzana, C.; Migliorini, P. Assessment of Agricultural Biodiversity in Organic Livestock Farms in Italy. Agronomy 2022, 12, 607. [Google Scholar] [CrossRef]
  30. Switek, S.; Sawinska, Z.; Głowicka-Wołoszyn, R. A New Approach to Farm Biodiversity Assessment. Agronomy 2019, 9, 551. [Google Scholar] [CrossRef]
  31. Henke, R.; Vaquero-Piñeiro, C. Measuring Agro-Biodiversity through Leverage Factors: Land Use, Farmer Practices and Public Policies. Land 2023, 12, 1499. [Google Scholar] [CrossRef]
  32. Ruckli, A.K.; Dippel, S.; Durec, N.; Gebska, M.; Guy, J.; Helmerichs, J.; Leeb, C.; Vermeer, H.; Hörtenhuber, S. Environmental Sustainability Assessment of Pig Farms in Selected European Countries: Combining Lca and Key Performance Indicators for Biodiversity Assessment. Sustainability 2021, 13, 11230. [Google Scholar] [CrossRef]
  33. Pépin, A.; Guidoboni, M.V.; Jeanneret, P.; van der Werf, H.M.G. Using an Expert System to Assess Biodiversity in Life Cycle Assessment of Vegetable Crops. Ecol. Indic. 2023, 148, 110098. [Google Scholar] [CrossRef]
  34. Soulé, E.; Hawes, C.; Young, M.; Henckel, L.; Michel, N.; Michonneau, P.; Bockstaller, C. A Predictive Indicator Assessing Effect of Cropping System and Surrounding Landscape on Biodiversity. Ecol. Indic. 2023, 151, 289. [Google Scholar] [CrossRef]
  35. Xu, X.; Qin, C.; Zhu, Y. Developing the Agri-Environment Biodiversity Index for the Assessment of Eco-Friendly Farming Systems. Ecol. Indic. 2022, 142, 109220. [Google Scholar] [CrossRef]
  36. Tasser, E.; Rüdisser, J.; Plaikner, M.; Wezel, A.; Stöckli, S.; Vincent, A.; Nitsch, H.; Dubbert, M.; Moos, V.; Walde, J.; et al. A Simple Biodiversity Assessment Scheme Supporting Nature-Friendly Farm Management. Ecol. Indic. 2019, 107, 105649. [Google Scholar] [CrossRef]
  37. Roul, C.; Chand, P.; Pal, S.; Naik, K. Assessment of Agrobiodiversity in the Intensive Agriculture: A Case Study of the Indo-Gangetic Plains of India. Biodivers. Conserv. 2022, 31, 397–412. [Google Scholar] [CrossRef]
  38. Quintero, I.; Daza-cruz, Y.X. Main Agro-Ecological Structure: An Index for Evaluating Agro-Biodiversity in Agro-Ecosystems. Sustainability 2022, 14, 13738. [Google Scholar] [CrossRef]
  39. Leyva, Á.; Lores, A. Assessing Agroecosystem Sustainability in Cuba: A New Agrobiodiversity Index. Elementa 2018, 6, 80. [Google Scholar] [CrossRef]
  40. Turner, P.A.M.; Ximenes, F.A.; Penman, T.D.; Law, B.S.; Waters, C.M.; Grant, T.; Mo, M.; Brock, P.M. Accounting for Biodiversity in Life Cycle Impact Assessments of Forestry and Agricultural Systems—The BioImpact Metric. Int. J. Life Cycle Assess. 2019, 24, 1985–2007. [Google Scholar] [CrossRef]
  41. Blandi, M.L.; Gargoloff, N.A.; Iermanó, M.J.; Paleologos, M.F.; Sarandón, S.J. The Mental Map as an Instrument to Define Indicators in Complex Systems: An Application on the Environmental Knowledge of Local Horticultural Farmers. Rev. Econ. Sociol. Rural. 2021, 60, 233521. [Google Scholar] [CrossRef]
  42. Tamburini, G.; Bommarco, R.; Wanger, T.C.; Kremen, C.; van der Heijden, M.G.A.; Liebman, M.; Hallin, S. Agricultural Diversification Promotes Multiple Ecosystem Services without Compromising Yield. Sci. Adv. 2020, 6, eaba1715. [Google Scholar] [CrossRef]
  43. Dinar, A.; Quinn, N.W.T. Developing a Decision Support System for Regional Agricultural Nonpoint Salinity Pollution Management: Application to the San Joaquin River, California. Water 2022, 14, 2384. [Google Scholar] [CrossRef]
  44. Ma, K. Kunming-Montreal Global Biodiversity Framework: An Important Global Agenda for Biodiversity Conservation. Biodivers. Sci. 2023, 31, 23133. [Google Scholar] [CrossRef]
Figure 1. Summary of the strategy followed to conduct this state-of-the-art review.
Applsci 14 02622 g001
Figure 2. Summary of key findings.
Applsci 14 02622 g002
Table 1. Summarization of studies with composite indicators.
ReferenceAimCovered Aspects of BiodiversityStandardization MethodAggregation MethodWeighting MethodApplication Context
[7]Capture the most relevant dimensions of agrobiodiversity contributing to food system sustainabilityConsumption, contributing to healthy diets; agrobiodiversity in production, contributing to sustainable agriculture; and Agrobiodiversity in genetic resource conservation, contributing to current and future use optionsMin–max scaling methodArithmetic mean of the pillar scoresEqual weightsEighty countries around the world, using globally available public datasets
[30]Assess farm biodiversity according to farmers’ perspectivesFarm attractiveness for: pollinators; wild game; birds; amphibians and reptiles; rodents; and non-crop plantsValues of 1 (very unattractive) and 5 (very attractive) and min–max scaling methodTOPSIS (Technique for Order of Preference by Similarity to Ideal Solution) methodEqual weights A total of 273 complete interviews with farmers across Poland were used for the analysis
[31]Evaluate agrobiodiversity through leverage factors at the territorial (regional) levelLand use strategies, agriculture practices, and common agricultural policy fundsMin–max scaling methodArithmetic mean of the sub-indicatorsEqual weights Farm Account Data Network (FADN) 2020 database for Italian farms
[32]Combine life cycle assessment (LCA) with key performance indicator (KPI) assessment focusing on biodiversity in order to examine the environmental impacts of different pig farm typesEcosystem (habitat) diversity; species (flora and fauna; number of species; and abundance) diversity; and genetic diversityBenchmark methodArithmetic mean of the sub-indicatorsExpert weightsDifferent pig farm types (13 breeding, 23 finishing, and 27 breeding-to-finishing farms) in Austria, Finland, Germany, Italy, the Netherlands, the United Kingdom, and Poland
[33]Assess and compare impacts on the biodiversity of vegetable production systems as a function of farming practices and the local context11 indicator species groups (ISG) (crop flora, grassland flora, birds, small mammals, amphibians, snails, spiders, carabid beetles, butterflies, wild bees, and grasshoppers);
coefficient of the habitat’s potential for hosting each ISG (Chabitat); coefficient of the influence of a management practice in each ISG (Cmanagement); and direct impact of each management option in a given habitat on the population of each of the 11 ISGs (R)
R × ((Chabitat + Cmanagement)/2), where Chabitat is on a scale from 0 to 10, Cmanagement is on a scale from 0 to 10, and R is on a scale from 0 to 5Additive aggregation methodUse of areas of the fields as weightsCase study of an organic vegetable farm in Brittany, France
[34]Develop a new indicator, I-BIO, aiming to predict the impacts of management practices on the overall biodiversity at the field level Microorganisms; vegetation; invertebrates; and vertebratesIndicators are converted to a qualitative class“If–then” linguistic rulesDEXi-CSC model software calculated the weights by transforming qualitative classes (manually verified) into quantitative ones. The mean of the input variables corresponded to the relative weights of each basic indicators.Three case studies at the field-level in Scotland and France
[35]Propose a simplified, rapid assessment method of biodiversity performance to guide the improvement of self-management capabilities in eco-friendly farmsAnimal biodiversity; plant diversity; invasive species; habitat; and educational activitiesValues for each indicator were scaled between 0 and 1 (dimensionless)AdditiveEqual weights A total of 9 best-practice farms from a total of >300 eco-friendly farms in China
[36]Present a biodiversity assessment scheme for farmland to detect the impact associated with land-use practices, combining compositional (faunal and floral) and structural aspects, which can assist the monitoring of result-oriented measuresFlower color index; butterfly abundance; landscape structuring degree; and patch diversity indexMin–max scaling methodAdditiveNot specifiedForty-four farms in five countries (France, Switzerland, Germany, Italy, and Austria)
[37]Develop an agroecosystem diversity index to identify the status and challenges and offer suggestions to conserve and enrich agrobiodiversity Landscape diversity; genetic and species diversity; agrobiodiversity threats; and societal responseBenchmark methodAdditiveAverage of three weights, namely, equal weights, expert weights, and PCA weightsIndo-Gangetic Plains of India (Punjab and Haryana)
[38]Describe the agrobiodiversity of agroecosystems, considering the management and conservation practices and the producer’s perceptions, awareness, and ability to promote sustainable practices in a farm contextConnection with the main ecological structure of the landscape; extension of external connectors; diversity of external connectors; extension of internal connectors; diversity of internal connectors, land use; management practices; conservation practices; perception, awareness, and knowledge; and action capacityValues for each indicator were expressed on the ordinal scale, from 0 to 10The score for each category was obtained by the arithmetic mean of the indicators that composed it, and the composite index was obtained by summing the values of each category Differential weights for each criterion could be considered, according to applicational needsNot specified
[39]Development of a new index of agrobiodiversity (IDA) to identify the extent to which agroecosystems are sustainable, based on their agrobiodiversityBiodiversity for human diet; biodiversity for animal feed; biodiversity to improve soils; and complementary and associated biodiversity for non-dietary measuresMax scaling methodArithmetic mean of the sub-indicatorsEqual weightsAgroecosystems in Cuba’s urban agriculture movement
[40]Propose a metric (BioImpact) that incorporates biodiversity and the complexity of ecological interactions and processes using dialogue and data, with the strength of the LCA frameworkConnectivity (fragmentation, isolation, gene flow); interactions (invasive species, and
natural disturbance regimes); anthropogenic disturbance regime impacts (frequency, duration, intensity, extent, recovery × frequency, and succession); habitat structure (ecosystem function, and resilience); and threatened communities and species
Six risk levels (from no risk to very high risk). Additive aggregation methodExpert weightsFour agricultural production systems in Australia
Disclaimer/Publisher’s Note: The statements, opinions and data contained in all publications are solely those of the individual author(s) and contributor(s) and not of MDPI and/or the editor(s). MDPI and/or the editor(s) disclaim responsibility for any injury to people or property resulting from any ideas, methods, instructions or products referred to in the content.

