1. Introduction
Society is facing considerable challenges in building a sustainable future in different regions of the planet, including population growth, an increasingly worse environment, changing attitudes towards food consumption, such as an increase in the consumption of animal protein, an ageing population, migration, and climate change [
1,
2]. Moreover, excess nitrogen and phosphorus enter terrestrial ecosystems because of agricultural activities [
3,
4]. These chemicals have toxic effects on agricultural workers, their families, and local populations, both directly and through agricultural fields. As a result, a pesticide toxicity and exposure risk index [
5,
6] can be established. These effects can be mitigated with autonomous smart farming because chemicals such as fertilisers and pesticides are applied as and when needed and only to the right areas. In addition, there are several other aspects of precision agriculture that would reduce on-farm energy consumption, such as replacing heavy tractors with lightweight, autonomous vehicles that reduce soil compaction, the energy needed for tillage, and CO
2 emissions.
Modern technologies are increasingly being deployed in agricultural machinery, creating Information and Communication Technology (ICT)-based solutions such as global-positioning-based route planning, the automatic control of implements, fertiliser and irrigation mapping, soil analysis, and crop health monitoring. Moreover, remote sensing technologies for big-data-processing challenges are being introduced into agriculture [
7]. Data on agronomic workloads are collected and recorded in digitised computer format files from tractors, harvesters, and implement systems. These data are exported from the computers used in smart farming machines and imported into special software to optimise mechanised operations according to pre-determined digitised work plans. These work plans are developed and analysed in different farm management systems. However, it is not only important to buy modern agricultural machinery; it is also important to take full advantage of the opportunities offered by ICT.
In most cases, farms use machinery from several manufacturers with different systems for collecting, processing, and displaying data. There are also differences in the operating systems of the onboard computers and, most importantly, in the formats of the data stored. The user is faced with the problem of having modern solutions installed in their agricultural machinery but not being able to collect, combine, and analyse their data comprehensively. This incompatibility between software and data structures leads to a loss of potential for smart solutions. Digital data provide sufficiently accurate and convenient accounting and forecasting for performance; however, the full use of all available data is often limited by the lack of uniformity in the transmission of data from different farming machines, and current standards do not cover all cases of data transmission from farming activities. This does not ensure the seamless exploitation of the potential of smart farming [
8]. Moreover, according to a survey of experts in Brazil, the adoption of ICT and the application of these skills in agriculture often vary considerably across regions of the world [
9]. Even the relatively widespread adoption of advanced agriculture in Germany (42–58%, according to the survey) faces a lack of compatible interfaces in agricultural technology [
10]. The age of farmers and how advanced the machinery used is are still essential factors in applying ICT in agriculture [
11].
Smart farming, including automation, has already developed models that increase farm productivity and quality, improve working conditions, and reduce manual labour. These improvements create sustainable farming. Primary ICT solutions in agriculture (semi-autonomous) are designed to monitor and manage sowing and planting, harvesting, packing and storage, and livestock care, but they are task-oriented, i.e., there is no possibility of integrating them into a more complex workflow for a full application. There is also a lack of interoperability, which requires users to carry out additional work, such as manually transferring output data from one system to another.
Thus, the integration of different technologies and services, such as software components, various farm machines, mechanisms, vehicles, and other equipment, using a middleware solution with a common information model and application interface, can address the smart farming challenges described above. These improvements would also reduce the negative environmental impact of agriculture. To solve this problem, this paper describes the development of an innovative information system for agricultural machinery. The architecture of this agricultural data aggregation and conversion model allows for the collection and use of working data from different pieces of agricultural machinery which differ in their original file formats and cannot be combined and used in a common analysis system. File-format unification was carried out, enabling the conversion of the data into json format using a Python library. Then, utilising geographic data, spatial analysis methods employing mapping were used to match fields with different agricultural designations such as sowing and fertilising. Thus, digital layer formation was enabled to increase the model’s functionality. Scientific contribution was defined through the application of different formats and data processing tools, expanding the functions offered by agricultural machinery. An additional added value of the developed model came from enabling different topographical functions in the representation of operational agricultural indicators. This paper is structured as follows. In
Section 2, related projects and research studies focusing on smart farming development and data exchange tools are reviewed.
Section 3 presents the structure and design of the architecture of the agriculture data aggregation and conversion model. Model application cases are presented in
Section 4. A discussion and conclusions are provided in
Section 5.
2. Review
As reported in the European Parliament’s Science and Technology Options Assessment (STOA), smart farming technologies make it possible to produce “more with less” [
12]. The use of natural resources, agrochemicals, antibiotics, and energy will be reduced for the benefit of farmers, the environment, and society. In this respect, it is assumed that a comprehensive and systematic approach achieved via intelligent sustainable and digital automated production is urgently needed. From this perspective, precision agriculture needs to consider the use of various applications such as data collection and cloud computing, cyber-physical systems management, decision support systems, and autonomous vehicles in agricultural processes. These solutions aim to establish a holistic approach in which everything is closely linked to the optimisation of production, energy, water, food quality, and services. ICT makes it possible to carry out tasks more efficiently, quickly, and comfortably for the operator and to use digital working data for farm record-keeping and the implementation of advanced farming. The conventional technologies utilised here are continuously variable transmissions, auxiliary guidance systems and power units, alternative fuels, remote diagnostics, controllers operated via specific communication protocols, data acquisition and transmission units, fleet information systems, etc. [
13].
Different data exchange models have been applied in individual agricultural modernisation projects [
14]. FLOURISH (H2020-ICT) includes a three-dimensional multispectral map with high temporal and spatial resolutions, land intervention tools and techniques, data analysis tools for crop monitoring, weed detection, and a user interface designed to facilitate agricultural decision making. EU-PLF (FP7-KBBE) developed management tools for the continuous, automated, real-time monitoring of animal welfare, health, environmental impacts, and production. PIGWISE (Eranet ICT-AGRI) developed an individual pig performance and welfare monitoring tool that monitors warning signs such as changes in animal behaviour and other parameters for the early detection of diseases. RoboFarm (EU ICT-AGRI ERA-NET) aims to develop a technology platform that integrates and harmonises existing software and hardware technologies into a single system, using robots equipped with sensors and active vision systems capable of collecting data from the field and transmitting it to farmers [
15].
One of the first initiatives to unify the exchange of data from agricultural machinery was the iGreen project, which involved research institutes, government agencies, Original Equipment Manufacturers (OEMs), and service providers [
16]. In this dynamic, network-based architecture, the raw value from each CAN-Bus message was stored as a JavaScript Object Notation (JSON) document. Although the platform was successful in practice tests, the final communication with the data server occurred through the same central agricultural machine. This showed the platform’s potential but also the limitations of its use. A cloud-based farm-data-management architecture makes the use of the farmer’s own and external information convenient and easily accessible via Internet connection only, including the functionality of a social network for farmers [
17]. This architecture does not cover initial data collection for different agricultural machines; however, a JSON format for server messages was used.
The platform architecture of the AFarCloud project is defined and consists of three main functional components: (a) the farm management system, (b) the semantic middleware, and (c) the hardware [
14]. The platform is connected to other external data sources, such as third-party data and legacy system databases. The farm management system offers a task management tool for planning collaborative tasks involving unmanned aerial vehicles (UAVs) and ground vehicles (i.e., tractors).
The semantic middleware offers the following components: data storage and retrieval in the cloud; image management and cataloguing; the on-farm registration of IoT devices, animals, and vehicles; the management of data flows within the platform; the management of ground and unmanned vehicles; and the processing of the resulting data [
18,
19,
20].
Semantic middleware installs the software so that the farm management system can access the devices in a unified way. The semantic middleware acts as a communication centraliser, distributing messages between the farm management system and the devices. Semantic middleware offers a set of device-level communication interfaces. For example, a decision support system to send tasks to ground and unmanned vehicles and receive real-time feedback and status; ISOBUS to manage communications with ISOBUS-compatible ground vehicles; MQTT to manage communications with individual and onboard sensors and actuators; and REST to retrieve data from legacy system databases [
14]. The equipment layer enables the installation and integration of services and data related to unmanned aerial vehicles, ground vehicles, actuators, sensors, and other connectivity devices. In this complex context, extensive sensor testing is required before prototypes can be deployed in the field [
21].
The different formats of the hardware applications of farm machinery make it difficult for farmers to engage and develop precision agriculture [
22]. The possible communication between the different intelligent farm management applications is also not standardised. The standardisation of the transmission of data between machines and implements began with the formats AgroXML and AgXML. Unification is necessary for communication protocols and data processing; moreover, it is also essential to pay attention to the level of security, the amount of time required to process the data, and the overall costs [
23]. A standardised interface evolved through the gradual development of individual systems, including a binary data format and CAN (
Controller Area Network)-protocol-type communication [
24]. The CAN bus and the data transfer protocols had to be modified from closed- to open-type for interchangeable devices. The expanded information was embedded in the data transfer protocol according to eight priority groups depending on the significance of the data object.
The so-called ISO-XML format, defined by the international standard ISO 11783 [
25], is used for data transmission in agricultural machinery. This standardised data interface was first introduced using a standardised connector between a tractor and a connected implement [
26]. The interface has been developed into a CAN-type 250 kbps data bus to which other agricultural peripherals and tractor control computers are connected [
27].
ISO 11783 provides a network of embedded software for data transmission between sensors, controllers, and control devices, both on the tractor and connected implements. The standard also defines a protocol for transmitting data to data servers (cloud storage) and later via mobile devices. A designated computer, usually located in the driver’s cab, collects all the data, which is then exported via USB, another interface, or wirelessly for further use in increasingly used systems such as farm management information systems (FMISs) [
10]. Wireless data transmission is associated with telematics systems in which the data can already be converted into the required format. The following companies already offer commercial telematics services: AGCO (AgCommand) (owned by
Challenger,
Fendt,
Massey Ferguson, and
Valtra Farm),
John Deere (system JDLink),
Claas Telematics, Raven Slingshot, and Trimble Connected Farm [
28]. Using an XML (
extensible markup language) data format, the protocol implements real-time data transmission, such as between a machine and an FMIS [
28,
29]. This is achieved using a simple in-cab device, the task controller, which records and/or manages data transmitted via a standardised protocol. Device interfaces are defined in ISO (2015).
Several brand-oriented agriculture software programs are on the market from individual manufacturers, offering data analysis. The most common are those developed by John Deere, Case, Claas, Fend, and others; however, only original data files are allowed for use in a specific software. The John Deere Operations Center platform is used for transferring data between support vehicles and implements through JDLink connectivity. Performance in the field is improved utilising boundaries, the guidance line tracking function, and field flag obstacles. John Deere Remote Display Access (RDA) allows an operator or farm manager to monitor machine performance data through the internet platform MyJohnDeere.com. Yield maps, as-applied maps, and prescription maps are compiled using software from Case IH AFS (Advanced Farming Systems,
https://www.caseih.com/apac/en-int/products/advanced-farming-system/afs-system, accessed on 3 September 2023). This software also allows the user to prepare reports and import satellite images of the cultivated field. The software supports all major precision farming systems on the market, including Trimble, Ag Leader, and GreenStar. The software Farming 4.0 from system 365FarmNet (solution by Claas) allows for task planning, field mapping, inventory management, and other functions and is available on a mobile device as well. Agrirouter, developed by Fend, is another brand-oriented software used for data transfer and processing, with additional options from the VarioDoc Pro documentation system. In general, a telematics function is available from most the manufacturers; however, this function is used for data transfer only, and specific smart farming tools are available only with original software. The NEXT Wayline Converter enables the conversion of data from one brand to another (hallenger, Massey Ferguson, Valtra, and Gleaner); however, a lack of compatibility between waylines and field boundaries is still relevant.
Although the ISO 11783-10-based standardised agricultural machinery interfaces provide a wide range of data between an FMIS and the machinery, there are also some limitations [
30]. The main aspects of using ISO standard 11783 in the context of data transfer are formulated in
Table 1.
One of the largest and most widespread organisations is
AgGateway (
www.aggateway.org (accessed on 5 September 2023)), which offers open-format conversion tools [
31]. This platform and its toolkit, also known as ADAPT (
Agricultural Data Application Programming Toolkit), solves the problem of format diversity, not by offering a new farm management application capable of accepting all possible data file formats but by converting the different data formats into a common format compatible with conventional applications.
Platforms such as ADAPT, AgHub, and AgroSense [
32] address data synchronisation issues, but full data compatibility is not fully implemented. As data move in both directions between a farm management information system (FMIS) and the MICS, data re-encoding occurs [
33]. The process becomes unwieldy and often technologically complicated as different systems change work tasks. The job planning information is converted into a standard XML file and transmitted to the job controller on the tractor (wirelessly or via external media). Based on the content of the received task, the controller sends a message to the implement and records this information as well. The collected information is sent back to the farm computer and converted again for further use.
The successful conversion of XML data is achieved programmatically using a precise formulated query via Structured Query Language (SQL). To achieve this, the structure of the data to be sent must be known. The exported data must usually to be re-converted, so the query must be reformulated again. As a result set, the final query is saved and used to create the attribute string and generate the corresponding values for the new exported XML file [
34].
Despite the ability to transmit large amounts of agronomic data from machinery, communication systems based on ISO 11783 (including the internal systems of the farm machine—the implement) are plagued by large volumes of data traffic [
35]. In this case, it is possible to use dynamic data compression (ISOBUSComp protocol). This protocol is selected by the control unit (ECU) when sending higher-stream data via the
Compressor/
Decompressor modules (for sending and receiving data, respectively). The data buffer (instantaneous storage) is selected for the maximum amount of data (
MaxBuffz) in the integrated virtual decompression machine (parameter
UDVMmz, which allows for the processing of 65,520-byte files).
To assess the critical amount of data to be sent instantaneously, the Partition and Reassembly Mechanism (
PaRM) microcontroller is used to send the incoming data to the appropriate data compression procedure [
35]. The overall architecture of the experimental system in this study consisted of a data bus connecting several of a tractor’s operational control units and a data compression controller programmed in CAPL. Importantly, this data transmission technique does not require changes to the existing ISO 11783 standard.
3. Data Aggregation and Conversion Model
The developed data aggregation and conversion platform combines positioning, mapping, multi-class classification, and identification technologies. The model’s architecture ensures that data streams are integrated into machines and other mobile or stationary communication devices and also from cloud-based data streams that integrate information from other farms and related data sources. The platform engages the analysis of collected data, supports updating the information, and uses external data sources to extend the platform’s capabilities and functionality for farmers. The platform allows farmers to analyse uploaded data by area and time.
The initial stages of the development of the data aggregation and conversion model included the specification of smart technology file and data formats, their properties and structure parameters, the identification of the optimal unified data structure, and the corresponding data storage format. This was accomplished in the following stages:
Samples of work files were collected from the six farms participating in the study, using agricultural machinery from different manufacturers, and used for the different format scanning tasks;
The properties of the different files and formats collected and the structure of the recorded information (the model uses both overlapping and differently structured information in the data files) were examined;
Several possible common data structures were developed from which the optimal structure was selected after an initial test of the platform’s operation was conducted and the platform’s requirements were considered;
Methods were developed for converting data from the files used into a unified structure;
An automated system that identifies the uploaded file and converts it into a unified data format was designed.
The XML-format-based data files were initially converted into json format using Python for further data processing. This format is characterised because it is easy for most programming languages to read.
The Support-Vector algorithm in Python was used for data classification following the file-format unification. This algorithm is based on data grouping (clustering) for the measurable characteristics (features) of an input variable (an uploaded file). The study found that most agricultural machinery allows data to be exported and stored in at least two different ways and formats, so a methodology for evaluating data aggregation was devised to assess the efficiency of the different data storage tools and methods, as well as the usefulness and informativeness of the data structures they generate. The data aggregation interfaces and formats were evaluated based on the following:
Their complexity of use;
The need for additional tools and instruments;
Their stability of operation;
The clarity of the structure of the exported data;
The informativeness of exported files;
Other technological parameters.
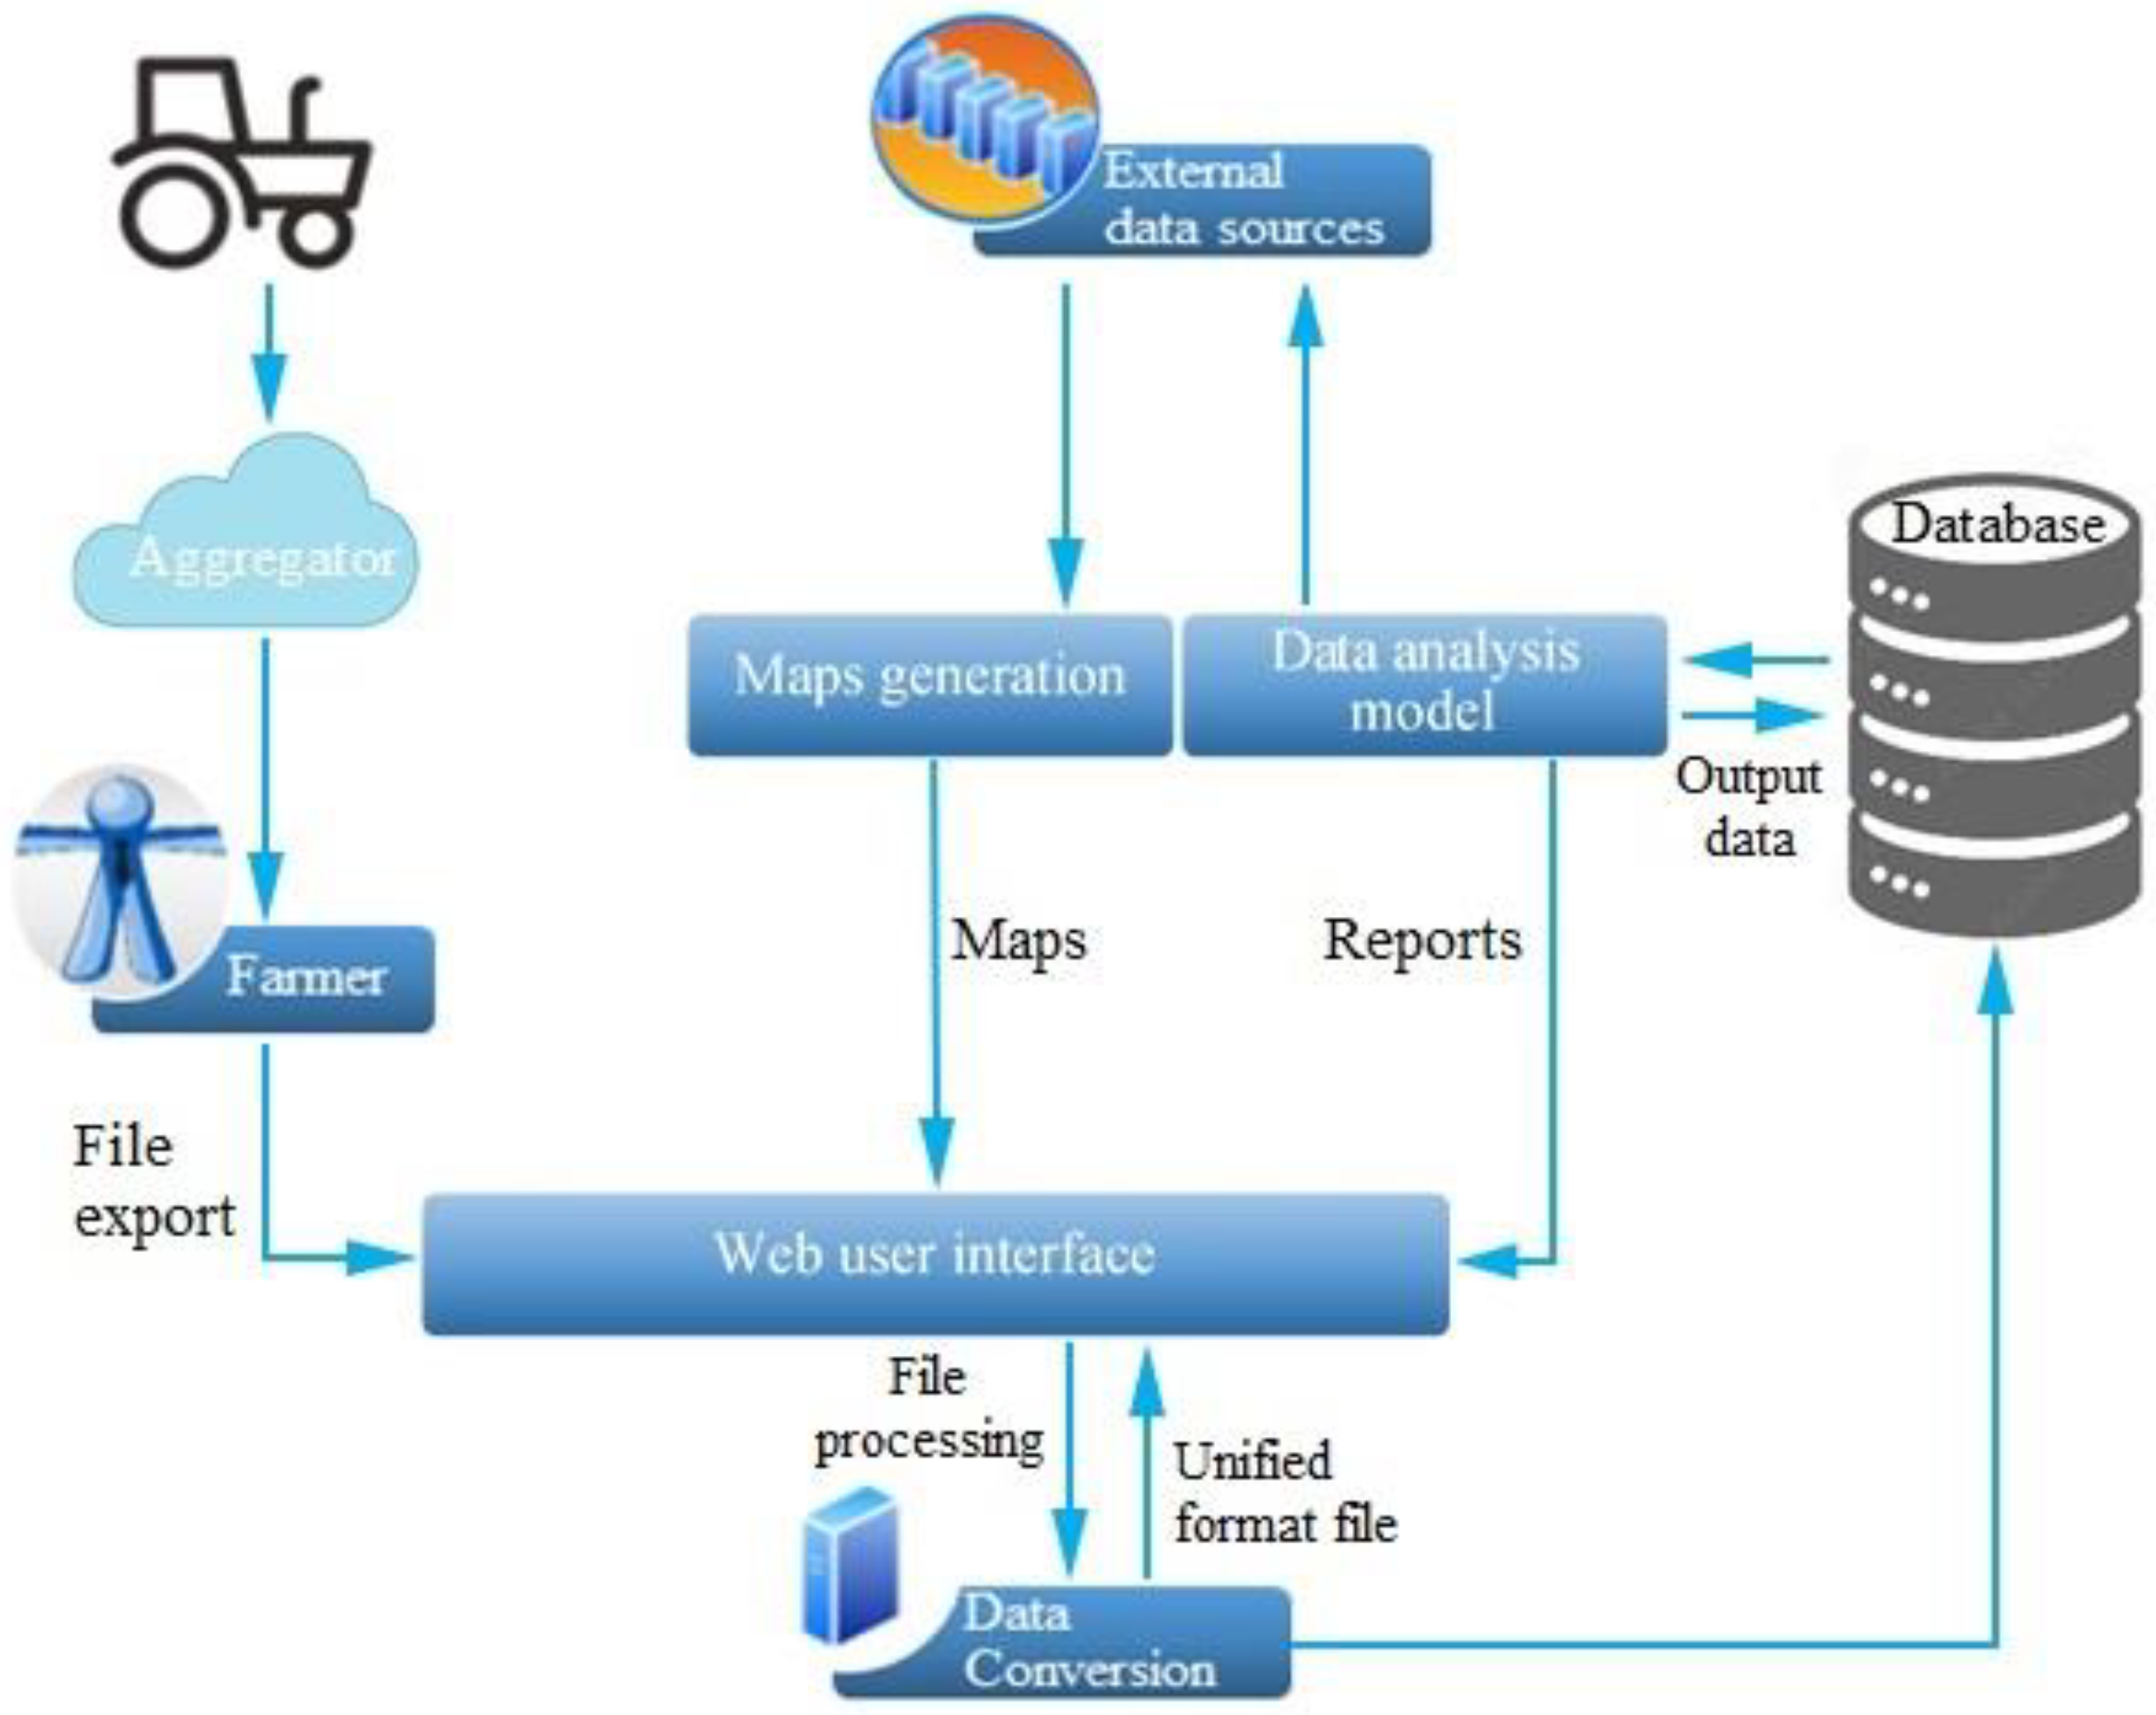
Based on the study results, a data aggregation model for smart agricultural machinery manufacturers was developed according to the data exchange scheme (
Figure 1).
Files from the tractor and other machinery are first uploaded through the aggregator interface to the systems used by farmers and provided by the manufacturers, from which data export is possible. Other data from external sources can be uploaded directly due to unnecessary aggregation. Farmers create the desired data on the platform using a common web user interface that assigns the uploaded data to the uploading farmer and provides data management capabilities. The web user interface was specifically designed to manage and display geographic data. It was built using the open-source PHP (Hypertext Preprocessor) and JavaScript programming language libraries.
The data uploaded to the default web user interface are converted into unified files and hosted in the database. The conversion of uploaded files is based on the specifications of the formats developed by different manufacturers. The platform architecture is supplemented with a component for the formation of a unified data structure. The component, upon receiving a new data file, forms a DataFrame object into which it calculates the necessary data, transforms its structure, and arranges it in order. The component performs data transformation using mathematical models capable of detecting data which are of the required type but structurally different, using the Python Pandas library (for agro-data manipulation and the grouping and processing of DataFrame objects). Aggregated and transformed DataFrame objects are each placed in their allocated space in a separate database, thus ensuring that all data are used in a unified format for further calculations.
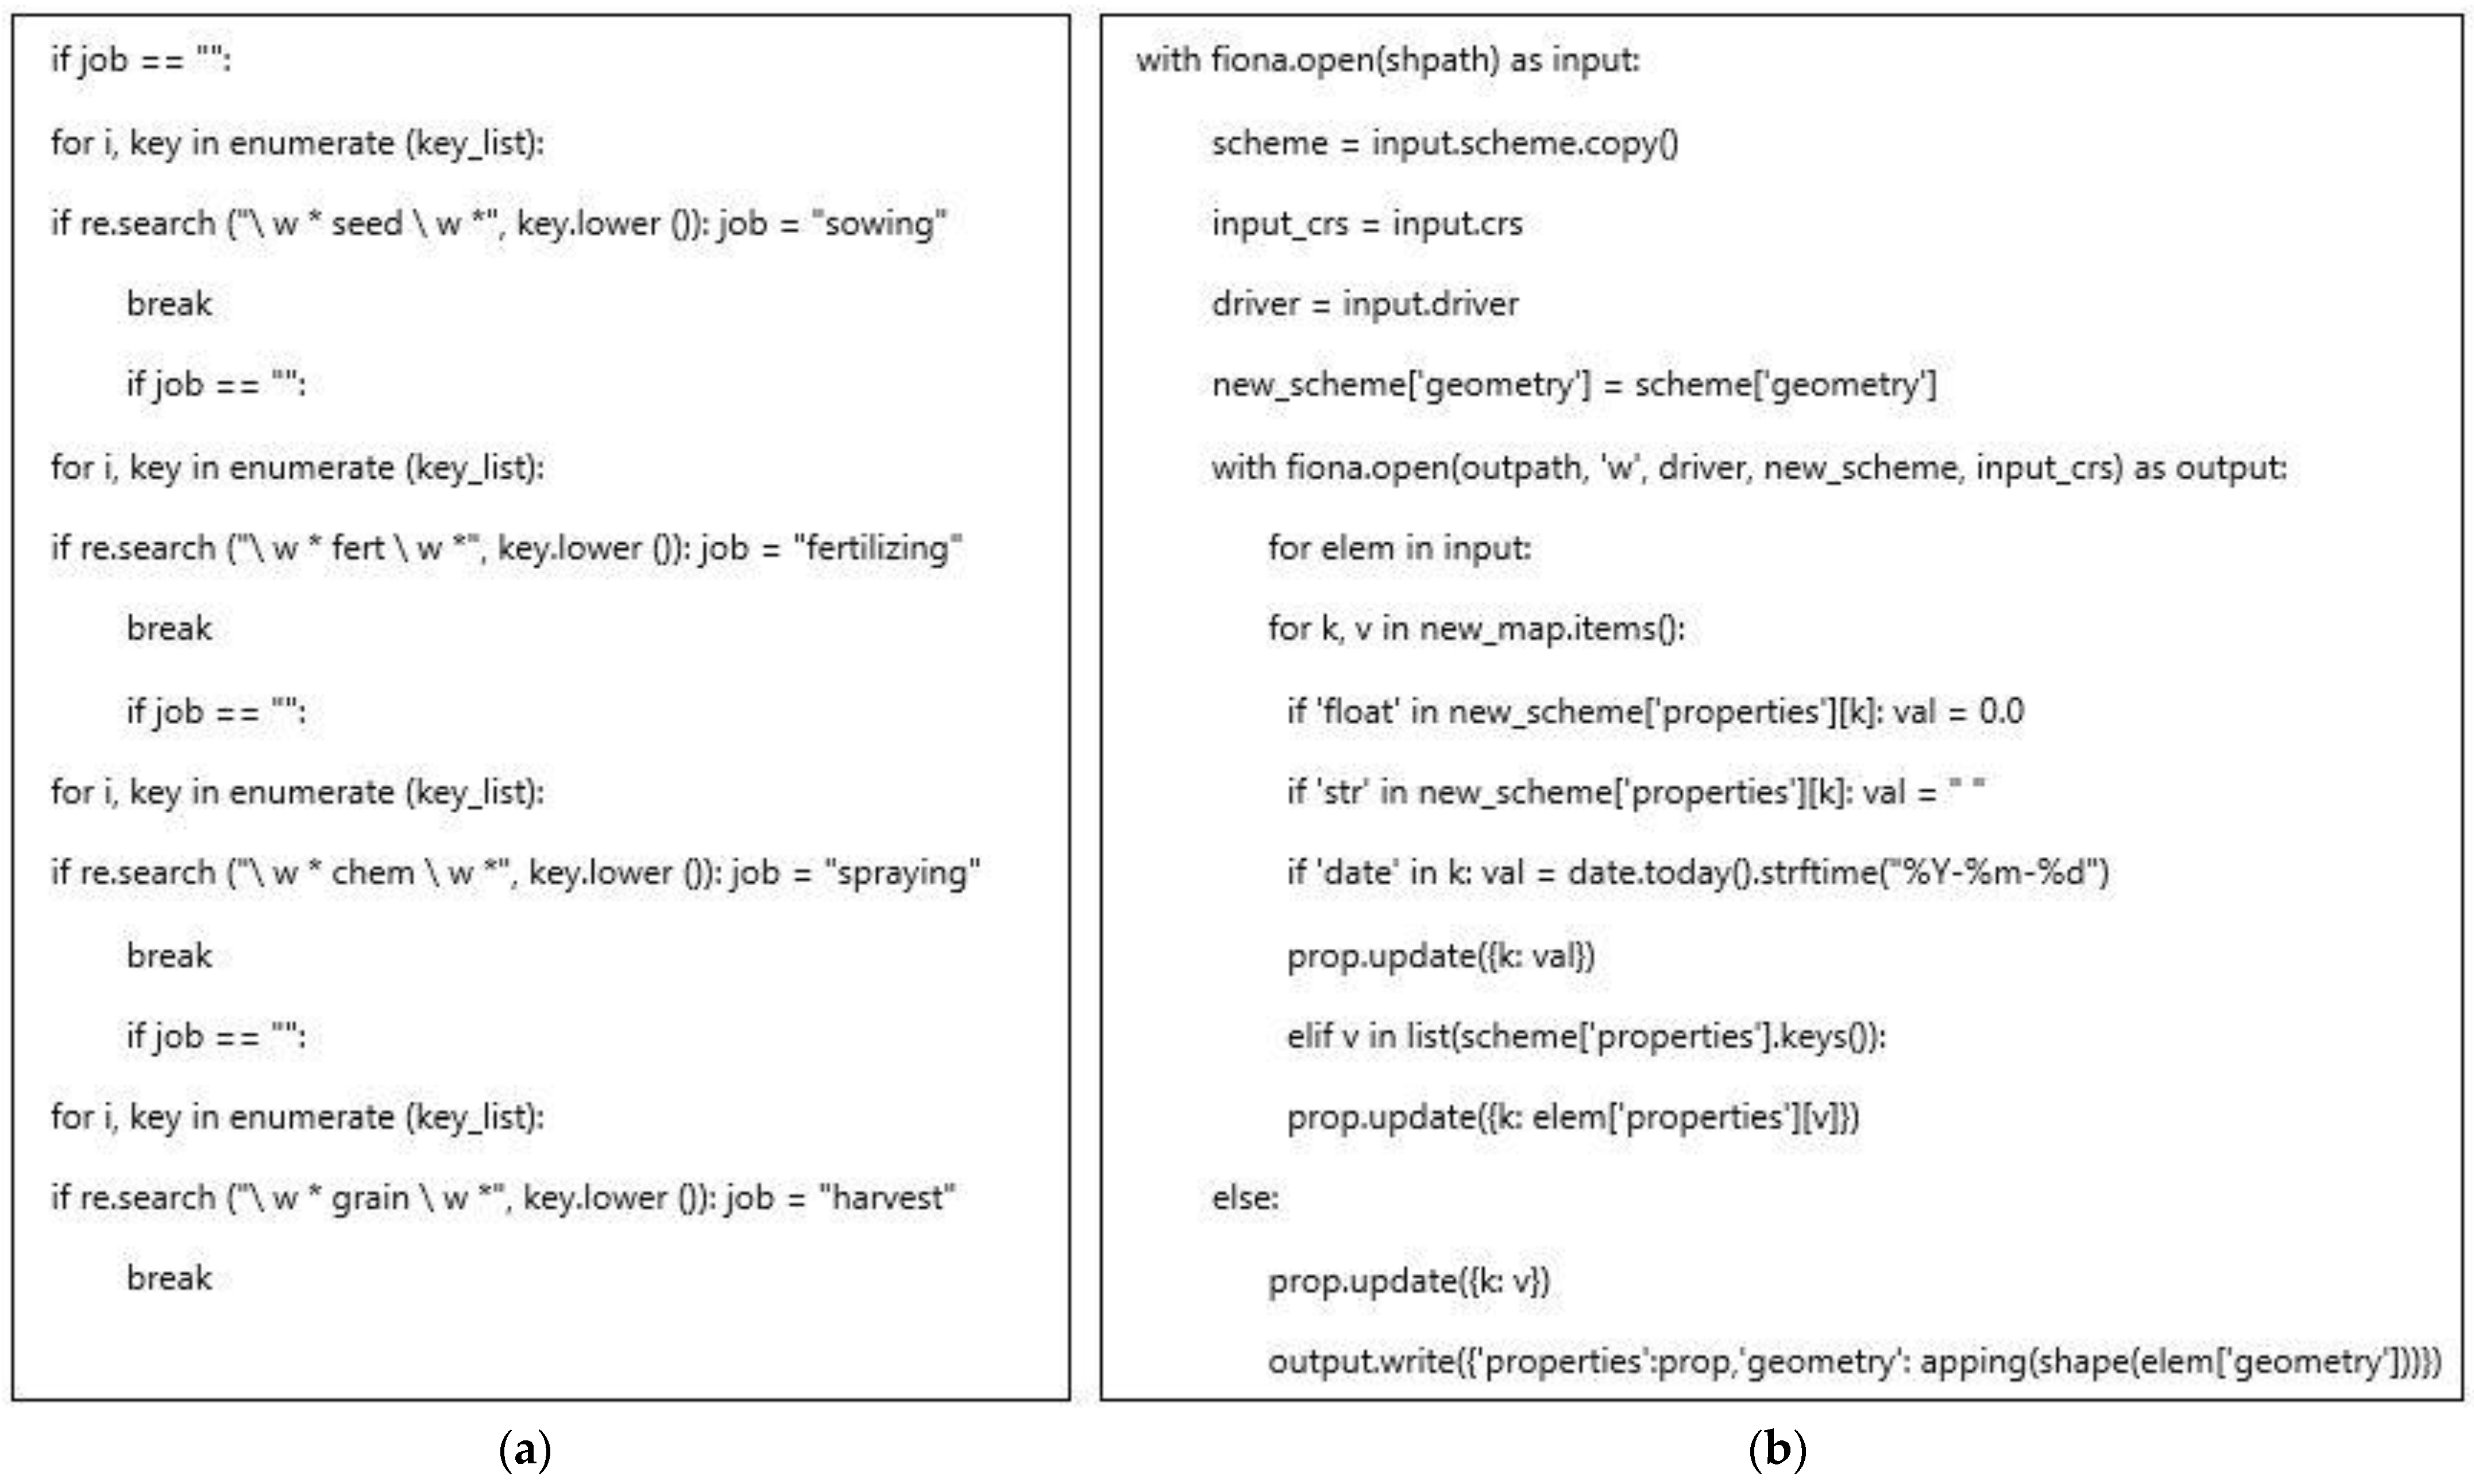
The source code (
Figure 2a) provides an example of how to determine the type of work from an uploaded file based on the formats provided by different manufacturers. The format change uses the
Python programming language [
36] and its libraries, which provide the ability to read, write, and process vectors and, if required, raster geographic data. In a particular case, the built-in Python function “
enumerate” is used to begin iterating and to keep track of activity conducted while iterating through the data array. In a given code part, an “
if” cycle performs iterations through sowing, fertilizing, spraying, or harvest according to variables
seed,
fert,
chem, and
grain, respectively. A few cycles are created that individually check if the action can be assigned to a farm operation (
seed,
fert,
chem, and
grain). After matching the data from the different data arrays, the work and logic assignment cycle is completed. Otherwise, a further check is conducted to see if the job remains unassigned.
The database is supplemented with processed information from external data sources. One of the external sources is represented by satellite data, which are processed before being placed in the database. From the multispectral data collected by the satellite, various vegetation indexes are calculated such as NDVI, MCARI, and LAI [
37]. The indexes are generated using the raster data processing library of the
Python programming language and the GDAL spatial data processing library.
The data in the database are used to build and further develop data analysis models. These developed models generate reports for farmers as well as maps for farmers.
Using maps uploaded by farmers, a temporal analysis of the fields is carried out and a report is generated. The temporal analysis is performed using
PostGIS spatial analysis functions as follows: the perimeters of areas and fields are subtracted, collecting fields in the same area that were created at different times. The “
fiona” module in
Python is used to interface geographic information systems (GISs) with a
web user interface (
Figure 2b). First, the directory is opened, and data are imported (
scheme,
input, and
driver). A new geometric scheme is created based on these data. Then, a “
for” cycle is initiated for each imported element, which creates a new map element and set the following parameters of the map element: float, str, and date. The created map elements are saved or updated in the database, and the geometric shape is drawn on the map (with different layer options). This information is used to calculate and output a temporal field analysis report depending on which field the user selects.
All the reports and maps generated by the platform are available to users via a web-based user interface (
Figure 1) and API (Application Programming Interface) access. The API allows to access the system’s functions externally by sending certain requests to the server that services the system.
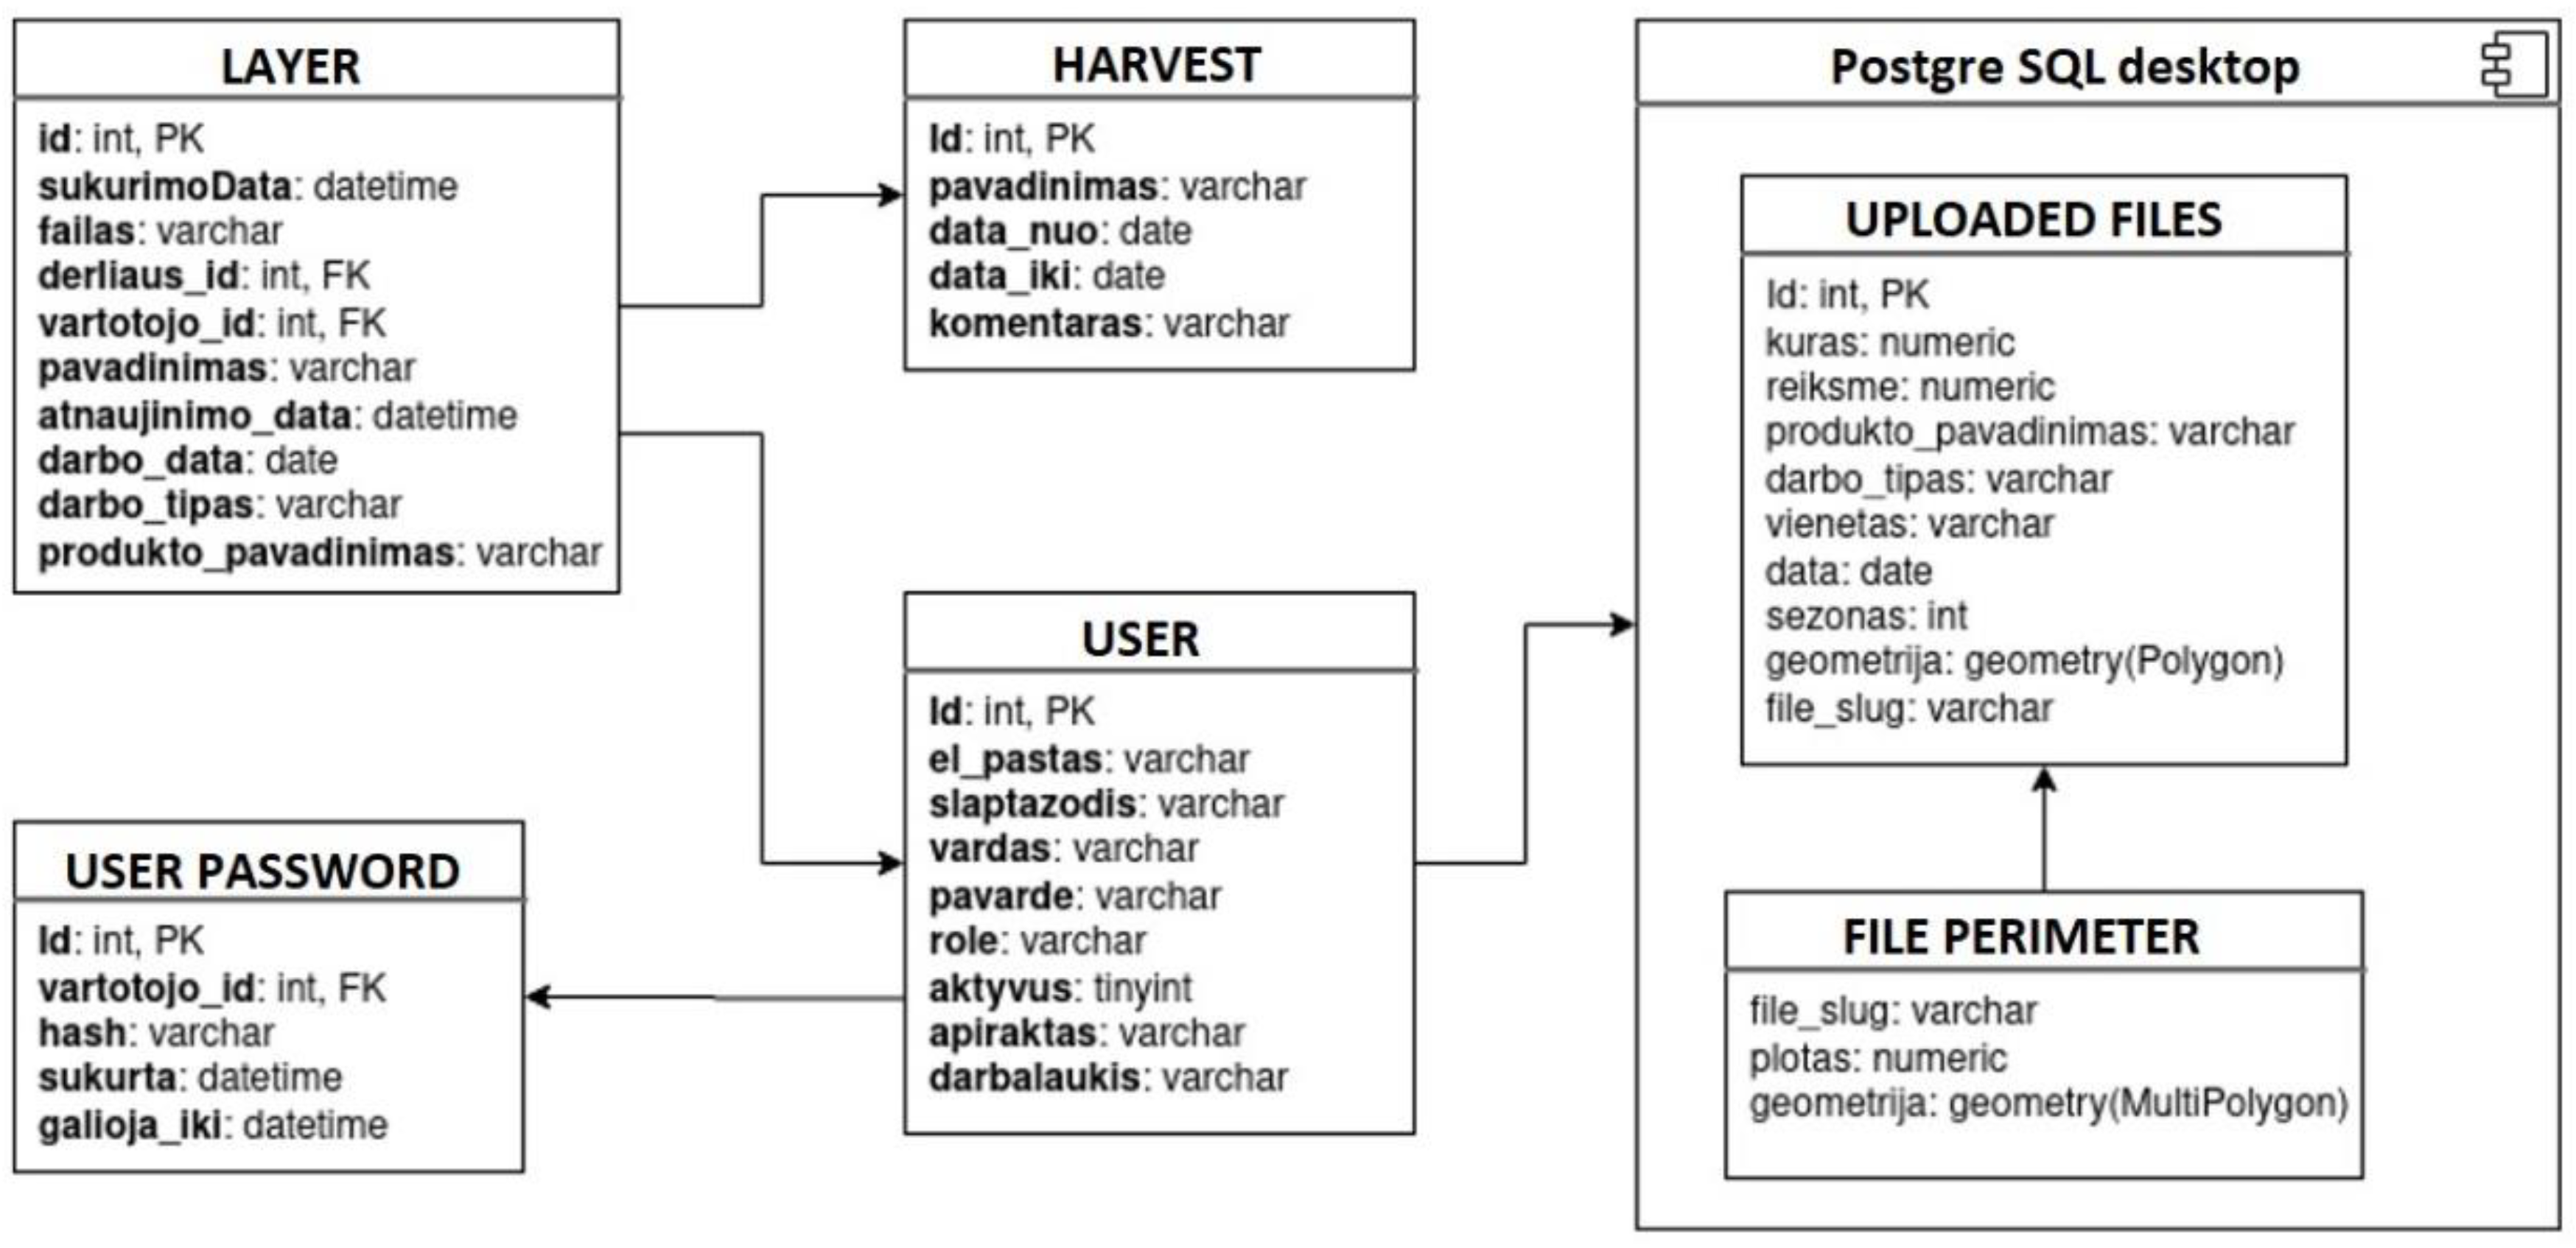
The
PostgreSQL database management system extension
PostGIS, which is designed to work with
GIS data, is used for storing the geographic data and for interfacing with additional information sources. The geographic database comprises interconnected parts (
Figure 3).
The user section holds the user’s basic login information and status, as well as the API key used by the user to access the system information externally. The user section also contains a unique desktop code that is used to connect the
PostgreSQL part of the database and the
PostGIS part of the geographic database. The code for this part of the program is generated from the information in the uploaded file and the date of the upload using a cryptographic hash function, a cryptographic method widely used in programming to encrypt data. This function is used to obtain a fixed-length result (character string) from which it is not possible to recover the original data. The system encrypts the entered data with the same hash function and compares the resulting hash value with the value stored in the database. If the values match, the data are good, if they do not match, the entered data are different from the protected data [
38]. The user section is connected to the user’s password section, which allows for password validity checks.
The layer section contains information about the fields uploaded by the user but does not hold the field geometry and other geographic information itself. The stored filename is used to associate the field data with geographic data that are accessible via the user’s desktop information. The layer is also linked to the harvest, the type of work carried out, and the dates.
For each platform user, a PostgreSQL desktop is created which separates the data of the different users according to their unique identification numbers. Each user also has their section of uploaded files which are not related to each other.
The uploaded files section contains GIS-type data stored in an optimised “geometry” format. The PostGIS extension allows for the use of geometric functions and query databases using GIS data. At the same time, the section holds the information obtained when users upload a file, for example, the amount of fuel, the type of work completed, the unit of measurement used, the product used, and how much of this product was used in that polygon (area of land).
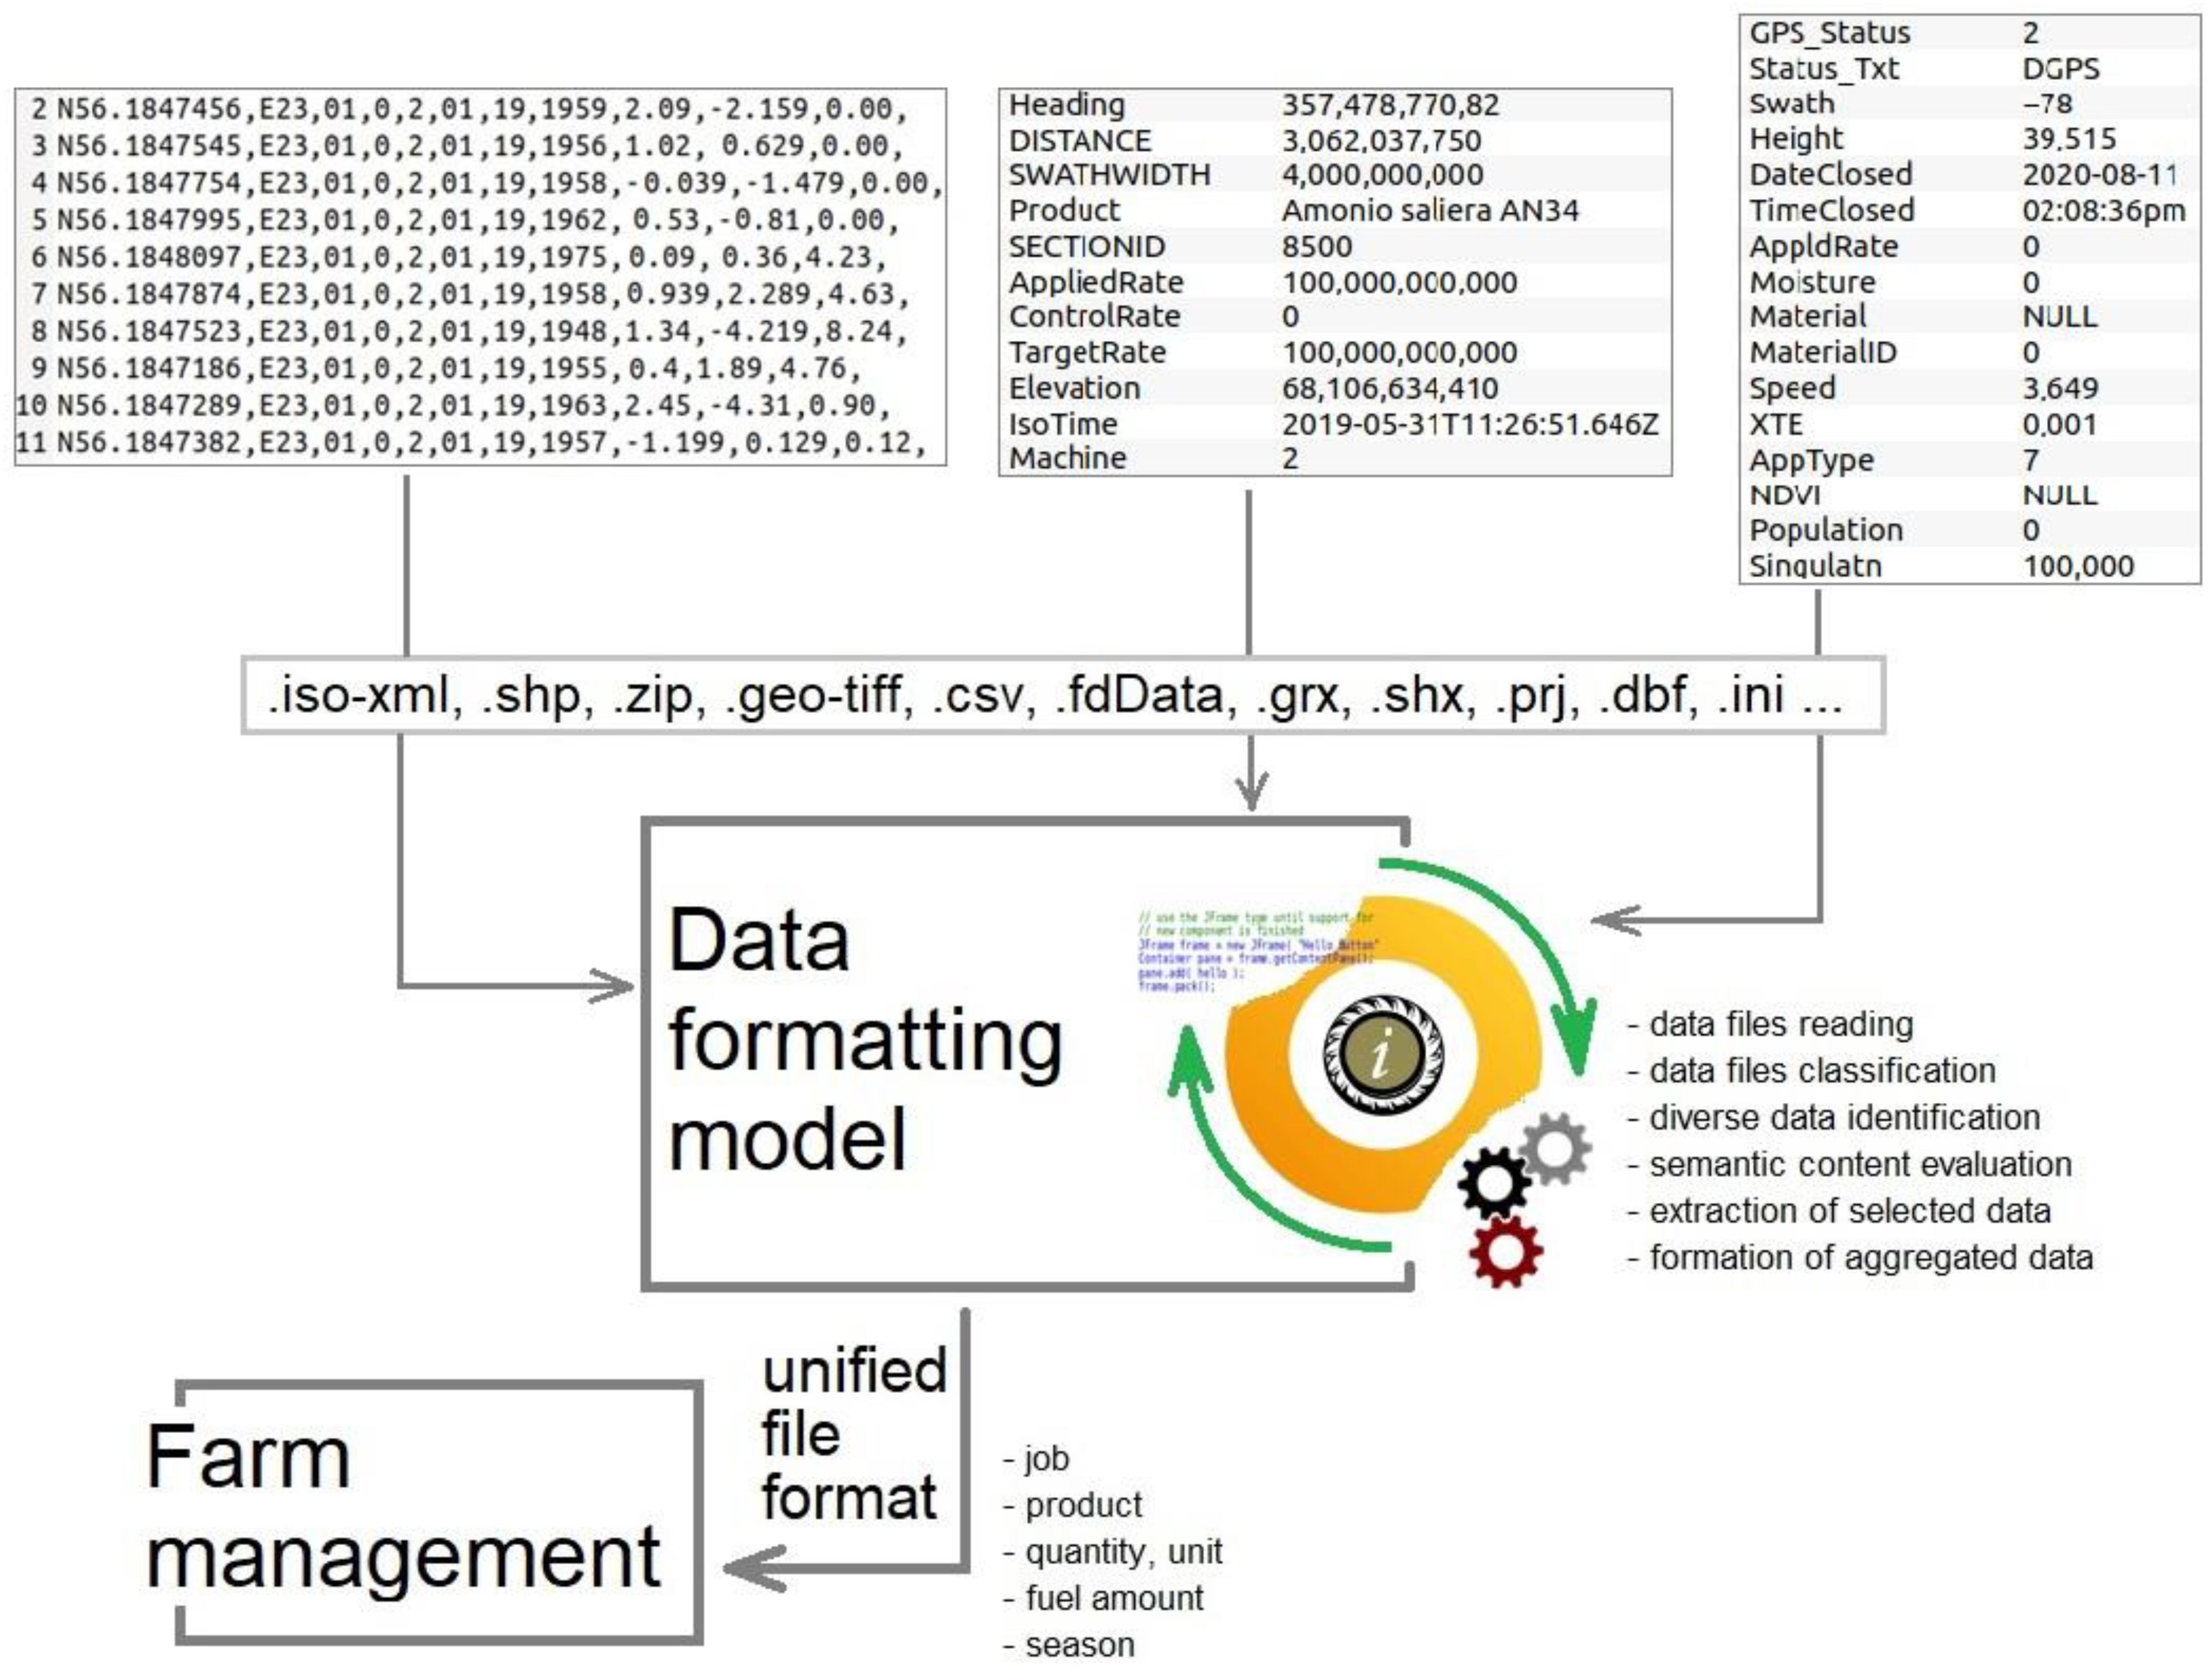
When uploading data to the platform, the geometry of the perimeter of the uploaded field (file) is automatically generated. The user-uploaded field, which comprises individual polygons, is merged into a solid polygon by applying a small distance buffer around each polygon, thus covering any gaps between them. The merged field is converted into its perimeter and the
MultiPolygon type so that the field can be read even if there is an area inside the field that is outside the field. The resulting perimeter is used for GIS operations and is saved. This saves computational resources by eliminating the need to calculate the perimeter each time. The perimeter is saved as a
MultiPolygon geometry type, which allows you to save non-contiguous geometries in a single line, i.e., if there is a space in the middle of the field, the polygon is still saved without errors. Combining the data aggregation and geographic database models results in a common platform that formats different data types and adapts them to farm management (
Figure 4).
4. Model Application, Validation, and Testing
The data aggregation and conversion platform prototype was tested using data collected from real agricultural machinery. The original test data consisted of 35 different datasets collected from agricultural machinery. Testing algorithms were developed to check the validity and format of the system’s source data and the conformity of the results generated by the prototype system with the pre-designed rules. During the initial tests, it was found that six of the primary data sets were not processed properly, which led to further optimisation and refinement of the prototype during the system validation phase. After refining the model, all the tests were carried out successfully, and the prototype results were tested on actual agricultural machinery.
Once the structure of the data conversion model was developed, tools for aggregating, displaying, analysing, and synthesising aggregated data were provided for convenient and efficient use. For this purpose, a set of transformed data processing and analysis methods were developed, in addition to algorithms to analyse, overlay, compare, and aggregate spatial data. Accumulated user-uploaded or other external data allow for the generation of spatial data reports that include current data as well as information accumulated over time. Using the spatial database and the functions it provides, all these methods were adapted to the location of the data on the maps. The reports generated can be accessed and data manipulation can be performed by users by logging in to the main system web page.
With the help of the developed algorithms, the data fed into the system can be analysed and used for a wide range of statistical, temporal, and spatial analyses and decision making in relation to smart farming. The functionality of the web-based system includes the following:
The representation of uploaded data in a spatial format;
The representation of the statistics assigned to a spatial point;
The representation of the aggregation of the uploaded data across time intervals and space;
The submission of various types of reports on the selected area;
The comparison and overlap of different maps.
An overview of the selected field and the work performed after importing and converting the agricultural machinery data file is shown in
Figure 5. The satellite image is supplemented with a colour layer showing the data of the selected indicator (fertilisation, spraying, sowing, yield, etc.). Selecting the desired layer (colour) provides the user with initial information about the default indicator, while selecting the function History provides detailed information for the field area. The extended field history information consists of the amount of product (sowing, spraying, fertilising, etc.) and the amount of fuel used for the work in absolute terms (kg or l) and relative terms per unit area (kg/ha or l/ha). The annual average value of the parameter in question is also provided, as are the previous year’s figures (if the system was charged).
Functional representations of the overlay and a comparison of the field map with the statistical data assigned to a spatial point in the developed platform environment are shown in
Figure 6. These functional displays allow the user to easily and conveniently compare different field indicators by moving the overlay line concerning the field area (
Figure 6a) or by comparing the same field information in parallel on different parts of the screen (
Figure 6b).
The final stage of the platform’s development was the creation of a tool for generating digital layers for smart farming for agricultural machinery. The tool allows the user to use satellite data to create plans for precision agriculture activities (fertilisation, spraying, sowing, etc.) based on the generated historical data and vegetation indexes. These plans are formed on a map in a format suitable for import into smart agricultural equipment (
Figure 7). An algorithm was developed to implement the tool, which performs the function of generating plans for precision agriculture activities from historical and satellite data.
5. Discussion and Conclusions
The agricultural data aggregation and conversion system developed and tested enables sophisticated data manipulation and analysis with more value added. The primary data generated by intelligent agricultural machinery are stored in databases integrated into the system. The data conversion model converts the different data files generated by the smart technology (files with producer-specific formats) into a single, unified data format that allows the data to be manipulated and subjected to different types of analyses (overlays, mathematical operations, spatial analyses, visualisation, etc.). The model ensures the identification of target data regardless of the format of the original data file, the evaluation of semantic content, and the transformation of the aggregated data into a unified format suitable for further use in precision agriculture management applications. Processed data are stored and aggregated in specially designed and configured databases.
The emergence of ISO standard 11783 led to the enabling of plug and play integration between agriculture equipment across manufacturers, but this does not regulate further data transfer and usage. The main advantage of the model presented herein when compared with similar agriculture-data-processing models is related to the conversion of data from different agriculture machines. The functionality of unification and data reading from different format files for further usage provides wider data usage and applications in farm management information systems. With this data aggregation and conversion model, farmers do not experience inconvenience when working with tractors and implement systems from different manufacturers; however, the presented system requires a knowledge of data configuration as a specific file’s properties should be adjusted using the model. This is one of the shortcomings of the developed model, which is intended to be improved in further stages of system development. Some of the competing information systems (i.e., the project ADAPT) pay a significant amount of attention to the user interface. Other platforms are original-format oriented (i.e., the system JDLink), with wide functionality but no possibilities of working with alternative formats.
The common limitations of the majority of agricultural-data-processing platforms are related to visual representations of non-standardised mapping. This occurs with different map lines and colour interpretations, in addition to layer inequalities and conformity to intended information. Intensively interpolated colour maps are output by GIS platforms; however, data analysis is limited without necessary standardisation. An important advantage of the developed data conversion model is its availability through cloud services and its easy access when working in field conditions (an Internet connection is necessary), as the designed web user interface does not require the installation of specific software.
The benefits of the developed system are expressed in economic terms due to the increased efficiency of farm management, i.e., the more rational use of agricultural machinery and the sustainable use of fertilisers and agricultural plant protection products. Monitoring the farm and evaluating statistical and historical data allows the farmer to select the most effective measures, and mapping fertiliser and spray applications allows them to be applied at the right time and in the right areas. Using fertilisers sparingly and targeting plant protection products reduces environmental and groundwater pollution, reduces the impact of farming on ecosystems, and preserves biodiversity. The system is relevant not only for cereal farms but also for horticulture, berry-growing, and horticultural farms where the optimal use of machinery, fertilisers, and plant-protection products is also important.
This system allows for the continuous monitoring of agricultural processes and the implementation of agricultural entities’ long-term and annual objectives. It encourages improvements in a farms’ performance and reduces its negative environmental impact.


