Abstract
Reversed-flow gas chromatography (R.F.G.C.) was employed to assess the impact of genetic modification on Saccharomyces cerevisiae yeast strains during the process of alcoholic fermentation, utilizing fig syrup. Multiple fermentations were carried out at various temperatures to evaluate the influence of genetic modifications on yeast strain efficiency. The study involved a wild-type yeast strain, W303, as a control and two genetically modified strains, W_M4_533 and W_M4_558, sharing the same genetic background as the wild type. Notably, the genetic modifications in the Msn4p transcription factor involved the substitution of serine residues with alanine at positions 533 and 558, resulting in the development of psychrophilic or ethanol-resistant strains. Utilizing the R.F.G.C. method enabled the differentiation of the duration of alcoholic fermentation phases, providing insights correlated to the yeast cell life cycle. The values of rate constants (k) for each phase, conducted with both wild-type and genetically modified cells using RFGC, aligned with the existing literature. Additionally, the calculation of activation energies for distinct phases revealed lower values for genetically modified strains compared to wild-type strains. This decrease in activation energies suggests enhanced efficiency in the alcoholic fermentation process for the genetically modified strains.
1. Introduction
The alcoholic fermentation process is of considerable importance for research and industry, in particular because of its significant economic impact on both the food industry and biofuel production [1,2,3]. A multitude of variables influence this complex process, providing opportunities for improving efficiency at single or synergistic levels. Extensive research has addressed issues such as substrate composition, yeast selection, yeast application methodologies and reactor conditions [4,5,6,7]. Another critical aspect affecting the overall viability of this process involves the economic costs and environmental impacts associated with the residual materials of this process [8].
One of the most important factors determining the efficiency of alcohol production is the yeast used. Yeasts, which are added as biocatalysts, have been extensively studied either to increase their alcohol production capacity, survivability and reusability in sequential processes or to improve the organoleptic characteristics of the final products [9,10]. In this context, Saccharomyces cerevisiae, the dominant yeast species in alcoholic fermentation, serves as the main candidate from which several strains are derived. The optimization of this approach has been significantly advanced through biotechnological interventions [11]. A key point of biotechnological modification of yeast lies in enhancing its resistance to harsh conditions and diverse environments [12,13]. To achieve this goal, it becomes imperative to regulate the genes governing the yeast cell response to stress conditions.
Transcription factors Msn2p and Msn4p emerge as pivotal and indispensable regulators orchestrating the cellular stress response. The intricate mechanism involves these transcription factors binding to stress-response elements (STREs), thereby instigating the activation of a repertoire exceeding 200 genes [14]. Notably, investigations into the quantitative transcription dynamics of a yeast strain manifesting ethanol tolerance underscore the substantive role of Msn4p as a regulator crucial for ethanol tolerance [15,16,17,18].
Apart from the aforementioned critical parts in the study of alcoholic fermentation, a key aspect involves understanding the life cycle of yeast strains, along with the intricate task of determining kinetic parameters for this process. The determination of these parameters poses a particular challenge, particularly during the initial stages of the alcoholic fermentation procedure [19,20,21].
In this investigation, two yeast strains, denoted W_M4_533 and W_M4_558, were assessed as biocatalysts. These strains underwent genetic modification through the substitution of serine residues in the Msn4p transcription factor with alanine at positions 533 and 558, respectively. The purpose of these alterations was to eliminate the kinase’s phosphorylation capacity at these specific sites, thereby facilitating the nuclear entry of Msn4p [22,23]. The yeast strains, W_M4_533 and W_M4_558, alongside the wild-type (W.T.) W303 strain of Saccharomyces cerevisiae, will serve as biocatalysts in the alcoholic fermentation of syrup extracted from dried figs [24].
Figs (Ficus carica L.) are fruits of elevated glycemic indexes. Their predominant carbohydrate composition consists of glucose and fructose, with a slightly higher prevalence of glucose (approximately 50% vs. 47%). Figs stand out as a rich source of essential nutrients, including calcium, fiber, copper, manganese, magnesium, potassium and vitamin K. Additionally, they are abundant in flavonoids and polyphenols, such as gallic acid, chlorogenic acid, syringe acid and rutin. Amino acids are also present in substantial amounts, rendering figs an adequate nitrogen source for yeasts involved in alcohol and ester production, particularly in alcoholic beverage fermentation [25,26,27].
The selection of figs as a carbon source for biocatalysts is justified by their cost-effectiveness, widespread utilization in the food industry and the enriched sugar composition [28,29]. The utilization of dried figs, readily available in commercial markets, offers the advantage of the prolonged preservation of their intrinsic properties [30]. This formal restatement emphasizes the nutritional richness and suitability of figs as a carbon source for biocatalytic processes, particularly in the context of their applications in fermentation and food industries [31].
The physicochemical assessment of the aforementioned yeast strains for the fermentation of must derived from dried figs was conducted through a series of experiments, encompassing kinetic analyses under various conditions [32]. To this end, the reversed-flow gas chromatography technique (R.F.G.C.), a sub-technique of inverse gas chromatography (IGC) [33], was employed to derive kinetic parameters related to activation energies and rate constants governing the alcoholic fermentation process. This versatile technique, which has found application in diverse studies, including the diffusion and mass transfer of gases over gas–gas and gas–liquid interfaces, the adsorption, desorption and deposition of air pollutants on solid surfaces, the exchange of air pollutants between atmospheric and aquatic environments, the interaction between aroma compounds and food ingredients and transformations in the surface-catalyzed reactions and evaporation of volatile compounds from water [34,35,36,37,38,39,40,41,42], is particularly suited for the kinetic scrutiny of alcoholic fermentation [43,44].
2. Materials and Methods
2.1. Materials
2.1.1. Yeast Strains
In this investigation, Saccharomyces cerevisiae yeast was employed in three distinct strains, namely the wild-type W303 (wt) and its genetically modified derivatives W_M4_533 and W_M4_558. The modification and isolation procedures for these strains were executed following established protocols [22,23].
All yeast strains were maintained in a liquid medium characterized by the following w/v composition: 2% glucose, 0.1% KH2PO4, 0.1% (NH4)2SO4, 0.5% MgSO4 7H2O and 0.4% yeast extract, diluted in triple distilled water. The pH value of the medium was equal to 5. The chemicals used were procured from Merck, Darmstadt, Germany, and the triple distilled water was sourced from laboratory production. To prevent microbiological contamination, the nutrient solution underwent sterilization for 15 min at a pressure of 1.5 atm and 130 °C. Subsequently, 10 μL of purified yeast was inoculated into a Falcon plastic tube containing 50 mL of the liquid medium. The Falcon tube was then placed in a mechanical incubator within a controlled chamber set at 30 °C for 12 h, with continuous stirring at 200 rpm [45].
2.1.2. Dried Fig Syrup
Dried figs were procured from the local market and subjected to syrup extraction via the hot method. The dried figs underwent segmentation into smaller pieces, enclosed in permeable cloth packages of 1 kg each. These packages were immersed in 1 L of water at 40 °C and left undisturbed for 24 h to facilitate the extraction of hydrocarbons, specifically sucrose and fructose. The liquid’s density in Baume (°Be) was subsequently gauged. If the measured density fell below the targeted value of 12.5 °Be, compression of the packages ensued, and the beaker was reheated to augment extraction efficiency. Upon completion of the extraction process, the liquid underwent filtration and sterilization at a pressure of 1.5 atm and 134 °C for 30 min in an autoclave (TLV-FA Series—RAYPA-Spain, Barcelona, Spain).
2.2. Apparatus and Procedure
2.2.1. Alcoholic Fermentation at a Laboratory Scale
The incubation protocol outlined in Section 2.1.1 was implemented for each yeast strain (W303, W_M4_588 and W_M4_533). For inoculation, 108 cells were utilized in volumetric flasks, each containing 200 mL of sterilized syrup extracted from figs. The fermenting flasks were then housed in a thermostat set to temperatures of 12, 18 and 25 °C. To investigate the kinetics of the alcoholic fermentation process, a 1 mL aliquot of the fermented syrup was introduced into a glass vessel, connected at the end of the diffusion column within the R.F.G.C. chromatograph.
2.2.2. Reversed-Flow Gas Chromatography Apparatus
The experimental configuration of R.F.G.C. technique is depicted in Figure 1. Two conventional gas chromatographs, Pye Unicam Series 104 (Cambridge, UK) and Shimadzu 8A (Kyoto, Japan) equipped with a flame ionization detector, were employed. A stainless-steel sample column, possessing an internal diameter of 4 mm and a total length of 2 m, devoid of any packing material, was connected to the diffusion column at the midpoint within the oven of the initial chromatograph. The sampling column was bifurcated into two identical sections, denoted as l and l′ (each 100 cm + 100 cm).
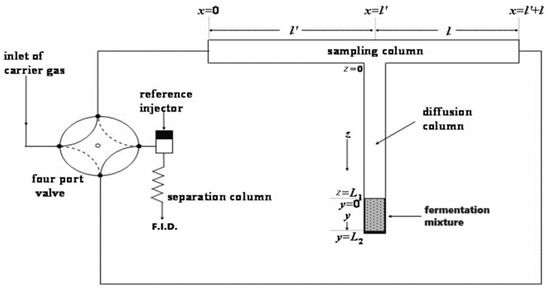
Figure 1.
Experimental configuration of reversed-flow gas chromatography (R.F.G.C.).
The diffusion column comprised two sections, labeled as z and y (refer to Figure 1). Section z extends for 45 cm and shares the same diameter as the sampling column, whereas section y is a glass vessel measuring 4 cm in length, also with the same diameter as the other columns.
To enable versatile control over carrier gas flow through the sampling and diffusion columns, constituting the “sampling cell”, the carrier gas input and detector were affixed to these columns. A four-port valve, connecting the ends x = 0 and x = l + l′ of the sampling column to the carrier gas supply and detector, facilitated the ability to alter the direction of carrier gas flow at will. The reversal was sustained for a duration of 6 s before returning to its initial direction. This reversal was shorter than the gas hold-up time in the sampling column and led to the creation of narrow and fairly symmetrical chromatographic peaks over the continuous elution curve. These extra chromatographic peaks, called “sample peaks”, and their heights H are measured as a function of the time t0 when the reversal occurs. The height is proportional to the concentration c of the ethanol at the junction point z = 0 and x = l′ of the sampling column (Figure 1).
More details and analytical description of the experimental procedure, as well as the mathematical analysis, are given in the literature [46].
The operational temperature of the sampling cell was maintained at 80 °C. Additionally, to discern the ethanol eluted fraction from potential volatile by-products in the fermented sample, an analytical column was introduced before the detector. This column (2 m × 1/4 in I.D. × 2 mm thick glass) was packed with 5% Carbowax-20 M and 80/120 mesh Carbopack BAW and maintained at 110 °C in the oven of the second gas chromatograph, equipped with the F.I.D. as illustrated in Figure 1.
For detector operation, high-purity hydrogen (99.999%) was sourced from Aeroscopio S.A. (Athens, Greece), and atmospheric air was supplied through a compressor apparatus. The detector’s operational temperature was set at 150 °C.
Helium served as the carrier gas in all experiments, maintaining a constant flow rate of 0.5 cm3 s−1 with a 1.6 atm pressure drop across the sampling cell. The helium used, obtained from Aeroscopio S.A. (Athens, Greece), was of 99.999% purity.
3. Theory
A typical segment of a chromatogram, as depicted in Figure 2, illustrates sample peaks corresponding to ethanol obtained from the alcoholic fermentation of dried fig syrup (12.5 °Be) at 18 °C, featuring the involvement of a wild type of S. cerevisiae.
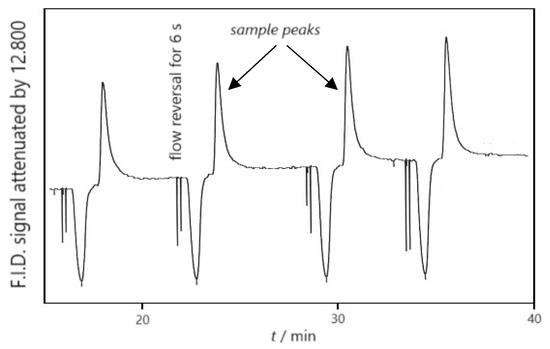
Figure 2.
Reversed-flow gas chromatograph showing sample peaks of ethanol at 291.15 K.
The observed sample peaks’ height, denoted as H, pertinent to the concentration of the ethanol, c, near the intersection of the sample column and the diffusion column (x = l′), at the time of each flow perturbation (t0), is approximated by
where c (l′, t0) is the solute concentration at x = l′ and time t0.
The gaseous substance that comes out from a liquid phase, which is positioned near the bottom of the diffusion column, is transported until the point x = l′ of the sampling column. The only procedure of this mass transport is the diffusion phenomenon and is described by Fick’s second law:
Utilizing Fick’s second law and solving this equation under the defined initial condition c(z, 0) = 0, the boundary conditions in the diffusion column at z = 0, c(0, t0) = c(l, t0) and –D(c/z)z = 0 = uc(l, t0) and the boundary conditions at z = L, D(c/z)z = L = kc(c0 − ), the expression of the substance concentration at the junction point of the diffusion and the sample column at various times is derived [47].
where c0 is the concentration of the substance at the gas–liquid interphase in equilibrium with the bulk liquid phase, is the concentration of the substance at the boundary layer of the gas–liquid interphase in equilibrium with c0, kc is the mass transfer coefficient for the evaporation process, D is the diffusion coefficient of the substance into the carrier gas, υ is the linear velocity of the carrier gas, and L is the length of the diffusion column in the R.F.G.C. system.
The combination of Equations (1) and (3) yields
Equation (4) predicts the elution curve’s form. Moreover, an infinity value of Hmax can be deduced for extended time periods [37]:
Here, Hmax signifies the sample peak height at the plateau region of the elution curve. Notably, this expression indicates that peak height is inversely proportional to the concentration of the substance at the gas–liquid interphase, a quantity analogous to the substance’s bulk concentration.
The measured values of Hmax can be utilized in a suitable mathematical expression for the kinetic phenomenon under investigation. For alcoholic fermentation, a first-order reaction rate expression aligns well with experimental results. The modified model, incorporating experimental peak height values, is expressed as follows [48]:
Here, Hmax∞ denotes the sample peak value when the fermentation process concludes at extended times, and k represents the rate constant for the first-order alcohol-producing reaction.
4. Results and Discussion
4.1. Ethanol Production Ability
To assess the efficiency of alcoholic fermentation for each strain (W303 wild type, W_M4_558, W_M4_533), samples collected at various time points during the fermentation process were subjected to analysis using R.F.G.C. The peak height, denoted as H, was extracted from the recorded chromatograms, as it has been established that H linearly corresponds to the ethanol concentration c [48]. Specifically, H represents the distance from the baseline to the maximum height at the conclusion of the R.F.G.C. experiment. The results were obtained after three repetitions at each temperature and for each yeast strain.
The graphical representation of H versus time at a fermentation temperature of 12 °C revealed that substituting the serine residue with alanine at position 533 of the Msn4p transcription factor, while not influencing ethanol production, results in a 3-fold reduction in the time required for completion compared to the wild-type strain. Moreover, substituting the serine residue with alanine at position 558 demonstrates a 2.5-fold decrease in the time required for completion compared to the wild-type strain (Figure 3A). This can be attributed to the fact that the genetic modifications of the wild type lead to more psychrophilic and alcoholic-resistant yeast strains.
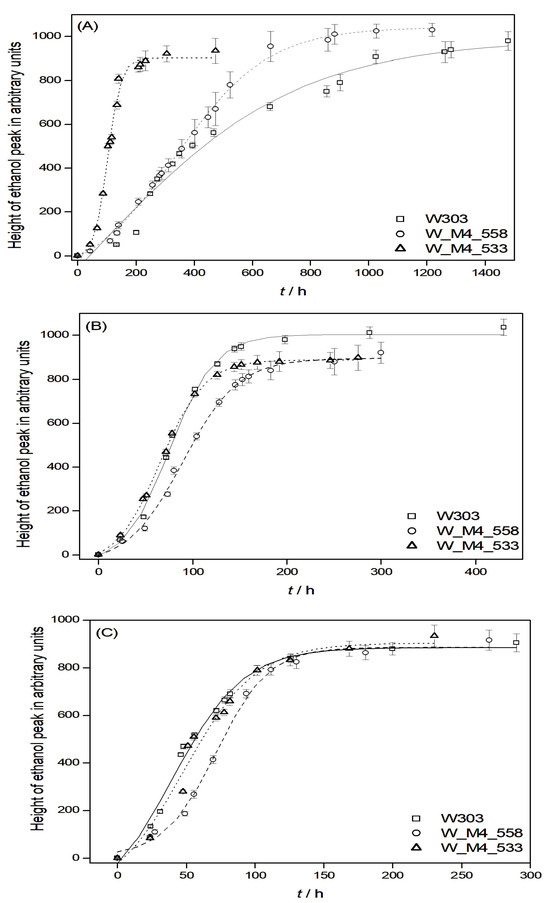
Figure 3.
Graphical representation of ethanol production, illustrating the relationship between the peak height (H) and time, accompanied by sigmoidal fitting curves for each strain. In each graph, the error bars after three replicates are also given. Alcoholic fermentation was conducted at (A) 12 °C, (B) 18 °C and (C) 25 °C.
At temperatures of 18 °C and 25 °C, both wild-type and genetically modified yeast strains exhibit a shorter duration for alcoholic fermentation compared to the time required at 12 °C, as anticipated [49]. Upon comparing genetically modified yeasts with the wild-type strain, it is discerned that, despite the genetically modified strains displaying a shorter fermentation duration than the wild type, these differences do not attain statistical significance (p < 0.05, one-way ANOVA) (Figure 3B,C).
The above findings do not entirely align with previously published results [50] regarding the use of the same genetically modified yeasts in fermenting grape must. While the outcomes for strain W_M4_533 exhibit similarities, there are notable discrepancies in comparison to the other modified strain W_M4_558.
4.2. Kinetic Analysis
Alcoholic fermentation is characterized by four distinct stages from the beginning to the end of the fermentations, and they correspond to the phases of the alcoholic fermentation processes. Sometimes, three distinct stages are observed as the absorption of one phase by its neighboring phase. The kinetic characteristics of each phase were calculated by plotting ln (H∞ − H) against t. Here, H∞ represents the peak height of the sample collected at the end of fermentation, and h corresponds to the peak height of each sample collected at time point t. Rate constants (k) were determined for each stage of the fermentation process. Representative plots for each strain at 18 °C are depicted in Figure 4, illustrating three distinct phases of alcoholic fermentation corresponding to the lag phase, log phase and stationary phase. These plots confirm that alcoholic fermentation can be modeled as a pseudo-first-order reaction.
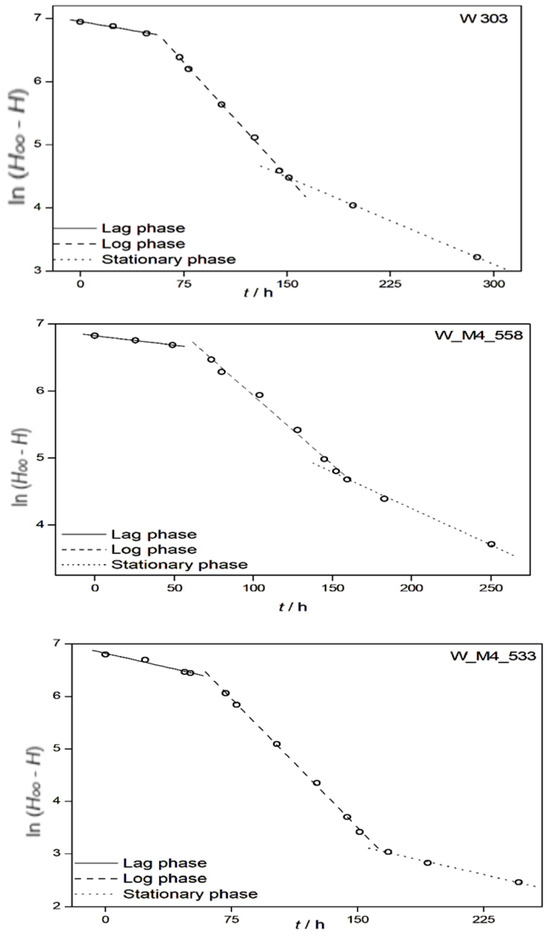
Figure 4.
Kinetic analysis of alcoholic fermentation. Representative plots depicting ln(H∞ − H) against time for fermentation at 18 °C elucidate three discernible phases of fermentation: lag, log and stationary. The slope of each line corresponds to the reaction rate constant (k).
Consequently, the slopes mentioned above correspond to the lag, log and stationary phases. These slopes were validated by r2 values ranging between 0.94 and 1.00. By considering the slopes of the aforementioned lines and remembering Equation (6), the rate constants of ethanol production, k, can be readily computed for the three phases observed during the alcoholic fermentations conducted with wild-type yeast strains as well as genetically modified strains at various temperatures. As the rate constants for ethanol production align with the phases of the alcoholic fermentation process, estimating the duration of each of these phases becomes straightforward. The results, presented in Table 1, represent mean values calculated after three replications for each system, along with their corresponding standard deviations.

Table 1.
Mean values of rate constants for ethanol production, k, with their corresponding standard deviations (σ) for the three fermentation phases for each of different yeast strains at different fermented temperatures.
In Table 1, the reaction rate constants (k) for each phase (lag, log and stationary) at various temperatures, along with their respective standard deviations are illustrated.
From the results presented in Table 1, one can derive the following insights:
- Throughout the fermentation process at 12 °C, the lag phase revealed an approximately 2-fold increase in the reaction rate constant for strain W_M4_558 and a more than 3-fold increment for W_M4_533, both in comparison to the wild-type strain. These disparities were found to be statistically significant (p < 0.05, one-way ANOVA). In the log phase, both genetically modified strains exhibited heightened reaction rate constants. Specifically, the Ser558Ala modification resulted in a statistically significant 1.5-fold increase in k (p < 0.05, one-way ANOVA), while the Ser533Ala modification proved notably more effective, yielding an almost 4-fold increase in the reaction rate constant (p = 0.05, one-way ANOVA). Moving to the stationary phase, both genetically modified strains demonstrated increased reaction rate constants compared to the wild type. W_M4_558 exhibited a 3.5-fold greater increase (p < 0.05, one-way ANOVA), and W_M4_533 showed a 2.5-fold increment (p < 0.05, one-way ANOVA). In summary, the Ser533Ala substitution conferred the strain with efficient fermentation capabilities at low temperatures. Furthermore, while the Ser558Ala substitution did not manifest increased fermentative ability during the log phase, it exhibited enhanced capability during the stationary phase, particularly in the presence of elevated ethanol levels in the medium, suggesting a potential ethanol-resistant phenotype at low temperatures.
- In the context of fermentation at 18 °C, there is an increment in the k value during the Lag phase for both genetically modified yeasts when compared to wild-type yeasts; however, these differences do not attain statistical significance at p < 0.05, one-way ANOVA. Conversely, during the subsequent log and stationary phases, the observed enhancements in the k constant values are statistically significant (p < 0.05, one-way ANOVA).
This observation may be ascribed to the assumption that genetic modification does not manifest a discernible impact on the rate of yeast adaptation to the fermentation environment at 18 °C—a condition intrinsically stressful for the yeasts. After that, the fermentation efficiency of the genetically modified yeasts appears to be significantly augmented owing to the specific genetic modifications implemented, as contrasted with the wild-type strains.
- Similar observations to those at 18 °C are drawn for fermentations at 25 °C regarding the behavior of the yeasts across the three phases of alcoholic fermentation. This further strengthens the conclusion that at elevated temperatures, genetic modifications impact the fermentation capacity by reducing fermentation time, while not affecting the duration of the yeasts’ adaptation to the fermentation medium.
- These observations align with the observed duration of alcoholic fermentation. As noted, the most significant impact of genetic modification was evident during fermentation at 12 °C, while the effects at 18 °C and 25 °C were not statistically significant.
- The findings presented in Table 1 exhibit a consistency in magnitude with previous research endeavors. In a study conducted by Ozilgen et al. [51], the rate constant for the lag phase was calculated to range between 0.024 h−1 (for fast fermentation) and 0.006 h−1 (for slow fermentation), while the rate constant for the stationary phase varied between 0.039 h−1 (for fast fermentation) and 0.042 h−1 (for slow fermentation). Additionally, Giovanelli et al. [52] reported a specific growth rate of S. cerevisiae amounting to 0.13 h−1 under aerobic conditions and 0.07 h−1 under anaerobic conditions.
Utilizing the Arrhenius equation, the activation energies (Eα) for various stages of alcoholic fermentation were determined:
Here, k represents the reaction rate constants of the alcoholic fermentation phases, A is the pre-exponential factor, Eα is the activation energy, R is the gas constant, and T is the temperature. Activation energies for each stage of the fermentation process were calculated from the slopes of the graphical representations using the determined values of rate constants for each stage of alcoholic fermentation. The results are illustrated in Table 2.
Table 2.
Activation energies Εα with their corresponding standard deviation (σ) for each phase of alcoholic fermentation for each yeast strain, computed from Arrhenius equation plots.
It appears that the results presented in Table 2 align with previously drawn conclusions. Specifically, the activation energy during the lag phase for the wild-type yeast strain is nearly double that of the activation energies observed for the W_M4_533 genetically modified strain. Additionally, the activation energy for the wild-type strain during the lag phase is approximately half as large as the activation energy for the W_M4_558 modified strain.
The lag phase is crucial as it characterizes the adaptation of yeast strains to the fermented media. Notably, the genetically modified strains (W_M4_533 and W_M4_558) exhibit smaller activation energies during the lag phase compared to the wild-type strain. This suggests that the genetic modifications have an impact on the yeast strains’ ability to adapt to the fermented media during this phase.
Moreover, in the two additional phases under consideration, the genetically modified strains exhibit diminished activation energies in comparison to the wild-type strain. This implies that the genetic modifications have a consistent effect of reducing activation energies in these phases, indicating potential improvements or alterations in the metabolic processes of the modified strains.
5. Conclusions—Featured Applications
The fermentation process was meticulously monitored utilizing the reversed-flow gas chromatography technique, enabling the assessment of different yeast strains’ proficiency in fermenting fig syrup. Beyond physicochemical quantities related to alcohol production, this technique facilitated the estimation of various phases within the yeast life cycle.
Although conventional gas chromatography with a flame ionization detector or mass spectrometry detection has been widely employed for quantifying ethanol concentration and by-products in fermentation processes, reversed-flow gas chromatography emerges as a viable alternative. Reversed-flow gas chromatography proves effective not only in determining ethanol concentration but also in assessing physicochemical parameters associated with the kinetics of each phase in alcoholic fermentation. This suggests that the application of reversed-flow gas chromatography allows for a more in-depth analysis, possibly capturing nuances and details that go beyond traditional concentration measurements. The information gathered through reversed-flow gas chromatography appears to be particularly relevant for assessing the efficiency of fermentation, especially in the context of genetically modified yeast strains.
Regarding the substitution of a serine residue with alanine at position 533 (strain W_M4_533), it is suggested that this particular serine residue potentially inhibits the fermentation ability of S. cerevisiae at various temperatures. Interestingly, this substitution conferred an enhanced fermentation ability at lower temperatures, significantly reducing the total fermentation time without compromising alcohol synthesis efficiency. The Ser558Ala substitution (strain W_M4_558) also contributed to a reduced fermentation time, albeit to a lesser extent, gaining efficiency in the latter half of the fermentation process.
In order to confirm the observed behaviors and draw robust conclusions about the effects of genetic modifications on fermentation efficiency, it would be advisable to conduct fermentations in various fermentation media. An in-depth kinetic analysis of each fermentation phase revealed that the W_M4_533 strain exhibited superior performance during the lag and log phases at lower temperatures, indicative of a psychrophilic phenotype. Conversely, the W_M4_558 strain demonstrated enhanced fermentation efficiency during the stationary phase at lower temperatures, hinting at a potential ethanol-resistant phenotype.
The present investigation affirmed the efficacy of reversed-flow gas chromatography as a method for analyzing the kinetic aspects of alcoholic fermentation. Furthermore, it demonstrated that genetic modifications can yield strains capable of completing fermentation in reduced durations and/or at diminished temperatures. This finding holds significant implications for both ethanol-producing facilities and establishments engaged in the production of alcoholic beverages.
Assessing the impact of genetically modified yeasts on the quality characteristics of the produced beverages requires a comprehensive analysis that goes beyond concentration measurements and fermentation efficiency. To draw meaningful conclusions, parameters such as aroma and taste profile, by-product production, consistency and reproducibility, microbial stability, etc., should be determined, in order for the final product to meet the regulatory standards for alcoholic beverages.
Author Contributions
Conceptualization, A.K.; methodology, A.K. and D.S.; software, K.K. and D.S.; validation, A.K. and D.S.; formal analysis, K.K. and D.S.; investigation, K.K.; resources, A.K.; data curation, A.K.; writing—original draft preparation, K.K. and D.S.; writing—review and editing, A.K.; visualization, K.K., D.S. and A.K.; supervision, A.K.; project administration, A.K. All authors have read and agreed to the published version of the manuscript.
Funding
This research received no external funding.
Institutional Review Board Statement
Not applicable.
Informed Consent Statement
Not applicable.
Data Availability Statement
The raw data supporting the conclusions of this article will be made available by the authors on request.
Acknowledgments
The authors wish to extend their acknowledgment to S.S. Vamvaka for providing the genetically modified yeast strains.
Conflicts of Interest
The authors declare no conflicts of interest.
References
- Wainaina, S.; Sárvári Horváth, I.; Taherzadeh, J.M. Biochemicals from food waste and recalcitrant biomass via syngas fermentation: A review. Bioresour. Technol. 2018, 248, 113–121. [Google Scholar] [CrossRef]
- Qureshi, N.; Lin, X.; Tao, S.; Liu, S.; Huang, H.; Nichols, N.N. Can Xylose Be Fermented to Biofuel Butanol in Continuous Long-Term Reactors: If Not, What Options Are There? Energies 2023, 16, 4945. [Google Scholar] [CrossRef]
- Wu, X.; Fang, G.; Tong, Y.; Jiang, D.; Liang, Z.; Leng, W.; Liu, L.; Tu, P.; Wang, H.; Ni, J.; et al. Catalytic Upgrading of Ethanol to n-Butanol: Progress in Catalyst Development. Chem. Sus. Chem. 2018, 11, 71–85. [Google Scholar] [CrossRef] [PubMed]
- Suiker, I.M.; Wösten, H.A.B. Spoilage yeasts in beer and beer products. Curr. Opin. Food Sci. 2022, 44, 100815. [Google Scholar] [CrossRef]
- Gschaedler, A.; Iñiguez-Muñoz, L.E.; Flores-Flores, N.Y.; Kirchmayr, M.; Arellano-Plaza, M. Use of non-Saccharomyces yeasts in cider fermentation: Importance of the nutrients addition to obtain an efficient fermentation. Int. J. Food Microbiol. 2021, 347, 109169. [Google Scholar] [CrossRef] [PubMed]
- Veloso, I.I.K.; Rodrigues, K.C.S.; Batista, G.; Cruz, A.J.G.; Badino, A.C. Mathematical Modeling of Fed-Batch Ethanol Fermentation Under Very High Gravity and High Cell Density at Different Temperatures. Appl. Biochem. Biotechnol. 2022, 194, 2632–2649. [Google Scholar] [CrossRef]
- Walker, G.M.; Basso, T.O. Mitigating stress in industrial yeasts. Fungal Biol. 2020, 124, 387–397. [Google Scholar] [CrossRef]
- Freitas, J.V.; Farinas, C.S. Sugarcane Bagasse Fly Ash as a No-Cost Adsorbent for Removal of Phenolic Inhibitors and Improvement of Biomass Saccharification. ACS Sustain. Chem. Eng. 2017, 5, 11727–11736. [Google Scholar] [CrossRef]
- Adebo, J.A.; Njobeh, P.B.; Gbashi, S.; Oyedeji, A.B.; Ogundele, O.M.; Oyeyinka, S.A.; Adebo, O.A. Fermentation of Cereals and Legumes: Impact on Nutritional Constituents and Nutrient Bioavailability. Fermentation 2022, 8, 63. [Google Scholar] [CrossRef]
- Chua, J.Y.; Liu, S.Q. Effect of single amino acid addition on growth kinetics and flavor modulation by Torulaspora delbrueckii in soy (tofu) whey alcoholic beverage fermentation. Food Res. Int. 2020, 135, 109283. [Google Scholar] [CrossRef]
- Maicas, S.; Mateo, J.J. The Life of Saccharomyces and Non-Saccharomyces Yeasts in Drinking Wine. Microorganisms 2023, 11, 1178. [Google Scholar] [CrossRef] [PubMed]
- Chen, Y.; Yang, Y.; Cai, W.; Zeng, J.; Liu, N.; Wan, Y.; Fu, G. Research progress of anti-environmental factor stress mechanism and anti-stress tolerance way of Saccharomyces cerevisiae during the brewing process. Crit. Rev. Food Sci. Nutr. 2023, 63, 12308–12323. [Google Scholar] [CrossRef] [PubMed]
- Kyriakou, M.; Christodoulou, M.; Ioannou, A.; Fotopoulos, V.; Koutinas, M. Improvement of stress multi-tolerance and bioethanol production by Saccharomyces cerevisiae immobilised on biochar: Monitoring transcription from defence-related genes. Biochem. Eng. J. 2023, 195, 108914. [Google Scholar] [CrossRef]
- Sahana, G.R.; Balasubramanian, B.; Joseph, K.S.; Pappuswamy, M.; Liu, W.-C.; Meyyazhagan, A.; Kamyab, H.; Chelliapan, S.; Joseph, B.V. A review on ethanol tolerance mechanisms in yeast: Current knowledge in biotechnological applications and future directions. Process. Biochem. 2024, 138, 1–13. [Google Scholar] [CrossRef]
- Tondini, F.; Onetto, C.A.; Jiranek, V. Early adaptation strategies of Saccharomyces cerevisiae and Torulaspora delbrueckii to co-inoculation in high sugar grape must-like media. Food Microbiol. 2020, 90, 103463. [Google Scholar] [CrossRef] [PubMed]
- Giannattasio, S.; Guaragnella, N.; Ždralević, M.; Marra, E. Molecular mechanisms of Saccharomyces cerevisiae stress adaptation and programmed cell death in response to acetic acid. Front. Microbiol. 2013, 4, 33. [Google Scholar] [CrossRef] [PubMed]
- Baptista, S.L.; Costa, C.E.; Cunha, J.T.; Soares, P.O.; Domingues, L. Metabolic engineering of Saccharomyces cerevisiae for the production of top value chemicals from biorefinery carbohydrates. Biotechnol. Adv. 2021, 47, 107697. [Google Scholar] [CrossRef] [PubMed]
- Hu, M.; Dinh, H.V.; Shen, Y.; Suthers, P.F.; Foster, C.J.; Call, C.M.; Ye, X.; Pratas, J.; Fatma, Z.; Zhao, H.; et al. Comparative study of two Saccharomyces cerevisiae strains with kinetic models at genome-scale. Metab. Eng. 2023, 76, 1–17. [Google Scholar] [CrossRef]
- Lainioti, G.C.; Karaiskakis, G. New approaches to the kinetic study of alcoholic fermentation by chromatographic techniques. J. Chromatogr. Sci. 2013, 51, 764–779. [Google Scholar] [CrossRef]
- Gonzalez, R.; Morales, P. Truth in wine yeast. Microb. Biotechnol. 2021, 15, 1339–1356. [Google Scholar] [CrossRef]
- Lainioti, G.; Kapolos, J.; Koliadima, A.; Karaiskakis, G. Comparative study of the kinetic approach on the alcoholic fermentation procedure conducted in laboratory and scale-up systems by inverse gas chromatography. Acta Chromatogr. 2014, 26, 371–389. [Google Scholar] [CrossRef]
- Vamvakas, S.S.; Kapolos, J.; Farmakis, L.; Genneos, F.; Damianaki, M.E.; Chouli, X.; Vardakou, A.; Liosi, S.; Stavropoulou, E.; Leivaditi, E.; et al. Specific serine residues of Msn2/4 are responsible for regulation of alcohol fermentation rates and ethanol resistance. Biotechnol. Prog. 2019, 35, e2759. [Google Scholar] [CrossRef]
- Vamvakas, S.S.; Kapolos, J.; Farmakis, L.; Koskorellou, G.; Genneos, F. Ser625 of msn2 transcription factor is indispensable for ethanol tolerance and alcoholic fermentation process. Biotechnol. Prog. 2019, 35, e2837. [Google Scholar] [CrossRef] [PubMed]
- Kedar, P.G.; Wagh, S.T.; Konale, R.A.; Patil, N.K.; Ingle, S.T. Cluster Fig (Ficus racemosa Linn): A sustainable renewable source for Bioethanol Production by Fermentation. Res. J. Chem. Environ. 2022, 26, 70–74. [Google Scholar] [CrossRef]
- Shahinuzzaman, M.; Yaakob, Z.; Anuar, F.H.; Akhtar, P.; Kadir, N.H.A.; Hasan, A.K.M.; Sobayel, K.; Nour, M.; Sindi, H.; Amin, N.; et al. In vitro antioxidant activity of Ficus carica L. latex from 18 different cultivars. Sci. Rep. 2020, 10, 10852. [Google Scholar] [CrossRef]
- Aljane, F.; Neily, M.H.; Msaddak, A. Phytochemical characteristics and antioxidant activity of several fig (Ficus carica L.) ecotypes. Ital. J. Food Sci. 2020, 32, 755–768. [Google Scholar] [CrossRef]
- Khadhraoui, M.; Bagues, M.; Artés, F.; Ferchichi, A. Phytochemical content, antioxidant potential, and fatty acid composition of dried Tunisian fig (Ficus carica L.) cultivars. J. Appl. Bot. Food Qual. 2019, 92, 143–150. [Google Scholar] [CrossRef]
- López-Cárdenas, F.; Ochoa-Reyes, E.; Baeza-Jiménez, R.; Tafolla-Arellano, J.C.; Ascacio-Valdés, J.A.; Buenrostro-Figueroa, J.J. Solid-State Fermentation as a Sustainable Tool for Extracting Phenolic Compounds from Cascalote Pods. Fermentation 2023, 9, 823. [Google Scholar] [CrossRef]
- Kadam, N.U.; Upadhye, A.A.; Ghosh, J.S. Fermentation and characterization of wine from dried Ficus carica (L) using Saccharomyces cerevisiae NCIM 3282. Int. Food Res. J. 2021, 18, 1569–1571. [Google Scholar]
- Barolo, M.I.; Ruiz Mostacero, N.; López, S.N. Ficus carica L. (Moraceae): An ancient source of food and health. Food Chem. 2014, 164, 119–127. [Google Scholar] [CrossRef]
- Wang, C.; Liu, L.; Guo, J.; Xu, H.; Lei, H. Phenolic profiles, antioxidant capacities and flavour volatiles in fig (Ficus carica L.) juices from five cultivars fermented by Lactobacillus plantarum and Lactobacillus acidophilus. Int. J. Food Sci. Technol. 2023, 58, 6025–6035. [Google Scholar] [CrossRef]
- Miller, K.V.; Block, D.E. A review of wine fermentation process modeling. J. Food Eng. 2020, 273, 109783. [Google Scholar] [CrossRef]
- Katsanos, N.A.; Georgiadou, I. Reversed flow gas chromatography for studying heterogeneous catalysis. J. Chem. Soc. Chem. Commun. 1980, 5, 242–243. [Google Scholar] [CrossRef]
- Karaiskakis, G.; Gavril, D. Determination of diffusion coefficients by gas chromatography. J. Chromatogr. A 2004, 1037, 147–189. [Google Scholar] [CrossRef] [PubMed]
- Katsanos, N.A.; Kapolos, J. Diffusion coefficients of gases in liquids and partition coefficients in gas-liquid interphases by reversed-flow gas chromatography. Anal. Chem. 1989, 61, 2231–2237. [Google Scholar] [CrossRef]
- Farmakis, L.; Koliadima, A.; Karaiskakis, G.; Kapolos, J. Reversed-Flow Gas Chromatography as a Tool for Studying the Interaction between Aroma Compounds and Starch. J. Agric. Food Chem. 2018, 66, 12111–12121. [Google Scholar] [CrossRef]
- Sevastos, D.; Kotsalos, E.; Koliadima, A. The reversed–flow gas chromatography technique as a tool for the study of the evaporation retardation of SO2 and (CH3)2S from water by soluble surfactants. Sci. Total. Environ. 2017, 578, 290–296. [Google Scholar] [CrossRef]
- Sevastos, D.; Koliadima, A. Influence of temperature and pH on the Transfer of SO2 from water to air by inverse gas chromatography. Water Air Soil Pollut. 2014, 225, 1901. [Google Scholar] [CrossRef]
- Katsanos, N.A.; Roubani-Kalantzopoulou, F.; Iliopoulou, E.; Bassiotis, I.; Siokos, V.; Vrahatis, M.N.; Plagianakos, V.P. Lateral molecular interaction on heterogeneous surfaces experimentally measured. Colloids Surf. A Physicochem. Eng. Asp. 2002, 201, 173–180. [Google Scholar] [CrossRef]
- Katsanos, N.A.; Gavril, D.; Kapolos, J.; Karaiskakis, G. Surface energy of solid catalysts measured by inverse gas chromatography. J. Colloid Interface Sci. 2004, 270, 455–461. [Google Scholar] [CrossRef]
- Margariti, S.; Katsanos, N.A.; Roubani-Kalantzopoulou, F. Time distribution of surface energy on heterogeneous surfaces by inverse gas chromatography. Colloids Surf. A Physicochem. Eng. Asp. 2003, 226, 55–67. [Google Scholar] [CrossRef]
- Gavril, D. Surface studies by reversed-flow inverse gas chromatography: A review. Catal. Today 2010, 154, 149–159. [Google Scholar] [CrossRef]
- Lainioti, G.C.; Kapolos, J.; Farmakis, L.; Koliadima, A.; Karaiskakis, G. Kinetic study of the alcoholic fermentation process, in the presence of free and immobilized Saccharomyces cerevisiae cells, at different initial glucose concentrations by reversed flow GC. Chromatographia 2010, 72, 1149–1156. [Google Scholar] [CrossRef]
- Lainioti, G.C.; Kapolos, J.; Koliadima, A.; Karaiskakis, G. The study of the effect of fermentation temperature on the growth kinetics of Saccharomyces cerevisiae yeast strain, in the presence or absence of support, by chromatographic techniques. J. Liq. Chromatogr. Relat. Technol. 2011, 34, 195–208. [Google Scholar] [CrossRef]
- Izmirlioglu, G.; Demirci, A. Ethanol production from waste potato mash by using Saccharomyces Cerevisiae. Appl. Sci. 2012, 2, 738–753. [Google Scholar] [CrossRef]
- Katsanos, N.A. Flow Perturbation Gas Chromatography; Marcel Dekker: New York, NY, USA, 1988; p. 108. [Google Scholar]
- Katsanos, N.A.; Karaiskakis, G. Rate coefficients for evaporation of pure liquids and diffusion coefficients of vapors. J. Phys. Chem. 1984, 88, 3674–3678. [Google Scholar]
- Economopoulos, N.; Athanassopoulos, N.; Katsanos, N.A.; Karaiskakis, G.; Agathonos, P.; Vassilakos, C. A Plant Kinetic Study of Alcoholic Fermentation Using Reversed-Flow Gas Chromatography. Sep. Sci. Technol. 1992, 27, 2055–2070. [Google Scholar] [CrossRef]
- Liszkowska, W.; Berlowska, J. Yeast Fermentation at Low Temperatures: Adaptation to Changing Environmental Conditions and Formation of Volatile Compounds. Molecules 2021, 26, 1035. [Google Scholar] [CrossRef] [PubMed]
- Kassoumi, K.; Kousoulou, P.; Sevastos, D.; Vamvakas, S.S.; Papadimitriou, K.; Kapolos, J.; Koliadima, A. Fermentation Efficiency of Genetically Modified Yeasts in Grapes Must. Foods 2022, 11, 413. [Google Scholar] [CrossRef]
- Ozilgen, M.; Celik, M.; Bozoglu, T.F. Kinetics of spontaneous wine production. Enzym. Microb. Technol. 1991, 13, 252–256. [Google Scholar] [CrossRef]
- Giovanelli, G.; Peri, C.; Parravicini, E. Kinetics of grape juice fermentation under aerobic and anaerobic conditions. Am. J. Enol. Vitic. 1996, 47, 429–434. [Google Scholar] [CrossRef]
Disclaimer/Publisher’s Note: The statements, opinions and data contained in all publications are solely those of the individual author(s) and contributor(s) and not of MDPI and/or the editor(s). MDPI and/or the editor(s) disclaim responsibility for any injury to people or property resulting from any ideas, methods, instructions or products referred to in the content. |
© 2024 by the authors. Licensee MDPI, Basel, Switzerland. This article is an open access article distributed under the terms and conditions of the Creative Commons Attribution (CC BY) license (https://creativecommons.org/licenses/by/4.0/).