Article

A Practical Deep Learning Architecture for Large-Area Solid Wastes Monitoring Based on UAV Imagery

Research Center of Big Data Technology, Nanhu Laboratory, Jiaxing 314000, China
*
Author to whom correspondence should be addressed.
Appl. Sci. 2024, 14(5), 2084; https://doi.org/10.3390/app14052084
Submission received: 29 January 2024 / Revised: 26 February 2024 / Accepted: 29 February 2024 / Published: 1 March 2024
(This article belongs to the Special Issue Deep Learning in Satellite Remote Sensing Applications)

Abstract

:
The development of global urbanization has brought about a significant amount of solid waste. These untreated wastes may be dumped in any corner, causing serious pollution to the environment. Thus, it is necessary to accurately obtain their distribution locations and detailed edge information. In this study, a practical deep learning network for recognizing solid waste piles over extensive areas using unmanned aerial vehicle (UAV) imagery has been proposed and verified. Firstly, a high-resolution dataset serving to solid waste detection was created based on UAV aerial data. Then, a dual-branch solid waste semantic segmentation model was constructed to address the characteristics of the integration of solid waste distribution with the environment and the irregular edge morphology. The Context feature branch is responsible for extracting high-level semantic features, while the Spatial feature branch is designed to capture fine-grained spatial details. After information fusion, the model obtained more comprehensive feature representation and segmentation ability. The effectiveness of the improvement was verified through ablation experiments and compared with 13 commonly used semantic segmentation models, demonstrating the advantages of the method in solid waste segmentation tasks, with an overall accuracy of over 94%, and a recall rate of 88.6%—much better than the best performing baselines. Finally, a spatial distribution map of solid waste over Jiaxing district, China was generated by the model inference, which assisted the environmental protection department in completing environmental management. The proposed method provides a feasible approach for the accurately monitoring of solid waste, so as to provide policy support for environmental protection.

1. Introduction

With the continuous increase in global population and the accelerated process of urbanization, the amount of urban solid waste is also increasing [1,2]. Managing and handling these solid wastes has become a global challenge [3]. Due to the high cost of waste disposal and the drive for illegal profits, phenomena such as unauthorized dumping and littering of solid waste, as well as the establishment of abandoned disposal sites, are common [4,5]. Untreated solid waste, after being infiltrated by rainwater and undergoing decomposition, results in leachate and harmful chemicals entering the soil through surface runoff, which disrupts soil structure and causes pollution to nearby rivers and groundwater, leading to serious ecological impacts [6,7]. Therefore, it is essential to regulate and govern these illegal solid waste materials, as this work holds significant importance for the construction of urban ecological civilization and sustainable development. To conduct large-area solid-waste management, accurate acquisition of the distribution locations and rugged edge information is highly required, so as to provide policy support for estimating the workload and generating specific strategies for their treatment.
The previous approaches for monitoring solid waste dumps relied on manual inspections and video surveillance, both of which have many drawbacks [8]. These approaches have limited detection range and cannot comprehensively cover monitoring areas, especially in remote areas such as suburbs, mountains, riverbanks, and road edges [9,10]. Inasmuch, many scholars have applied remote sensing technology to relevant research, such as Gill et al. [11], who used thermal infrared remote sensing technology to measure land surface temperature (LST) and outline the most likely dumping areas within landfill sites. However, the sensitivity of temperature difference detection is low, and the LST changes in small garbage heaps are not significant. Other scholars have considered feature extraction approaches, such as Begur et al. [12], who proposed an edge-based intelligent mobile service system for detecting illegal dumping of solid waste. However, the accuracy of such algorithms depends on manually designed features, and although they perform well on some samples, they cannot be applied to large-area automated identification due to the complex and diverse structures and textures of garbage heaps. In addition, satellite imagery as a data source is prone to cloud cover, and the limitations of revisit periods restrict the application of related methods [13]. This paper utilizes unmanned aerial vehicle (UAV) to gather data, which have the characteristics of high resolution, wide monitoring range, and real-time capabilities [14,15]. Moreover, UAV can perform monitoring in hard-to-reach areas, providing a solid data foundation for extracting characteristic information of solid waste and identifying targets in various garbage scenarios [16,17].
In recent years, deep learning technology has gradually matured and is widely used in various complex scenarios due to its powerful feature learning and representation capabilities compared to conventional methods [18,19]. Some scholars have introduced it into the research field of garbage classification [20,21,22,23,24]. Current research mostly regards deep learning as three tasks: target detection [25,26], image classification [27,28,29], and weakly supervised segmentation [30,31]. For example, Yu et al. [32] proposed a street garbage detection algorithm based on remote sensing satellite SIFT feature image registration and fast regional convolutional neural networks. Shi et al. [29] proposed a waste classification method based on a multi-layer hybrid convolutional neural network, changing the number of network modules and channels to improve the model’s performance. Niu et al. [33] proposed a weakly supervised learning method that utilizes multi-scale dilated convolutional neural networks and Swin-Transformer to aggregate local and global features for rough extraction of solid waste boundaries. However, these methods cannot obtain the actual distribution edges of solid waste piles to achieve pixel-level classification, and are generally limited to small-scale areas or single scenarios [22,34,35]. Therefore, they are not suitable for monitoring and controlling large-area illegal solid waste that this study focuses on. Semantic segmentation can obtain detailed edges of segmented objects, but there is a problem of missing high-quality training images [23,24,30], and existing semantic segmentation models are mainly used in street scenes such as Cityscapes [36], CamVid [37], Mapillary Vistas [38], and BDD100K [39]. However, solid waste piles are of different scales, diverse types, varied shapes, and widely distributed, which greatly increase the difficulty of existing models to distinguish objects from backgrounds. It remains questionable whether existing models can be applied to the segmentation of large-area solid waste.
In summary, the semantic segmentation method for large-area solid waste piles is still in the development stage and requires further in-depth research. This paper conducts research in the Nanhu District of Jiaxing City. Compared with existing research, the contribution of this work can be summarized as follows:
(1)
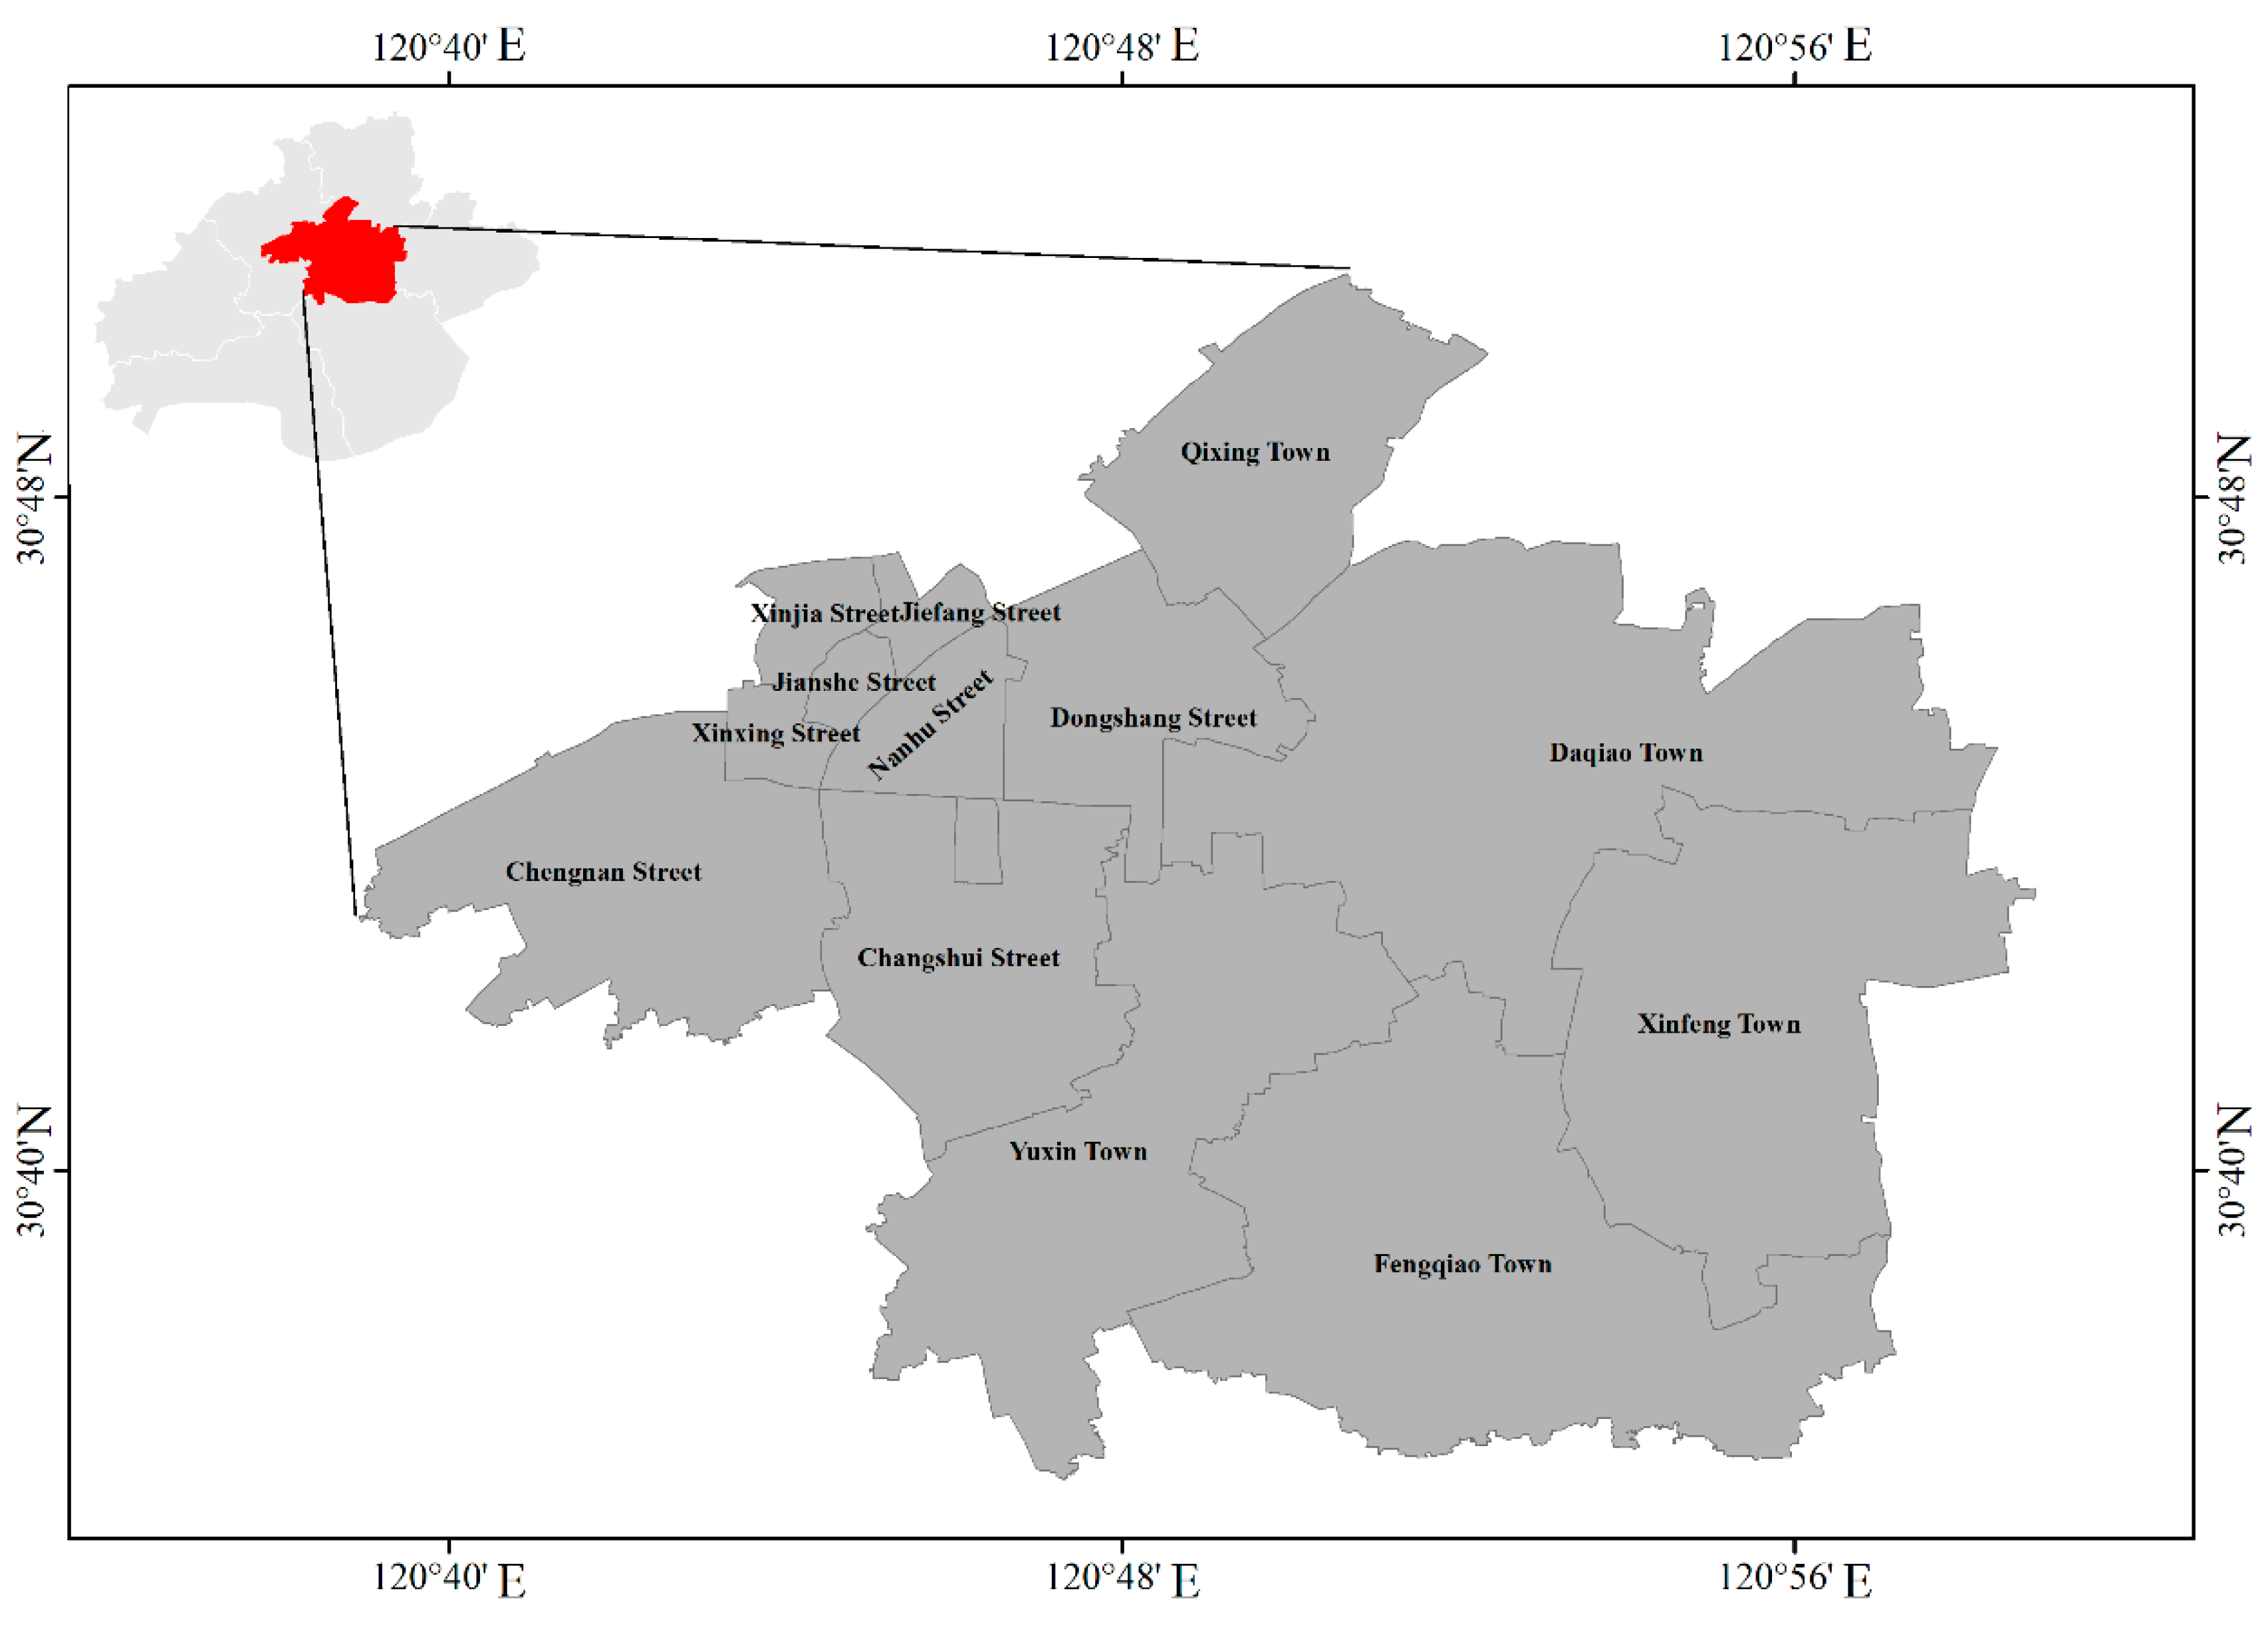
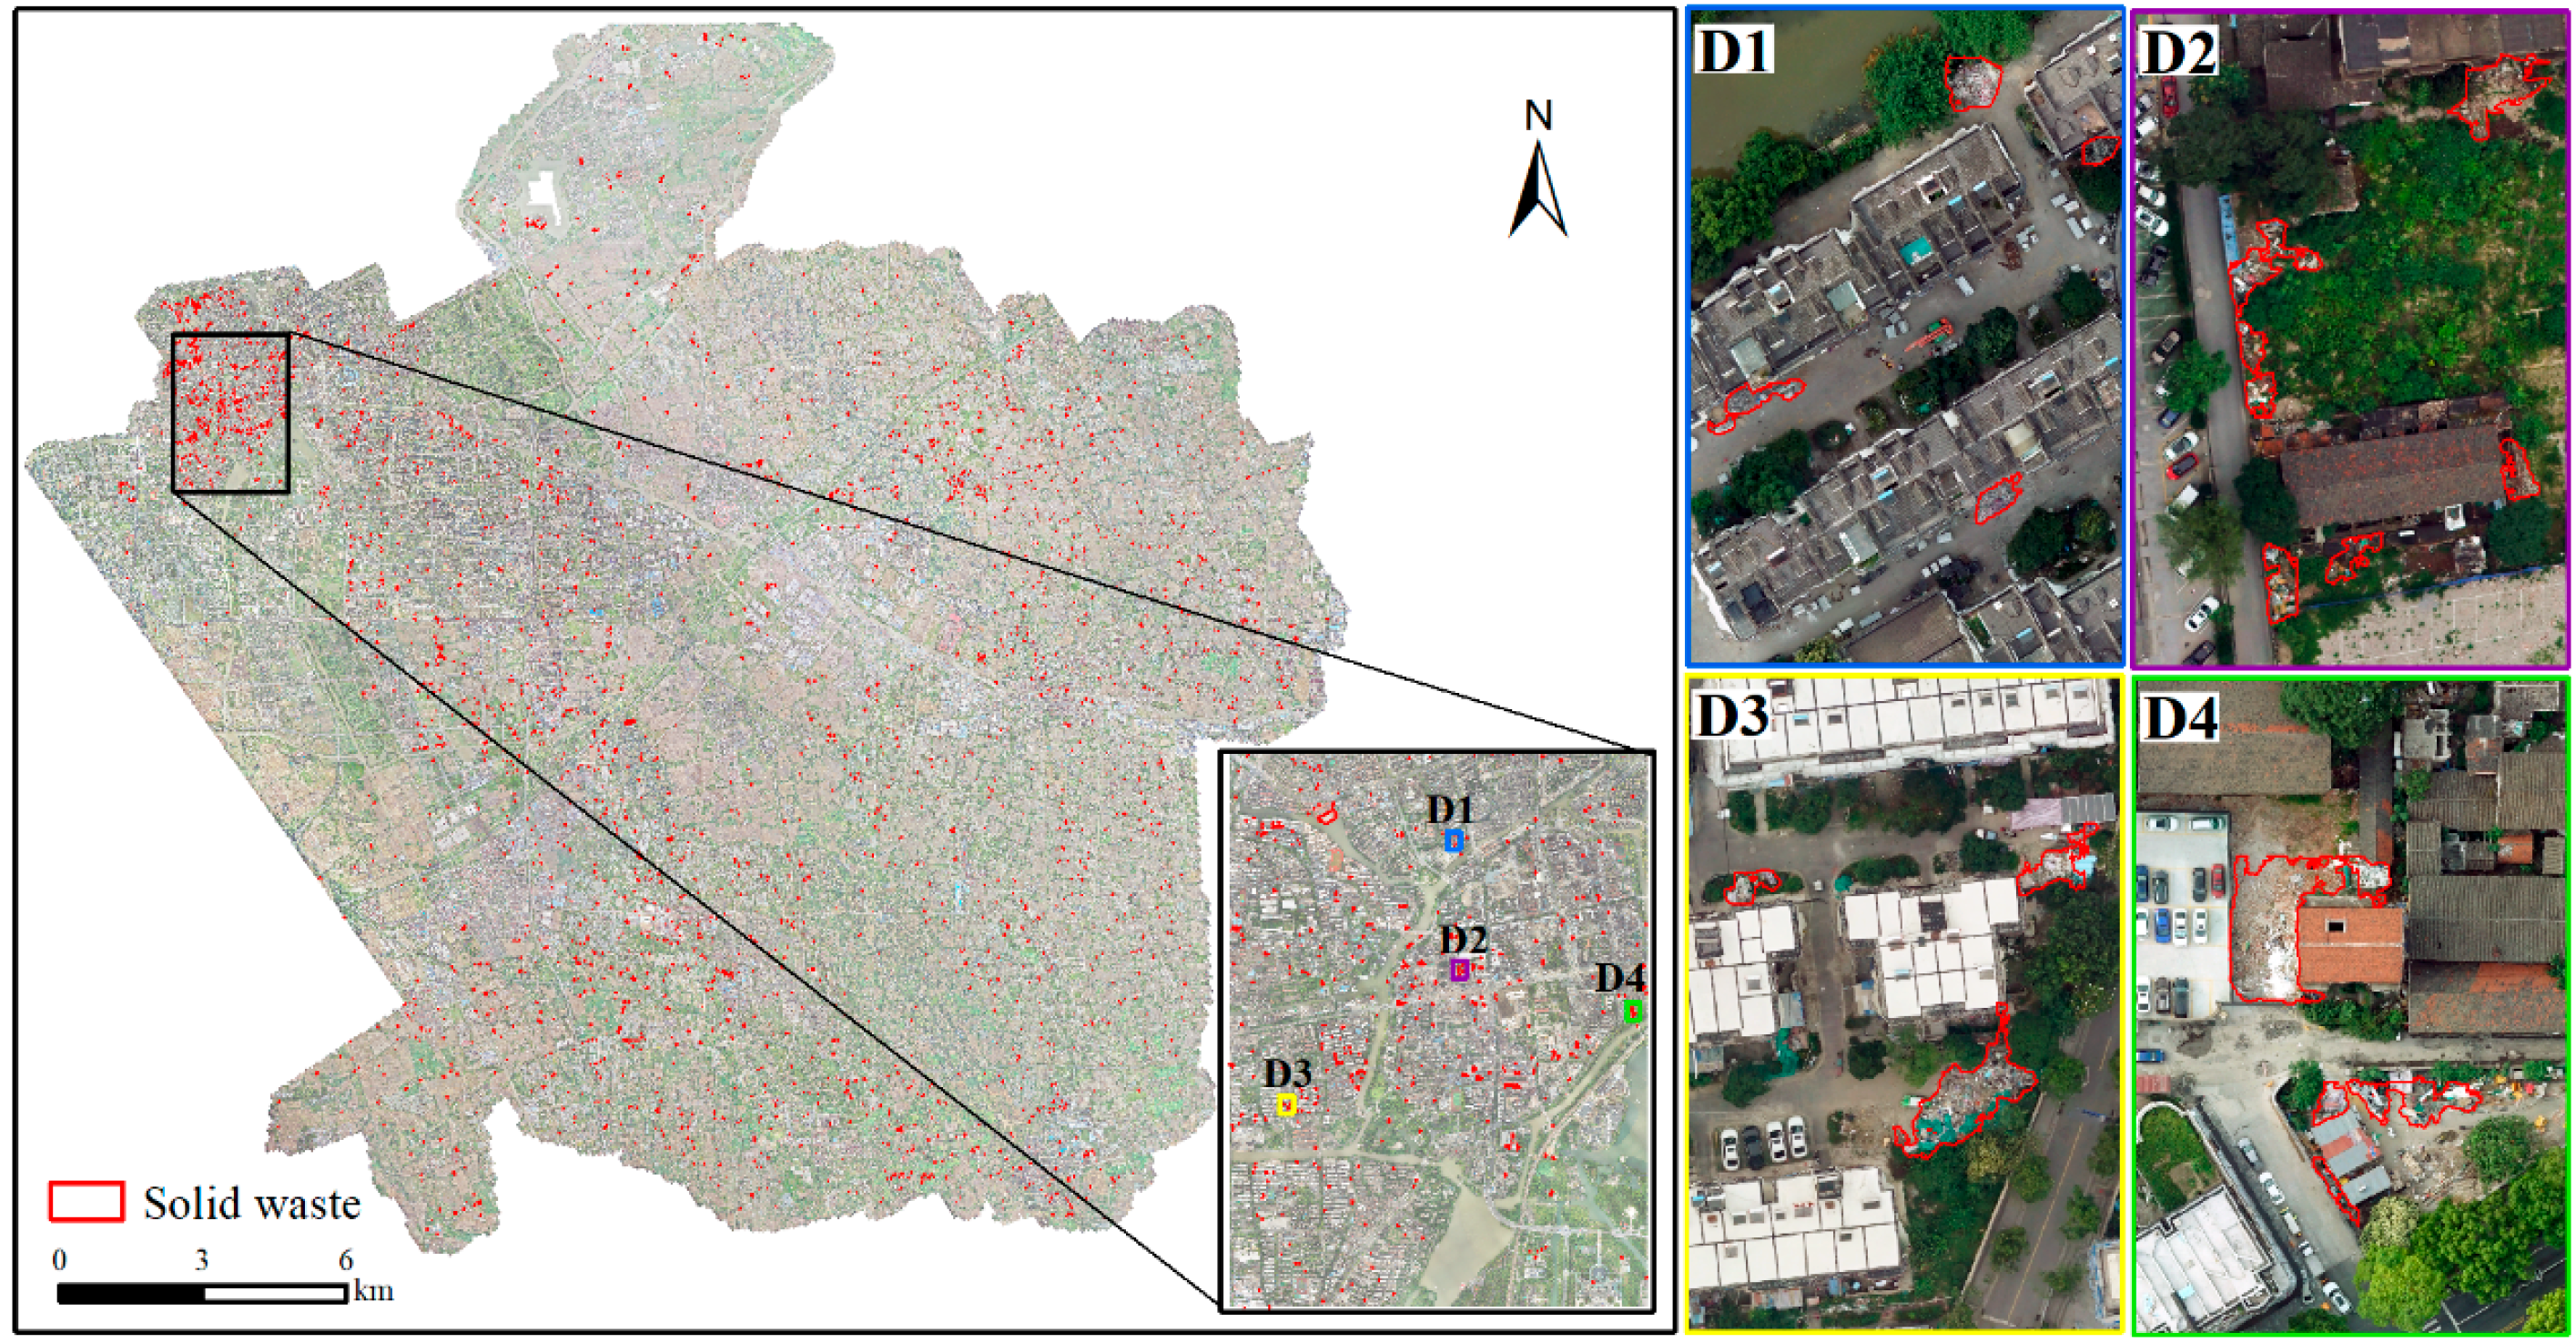
Approximately 450 km2 of high-resolution images of the Nanhu District in Jiaxing City and some neighboring areas were collected using drones, and a high-precision solid waste pile segmentation dataset with multi-scene distribution was created by pixel-wise labeling.
(2)
A dual-branch structured semantic segmentation model was proposed, which achieves a more comprehensive feature representation by fusing contextual feature branches and spatial feature branches. In comparison with other semantic segmentation methods, it achieves state-of-the-art performance in the high-resolution solid waste pile segmentation dataset, demonstrating excellent capability in segmenting complex edges of solid waste piles in multiple scenes.
(3)
This work provides new ideas for large-area and high-precision solid waste monitoring, effectively reducing the cost of manual inspection and supervision. It can provide scientific theoretical support for the ecological civilization construction and sustainable development of cities, and play an active role in protecting land resources and the ecological environment.

2. Study Area

Nanhu District, Jiaxing City, is located in the northern part of Hangjiahu Plain in Zhejiang Province. The central coordinates of its geographic location are 120°76′ E and 30°76′ N. It covers a total land area of 368.3 square km and includes 7 streets and 4 towns (Figure 1). The district has a permanent population of 560,000 people. With the development of the economy and its location within the Yangtze River Delta urban agglomeration, Nanhu District, acting as the economic, political, cultural, and commercial center of Jiaxing City, has undergone significant changes. As a result, with the rapid increase in construction and population, the issue of solid waste in the city has become increasingly apparent. There is an urgent need to develop high accuracy monitoring methods for solid waste, providing more intelligent technical means for environmental protection in this region.

3. Methods

3.1. Dataset

3.1.1. Data Acquisition

This study has constructed a high-resolution solid waste semantic segmentation dataset (RSD). The data source consists of aerial images of Nanhu District, Jiaxing City, captured by UAV in June 2021. After geometric correction and stitching, a total of 1210 GB of imagery was obtained, covering an area of approximately 450 km2, with a spatial resolution of 0.038 m. The UAV model used in this study is DJI Phantom 4 Pro, and the flight altitude is 90 m.

3.1.2. Data Labeling

The labeling work consists of two steps: preliminary sample area selection and pixel-by-pixel labeling. The former involves creating a mask through visual interpretation (without the need for precise boundaries) and then using the mask to clip the corresponding area of UAV images as the preliminary sample area. The latter involves detailed outlining of the edges of solid waste to create labeled data. All training dataset are from the preliminary sample area. The selection rules for the preliminary sample area can be summarized as follows:
(1)
Area Selection: Priority is given to identifying large, concentrated areas. In the sample area selection, garbage piles with an area of at least 1 square meter, as determined by expert judgment, and consisting of more than 900 pixels based on the spatial resolution, are considered. If there are objects of similar nature near a large garbage pile, they are also considered as garbage.
(2)
Covering Multiple Scene Types: Solid waste piles commonly found in daily life are widely distributed in various environments such as buildings, roads, grasslands, rivers, and forests. In order for the model in this study to possess the ability to recognize solid waste in multiple scene types, the sampling areas need to include various scene types.
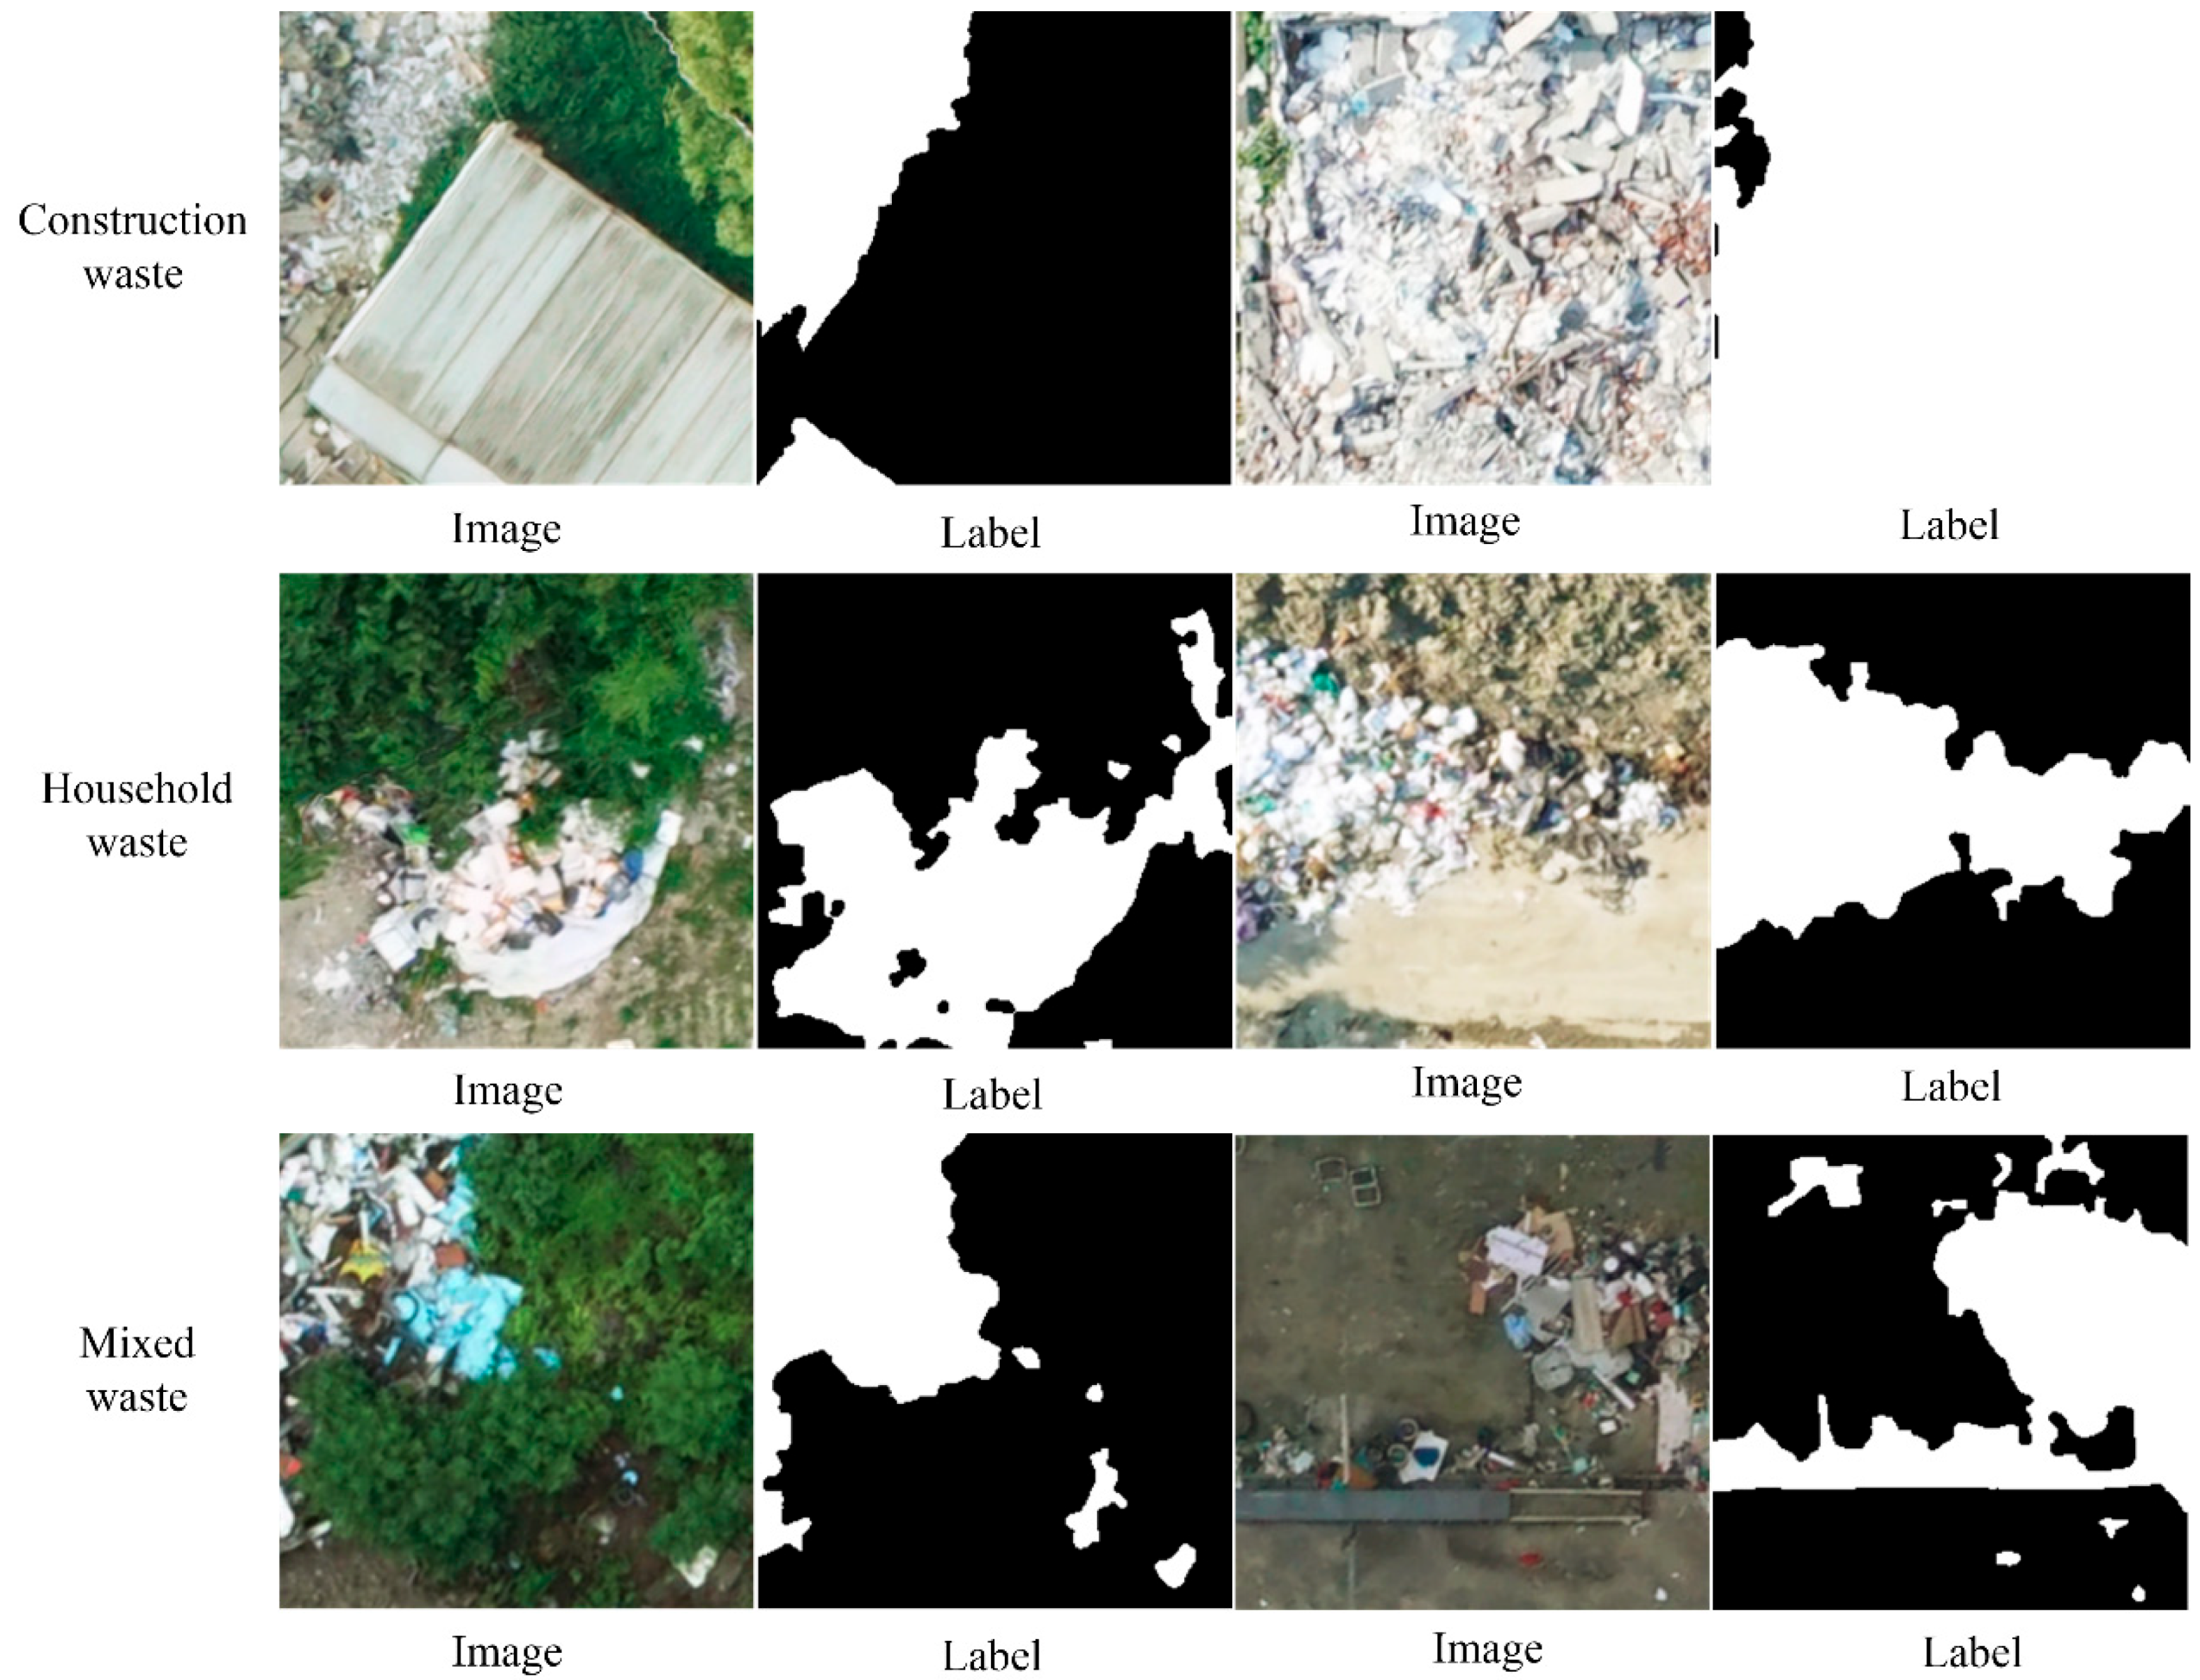
(3)
Balancing Garbage Category Proportions: Based on the overview of the entire image, garbage can be classified into three categories: construction waste, household waste, and mixed waste. Construction waste includes materials such as wood, bricks, and concrete generated during construction and demolition processes. Household waste includes garbage such as plastic, kitchen waste, and paper generated in daily life. Mixed waste refers to garbage that is a mixture of different sources and types. This study does not distinguish between different types of garbage, but when creating sampling areas, it is necessary to maintain a balance in the quantities of these three types to meet monitoring requirements.

3.1.3. Training Dataset

The images and labels are divided into synchronized image pairs according to the common deep learning pixel standard of 256 × 256 format. Then, the labels are filtered using histogram pixel value statistics to remove image pairs without solid waste. In this study, a total of 2600 image pairs were retained and named RSD. Figure 2 demonstrates that the distribution details of solid waste can be clearly represented. Additionally, during network training, the RSD dataset is randomly divided into three subsets based on quantity: RSD-Train (2000), RSD-Val (300), and RSD-Test (300), which are used for training, validation, and testing, respectively. Since the RSD dataset has not undergone any data augmentation operations and comes from different regions, the images in the three subsets do not overlap. The random classification ensures that the scales and distribution environment proportions of solid waste in the three subsets are relatively consistent.

3.2. Segmentation Model

This paper proposes a new semantic segmentation algorithm based on UAV imagery to construct a solid waste segmentation model (SWM). The model consists of a backbone, context feature branch, spatial feature branch, feature fusion module, and segmentation head (Figure 3). Firstly, the input image is encoded through multiple layers of operations by the backbone to 1/8 of the original scale, with a tensor shape of [128, 32, 32]. Then it is fed into a dual-branch structure, where the Context feature branch extracts global semantic features, and the features are down-sampled. In addition, the feature map scales of stage 1 and stage 2 are 1/16 and 1/32, respectively. The Spatial feature branch extracts spatial detail information without changing the feature map scale. The dual branches communicate through the fusion block to achieve information exchange and feature fusion. Finally, the segmentation head produces the output, which represents the segmented solid waste result.

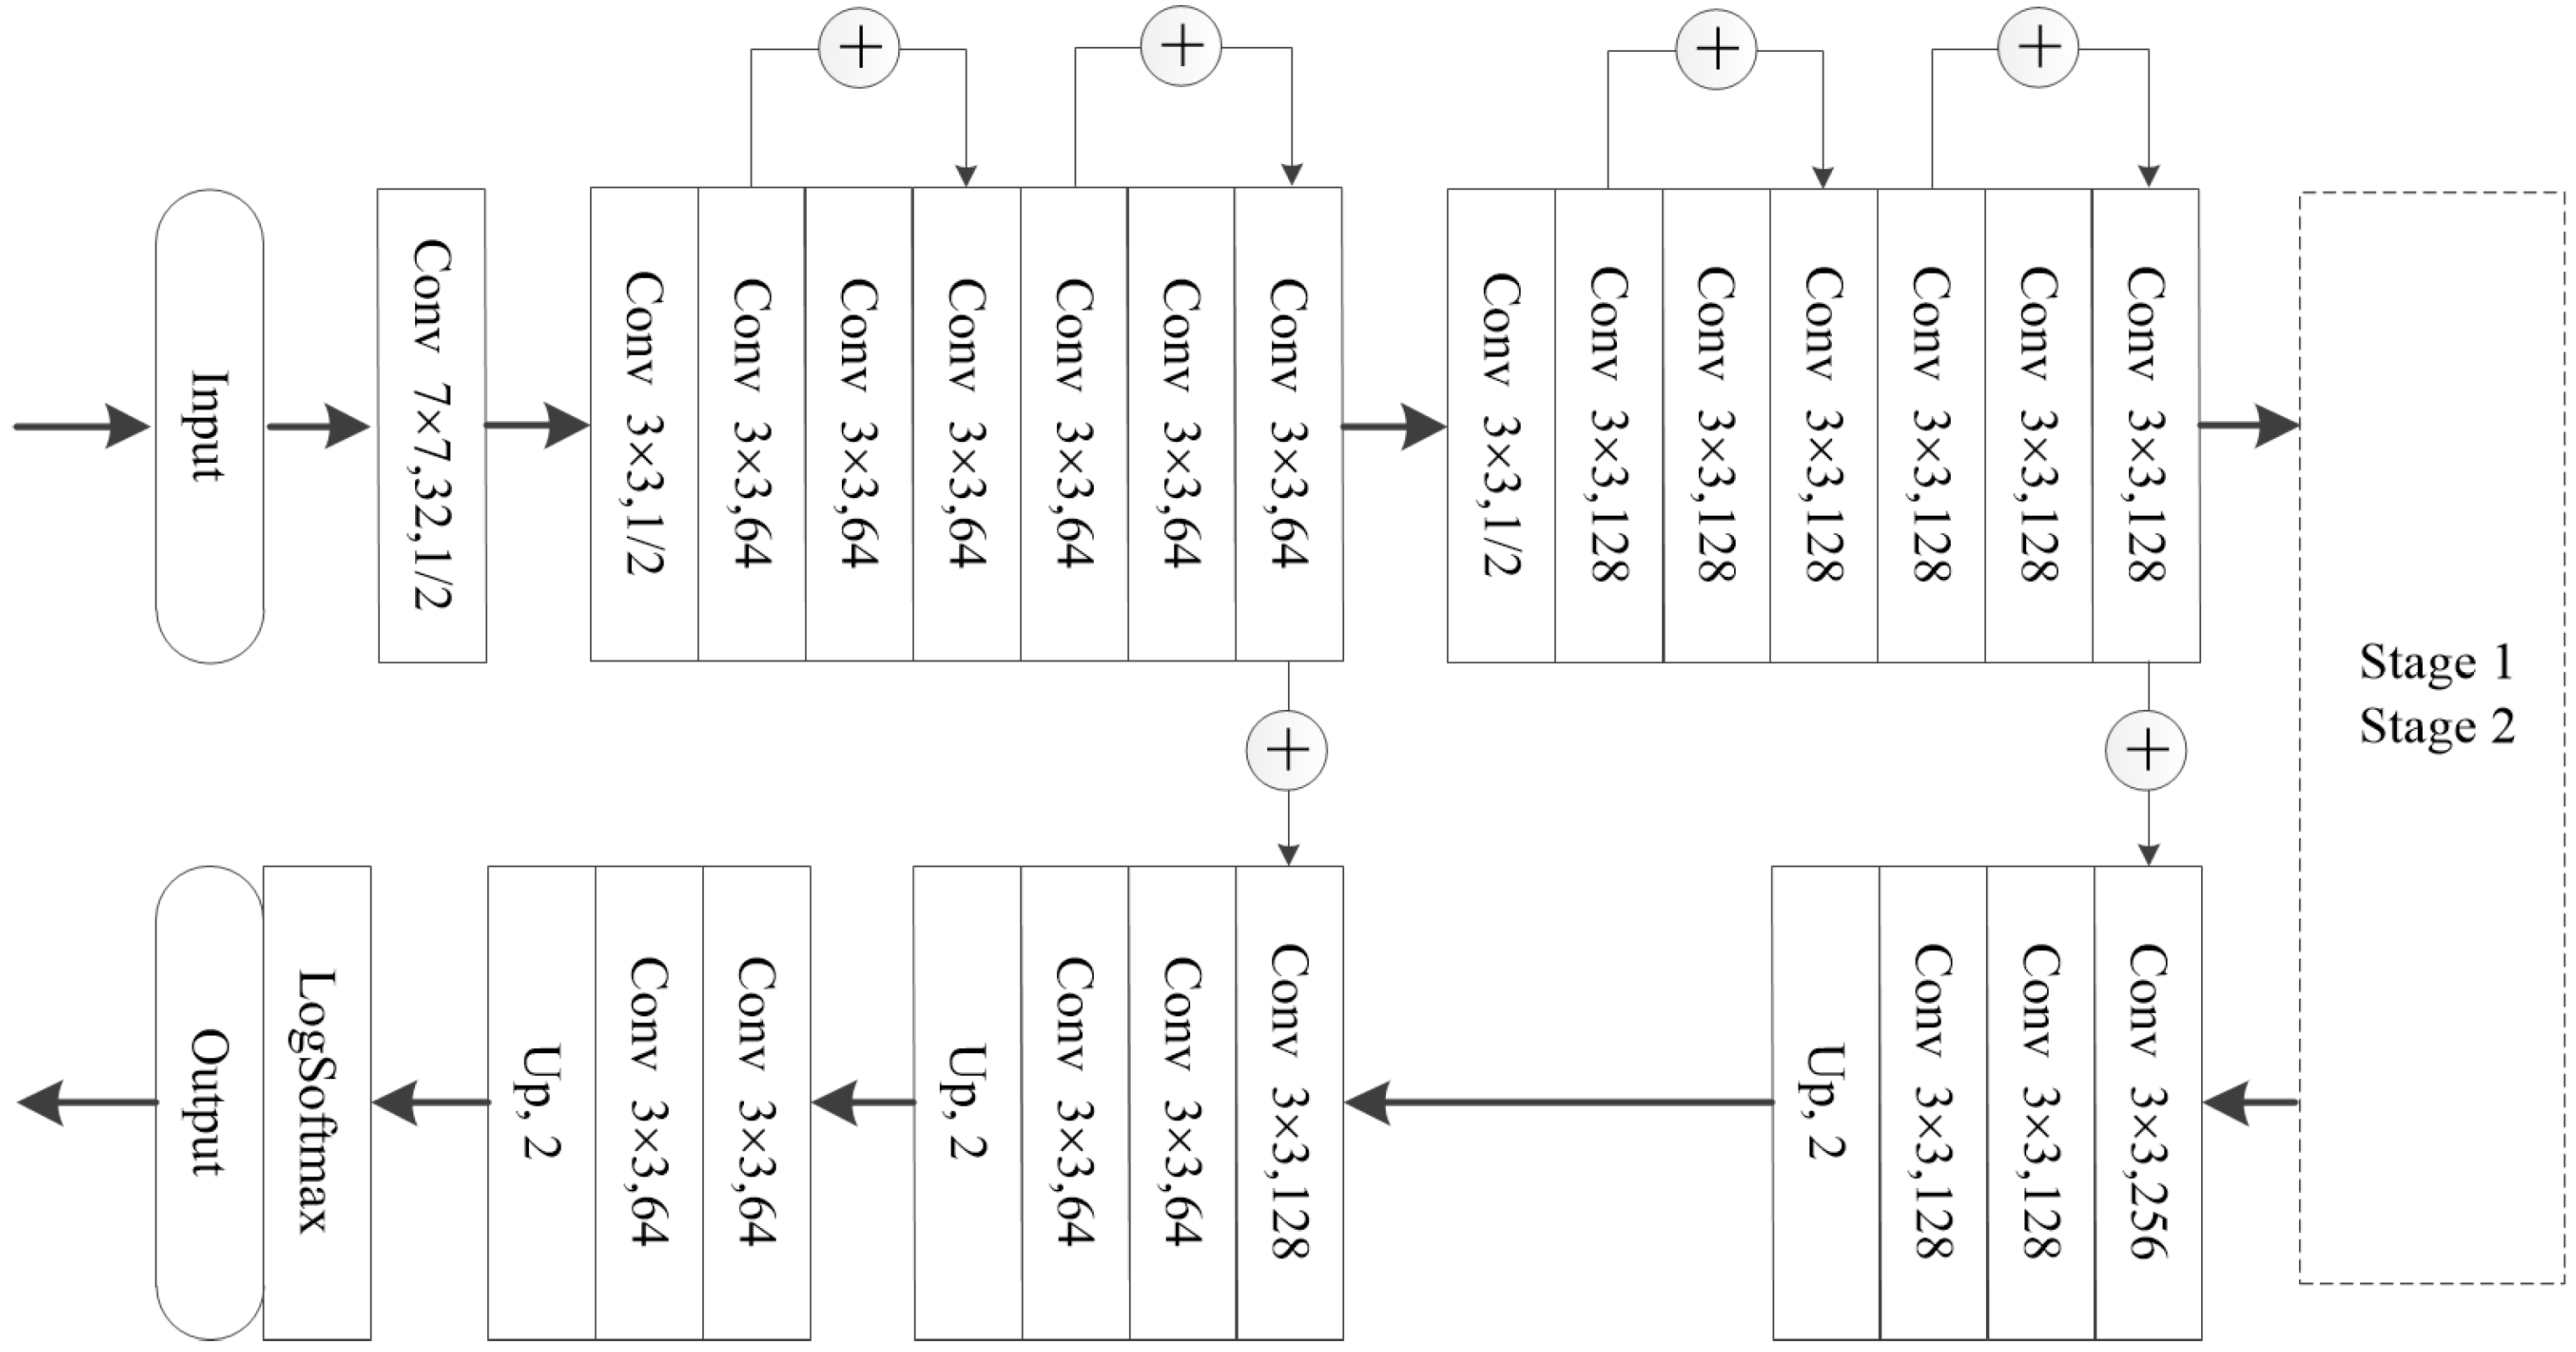
3.2.1. Backbone and Segmentation Head

The feature backbone (Figure 4) of the SWM is designed based on the concept of residual network [40]. It extracts features through convolution, downsampling, and residual blocks. The size of the feature map gradually decreases while the number of channels increases. Each level of features is added to the deep features in the decoding stage through skip connections. Finally, the upsampled output generates end-to-end pixel-level prediction results through logarithmic SoftMax, which converts the values into probability distributions.

3.2.2. Context Feature Branch

In high-resolution imagery, the overall visual interpretation characteristics of solid waste include: first, solid waste is prone to be confused with background elements such as buildings and roads; second, solid waste is deeply integrated into the background and often distributed within other land-use types, especially open spaces and lawns. Its identification relies on specific contextual information. To address these two issues, we designed a global semantic module block (GSM Block). This block enables the model to extract global contextual features, which refer to the information across the entire image and are used to understand the relationship between the target object and its surrounding environment. Additionally, it facilitates the extraction of solid waste from the background using an attention mechanism. As a result, the model gains the ability to effectively distinguish solid waste from other elements in the image.
The squeeze block, designed in this paper, is used to perform global feature condensation (Figure 5). The input feature IN R H × W × C is divided into three parts: q = W q i n , k = W k i n , v = W v i n . Where, W q R C q × C , W k R C k × C , and W v R C v × C are learnable weights. x ( h , w , c ) represents the transformation of tensor x to dimensions (h,w,c), w denotes a vector with all elements being 1.
Global features are obtained by performing dimension transformation and taking the mean along the horizontal and vertical directions of tensor q. The formula for calculating the mean along the horizontal direction is:
q h = ( q C q , H , W 1 W ) ( H , C q ) / w
The formula for calculating the mean along the vertical direction is:
q w = ( q C q , W , H 1 H ) ( W , C q ) / H
Similarly, applying this set of formulas to tensors k and v, we obtain the horizontal mean values k h   and   v h , as well as the vertical mean values k w and v w . Next, the compressed feature maps are multiplied together to obtain a H × W × C feature map. Then, the product is element-wise multiplied with the input feature to weight the correlations between different dimensions.
After completing the global feature condensation, we need to enhance attention by introducing global attention extraction. P i , j represents a position on the feature map:
P i , j = 1 H s o f t m a x ( q h T · k h ) v h + 1 W s o f t m a x ( q v T · k v ) v v
The above design amplifies the “global” cross-dimensional interactions, ensuring the ability to reflect the spatial location or feature channel importance of solid waste, allowing its information to be propagated and amplified in subsequent feature maps.

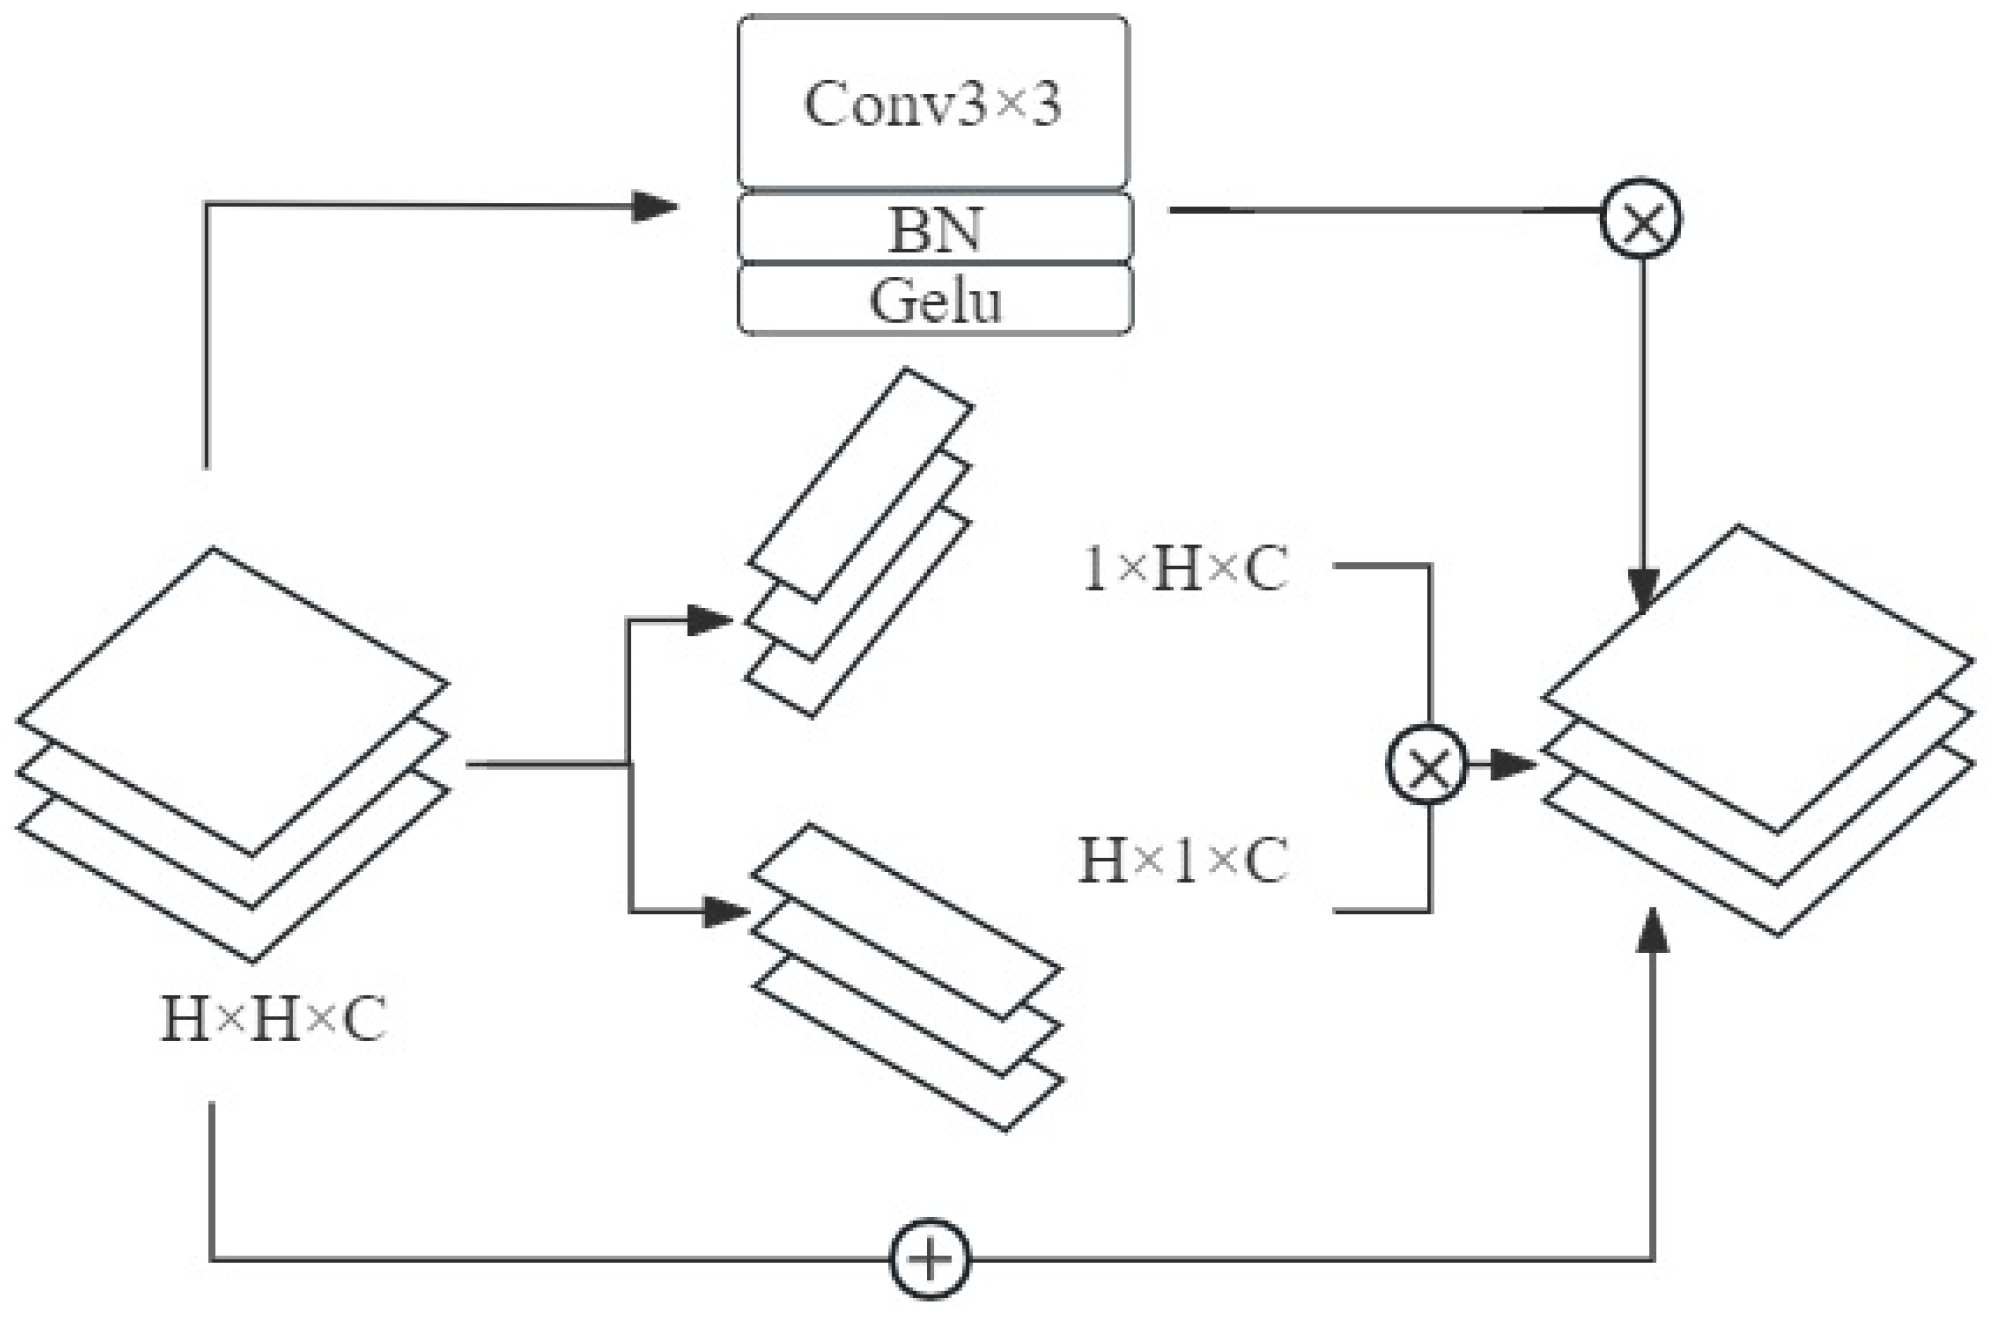
3.2.3. Spatial Feature Branch

In high-resolution images, the edges of solid waste piles do not have regular shapes. Therefore, deformable convolution concept [41] was introduced into the model to design the spatial feature branch, which is aimed at adaptively extracting high-resolution spatial features. Traditional convolutional kernels have a fixed shape and cannot adapt to irregular target shapes or local structural changes. In contrast, deformable convolution allows for adaptive adjustment of sampling positions based on the characteristics of the input data, thereby better capturing spatial information of the target.
The spatial feature branch consists of DCR (Deformable separable Convolution with Regularization) blocks, corresponding to the structure B in Figure 3. Firstly, pointwise convolutions (1 × 1 convolutions) are used to extend the tensor dimension from 128 to 384, then which are further processed by deformable separable convolution + BatchNorm + GeLU (Gaussian Error Linerar Units, activation function), and finally reduced back to 128 using pointwise convolutions. The so-called DCR here is just a minor modification to the existing MobileNet Block equipped by MobileNet V2 [42]. In this study, the depthwise separable convolutions that compose the MobileNet Block in MobileNet V2 were replaced with deformable separable convolution. Since solid waste generally has irregular edges, it is better to use deformable convolution kernels that follow its trajectory. The benefits of pointwise convolutions lie in enhancing features by widening and then consolidating tensor dimensions.
The operational steps of the designed deformable separable convolution in this study are as follows: Firstly, a small convolution operation is performed to predict the spatial offset parameters for the input feature map. The offset parameters p k   x and p k y are predicted for the k-th channel at point P. Then, the position adjustment of sampled points is applied to the input feature map, generating new sampled point coordinates x p k x + i , p k y + j k . Next, a channel convolution operation is performed on the input feature map that has undergone deformable sampling to predict the weights W k c for each channel. Finally, based on the predicted channel weights, a spatial convolution operation is performed on the sampled feature map to generate the final feature map. P i , j c represents the pixel value at the i-th row and j-th column of the c-th channel in the output feature map, and C i n represents the number of channels in the input feature map. The deformable separable convolution function can be represented as:
P i , j c = 1 C i n ( W k c · x p k x + i , p k y + j k )
For each position in the input feature map, the designed DCR adjusts the sampling position of the convolution kernel based on the offset at that position, introducing positional variability. This allows the model to better adapt to the deformation of solid waste, thereby improving the model’s ability to handle the complex structures and irregular shapes of solid waste.

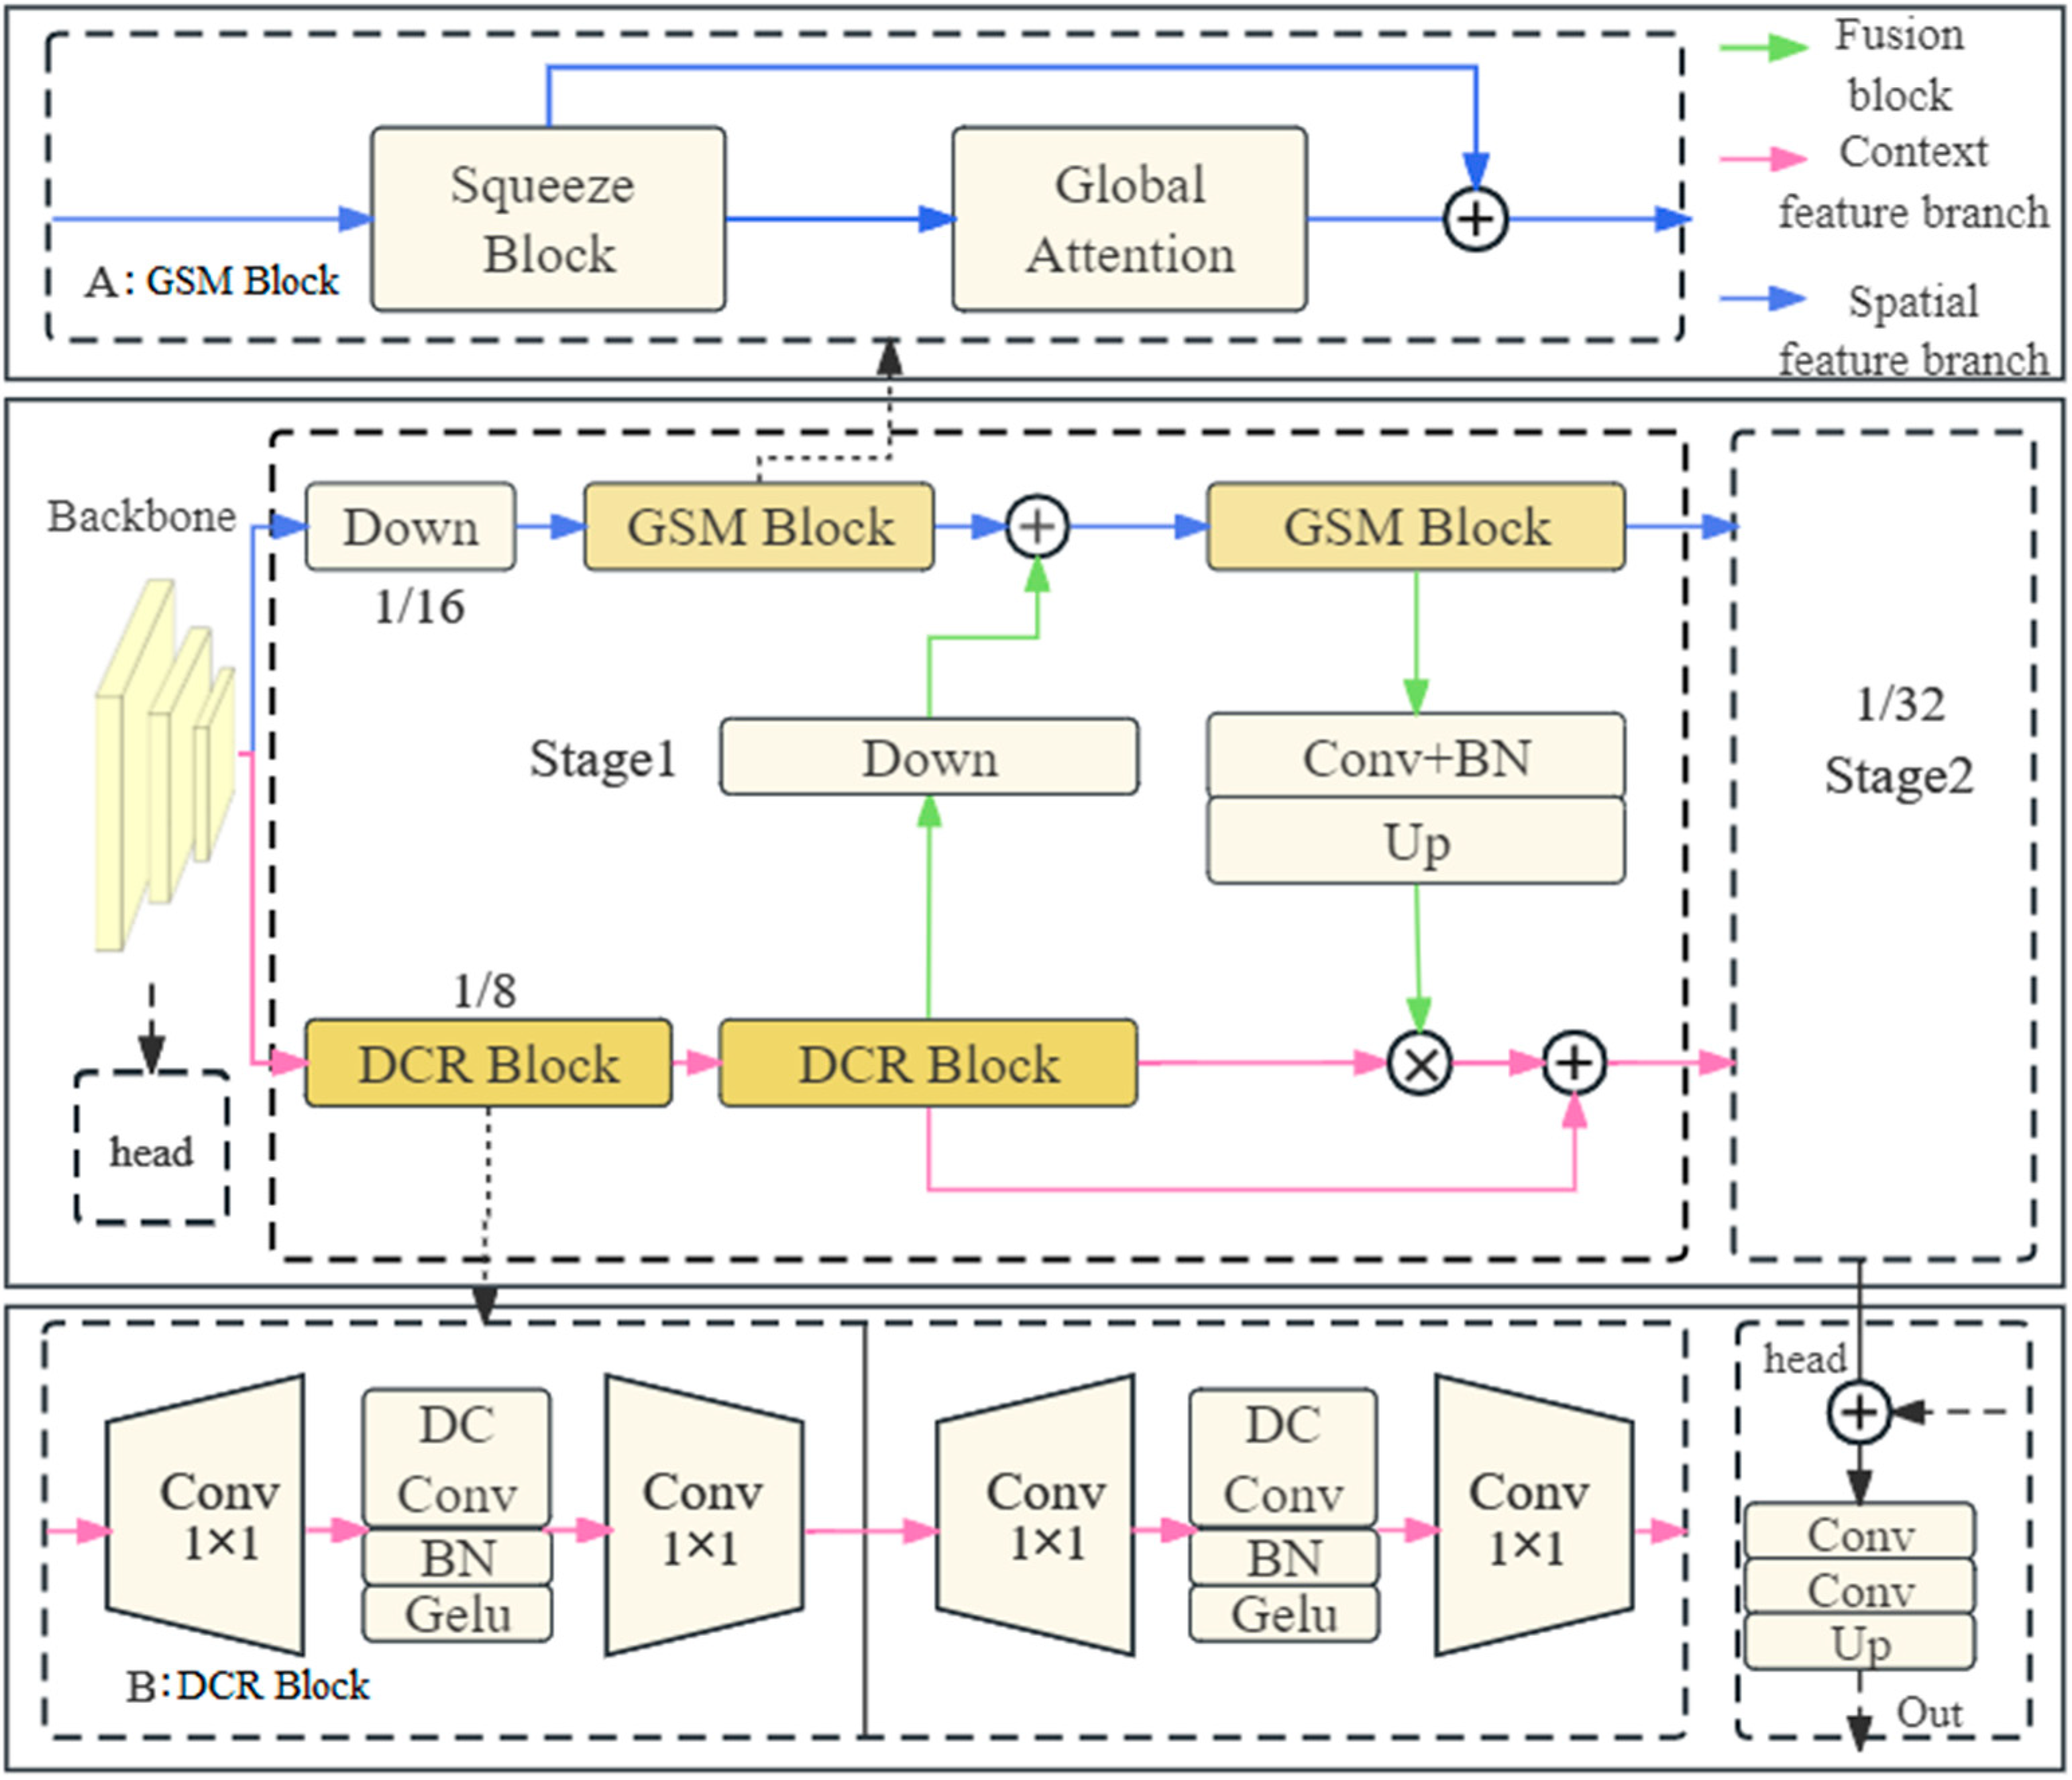
3.2.4. Feature Fusion Module

Two feature fusion mechanisms are designed to promote information interaction between branches in this study: the first involves downsampling and addition, where spatial features are passed to the contextual feature branch; the second mechanism involves upsampling contextual features, multiplying them with spatial features to obtain semantic features, which are then summed up with the original spatial features and passed to the spatial feature branch. This mainly involves multi-level fusion of DCR boundary information and GSM semantic information. The innovation of this part includes:
(1)
Different preprocessing scales. The GSM block is 1/16 in stage 1, 1/32 in stage 2, and the DCR is 1/8 in both stages. Since the global semantic information covers the entire image, the GSM block can focus on highlighting global semantic features in low-resolution feature maps, while spatial detail information mainly concentrates on local regions. The high-resolution feature maps allow the DCR to focus on highlighting spatial detail information. The separation and extraction mechanism makes feature extraction more efficient.
(2)
Multi-level fusion and complementary information. By conditioning the learning of the GSM block on DCR features, and conditioning the learning of DCR on SWR features, for the contextual branch, downsampling and global semantic information extraction will result in the loss of feature map detail information. However, spatial features from high-resolution can effectively supplement the detail information, addressing the blurring of feature maps caused by information loss. For the spatial feature branch with low-level detailed features, it typically contains a large amount of noise and redundant information. After communication, it can obtain high-level global semantic information at the low level and weight the detail information based on the importance of semantic information.
(3)
Improving the joint training-prediction accuracy of the GSM block and DCR block. Joint training framework refers to a training approach where multiple components are trained together in an integrated manner. Due to the dependency between the two branches, integrating them into a joint training framework can better utilize their complementary information, enhancing the model’s expressive power and prediction accuracy. It also reduces the reliance on the sample size.

4. Experiments and Discussion

4.1. Implementation Details

The networks in this paper are implemented on the Python-based deep learning framework PyTorch 1.11, using NVIDIA A40 with 48 G. To ensure fairness in method comparison, all network model hyperparameters are set uniformly: the number of training epochs is 100, the learning rate is 0.01, the batch size is 16, and the loss function uses cross-entropy loss. The model comparisons include BiSeNetv2 [43], ConvNeXt [44], Danet [45], DDRNet [46], Deeplabv3plus [47], Unet [48], FCHarDNet [49], GCN [50], NestedUnet [51], PSPNet [52], SFNet [53], SegFormer [54], and Swin Transformer [55]. These state-of-the-art models were proved to perform well in traditional semantic segmentation-related downstream tasks.

4.2. Accuracy Metrics

The evaluation metrics for method performance in this study include precision (Prec), recall (Rec), overall accuracy (OA), and F1 score. The F1 score is a comprehensive measure that takes into account both precision and recall, making it the primary metric for assessing the overall performance of the models.
F 1 = 2 × P r e × R e c P r e c + R e c
P r e c = T P T P + F P
R e c = T P T P + F N
O A = T P + T N T P + T N + F P + F N
where, TP represents the number of pixels detected as solid waste correctly, TN represents the number of pixels detected as background correctly, FP represents the number of pixels falsely detected as solid waste, and FN represents the number of pixels falsely detected as background.

4.3. Ablation Study

In the SWM network designed in this study, in addition to the conventional backbone and head, the proposed modules include the context feature branch, spatial feature branch, and fusion block. To verify their effectiveness, the combination of backbone and head is used as the baseline network.
According to the comparison of various methods, the results of the ablation study are obtained (Table 1). Compared with the single module class and baseline network, Method A uses the MobileNet block structure for the dual-branch part of the baseline network, Method B adds the Spatial feature branch, and Method C adds the Context feature branch. Compared with Method A, Methods B and C show significant improvement in all four indicators, demonstrating better performance. This indicates that both the spatial feature branch and contextual branch can effectively improve the model’s feature extraction ability. Among them, Method C has a 2.351% increase in F1 score, which is higher than the 2.078% increase of Method B. The two methods are close in recall rate, and the main difference in performance improvement is that Method C has a larger increase in precision, which may be due to the fact that contextual features are more helpful in distinguishing solid waste from the background. Compared with the single module method group and double module method, both Methods B and C only add single modules, while Method D adds double modules. From Table 1, it can be found that Method D performs better than the single module group in comprehensive performance F1 score, with a recall rate increase of 1.57% and 1.75%, respectively. However, not all indicators have increased, and the precision indicator has decreased by 0.22% and 0.98%, respectively. This may be due to the fact that the dual-branch structure allows the model to obtain more information, which helps improve its ability to detect solid waste, but the interaction between the information reduces precision. Compared with the double module method and double module method with fusion block, Method D directly superimposes the information of the two modules in the channel dimension, while Method E designs two feature fusions. The comparison shows that Method E has better overall indicators than Method D. This indicates that a simple feature superimposition method cannot fully utilize the features extracted by the dual branch. By designing a feature fusion mechanism, Method E can make a combined use of the two types of information by interacting and cooperating between the dual branches, providing more comprehensive and accurate data representations and effectively improving the model’s prediction ability and accuracy.

4.4. Method Comparison

4.4.1. Quantitative Analysis

This study compares the SWM with 13 existing models (Table 2). Since there are many models involved, the advantages of SWM are discussed in two types of comparisons. #1: Comparison between the SWM and other feature fusion-based models. The compared methods include UNet, NestedUnet, SwinTransformer, DAnet, etc., which achieve feature fusion through skip connections or attention mechanisms. Among them, SwinTransformer and NestedUnet perform better. Compared with the proposed SWM in this study, SwinTransformer lags behind in all four indicators by 2.7%, 1.3%, 3.2%, and 2.2%, with overall performance falling behind; NestedUnet performs 2.3% worse than this study’s method in F1 value, although its precision is slightly higher than this method, its recall rate is 5.8% lower, indicating a large number of missed detections, making it unsuitable for large-area monitoring and control. The SWM in this study allows bidirectional information transmission, enabling the high-dimensional feature space to obtain detailed information during the encoding process to compensate for information loss during feature extraction, while allowing the low-dimensional feature space to gain high-dimensional semantic information to obtain more comprehensive feature representation. #2: Comparison between the SWM and other models based on feature extraction enhancement. Comparison methods include PSPNet, Deeplabv3plus, DDRNet, which adjust the convolution, pooling, and other operation strides to achieve a larger receptive field in the spatial domain, and DANet, BiSeNetv2, SegFormer, GCN, and other models that design some modules to improve their ability to extract contextual features. When comparing the SWM with the best-performing GCN model among these models, the SWM outperforms it by 1.2%, 0.5%, and 2.5% in terms of F1 value, precision, and recall rate, respectively. Although there is a decrease in precision of 0.2%, the SWM significantly reduces the number of missed detections. Overall, compared with the 13 existing methods, the main improvement of this study is a significant increase in recall rate, with the highest overall performance among the 14 methods, indicating that the spatial and contextual branch structures we designed are superior to the compared methods in feature extraction ability, and can better capture the semantic information of image targets, demonstrating good performance in solid-waste recognizing tasks.

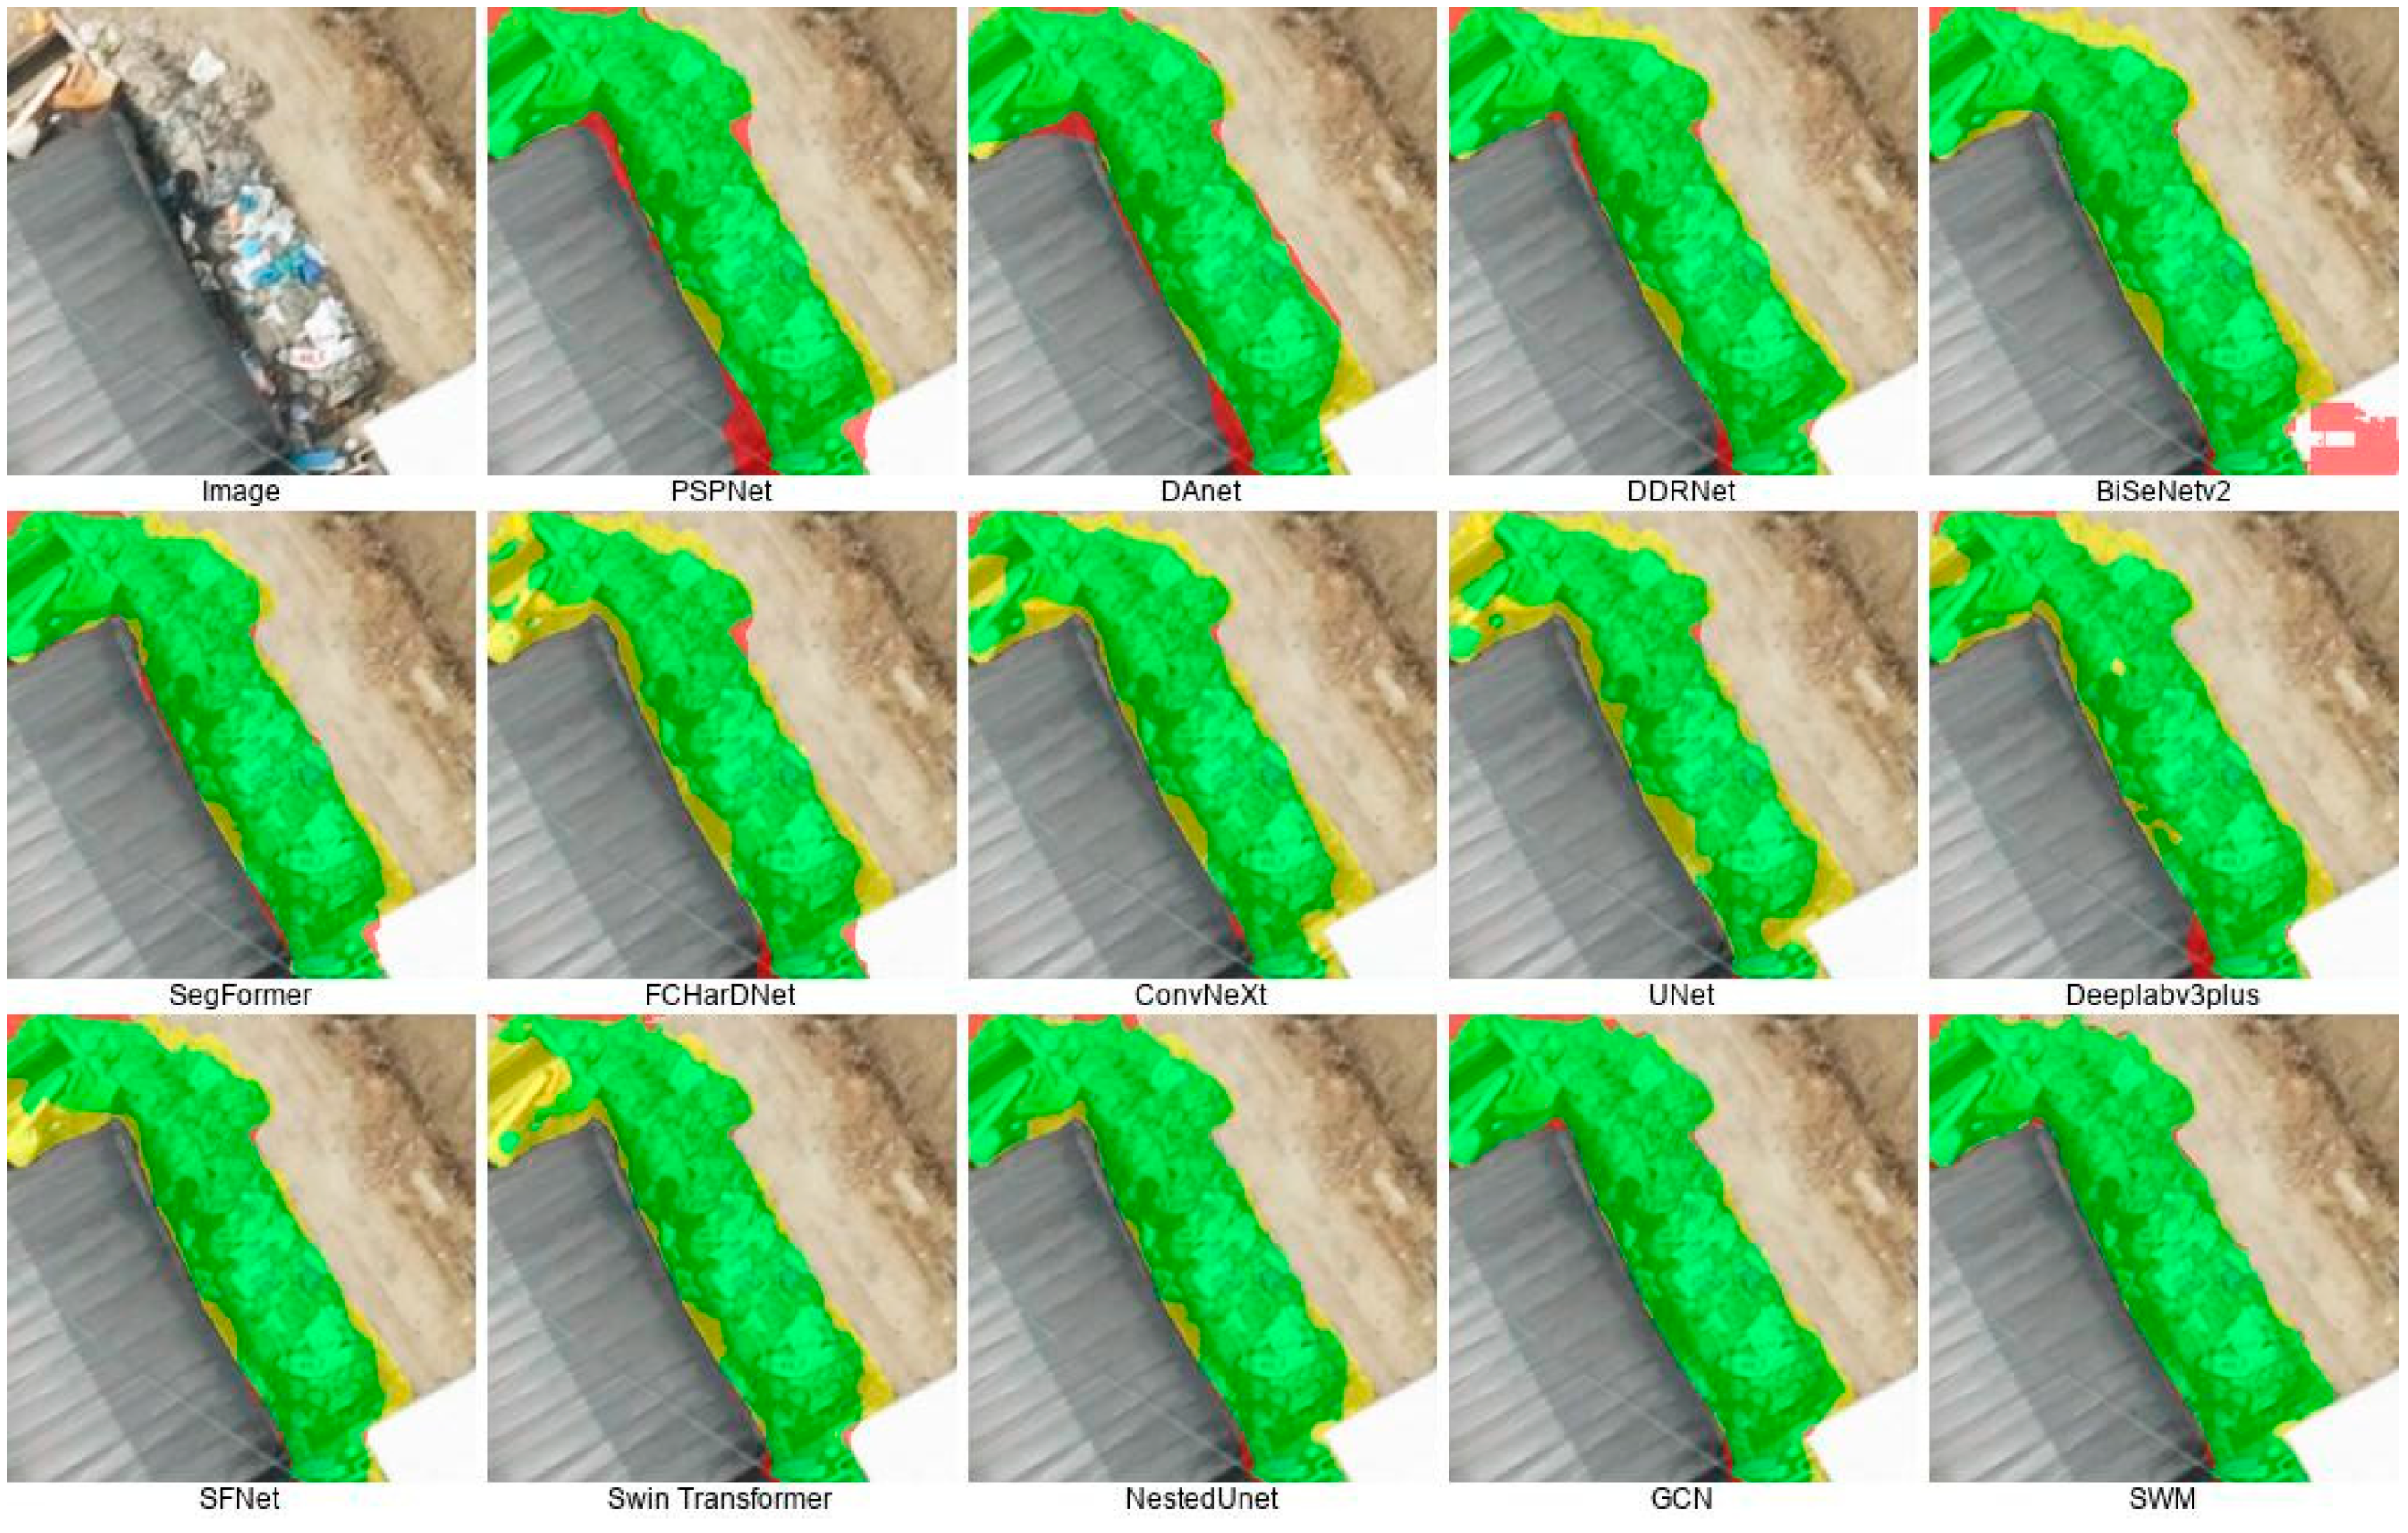
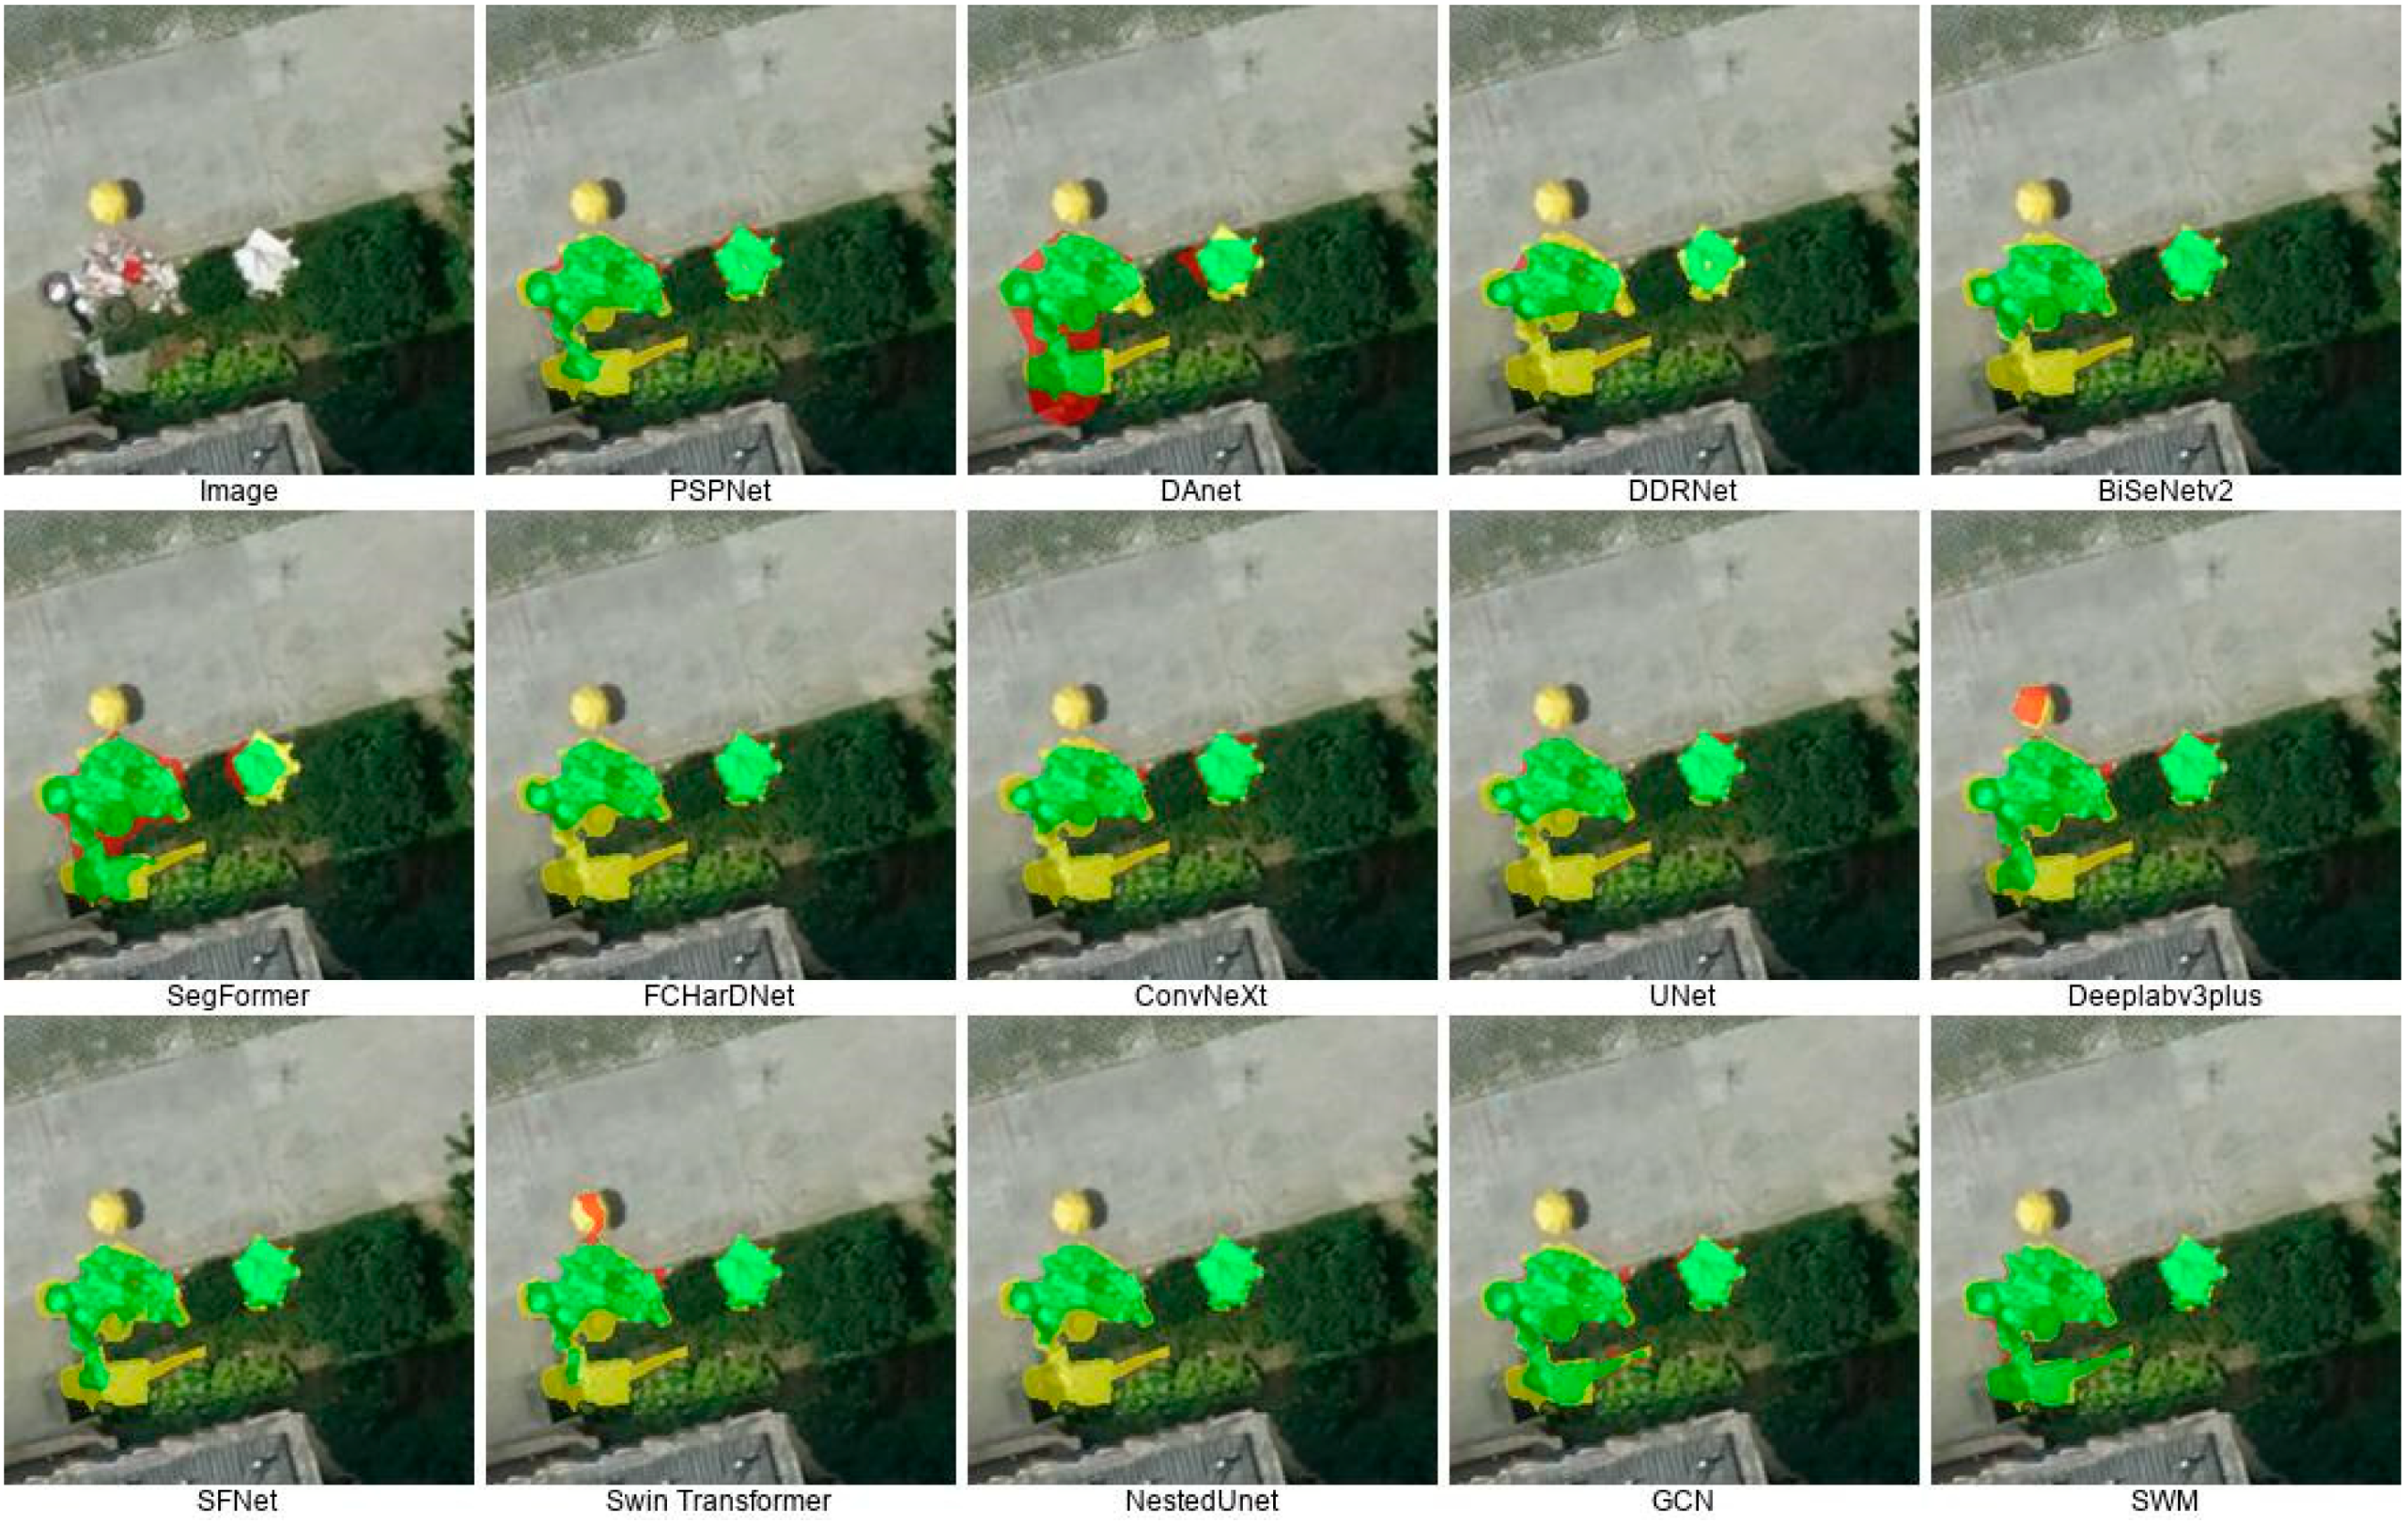
4.4.2. Qualitative Analysis

Multi-Scene Comparison

Solid waste piles are widely distributed in various urban land use types, including roads, buildings, grasslands, forests, rivers, etc. Figure 6 shows the segmentation results in the building and road scenes. PSPNet and DAnet models have false detections (marked in red), mistakenly recognizing building and road edges as solid waste. FCHarDNet, ConvNeXt, UNet, SFNet, and SwinTransformer models have a large number of missed detections (marked in yellow), while the SWM proposed in this study has the fewest missed detections, consistent with the quantitative analysis results. Figure 7 shows the segmentation results in the river-forest scene. All models are able to accurately detect it, with a small amount of gray garbage on the bank in the upper left corner. Among them, PSPNet, DAnet, and SegFormer have missed detections on the boundaries. Figure 8 shows the segmentation results in the road-grassland scene. There is a single yellow pattern on the road, which is a pedestrian’s parasol. Deeplabv3plus and SwinTransformer mistakenly identify it as solid waste, while other models generally recognize the garbage on the grassland as background. However, the segmentation result of the SWM in this study is basically consistent with the label boundary. Overall, the diverse scales, textures, shapes, and distribution environments of solid waste make it difficult to accurately segment the targets from the background. The main advantage of our proposed model lies in its higher recall rate, which enables the detection of a larger number of missed instances. As seen from Figure 6, Figure 7 and Figure 8 (showing three demonstration areas), our proposed model tends to extract the solid-waste piles in their complete form, i.e., the segmentation boundaries are almost identical to the labels, whereas the compared models are charactered by ubiquitous missed detections. This indicates that the proposed dual-branch structure can provide more comprehensive and accurate feature representation, which helps improve performance and achieve the best results in the segmentation task of solid waste piles studied.

Extensive Examples

In order to further demonstrate the reliable performance of the SWM in large-area solid waste segmentation tasks, Figure 9 presents segmentation results in diverse scenes. The segmentation results show that three types of garbage can be segmented, indicating the generalization ability of the model proposed in this paper to accurately segment complex boundaries of solid waste in different distribution scenarios. The model is capable of achieving complete segmentation of solid waste occurrences at different scales, with very few missed and false detections, making it suitable for large-area solid waste monitoring.

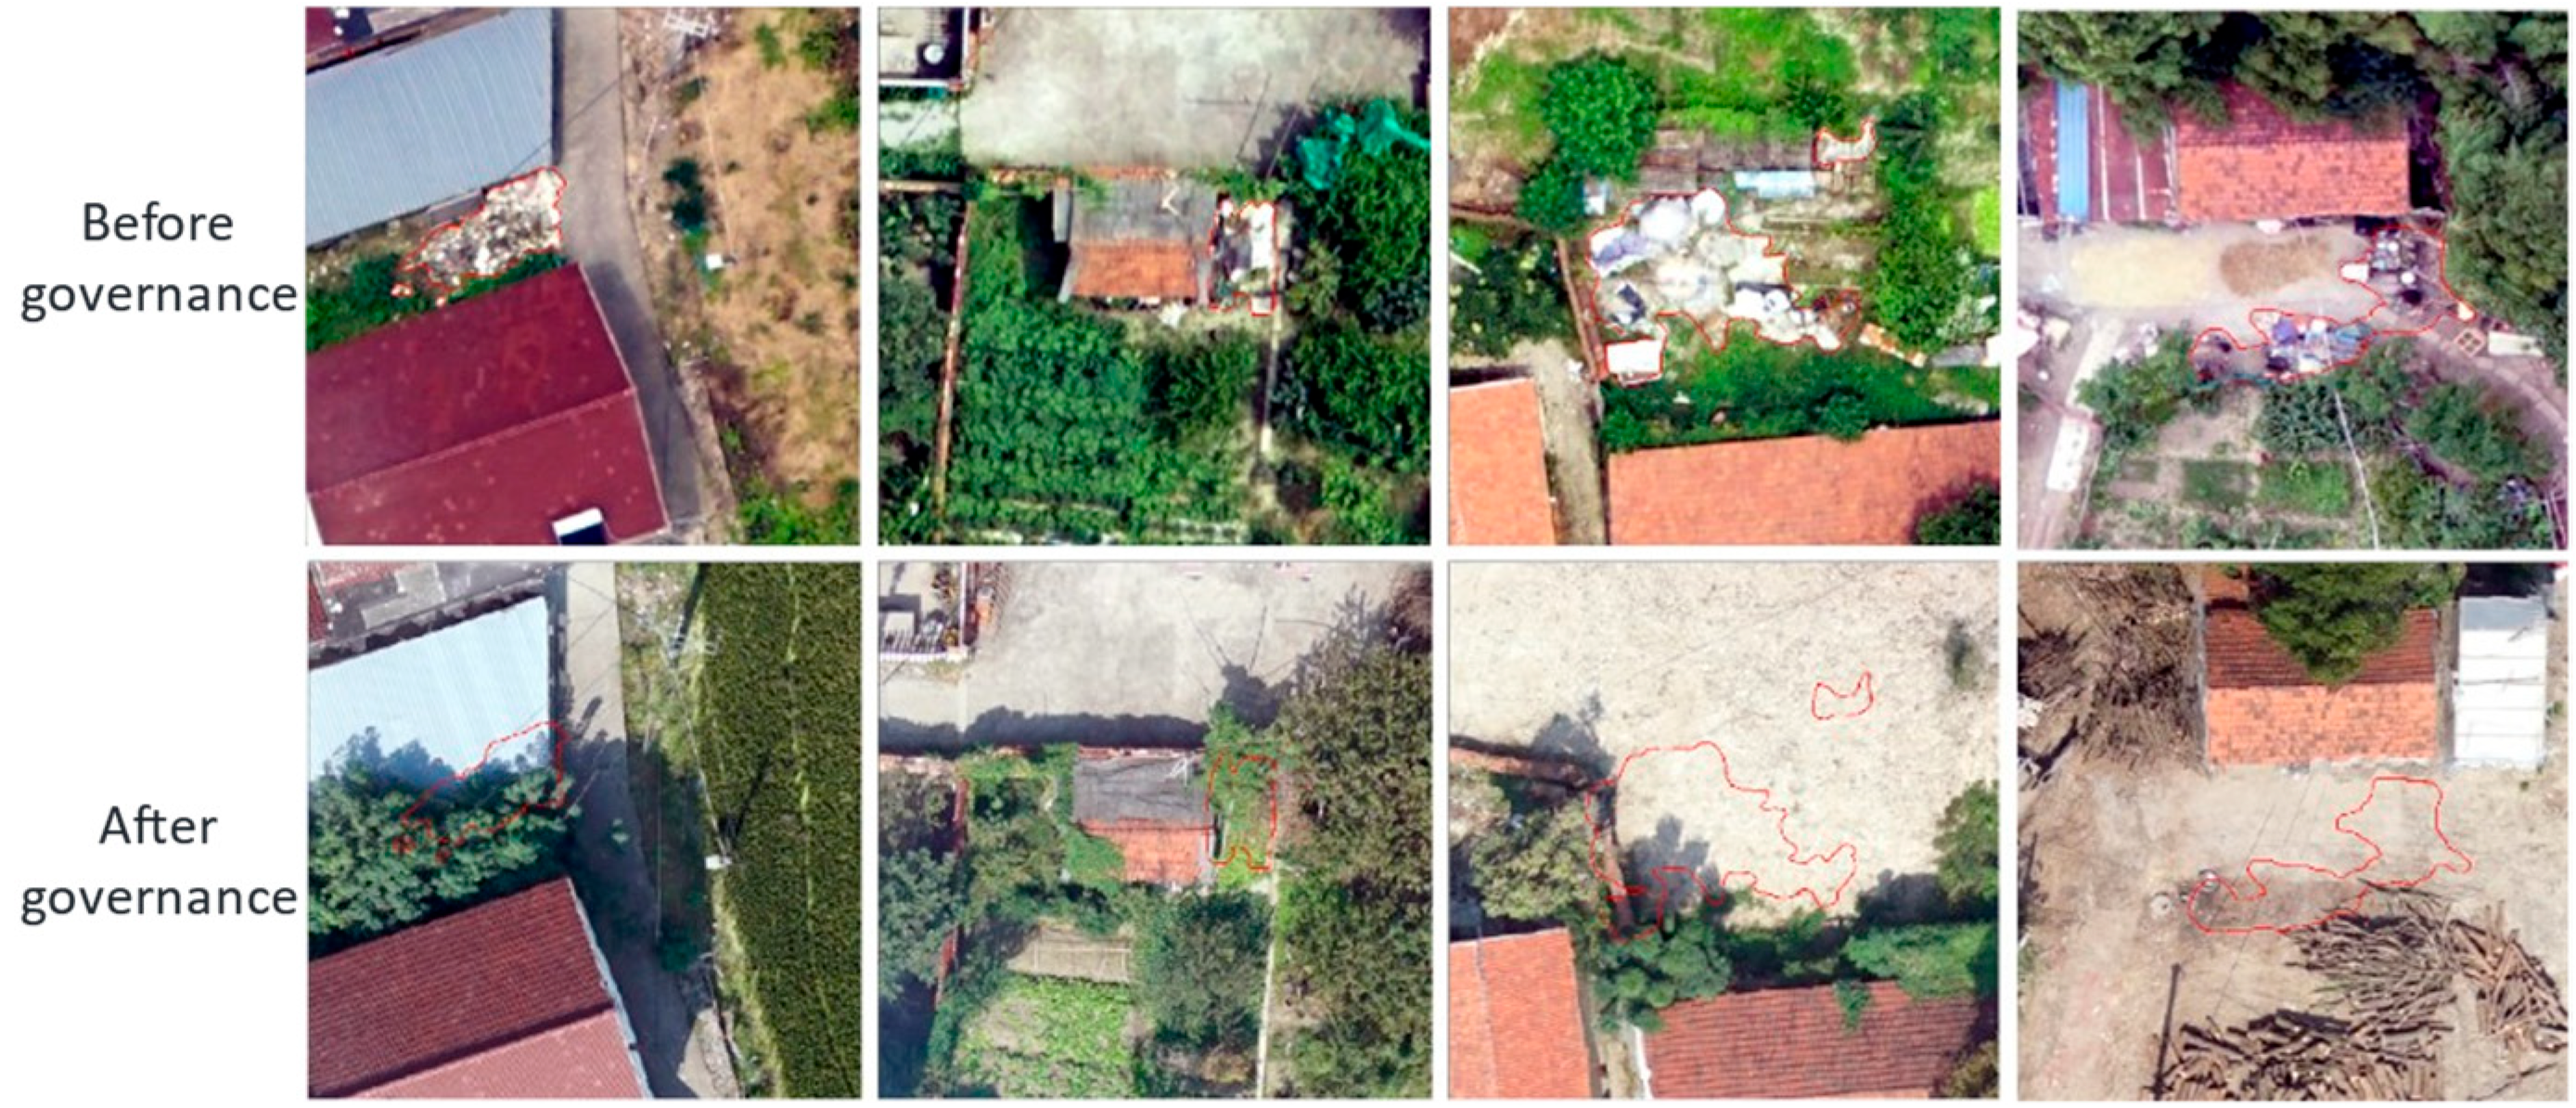
4.5. Effectiveness of Comprehensive Monitoring and Management

The trained SWM was used to monitor the entire study area using UAV imagery, and a total of 3462 solid waste piles were identified (Figure 10). It can be observed that the garbage is relatively dispersed throughout the entire study area. This study randomly selected 100 solid waste piles, among which the detection results of 89 were accurate. Due to the large-area of the study site, in order to demonstrate the reliability of the SWM’s segmentation over the entire study area in detail, this paper selected the northwest area, which has a high concentration of solid waste, as a representative area to analyze the model’s segmentation results. These waste piles are widely distributed in our living environment (D1–D4). Long-term outdoor waste dumping and improper disposal will lead to the proliferation of rats and mosquitoes, causing the spread of certain diseases and posing a threat to human health. The spatial location map produced in this study can intuitively demonstrate the distribution of solid waste in different areas.
The environmental protection department has implemented governance measures on the solid waste piles, and a portion of the before-and-after comparison results are shown in Figure 11. From the results, it can be seen that the waste identified in this study has disappeared after the governance, indicating targeted management of the waste piles. This also demonstrates the high reliability of the monitoring results presented in this paper. Our work provides data support for ecological environment improvement efforts, effectively reducing the regulatory costs of manual inspection of solid waste in urban management through intelligent monitoring methods. It also promotes waste recycling and reduces environmental pollution.

5. Conclusions

Various semantic segmentation methods have been applied in different research fields by many scholars, but most of them focus on conventional segmentation tasks such as street scenes, farmlands, and buildings. An immediate application to large-area solid waste detection in ultra-high-resolution drone images results in a large number of missed and false detections. In this study, we combined unmanned aerial vehicle remote sensing and deep learning analysis technology to conduct research in 450 km2 of ultra-high-resolution UAV images, built a dataset of 2600 images, and solved the problem of the lack of high-resolution semantic segmentation datasets for solid waste.
We then constructed a dual-branch semantic segmentation model that improved the ability to distinguish solid waste from the environment and the ability to segment complex edges. The global attention mechanism was introduced in the contextual feature branch to enhance the discrimination of foreground and background, and the deformable separable convolution was introduced in the spatial feature branch to adapt to complex edges and extract spatial detail information. Finally, we obtained an F1 score of 88.875%, an overall accuracy of 94.390%, a recall rate of 88.626%, and a precision rate of 89.125% on the dataset using our proposed method, which is superior to other 13 state-of-the-art semantic methods. Finally, the trained model was applied to segment the entire regional image, obtaining a distribution map of the entire region, which was successfully applied in large-area solid waste monitoring and governance. In urban solid waste monitoring, this method can save labor costs, facilitate quick treatment, and play a positive role in improving the overall living environment.
This study differs from solid waste recycling scenarios [21,24], as it primarily targets the monitoring of exposed solid waste over extensive regions. In comparison to approaches target detection [25,26], image classification [27,28,29], and weakly supervised segmentation [30,31], this study achieves pixel-level recognition outcomes for solid waste. However, there are certain limitations. With regard to the sample library, the data captured by the visible light band of the unmanned aerial vehicle (UAV) is limited to monitoring exposed solid waste on the ground surface, and is unable to detect waste concealed by vegetation or buried beneath the surface. To address this, there is a potential for introducing thermal infrared data in the future to identify such waste based on temperature changes resulting from the decomposition of garbage. Regarding the model, there is a need to enhance the performance of mixed waste detection, particularly in cases where the mixed waste is dispersed rather than consolidated. Furthermore, the dual-branch structure, while capable of capturing more complementary information, results in an increase in parameter size, thereby escalating the costs associated with training and inference. Therefore, further optimization to improve efficiency is necessary.

Author Contributions

Y.L.: Methodology, writing, and funding acquisition. X.Z.: Analysis and coding. B.Z.: Investigation. W.N.: Data curation. P.G.: Visualization. J.L.: Review and Editing. K.W.: software. All authors have read and agreed to the published version of the manuscript.

Funding

This research was financially supported by the Science and Technology Program of Zhejiang Province (Grant No. 2022C35070).

Institutional Review Board Statement

Not applicable.

Informed Consent Statement

Not applicable.

Data Availability Statement

The data presented in this study are available on request from the corresponding author. Data available on request due to privacy.

Conflicts of Interest

The authors declare no conflicts of interest.

References

  1. Mohee, R.; Mauthoor, S.; Bundhoo, Z.M.A.; Somaroo, G.; Soobhany, N.; Gunasee, S. Current status of solid waste management in small island developing states: A review. Waste Manag. 2015, 43, 539–549. [Google Scholar] [CrossRef] [PubMed]
  2. Grazhdani, D. Assessing the variables affecting on the rate of solid waste generation and recycling: An empirical analysis in Prespa Park. Waste Manag. 2016, 48, 3–13. [Google Scholar] [CrossRef] [PubMed]
  3. Incekara, A.H.; Delen, A.; Seker, D.Z.; Goksel, C. Investigating the Utility Potential of Low-Cost Unmanned Aerial Vehicles in the Temporal Monitoring of a Landfill. ISPRS Int. J. Geo-Inf. 2019, 8, 22. [Google Scholar] [CrossRef]
  4. Manzo, C.; Mei, A.; Zampetti, E.; Bassani, C.; Paciucci, L.; Manetti, P. Top-down approach from satellite to terrestrial rover application for environmental monitoring of landfills. Sci. Total Environ. 2017, 584–585, 1333–1348. [Google Scholar] [CrossRef]
  5. Li, H.; Hu, C.; Zhong, X.; Zeng, C.; Shen, H. Solid Waste Detection in Cities Using Remote Sensing Imagery Based on a Location-Guided Key Point Network With Multiple Enhancements. IEEE J. Sel. Top. Appl. Earth Obs. Remote Sens. 2023, 16, 191–201. [Google Scholar] [CrossRef]
  6. Bui, T.D.; Tsai, F.M.; Tseng, M.L.; Ali, M.H. Identifying sustainable solid waste management barriers in practice using the fuzzy Delphi method. Resour. Conserv. Recycl. 2020, 154, 104625. [Google Scholar] [CrossRef]
  7. Zeng, L.; Sun, H.; Peng, T.; Hui, T. Effect of glass content on sintering kinetics, microstructure and mechanical properties of glass-ceramics from coal fly ash and waste glass. Mater. Chem. Phys. 2021, 260, 124120. [Google Scholar] [CrossRef]
  8. Malche, T.; Maheshwary, P.; Tiwari, P.K.; Alkhayyat, A.H.; Bansal, A.; Kumar, R. Efficient solid waste inspection through drone-based aerial imagery and TinyML vision model. Trans. Emerg. Telecommun. Technol. 2023, e4878. [Google Scholar] [CrossRef]
  9. Padubidri, C.; Kamilaris, A.; Karatsiolis, S. Accurate Detection of Illegal Dumping Sites Using High Resolution Aerial Photography and Deep Learning. In Proceedings of the 2022 IEEE International Conference on Pervasive Computing and Communications Workshops and other Affiliated Events (PerCom Workshops), Pisa, Italy, 21–25 March 2022. [Google Scholar] [CrossRef]
  10. Ramos, R.d.O.; de Sousa Fernandes, D.D.; de Almeida, V.E.; Gonsalves Dias Diniz, P.H.; Lopes, W.S.; Leite, V.D.; Ugulino de Araujo, M.C. A video processing and machine vision-based automatic analyzer to determine sequentially total suspended and settleable solids in wastewater. Anal. Chim. Acta 2022, 1206, 339411. [Google Scholar] [CrossRef]
  11. Gill, J.; Faisal, K.; Shaker, A.; Yan, W.Y. Detection of waste dumping locations in landfill using multi-temporal Landsat thermal images. Waste Manag. Res. 2019, 37, 386–393. [Google Scholar] [CrossRef]
  12. Begur, H.; Dhawade, M.; Gaur, N.; Dureja, P.; Gao, J.; Mahmoud, M.; Huang, J.; Chen, S.; Ding, X. An edge-based smart mobile service system for illegal dumping detection and monitoring in San Jose. In Proceedings of the 2017 IEEE SmartWorld, Ubiquitous Intelligence & Computing, Advanced & Trusted Computed, Scalable Computing & Communications, Cloud & Big Data Computing, Internet of People and Smart City Innovation (SmartWorld/SCALCOM/UIC/ATC/CBDCom/IOP/SCI), San Francisco, CA, USA, 4–8 August 2017; pp. 1–6. [Google Scholar] [CrossRef]
  13. DeVries, B.; Huang, C.; Armston, J.; Huang, W.; Jones, J.W.; Lang, M.W. Rapid and robust monitoring of flood events using Sentinel-1 and Landsat data on the Google Earth Engine. Remote Sens. Environ. 2020, 240, 111664. [Google Scholar] [CrossRef]
  14. Enegbuma, W.I.; Bamgbade, J.A.; Ming, C.P.H.; Ohueri, C.C.; Tanko, B.L.; Ojoko, E.O.; Dodo, Y.A.; Kori, S.A. Real-Time Construction Waste Reduction Using Unmanned Aerial Vehicle. In Handbook of Research on Resource Management for Pollution and Waste Treatment; IGI Global: Hershey, PA, USA, 2020. [Google Scholar] [CrossRef]
  15. Osco, L.P.; Marcato Junior, J.; Marques Ramos, A.P.; de Castro Jorge, L.A.; Fatholahi, S.N.; de Andrade Silva, J.; Matsubara, E.T.; Pistori, H.; Gonçalves, W.N.; Li, J. A review on deep learning in UAV remote sensing. Int. J. Appl. Earth Obs. Geoinf. 2021, 102, 102456. [Google Scholar] [CrossRef]
  16. Manfreda, S.; McCabe, M.F.; Miller, P.E.; Lucas, R.; Pajuelo Madrigal, V.; Mallinis, G.; Ben Dor, E.; Helman, D.; Estes, L.; Ciraolo, G.; et al. On the Use of Unmanned Aerial Systems for Environmental Monitoring. Remote Sens. 2018, 10, 641. [Google Scholar] [CrossRef]
  17. Tmušić, G.; Manfreda, S.; Aasen, H.; James, M.R.; Gonçalves, G.; Ben-Dor, E.; Brook, A.; Polinova, M.; Arranz, J.J.; Mészáros, J.; et al. Current Practices in UAS-based Environmental Monitoring. Remote Sens. 2020, 12, 1001. [Google Scholar] [CrossRef]
  18. Shen, C. A transdisciplinary review of deep learning research and its relevance for water resources scientists. Water Resour. Res. 2018, 54, 8558–8593. [Google Scholar] [CrossRef]
  19. Gonçalves, G.; Andriolo, U.; Pinto, L.; Bessa, F. Mapping marine litter using UAS on a beach-dune system: A multidisciplinary approach. Sci. Total Environ. 2020, 706, 135742. [Google Scholar] [CrossRef]
  20. Li, J.; Chen, J.; Sheng, B.; Li, P.; Yang, P.; Feng, D.D.; Qi, J. Automatic detection and classification system of domestic waste via multimodel cascaded convolutional neural network. IEEE Trans. Ind. Inform. 2021, 18, 163–173. [Google Scholar] [CrossRef]
  21. Sheng, T.J.; Islam, M.S.; Misran, N.; Baharuddin, M.H.; Arshad, H.; Islam, M.R.; Chowdhury, M.E.; Rmili, H.; Islam, M.T. An internet of things based smart waste management system using LoRa and tensorflow deep learning model. IEEE Access 2020, 8, 148793–148811. [Google Scholar] [CrossRef]
  22. Gupta, T.; Joshi, R.; Mukhopadhyay, D.; Sachdeva, K.; Jain, N.; Virmani, D.; Garcia-Hernandez, L. A deep learning approach based hardware solution to categorise garbage in environment. Complex Intell. Syst. 2022, 8, 1129–1152. [Google Scholar] [CrossRef]
  23. Abdu, H.; Noor, M.H.M. A Survey on Waste Detection and Classification Using Deep Learning. IEEE Access 2022, 10, 128151–128165. [Google Scholar] [CrossRef]
  24. Majchrowska, S.; Mikołajczyk, A.; Ferlin, M.; Klawikowska, Z.; Plantykow, M.A.; Kwasigroch, A.; Majek, K. Deep learning-based waste detection in natural and urban environments. Waste Manag. 2022, 138, 274–284. [Google Scholar] [CrossRef]
  25. Yun, K.; Kwon, Y.; Oh, S. Vision-based garbage dumping action detection for real-world surveillance platform. ETRI J. 2019, 41, 494–505. [Google Scholar] [CrossRef]
  26. Li, X.; Tian, M.; Kong, S.; Wu, L.; Yu, J. A modified YOLOv3 detection method for vision-based water surface garbage capture robot. Int. J. Adv. Robot. Syst. 2020, 17, 1729881420932715. [Google Scholar] [CrossRef]
  27. Chu, Y.; Huang, C.; Xie, X.; Tan, B.; Kamal, S.; Xiong, X. Multilayer hybrid deep-learning method for waste classification and recycling. Comput. Intell. Neurosci. 2018, 2018, 5060857. [Google Scholar] [CrossRef] [PubMed]
  28. Shahab, S.; Anjum, M. Solid waste management scenario in india and illegal dump detection using deep learning: An AI approach towards the sustainable waste management. Sustainability 2022, 14, 15896. [Google Scholar] [CrossRef]
  29. Shi, C.; Tan, C.; Wang, T.; Wang, L. A waste classification method based on a multilayer hybrid convolution neural network. Appl. Sci. 2021, 11, 8572. [Google Scholar] [CrossRef]
  30. Fasana, C.; Pasini, S. Learning to Detect Illegal Landfills in Aerial Images with Scarce Labeling Data. 2022. Available online: https://hdl.handle.net/10589/196992 (accessed on 20 December 2022).
  31. Torres, R.N.; Fraternali, P. AerialWaste dataset for landfill discovery in aerial and satellite images. Sci. Data 2023, 10, 63. [Google Scholar] [CrossRef]
  32. Yu, X.; Chen, Z.; Zhang, S.; Zhang, T. A street rubbish detection algorithm based on Sift and RCNN. In Proceedings of the MIPPR 2017: Automatic Target Recognition and Navigation, Xiangyang, China, 19 February 2018; pp. 97–104. [Google Scholar] [CrossRef]
  33. Niu, B.; Feng, Q.; Yang, J.; Chen, B.; Gao, B.; Liu, J.; Li, Y.; Gong, J. Solid waste mapping based on very high resolution remote sensing imagery and a novel deep learning approach. Geocarto Int. 2023, 38, 2164361. [Google Scholar] [CrossRef]
  34. Altikat, A.; Gulbe, A.; Altikat, S. Intelligent solid waste classification using deep convolutional neural networks. Int. J. Environ. Sci. Technol. 2022, 19, 1285–1292. [Google Scholar] [CrossRef]
  35. Li, N.; Chen, Y. Municipal solid waste classification and real-time detection using deep learning methods. Urban Clim. 2023, 49, 101462. [Google Scholar] [CrossRef]
  36. Cordts, M.; Omran, M.; Ramos, S.; Rehfeld, T.; Enzweiler, M.; Benenson, R.; Franke, U.; Roth, S.; Schiele, B. The cityscapes dataset for semantic urban scene understanding. In Proceedings of the IEEE Conference on Computer Vision and Pattern Recognition, Las Vegas, NV, USA, 27–30 June 2016; pp. 3213–3223. [Google Scholar] [CrossRef]
  37. Brostow, G.J.; Fauqueur, J.; Cipolla, R. Semantic object classes in video: A high-definition ground truth database. Pattern Recognit. Lett. 2009, 30, 88–97. [Google Scholar] [CrossRef]
  38. Neuhold, G.; Ollmann, T.; Rota Bulo, S.; Kontschieder, P. The mapillary vistas dataset for semantic understanding of street scenes. In Proceedings of the IEEE International Conference on Computer Vision, Venice, Italy, 22–29 October 2017; pp. 4990–4999. [Google Scholar] [CrossRef]
  39. Ogunrinde, I.; Bernadin, S. A review of the impacts of defogging on deep learning-based object detectors in self-driving cars. SoutheastCon 2021, 2021, 01–08. [Google Scholar] [CrossRef]
  40. He, K.; Zhang, X.; Ren, S.; Sun, J. Deep residual learning for image recognition. In Proceedings of the IEEE Conference on Computer Vision and Pattern Recognition, Las Vegas, NV, USA, 26 June–1 July 2016; pp. 770–778. [Google Scholar] [CrossRef]
  41. Chen, F.; Wu, F.; Xu, J.; Gao, G.; Ge, Q. Adaptive deformable convolutional network. Neurocomputing 2021, 453, 853–864. [Google Scholar] [CrossRef]
  42. Sandler, M.; Howard, A.; Zhu, M.; Zhmoginov, A.; Chen, L. Mobilenetv2: Inverted residuals and linear bottlenecks. In Proceedings of the IEEE Conference on Computer Vision and Pattern Recognition, Salt Lake City, UT, USA, 18–22 June 2018; pp. 4510–4520. [Google Scholar] [CrossRef]
  43. Yu, C.; Gao, C.; Wang, J.; Yu, G.; Shen, C.; Sang, N. Bisenet v2: Bilateral network with guided aggregation for real-time semantic segmentation. Int. J. Comput. Vis. 2021, 129, 3051–3068. [Google Scholar] [CrossRef]
  44. Qi, J.; Nguyen, M.; Yan, W. Waste classification from digital images using ConvNeXt. In Image and Video Technology: Proceedings of the 10th Pacific-Rim Symposium, PSIVT 2022, Virtual Event, 12–14 November 2022; Springer International Publishing: Cham, Switzerland, 2022; pp. 1–13. [Google Scholar] [CrossRef]
  45. Minaee, S.; Boykov, Y.; Porikli, F. Image segmentation using deep learning: A survey. IEEE Trans. Pattern Anal. Mach. Intell. 2021, 44, 3523–3542. [Google Scholar] [CrossRef]
  46. Hong, Y.; Pan, H.; Sun, W.; Jia, Y. Deep dual-resolution networks for real-time and accurate semantic segmentation of road scenes. arXiv 2021, arXiv:2101.06085. [Google Scholar] [CrossRef]
  47. Chen, L.C.; Zhu, Y.; Papandreou, G.; Schroff, F.; Adam, H. Encoder-decoder with atrous separable convolution for semantic image segmentation. In Computer Vision—ECCV 2018: Proceedings of the 15th European Conference, Munich, Germany, 8–14 September 2018; Lecture Notes in Computer Science (including subseries Lecture Notes in Artificial Intelligence and Lecture Notes in Bioinformatics); Springer International Publishing: Cham, Switzerland, 2018; Volume 11211 LNCS, pp. 833–851. [Google Scholar] [CrossRef]
  48. Ronneberger, O.; Fischer, P.; Brox, T. U-net: Convolutional networks for biomedical image segmentation. In Medical Image Computing and Computer-Assisted Intervention—MICCAI 2015: Proceedings of the 18th International Conference, Munich, Germany, 5–9 October 2015; Lecture Notes in Computer Science (including subseries Lecture Notes in Artificial Intelligence and Lecture Notes in Bioinformatics); Springer International Publishing: Cham, Switzerland, 2015; Volume 9351, pp. 234–241. [Google Scholar] [CrossRef]
  49. Chao, P.; Kao, C.-Y.; Ruan, Y.-S.; Huang, C.-H.; Lin, Y. Hardnet: A low memory traffic network. In Proceedings of the IEEE/CVF International Conference on Computer Vision, Seoul, Republic of Korea, 27 October–2 November 2019; pp. 3552–3561. [Google Scholar] [CrossRef]
  50. Peng, C.; Zhang, X.; Yu, G.; Luo, G.; Sun, J. Large kernel matters–improve semantic segmentation by global convolutional network. In Proceedings of the IEEE Conference on Computer Vision and Pattern Recognition, Honolulu, HI, USA, 21–26 July 2017; pp. 4353–4361. [Google Scholar] [CrossRef]
  51. Zhou, Z.; Siddiquee, M.M.R.; Tajbakhsh, N.; Liang, J. UNet++: Redesigning Skip Connections to Exploit Multiscale Features in Image Segmentation. IEEE Trans. Med. Imaging 2020, 39, 1856–1867. [Google Scholar] [CrossRef]
  52. Zhu, X.; Cheng, Z.; Wang, S. Coronary angiography image segmentation based on PSPNet. Comput. Methods Programs Biomed. 2021, 200, 105897. [Google Scholar] [CrossRef] [PubMed]
  53. Lee, J.; Kim, D.; Ponce, J.; Ham, B. Sfnet: Learning object-aware semantic correspondence. In Proceedings of the IEEE/CVF Conference on Computer Vision and Pattern Recognition, Long Beach, CA, USA, 15–20 June 2019; pp. 2278–2287. [Google Scholar] [CrossRef]
  54. Xie, E.; Wang, W.; Yu, Z.; Anandkumar, A.; Alvarez, J.M.; Luo, P. SegFormer: Simple and efficient design for semantic segmentation with transformers. Adv. Neural Inf. Process. Syst. 2021, 34, 12077–12090. [Google Scholar] [CrossRef]
  55. Aleissaee, A.; Kumar, A.; Anwer, R.; Khan, S.; Cholakkal, H. Transformers in remote sensing: A survey. Remote Sens. 2023, 15, 1860. [Google Scholar] [CrossRef]
Figure 1. Study area.
Applsci 14 02084 g001
Figure 2. Example of RSD Dataset.
Applsci 14 02084 g002
Figure 3. Structure of the SWM.
Applsci 14 02084 g003
Figure 4. Backbone and segmentation head of the SWM.
Applsci 14 02084 g004
Figure 5. Squeeze Block of SWM.
Applsci 14 02084 g005
Figure 6. Segmentation results in building and road scenes.
Applsci 14 02084 g006
Figure 7. Segmentation results in river and forest scenes.
Applsci 14 02084 g007
Figure 8. Segmentation results in road and grassland scenes.
Applsci 14 02084 g008
Figure 9. Segmentation results in diverse scenes.
Applsci 14 02084 g009
Figure 10. Overall monitoring results of the study area.
Applsci 14 02084 g010
Figure 11. Governance results.
Applsci 14 02084 g011
Table 1. Results of Ablation Study.
MethodBackbone +
Head
Context Spatial FusionF1OARecPrec
A 85.79192.97283.91587.752
B 87.86993.95686.57489.203
C 88.14294.12386.39289.964
D 88.56494.24588.14688.986
E88.87594.39088.62689.125
Table 2. Accuracy comparison of methods.
MethodF1 (%)OARecPrec
PSPNet81.38790.98577.95685.134
DAnet83.07691.63281.2385.008
DDRNet83.24691.54683.06883.424
BiSeNetv284.48292.41381.68387.479
SegFormer85.11392.71982.31888.104
FCHarDNet85.18992.71382.88987.62
ConvNeXt85.28692.73883.23987.436
UNet85.38992.86582.45788.537
Deeplabv3plus85.84393.03783.49588.328
SFNet86.09493.16283.72488.602
SwinTransformer86.17393.07185.40586.956
NestedUnet86.57293.50582.80390.701
GCN87.68393.88586.08789.34
SWM88.87594.39088.62689.125
Disclaimer/Publisher’s Note: The statements, opinions and data contained in all publications are solely those of the individual author(s) and contributor(s) and not of MDPI and/or the editor(s). MDPI and/or the editor(s) disclaim responsibility for any injury to people or property resulting from any ideas, methods, instructions or products referred to in the content.

