Abstract
The Xiaojiang watershed in Luxi, Yunnan, is a typical rocky desertification area, in which karst groundwater pollution is severe and water resources are scarce. This article takes the watershed as an example and investigates the response mechanisms of surface karst spring water quality to agricultural pollution in rocky desertification areas. Specifically, the study was conducted as follows: (I) A total of 108 water samples from 54 sources were collected during the dry and wet seasons for analysis. (i) Principal component and correlation analyses identified the main pollution indicators in the soil surface karst zone of the area, including total bacterial count, total coliforms, COD, pH, and redox potential. (ii) It was also discovered that surface soil, impacted by agricultural activities, directly contributes to groundwater pollution in the soil surface karst zone. (II) Local soil was used to prepare soil columns under various conditions for simulation. The findings indicate: (i) Temperature significantly affects the surface karst springs, with higher temperatures leading to more pronounced water quality responses, increased enrichment of pathogen-microbiota indicators, and degraded water quality. (ii) Soil porosity substantially influences the water quality of surface karst springs. Increased porosity results in looser soil, more oxidizing conditions in the storage matrix, reduced pathogen-microbiota development, and consequently, less water pollution. This study offers theoretical and technical references for evaluating, monitoring, and issuing early warnings for pathogenic bacteria-microbiota pollution in groundwater in rocky desertification areas.
1. Introduction
Southwest China hosts the world’s largest exposed karst region, where karst water resources, totaling 2039.67 × 10⁴ m³/year, comprise 23.39% of the nation’s groundwater [1]. However, challenges such as high population density, uneven spatial and temporal distribution of these resources, intricate storage and burial dynamics, and significant pollution reduce per capita water availability [2,3]. Karst areas, characterized by rocky desertification, present a complex and diverse range of underground water pollution. This leads to a highly sensitive and vulnerable groundwater system, which is particularly susceptible to pathogen-microbiota pollution [4,5]. Research indicates that pathogen-microbiota indicators in groundwater are not merely detrimental to human health but also potentially harbor or transmit other harmful microbes. These indicators serve as proxies for microbial viruses posing threats to human health [6,7,8,9]. Consequently, investigating the response changes of pathogen-microbiota indicators in groundwater within rocky desertification areas holds substantial theoretical and practical significance.
The soil–water matrix environment plays a pivotal role in exploring the response mechanisms of groundwater to pathogen-microbiota pollution. The sequence of interactions, spanning from groundwater contamination through infiltration to microbial pollution, culminates in the response of pathogen toxicology indicators. This sequence is intimately linked with the evolutionary processes of microbes [4,5].
Soil, as a three-phase porous medium, exhibits substantial purification capabilities attributed to its unique structure and the presence of mineral ions. Within this porous matrix environment, the evolution and migration of groundwater microbes are influenced by the soil’s self-purification capacities, which play a crucial role in retaining microbes, thereby substantially diminishing the microbial content that enters the groundwater [10,11]. The factors affecting microbial evolution in soil solid porous media can be classified into three categories: microbial factors, soil medium factors, and soil environmental factors [12,13].
Microbial factors encompass the microbe type, strain size, surface charge, hydrophobicity, and chemotactic nature of the community. The surface charge of microbes significantly influences their adsorption within the soil–water matrix environment [14]. Moreover, their migration and attenuation are associated with factors such as microbial type [8,15,16,17], surface hydrophobicity [18], individual size [19], community chemotaxis [12,20], and population heterogeneity [21,22].
Soil medium factors encompass soil particle size, pore structure, moisture content, mineral composition, and overall content. The dynamics of solute movement in the soil–water matrix environment adhere to mechanisms such as interception, leaching, and physicochemical filtration, as delineated in previous studies [23,24]. The ionic content of clay minerals demonstrates pronounced adsorption [25,26] and desorption [27,28] effects on microbes. Microbial mobility is enhanced in larger pores [29,30]. An increase in moisture content correlates with greater microbial retention [29,31], and smaller effective particle sizes are associated with higher microbial retention [32,33,34].
Soil environmental factors encompass pH, temperature, flow rate, and ionic strength. Within certain limits, elevated temperatures enhance the activity of microbial pathogens [35,36]. The migration capacity of microbes notably increases with the environmental pH [11,13]. Enhanced hydrodynamic conditions facilitate microbial migration capacity while diminishing retention effects [32,36]. An increased ion concentration amplifies microbial migration and penetration capabilities [37,38]. However, molecular diffusion effects are generally inconsequential in most microbial transport processes [39,40].
In summary, both domestic and international experts and scholars have extensively researched the response mechanisms, evolutionary processes, and patterns of pathogen-microbiota in the soil–water matrix environment. However, the response evolution of groundwater pathogen-microbiota indicators involves a complex interplay between the matrix environment and the microbes themselves. The mechanisms of response under varying conditions remain intricate, with many aspects still obscure, underscoring the need for in-depth exploration. Therefore, a water quality analysis of surface karst springs in a rocky desertification area was conducted through field sampling and laboratory tests in this paper, which provided theoretical and technical references for exploring the response mechanisms of pathogenic bacteria and microorganisms in groundwater in a rocky desertification area, which is of great scientific significance.
2. Materials and Methods
The Xiaojiang Watershed, situated in southeastern Yunnan Province (Figure 1), features a terrain that descends from the northeastern highlands to the southwestern lowlands, extending northeasterly over an area of approximately 1009.28 km². It has a population of 200,400. This watershed exemplifies a typical independent karst water system, encompassing comprehensive processes of recharge, flow, and discharge. The area is marked by thin surface soil, sparse vegetation, pronounced karst geological structures, extensive fractures, and complex hydrogeological formations [1,2,5]. Given that surface karst springs are a vital source of drinking water in the region, analyzing the response of pathogenic microbes to the water quality of these springs within the typical rocky desertification context of the Xiaojiang Watershed is of substantial practical importance.
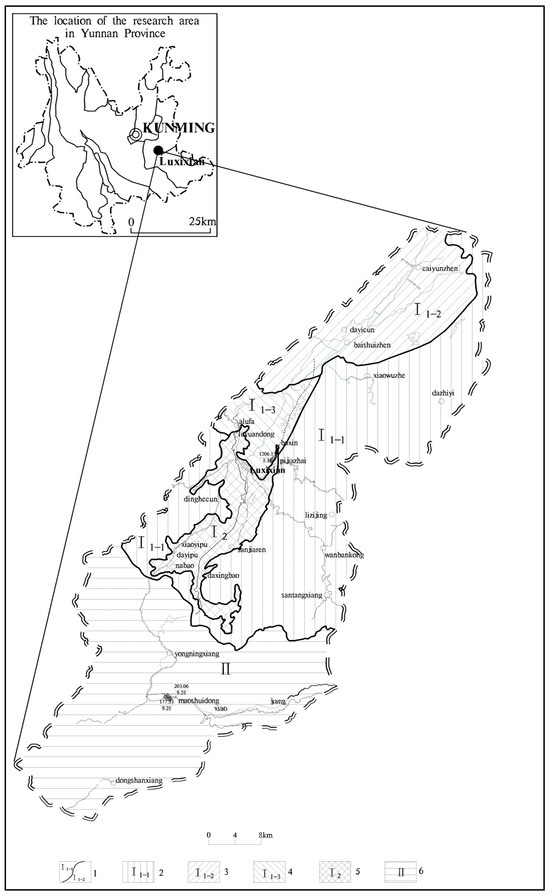
Figure 1.
Hydrogeological zoning map: (1) hydrogeological zoning boundaries; (2) surrounding rocks outside karst basins in mountainous areas (I1–1); (3) upstream karst basin, karst hilly plateau trough valley area (I1–2); (4) karst peak cluster and depression areas around the basin bottom (I1–3); (5) basin bottom covered karst discharge runoff area (I2); (6) Xiaojiang karst valley (II).
The surface spring is located in Wanbankong Village, Santang Township, Luxi County. The village now has a population of more than 900 people, who mainly farm. The upper layer of the surface spring is a shallow surface karst aquifer of pure carbonate rock with a high degree of rock fissures. The physical and biological weathering and the karst process form a large number of karst voids, such as dissolved pores and network dissolved gaps. The atmospheric precipitation seeps into the surface karst water through the solution holes and gaps, and the karst runoff seeps into the surface to form the surface spring, where the aquifer and the bottom water-barrier layer are exposed [1,2,3,5].
2.1. Field Sampling
Following comprehensive field surveys, a total of 108 water samples were collected from 54 sources within the basin. This included 18 natural spring outlets, 13 rivers, 12 reservoirs, and 11 wells, during both the dry and wet seasons. The spatial distribution of these sampling points is depicted in Figure 2. The field sampling adhered strictly to the technical specifications presented in [41]. Subsequent analyses of these samples were carried out by the Testing Center of the Institute of Hydrogeology and Environmental Geology at the Chinese Academy of Geological Sciences, Ministry of Natural Resources. This analysis followed the Standard Examination Methods [42].
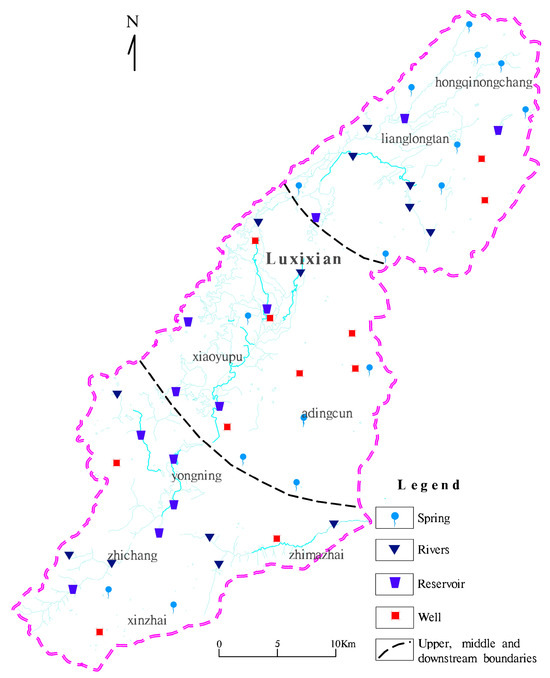
Figure 2.
Research area watershed scope and sampling layout map.
2.2. Soil Column Experiment
Undisturbed soil samples were collected from various depths within the soil surface karst zone of the Xiaojiang Watershed. Indoor density was measured using the ring knife method, volume was measured using the wire method, moisture content was measured using the weighing method, and specific gravity was measured using the heavy bottle method to obtain the basic physical parameters of the undisturbed soil (Figure 3). To replicate the natural conditions of the soil surface karst zone soil layers in the Xiaojiang Watershed, taking local undisturbed soil, from the surface to the bedrock depth, we packed the undisturbed soil per 10 cm layers. After returning to the laboratory, the 60 cm soil column was filled according to the same physical parameters (density, porosity, moisture content, etc.) of the in situ soil (every 10 cm depth corresponds to the same layer). Additionally, outlets were strategically installed at 10 cm intervals along the side of the column to facilitate the study [43,44,45].
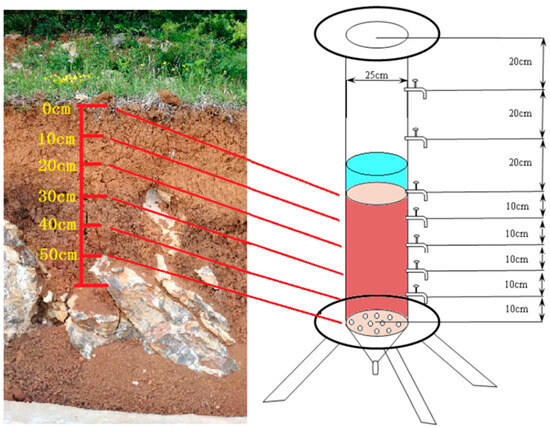
Figure 3.
The indoor soil column experiment simulated in situ permeation.
2.3. Experimental Conditions
Informed by the annual temperature variation chart of the Xiaojiang Watershed and the distribution range of physical and mechanical indicators of the soil surface karst zone soil (Table 1 and Table 2), temperature and porosity rate, as controllable conditions, were chosen as variables. Experimental setups, representing different levels of these factors, were established to conduct indoor simulated in situ soil water environment percolation process experiments.

Table 1.
The monthly average temperature in the research area over many years.
Table 2.
The experimental condition table.
According to weather data from 1958 to 2023, the average annual temperature in the Xiaojiang River Basin is 19.5 °C, with an annual temperature of ≥9.5 °C. The coldest month is January, with an average monthly temperature of 9.5 °C, while the hottest month is July, with an average monthly temperature of 29 °C. Therefore, the indoor test temperature conditions are set at 10 °C, 20 °C, and 30 °C.
2.4. Sampling and Analyses
Water samples were systematically collected from various depths (10 cm, 20 cm, 30 cm, 40 cm) of the soil column outlets at predetermined intervals: 0, 1, 3, 6, 10, 15, 21, 28, 35, 42, 49, and 56 days. In the case of orthogonal experiments, wastewater samples were specifically gathered at different depths on days 7 and 9. These samples were secured in 100 mL sterile glass bottles and subsequently stored at 4 °C. The water samples underwent testing for pH, redox potential, COD, total bacterial count, total coliform count, and other physical, chemical, and microbiological indicators of groundwater, in accordance with the Standard Examination Methods [42].
2.5. Statistical Evaluation
The water quality of the field water samples was analyzed completely. Data analysis was conducted using the Nemero index method (Equations (1) and (2)), and the water quality comprehensive grade of each water source was calculated (Table 3).
where Pi is the single-factor pollution index, Ci is the single-factor pollution measured value, and Si is the single-factor pollution evaluation standard value.
where is the composite pollution index, is the single-factor index average, and Pimax is the maximum value of the single-factor index.
Table 3.
Water quality comprehensive pollution grade classification standard.
Then, the data analysis was conducted using Origin Pro 8 and SPSS 19 statistical software, and water quality indexes obtained from indoor soil column experiments were collected. Aiming at pathogen-microorganism (total bacterial community and total Escherichia coli), correlations, variances, significance, distribution characteristics, and consistency, tests of the data were calculated. A threshold of ≤0.05 was set for the consistency test to ensure statistical significance.
3. Results
3.1. Determination of Pollution Indicators
Utilizing pre-human-engineering-activity baseline values from the basin, pollution indicators for karst water quality at 54 water source locations were established based on test results (Table S1). These results were derived from seven water sources in the study area, which included seven population drinking water source areas (Baishuitang, Yanjinggou, Wuzhe Shuiku, Zuyuandi, Aobushan, Wulang Haizi), as well as one karst spring water source (Pijiazhai Daquan). The establishment of these baselines followed the guidelines of the report presented in [43] in conjunction with the Standard Examination Methods [42].
The Nemero index method was used to calculate the degree of water pollution and the water quality grade in the study area (Figure 4). The results are as follows:
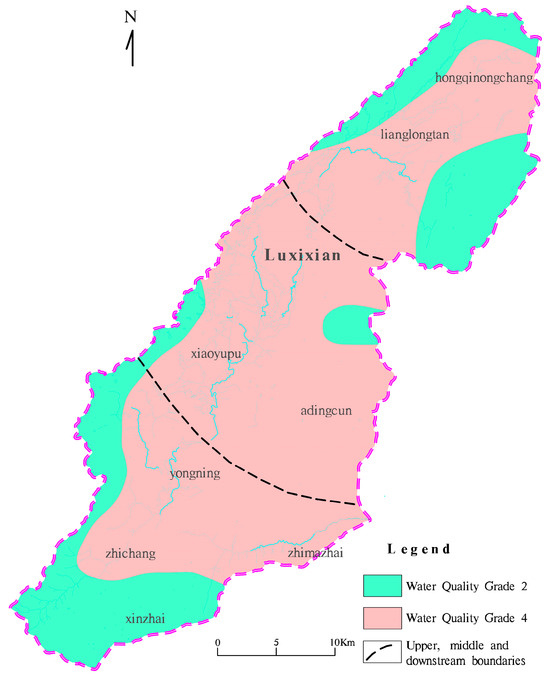
Figure 4.
Research area watershed scope and water quality.
(i) The value of Pi was calculated, and the contribution degree of the water quality grade was analyzed. The identified pollution indicators include total bacterial count, total coliforms, total hardness (CaCO3), HCO3−, oxygen demand (COD), pH, Ca2+, Mg2+, chroma, odor, visible objects, and turbidity, ordered by their individual factor contribution. Collectively, the first eight factors account for 89.82% of the cumulative pollution affecting the water quality in the area.
Notably, total hardness (CaCO3), HCO3−, oxygen demand (COD), pH, Ca2+, Mg2+, chroma, odor, visible objects, and turbidity align with the chemical characteristics of carbonate rocks in rocky desertification karst areas [43]. In addition, ORP as a comprehensive water quality indicator should also be considered. Consequently, the laboratory experiments prioritized pathogen-microbes (total bacterial count, total coliforms), COD, and pH as the target characteristic pollution indicators.
(ii) Under the influence of long-term agricultural activity, the thin surface soil layer not only fails to purify surface water but also acts as a repository for pollution. Field surveys revealed that the primary sources of karst groundwater pollution in the area are domestic sewage, livestock breeding, and agricultural cultivation, which significantly pollute both water resources and soil layers.
3.2. Temperature Variations and Karst Groundwater Quality Indicator Responses
3.2.1. Changes in pH of Groundwater at Various Depths under Different Temperature Conditions
Indoor experiments at different temperatures measured the pH values of groundwater at various depths, as shown in Table 4 and Figure 5.
Table 4.
The pH values of groundwater under different temperature and depth conditions.
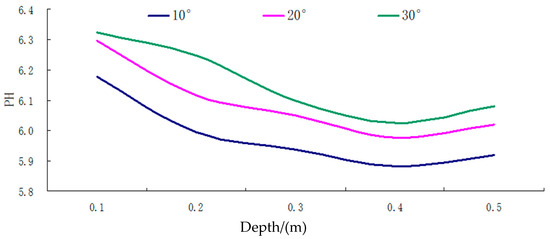
Figure 5.
The pH curve of different depth of groundwater under different temperature conditions.
(i) As shown in the results, under varying temperature conditions, the pH value of groundwater in the soil surface karst zone exhibited fluctuations within the range of 5.88–6.32, typically demonstrating acidic characteristics. The variation range was relatively narrow at 0.44, indicating modest fluctuation levels.
(ii) As demonstrated in Figure 5, across the entire soil surface karst zone, the overall trend shows that the groundwater pH tends to decrease with increasing soil depth. However, this rate of change gradually diminishes, reaching an extreme value at a depth of 0.4 m. This is followed by a slight upward fluctuation between 0.4 m and 0.5 m, although the extent of this increase is minimal.
(iii) The pH value of karst groundwater tends to increase with higher temperatures, exhibiting smaller fluctuations and a tendency towards stability. Conversely, in winter, with the lowest temperatures, groundwater pH reaches its minimum value.
3.2.2. Changes in ORP (Oxidation-Reduction Potential) of Groundwater at Various Depths under Different Temperature Conditions
In the experiments conducted under varying temperature conditions, the oxidation-reduction potential (ORP) values of groundwater were measured at different depths. The results of these measurements are detailed in Table 5 and Figure 6.
Table 5.
The ORP values of different depths of groundwater under different temperature conditions.
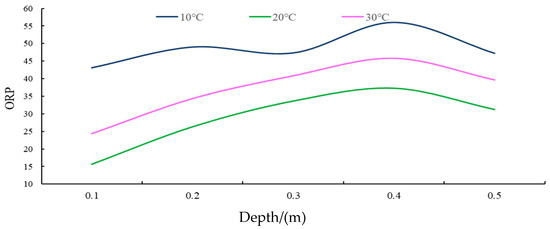
Figure 6.
The ORP curve for different depths of groundwater under different temperature conditions.
(i) As shown in the results, under varying temperature conditions, the ORP (oxidation-reduction potential) values in the groundwater of the soil surface karst zone exhibited a range of fluctuation between 15.67 and 56.00. This range suggests an overall low potential and strong reduction characteristic, with a variation extent of 40.33, indicating considerable and unstable fluctuations.
(ii) As demonstrated in Figure 6, the general trend in the ORP values of groundwater across the entire soil surface karst zone is an increase with greater soil depth, signifying a decrease in reduction and an increase in oxidation. Nevertheless, this rate of change gradually decreases, peaking at a depth of 0.4 m. Beyond this point, a minor decreasing fluctuation trend is observed between 0.4 and 0.5 m depth, though the extent of this decline is minimal.
(iii) Under different temperature conditions, lower temperatures correlate with higher karst groundwater ORP, displaying minimal fluctuations and a tendency towards stability. Conversely, with the highest temperatures, groundwater ORP shows the most significant fluctuations and is least stable.
3.2.3. Changes in COD (Chemical Oxygen Demand) of Groundwater at Various Depths under Different Temperature Conditions
Indoor experiments at different temperatures measured the chemical oxygen demand (COD) values of groundwater at various depths, as shown in Table 6 and Figure 7.
Table 6.
The COD values of different depths of groundwater under different temperature conditions.
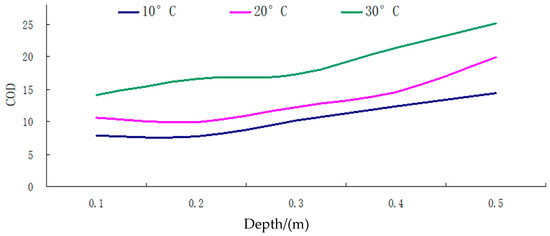
Figure 7.
The COD curve for different depths of groundwater under different temperature conditions.
(i) As shown in the results, under various temperature conditions, the chemical oxygen demand (COD) values of groundwater in the soil surface karst zone demonstrated fluctuations between 7.74 and 25.15, with a range of 17.41. This significant fluctuation indicates that the groundwater in this karst surface zone generally exhibits high chemical oxygen demand and is substantially polluted.
(ii) As demonstrated in Figure 7, the overall trend of COD values throughout the soil surface karst zone tends to increase with increasing soil depth, displaying a generally linear positive correlation.
(iii) At consistent temperature conditions, with a temperature rise, the COD values in karst groundwater increase, exhibiting more significant fluctuations and instability. When temperatures reach their lowest, groundwater COD values are at their minimum, with the smallest fluctuations, indicating greater stability.
3.2.4. Changes in TBC (Oxidation-Reduction Potential) of Groundwater at Various Depths under Different Temperature Conditions
Indoor experiments under different temperature conditions measured the total bacterial count (TBC) values of groundwater at various depths, as shown in the Table 7 and Figure 8.
Table 7.
The TBC of different depths of groundwater under different temperature conditions.
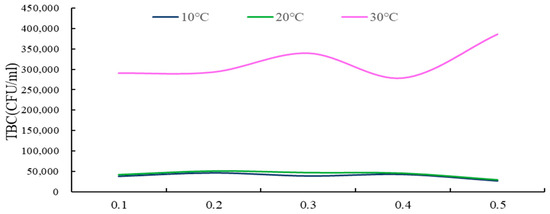
Figure 8.
The TBC curve for different depths of groundwater under different temperature conditions.
(i) As shown in the results, under varying temperature conditions, the total bacterial count (TBC) value range of groundwater in the soil surface karst zone was observed to fluctuate between 26,900 and 386,667, with a substantial range of 359,767, indicating significant fluctuations. This suggests that the groundwater in this karst surface zone is subject to severe TBC exceedance, indicative of serious microbial pollution.
(ii) As demonstrated in Figure 9, across the entire soil surface karst zone soil layer, at lower temperatures, there is a general trend of decreasing groundwater TBC values with increasing soil depth, although the range of this change is quite minimal. Conversely, at higher temperatures, the overall trend is for groundwater TBC values to disperse more with increasing soil depth.
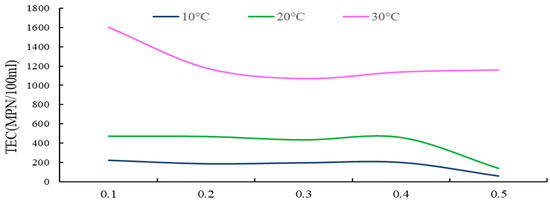
Figure 9.
The TEC curve for different depths of groundwater under different temperature conditions.
(iii) Under different temperature scenarios, with the summer temperature rise, karst groundwater TBC values increase, displaying larger fluctuations and more instability. When temperatures are at their lowest, groundwater TBC values reach their minimum and exhibit the smallest fluctuations, indicating greater stability.
3.2.5. Changes in TEC (Total Escherichia coli) of Groundwater at Various Depths under Different Temperature Conditions
Indoor experiments under different temperature conditions measured the total Escherichia coli (TEC) values of groundwater at various depths, as indicated in Table 8 and Figure 9.
Table 8.
The TEC of different depths of groundwater under different temperature conditions.
(i) As shown from the results, under diverse temperature conditions, the total E. coli count (TEC) values in the groundwater of the soil surface karst zone exhibited fluctuations between 60 and 1600, with a range of 1540. This substantial fluctuation indicates that the groundwater in this karst surface zone experiences severe TEC exceedance, signifying serious microbial pollution.
(ii) As demonstrated in Figure 9, throughout the entire soil surface karst zone soil layer, at lower temperatures, the general trend shows a decrease in groundwater TEC values with increasing soil depth, although the range of this change is relatively minor. At higher temperatures, groundwater TEC values initially decrease and then tend to stabilize as soil depth increases.
(iii) Under different temperature scenarios, with the summer temperature rise, karst groundwater TEC values increase, demonstrating larger fluctuations and more instability. When temperatures are at their lowest, groundwater TEC values reach their minimum, with the least fluctuation, indicating greater stability.
3.3. Response of Karst Groundwater Quality Indicators to Changes in Porosity
3.3.1. Changes in pH of Groundwater at Various Depths under Different Porosity Conditions
Indoor experiments under different porosity conditions of undisturbed soil tested the pH values of groundwater at various depths, as indicated in Table 9 and Figure 10.
Table 9.
The pH of different depths of groundwater under different porosity conditions.
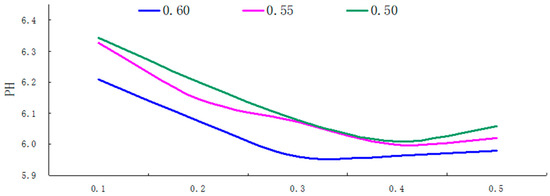
Figure 10.
The PH curve for different depths of groundwater under different porosity conditions.
(i) As shown in the results, in the soil surface karst zone under various porosity conditions, the pH value range of groundwater exhibited fluctuations between 5.91 and 6.29, typically acidic, with a fluctuation range of 0.38, indicating relatively minor fluctuations.
(ii) Within the soil layer of the surface karst zone, with smaller porosity, karst groundwater pH values tend to increase, exhibiting greater fluctuations and more instability.
(iii) As demonstrated in Figure 10, throughout the entire soil surface karst zone, the general trend of groundwater pH values showed a tendency to decrease with increasing soil depth. The change was approximately linear in the 0.1−0.3 m depth range, reaching extreme values at a depth of 0.3 m under varying porosity rates. This was followed by a slight upward fluctuation trend with increasing soil depth, although the magnitude of this rise was quite minimal.
3.3.2. Changes in ORP (Oxidation-Reduction Potential) of Groundwater at Various Depths under Different Porosity Conditions
Indoor experiments under different soil porosity conditions tested the oxidation-reduction potential (ORP) values of groundwater at various depths, as indicated in Table 10 and Figure 11.
Table 10.
The ORP values of different depths of groundwater under different porosity conditions.
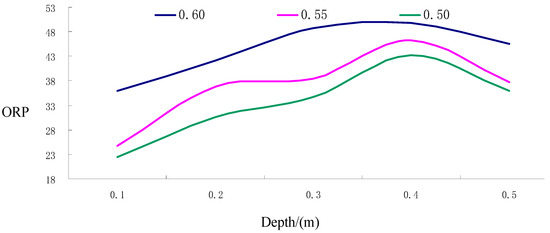
Figure 11.
The ORP curve for different depths of groundwater under different porosity conditions.
(i) As shown from the results, in the soil surface karst zone with varying porosity rates, the oxidation-reduction potential (ORP) values of groundwater fluctuated between 22.50 and 49.72, indicative of overall low potential and strong oxidizing conditions. The variation range of 27.22 suggests substantial and unstable fluctuations.
(ii) Within the soil layer of the soil surface karst zone, the smaller the porosity results in minimized groundwater ORP values and secondary stability, exhibiting greater fluctuations and more instability.
(iii) As demonstrated in Figure 11, across the entire soil surface karst zone, the general trend is for groundwater ORP values to increase with increasing soil depth, although the rate of change gradually diminishes. An extreme value is observed at a depth of 0.4 m, followed by a minor downward fluctuation trend between 0.4 and 0.5 m depth; however, the extent of this downward fluctuation is minimal.
3.3.3. Changes in COD (Chemical Oxygen Demand) of Groundwater at Various Depths under Different Porosity Conditions
Indoor experiments under different soil porosity conditions tested the chemical oxygen demand (COD) values of groundwater at various depths, as indicated in Table 11 and Figure 12.
Table 11.
The COD values of different depths of groundwater under different porosity conditions.
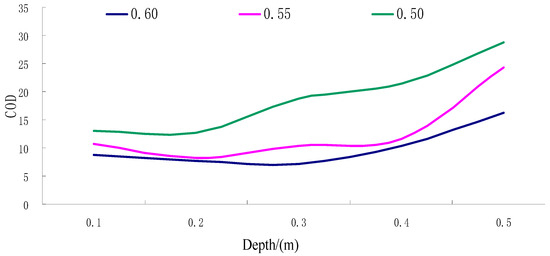
Figure 12.
The COD curve for different depths of groundwater under different porosity conditions.
(i) As shown from the results, in the soil surface karst zone with different porosity rates, the range of chemical oxygen demand (COD) values in groundwater fluctuated between 7.19 and 28.78, with a variance of 21.59. This significant fluctuation suggests that the groundwater in this karst surface zone generally has a high COD, indicative of substantial pollution.
(ii) In the soil surface karst zone soil layer, with smaller porosity, the fluctuations in groundwater COD values are also reduced, indicating increased stability.
(iii) As demonstrated in Figure 12, throughout the entire soil surface karst zone, the overall trend shows that groundwater COD values tend to increase with increasing soil depth, exhibiting a non-linear positive correlation.
3.3.4. Changes in TBC (Total Bacterial Count) of Groundwater at Various Depths under Different Porosity Conditions
Indoor experiments under different soil porosity conditions tested the total bacterial count (TBC) of groundwater at various depths, as indicated in Table 12 and Figure 13.
Table 12.
The TBC values of different depths of groundwater under different porosity conditions.
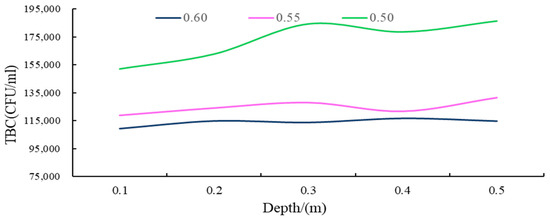
Figure 13.
The TBC curve for different depths of groundwater under different porosity conditions.
(i) As shown in the results, in the soil surface karst zone, under varying porosity rates, the Total Bacterial Count (TBC) values of groundwater fluctuated between 109,275 and 186,367 CFU/mL, with a range of 77,092. These significant fluctuations suggest that the groundwater in this karst surface zone generally experiences severe TBC exceedance, indicative of serious microbial pollution.
(ii) Within the soil layer of the soil surface karst zone, with smaller porosity, the groundwater TBC values increase, with the average being approximately 1.5 times higher than in looser soil layers, and fluctuations are larger and more unstable.
(iii) As demonstrated in Figure 13, across the entire soil surface karst zone, as soil becomes denser or the soil particle size decreases, the general trend is for groundwater TBC values to increase with increasing soil depth, typically exhibiting non-linear changes. In contrast, when the soil layer is looser or the soil particle size is larger, changes in groundwater TBC values with increasing depth are relatively smaller.
3.3.5. Changes in TEC (Total Escherichia coli) of Groundwater at Various Depths under Different Porosity Conditions
Indoor experiments under different soil porosity conditions tested the total Escherichia coli (TEC) values of groundwater at various depths, as indicated in Table 13 and Figure 14.
Table 13.
The TEC values of different depths of groundwater under different porosity conditions.
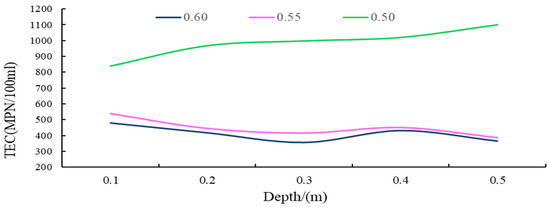
Figure 14.
The TEC curve for different depths of groundwater under different porosity conditions.
(i) As shown in the results, in the soil surface karst zone, under varying porosity rates, the total E. coli count (TEC) values in groundwater fluctuated between 357 and 1100 MPN/100 mL, with a variance of 743. This significant fluctuation suggests that the groundwater in this karst surface zone typically experiences severe TEC exceedance, indicative of serious microbial pollution.
(ii) As demonstrated in Figure 14, throughout the entire soil surface karst zone, as soil becomes denser or the particle size decreases, the general trend is for groundwater TEC values to increase with increasing soil depth, displaying predominantly non-linear changes. Conversely, in conditions where the soil layer is looser or the soil particle size is larger, the changes in groundwater TEC values with increasing depth are relatively smaller, and the fluctuations are less pronounced.
(iii) Within the soil layer of the soil surface karst zone, with smaller porosity, the groundwater TEC values increase, with the average being approximately 2.4 times higher than in looser soil layers, and fluctuations are larger and more unstable.
4. Discussion and Conclusions
4.1. Water Quality and Pollution Status
In the study area, exposed bedrock, developed cracks, thin surface rooted soil zone, sparse vegetation, uneven annual rainfall, and strong monsoon effect lead to uneven distribution of groundwater resources in the inland basin in terms of morphology and burial, contributing to severe rocky desertification, water scarcity, and notable pollution. The primary pollution sources in the basin include dispersed domestic waste, farmyard manure application in fields, and unregulated livestock farming, leading to a high concentration of total bacterial count, total coliforms, and other microbes in the soil. The research focused on identifying primary pollution indicators in the soil surface karst zone of the study area, including total bacterial count, total coliforms, COD, pH, and oxidation-reduction potential. It was observed that under long-term agricultural activity, the thin surface soil layer serves as a direct source of pollution for groundwater in the soil surface karst zone. The uneven distribution of water resources, combined with intense pollution and the local residents’ limited awareness of water resource conservation, has resulted in significant ecological degradation.
4.2. The Temperature and Porosity Effects on Groundwater Quality
The results of the present study have demonstrated that temperature was the most significant factor influencing groundwater pathogen-microbiota indicators. Mesophilic microbes, such as bacteria and coliforms, exhibit optimal growth within specific temperature ranges. Coliforms, which are commonly found in the intestines of animals and humans, demonstrate optimal growth at temperatures ranging from 30 °C to 40 °C, with the most rapid reproduction occurring at 37 °C. The quantity, metabolism, and activity are subject to change when the temperatures are not conducive to their survival [44,45,46,47,48]. This is consistent with our finding that TBC and TEC values are lower below 30 °C. In summer, with high temperatures, the average groundwater TEC values are approximately seven times higher than in other seasons. This suggests that during summer, the microbial TBC and TEC exceedance in soil surface karst zone groundwater is severe, rendering it unsuitable as a source of potable water for human use.
Soil consists of particles of varying sizes, and its particle size distribution, coupled with porosity, constitutes one of its critical physical properties. These aspects significantly influence the evolution of groundwater microbes. Research by scholars such as Bradford and Harter, using saturated soil columns with varied particle sizes, has demonstrated that as particle size diminishes, microbial concentration at the column outlet decreases, while retention at the inlet increases [32,33]. Furthermore, David’s experiments on agricultural grassland soil revealed that particles of different sizes possess distinct adsorption surface energies. For instance, only 2% of Escherichia coli were retained in soil particles ≥31 µm, compared to 65% in particles <2 µm [49]. In studies involving Bacillus subtilis spores in soil, Minyoung found that doubling the soil particle size could increase the migration speed of spore microbes by 82%, likely due to the impact of larger pores in sandy soil on both adsorption capacity and hydrophobic interactions [50]. This is consistent with our finding that in denser soil or with smaller soil particle sizes, the groundwater TBC and TEC values increase. This phenomenon underscores that in rocky desertification areas under agricultural conditions, more frequent tilling and looser soil quality correlate with higher groundwater TBC levels, with the smallest and most stable fluctuations.
4.3. Implication
The results highlight that temperature exerts the most significant influence on the quality of karst groundwater. Elevated temperatures lead to increased pH, COD, and microbial indicator (total bacterial count and total coliforms) values in groundwater, along with wider ranges in ORP values. When the temperature exceeds 25 °C, the total bacterial count markedly increases with rising temperatures, while below 25 °C, there is minimal response to temperature variations. Total coliform concentration gradually increases with temperature, showing a more rapid rise above 15 °C. At the same temperature, depth shows little impact on water quality changes in surface karst springs. When porosity exceeds 0.55, the hydrodynamic cycle is accelerated, and soil oxygen content increases, resulting in higher ORP values and lower pH, indicative of a pronounced oxidative environment in the soil–water matrix. This suggests that the surface charge of soil mineral particles increases, thereby enhancing the adsorption capacity of the soil mineral surface for microbial indicators in karst groundwater, leading to more enriched pathogen-microbiota indicators. On the contrary, when porosity is less than 0.55, the surface soil layer exerts the opposite effect on karst groundwater microbes, reducing the concentration of pollution indicators. This indicates that denser soil surface karst zone soil or smaller soil particle sizes possess some capacity to purify karst groundwater quality.
Supplementary Materials
The following supporting information can be downloaded at: https://www.mdpi.com/article/10.3390/app14051933/s1, Table S1: Concentration values and evaluation results of water pollution.
Author Contributions
Conceptualization, L.S.; data curation, W.S. and Z.N.; funding acquisition, X.W.; writing—original draft, W.S.; writing—review and editing, S.W. All authors have read and agreed to the published version of the manuscript.
Funding
This research was supported by Hebei Natural Science Foundation: D2022504009; National Natural Science Foundation of China (No. 42330714); National Key R&D Projects of China (No. 2016 YFC0502502); Basal Research Fund of Iheg (CAGS: SK202314, SK202319).
Data Availability Statement
The original contributions presented in this study are included in the article. Further inquiries can be directed to the corresponding author.
Conflicts of Interest
The authors declare that the research was conducted in the absence of any commercial or financial relationships that could be construed as a potential conflict of interest.
References
- Congxi, C. Geology of karst rocky mountainous areas in southwestern China-Ecological Environment and Governance. Geol. China 1999, 4, 11–13. [Google Scholar]
- Zhang, L.; Yamane, T.; Satoh, E.; Amagasaki, K.; Kawataki, T.; Asahara, T.; Furuya, K.; Nukui, H.; Naganuma, H. Establishment and partial characterization of five malignant glioma cell lines. Neuropathology 2005, 25, 136–143. [Google Scholar] [CrossRef]
- Jiang, Y.J.; Yuan, D.X.; Zhang, C. Impact of Land Use Change on Soil Properties in a Typical Karst Agricultural Region: A Case Study of Xiaojiang Watershed, Yunnan. Acta Geogr. Sin. 2005, 50, 911–918. [Google Scholar] [CrossRef]
- Ning, Z.; Wang, S.; Guo, C. The impact of environmental factors on the transport and survival of pathogens in agricultural soils from karst areas of Yunnan province, China: Laboratory column simulated leaching experiments. Front. Microbiol. 2023, 14, 1143900. [Google Scholar] [CrossRef] [PubMed]
- Wang, S. Microbial-Toxicological Combined Response Mechanism and Simulation of Groundwater Polluted by Farming in Desertification Areas; Chinese Academy of Geological Sciences: Beijing, China, 2019. [Google Scholar]
- Charudattan, R. Biological Control of Water Hyacinth by Using Pathogens: Opportunities, Challenges, and Recent Developments//Biological and integrated control of water hyacinth: Eichhornia crassipes. In Proceedings of the Second Meeting of the Global Working Group for the Biological and Integrated Control of Water Hyacinth, Beijing, China, 9–12 October 2000; Australian Centre for International Agricultural Research (ACIAR): Sydney, Australia, 2001. [Google Scholar]
- Pang, R.-l.; Wang, S.-y.; Wang, R.-p. Study on the Enrichment and Migration Characteristics of Heavy Metals in Soil-Grapevine System. J. Ecol. Rural. Environ. 2019, 35, 515–521. [Google Scholar] [CrossRef]
- Yuan, S.; Tan, Z.; Huang, Q. Migration and transformation mechanism of nitrogen in the biomass–biochar–plant transport process. Renew. Sustain. Energy Rev. 2018, 85, 1–13. [Google Scholar] [CrossRef]
- Mohammadi, K.H.; Karim, G.H.; Razavilar, V. Study on the growth and survival of Escherichia coli O157:H7 during the manufacture and storage of Iranian white cheese in brine. Iran. J. Vet. Res. 2009, 10, 346–351. [Google Scholar] [CrossRef]
- Andrew, F.B. Numerical simulation of chemical migration in physically and chemically heterogeneous porous media. Water Resour. Res. 1993, 29, 3709–3726. [Google Scholar] [CrossRef]
- Li, Y.; Hou, Q.; Wang, S. Assembly of abundant and rare maize root-associated bacterial communities under film mulch. Appl. Soil Ecol. 2023, 182, 1–11. [Google Scholar] [CrossRef]
- Jiang, W.; Meng, L.; Liu, F. Distribution, source investigation, and risk assessment of topsoil heavy metals in areas with intensive anthropogenic activities using the positive matrix factorization (PMF) model coupled with self-organizing map (SOM). Environ. Geochem. Health 2023, 45, 6353–6370. [Google Scholar] [CrossRef]
- Wang, X.; Sun, L.; Wang, S. Development and application of multi-field coupled high-pressure triaxial apparatus for soil. Groundw. Sci. Eng. Engl. Version 2023, 11, 308–316. [Google Scholar] [CrossRef]
- Bitton, G. Adsorption of viruses onto surfaces in soil and water. Water Res. 1975, 9, 473–484. [Google Scholar] [CrossRef]
- Sun, L.; Wang, S.-W.; Guo, C.-J.; Shi, C.; Su, W.-C. Using pore-solid fractal dimension to estimate residual LNAPLs saturation in sandy aquifers: A column experiment. J. Groundw. Sci. Eng. 2022, 10, 87–98. [Google Scholar] [CrossRef]
- Mallén, G.; Maloszewski, P.; Flynn, R. Determination of bacterial and viral transport parameters in a gravel aquifer assuming linear kinetic sorption and desorption. J. Hydrol. 2005, 306, 21–36. [Google Scholar] [CrossRef]
- Sinton, L.W.; Braithwaite, R.R.; Hall, C.H. Tracing the Movement of Irrigated Effluent into an Alluvial Gravel Aquifer. Water Air Soil Pollut. 2005, 166, 287–301. [Google Scholar] [CrossRef]
- Hermansson, M.; Kjelleberg, S.; Norkrans, B. The hydrophobicity of bacteria? An important factor in their initial adhesion at the air-water interface. Arch. Microbiol. 1981, 128, 267. [Google Scholar] [CrossRef]
- Jiang, W.; Liu, H.; Sheng, Y. Distribution, Source Apportionment, and Health Risk Assessment of Heavy Metals in Groundwater in a Multi-mineral Resource Area, North China. Water Qual. Expo. Health 2022, 14, 807–827. [Google Scholar] [CrossRef]
- Yang, C.; Liu, Y.; Liu, S.Q. Mechanism of microbial clogging effect on single-well push-pull test. Saf. Environ. Eng. 2023, 30, 199–204. [Google Scholar]
- Foppen, J.W.; Herwerden, M.V.; Schijven, J. Measuring and modelling straining of Escherichia coli in saturated porous media. J. Contam. Hydrol. 2007, 93, 236–254. [Google Scholar] [CrossRef]
- Haznedaroglu, B.Z.; Bolster, C.H.; Walker, S.L. The role of starvation on Escherichia coli adhesion and transport in saturated porous media. Water Res. 2008, 42, 1547–1554. [Google Scholar] [CrossRef]
- McDowell-Boyer, L.M.; Hunt, J.R.; Sitar, N. Reply to “Comments on ‘Particle transport through porous media’ by Laura M. McDowell-Boyer, James R. Hunt, and Nicholas Sitar”. Water Resour. Res. 1987, 23, 1699. [Google Scholar] [CrossRef]
- McDowell-Boyer, L.M.; Hunt, J.R.; Sitar, N. Particle transports through porous media. Water Resour. Res. 1986, 22, 1901–1921. [Google Scholar] [CrossRef]
- Reneau, R.B.; Hagedorn, C.; Degen, M.J. Fate and Transport of Biological and Inorganic Contaminants from On-Site Disposal of Domestic Wastewater. J. Environ. Qual. 1989, 18, 135–144. [Google Scholar] [CrossRef]
- Yee, N.; Fein, J.B.; Daughney, C.J. Experimental study of the pH, ionic strength, and reversibility behavior of bacteria–mineral adsorption. Geochim. Cosmochim. Acta 2000, 64, 609–617. [Google Scholar] [CrossRef]
- Wellings, F.M.; Lewis, A.L.; Mountain, C.W. Demonstration of Virus in Groundwater after Effluent Discharge onto Soil. Appl. Microbiol. 1975, 29, 751. [Google Scholar] [CrossRef]
- Sander, M.; Pignatello, J.J. On the Reversibility of Sorption to Black Carbon: Distinguishing True Hysteresis from Artificial Hysteresis Caused by Dilution of a Competing Adsorbate. Environ. Sci. Technol. 2007, 41, 843–849. [Google Scholar] [CrossRef] [PubMed]
- Stewart, B.A. The Influence of Macropores on the Transport of Dissolved and Suspended Matter Through Soil. In Advances in Soil Science: Volume 3; Springer: New York, NY, USA, 1985; pp. 95–120. [Google Scholar] [CrossRef]
- Huysman, F.; Verstraete, W. Water-facilitated transport of bacteria in unsaturated soil columns: Influence of inoculation and irrigation methods. Soil Biol. Biochem. 1993, 25, 91–97. [Google Scholar] [CrossRef]
- Jewett, D.G.; Logan, B.E.; Arnold, R.G. Transport of Pseudomonas fluorescens strain P17 through quartz sand columns as a function of water content. J. Contam. Hydrol. 1999, 36, 73–89. [Google Scholar] [CrossRef]
- Bradford, S.A.; Simunek, J.; Bettahar, M. Modeling colloid attachment, straining, and exclusion in saturated porous media. Environ. Sci. Technol. 2003, 37, 2242–2250. [Google Scholar] [CrossRef]
- Bradford, S.A.; Bettahar, M. Straining, attachment, and detachment of cryptosporidium oocysts in saturated porous media. J. Environ. Qual. 2005, 34, 469–478. [Google Scholar] [CrossRef]
- Shahmohammadi-Kalalagh, S.; Beyrami, H.; Taran, F. Bromide Transport through Soil Columns in the Presence of Pumice. Iran. J. Chem. Chem. Eng. 2022, 41, 1305–1312. [Google Scholar] [CrossRef]
- Jewett, D.G.; Hilbert, T.A.; Logan, B.E. Bacterial transport in laboratory columns and filters: Influence of ionic strength and pH on collision efficiency. Water Res. 1995, 29, 1673–1680. [Google Scholar] [CrossRef]
- Gerba, C.P. Persistence of Viruses in Desert Soils Amended with Anaerobically Digested Sewage Sludge. Appl. Environ. Microbiol. 1992, 58, 636–641. [Google Scholar] [CrossRef]
- Fontes, D.E.; Mills, A.L.; Hornberger, G.M. Physical and chemical factors influencing transport of microorganisms through porous media. Appl. Environ. Microbiol. 1991, 57, 2473–2481. [Google Scholar] [CrossRef] [PubMed]
- Gannon, J.; Tan, Y.; Baveye, P.; Alexander, M. Effect of sodium chloride on transport of bacteria in a saturated aquifer material. Appl. Environ. Microbiol. 1991, 57, 2497–2501. [Google Scholar] [CrossRef] [PubMed]
- Unc, A.; Goss, M.J.; Cook, S.; Li, X.; Atwill, E.R.; Harter, T. Analysis of matrix effects critical to microbial transport in organic waste-affected soils across laboratory and field scales. Water Resour. Res. 2012, 48, 154–167. [Google Scholar] [CrossRef]
- Kato, S.; Jenkins, M.B.; Ghiorse, W.C. Chemical and physical factors affecting the excystation of Cryptosporidium parvum oocysts. J. Parasitol. 2001, 87, 575–581. [Google Scholar] [CrossRef] [PubMed]
- DD2008-01; Technical Code for Groundwater Pollution Investigation and Evaluation. Ministry of Environment and Climate Change Strategy: Victoria, BC, Canada, 2021.
- GB/T 5750-2023; Standard Test Method for Drinking Water. Code of China: Beijing, China, 2023.
- Wang, Y. The Yunnan Typical Regional Karst Groundwater Investigation and Geological Environmental Remediation Demonstration Report; China Geological Survey: Beijing, China, 2003. [Google Scholar]
- Conner, D.E. Growth and survival of Escherichia coli O157:H7 under acidic conditions. Appl. Environ. Microbiol. 1995, 61, 382–385. [Google Scholar] [CrossRef] [PubMed]
- Vanbleu, E.; Vanderleyden, J. Molecular Genetics of Rhizosphere and Plant-Root Colonization; Springer: Amsterdam, The Netherlands, 2007. [Google Scholar] [CrossRef]
- Sinton, L.W.; Mackenzie, M.L.; Karki, N. Transport of Escherichia coli and F-RNA bacteriophages in a 5 m column of saturated pea gravel. J. Contam. Hydrol. 2010, 117, 71–81. [Google Scholar] [CrossRef]
- Zheng, Y.; Zhang, Z.; Chen, Y. Adsorption and desorption characteristics and mechanism of Cd in reclaimed soil under the influence of dissolved organic carbon. J. Int. J. Coal Sci. Technol. 2022, 9, 225–235. [Google Scholar]
- Li, Z.Y. Assessment of future climate change impacts on water-heat-salt migration in unsaturated frozen soil using CoupModel. Front. Environ. Sci. Eng. 2021, 15, 145–161. [Google Scholar]
- Haack, S.K.; Metge, D.W.; Fogarty, L.R. Effects on Groundwater Microbial Communities of an Engineered 30-Day in Situ Exposure to the Antibiotic Sulfamethoxazole. Environ. Sci. Technol. 2012, 46, 7478. [Google Scholar] [CrossRef] [PubMed]
- Kim, M.; Choi, C.Y.; Gerba, C.P. Development and evaluation of a decision-supporting model for identifying the source location of microbial intrusions in real gravity sewer systems. Water Res. J. Int. Water Assoc. 2013, 47, 4630–4638. [Google Scholar] [CrossRef] [PubMed]
Disclaimer/Publisher’s Note: The statements, opinions and data contained in all publications are solely those of the individual author(s) and contributor(s) and not of MDPI and/or the editor(s). MDPI and/or the editor(s) disclaim responsibility for any injury to people or property resulting from any ideas, methods, instructions or products referred to in the content. |
© 2024 by the authors. Licensee MDPI, Basel, Switzerland. This article is an open access article distributed under the terms and conditions of the Creative Commons Attribution (CC BY) license (https://creativecommons.org/licenses/by/4.0/).