Article

Crustal Apparent Density Variations in the Middle Segment of the North Tianshan Mountains and Their Tectonic Significance

1
College of Civil Engineering, Architecture Xinjiang University; Urumqi 830047, China
2
Earthquake Agency of Xinjiang Uygur Autonomous Region, Urumqi 830011, China
3
School of Earth and Space Sciences, University of Science and Technology of China, Hefei 230026, China
4
Urumqi Institute of Central Asia Earthquake, Urumqi 830011, China
*
Author to whom correspondence should be addressed.
Appl. Sci. 2024, 14(5), 1694; https://doi.org/10.3390/app14051694
Submission received: 3 January 2024 / Revised: 15 February 2024 / Accepted: 15 February 2024 / Published: 20 February 2024
(This article belongs to the Special Issue Advanced Observation for Geophysics, Climatology and Astronomy)

Abstract

:
In this study, we collected mobile gravity observations in the middle segment of the North Tianshan Mountains from August 2016 to July 2022 and carried out classical adjustment calculations under the constraint of the absolute gravity datum to obtain the spatiotemporal variation pattern of the local gravity field. We used equivalent source inversion to obtain the spatiotemporal variation characteristics of crustal apparent density. We also extracted the coseismic deformation field from SAR data, using the 2016 Hutubi earthquake as an example, and constructed a model of the seismogenic fault. The gravity monitoring network in the study area performed well in resolving the earthquake source parameters. Both the time-varying gravity field and equivalent apparent density variation pattern show prominent zoning characteristics with a smoothly evolving spatial distribution over time. The variation trends of the gravity field and equivalent apparent density are in line with the orientation of tectonic structures, and their anomalous signals can be detected before and after an earthquake. The constructed seismogenic structure of the 2016 Hutubi earthquake indicates a typical thrust earthquake, probably occurring on a north-dipping blind fault beneath a region with intense crustal deformation. The subsurface tectonic system reflected by this earthquake can be informatively extended to the entire middle segment of the North Tianshan Mountains by subsurface configuration. Our findings can serve as a reference for analyzing the source characteristics of the time-varying gravity field and interpreting anomalous pre-seismic signals, and aid in understanding earthquake preparation zones and the mode of crustal tectonic movements.

1. Introduction

The earth’s gravity field is a basic physical field reflecting subsurface material migration that directly reflects the process and nature of deep tectonic movements and surface mass redistribution [1]. Earthquakes are closely related to the gravity field through the tectonic movements and variations in the density of subsurface media [2]. There is a long history of research on the relationship between seismic activities and gravity changes, with a landmark achievement obtained by Barnes in 1966. He proposed that before and after an earthquake, the density of subsurface media along the fault varies due to the changes in the regional crustal stress field triggered by fault movement. At the same time, medium deformation leads to the formation of new cracks or expands pre-existing fractures in the media. As a result, fluid media, such as groundwater or volcanic magma, may directly flow in or out, resulting in fluid medium density alterations around the observation site and directly causing temporal variations in the regional gravity field [1,3,4].
Time-varying gravity anomalies are reliable earthquake precursors [5]. In recent years, the rapid development of high-precision absolute gravimeters has made available time-varying gravity data obtained by the terrestrial hybrid repeated gravity observation (THRGO) system, which have been applied to investigate crustal deformation, deep crustal fluid migration, and crustal apparent density variations in tectonically active regions [6,7]. Recently, relatively accurate medium-term predictions of several large earthquakes have been made by interpreting the data of anomalous gravity changes with reference to historical local earthquake records [8,9,10]. Many scholars therefore believe that it is possible to extract the gravity signals that are probably associated with deep mass transfer processes from THRGO records [11], which is the basis for applying time-varying gravity observations to in-depth explorations of earthquake mechanisms and seismic risk prediction [12]. With the advancement of technology, analyzing earthquake-associated surface deformations using interferometric synthetic aperture radar (InSAR) has become a research hotspot, and this field is among those where InSAR technology has been most successfully applied [13]. With the gradual maturity of InSAR technology, increasingly detailed coseismic deformation fields can be extracted to inverse coseismic slip distribution patterns [14]. Due to their large spatial coverage and high-accuracy deformation monitoring capacity, short-period InSAR data have facilitated the rapid acquisition of earthquake-induced surface deformation, post-earthquake field investigations, surface rupture zone identification, and seismic regime prediction, thus providing essential scientific support for earthquake disaster mitigation [15].
In the present study, we used mobile gravity observation data collected in the middle segment of the North Tianshan Mountains from August 2016 to July 2022 to obtain time-varying gravity values on an annual scale based on the repeated ground-based observations from the monitoring network in the study area. We used the classical constrained adjustment method, with an idea of integrating the field and seismic sources. We further obtained the local gravity field variation features and then performed equivalent source inversion based on the time-varying gravity signals to reveal the crustal apparent density changes in the study area. These provide a geophysical basis for a thorough investigation of the process of deep crustal material migration and the generation mechanism of moderate to strong earthquakes. We used the differential InSAR (DInSAR) technique [16,17] to obtain the LOS coseismic deformation field for the 2016 Hutubi earthquake (magnitude 6.2) that occurred during the observation period, and inverted the seismogenic fault based on the elastic dislocation model [18] to study the regional earthquake generation mechanism and fault activity. The software used for gravity field inversion was GEOIST1.0, the software used for InSAR data processing was GMTSAR6.2, and the calculation program used for seismic fault inversion was the Steepest Descent Method (SDM). The outcomes may aid in understanding the tectonic background of earthquake preparation and the tectonic activity pattern around the faults in the study area. Therefore, the purpose of this work was to interpret the seismogenic structure and focal mechanism of the 2016 Hutubi earthquake, with the aim of exploring the geological significance of the deep tectonic features in an extended spatial range covering the entire middle segment of the North Tianshan Mountains.
The research objective was to discuss the seismicity characteristics and earthquake risk areas of the study area by analyzing the characteristics of the time-varying gravity field and the apparent density of the crust in the study area, and combining it with a comprehensive analysis of the meaning of the underground structure obtained from the inversion.

2. Materials and Methods

2.1. Gravity Monitoring Network in the Middle Segment of the North Tianshan Mountains

Mobile gravity monitoring has been conducted by the Seismological Bureau of the Xinjiang Uygur Autonomous Region since the 1980s, with two periods of repeated observation at each station every year. The gravity monitoring network in Northern Xinjiang had been modified twice by 2015, with the number of monitoring stations increased to 97 and network coverage extended to the middle segment of the Tianshan Mountains and the Yili Basin. This enhanced the effectiveness of surface gravity measurements and allowed for better capture of the gravity anomalies in the Xinjiang region. The study area (Figure 1) is located at the southern margin of the Junggar Basin and the middle segment of the North Tianshan Mountains, and features complex geological structures and frequent seismic activities [19]. The monitoring network covers densely populated cities, including Urumqi, Changji, Hutubi, Shihezi, and Dushanzi, which has enhanced the seismic monitoring capability of the region and laid a solid foundation for obtaining data to reveal the spatiotemporal variation characteristics of the local gravity field. Mobile gravity observation in the study area was carried out using CG5 and CG6 high-precision gravimeters, and the personal digital assistant (PDA) system provided by the Institute of Seismology, China Earthquake Administration, was used for data recording and processing. The observations featured a self-deviation within 25 × 10−8 m·s−2, a mutual deviation within 30 × 10−8 m·s−2, and a unit weight variance of 10.0 × 10⁻⁸ m·s−2, and therefore fulfilled the specification requirements. In the classical constrained adjustment calculations, segment differences with large errors were rejected or down-weighted. After determining the instruments’ precision, the measurement results were re-weighted accordingly to ensure data accuracy. The mobile gravity records were then gridded to obtain the dynamic spatiotemporal variation patterns in the study area.
Seismic activities are frequent in the study area, with more than one hundred felt earthquakes occurring during our research period. The largest event, with magnitude 6.2, occurred in Hutubi on 8 December 2016. Here, we used mobile gravity observations from August 2016 to July 2022 to explore gravity field changes at the annual scale during these six years. We performed equivalent source inversion based on the time-varying gravity field to obtain the characteristics of the crustal apparent density distribution in the study area and further explored the physical variation features of seismic sources within the crust. Figure 1 was drawn by the Generic Mapping Tools (GMT), in which the topographic relief data are the data of GMT, and the seismic data are from the China Earthquake Networks Center (CENC). Fault data and ground gravity point data are from the Earthquake Agency of the Xinjiang Uygur Autonomous Region.

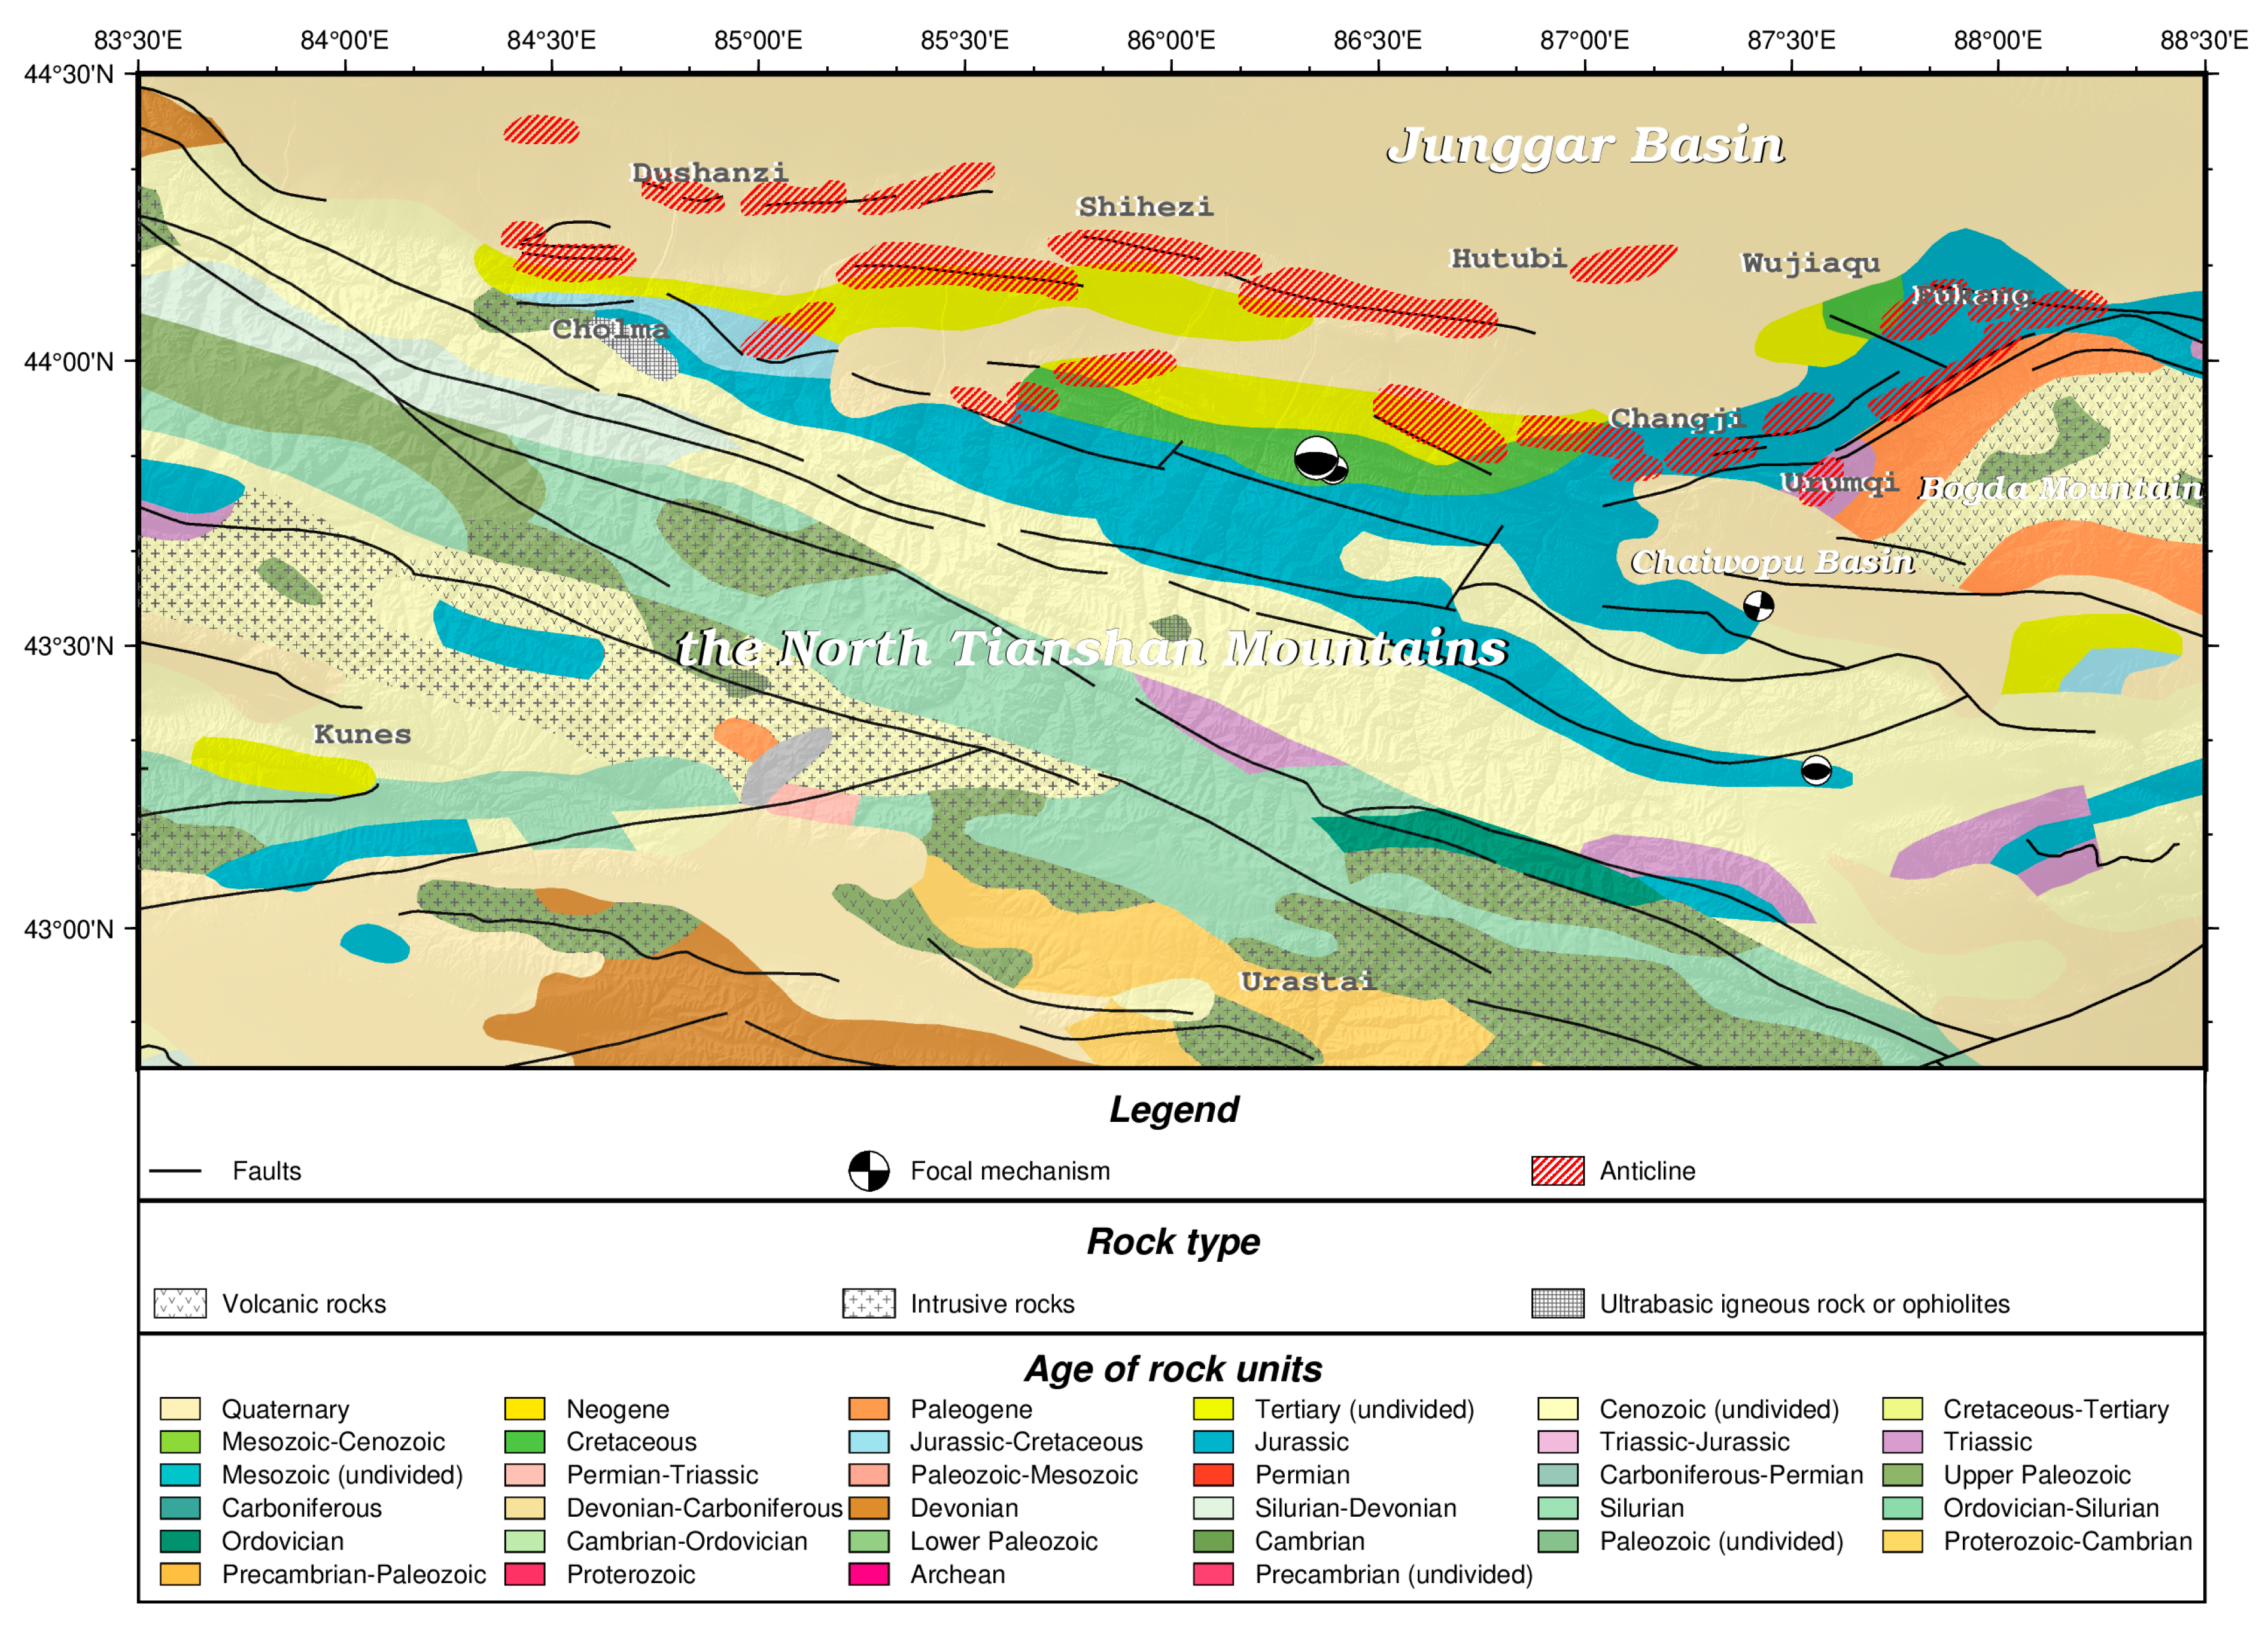
2.2. Tectonic Background

The Tianshan Mountains are characterized by active tectonic movements and frequent seismic activities. Under the influence of the collision between the far-field Indian plate and the Eurasian plate and the direct squeezing of the Tarim and Junggar basins on both sides, the Cenozoic tectonic changes in the Tianshan area are mainly characterized by the bidirectional thrusting of the mountain and the shortening of the Tianshan crust. In the Late Paleozoic, the Junggar, Tuha, Bogda, and Harlik blocks accreted during the collision between the Siberian and Tarim blocks to form the east–west trending Tianshan orogenic belt. This is a typical reactivated orogenic belt with a basic structure built in the Late Paleozoic and reactivated during the Cenozoic [20]. In the Cenozoic, the Tarim block subducted northward, compressing the Tianshan Mountains under the remote impacts of the India–Eurasia collision and Indian plate subduction, which resulted in the reactivation and uplift of the Tianshan orogenic belt and the formation of the present-day topographic pattern with alternating large mountain belts and basins in the Tianshan region [21]. Plate collision and subduction activities have altered the geological structure of the Tianshan Mountains and the adjacent basins. According to GPS-derived horizontal and vertical displacement data, the Tianshan orogenic belt still has an overall uplift trend [22]. Our study area lies in the middle segment of the North Tianshan Mountains (Figure 2), principally including the structural units of the Urumqi piedmont depression and Tianshan intensive uplift belt. The study area can be roughly divided at 44° N into a subsidence zone in the north, with a maximum subsidence rate of about −3 mm·a−1, and the North Tianshan uplift zone in the south, where the Haxilegen Danban in the Yilianhabierga Mountain area west of Urumqi is the region with the strongest uplift throughout Xinjiang and displays an uplift rate of up to 17.8 mm·a−1 [23].
A series of active faults developed along the foothills of the North Tianshan Mountains. From the south to the north, these include the Yamate fault, Junggar Southern Margin fault, Bogda arcuate fault zone, and Horgos–Manas–Tugulu fault. Multiple types of tectonic structures are co-developed in this area, forming complex and superposed fault systems [24]. The crust in the North Tianshan region gradually shortens from the west to the east and from the south to the north [25,26]. However, this shortening is not uniformly absorbed, indicating that the thrust force gradually weakens from the west to the east along the Tianshan Mountains, in a direction away from the plate boundary; the intensity of folding in the Tianshan Mountains decreases accordingly [27]. Due to the thrusting of the Indian plate [28], the Tianshan Mountains were intensely uplifted in the Late Cenozoic, forming a regenerated orogenic belt [29]. Heavily deformed compressive structures were formed in the piedmont depressions on both sides of the mountain range. These are piedmont thrust sheets inherited from the structures formed during the Late Mesozoic tectonic activities, which continuously developed from the Mesozoic to the Cenozoic, manifesting as a series of thrust fault–anticline belts. The several sets of thrust fault–anticline belts in the Urumqi piedmont depression north of the Tianshan Mountains are the most remarkable features of this range [30].
The Urumqi piedmont depression is located at the northern foot of the North Tianshan Mountains. It is a Mesozoic–Cenozoic depression stretching from the east of Urumqi City in the east to Wusu in the west, with a southern margin separated from the North Tianshan Mountains by the Junggar Southern Margin fault [30]. The maximum thickness of the Mesozoic–Cenozoic sediments in the Manas region within the depression reaches 12,000 m [31]. Subsidence centers of different ages have migrated from the east to the west. The Early Tertiary subsidence center was located around Shawan and Anjihai, and the deposition thickness was the greatest around Wusu in the Late Tertiary. The subsidence center in the Quaternary had migrated to Wusu and west of this location [30]. Three sets of nearly east–west trending thrust fault–anticline belts developed within the Urumqi piedmont depression. From south to north, these are the Qigu piedmont, Horgos–Manas–Tugulu, and Dushanzi–Halaande–Anjihai thrust fault–anticline belts, separated by synclines [30]. In the following, these are referred to as the Q, M, and D thrust fault–anticline belts, respectively. The Q anticlines are parts of an arcuate structure, consisting of six anticlines in an echelon arrangement (i.e., the Qigu, Changji, Kalazha, Xishan, Qidaowan, and Nanfukang anticlines), which were formed by the northward thrusting of the Bogda block [32]. The north limb of the Xishan anticline lies in the Wangjiagou–Toutunhe area, where the Upper Pleistocene gravel bed is tilted with the folds. Its southern limb is faulted by the Xishan fault, with the Badaowan anticline folded into the Upper Pleistocene strata. The Nanfukang folds in the North Bogda Mountain in the east were formed under intense folding activities involving the Upper Pleistocene strata [33]. The M anticlines consist of the Horgos anticline, Manas anticline, Turpan anticline, and Beisantai uplift, which are associated with more intense folding activities than the Q anticlines, and the Upper Pleistocene sequences are generally deformed and folded. The hinge sections or two limbs of these anticlines are typically faulted, and these folds are all active in the Holocene. The intense folding activities have lasted from the end of the Early Pleistocene to the present, controlling the occurrence of large earthquakes, e.g., the Manas earthquake of magnitude 7.7 in December 1906 in the North Tianshan region [34,35,36]. The D anticlines are younger folds involving the Upper Pleistocene strata, and the Holocene active faults are developed along the anticline structures. Although the D thrust fault–anticline belt was formed much later, roughly from the end of the Early Pleistocene to the beginning of the Middle Pleistocene [37], the associated tectonic activities were very intense, with an average shortening rate of 1.7–1.9 mm·a−1 [30,38].
The thrust fault–anticline belts in the Urumqi piedmont depression are mainly asymmetrical anticlines with steep north limbs and gentle southern limbs (Figure 2), with active vertical faults parallel to the fold axes on their north limbs and hinge zones and north-dipping backthrust faults on their south limbs. The activity of the multiple sets of piedmont fold belts gradually increases from the south to the north (Figure 2). These folds mostly have a thin-skinned structure with a shallow depth, forming a pattern of closely packed stripes trending east–west [23].
The study area is one of the most seismically active regions, with frequent moderate-to-strong earthquakes. It has been shown that the frequent earthquakes in this area may be caused by differential block movements [39]. Since the twentieth century, the seismicity in the study region first increased, followed by a calm period, and then increased again [23]. Two earthquakes of magnitude 7 or above have occurred in this area, with the largest one being the Manas earthquake of magnitude 7.7 in December 1906, followed by a magnitude 7.2 event at Xinyuan in 1944 and a magnitude 6.6 earthquake northeast of Urumqi in 1965. No earthquakes of magnitude six or above occurred during the last few decades, and the faults remained locked until the calm period was broken by the 2012 Xinyuan–Hejing earthquake of magnitude 6.6. The most recent strong earthquake was the 2016 Hutubi earthquake of magnitude 6.2, occurring in the piedmont of the North Tianshan Mountains. The seismogenic fault is a thrust fault, and no surface rupture was detected in the vicinity of the epicenter. Due to the lack of understanding of the seismogenic mechanism of intracontinental earthquakes and inadequate research on deep tectonic structures in this region, it is difficult to clarify the local earthquake generation mechanism, and no unified interpretation of the seismogenic fault of the Hutubi earthquake has not yet been obtained [40,41,42].

3. Results

3.1. Equivalent Source Inversion

3.1.1. Basic Principles of the Inversion

Changes in the gravity field are not only the results of crustal movements, but they are also affected by density variations in the materials inside the earth [43]. The time-varying gravity field obtained by repeated surface gravity observations has the advantages of a high spatial resolution, observation accuracy, and data reliability, which provides important support for extracting anomalous signals during the earthquake preparation process. Therefore, this field can be inverted using the “equivalent source” model to obtain the characteristics of apparent density changes and infer the dynamic density variations in the subsurface media [44].
The experimental method can be summarized as the tuning and inversion of time-varying gravity field signals. First, the resolution of the source model is assessed and adjusted through a checkerboard test. The source term is discretized into hexahedral grids in a spherical domain [45], and spatiotemporal constraints are introduced. Then, the “equivalent source” inversion model is optimized and solved following Akaike Information Criterion and Bayesian Information Criterion (ABIC) [46].
The equation of equivalent source inversion [47] can be expressed as
Φ = W 0 G m f x , y , t 2 + Φ s m + Φ T m
The three terms on the right-hand side of the equation represent the observations, spatial constraints, and temporal constraints, respectively, the details of which depend on the a priori assumptions of the model; W 0 is a weight parameter; G is the kernel function matrix; m is the source model; and f x , y , t denotes the three-dimensional space–time model, where x , y , and t represent the latitude, longitude, and time, respectively.
The spatial constraint term Φ s m can be expressed as
Φ s m = W 1 m x 2 + W 2 m x y 2 + W 3 m y 2 d x d y
W 1 , W 2 , and W 3 are the weight coefficients (hyperparameters) related to the spatial smoothness of the model in each direction, whose physical implication is that the source model to be solved is expected to have second-order smoothness in horizontal directions of X , X Y , and Y .
The temporal constraint term Φ T m can be expressed as
Φ T m = W 4 m t 2 d t
W 4 is the weight coefficient (hyperparameter) related to the temporal smoothness of the model, whose physical implication is that the source model to be solved is expected to have second-order smoothness on the temporal scale.
During the inversion, it is necessary to determine all the hyperparameters in the equation. Therefore, the ABIC criterion needs to be introduced to optimize the hyperparameters [48]. It is defined as follows:
A B I C = 2 log L + 2 P
where L is the likelihood function of the model, and P is the number of hyperparameters. The criterion can be minimized using multi-parameter and nonlinear optimization methods, such as Newton’s method or the simplex method.

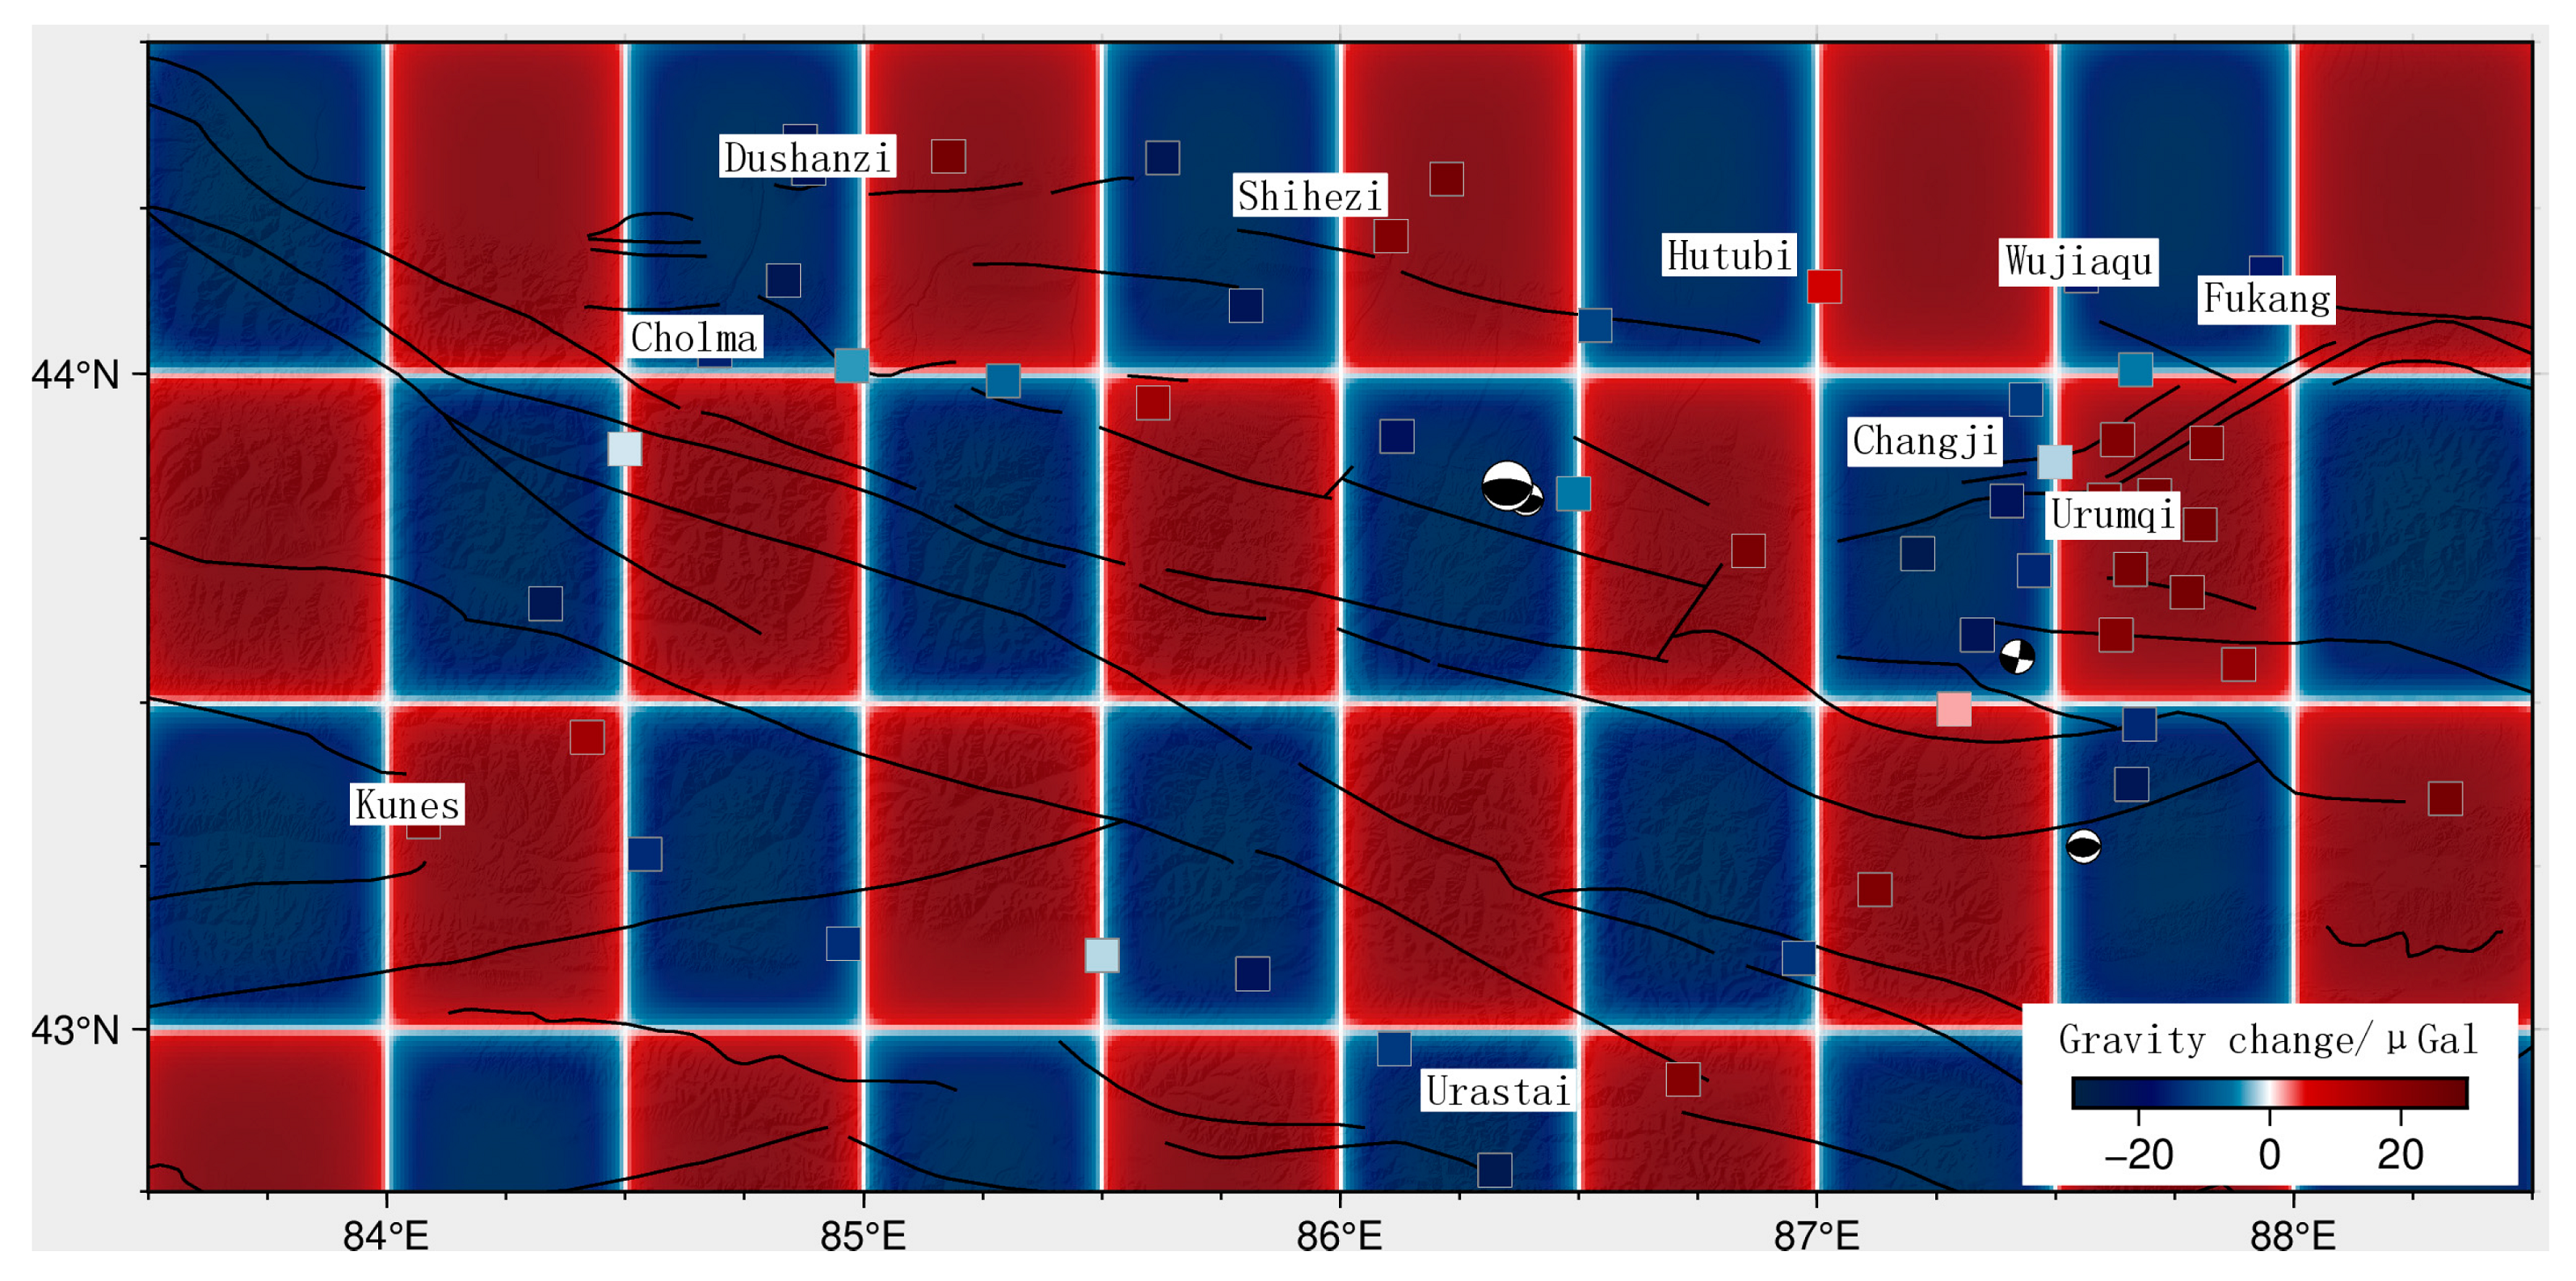
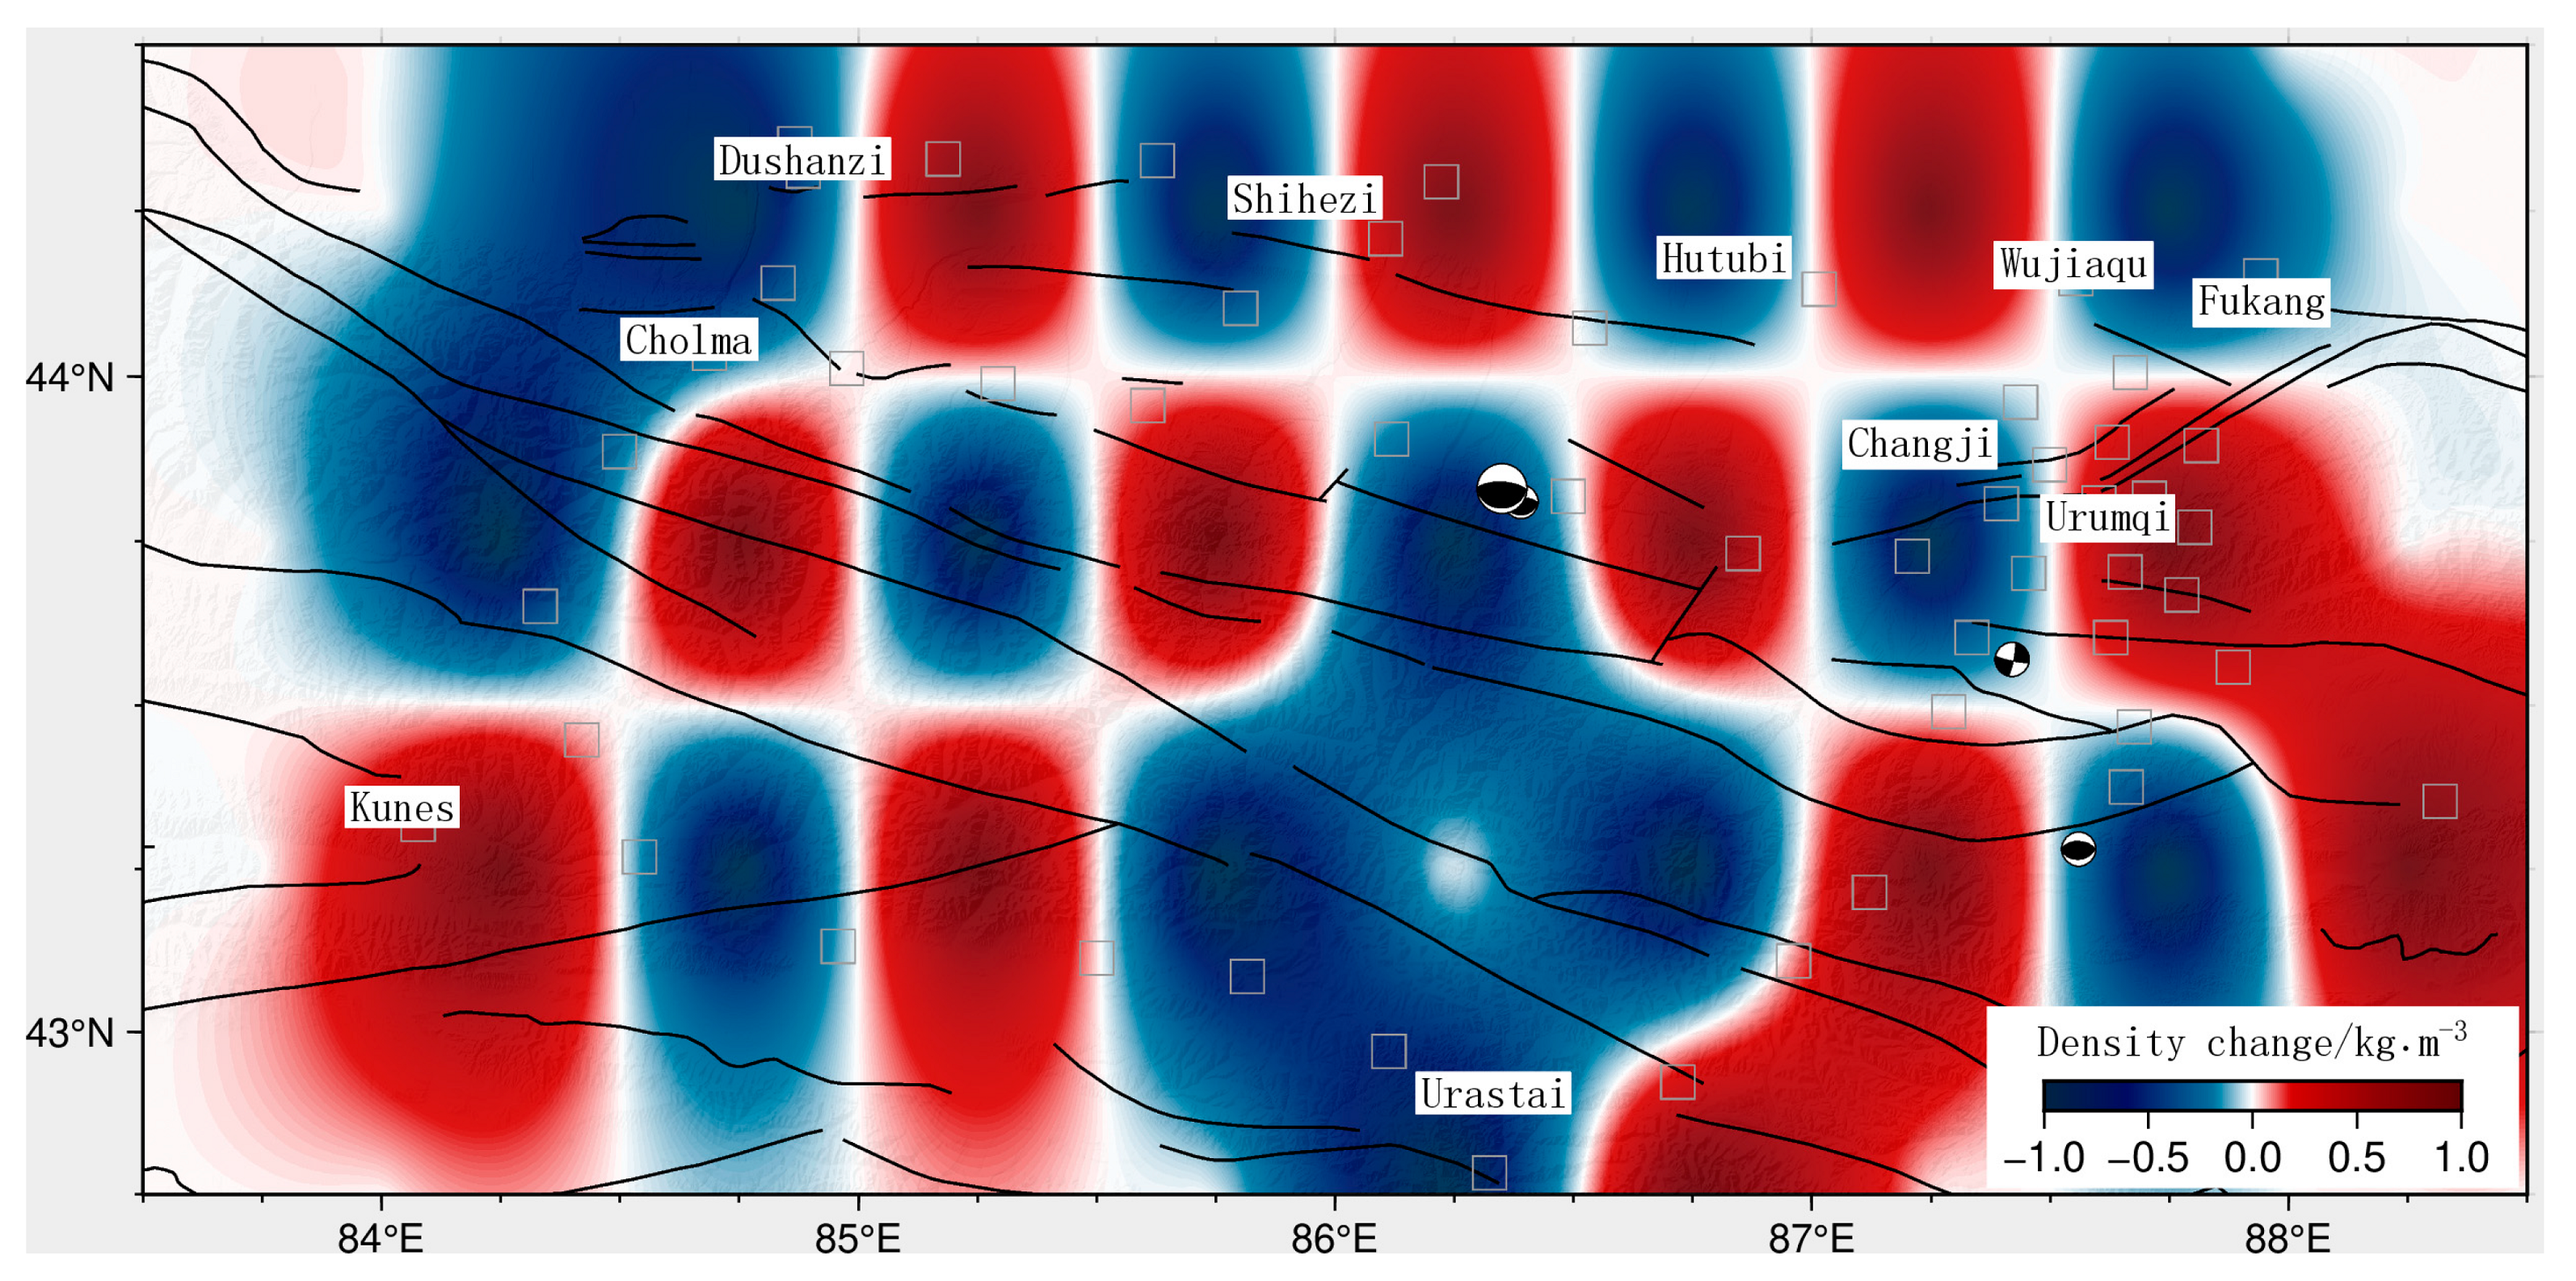
3.1.2. Checkerboard Test

Before the inversion of the surface time-varying gravity field, it is necessary to examine the source resolution capacity of the gravity monitoring network in the study area. To this end we applied the checkerboard test, which is commonly used in seismic tomography studies [49]. As we aimed to conduct equivalent source inversion for crustal apparent density, we only tested the resolution in the horizontal directions. We assigned alternatively distributed sources of positive and negative anomalies of the same size in the study area, measured the theoretical gravity anomalies at the surface monitoring stations by forward gravity modeling, and then used the inversion method to solve the source parameters and compare the results with the designed values to evaluate the differences in spatial resolution caused by the uneven distribution of the existing monitoring stations [50]. We designed discretized source bodies with a size of 0.5° × 0.5°, a burial depth of 10 km, an apparent density of ±1.0 kg/m3, and a thickness of 1 km to examine the resolution capacity of the gravity monitoring network in the middle segment of the North Tianshan Mountains with the hypothetical equivalent source model [51]. The range of surface gravity anomalies obtained by forward modeling was about ±30 μGal.
Figure 3 shows the theoretical gravity anomalies at the ground surface associated with a checkerboard model with a resolution of 0.5° × 0.5°, as well as the spatial distribution of the monitoring stations in the study area. The locations of the stations are marked by grey rectangles, and the color of the rectangular patches indicates the measured gravity anomalies at the ground surface. The monitoring stations are unevenly distributed in the study area, and the employed resolution was chosen after considering the source resolution capacity of the stations, the optimal design and layout of the monitoring network, and the uncertainty of the source signals [52]. Then, the theoretical gravity anomalies with a checkerboard pattern were inverted to obtain the crustal apparent density using the equivalent source inversion method. The results are presented in Figure 4, where the grey rectangles mark the locations of the surface monitoring stations. The obtained source parameters can provide a reliable reference for the gravity variations in different regions. The figure shows that the predetermined source parameters cannot be accurately recovered in regions far away from the monitoring stations, and that there are certain areas that are not covered by the monitoring network. At the edges of the covered area, the inverted source body densities therefore show transition features, mainly manifested as the constraints of spatial smoothing regularization. The test shows good resolution in the area covered by the monitoring network, and the results were representative of the surface gravity changes induced by the regional crustal material migration. This indicates that the network’s resolution would not have significant impacts on the subsequent inversion of the actual mobile gravity data.

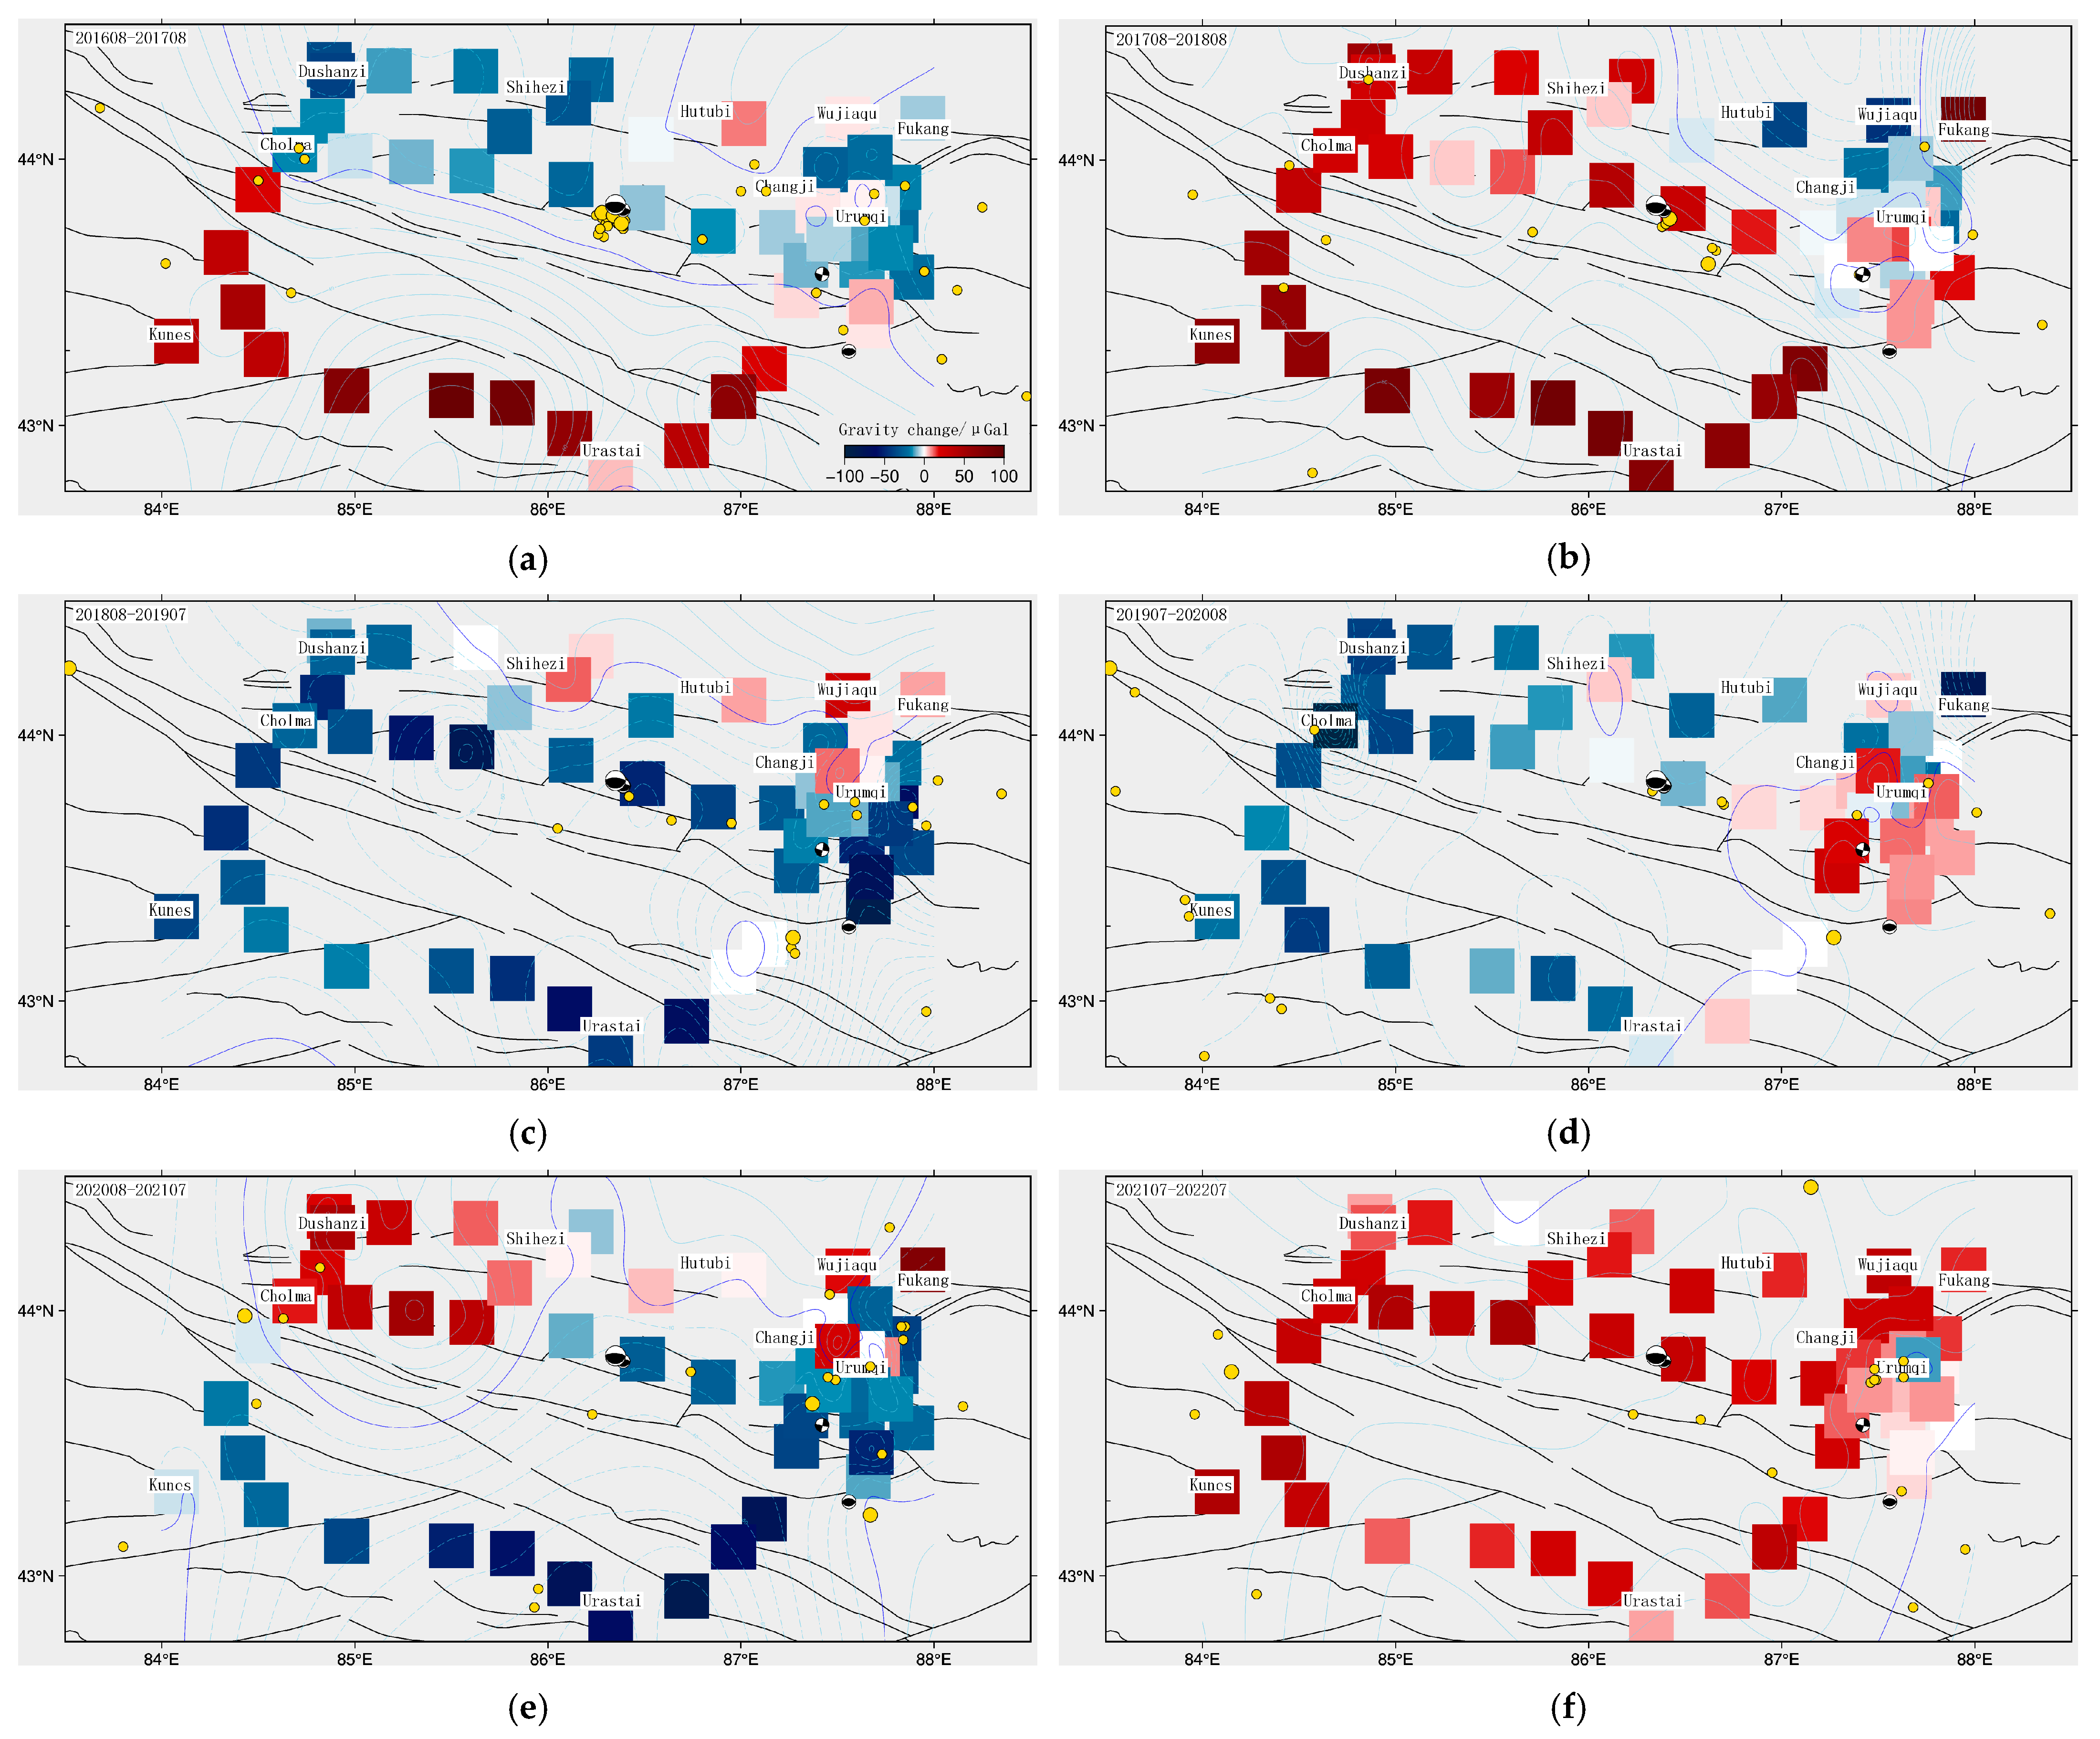
3.1.3. Time-Varying Gravity Field

In this study, we selected the mobile gravity observations recorded by the monitoring network in the study area from August 2016 to July 2022 and further adjusted and inverted the gravity data to analyze the dynamic changes at the annual scale in the gravity field and equivalent crustal apparent density. Figure 5 demonstrates the dynamic changes in the gravity field in the study area, with the rectangles of different colors representing the gravity differences at the monitoring stations after adjustment. The contours of the gravity field changes are also plotted. The focal mechanisms of the 2016 Hutubi earthquake, 2018 Urumqi earthquake, 2018 Hutubi earthquake, and 2020 Toksun earthquake are indicated by black beach balls. Solid black lines delineate faults, and yellow circles of different sizes denote felt earthquakes during the research period.
Figure 5a shows the gravity change pattern in the study area from August 2016 to August 2017. The gravity field in the entire region exhibited apparent zoning characteristics. The Urumqi piedmont degression region was dominated by negative gravity variations, and the foothills of the North Tianshan Mountains all showed positive gravity changes. On 8 December 2016, a magnitude 6.2 earthquake occurred in Hutubi. As shown in the figure, this earthquake occurred at the junction of positive and negative gravity changes, confirming the migration of subsurface materials in this region. The foothills of the North Tianshan Mountains are subjected to intense uplift, and the gravity field change should thus be negative. The Urumqi piedmont degression is undergoing mild subsidence, and its gravity field change should be a positive value of relatively small magnitude. However, we found exactly the opposite (Figure 5a), with the strongly uplifting foothills of the North Tianshan Mountains showing dramatic positive variations, indicating that subsurface medium migration did occur in this region. The regional tectonic stress around the epicenter had changed, and the subsurface media were migrating from the north to the south, eventually triggering the Hutubi earthquake. We believe that these factors probably constituted the main causes of the Hutubi earthquake. Figure 5b shows the gravity change pattern in the study area from August 2017 to August 2018. Compared with the pattern from August 2016 to August 2017 (Figure 5a), the regions with positive gravity changes increased throughout the study area, and the gravity field variation around the epicenter turned from negative to positive. Negative gravity anomalies appeared in the eastern part of the Horgos–Manas–Turpan fault, north of Urumqi City, and in other local areas, suggesting that the tectonic stress field and subsurface medium distribution in the Urumqi piedmont depression region had recovered after the earthquake. On 20 January 2018, a magnitude 4.9 earthquake occurred at the junction of positive and negative gravity changes in the Urumqi area, presenting apparent correlations with the positive gravity variation anomalies at the foothills of the North Tianshan Mountains. Figure 5c shows the gravity change pattern in the study area from August 2018 to July 2019, which presents as completely changed, with the foothills of the North Tianshan Mountains and the Urumqi piedmont depression region showing negative gravity variations and the southern Junggar Basin turning into a positive gravity change zone. On 18 August 2018, another magnitude 4.9 earthquake occurred in Hutubi; at this time the gravity field anomaly was changing from positive to negative, which further indicates that subsurface medium migration or exchange might occur in the study area. It has been frequently reported that moderate to strong earthquakes tend to occur in the four quadrants of gravity changes, anomalous regions showing alternating positive and negative gravity changes, or areas with a strong gravity gradient [1,53,54].
Figure 5d demonstrates the gravity change pattern in the study area from July 2019 to August 2020. Compared with Figure 5c, most of the study area was dominated by negative gravity changes, and the region with positive change was migrating southward in the horizontal direction. The degree of negative gravity variation increased in the western part of the study area, including the Cholma region, indicating that migration of subsurface materials from the west to the east was again occurring in the study area. There was an isolated point of positive gravity change in the Shihezi area, suggesting that tectonic stress might be accumulating in this region. Figure 5e shows the gravity change pattern in the study area from August 2020 to July 2021. Regions with positive gravity changes were distributed in Dushanzi, Shihezi, and Cholma and extended along the Horgos–Manas–Turpan fault to the north of Urumqi. The foothills of the North Tianshan Mountains still showed negative gravity changes. On 8 August 2020, a magnitude 4.9 earthquake occurred in Toksun County, a transition zone between positive and negative gravity anomalies. This seismic signal was once again correlated with the gravity field anomaly. Figure 5f shows the gravity change pattern in the study area from July 2021 to July 2022. The gravity field in the study was dominated by positive changes, with negative gravity variations only locally distributed in Urumqi. The enhanced degree of gravity field changes in the study area indicates that the energy level in this region increased and that tectonic stress was accumulating.
The time-varying gravity field in the study area exhibited clear zoning features with smooth changes. Although the magnitude of the gravity variations was not drastic, the site values showed alternating positive and negative changes. Comparison with the seismic events and fault activities in the study area suggests an apparent correlation between the earthquake clusters and gravity anomalies. These earthquakes mostly occurred in the regions with a high gravity gradient or the anomalous zones with alternating positive and negative gravity changes [55]. Considering the regional tectonic background, it can be concluded that the study area is still at risk of moderate to strong earthquakes.

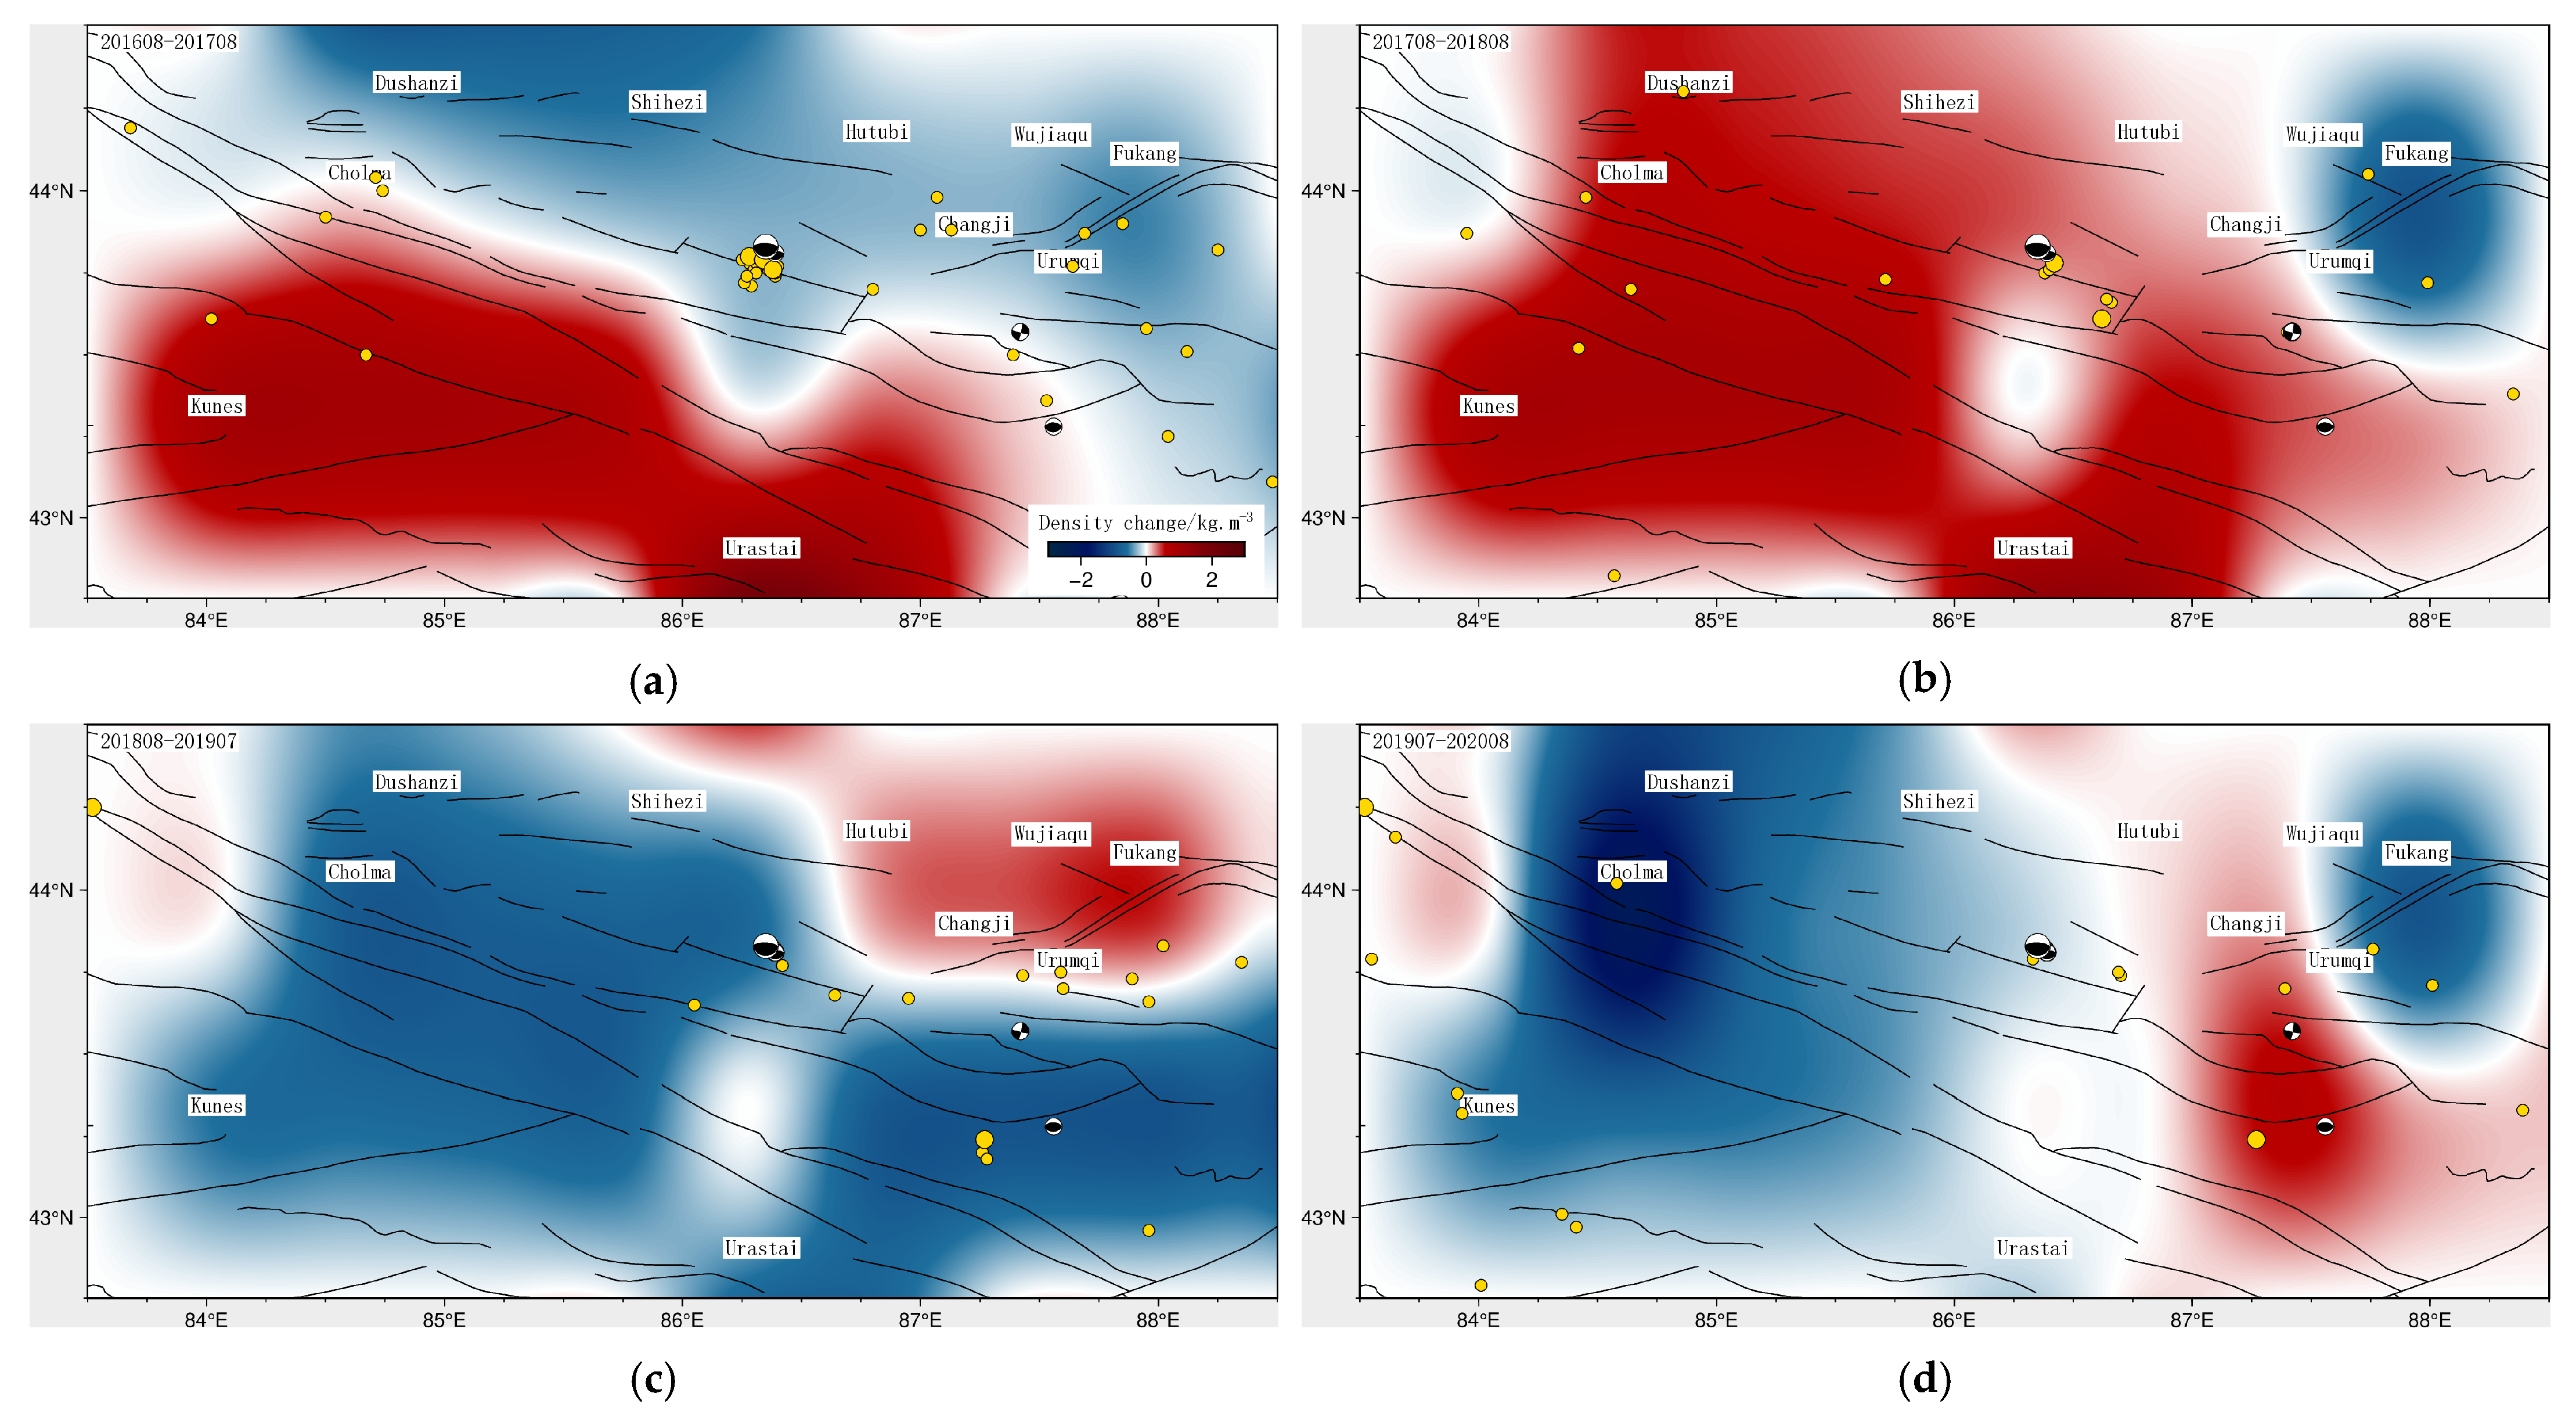
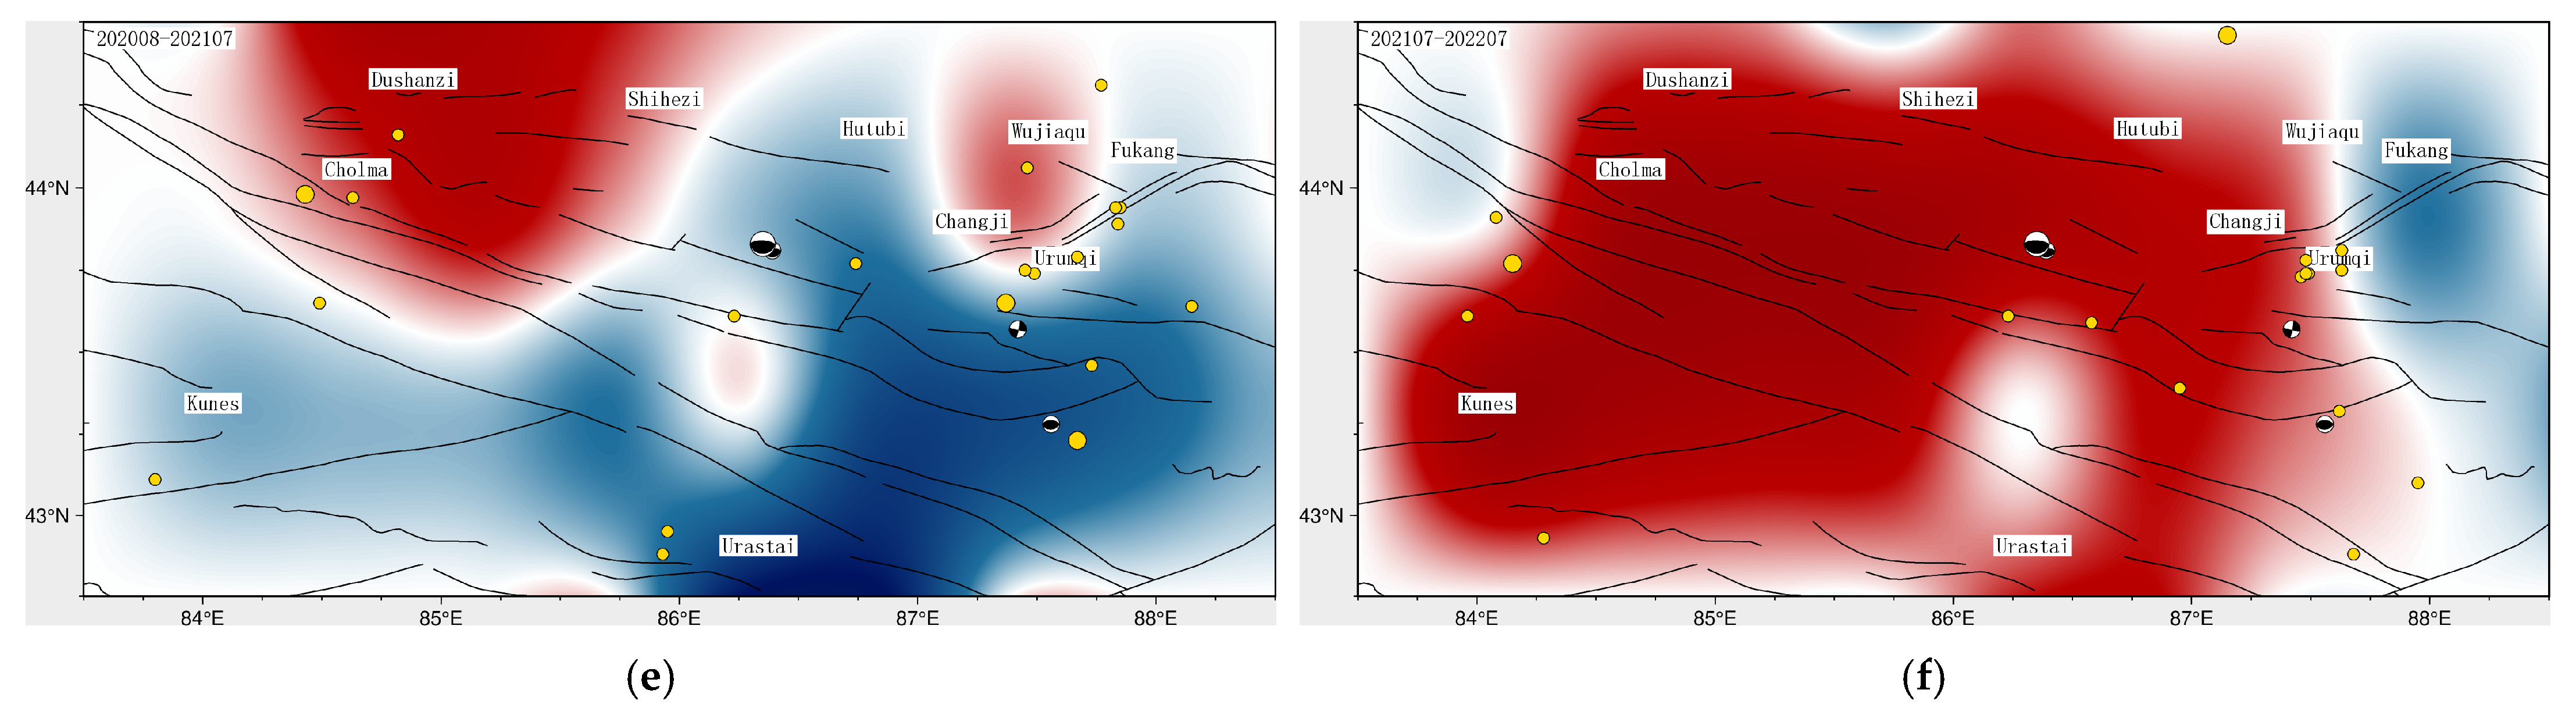
3.1.4. Apparent Density Changes of the Sources

Based on the adjustment results of the mobile gravity observations in the study area, we used the equivalent source inversion method to obtain crustal apparent density values (Figure 6). The geographical elements in this diagram are the same as those in Figure 5. Strictly speaking, the gravity variations are closely related to environmental factors local to each monitoring station, such as the migration of subsurface fluids, soil moisture, vehicle vibration, and elevation changes [12]. These factors, which are difficult to determine, can be uniformly defined as external factors of the sources. They are highly contingent on small-scale drivers and difficult to quantitatively eliminate. Reducing any of them to a fixed value will affect the reliability of the results. In this study, we therefore adopted the equivalent source inversion method and introduced the a priori condition of space–time smoothing into the inversion model to suppress anomalous signals, such as local disturbances and source errors. This allowed us to more accurately extract the anomalous time-varying gravity field signals and determine the parameters of the source model.
For the inversion, we selected equivalent crustal density anomalies of 1 km thickness at a depth of 10 km in the study area that could be effectively detected by repeated surface gravity measurements. The characteristics of apparent density variations obtained by inversion are similar to the evolution trends of the gravity values, and the major anomalous regions are consistent. Data (crust1.0) show that the average crustal density in the study area is approximately 2700 kg·m−3, and the apparent density variation of the sources in the study area is roughly ±3.0 kg·m−3. The inverted density variation is about 1‰ of the crustal density. The time scale of each panel in Figure 6 is the same as that in Figure 5, and the color bar for the time-varying gravity field variation is consistent with that for crustal apparent density variations to allow for a better illustration of the anomalous features revealed by the inversion.
Figure 6a shows the apparent density variation pattern in the study area from August 2016 to August 2017. Apparent density anomalies were generally distributed along the trend of the tectonic structures, with distinct zoning features. The Urumqi piedmont depression was a region with negative changes, while the foothills of the North Tianshan Mountains showed positive variations. These density changes verified our inference based on the gravity changes described above, i.e., that the crustal media were migrating from the north to the south. There was an incongruous negative anomaly at the epicenter location, where the density variation contour bends southward, out of line with the tectonic trends. We believe that this feature was not simply caused by noise but very likely constitutes a manifestation of deep crustal material migration before and after the earthquake. According to the theory of isostasy, the regional uplift of the crust will lead to a decrease in its density, thus achieving a state of mass balance among different regions [56]. Therefore, the anomaly shown in Figure 6a may reflect the influence of post-seismic surface deformation and crustal uplift on subsurface media; that is, the seismic activity led to crustal uplift, which induced a decrease in crustal density. The possible reasons for this anomaly are further discussed and verified in combination with the InSAR data in the next section. Figure 6b shows the apparent density change pattern in the study area from August 2017 to August 2018. The region with positive apparent density variation, which was previously distributed along the trend of tectonic structures, significantly expanded toward the north, and the negative anomalies were only distributed in a small area northeast of Urumqi. This phenomenon suggests that the crustal density deficit at the Urumqi piedmont depression was restored after the earthquake. On 20 January 2018, a magnitude 4.9 earthquake occurred at the junction of positive and negative gravity field changes in the Urumqi area, with an epicenter also located at the junction of positive and negative changes in apparent density. We suggest that the migration of subsurface materials altered the tectonic stress field, thereby triggering the fault activity. Figure 6c shows the apparent density change pattern in the study area from August 2018 to July 2019. The regions with positive and negative apparent density changes in the study area were completely interchanged, with the foothills of the North Tianshan Mountains and the Urumqi piedmont depression showing a decrease in apparent density and the north of Urumqi City and the Hutubi area showing an increase. During the crustal density change, a magnitude 4.9 earthquake occurred again in Hutubi on 18 August 2018. Figure 6d shows the apparent density change pattern in the study area from July 2019 to August 2020. The zoning features in the study area became more prominent, with an enhanced negative apparent density change in the Dushanzi area, and the region with an increase in apparent density shifted to the south, indicating that crustal material migration occurred again from the west to the east in the study area. Figure 6e shows the apparent density change pattern in the study area from August 2020 to July 2021, displaying obvious zoning features. The regions with an increase in apparent density expanded around Dushanzi, Cholma, and Shihezi but shrunk around Urumqi. The degree of apparent density decrease at the foothills of the North Tianshan Mountains was reduced. On 8 August 2020, a magnitude 4.9 earthquake occurred in Toksun County, where the apparent density change was turning from positive to negative, once again corresponding to the crustal material migration feature in this region. Figure 6f shows the apparent density change pattern in the study area from July 2021 to July 2022, displaying a predominantly increasing trend, while an apparent density decrease was only locally distributed in Urumqi. This increase in apparent density in the study area suggests that the tectonic stress had been accumulating and that the energy level in the study area may be increasing.
In summary, the positive and negative equivalent apparent density anomalies in the study area show zoning characteristics, and their spatial distribution pattern has been evolving and repeating. The source variation features correspond well to the seismicity pattern, and their measurement accuracy is sufficient for further studies on the magnitude of equivalent apparent density changes obtained by inversion. For our study area, the inversion results of the sources’ apparent density can serve as the basis for analyzing local seismicity and determining the sources of future seismic risk.

3.2. Tectonic Significance of the Middle Segment of the North Tianshan Mountains

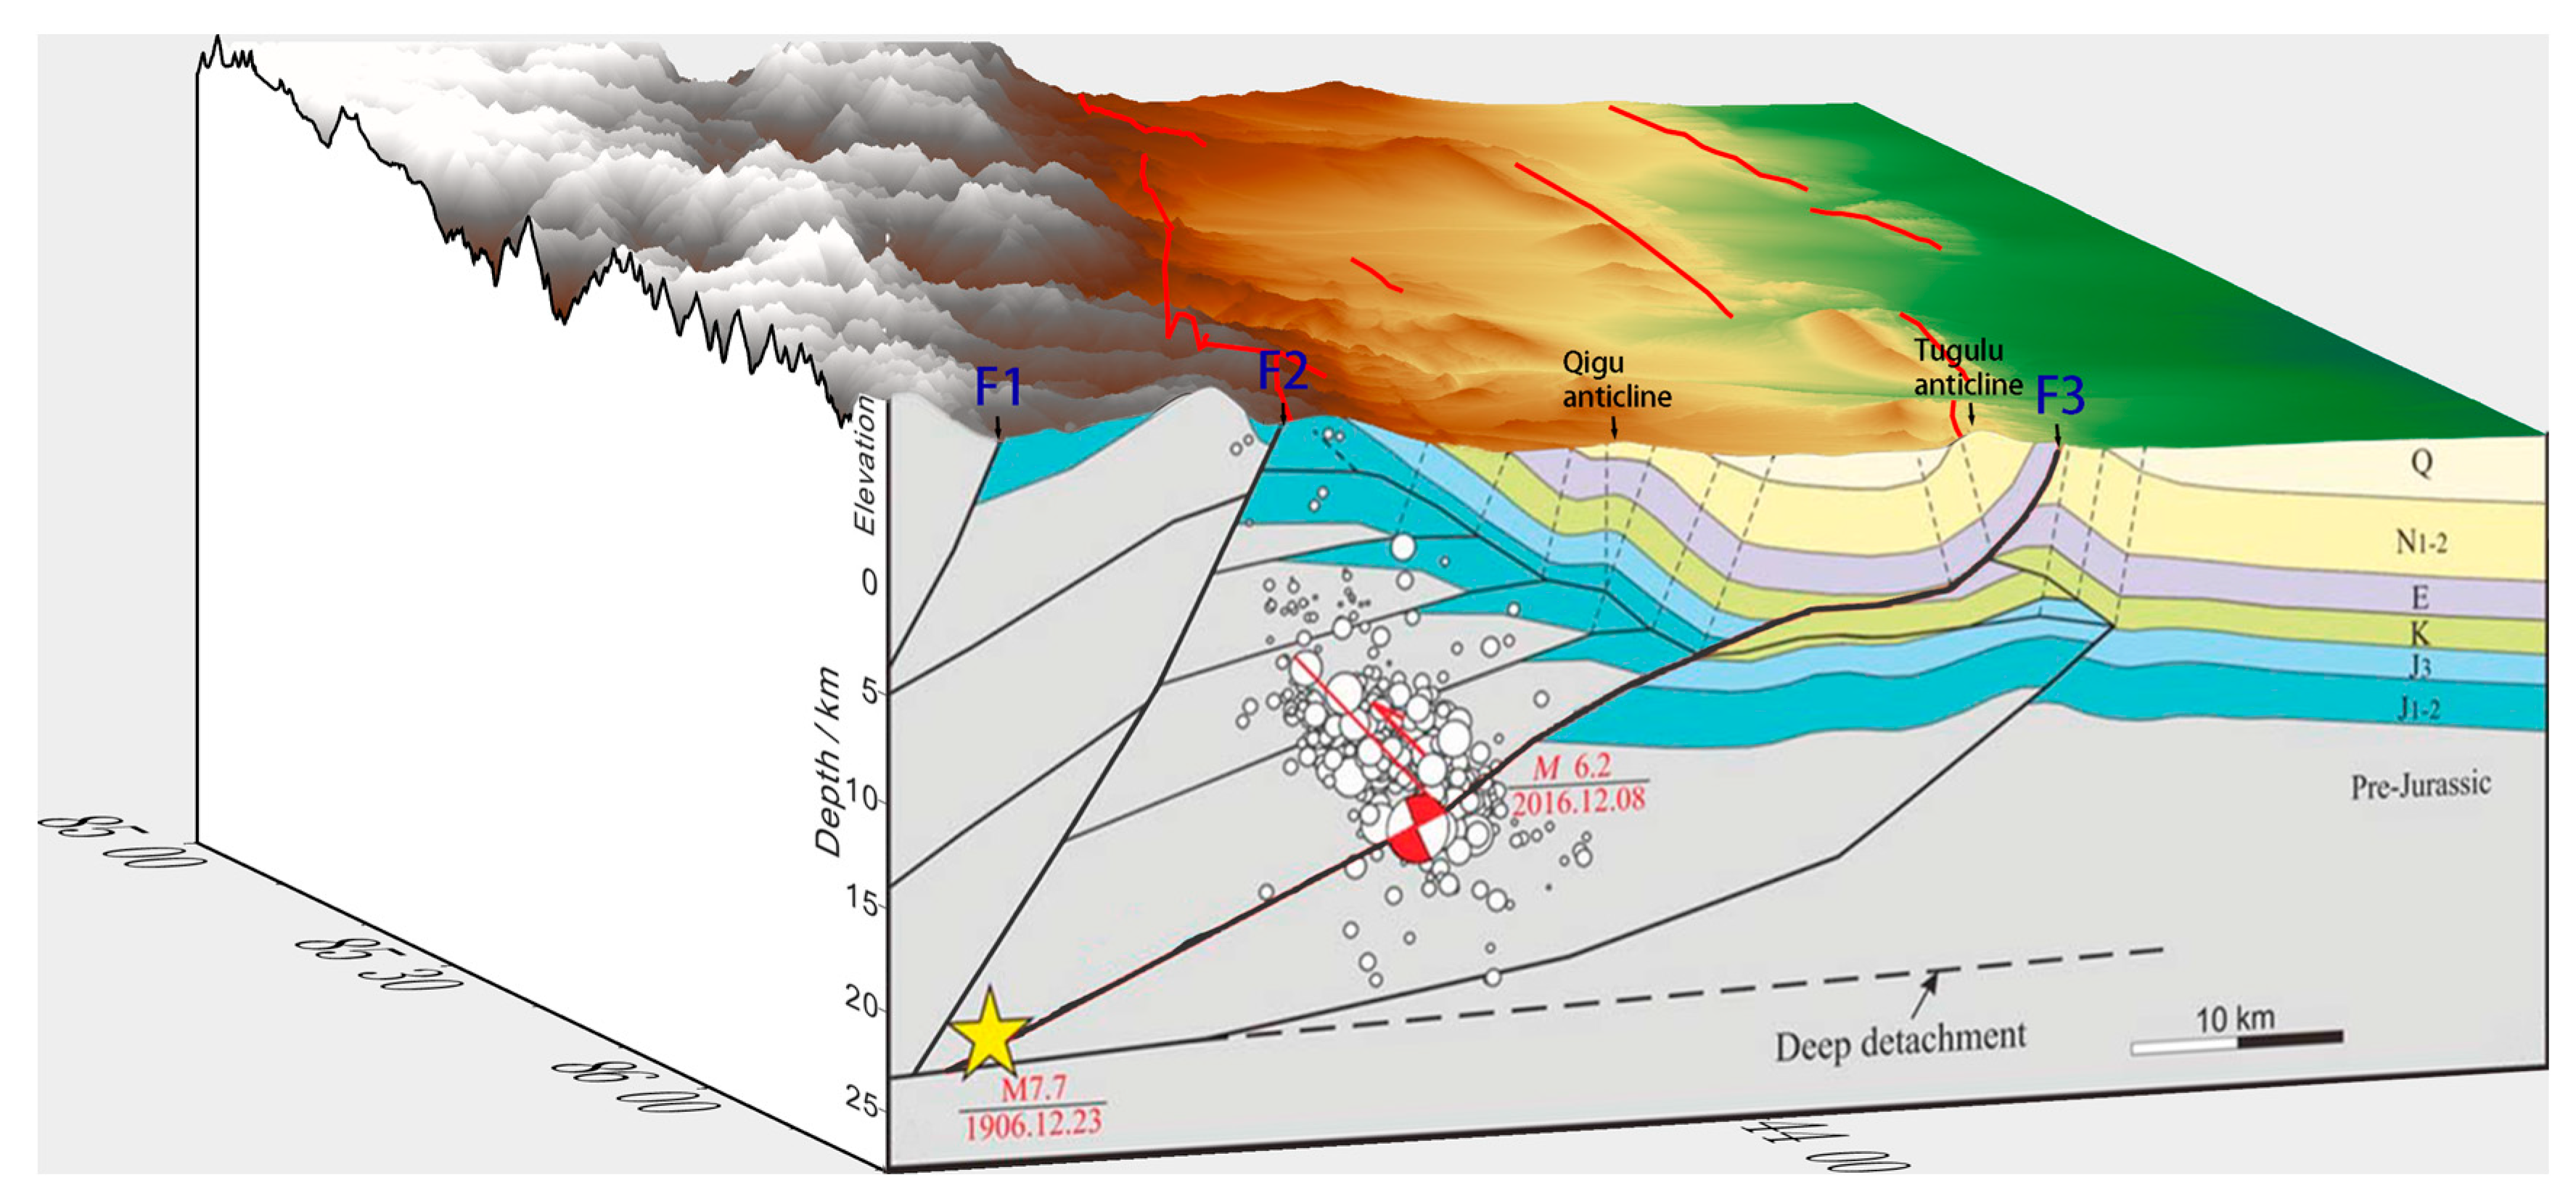
3.2.1. The Hutubi Earthquake

Regional tectonic movements are closely related to seismicity. Analyzing the seismogenic structures and focal mechanisms of moderate to strong earthquakes in an area can help in the interpretation of the area’s tectonic significance. According to the China Earthquake Networks Center, a magnitude 6.2 earthquake occurred in the Hutubi area on 8 December 2016, Beijing time, with the mainshock epicenter located at 43.83° N, 86.35° E, and with a focal depth of 6 km. The earthquake has been the subject of much subsequent research. Kong et al. [57] reported out that the aftershocks were concentrated to the west of the mainshock, and they inferred, based on the focal mechanism and the spatial distribution of the aftershock sequence, that the Junggar South Margin fault was the seismogenic structure of the Hutubi earthquake. Liu et al. [58] suggested that the seismogenic structure of this earthquake was a north-dipping thrust fault, probably formed by fault inversion. Lu et al. [41] concluded that the focus of this earthquake was at a depth of 16.5 km, located near the Horgos–Manas–Tugulu fault; they consequently suggested that both the Hutubi earthquake and the 1906 Manas earthquake occurred on the Horgos–Manas–Tugulu fault. Yang et al. [42] performed cut-and-paste inversion to obtain the focal mechanism of the earthquake and speculated that the seismogenic fault might be the south-dipping Qigu fault. As shown by the inverted equivalent apparent density changes described above, there existed an anomaly around the epicenter of the Hutubi earthquake between August 2016 and August 2017 (Figure 6a). We believe that this feature could be a direct manifestation of the crustal density change induced by the movement of the subsurface tectonic system before and after the earthquake; this is further explored below. Due to the scarcity of GPS stations in the study area, no coseismic signals of this earthquake were recorded, and the brief observation period prevented obtaining a significant transient response of the time-varying gravity field to the earthquake. Therefore, we chose to use the SAR data to comprehensively study the earthquake with the D-InSAR technique in combination with the time-varying gravity field and crustal apparent density with the aim of interpreting the tectonic significance of the entire middle segment of the North Tianshan Mountains.

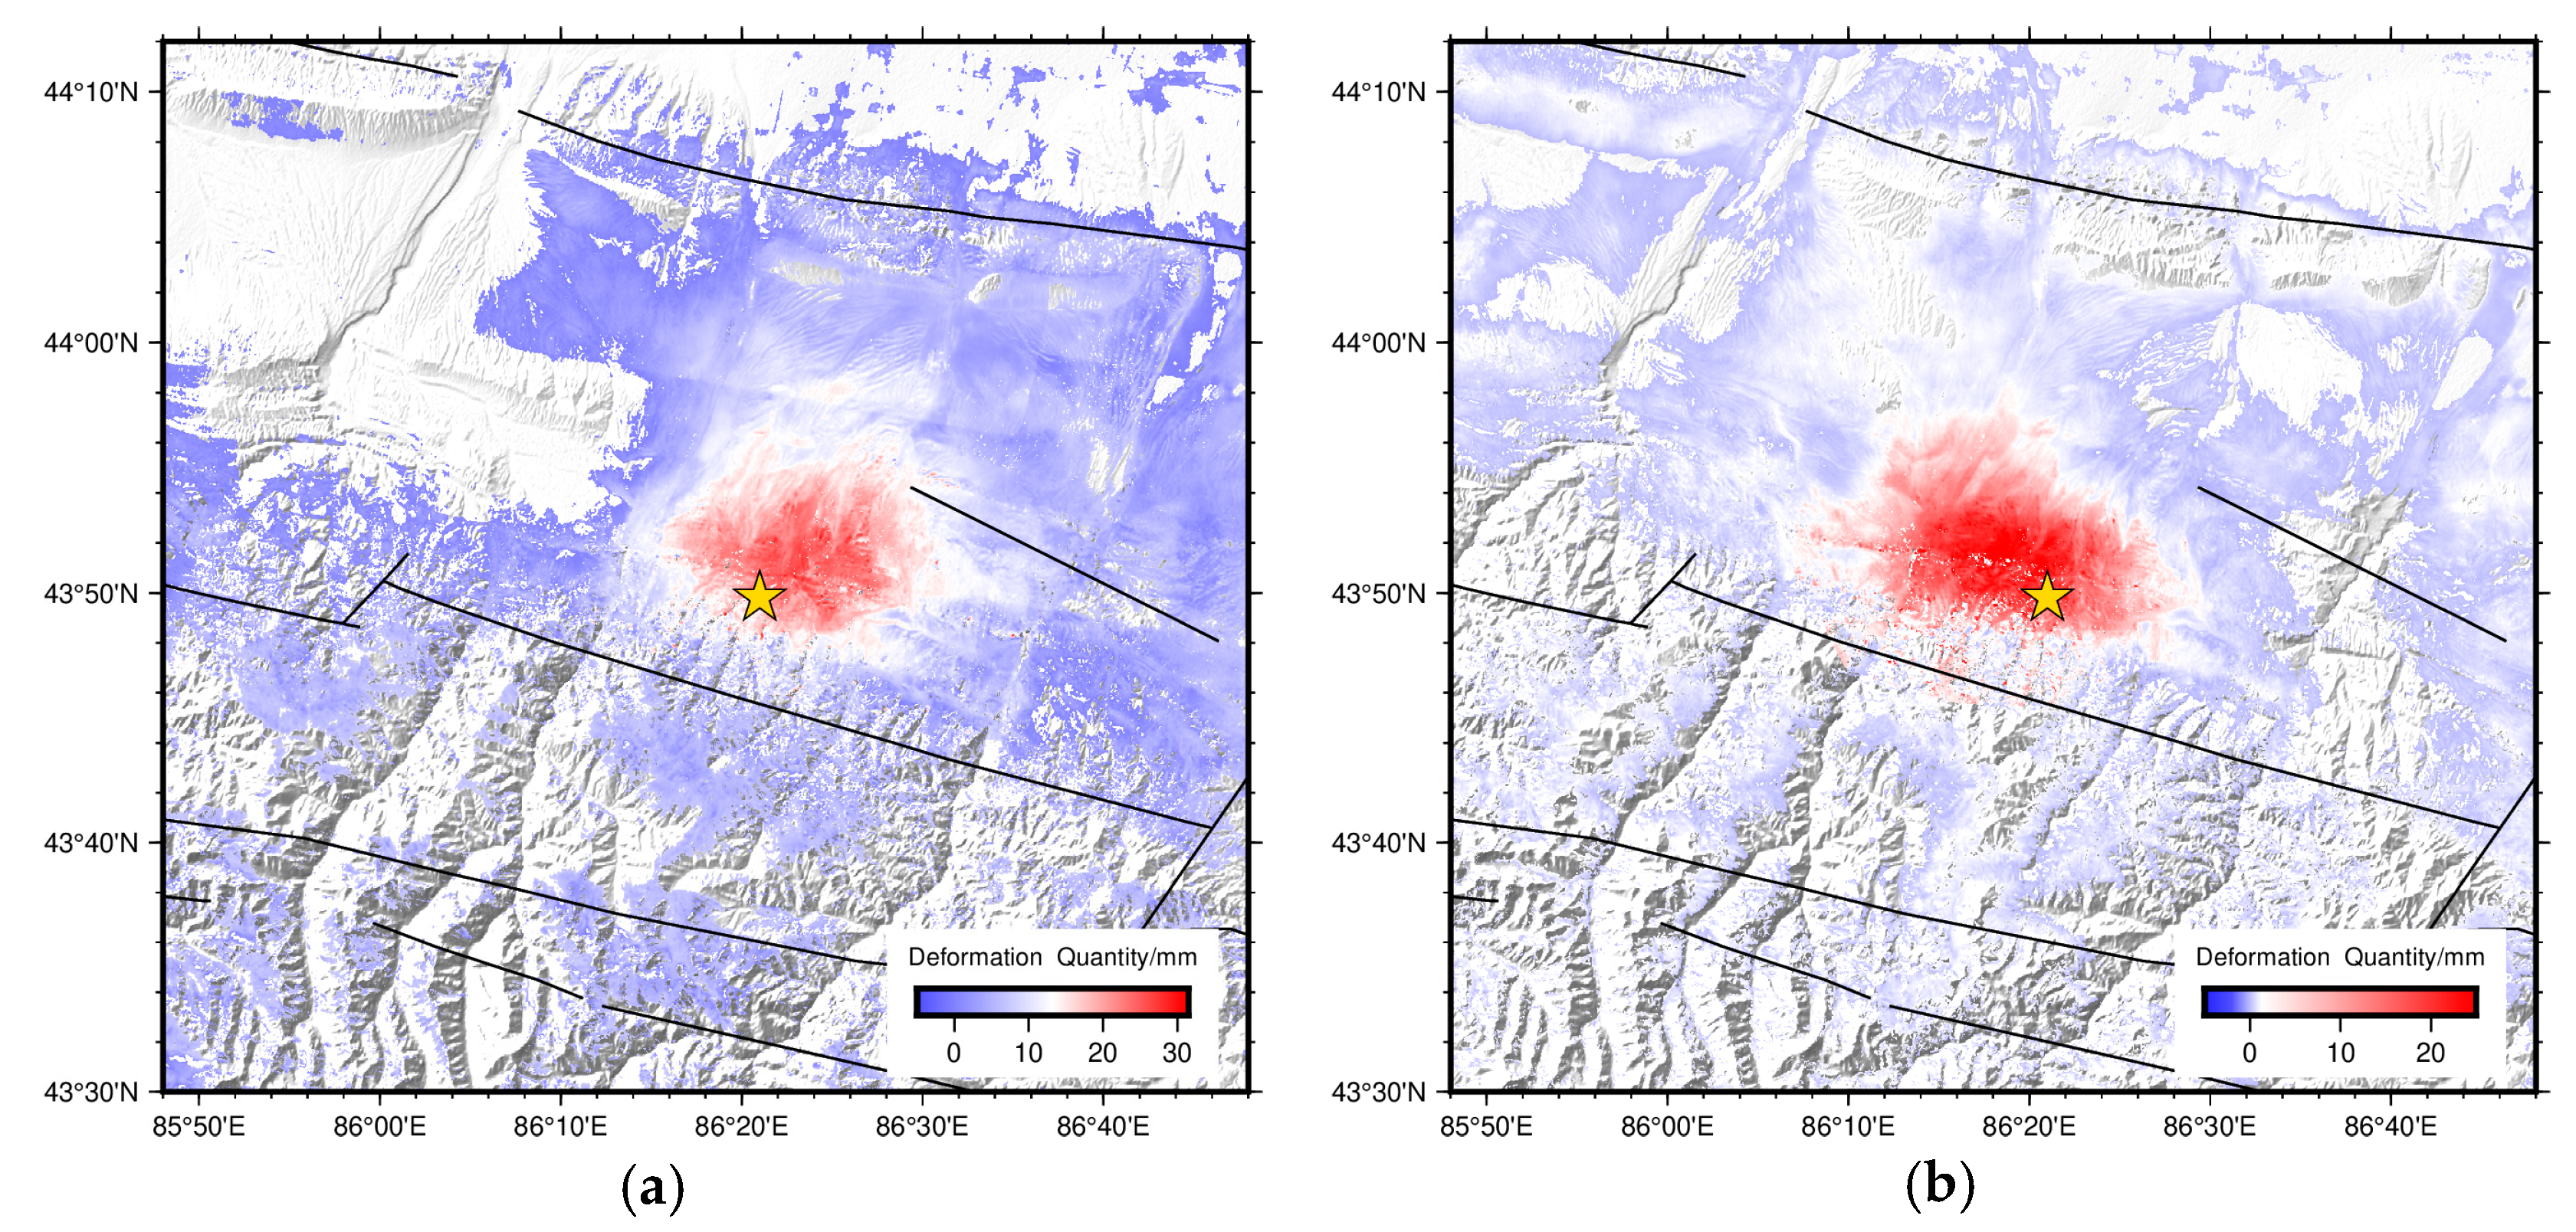
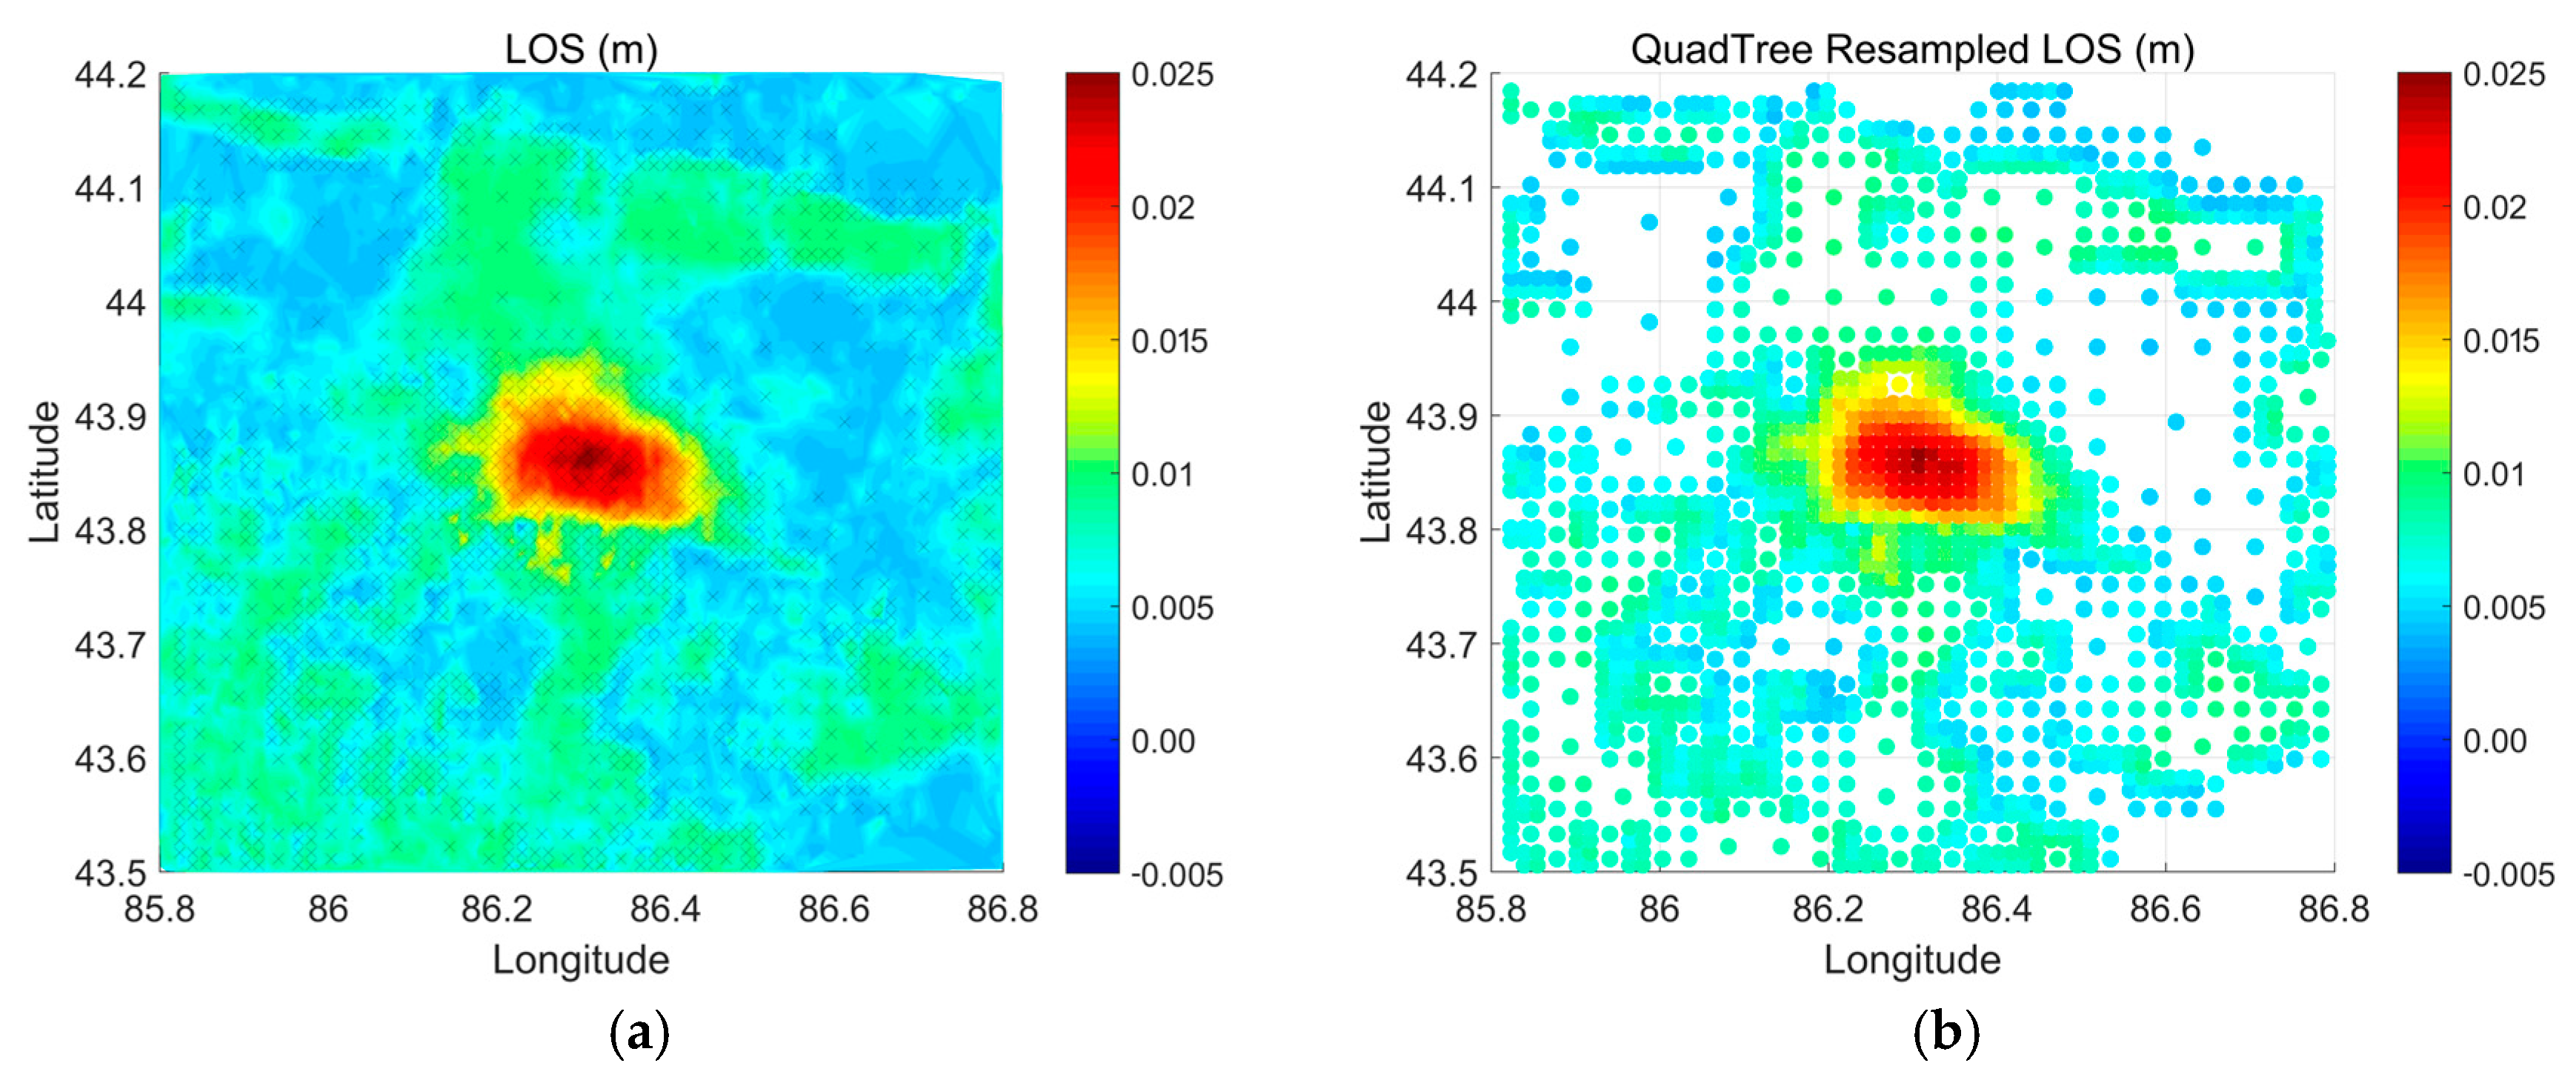
3.2.2. InSAR Coseismic Deformation Field

We employed C-band Sentinel-1A TOPS-mode SAR images from both the ascending and descending tracks provided by the European Space Agency (ESA) to obtain the line-of-sight (LOS) coseismic ground deformation field using the D-InSAR technique. The parameters of the SAR images are listed in Table 1.
We used the GMTSAR software (UC San Diego: Scripps Institution of Oceanography) for data processing and made use of ESA high-precision orbit data, SRTM DEM data published by NASA (with a spatial resolution of 30 m), and GACOS atmospheric data for orbital correction, topographic phase removal, and atmospheric phase weakening, respectively. The interferograms were processed by Gaussian filtering to raise their signal-to-noise ratio. Then, we applied the minimum-cost flow method for phase unwrapping [59] and established bilinear trend surfaces for the orbits based on the far-field data in the coseismic deformation field to remove the trend of residual phases generated by the errors in the high-precision orbital data [60]. After geocoding and phase transformation, the coseismic deformation fields from the ascending and descending tracks covering the entire study area were obtained (Figure 7).
Figure 7 shows that the coseismic deformation field of the Hutubi earthquake had an irregular elliptical shape. It was located on the north side of the Junggar South Margin fault, crossed through by several fold belts. The InSAR images from both the ascending and descending tracks show positive deformation signals in the earthquake region. After removing the noise interference, the maximum displacement in the LOS direction was 30 mm in the ascending track image (Figure 7a) and 25 mm in the descending track image (Figure 7b). The surface deformation caused by the earthquake was relatively small, and the fault rupture did not extend to the ground surface, indicating that the earthquake-induced ground deformation was mainly controlled by the uplift movement. Thus, the surface displacement associated with the Hutubi earthquake might have been caused by fault thrusting, which agrees with the focal mechanisms provided by the USGS and GCMT.

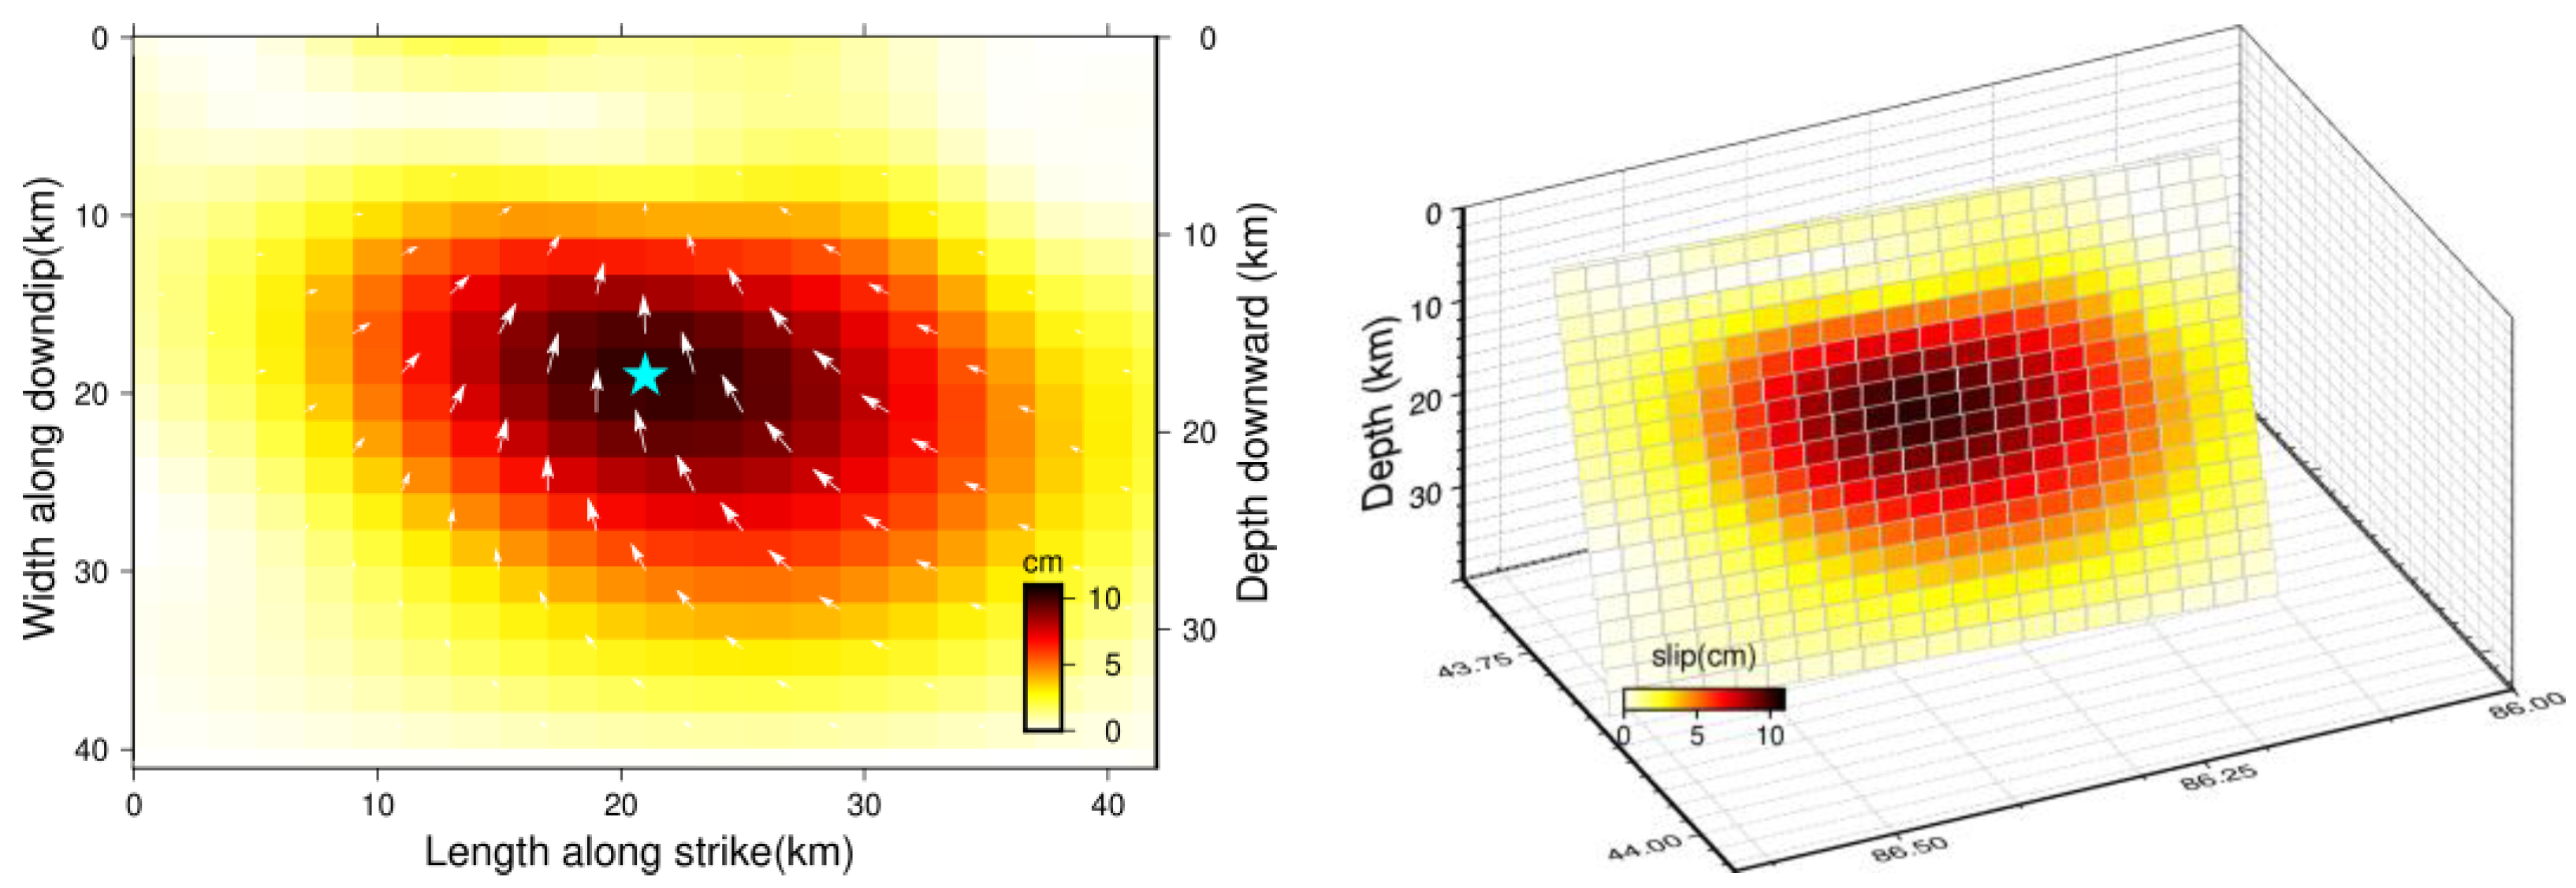
3.2.3. Inversion of the Coseismic Fault Slip Model

Using the acquired InSAR ascending and descending track data as constraints, we obtained the parameters of the seismogenic fault using the simulated annealing inversion method based on the theory of dislocations in an elastic half-space. We then conducted linear inversion to obtain the fault slip characteristics, finally deriving the geometric position of the slipping fault and the fault movement model. The spatial continuity and wide coverage of the ascending and descending track data selected for this study resulted in a large data volume, which had to be downsampled to improve computational efficiency. To ensure the reliability of the results, we first masked the deformation field based on the coefficient of coherence to remove values with low accuracy. Then, the unmasked area was downsampled using the quadtree sampling method [61] to retain the completeness of deformation characteristics in the study area. Because the quadtree sampling method can effectively compress the data while keeping the deformation information well and can achieve the purpose of noise elimination to a certain extent, it has good universality. And, compared with other methods, the quadtree sampling method has the advantages of being a simple algorithm, and having fast calculation efficiency and wide application. The results are shown in Figure 8.
The relocating of the Hutubi earthquake and its aftershocks [57,62] revealed that the aftershocks were mainly concentrated to the west of the mainshock. Based on the characteristics of the coseismic deformation field and the spatial distribution of the aftershock sequence and in view of the wedge-shaped structural characteristics of the fault system in the fold belts north of the North Tianshan Mountains, we preliminarily constructed a north-dipping wedge-shaped fault model with a length of 40 km to describe the seismogenic structure of the Hutubi earthquake. The search intervals for the optimal strike, dip angle, and focal depth were set as [260°, 280°], [5°, 80°], and [−20 km, −5 km]. The optimal geometric parameters determined using simulated annealing consisted of a strike of 276°, a dip angle of 70°, a depth of −17.85 km, a slip angle of 98.77°, and an earthquake magnitude of Mw5.98. A comparison to focal mechanism parameters sourced from different institutions and researchers (Table 2) suggests that these strike, dip angle, slip angle, and focal depth values are within a reasonable range.
After obtaining the geometric parameters of the fault plane, we discretized the fault plane into small rectangular blocks of 2 km × 2 km and inverted the motion vectors of the fault plane under the constraints of the downsampled deformation fields from the ascending and descending tracks, in order to obtain a detailed fault slip distribution. The resulting reverse fault slip distribution of the Hutubi earthquake is shown in Figure 9. The length, width, and depth of the fault plane were approximately 40 km, 40 km, and 35 km, respectively; the arrows represent the motion vectors of the discretized fault slips. The coseismic fault slip was mainly distributed at a depth of 10–30 km, in a range of 40 km long along the strike. The maximum slip was approximately 10 cm at a depth of approximately 15–20 km. The model suggests that the seismogenic structure of the Hutubi earthquake was a north-dipping thrust fault with a small slip magnitude and that the fault rupture did not extend to the ground surface. Research based on teleseismic data has shown that the spatial coherence of the north-dipping fault with the aftershocks was significantly higher than that of the south-dipping fault, indicating that the 2016 Hutubi earthquake likely resulted from the movement of a north-dipping reverse fault [58]. Therefore, here, we only discuss the north-dipping fault, and conclude that the parameters obtained from the experiments are in line with the actual situation. Combining the data and experimental results, we believe that the north-dipping fault obtained by the inversion carried out in this study was the seismogenic fault of the 2016 Hutubi earthquake.

3.3. Tectonic Significance of the Study Area

Figure 10 shows the geological profile inferred from the seismic reflection data of the 2016 Hutubi earthquake. Figure 10 is modified from Lu et al. [41]. The location of this profile is marked by the solid cyan line in Figure 1. Prominent fold-and-thrust belts developed in the North Tianshan foreland basin, with the solid lines indicating the interpreted faults and the dashed lines representing the axial planes. F1 denotes the Yamate fault, F2 the Junggar South Margin fault, and F3 the Horgos–Manas–Tugulu fault. The solid white circles indicate the aftershocks of the Hutubi earthquake, and the solid black lines passing through them are possible seismogenic faults. The yellow star marks the epicenter of the 1906 Manas earthquake, and the solid white circles indicate the aftershocks, whose spatial distribution implies that the seismogenic fault should be a north-dipping fault. However, as no north-dipping faults have been detected in this region, we suggest that the mainshock of the Hutubi earthquake might have occurred on a north-dipping blind fault at a depth of 5–20 km. This structure is extremely similar to the fault model obtained by the inversion described above; this also verifies that the inverted fault model fulfils the research requirements and expectations. F2 and F3 extend downward and finally intersect the detachment plane at a depth of about 24 km. Between them, strata of different ages overlap to form a wedge structure. The geological structures depicted in this figure are extremely complex, and the deformation characteristics of these faults and their related folds are similar to those of large-scale wedge structures [63,64,65], being composed of small wedges formed under forward and backward thrusts [66]. Blind faults usually occur as individual faults, sets of faults, or thrust systems. The overlapping strata may respond to a blind fault system by back-thrusting, coupling, forward-thrusting, or sedimentation [67]. The thrust structure of a large-scale tectonic wedge contains many blind faults, but F2 and F3, rupturing at the ground surface, are not blind faults. The Hutubi earthquake did not cause any surface rupture as its epicenter was deep, and its magnitude was not particularly great.
The 1906 Manas earthquake occurred at a much greater depth, but historical records show that it caused considerable damage. According to its deep structural features and the regional tectonic background, this may have been because energy was released at a deep blind fault under the reactivated uplift of the Tianshan orogenic belt, which triggered tectonic activities at a shallow depth that resulted in violent crustal deformation. The young fault scarps along the Horgos–Manas–Tugulu thrust fault–anticline belt may be surface ruptures associated with the M 7.7 Manas earthquake [33,68]. Therefore, we believe that the triggering mechanism of the 2016 Hutubi earthquake may be similar to that of the 1906 Manas earthquake, both of which were initiated by deep fault activities. The 2016 Hutubi earthquake might have been induced by the slip of a blind fault at a depth of 5–20 km under tectonic stress, which in turn caused the movement of deep tectonic systems that manifested as the uplift of the ground surface at the epicenter.
Our study area is located in the middle segment of the North Tianshan Mountains, between the northern margin of the Tianshan Mountains and the Junggar Basin. The Tianshan orogenic belt is one of the largest orogenic belts within the Asian continent and was formed by multiple phases of plate subduction and collision [69,70,71]. The 2016 Hutubi earthquake occurred right on a fold-and-thrust belt within the Urumqi piedmont depression, a region that absorbs about 50% of the shortening from the collision between the Indian and Eurasian plates [72,73,74]. This earthquake was the largest to occur in the North Tianshan fold-and-thrust belt in the past century (1916–2023), and it released some of the accumulated strain in the northern part of the Tianshan fold-and-thrust belt [75]. The formation of fault-related folds can be explained by the upper crustal folding associated with brittle processes [64,76,77]; these fold structures have played an important role in coseismic deformation [78,79,80,81,82]. The occurrence of the 2016 Hutubi earthquake revealed a macroscopic tectonic background that suggests that the back-thrusting of the wedge structure in the Tianshan area offset the tectonic displacement from the Tianshan Mountains. Conclusive evidence can be obtained from the surface deformation pattern and the inverted fault model, both of which indicate that the Hutubi earthquake was caused by blind thrusting and the associated folding of the overlying strata in the North Tianshan fold-and-thrust belt.
The geological structures in the study area are mainly manifested as east–west trending faults, and the risk of fold-type earthquakes is high in the northern part of the Tianshan fold-and-thrust belt [36,83]. Our analysis of the earthquakes associated with deep blind thrust faults and fault-related folds suggests that attention should be paid to the shallow folding activities within active fold-and-thrust belts, since the faults developed in these shallow fold belts may be ruptured during moderate to strong earthquakes occurring on deep faults and in some cases generate more severe consequences than the mainshocks. At the same time, the activities of deep blind faults and the folding within thrust belts should also be monitored, as the macroscopic tectonic background they reflect constitutes an important basis for studying the tectonic significance of the study area and the entire Tianshan orogenic belt.

4. Discussion

The time-varying gravity field in the study area over the past 6 years was characterized by apparent zoning of positive and negative anomalies, and the transition between anomalous zones was found to be smooth. Positive and negative gravity changes appeared alternately but at a moderate magnitude. A comparison with the seismic activities in the study area shows an apparent correlation between earthquake clusters and gravity anomalies; earthquakes mostly occurred around areas in the high strain zones, in the four quadrants of gravity anomalies, or in the anomalous regions showing alternating positive and negative gravity changes. Before the 2016 Hutubi earthquake, the time-varying gravity field around its epicenter appeared as a transition zone between positive and negative gravity anomalies.
The apparent density variations obtained by equivalent source inversion are matched well with the time-varying gravity field changes. The positive and negative equivalent apparent density anomalies show a prominent zoning characteristic, with an evolving and repeating spatial distribution pattern (Figure 6). The source variation features exhibit a good correlation with the seismicity pattern. Seismic activities mostly occurred in regions with dramatic apparent density changes, such as the transition between positive and negative changes and rapid apparent density increases or decreases. The crustal apparent density inversion in this study fulfils the research objective. The examined evolutions of the time-varying gravity field and spatial and temporal crustal apparent density distribution can serve as a basis for analyzing the seismic activity and determining future seismic risk in the study area.
We used the 2016 Hutubi earthquake as a case study to thoroughly explore the tectonic significance of the deep part of the study area by examining the geometric parameters of the earthquake’s seismogenic fault. The fault model of the earthquake was obtained by inversion based on the SAR-derived coseismic deformation field, and the focal mechanism of this earthquake was investigated to explore the transient response of the subsurface tectonic system to the earthquake. Finally, the tectonic structures were extended to the entire study area. This was done to discuss the regional tectonic background and interpret the tectonic significance of the area’s deep layers. The aim was to provide a basis for elucidating local seismogenic mechanisms and enabling early earthquake warnings. The regional time-varying gravity field was obtained by THRGO to extract and analyze the long-term features involved in the earthquake preparation process. Further, the coseismic deformation field was obtained from the SAR data to invert the fault model and synthetically reflect the transient response of the tectonic system to the occurrence of an earthquake. This approach can not only make up for the shortcomings of the THRGO system, which is not able to capture the transient features of earthquake events, but also provides detailed background information on regional seismic risks and tectonic evolutions for coseismic deformation studies. For example, Zhang conducted inversion algorithms and simulation experiments on a spherical model of the time-varying gravity field, and Wang used the gravitational field changes before and after the Lushan earthquake in 2013 to reveal the transfer of deep matter.
Previous studies have shown that the Junggar block is subducted beneath the Tianshan block under near north–south compressive stress, forming a multi-layered wedge-shaped thrust system in the shallow crust of the Tianshan piedmont in the study area [84]. Although earthquakes in the study area have mainly occurred on shallow blind thrust faults or fault-related folds, moderate to strong earthquakes on deep faults can also trigger ruptures at shallow depths, resulting in even more serious consequences than the mainshock. The deep blind faults and fault-related folds present in the study area should therefore also receive attention. The spatiotemporal variations in the gravity field can reflect the movements of major tectonic faults in the monitored area [2], and deep tectonic activities are also capable of altering the surface gravity field [85]. This enables the extraction and analysis of anomalous gravity field signals to evaluate the seismic risk of a region. Because the inversion of crustal apparent density can reflect deep material migration and medium flow, the comprehensive analysis of the apparent density variation trend and the tectonic activity background can help in the identification of possible anomaly signals before an earthquake, which is essential for seismic risk assessment and early earthquake warnings.

Author Contributions

Conceptualization, X.K. and D.L.; methodology, X.K. and D.L.; software, X.K., A.Y. and R.C.; validation, X.K., A.Y., and R.C.; formal analysis, X.K.; investigation, X.K. and R.C.; resources, X.K., A.Y., R.C. and L.C.; data curation, X.K., D.L., A.Y., J.L. and R.C.; writing—original draft preparation, X.K. and D.L.; writing—review and editing, X.K. and D.L.; visualization, X.K. and R.C.; supervision, D.L., A.Y., J.L., L.C., and R.L.; project administration, D.L., X.K., A.Y., and J.L.; funding acquisition, D.L. All authors have read and agreed to the published version of the manuscript.

Funding

This work was jointly supported by the Xinjiang Uygur Autonomous Region Key R&D Project (2020B03006-2), Spark Program of Earthquake Science and Technology (XH22007YA), Natural Science Foundation of the Xinjiang Uygur Autonomous Region (2022D01A106, 2023D01A105), National Natural Science Foundation of China (42274014), Intelligence Introduction Project of the State Administration of Foreign Experts Affairs (G2022045013L), the Third Xinjiang Scientific Expedition Program (2022xjkk1305), and Science and Technology Innovation Team Program of Xinjiang Seismological Bureau (XJDZCXTD2020-1).

Institutional Review Board Statement

Not applicable.

Data Availability Statement

The data presented in this study are available on request from the corresponding author. The data are not publicly available due to the unavailability of ground gravity data to the public.

Acknowledgments

We thank all the teachers who participated in the North Tianshan mobile gravity observation for their hard work; the Management Department of Gravity Observation Technology of China Earthquake Administration for providing the relevant basic data; the developers of the GEOIST open source Python package (https://cea2020.gitee.io/geoistdoc/ (accessed on 1 January 2024)) and GMTSAR software (https://github.com/gmtsar/gmtsar (accessed on 1 January 2024)), which provided support in this paper for the model testing and inversion. We also thank the reviewers for their constructive comments and suggestions.

Conflicts of Interest

The authors declare no conflicts of interest.

References

  1. Zhu, Y.; Shen, C.; Liu, F.; Xu, Y.; Li, H.; Guo, S.; Zhao, Y. Application of Earthquake Prediction Based on Gravity Observation. Earthq. Res. China 2020, 36, 708–717. [Google Scholar]
  2. Zhu, Y.; Zhang, Y.; Yang, X.; Liu, F.; Zhang, G.; Zhao, Y.; Wei, S.; Mao, J.; Zhang, S. Progress of Time-Varying Gravity in Seismic Research. Rev. Geophys. Planet. Phys. 2022, 53, 278–291. [Google Scholar]
  3. Walsh, J.B. An Analysis of Local Changes in Gravity Due to Deformation. Pure Appl. Geophys. 1975, 113, 97–106. [Google Scholar] [CrossRef]
  4. Chen, Y.; Gu, H.; Lu, Z. Variations of Gravity Before and after the Haicheng Earthquake, 1975, and the Tangshan Earthquake, 1976. Phys. Earth Planet. Inter. 1979, 18, 330–338. [Google Scholar] [CrossRef]
  5. Chen, S.; Xu, W.; Jiang, C. Relationship between Gravity Variation and Seismic Hazards in the Western China. Acta Seismol. Sin. 2015, 37, 575–587. [Google Scholar]
  6. Okubo, S. Advances in Gravity Analyses for Studying Volcanoes and Earthquakes. Proc. Jpn. Acad. Ser. B 2020, 96, 50–69. [Google Scholar] [CrossRef]
  7. Hinderer, J.; Hector, B.; Memin, A.; Calvo, M. Hybrid Gravimetry as a Tool to Monitor Surface and under Ground Mass Changes. In Proceedings of the International Symposium on Earth and Environmental Sciences for Future Generations, Prague, Czech Republic, 22 June–2 July 2015; International Association of Geodesy Symposia. Springer: Cham, Switzerland, 2016; Volume 147, pp. 123–130. [Google Scholar]
  8. Zhu, Y.; Liang, W.; Xu, Y. Medium-Term Prediction of Ms8.0 Earthquake in Wenchuan, Sichuan by Mobile Gravity. Recent Dev. World Seismol. 2008, 38, 36–39. [Google Scholar]
  9. Zhu, Y.; Xu, Y.; Liang, W. Medium-Term Prediction of Yutian, Xinjiang Ms7.3 Earthquake in 2008. J. Geod. Geodyn. 2008, 28, 13–15. [Google Scholar]
  10. Shen, C.; Zhu, Y.; Hu, M.; Tan, H.; Hao, H.; Wei, J.; Han, Y.; Li, H.; Wang, J.; Zhang, X.; et al. Time-Varying Gravity Field Monitoring and Strong Earthquake Prediction on the Chinese Mainland. Earthq. Res. China 2020, 36, 729–743. [Google Scholar]
  11. Wang, L.; Chen, S.; Zhuang, J.; Zhang, B.; Shi, W.; Yang, J.; Xu, W. Gravity Field Changes Reveal Deep Mass Transfer before and after the 2013 Lushan Earthquake. Commun. Earth Environ. 2023, 4, 194. [Google Scholar] [CrossRef]
  12. Zhu, Y.; Liu, F.; Zhang, G.; Zhao, Y.; Wei, S. Mobile Gravity Monitoring and Earthquake Prediction in China. Geomat. Inf. Sci. Wuhan Univ. 2022, 47, 820–829. [Google Scholar]
  13. Wang, C.; Zhang, H.; Liu, Z. Spaceborne Synthetic Aperture Radar Interferometry, 1st ed.; Science Press: Beijing, China, 2002. [Google Scholar]
  14. Zhang, H.; Wang, C.; Wu, T.; Tang, Y. Research on DinSAR Method Based on Coherent Target, 1st ed.; Science Press: Beijing, China, 2009. [Google Scholar]
  15. Zhao, D.; Qu, C.; Zhang, G.; Gong, W.; Shan, X.; Zhu, C.; Zhang, G.; Song, X. Applications and Advances for the Coseismic Deformation Observations, Earthquake Emergency Response and Seismogenic Structure Investigation Using in SAR. Seismol. Geol. 2023, 45, 570–592. [Google Scholar]
  16. Massonnet, D.; Rabaute, T. Radar Interferometry: Limits and Potential. IEEE Trans. Geosci. Remote 1993, 31, 455–464. [Google Scholar] [CrossRef]
  17. Zebker, H.; Rosen, P.; Goldstein, R.; Gabriel, A.; Werner, C. On The Derivation of Coseismic Displacement Fields Using Differential Radar Interferomentry: The Landers Earthquake. J. Geophys. Res. Atmos. 1994, 99, 19617–19634. [Google Scholar] [CrossRef]
  18. Okada, Y. Surface Deformation Due To Shear And Tensile Faults In A Half-Space. Bull. Seismol. Soc. Am. 1985, 75, 1135–1154. [Google Scholar] [CrossRef]
  19. Wan, L.; Liu, D.; Hou, L. Study on Structural Characteristics of Foreland Thrust Belt in Southern Margin of Junggar Basin. Oil Geophys. Prospect. 2005, S1, 40–45+138. [Google Scholar]
  20. Xiao, X.; Tang, Y.; Li, J. On the Tectonic Evolution of the Northern Xinjiang, Northwest China. Geosci. Xinjiang 1990, 1990, 47–68. [Google Scholar]
  21. Molnar, P.; Tapponnier, P. Cenozoic Tectonics of Asia: Effects of a Continental Collision: Features of Recent Continental Tectonics in Asia Can Be Interpreted as Results of the India-Eurasia Collision. Science 1975, 189, 419–426. [Google Scholar] [CrossRef]
  22. Pan, Y.; Hammond, W.; Ding, H.; Mallick, R.; Jiang, W.; Xu, X.; Shun, C.; Shen, W. GPS Imaging of Vertical Bedrock Displacements: Quantification of Two-Dimensional Vertical Crustal Deformation in China. J. Geophys. Res. Solid Earth 2021, 126, e2020JB020951. [Google Scholar] [CrossRef]
  23. Shen, J. The Active Fault Detecting and Seismic Risk Assessment in Urumqi City, 1st ed.; Seismological Press: Xinjiang, China, 2010. [Google Scholar]
  24. Jiang, Y.; Sun, W.; Kong, X.; Li, T.; Li, Y.; Zhou, P. Developmental Characteristics and Geological Significance of the Fault System in the Junggar North Tianshan Basin Transition Zone. Chin. J. Geol. 2023, 58, 398–411. [Google Scholar] [CrossRef]
  25. Zhao, R.; Yang, Z.; Zhou, W.; Guo, F. Mesozoic—Cenozoic Structural Characteristics and Seismicity of the Depressions on the South and North Sides of the Tianshan Mountain. Seismol. Geol. 2000, 22, 295–304. [Google Scholar]
  26. Wang, X.; Lu, X.; Liu, B.; Li, J.; Liu, D. Studyon Present-Dayvertical Crust Movement and Seismic Activity in Xinjiang Area. J. Geod. Geodyn. 2009, 29, 22–27. [Google Scholar] [CrossRef]
  27. Zhang, P.; Deng, Q.; Yang, X.; Peng, S.; Xu, X. Late Cenozoic Tectonic Deformation and Mechanism along the Tianshan Mountain, Northwestern China. Earthq. Res. China 1996, 12, 23–36. [Google Scholar]
  28. Kong, F.; Zhang, X.; Liang, Q.; Chen, C. Characteristics of Isostatic Residual Topography in the Tianshan Area and Its Geological Significance. J. Geod. Geodyn. 2023, 42, 223–233. [Google Scholar] [CrossRef]
  29. Liu, H.; Liang, H.; Cai, L.; Xia, L.; Liu, L. Evolution and Structural Style of Tianshan and Adjacent Basins, Northwestern China. Earth Sci. 1994, 19, 727–741. [Google Scholar]
  30. Deng, Q.; Feng, X.; Zhang, P.; Yang, X.; Xu, X.; Peng, S.; Li, J. Reverse Fault and Fold Zone in the Urumqi Range-Front Depression of the Northern Tianshan and Its Genetic Mechanism. Earth Sci. Front. 1999, 6, 191–201. [Google Scholar]
  31. Wang, Y. Discussion on Neotectonic Activity and Neotectonic Stress Field in the Urumqi Fore-Mountain Depression. Xinjiang Geogr. 1984, 3, 33–39. [Google Scholar] [CrossRef]
  32. Feng, X. Xinjiang Paleoearthquake, (1); Xinjiang Science and Technology Health Press: Urmqi, China, 1997. [Google Scholar]
  33. Zhang, P.; Deng, Q.; Xu, X.; Peng, S.; Yang, X.; Feng, X.; Zhao, R.; Li, J. Blind Thrust, Folding Earthquake, and the 1906 Manas Earthquake, Xinjiang. Seismol. Geol. 1994, 16, 193–204. [Google Scholar]
  34. Yang, X.; Deng, Q.; Feng, X. Geometric and Kinematic Characteristics of Tugu Lu Active Reverse Fault-Anticline in the North Tianshan Mountains. Active Fault Study; Seismological Press: Beijing, China, 1996; Volume 5, pp. 42–53. [Google Scholar]
  35. Li, J.; Feng, X.; Chen, J. Study on the Active Reverse Fault-Fold Structure in Horgos. Active Fault Study; Seismological Press: Beijing, China, 1992; Volume 2, pp. 105–116. [Google Scholar]
  36. Zhang, P.; Deng, Q.; Xu, X. Deformation Characteristics and Tectonic Evolution of the Manas Active Reverse Fault-Fold Belt at the Northern Foot of Tianshan Mountains, Active Fault Study; Seismological Press: Beijing, China, 1994; Volume 3, pp. 18–32. [Google Scholar]
  37. Deng, Q.; Feng, X.; You, H. Deformation Characteristics and Formation Mechanism of the Dushanzi-Anjihai Active Reverse Fault-Fold Belt in Xinjiang. Active Fault Study; Seismological Press: Beijing, China, 1991; Volume 1, pp. 17–36. [Google Scholar]
  38. Jamison, W. Geometric Analysis of Fold Development in Overthrust Terraces. J. Struct. Geol. 1987, 9, 207–219. [Google Scholar] [CrossRef]
  39. Wang, X.; Li, J.; Wang, Q.; Zubovich, A. Analysis of Present—Day Crustal Deformation of Tianshan. J. Geod. Geodyn. 2005, 2005, 63–68. [Google Scholar]
  40. Liu, J.; Wang, Q.; Li, J.; Wu, C.; Zhao, B.; Kong, X. Relocation of the Hutubi Ms6. 2 Earthquake Sequence on 8 December 2016 and Analysis of the Seismogenic Structure. Seismol. Geol. 2018, 40, 566–578. [Google Scholar]
  41. Lu, R.; He, D.; Xu, X.; Wang, X.; Tan, X.; Wu, X. Seismotectonics of the 2016 M6.2 Hutubi Earthquake: Implications for the 1906 M7.7 Manas Earthquake in the Northern Tian Shan Belt, China. Seismol. Res. Lett. 2018, 89, 13–21. [Google Scholar] [CrossRef]
  42. Yang, W.; Chen, J.; Yao, Q.; Cui, R.; Long, H.; Han, Y. The Preliminary Study on the Seismogenic Structure of the Hutubi M_S6.2 Earthquake. Seismol. Geol. 2018, 40, 161–175. [Google Scholar]
  43. Shen, C. Preliminary Analysis of Coupling Movement between Crustal Deformation and Density Change. J. Geod. Geodyn. 2005, 25, 7–12. [Google Scholar] [CrossRef]
  44. Liu, D.; Chen, S.; Wang, X.; Zhang, B.; Li, J.; Wu, C.; Lu, H. The Apparent Density Variation of the Focal Area before and after Jiashi Ms6.4 Earthquake and Its Tectonic Significance. Seismol. Geol. 2021, 43, 311–328. [Google Scholar] [CrossRef]
  45. Heck, B.; Seitz, K. A Comparison of the Tesseroid, Prism and Point-Mass Approaches for Mass Reductions in Gravity Field Modelling. J. Geodesy 2007, 81, 121–136. [Google Scholar] [CrossRef]
  46. Wang, L.; Chen, S.; Zhang, B.; Lu, H. Analysis of the Variation of Gravity Field Source before the 2013 Lushan Ms7.0 Earthquake. Earthquake 2021, 41, 78–92. [Google Scholar] [CrossRef]
  47. Li, Y.; Oldenburg, D. 3-D Inversion of Gravity Data. Geophysics 1998, 63, 109–119. [Google Scholar] [CrossRef]
  48. Akaike, H. Likelihood and the Bayes Procedure; Bayesian Statistics; Bernardo, J., Degroot, M., Lindley, D., Smith, A., Eds.; University Press: Valencia, Spain, 1980; pp. 143–166. [Google Scholar]
  49. Han, J.; Chen, S.; Lu, H.; Xu, W. Time-Variable Gravity Field Determination Using Slepian Functions and Terrestrial Measurements: A Case Study in North China with Data From 2011 to 2013. Chin. J. Geophys. 2021, 64, 1542–1557. [Google Scholar]
  50. Yang, J.; Chen, S.; Li, H.; Zhang, B.; Ruan, M. Modeling Experiment and Anomaly Analysis of Time-Varying Gravity Field in South China. Earthquake 2021, 41, 141–152. [Google Scholar]
  51. Yushan, A.; Liu, D.; Yasen, A.; Chen, L.; Li, J.; Zhao, L.; Li, B. Field Source Resolution of Mobile Gravity Network in Northern Tianshan. J. Geod. Geodyn. 2023, 2023, 1–7. [Google Scholar] [CrossRef]
  52. Zhang, B.; Chen, S.; Li, H.; Yang, J.; Han, J.; Lu, H. Time-Varying Gravity Inversion Using Spherical Model and Synthetic Test. Earthquake 2021, 41, 13–24. [Google Scholar]
  53. Mao, J.; Zhu, Y. Progress in the Application of Ground Gravity Observation Data in Earthquake Prediction. Adv. Earth Sci. 2018, 33, 236–247. [Google Scholar] [CrossRef]
  54. Hu, M.; Hao, H.; Li, H.; Zhu, Y. Quantitative Analysis of Gravity Changes for Earthquake Prediction. Earthq. Res. China 2019, 35, 417–430. [Google Scholar]
  55. Chen, S.; Wang, Q.; Wang, Q.; Wang, Y.; Lu, H.; Xu, W.; Shi, L.; Guo, F. The 3D Density Structure and Gravity Change of Ludian Ms6.5 Yunnan epicenter and Surrounding Regions. Chin. J. Geophys. 2014, 57, 3080–3090. [Google Scholar]
  56. Application Of Isostasy Theory in The Elevation Calculation of Mount Everest. Bull. Surv. Mapp. 1975, 4, 34–39. Available online: https://www.cnki.com.cn/Article/CJFDTotal-CHTB197504011.htm (accessed on 1 January 2024).
  57. Kong, X.; Chen, X.; Liu, J.; Zhong, S. Relocation of Mainshock and Aftershocks of Hutubi Earthquake with Ms6.2 Occurred on December 8th, 2016. Inland Earthq. 2017, 31, 237–241. [Google Scholar]
  58. Liu, G.; Qiao, X.; Xiong, W.; Zhou, Y.; Nie, Z.; Xia, C. Source Models for the 2016 Mw6.0 Hutubi Earthquake, Xinjiang, China: A Possible Reverse Event. Geod. Geodyn. 2017, 8, 311–318. [Google Scholar] [CrossRef]
  59. Liu, G.; Zhang, B.; Zhang, R.; Cai, J.; Fu, Y.; Liu, Q.; Yu, B.; Li, Z. Monitoring Dynamics of Hailuogou Glacier and the Secondary Landslide Disasters Based on Combination of Satellite SAR and Ground-Based SAR. Geomat. Inf. Sci. Wuhan Univ. 2019, 44, 980–995. [Google Scholar]
  60. Wang, Y. Comparison and Analysis of Orbit Error Methods in Palsar Interferogram. Geotech. Investig. Surv. 2015, 43, 55–56. [Google Scholar]
  61. Jonsson, S. Fault Slip Distribution of the 1999 Mw7.1 Hector Mine, California, Earthquake, Estimated from Satellite Radar and GPS Measurements. Bull. Seismol. Soc. Am. 2002, 92, 1377–1389. [Google Scholar] [CrossRef]
  62. Xu, Z.; Liang, S.; Zou, L.; Liu, J. Mechanism of the 2016 Hutubi, Xinjiang, Ms6.2 Mainshock and Relocation of Its Aftershock Sequences. Seismol. Geol. 2019, 41, 44–57. [Google Scholar] [CrossRef]
  63. Medwedeff, D. Geometry and Kinematics of an Active, Laterally Propagating Wedge Thrust, Wheeler Ridge, California. In Structural Geology of Fold and Thrust Belts; Mitra, S., Fisher, G., Eds.; John Hopkins University Press: Baltimore, MD, USA, 1992; pp. 3–28. [Google Scholar]
  64. Shaw, J.; Connors, C.; Suppe, J. Seismic Interpretation of Contractional Fault-Related Folds, an American Association of Petroleum Geologists Seismic Atlas; American Association of Petroleum Geologists Special Publication: Houston, TX, USA, 2005. [Google Scholar]
  65. Mount, V.; Martindale, K.; Griffith, T.; Byrd, J. Basement-Involved Contractional Wedge Structural Styles: Examples from the Hanna Basin, Wyoming. In Thrust Fault Related Folding; Mcclay, K., Shaw, J.H., Suppe, J., Eds.; AAPG Memoir 94; American Association of Petroleum Geologists (AAPG): Tulsa, OK, USA, 2011; pp. 271–282. [Google Scholar]
  66. Guan, S.W.; Stockmeyer, J.; Shaw, J.; Plesch, A.; Zhang, J. Structural Inversion, Imbricate Wedging, And Out-of-Sequence Thrusting in the Southern Junggar Fold-and-Thrust Belt, Northern Tian Shan, China. AAPG Bull. 2016, 100, 1443–1468. [Google Scholar] [CrossRef]
  67. Stein, R.; Yeats, R. Hidden Earthquakes. Sci. Am. 1989, 260, 48–57. [Google Scholar] [CrossRef]
  68. Deng, Q.; Feng, X.; Yang, X. Study on Holocene Paleoearthquake by Large Trench in the Manas—Tugulu Reverse Faultand-Fold Zone along Northern Margin of the Tianshan Mountain in Xinjiang in Research on Active Faults; Institute of Geology SSB; Seismological Press: Beijing, China, 1994; Volume 3. [Google Scholar]
  69. Charvet, J.; Shu, L.; Charvet, S.; Wang, B.; Faure, M.; Cluzel, D.; Chen, Y.; Jong, K. Palaeozoic Tectonic Evolution of the Tianshan Belt, NW China. Sci. China Earth Sci. 2011, 54, 166–184. [Google Scholar] [CrossRef]
  70. Xiao, W.; Zhang, L.; Qin, K.; Sun, S.; Li, J. Paleozoic Accretionary and Collisional Tectonics of The Eastern Tianshan (China): Implications for the Continental Growth of Central Asia. Am. J. Sci. 2004, 304, 370–395. [Google Scholar] [CrossRef]
  71. Chen, K.; Charles, G.; Romain, A.; Chen, Y.; Mei, H.; Lin, W.; Wang, Q. A Multidiscipline Method of Geological Survey, Seismic Profile and Gravity Measurement Applied to Fold-and-Thrust Belt: A Case Study along the Hutubi River in the Northern Piedmont of Tianshan. Chin. J. Geophys. 2014, 57, 75–87. [Google Scholar] [CrossRef]
  72. Yang, Y.; Hu, J.; Chen, Q.; Wang, Z.; Tsai, M. A Blind Thrust and Overlying Folding Earthquake of the 2016 Mw6. 0 Hutubi Earthquake in the Northern Tien Shan Fold-and-Thrust Belts, China. Bull. Seismol. Soc. Am. 2019, 109, 770–779. [Google Scholar] [CrossRef]
  73. Yin, A.; Nie, S.; Craig, P.; Harrison, T.; Ryerson, F.; Qian, X. Late Cenozoic Tectonic Evolution of the Southern Chinese Tian Shan. Tectonics 1998, 17, 1–27. [Google Scholar] [CrossRef]
  74. Zubovich, A.; Wang, X.; Scherba, Y.; Schelochkov, G.; Reilinger, R.; Mosienko, O.; Molnar, P.; Michajljow, W.; Makarov, V.; Li, J.; et al. Gps Velocity Field for The Tien Shan and Surrounding Regions. Tectonics 2010, 29, Tc6041. [Google Scholar] [CrossRef]
  75. Bu, Z.; Li, Y.; Tang, L.; Jing, Y.; Chen, L. Seismogenic Fault of the 2016 Hutubi M6. 2 Earthquake Constraint from the Borehole Strain Observations. J. Seismol. Res. 2021, 44, 64–71. [Google Scholar]
  76. Suppe, J. Geometry and Kinematics of Fault-Bend Folding. Am. J. Sci. 1983, 283, 684–721. [Google Scholar] [CrossRef]
  77. Suppe, J.; Connors, C.; Zhang, Y. Shear Fault Bend Folding. In Thrust Tectonics and Hydrocarbon Systems; AAPG Memoir; Association of Petroleum Geologists (AAPG): Tulsa, OK, USA, 2004; Volume 82, pp. 303–323. [Google Scholar]
  78. Kao, H.; Chen, W. The Chi-Chi Earthquake Sequence: Active Out-of-Sequence Thrust Faulting in Taiwan. Science 2000, 288, 2346–2349. [Google Scholar] [CrossRef]
  79. Chen, W.; Huang, B.; Chen, Y.; Lee, Y.; Yang, C.-N.C.; Lo, C.; Chang, H.; Sung, Q.; Huang, N.; Lin, C.; et al. 1999 Chi-Chi Earthquake: A Case Study on the Role of Thrust-Ramp Structures for Generating Earthquakes. Bull. Seismol. Soc. Am. 2001, 91, 986–994. [Google Scholar] [CrossRef]
  80. Johnson, K.; Segall, P. Imaging the Ramp-Décollement Geometry of the Chelungpu Fault Using Coseismic GPS Displacements from the 1999 Chi-Chi, Taiwan Earthquake. Tectonophysics 2004, 378, 123–139. [Google Scholar] [CrossRef]
  81. Guzofski, C.; Shaw, J.; Lin, G.; Shearer, P. Seismically Active Wedge Structure Beneath the Coalinga Anticline, San Joaquin Basin, California. Geophys. Res. 2007, 112, B03s05. [Google Scholar] [CrossRef]
  82. Lu, R.; Xu, X.; He, D.; John, S.; Liu, B.; Wang, F.; Tan, X.; Li, Y. Seismotectonics of the 2013 Lushan Mw 6.7 Earthquake: Inversion Tectonics in the Eastern Margin of the Tibetan Plateau. Geophys. Res. Lett. 2017, 44, 8236–8243. [Google Scholar] [CrossRef]
  83. Yang, X.; Deng, Q.; Zhang, P.; Xu, X.; Yu, G.; Feng, X. Active Reverse Fault-Fold Zones and Estimation of Potential Earthquake Sources in Northern Tianshan. Seismol. Geol. 1998, 20, 193–200. [Google Scholar]
  84. Yang, X.; Gu, M.; Sun, Z.; Zhao, C.; Zhou, Q. Multilayered Reverse Faults and Deep Structures in the Manas Earthquake Area, Northern Tianshan. Seismol. Geol. 2002, 24, 303–314. [Google Scholar]
  85. Wu, G.; Luo, Z.; Lai, Q.; Luo, W. Gravity Variation in The Western Yunnan Earthquake Prediction Test Site (Wyepts) before the Ms 7.3 Earthquake Occurrence on the Border Between China and Myanmar to the West of Menglian, Yunnan Province. Earthquake 1998, 18, 146–154. [Google Scholar]
Figure 1. Seismological gravity monitoring network in the middle segment of the North Tianshan Mountains. Solid black lines delineate faults; the black beach ball symbol shows the focal mechanism of the 2016 Hutubi earthquake; red circles are felt earthquakes during the last decade; yellow triangles are the gravity observation stations; solid blue lines are gravity traverses. The solid cyan line marks the location of the geological profile.
Applsci 14 01694 g001
Figure 2. Tectonic background of the middle segment of the North Tianshan Mountains. The black and white beach ball indicates the focal mechanism of the 2016 Hutubi earthquake.
Applsci 14 01694 g002
Figure 3. Checkerboard model for testing the resolution of the gravity monitoring network in the study area. Solid black lines represent faults. The squares indicate the gravity points. The black and white beach ball indicates that earthquakes of magnitude 5 or greater occurred in the study area between July 2016 and July 2022.
Applsci 14 01694 g003
Figure 4. Inverted checkerboard pattern of the gravity monitoring network. Solid black lines represent faults. The squares indicate the gravity points. The black and white beach ball indicates that earthquakes of magnitude 5 or greater occurred in the study area between July 2016 and July 2022.
Applsci 14 01694 g004
Figure 5. Gravity field variations after adjustment. (a) August 2016 to August 2017; (b) August 2017 to August 2018; (c) August 2018 to July 2019; (d) July 2019 to August 2020; (e) August 2020 to July 2021; (f) July 2021 to July 2022. Solid black lines represent faults. The black and white beach ball indicates that earthquakes of magnitude 5 or greater occurred in the study area between July 2016 and July 2022. The solid yellow circle represents information about earthquakes that occurred in the study area from July 2016 to July 2022, with different magnitudes represented by different sizes. The red and blue rectangles represent changes in gravity differences at ground gravity monitoring points.
Applsci 14 01694 g005
Figure 6. Equivalent apparent density variation features in the study area. (a) August 2016 to August 2017; (b) August 2017 to August 2018; (c) August 2018 to July 2019; (d) July 2019 to August 2020; (e) August 2020 to July 2021; (f) July 2021 to July 2022. Solid black lines represent faults. The black and white beach ball indicates that earthquakes of magnitude 5 or greater occurred in the study area between July 2016 and July 2022. The solid yellow circle represents information about earthquakes that occurred in the study area from July 2016 to July 2022, with different magnitudes represented by different sizes.
Applsci 14 01694 g006aApplsci 14 01694 g006b
Figure 7. Coseismic deformation fields of the 2016 Hutubi earthquake from the ascending and descending tracks—(a) Deformation field from the ascending tracks; (b) deformation field from the descending tracks. The yellow star indicates the epicenter of the earthquake. The solid black lines represent faults.
Applsci 14 01694 g007
Figure 8. Results of quadtree downsampling of the 2016 Hutubi earthquake data. (a) Before downsampling; (b) after downsampling.
Applsci 14 01694 g008
Figure 9. Coseismic fault slip model of the 2016 Hutubi earthquake. The blue pentagram denotes the focus of the earthquake, and the white arrows are the motion vectors of discretized fault slips.
Applsci 14 01694 g009
Figure 10. Geological profile of the study area interpreted based on seismic reflection data, modified from Lu et al. (2018) [41]. Solid lines indicate interpreted faults and dashed lines represent axial planes. White circles are the aftershocks of the 2016 Hutubi earthquakes, solid red lines are the surface fault ruptures, and the yellow star marks the epicenter of the 1906 Manas earthquake.
Applsci 14 01694 g010
Table 1. Parameters of the Sentinel-1A and Sentinel-1B SAR images used in the analysis of the 2016 Hutubi earthquake.
SatelliteTrack (No.)Subdivision NumberObservation TimeVertical Baseline of Interference Pairs (m)Azimuth (°)Incidence
Angle (°)
Sentinel-1AAscending track (114)12Master image:
19 November 2016
Sub-image:
13 December 2016
−0.634639.4
Sentinel-1BDescending track (92/3)3Master image:
24 November 2016
Sub-image:
18 December 2016
125.419433.6
Table 2. Parameters of the 2016 Hutubi earthquake derived from various sources.
Data SourceStrike (°)Dip (°)Slip Angle (°)Focal Depth (°)Magnitude (MW)
USGS269719317.66.0
GCMT272689220.36.0
SCANDEC2767095206.0
CENC2776988196.0
IGCEA2737010817.65.95
Present study2767098.7717.855.98
Disclaimer/Publisher’s Note: The statements, opinions and data contained in all publications are solely those of the individual author(s) and contributor(s) and not of MDPI and/or the editor(s). MDPI and/or the editor(s) disclaim responsibility for any injury to people or property resulting from any ideas, methods, instructions or products referred to in the content.

