Article

Exchange Flows in Inclined Pipes with Different Viscosity Ratios

School of Mechanical Engineering, Guangxi University, Nanning 530004, China
*
Author to whom correspondence should be addressed.
Appl. Sci. 2024, 14(4), 1573; https://doi.org/10.3390/app14041573
Submission received: 18 January 2024 / Revised: 8 February 2024 / Accepted: 13 February 2024 / Published: 16 February 2024
(This article belongs to the Section Fluid Science and Technology)

Abstract

:
In this study, we investigated the effects of the viscosity ratio ( β ) and the angle of inclination ( θ ) on the change in the flow regime of two fluids undergoing exchange flow in a pipe, using a combination of experimental and theoretical methods. In our experiments, we observed that changing either the viscosity ratio or the inclination angle of the pipe causes a change in the fluidity of the two fluids. For the upward-flowing light fluid, we observed four flow regimes: axisymmetric core-annular flow (CAF), eccentric core-annular flow (ECAF), transitional side-by-side flow (eccentric and side-by-side flow at the same time) (TSBS), and side-by-side flow (SBS). In addition, the larger the viscosity ratio, the larger the critical angle at which the flow pattern eventually changes to side-by-side flow. When the tilt angle is larger than 16 , the flow pattern is a side-by-side flow, regardless of the viscosity ratio, and we find that the viscosity ratio and the inclination angle determine the ratio of the width of the rising fluid to the diameter of the pipe ( δ a ) and the velocity of the increasing fluid (V). We used the velocity model of the fluid in the pipe to compare with our experimentally measured velocities and found some similarities and differences, which we explained. For the downward-flowing heavy fluid, we divided the viscosity ratios into three ranges for our study and found that the changes in flow regimes were different for different ranges of viscosity ratios.

1. Introduction

The convection of two-phase flows driven by the inertial forces in a pipe is one of the most fundamental hydrodynamic problems widely found in geophysical environments in nature, such as the circulation of magma in a continuously degassed volcanic conduit [1] and the countercurrent of the currents of different densities in oceanic straits [2]. They are also found in many industrial processes and have many applications in industrial processes, such as the exchange of air and combustion products in ventilation ducts during fires [3] and the transportation of viscous oil in lubrication pipelines through pipes by injecting water into the pipeline [4].
There are many laboratory studies of two-phase flow exchange flows in vertical pipelines [5,6,7,8,9], which are categorized according to the experimental setups in two ways: lock-exchange flows and long bubbles; lock-exchange flows are mainly exchange flows within a single pipe [5,6,7] between a heavy and a light fluid, each occupying one half of the pipe. The flow patterns can be categorized into three types, depending on the viscosity ratio ( β , the viscosity of the more viscous fluid divided by the viscosity of the less viscous fluid) of the two fluids [1]. While the long bubble flow is mainly the flow within a pipe connection between two reservoirs [8,9], the flow regimes are mainly categorized into two types according to the viscosity ratios: core-annular flow (CAF) and side-by-side flow (SBS) [9].
There is no good analytical solution for fluid dynamics in inclined pipes. Here, we exemplify some major fluid dynamics studies carried out in vertical pipes. A theoretical model for laminar two-way core flow in a vertical pipe was presented by Huppert et al. [8]. They placed constraints on the pressure gradient within the pipe. They then provided a useful prediction of the magnitude of the fluid flux compared with the experimental. However, they did not compare the velocity of the fluid used in the experiment with the theoretical velocity. Kerswell et al. [10] proposed a velocity model for side-by-side flow within a vertical pipe using the principle of maximum flux. However, the error obtained in the results of Beckett et al.’s [9] experimental velocities is large compared to their modelled velocities. We investigated the bi-stability of the exchange flow in the pipeline from our previous work [11]. By comparing these results with the experimental results of Stevenson et al. [1], we obtain two mathematically valid solutions in the steady state using the core–loop solution in the vertical pipe. The increasing dynamics of a Taylor droplet in a vertical pipe were studied by D. Picchi et al. [12], who provided an analytical solution for the velocity of a Taylor droplet in a vertical pipe using a lubrication approximation, while also providing an analytical solution for the velocity of a continuously rising fluid under specific conditions (the radius of the rising fluid as a fraction of the radius of the pipe is 0.6). In addition to that, there are many studies on exchange flow in pipelines in terms of simulation [13,14,15,16]. In actual nature, however, most of the channels involved in our study are inclined.
The effect of an inclined pipe on the flow of fluid in the pipe is complex because the inclination of the pipe changes the shape of the fluid flow [17]. Weber et al. [18] investigated the change in bubble rise velocity inside the pipe for different inclination angles ( θ ), the change in bubble-rising velocity in the pipe, and found that with an increase, the velocity of the bubbles increased and then decreased. Seon et al. [19] studied the exchange flow of light and heavy fluids in a pipe with different pipe diameters. The relationship between the forward velocity of a light fluid and viscosity was given. They found that the rising velocity of the light fluid increases and then decreases with an increase in the angle of inclination. This agrees with the velocity law found by Weber et al. Further, Alba et al. [20] studied the displacement flow of two Newtonian fluids in an inclined pipe in terms of the Froude number (Fr), Reynolds number (Re), and angle of inclination ( θ ), three parameters that characterize the flow regimes generated during the inclination process; the two fluids in the studied pipe have the same viscosity but different densities. They categorized the observed flow regimes into complete diffusion, transient diffusion, inertial flow, and viscous flow. For each flow regime, they give the frontal velocity as well as the axial diffusion coefficient. Adrien Lefauve et al. [21] studied the exchange flow driven by inertial forces in a rectangular inclined pipe between two reservoirs, investigating the longitudinal aspect ratio (A) and the length-to-diameter ratio (B) of the pipe, as well as the angle of inclination ( θ ), Reynolds number (Re) (based on the initial difference in inertial forces driving the flow), and Prandtl number (Pr) (considering both salt and temperature layers) of five parameters on the qualitative flow state (laminar, wavy, intermittent turbulent, or fully turbulent), the mass flux (the net transport of inertial forces between the reservoirs), and the interfacial thickness (the thickness of the intermediate density layer between the two countercurrent layers).
The viscosity of the two fluids in the inclined pipes studied in the above experiments are all the same, and both of them are used to study the change in their parameters by making the fluids undergo exchange flow through the difference in density. In nature and industrial applications, the viscosity difference between the two fluids in which the exchange flow occurs is relatively large in many channels [1,4]. Stevenson et al. [1] found that the lock-exchange flow of two fluids in a pipe is only related to their β . Three different transient flow patterns occur for two pure fluids in a vertical pipe in the range of three β ; when β < 10, the heavy fluid separates from the wall and assumes approximately the same morphology as the light fluid; when 10 < β < 300, the descending fluid eventually separates from the wall and splits into individual droplets that descend along the centre of the pipe; when β > 300, the falling fluid sticks to the wall. We build on this by tilting the pipe to a certain angle to observe the changes in the two fluid flow regimes inside the pipe. The main advantage of this study compared to the current experiments is that the combination of the change in viscosity ratio with the change in tilt angle is more relevant to the physical phenomena observed in real nature, as well as industrial applications.
In this study, in order to understand the effect of viscous forces on the flow regimes of exchange flow in an inclined pipe, we adopted a combination of experimental and theoretical modes to investigate the effect of viscosity ratio and angle of inclination on the changes in the flow regimes of the two types of fluids in the pipe, and we recorded the changes in the velocity of the ascending light fluid; then, we compared them with our previously obtained model of the velocity of the light fluid. We found that for different viscosity ratios, the flow regimes of the descending heavy fluid, as well as the ascending light fluid, changed in the inclined pipe. We observe four different flow regimes for the rising light fluid, which are related to the angle of inclination. However, as the viscosity ratio increases, the tilt angle for the change in flow regime is also different. We also investigated the effect of the viscosity ratio and inclination angle on the ratio of the width of the upward-flowing light fluid to the width of the pipe. Since the descending heavy fluid has different flow regimes for different ranges of viscosity ratios, we characterize the change in flow regimes of the heavy fluid in an inclined pipe for different ranges of viscosity ratios, and find that with the inclination of the pipe, all of the heavy fluid loses the flow regimes that it had when the pipe was vertical. Finally, we also study the change in the rising velocity of the light fluid, and the increase in the velocity of the light fluid becomes larger and then smaller with the rise in the inclination angle. We also found that the magnitude of the change in velocity is different for different viscosity ratios. In comparison to the modelled velocities, the comparison is good only when the pipe is vertical; we analysed the reasons for this situation. This article is structured as follows: We focus on the experiments in Section 2. Section 2.1 describes our research methodology, and Section 2.2 presents the materials and parameter ranges of our experiments. The experimental results are presented and discussed in Section 3. Section 3.1 shows the experimental results of the change in flow regime of two fluids in the pipe for different viscosity ratios. The force analysis of the two fluids inside the pipe is provided. Section 3.1.1 shows the change in the flow regime of a light fluid moving upward inside an inclined pipe for different viscosity ratios and provides the reasons for these changes. Section 3.1.2 shows the change in the flow regime of a heavy fluid moving downward in an inclined pipe for different viscosity ratios. The changes in the increasing velocity of the light fluid are shown in Section 3.2. Section 3.2.1 shows the effect of the angle of inclination and the viscosity ratio on the changes in the rising velocity of the light fluid. Section 3.2.2 mainly compares the velocity of the light fluid with the velocity model that we derived earlier, and the reasons for the errors are analysed.

2. Materials and Methods

2.1. Research Program

We conducted a series of experiments. In order to ensure that the viscosity of the experimental fluid does not change during the experimental process, the experimental temperature was controlled at room temperature (22 °C, and the temperature difference between the upper and lower temperature was not more than 0.5 °C). The exchange flow of two pure fluids was investigated for different viscosity ratios ( β ) in a pipe with different inclination angles ( θ ). In the pipes, the two fluids are incompressible and have different densities and viscosities, and the density difference drives the exchange. The experimental setup is shown in Figure 1, which consists of a bottom fixture as well as a bottom adjustable scheduling workbench, a vertical column, a glass pipe with radius r = 1.1 cm and length L = 50 cm, roughness of Ra6.19, two valves at both ends of the glass pipe to close the pipe, a camera (sony.ac7, 27 megapixels, 4 K, 30 Hz), a viscometer (Master SMART), and a backlighting board.
The two fluids used were a high-viscosity ( μ d ), high-density ( ρ d ) aqueous maltose solutions, and a low-viscosity ( μ a ), low-density ( ρ a ) aqueous glycerol solution, along with an aqueous fructose solution. Since the higher viscosity aqueous fructose solution has its yellow colour, a mixture of aqueous glycerol and aqueous fructose solution was used instead of the higher viscosity aqueous fructose solution in order to have consistent staining of all the experimental solutions. In order to prepare the experiment, the two fluids were configured to the desired viscosity of the aqueous solution; a viscometer measured the viscosity, and the density was determined by using the ratio of mass to volume measured by a balance. The lower half of the pipe was filled with a high-viscosity, high-density aqueous maltose solution, and the upper half of the pipe was filled with a low-viscosity, low-density aqueous glycerol solution, as well as an aqueous fructose solution. At the beginning of the experiment, the tubes were rotated so that the bottom of the tube base fit perfectly with the adjustable angle bench top, and the tubes rested on the column to stabilize the tubes. In order to minimize this rotation process, the positions of all experimental devices were adjusted to the exact positions at the beginning of the experiment. We experimented without the option of installing a valve in the middle of the pipe and then adjusting the device into position then opening the valve to allow the two fluids to flow. After adding a valve to the middle of the pipe, and due to the valve having a certain thickness, after opening the valve, there was a bubble between the two types of fluids; when the two types of fluids had a larger viscosity ratio ( β ) and the difference between the densities, after opening the valve, the flow occurred immediately. The presence of air bubbles creates a large error in the velocity data we collect. Also, the presence of air bubbles causes the fluid to follow the movement of the bubbles. This takes the fluid out of its original path of motion. Therefore, we choose the current experimental method. After starting the experiment, the two fluids experienced convection due to the density difference, and we observed a change in the flow pattern of the light fluid and the heavy fluid. We installed a backlight plate behind the experimental tube so that we could see the change in flow pattern more clearly and record the time of light fluid flow with a camera.

2.2. Range of Experimental Parameters

In order to study the effect of viscosity ratio and angle of inclination on the flow pattern, as well as the velocity of the two fluid exchange streams in the pipeline, we kept the viscosity of the high-viscosity aqueous maltose solution unchanged and changed the viscosity of the low-viscosity solution, thereby modifying the viscosity ratio of the two fluids. We conducted a total of five sets of independent experiments. The heavy fluids used were all aqueous maltose solutions (Syrup) with 818.6 mpa.s, and the pipe inclination angles all ranged from 0 to 60 ; the angular error of the experiments did not exceed 0.5 . The viscosity ratio of the two fluids for the first group of experiments was 5.46; the light fluid was an aqueous 80 wt% glycerol–syrup solution with a viscosity of 150.1 mpa.s, and there were a total of seven experiments. The viscosity ratio of the two fluids for the second group of experiments was 9.3, the light fluid was an aqueous solution of fructose (Dil.syrup) with a viscosity of 88 mpa.s, and there were a total of seven experiments. The viscosity ratio of the two fluids for the third group of experiments was 82.67, the light fluid was an aqueous solution of fructose (Dil.syrup) with a viscosity of 9.9 mpa.s, and there were a total of seven experiments. The viscosity ratio of the two fluids for the fourth group of experiments was 238.66. The light fluid was an aqueous solution of fructose (Dil.syrup) with a viscosity of 3.43 mpa.s, and there were a total of six experiments. For the fifth group of experiments, the viscosity ratio of the two fluids was 467.77, the light fluid was an aqueous solution of fructose (v.dil.syrup) with a viscosity of 1.75 mpa.s, and there were a total of seven experiments. Table 1 lists the basic parameters of the experimental solutions. We have recorded the symbols used in the article along with their meanings and units in Table 2.

3. Results and Discussion

3.1. Exchange Flow Experiments in Pipes

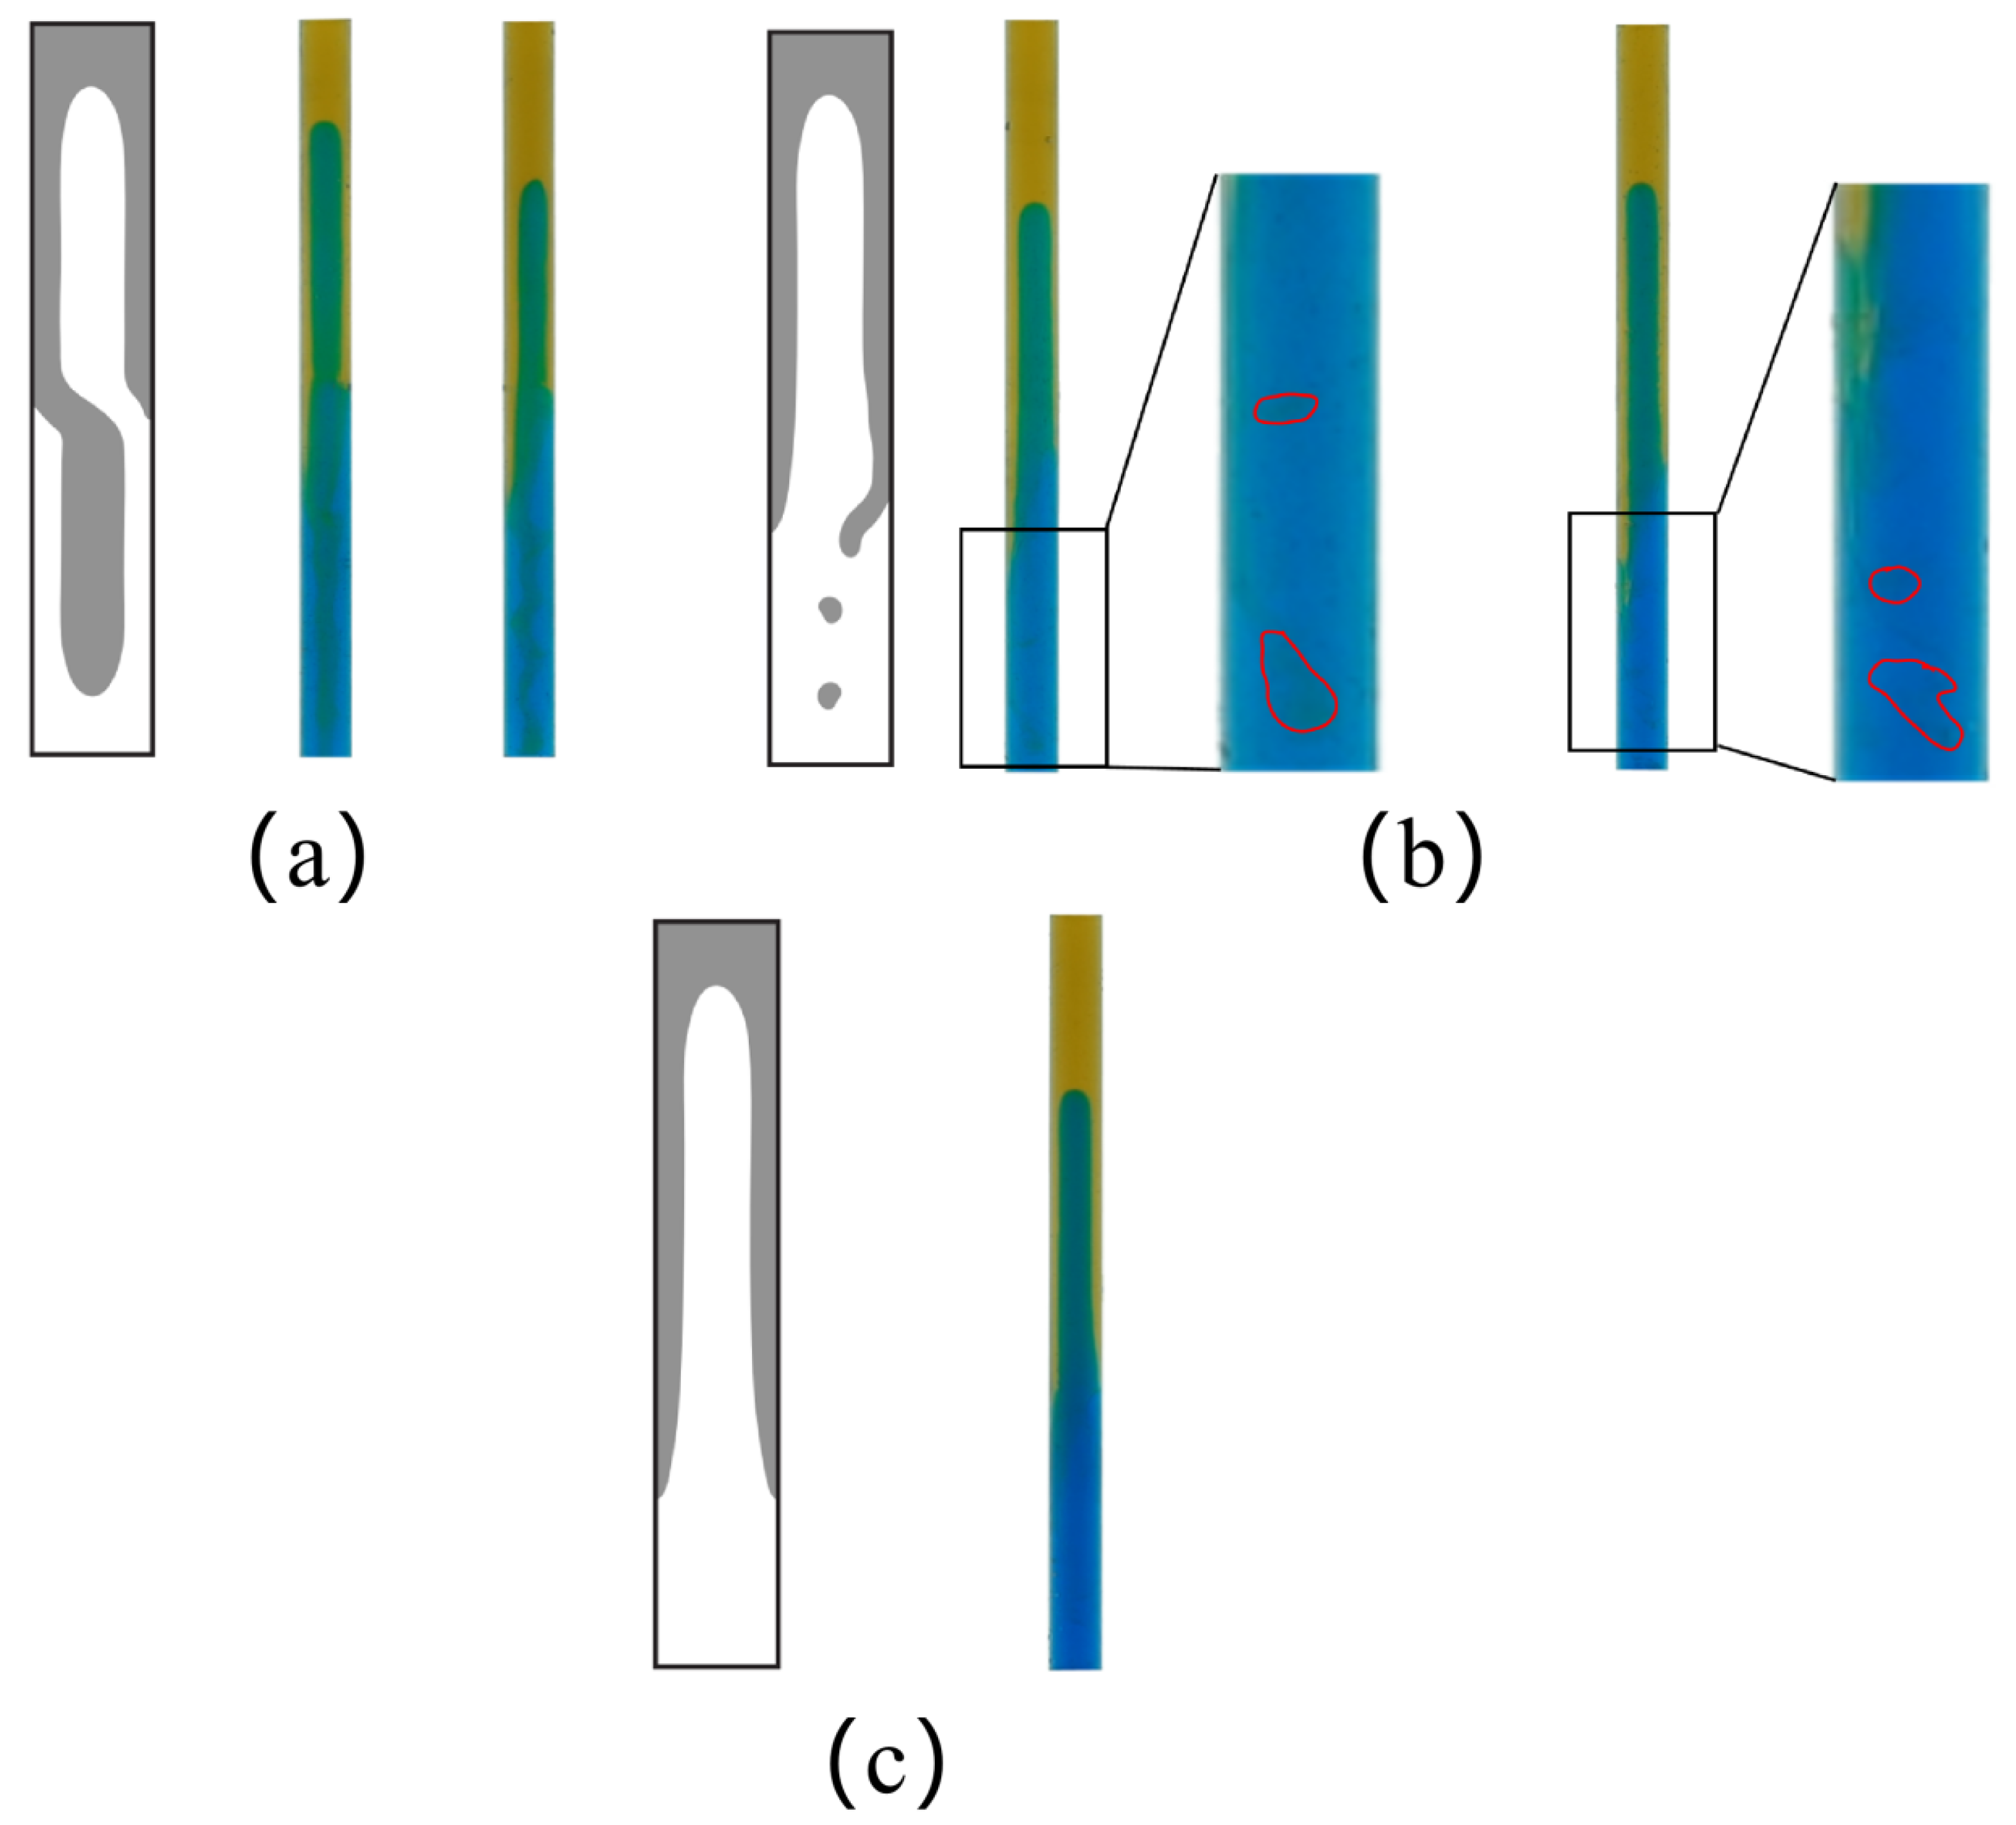
Before investigating the flow of two fluids with large differences in viscosity ratios in an inclined pipe, we first examined the flow of two fluids in a vertical pipe. One is to compare the experimental results for the subsequent experiments after tilting the pipe, and the other is to benchmark the experimental results of Stevenson et al. The experimental results obtained are shown in Figure 2, where we observe the existence of three different flow regimes for the falling heavy fluid at different ranges of viscosity ratios. The colour plots in Figure 2a show the experiments with viscosity ratios of 5.46 and 9.3 ( β = 5.46 and 9.3), respectively, where we observe that the heavy fluid rapidly detaches from the pipe wall and descends along the centre of the pipe at these two viscosity ratios, forming an approximate mirror image of the lighter fluid, and in Figure 2b, the colour plots show the experiments with viscosity ratios of 82.67 and 238.66 ( β = 82.67 and 238.66); at this time, we observe that the heavy fluid eventually separates from the wall of the tube and then splits into small pieces falling along the centre of the tube wall; since the colour contrast of the separated pieces is not obvious, we have depicted the shape of the pieces in the red areas. The colour plot in Figure 2c shows the experiment with a viscosity ratio of 467.77 ( β = 467.77), where we find that the heavy fluid still sticks to the wall. At all viscosity ratios ( β ), the light fluid always flows upward along the centre of the pipe. This is consistent with the experimental results observed by Stevenson et al. [1] (black-and-white plot in Figure 2).
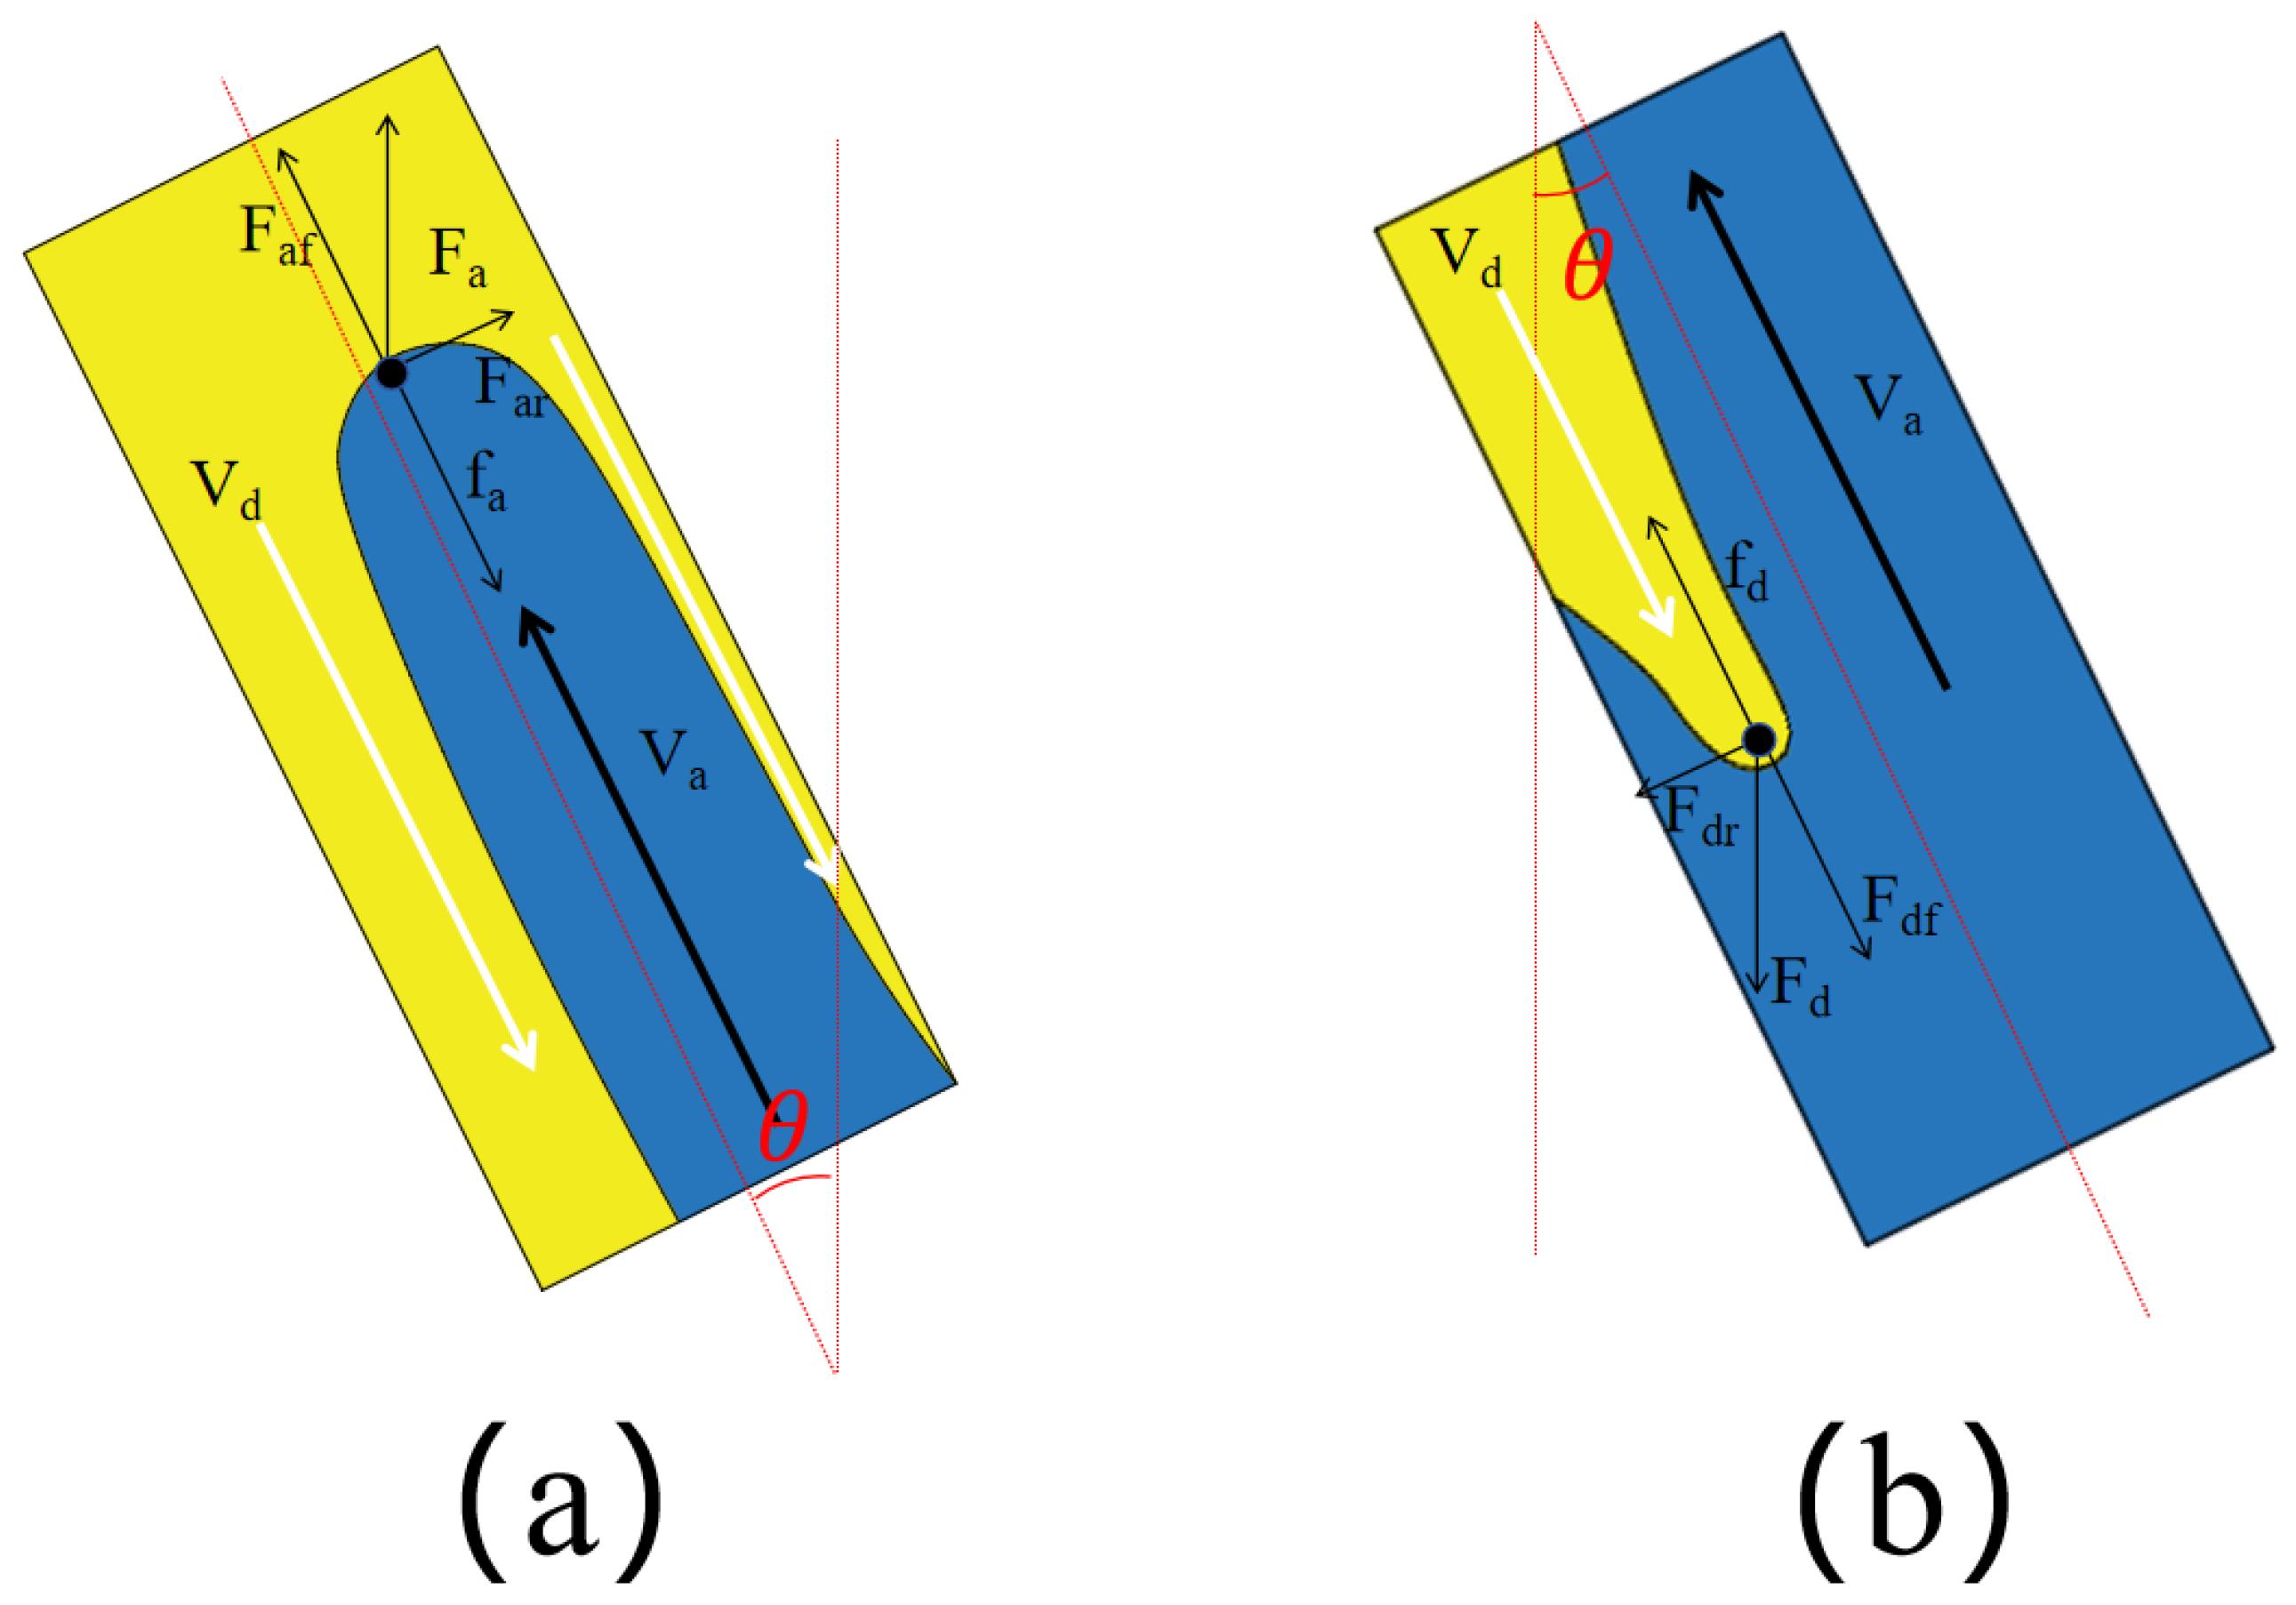
Figure 3 shows the main forces on the light and heavy fluids during flow in an inclined pipe. This facilitated us to subsequently analyse the reasons for the change in the flow pattern. Figure 3a illustrates the forces on the light fluid. The forces affecting the flow of the light fluid are the viscous force f a and the inertial force F a (which is the equivalent of the difference between the buoyancy force on the light fluid and its gravity). Here, we characterize the inertial force ( F a ) on the light fluid as the axial inertial force F a f along the pipe axis and the force perpendicular to the pipe axis. Here, we refer to it as the “radial force F a r ”. Figure 3b shows the force on the heavy fluid. During the descent of the aqueous maltose solution, it receives mainly the viscous force f d and the inertial force F d (which is the difference between the gravitational force of the aqueous maltose solution and the buoyant force on it). Here, we also characterize the force (as in the case of the light fluid) by the axial inertia force F d f along the axis and the pressure F d r perpendicular to the axis.

3.1.1. Changes in the Flow Regime of Light Fluids

Subsequently, We investigate the effect of viscosity ratio ( β ) on fluid flow in an inclined pipe. Here, we collectively refer to fluids that flow upward as light fluids. The inclination of the pipe mainly affects the fluid flow by changing the inertia force of the fluid, as well as the shape of the fluid flow. In a vertical pipe, the rising flow is basically in the centre of the pipe, as shown in Figure 2, and we refer to this flow pattern as the axisymmetric core-annular flow (CAF). When the pipe is tilted, the flow pattern of the light fluid changes. In the following, we categorize the flow patterns according to whether they flow away from the wall or not, and we judge whether the fluid flows away from the wall on two bases: first, whether we can observe the existence of a continuous flow of maltose aqueous solution between the light fluid and the wall, and second, whether the front end of the light fluid forms a complete finger-like flow pattern, whereas the flow against the wall will only form a half-finger-like flow pattern.
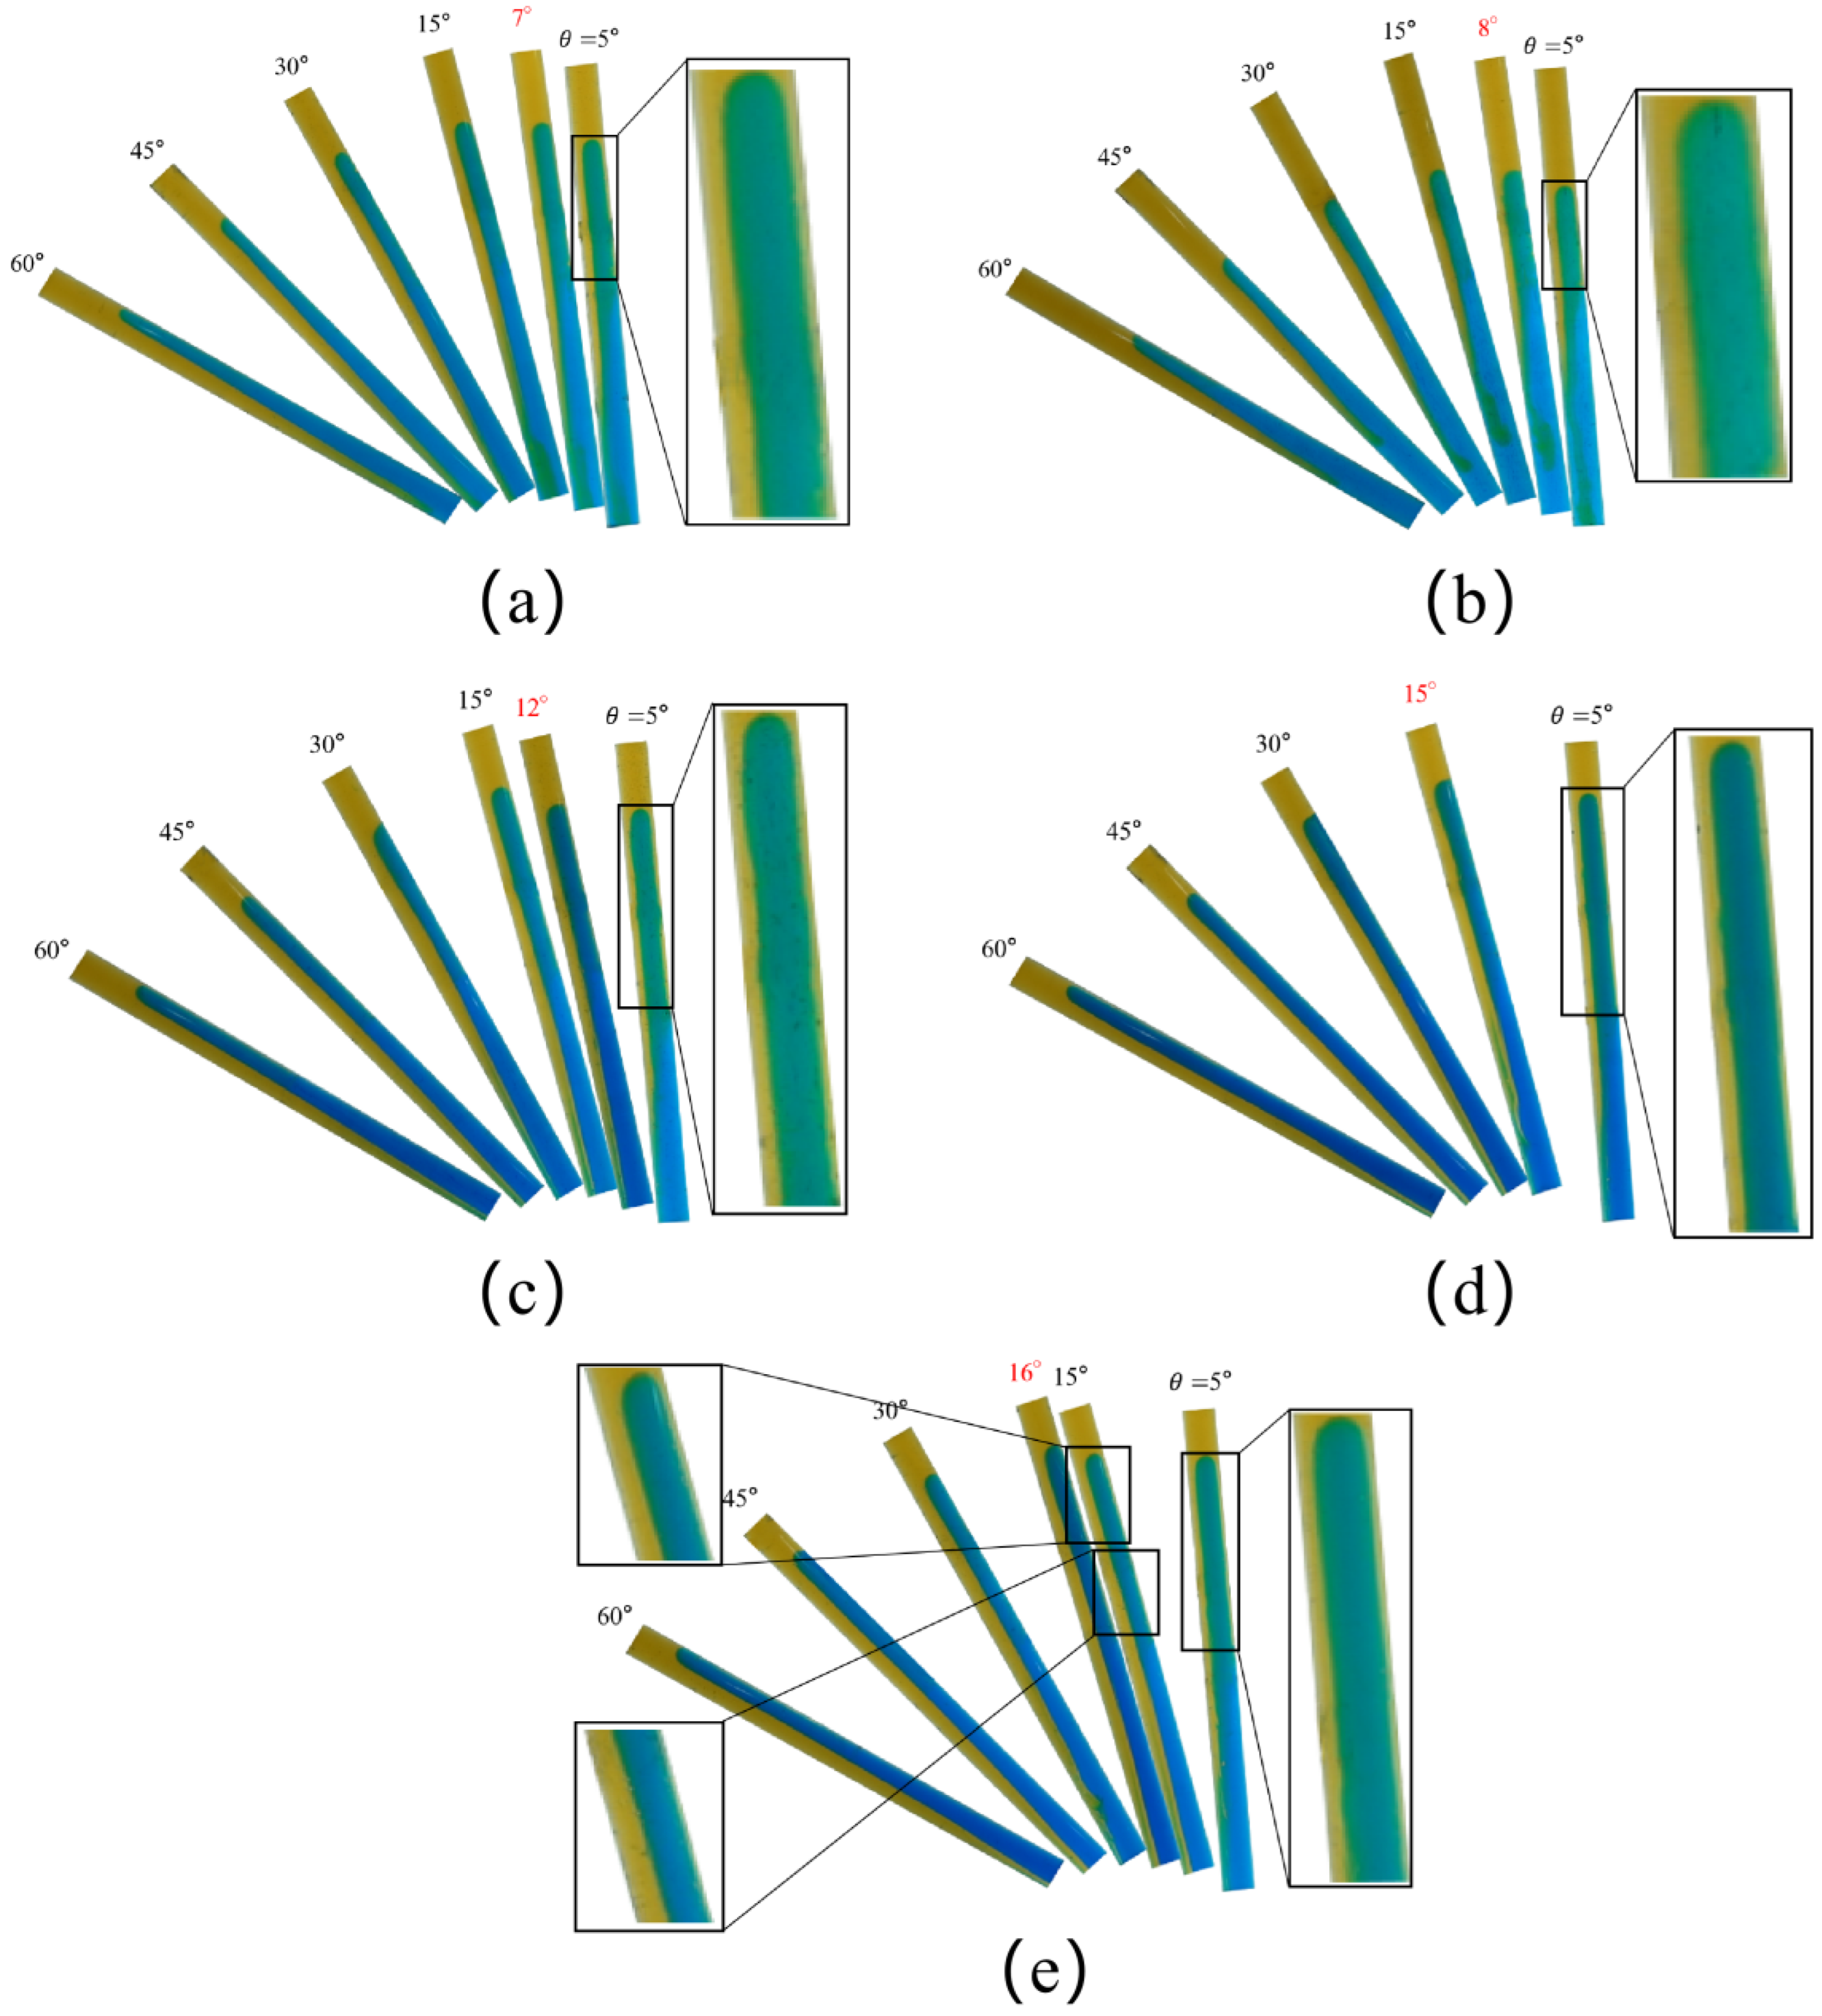
Figure 4a–e show the experimental images of flow regimes at different tilt angles ( θ ) for a β of 5.46, 9.3, 82.67, 238.66, and 467.77, respectively. As this increases, we observe three flow regimes for the light fluid at all these β . The first flow regime is that the light fluid flows away from the centre of the pipe but not along the wall, which we refer to as eccentric core-annular flow (ECAF), and we can observe this flow regime in Figure 4a–e at θ = 5 . The second flow regime is where the front end of the light fluid flows away from the wall while the back half of the fluid flows against the wall, and we refer to this flow regime as transitional side-by-side flow (TSBS), which we observe in Figure 4e with θ = 15 and in Figure A1 in the Appendix A. The third flow regime is a light fluid that flows completely against the wall, which we refer to as a side-by-side flow (SBS), and we can observe this flow regime in Figure 4a–e at the angles after the red angle.
Figure 5a shows the results of all experiments on the flow regime. In the phase diagram of Figure 5a, we summarize the light fluid flow regimes at different viscosity ratios ( β ) for different inclinations ( θ ) so that we can divide the light fluid flow regime changes into four regions during the inclination of the pipe. The light fluid on the black dotted line in Figure 5a is CAF; because the pipe is vertical at this time, the direction of the force on the light fluid is parallel to the flow direction, and the direction of the light fluid flow will not be shifted, so the light fluid flows upward in the centre of the pipe. The light fluid in the light-red transparent region of Figure 5a is ECAF; because the θ is small in this region, the direction is mainly dominated by F a f , but due to the tilt of the pipeline, it will also produce F a r ; at this time, the F a r , although small, will also change the direction of the light fluid flow with f a , resulting in light fluid in the upward flow of tilt in the process. In Figure 5a, the light-green transparent area of the light fluid flow state is TSBS. This is because, at this time, the F a f and F a r of a dominant fluid movement are of a critical point so that this will lead to part of the light fluid flowing against the wall and part of the flow moving away from the wall; when the angle of inclination is greater than the emergence of the SBS of the smallest angle of inclination ( θ ), the light fluid flow state completely turns into SBS because, at this time, the direction of the light fluid flow is dominated by the F a r , meaning the light fluid will be adhering to the wall and upward movement.
With an increase in β , the flow state into SBS of the required θ is greater; this is because of the low β , where viscous forces ( f a ) dominate. When blocking the movement of light fluids and forcing the fluid to the wall of the pipe, where the role of F a is small, resulting in a small F a f , the light fluids do not flow easily along the pipe axis. With the increase in β , the F a gradually dominates; when the F a f is large, it will make it easier for the fluid to flow along the axis of the pipe, and so a greater angle of inclination ( θ ) is needed in order to make the light fluid flow against the wall.
Figure 5b illustrates the variation of the ratio of the width of the rising light fluid to the width of the pipe ( δ a ) with the tilt angle ( θ ) for different viscosity ratios ( β ). In order to minimize the error, the δ a is measured by taking three different positions to measure the δ a and then taking the average value. As the θ becomes larger, the δ a becomes larger and then smaller. This is because when the tilt angle is small, the F a f plays a dominant role; when the tilt angle is large, the F a r plays a dominant role. The δ a at each β does not differ much when θ is small, which is due to the fact that at a small θ , the variation in the individual forces is small and, therefore, does not have much effect on the width of the fluid flow. With the gradual increase in θ , the δ a at a high β is larger than that at a low β , which is because the light fluid flow is dominated by F a f at a high β . It is easier for the light fluid to flow towards the centre of the pipe, resulting in the widening of the width of the light fluid at this time.
We found that as a light fluid rises, it does not occupy the centre of the pipe and flow upward. This causes the forces on both sides of the light fluid to be asymmetrical. This is very difficult to capture. It is currently not possible to set boundary conditions for this situation when considering the theoretical perspective. Thus, in our theoretical model, we have tried to simplify it. We assume that the rising fluid occupies the centre of the pipe at all tilt angles, making the forces on both sides of the light fluid symmetrical. This allowed us to derive a velocity model for the rising fluid. Furthermore, we collected the ratio of the width of the light fluid to the diameter of the pipe ( δ a ) and recorded it in Table 3, which will be used as a parameter to calculate the velocity for our later theoretical model. We found that the δ a increases and then decreases as the tilt angle ( θ ) increases. This variation in the δ a is different from the variation in the velocities of the light fluids that we have collected. Of course, such a simplification introduces a certain amount of error, and we also explain the main reason for this error later during the discussion of the theoretical model.

3.1.2. Changes in the Flow Regime of Aqueous Maltose Solution (Heavy Fluids)

We then investigated the changes in the flow pattern of the aqueous maltose solution, and for ease of observation, the pictures we show here are of the lower half of the pipe. The change in the viscosity ratio is mainly achieved by changing the magnitude of the inertial and viscous forces on the two fluids in the pipe to change the flow pattern. Based on our previous simulation results and the experimental results of Stevenson et al., we can classify the viscosity ratio range into three categories: The first category is for viscosity ratios less than 10 ( β < 10), and we refer to this range as the low viscosity ratio range. Heavy fluids in this viscosity ratio range descend from the centre of the pipe in vertical pipes. The second category is viscosity ratios greater than 10 and less than 300 (10 < β < 300), and we refer to this range as the medium viscosity ratio range; heavy fluids in this viscosity ratio range separate during descent. The third category comprises viscosity ratios greater than 300 ( β > 300); we refer to this range as the high viscosity range. Heavy fluids in this viscosity ratio range fall along the pipe wall. In our experiments, we found that the results for viscosity ratios of 5.46 and 9.3 are consistent. Because of this, here, we only show the experimental results for a viscosity ratio of 5.46.
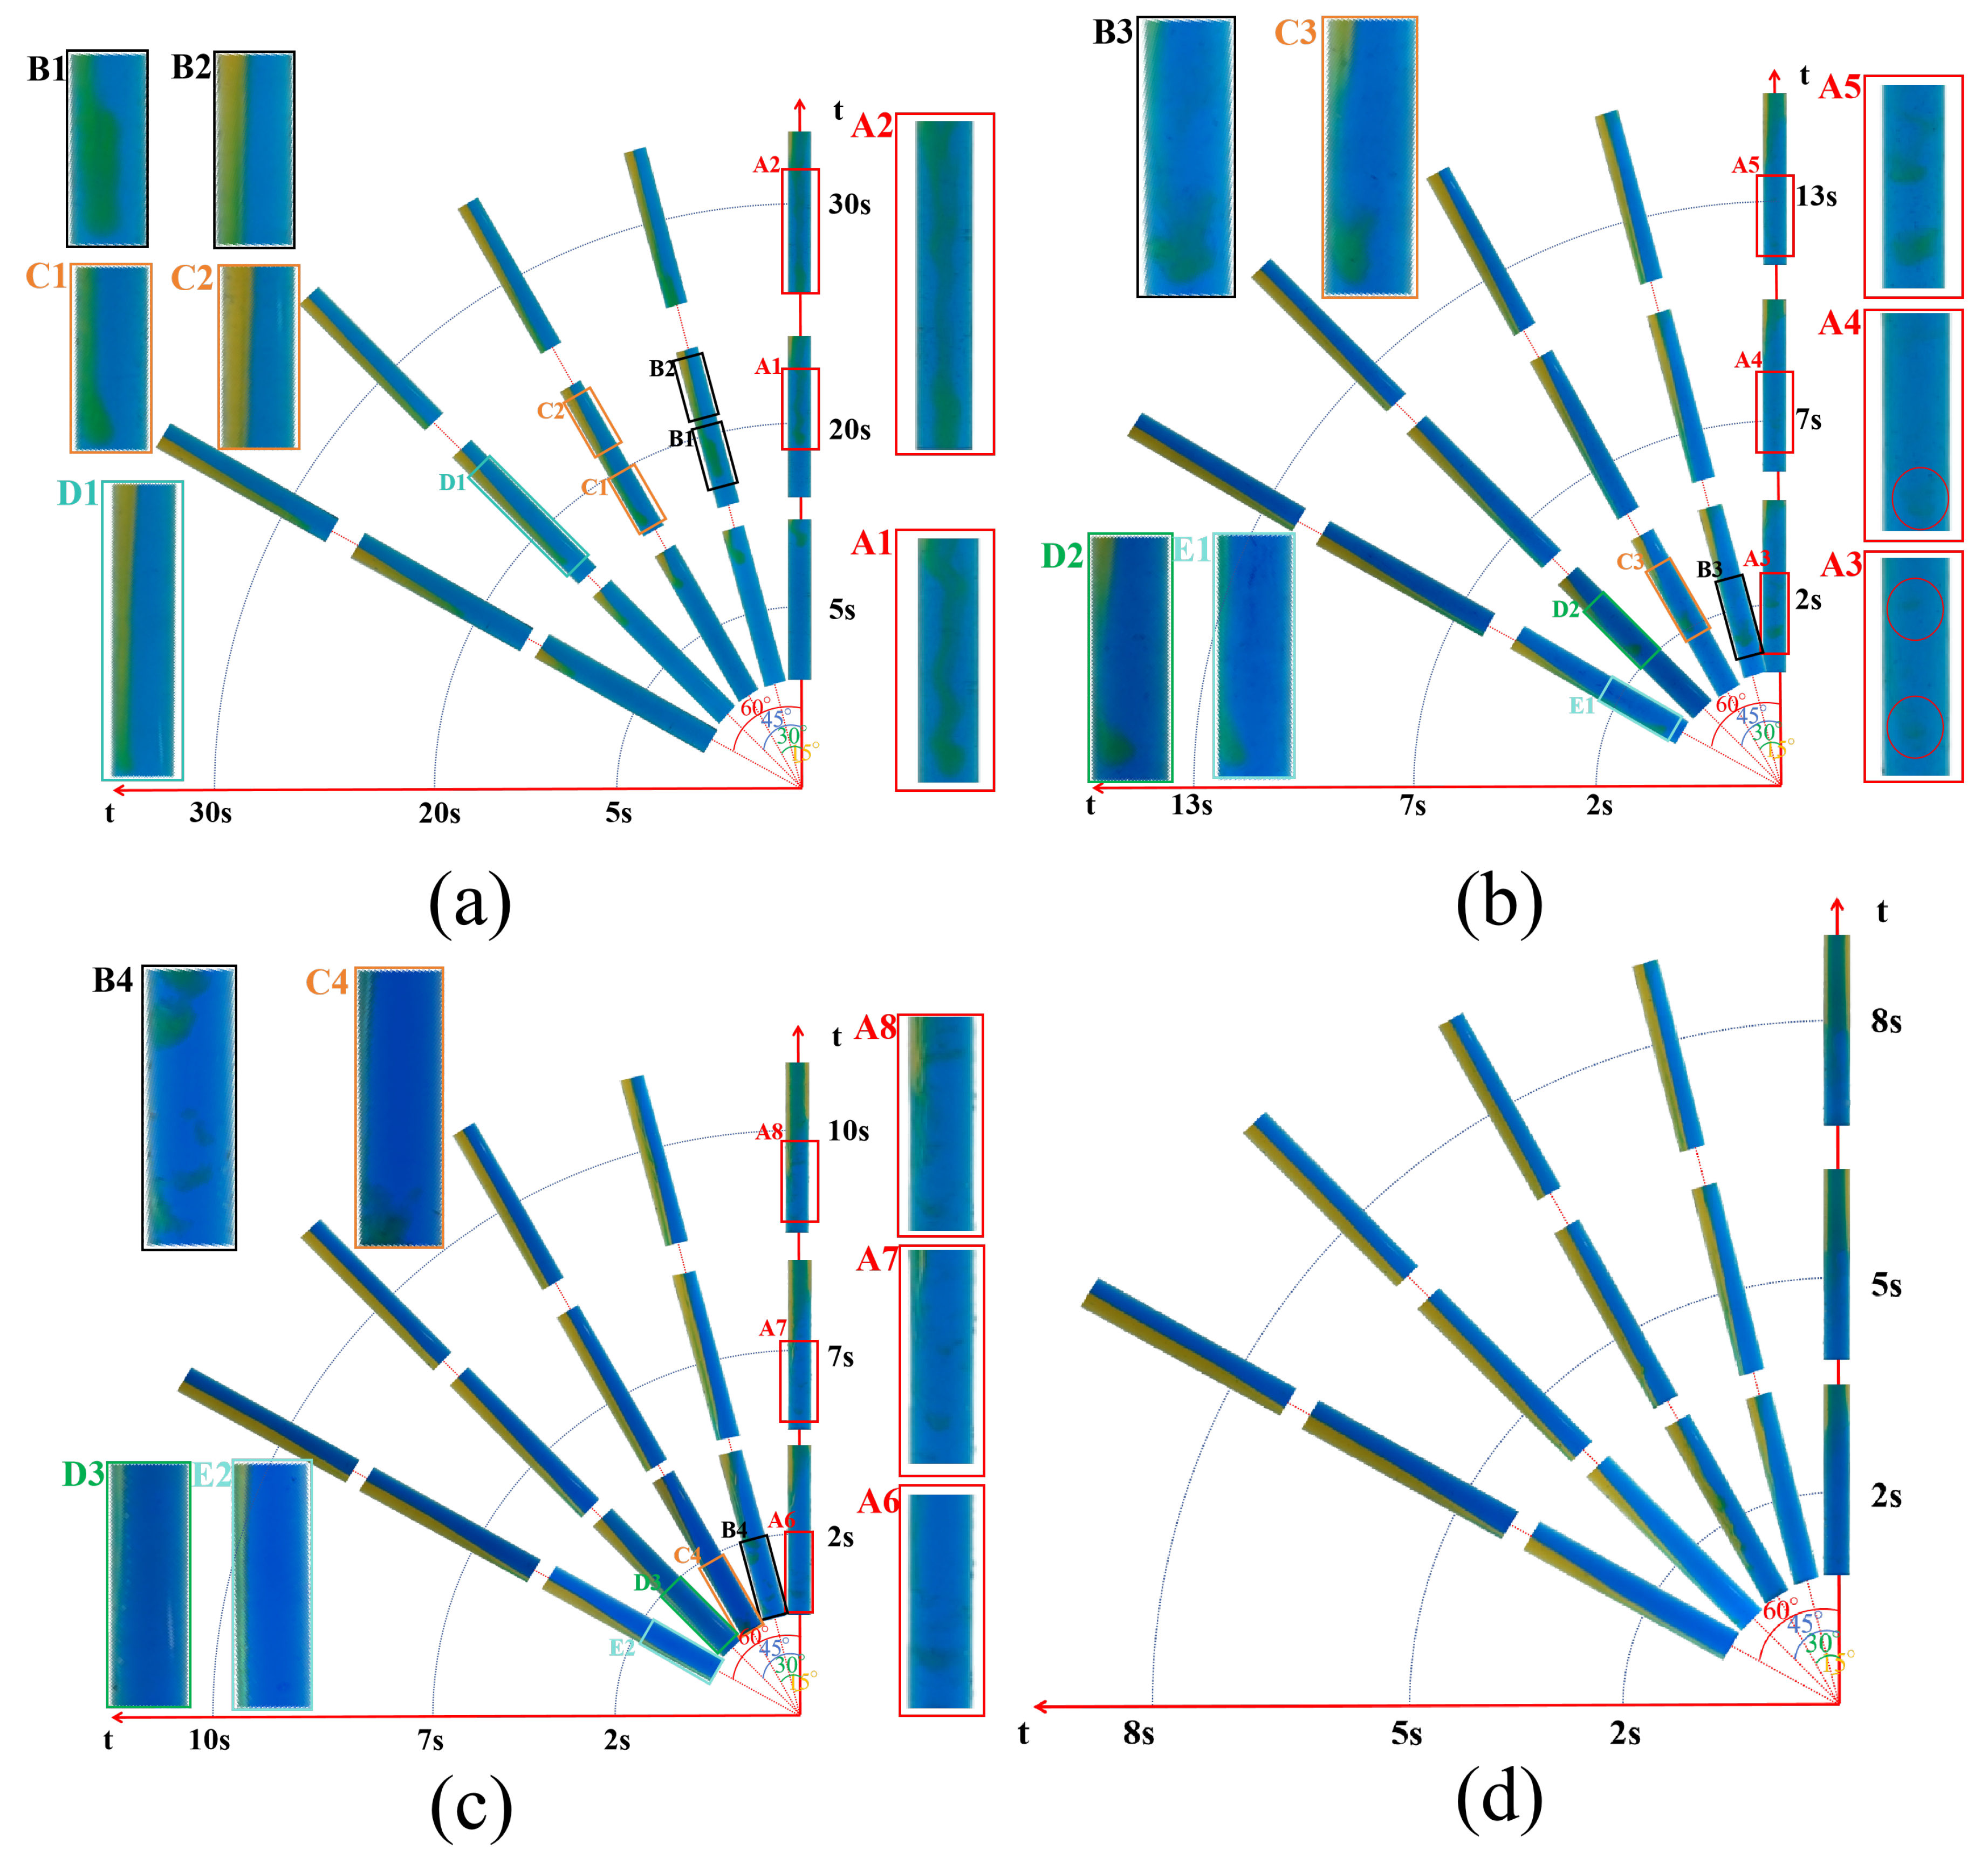
Figure 6a demonstrates the variation with time of the flow regime of aqueous maltose solution at different inclination angles ( θ ) for β = 5.46. This is in the low-viscosity ratio range. We observe that when the θ = 0 , the aqueous maltose solution at this viscosity ratios will keep descending along the centre of the pipe, as shown in Figure 6a for A1 and A2. When 0 < θ < 45 , we can observe that the front section of the aqueous maltose solution has a very obvious flow away from the wall, as demonstrated in Figure 6a for B1 and C1. This is because under the action of pressure ( F d r ), the aqueous maltose solution should flow down along the wall, but at this time, due to β being small and the viscous force ( f d ) being large, the viscous force ( f d ) and axial inertia force ( F d f ) are dominant during the movement of the front end of the aqueous maltose solution, which forces the maltose aqueous solution to move away from the wall. The F d r of the rear section of the aqueous maltose solution overcomes the f d and F d f , so it will make the rear section of the aqueous maltose solution flow downward along the wall, as demonstrated in Figure 6a for B2 and C2. As the θ becomes larger, the F d f will slowly become smaller, and the F d r will slowly become larger, meaning the larger the effect from F d r , the smaller the fraction of the aqueous maltose solution that moves away from the wall; when comparing Figure 6a B1 and C1, we can observe this. When the part that starts to produce movement away from the wall reaches the bottom of the pipe, the subsequent aqueous maltose solution will all flow down the wall under the action of F d r . When θ > 45 , the effect of F d r is so great that no aqueous maltose solution flowing away from the wall will be produced, which is illustrated in Figure 6a (D1).
Figure 6b,c show the variation with time in the aqueous maltose solution at different tilt angles ( θ ) for β = 82.67 and 238.66, respectively. This is in the medium-viscosity ratio range. We observe that when θ = 0 , the aqueous maltose solutions at the two viscosity ratios will continuously produce separated aqueous maltose solutions, as shown in Figure 6b for A3, A4, and A5, and Figure 6c for A6, A7, and A8; this is because, at this time, the viscosity of the light fluid is small, and the viscous force ( f d ) on the aqueous maltose solution is small. At this point, the axial inertia force ( F d f ) is greater than the sum of the viscous force ( F d r ) and the viscous force of the aqueous maltose solution itself. Thus, a separated maltose aqueous solution is produced. Here, in order to quantitatively characterize whether a separated aqueous maltose solution was produced, we measured the proportion of the pipe occupied by the minimum width of the aqueous maltose solution ( δ d ) 2 s prior to descent, and this is recorded in Table 3. When δ d = 0, we considered that the separated aqueous maltose solution. Conversely, no aqueous solution of separated maltose was produced. After the pipe is tilted, when β = 82.67 and t = 2 s, all δ d = 0 as shown in Figure 6b for B3, C3, D2, and E1. When β = 238.66 and t = 2 s and θ < 30 , δ d = 0, as shown in Figure 6c for B4 and C4. when θ = 45 and t = 2 s, δ d = 0.05; when θ = 60 and t = 2 s, δ d = 0.14, and at this time, the maltose aqueous solution was not undergoing separation, as can be seen in Figure 6c for D3 and E2. This is because, at this time, when the maltose aqueous solution was under inertial force ( F d ), the action of the maltose aqueous solution quickly reached the bottom of the pipeline so that it was too late for the lower end of the maltose aqueous solution to separate.
Figure 6d demonstrates the variation in the aqueous maltose solution as a function of time for β = 467.77 when the aqueous maltose solution was at different tilt angles ( θ ) along the flow state with time; this is in the high-viscosity ratio range. At this time, we can find that the flow pattern under each θ is basically the same; the maltose water solution is all adhering to the wall’s downward flow because, at this time, the viscous force ( f d ) is small, and under the action of the inertial force ( F d ), the maltose water solution quickly moved to the bottom of the pipe, where it is too late for the maltose water solution to separate. This situation is similar to Figure 6c (D3 and E2).

3.2. Velocity Changes

3.2.1. Light Fluid Velocity Changes

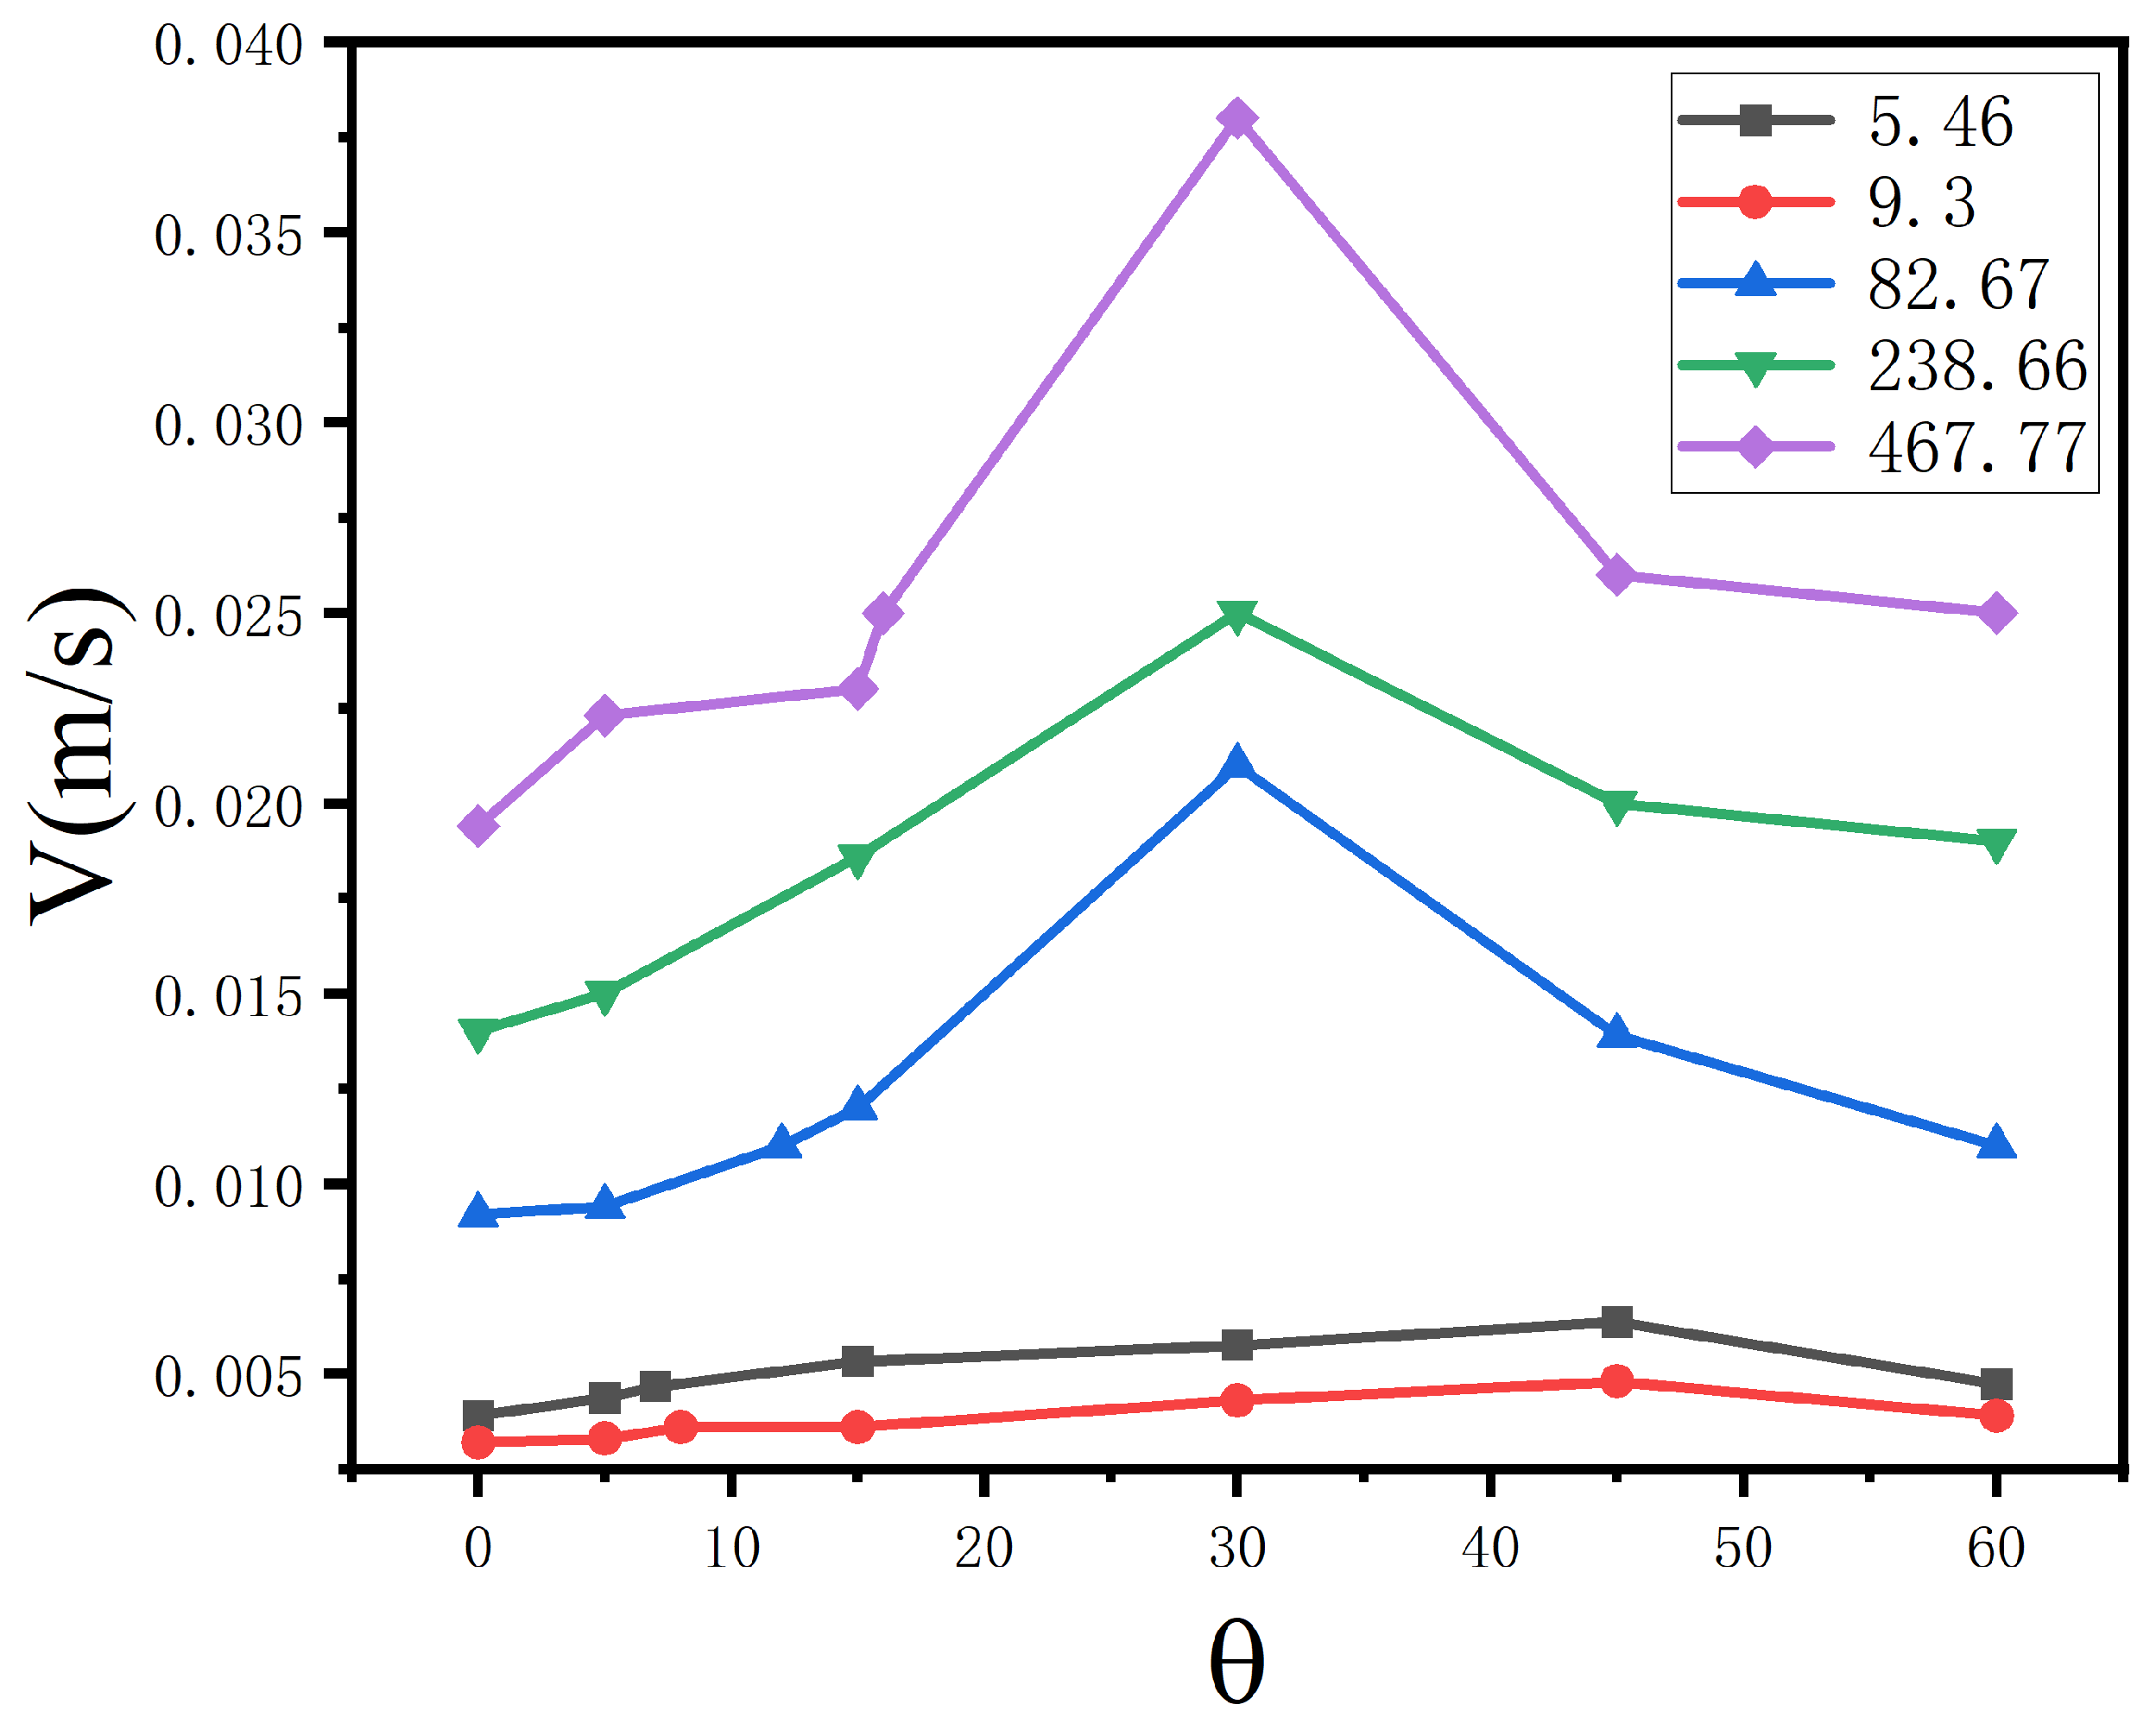
Subsequently, we also investigated the variation in the velocity (V) of the light fluid with tilt angle ( θ ) for different viscosity ratios ( β ). We calculated the velocity of the watery fluid in terms of the distance it reaches along the upper end of the pipe, as well as the time of its movement, and the results obtained are shown in Figure 7. We observe that the light fluid velocity increases and then decreases as θ increases, which is consistent with Weber et al. [18], who observed a change in the rate of the rise of bubbles in an inclined pipe.
We also found that when the viscosity ratio is smaller, the change in the rate of rise for the light fluid in the pipe is smaller. This is because, at this time, the viscosity ratio of the two fluids is relatively small, and the watery fluid produced by the viscous force is rather large. At this time, due to the density difference between the two fluids being small, the light fluid produced by the inertia force is also relatively small. Under the joint action of the two, no matter how inclined the pipeline, the change in the fluid velocity will not be large. When the viscosity ratio is relatively large, the speed at which the light fluid rises in the pipeline is larger. This is because, at this time, the viscosity ratio of the two fluids is relatively large, although the light fluid produced by the viscous force change is not. However, the difference in the density between the two fluids is very large at this time, leading to the light fluid’s inertia force being larger. Additionally, the rising speed of the watery fluid is mainly dominated by the force of inertia. When the pipeline is tilted, because the inertia force is larger, the changes in the tilted axial inertia force of the pipeline will be larger. This will this lead to a large change in the velocity of the rising fluid under this viscosity ratio.

3.2.2. Comparison of Experimental and Theoretical Model Velocities for Light Fluids

In our previous work, we established that the steady state exchange flow of two incompressible Newtonian fluids in a pipe inclination, θ , from the vertical direction can be described by the Stokes equation for radial co-ordinates [12]:
μ d 1 r d d r r d u d d r = d p d z + ρ d g cos θ , r [ δ , R ]
μ a 1 r d d r r d u a d r = d p d z + ρ a g cos θ , r [ 0 , δ ]
where R denotes the radius of the pipe; μ a and μ d denote the viscosity of the light and heavy fluids; u a and u d denote the velocities of the light and heavy fluids; ρ a and ρ d denote the densities of the light and heavy fluids; g denotes the acceleration of gravity; θ denotes the angle of inclination of the pipe; and δ denotes the radius of the rising fluid. The pressure drop is an unknown constant to be determined. The boundary conditions include no slippage of the pipe wall and the disappearance of radial stresses on the symmetric line at the centre of the pipe, as well as the continuity of velocities and shear stresses at the fluid–fluid interface. We define the dimensionless quantities here:
r ^ = r R , δ ^ = δ R , u ^ = u U
Here, we define U = Δ ρ g R 2 / μ d and Δ ρ = ρ d ρ a as the density difference. By combining Equations (1) and (2) and removing the superscripts, we obtain the dimensionless velocity equations for rising and heavy fluids:
u d ( r ) = P 4 r 2 1 δ 2 2 cos θ log r , r [ δ , 1 ]
u a ( r ) = M P cos θ 4 r 2 δ 2 + P 4 ( δ 2 1 ) δ 2 2 cos θ log δ , r [ 0 , δ ]
P = ( d p d z + ρ d g cos θ ) / ( g Δ ρ ) , M = μ d μ a
The rising flux in a closed pipe containing an incompressible fluid must be in perfect balance with the falling flux, and we can use this to obtain an expression for P. Finally, we obtain an expression for the rising velocity by integrating the velocity profile after bringing in the magnitude:
V = ( P 4 ( δ 2 1 ) δ 2 2 cos θ log δ δ 2 8 M ( P cos θ ) ) Δ ρ g R 2 μ d
P = δ 2 2 ( δ 2 1 ) M δ 2 δ 4 1 M δ 4 cos θ
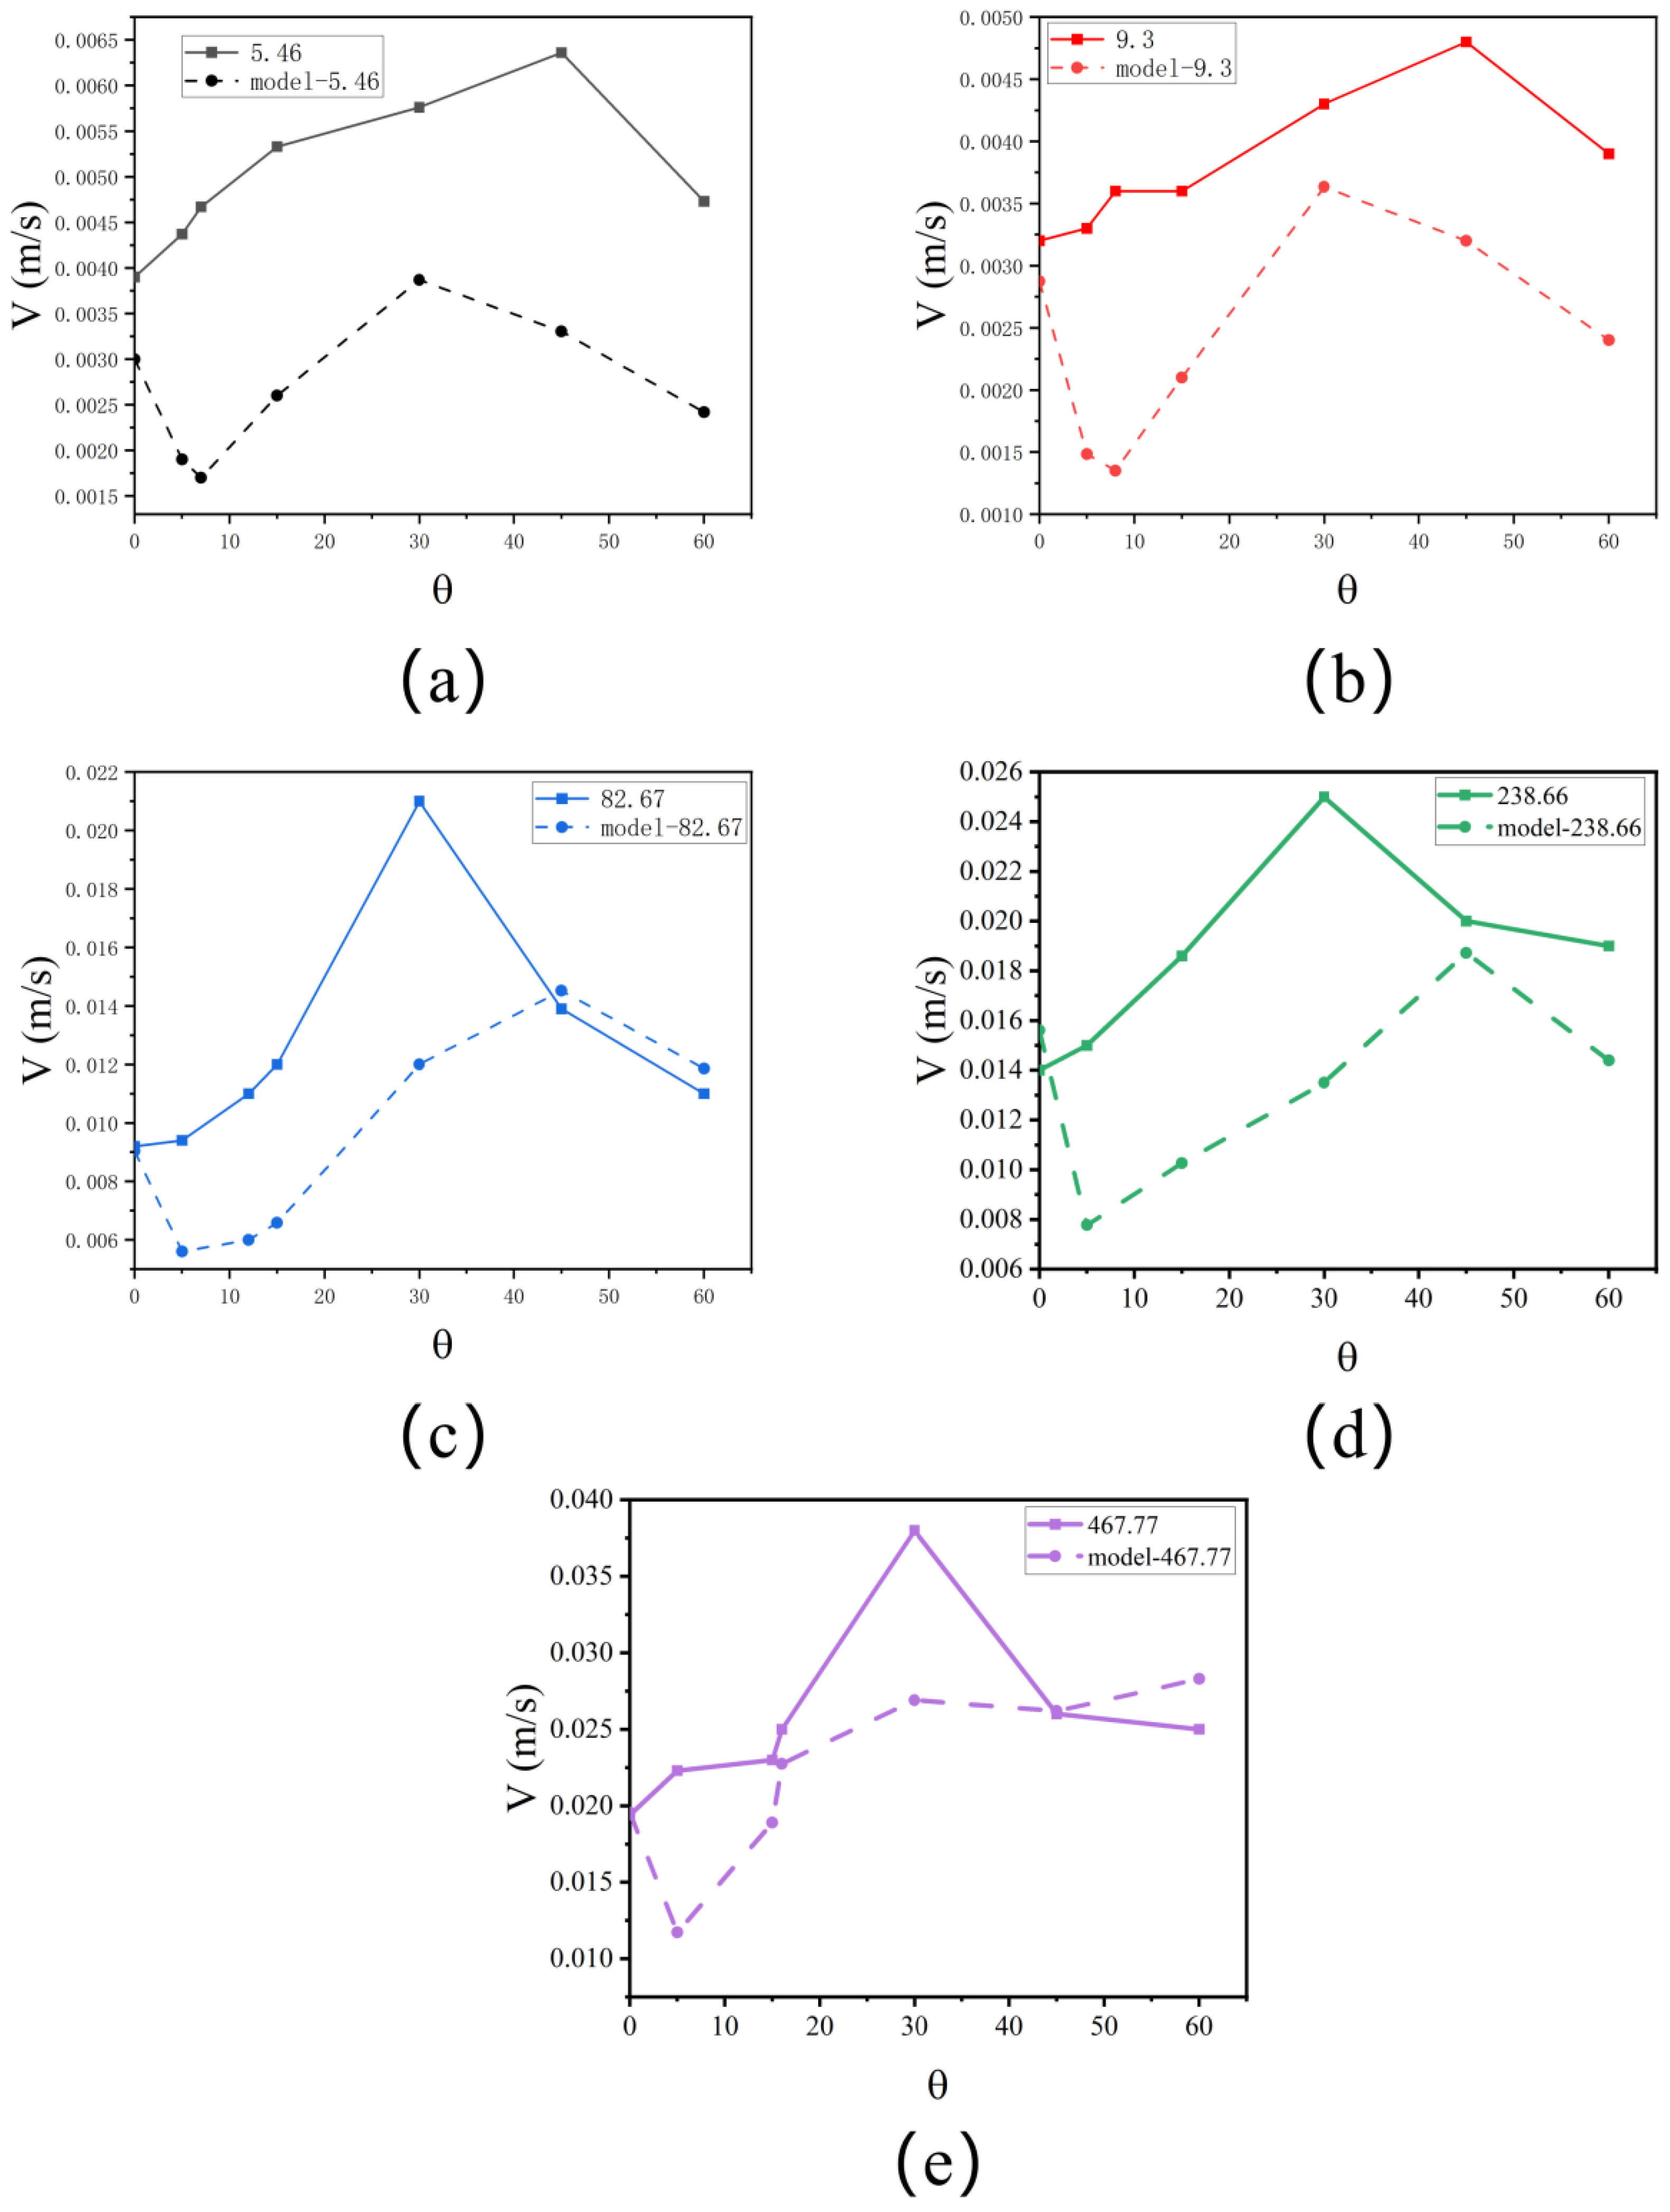
The parameters obtained from our experiments are shown in Table 3, and the parameters are brought into Equation (7) to derive the velocities for a comparison with the velocities measured by our experiments. Figure 8a–e show the results of the comparison between the experimentally measured velocities and the model-calculated velocities for the five viscosity ratios ( β ) at different times. We can find that the experimental velocities for the five β compare well with the theoretical velocities when the pipe is tilted at θ = 0 because, at this time, the fluid in the pipe flows upward in the centre of the pipe, which agrees with the conditions of the model. Once the pipe begins to tilt, the model differs more from the experimental measurements. We observe two main areas where the differences are large.
(1)
First, of all, we found that in the velocity results of the model, as the pipe is tilted, the velocity becomes smaller and then larger, whereas this did not happen in the velocities measured in our experiments. This is because after the pipe is tilted, as mentioned above, the δ a becomes larger and then smaller, whereas, in our model, where we kept the boundary conditions unchanged, the velocity becomes smaller as the θ and the δ a become larger so that there is a decrease in the velocity in the model. However, in the experiment, after the pipe was tilted, the light fluid did not move in the centre of the pipe; at this time, the shear force (viscous force) was not the same on both sides of the light fluid. When the light fluid moves against the wall, meaning only one side is subjected to shear force, and the closer it is to the wall, the smaller the subjection to resistance. This leads to the velocity becoming larger first when the pipe is tilted in the experiment. This results in inconsistencies regarding the results predicted by the model.
(2)
We also find that the model predicted velocities are generally smaller than the experimentally measured velocities. This is because a portion of the shear force exerted on the light fluid in the experiment acts on the change in direction of the light fluid flow. In that case, the role of inertial forces on the change in velocity in the experiment will be large as a percentage. This is not taken into account in our model, so the experimental velocity is greater than the modelled velocity. However, from Figure 8c,e, we observe that the model velocity is greater than the experimentally measured velocity at θ = 45 and θ = 60 for both β . In Figure 8e, we observe a tendency for the velocity to become larger at θ = 60 , which is attributed to the smaller value of the measured δ a due to the interfacial instability.
Our model can predict fluid velocities in vertical or near-vertical pipes. The rising light fluid in the experimental pipe occupies the centre of the pipe, and the force inside the pipe is symmetrical. Thus, the velocity of the fluid in the pipe can be predicted using our method. When a pipe is inclined, the forces on the fluid flow in the prone pipe are complex. First, the shear force on both sides of the rising fluid differs. This also causes the velocities on both sides of the rising fluid to be different. This is one of the main reasons for the large prediction error of our model. The shape of the rising light fluid also changes when the pipe is tilted. After careful observation, we found that when a light fluid rises, the front end is narrow, and the back end is wide. It is sometimes possible that the fluid flow is small in the centre and wide at both ends. Representing these situations in a theoretical model represents a significant challenge challenge.

4. Conclusions

In this work, we consider the effect of viscosity ratio ( β ) and inclination angle ( θ ) on the exchange flow of two fluids occurring inside a pipe. We found that when these two factors are changed, the flow regimes, as well as the velocities of the two fluids inside the pipe, are changed. The main findings are summarized below.
Under different β , after tilting the pipeline to a certain angle, we find that the light fluid will appear in a total of four flow regimes: CAF, ECAF, TSBS, and SBS. With the increase in β , the critical angle for the flow state to change into a side-by-side flow will become larger. When the tilt angle is greater than 16 , no matter how large the β is, the flow state of the light fluid is a side-by-side flow at this time. We also find that the width of the rising light fluid to the width of the pipe ( δ a ) increases and then decreases as the θ becomes larger. When the β is large, the δ a at a high β is larger than at a low β .
For a range of three β . As the pipe is tilted, at a low β , the portion flowing away from the wall becomes smaller as the angle of θ increases. In the medium β range, as the β increases, the maltose aqueous solution does not produce any more detached maltose aqueous solution at the beginning of the flow. At a high β , the flow pattern is essentially the same for all θ .
Finally, we have also studied the change in velocity of the light fluid. It was found that the velocity of the watery fluid first becomes larger and then smaller as the θ increases. However, the extent of the velocity change is not significant when β is small, and the velocity change is more obvious when β is large. For a final comparison, regarding the theoretical model we built previously, we found that the comparison is good only when θ = 0 , and the difference in the comparison is larger after the pipe is tilted.
Our experimental study fills the gap in the literature regarding the effect of the viscosity ratio on the exchange flow of two fluids in an inclined pipe. We can clearly understand the flow state of the two fluids in the pipe. This is very important for further research—for example, in a study of two complex fluids inside a pipe. However, our theoretical model does not compare well with the experimental velocity when the pipe is inclined. However, the comparison results are very reliable when the pipe is vertical. Our theoretical model can predict the fluid flow velocity in a pipe for any parameter. This velocity is not limited to the velocity of an ascending fluid, but also indicates the velocity of a downward-flowing fluid, which requires our model to be extended. We can use this to predict the velocity of fluids in vertical or near-vertical pipes, both in nature and in industrial production. Examples include the velocity of lava eruption in a crater channel and the velocity of oil flow in a submarine oil flow pipeline. Our experiments also provide insight into the design of industrial pipelines. For example, they show how the piping can be set up to help us obtain relatively high efficiency (such as the rate of oil recovery in subsea oil pipelines) or a lower rate of hazards (such as in the exchange of gases in ventilation ducts in the event of a fire).

Author Contributions

Conceptualization, Z.Q.; methodology, W.H.; formal analysis, W.H. and K.H.; investigation, Z.N.; resources, Z.Q.; data curation, Z.Q. and W.H.; writing—original draft preparation, K.H.; writing—review and editing, Z.Q., W.H. and Z.N.; supervision, Z.Q.; project administration, W.H.; funding acquisition, Z.Q. All authors have read and agreed to the published version of the manuscript.

Funding

This research was funded by the National Natural Science Foundation of China (Grant No. 12172094).

Institutional Review Board Statement

Not applicable.

Informed Consent Statement

Not applicable.

Data Availability Statement

The raw data supporting the conclusions of this article will be made available by the authors on request.

Conflicts of Interest

The authors declare no conflicts of interest.

Appendix A

Here, we give the experimental supplemental figure of Section 3, Part 1, where we can clearly observe the presence of a fingered flow regime at the front end of the light fluid, and the aqueous maltose solution can be observed between it and the wall. Still, the lower part of the light fluid flows against the wall and, thus, the flow regimes of light fluids under these four conditions are all transitional side-by-side flow regimes.
Figure A1. Supplementary experimental plots of approaching critical angles at different viscosity ratios ( β ). The yellow fluid is the descending heavy fluid, and the blue fluid is the ascending light fluid. The enlarged diagrams show the first half as well as the second half of the flow regime of the watery fluid under this condition. The corresponding β and θ are (a) β = 5.46, θ = 6 ; (b) β = 9.3, θ = 7 ; (c) β = 82.67, θ = 10 ; (d) β = 238.66, θ = 14 .
Applsci 14 01573 g0a1

References

  1. Stevenson, D.S.; Blake, S. Modelling the dynamics and thermodynamics of volcanic degassing. Bull. Volcanol. 1998, 60, 307–317. [Google Scholar] [CrossRef]
  2. Dalziel, S.B. Maximal exchange in channels with nonrectangular cross sections. J. Phys. Oceanogr. 1992, 22, 1188–1206. [Google Scholar] [CrossRef]
  3. Jaluria, Y.; Lee, S.K.; Mercier, G.; Tan, Q. Transport processes across a horizontal vent due to density and pressure differences. Exp. Therm. Fluid Sci. 1998, 16, 260–273. [Google Scholar] [CrossRef]
  4. Joseph, D.D.; Bai, R.; Chen, K.; Renardy, Y.Y. Core-annular flows. Annu. Rev. Fluid Mech. 1997, 29, 65–90. [Google Scholar] [CrossRef]
  5. Debacq, M.; Hulin, J.P.; Salin, D.; Perrin, B.; Hinch, E.J. Buoyant mixing of miscible fluids of varying viscosities in vertical tubes. Phys. Fluids 2003, 15, 3846–3855. [Google Scholar] [CrossRef]
  6. d’Olce, M.; Martin, J.; Rakotomalala, N.; Salin, D.; Talon, L. Pearl and mushroom instability patterns in two miscible fluids’ core annular flows. Phys. Fluids 2008, 20, 024104. [Google Scholar] [CrossRef]
  7. Martin, J.; Rakotomalala, N.; Salin, D.; Talon, L. Convective/absolute instability in miscible core-annular flow. Part 1: Experiments. J. Fluid Mech. 2009, 618, 305–322. [Google Scholar]
  8. Huppert, H.E.; Hallworth, M.A. Bi-directional flows in constrained systems. J. Fluid Mech. 2007, 578, 95–112. [Google Scholar] [CrossRef]
  9. Beckett, F.; Mader, H.; Phillips, J.; Rust, A.; Witham, F. An experimental study of low-Reynolds-number exchange flow of two Newtonian fluids in a vertical pipe. J. Fluid Mech. 2011, 682, 652–670. [Google Scholar] [CrossRef]
  10. Kerswell, R. Exchange flow of two immiscible fluids and the principle of maximum flux. J. Fluid Mech. 2011, 682, 132–159. [Google Scholar] [CrossRef]
  11. Suckale, J.; Qin, Z.; Picchi, D.; Keller, T.; Battiato, I. Bistability of buoyancy-driven exchange flows in vertical tubes. J. Fluid Mech. 2018, 850, 525–550. [Google Scholar] [CrossRef]
  12. Picchi, D.; Suckale, J.; Battiato, I. Taylor drop in a closed vertical pipe. J. Fluid Mech. 2020, 902, A19. [Google Scholar] [CrossRef]
  13. Joseph, D.D.; Renardy, M.; Renardy, Y. Instability of the flow of two immiscible liquids with different viscosities in a pipe. J. Fluid Mech. 1984, 141, 309–317. [Google Scholar] [CrossRef]
  14. Meiburg, E.; Vanaparthy, S.H.; Payr, M.D.; Wilhelm, D. Density-Driven Instabilities of Variable-Viscosity Miscible Fluids in a Capillary Tube. Ann. N. Y. Acad. Sci. 2004, 1027, 383–402. [Google Scholar] [CrossRef] [PubMed]
  15. Everage, A., Jr. Theory of stratified bicomponent flow of polymer melts. I. Equilibrium Newtonian tube flow. Trans. Soc. Rheol. 1973, 17, 629–646. [Google Scholar] [CrossRef]
  16. Bendiksen, K.H. On the motion of long bubbles in vertical tubes. Int. J. Multiph. Flow 1985, 11, 797–812. [Google Scholar] [CrossRef]
  17. Zukoski, E. Influence of viscosity, surface tension, and inclination angle on motion of long bubbles in closed tubes. J. Fluid Mech. 1966, 25, 821–837. [Google Scholar] [CrossRef]
  18. Weber, M.E.; Alarie, A.; Ryan, M.E. Velocities of extended bubbles in inclined tubes. Chem. Eng. Sci. 1986, 41, 2235–2240. [Google Scholar] [CrossRef]
  19. Séon, T.; Hulin, J.P.; Salin, D.; Perrin, B.; Hinch, E. Buoyancy driven miscible front dynamics in tilted tubes. Phys. Fluids 2005, 17, 031702. [Google Scholar] [CrossRef]
  20. Alba, K.; Taghavi, S.; Frigaard, I. Miscible density-unstable displacement flows in inclined tube. Phys. Fluids 2013, 25, 067101. [Google Scholar] [CrossRef]
  21. Lefauve, A.; Linden, P. Buoyancy-driven exchange flows in inclined ducts. J. Fluid Mech. 2020, 893, A2. [Google Scholar] [CrossRef]
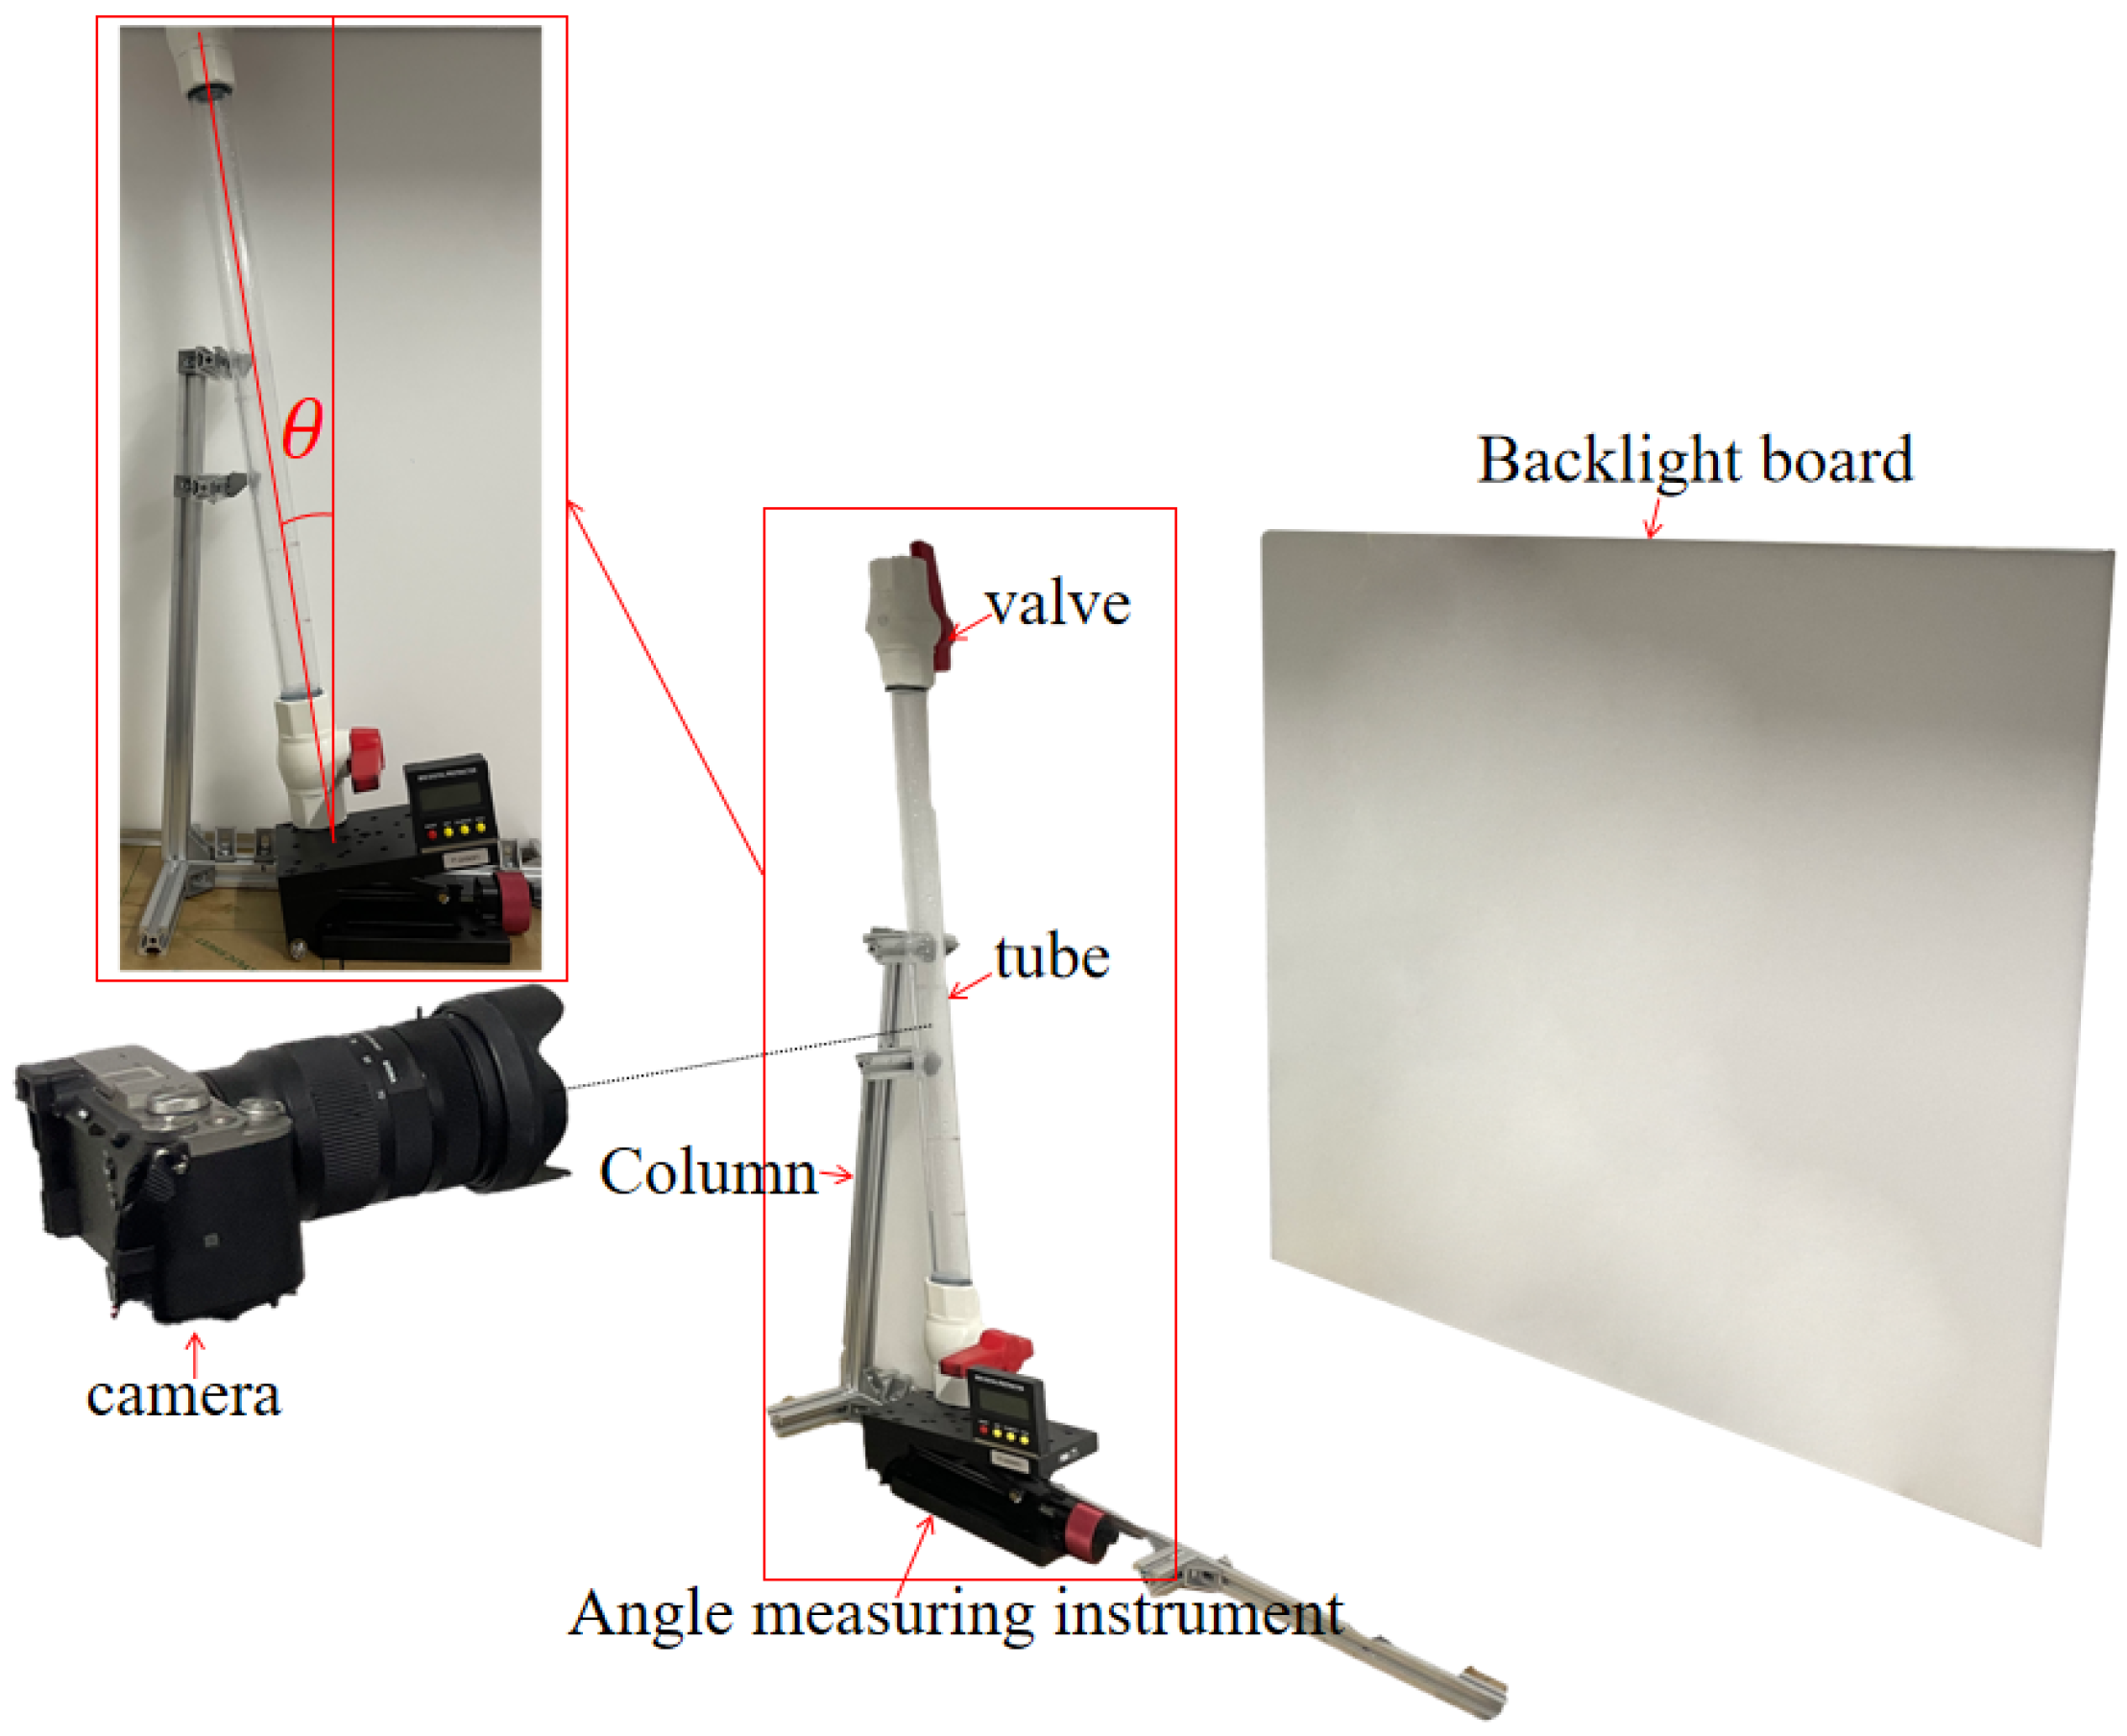
Figure 1. Diagram of the experimental setup.
Applsci 14 01573 g001
Figure 2. The experimental plots when θ = 0 ; black and white: Stevenson et al. (a) The colour plots (from left to right) are for the β = 5.46 and β = 9.3 experimental plots, respectively. (b) The colour plots (from left to right) for the β = 82.67 and β = 238.66 experimental plots; the zoomed-in image therein demonstrates that the aqueous maltose solution breaks during its descent; the aqueous maltose solution that breaks is shown in the red circle. (c) The colour figure shows the experimental graphs for β = 467.77 of the experimental graph.
Applsci 14 01573 g002
Figure 3. Forces on the fluid in the inclined pipe; the blue solution is the light fluid, and the yellow solution is the medium fluid. (a) Force on light fluid; (b) force on aqueous maltose solution.
Applsci 14 01573 g003
Figure 4. A collection of experiments at different viscosity ratios ( β ) for different inclination angles ( θ ), with the yellow fluid being the descending heavy fluid and the blue fluid being the ascending light fluid; the angle value marked in red is the critical angle at which the transitional flow regime changes to a side-by-side flow, with the viscosity ratios ( β ) of (a) β = 5.46; (b) β = 9.3; (c) β = 82.67; (d) β = 238.66; (e) β = 467.77. The enlarged plots in (ad) show the flow of light fluid at θ = 5 for the corresponding viscosity ratio for light fluid flow; the enlarged view in (e) shows the flow pattern of light fluid flow at θ = 5 at its viscosity ratio and the flow pattern of the first half and the second half of the light fluid at θ = 15 .
Applsci 14 01573 g004
Figure 5. (a) Phase diagrams of flow classification at different inclination angles for each logarithm of viscosity ratio; CAF stands for axisymmetric core-annular flow, ECAF stands for eccentric core-annular flow, TSBS stands for transition side-by-side flow, and SBS stands for side-by-side flow; the reddish transparent region indicates that the flow pattern in this region is CAF, and the greenish transparent region indicates that the flow pattern in this region is TSBS. (b) The variation in the ratio of the light fluid width to the pipe width ( δ a ) with the θ for different β . The small figure in the figure illustrates a partially enlarged view of the yellow portion. The yellow part is the change rule of the δ a when the tilt angle is small.
Applsci 14 01573 g005
Figure 6. Variation in heavy fluid flow regimes in the range of three viscosity ratios ( β ), with the yellow fluid being an aqueous solution of falling maltose. (a) Variation in the heavy fluid flow regimes with time at different tilt angles ( θ ) when β = 5.46; this viscosity ratio is in the low viscosity ratio range; the blue fluid is an aqueous 80 wt% glycerol-syrup solution; A1 and A2 are the heavy fluid flow regimes at θ = 0 , t = 20 s, and t = 30 s, respectively; B1 and B2 are the heavy fluid flow regimes in the first and second half of the θ = 15 , t = 20 s, respectively; C1 and C2 are the heavy fluid flow regimes in the first and second half of the θ = 30 , t = 20 s, respectively; D1 is the heavy fluid flow regime at θ = 45 , t = 20 s. (b,c) are the changes in the heavy fluid flow regimes with time for different inclination angles ( θ ) in the range of medium viscosity ratios ( β ); the blue fluid is Dil.syrup. (b) β = 82.67. A3, A4, and A5 are heavy fluid flow states at θ = 0 , t = 2 s, 7 s, and 13 s, respectively, and B3, C3, D2, and E1 are heavy fluid flow states at θ = 15 , 30 , 45 , 60 , t = 2 s, respectively. (c) β = 238.66. A6, A7, and A8 are heavy fluid flow regimes at θ = 0 , t = 2 s, 7 s, and 10 s, respectively, and B4, C4, D3, and E2 are heavy fluid flow regimes at θ = 15 , 30 , 45 , 60 , t = 2 s, respectively. (d) Variation in heavy fluid flow state with time at different tilt angles when β = 467.77, the blue fluid is v.dil.syrup.
Applsci 14 01573 g006
Figure 7. Variation in light fluid velocity (V) with tilt angle ( θ ) for β = [5.46, 9.3, 82.67, 238.66, 467.77].
Applsci 14 01573 g007
Figure 8. Comparison of experimentally measured and theoretical velocities with θ for different β . The solid line is the change in experimentally measured velocity, and the dashed line is the change in model-predicted velocity; the β are (a) β = 5.46, (b) β = 9.3, (c) β = 82.67, (d) β = 238.66, (e) β = 467.77.
Applsci 14 01573 g008
Table 1. Experimental fluid parameters.
Material ρ (kg/m3) μ (mpa.s)
Syrup1323818.6
80 wt% glycerol-syrup1270150.1
Dil.syrup128588
Dil.syrup1224.39.9
Dil.syrup1174.13.43
v.dil.syrup11001.75
Table 2. The meaning of the symbols that appear in the text and the corresponding units.
NotationHidden MeaningUnit
μ a Viscosity of rising fluid (light fluid).mpa.s
μ d Viscosity of downward flowing fluids (heavy fluids).mpa.s
ρ a Density of light fluids.kg/m3
ρ d Density of heavy fluids.kg/m3
β Viscosity ratio (ratio of high viscosity to low viscosity).
Δ ρ Density difference (high density minus low density).kg/m3
δ a The ratio of the width of the light fluid to the diameter of the pipe.
δ d Ratio of minimum width of heavy fluid to pipe diameter.
F a Inertial force on a light fluid.
F d Inertial force on heavy fluid.
F a f Axial inertia forces on light fluids.
F a r Radial force on light fluid.
F d f Axial inertia force on heavy fluid.
F d r Radial force on heavy fluid.
f a Viscous resistance to light fluids.
f d Viscous resistance to heavy fluids.
uExperimentally measured rate of ascent of a light fluid.m/s
VRising velocity of light fluid calculated by theoretical model.m/s
QFluid flow.m3/s
Table 3. Summary of experimental data and results. Viscosity ratio ( β ); density difference between the two fluids ( Δ ρ ) (density of heavy fluid minus density of light fluid); angle of inclination of the pipe ( θ ); ratio of width of ascending fluid to diameter of the pipe ( δ a ) (we took measurements at three different locations of the rising light fluid and averaged them); ratio of minimum width of descending heavy fluid to diameter of the pipe ( δ d ); experimentally measured velocity (u); theoretically modelled velocity (V); fluid flow (Q) (the product of the velocity of a light fluid and its cross-sectional area).
β Δ ρ (kg/m3) θ (°) δ a δ d u (m/s)V (m/s)Q (m3/s)
5.435300.59 0.00390.0030.0052
50.66 0.004370.00190.0072
70.67 0.004670.00170.0080
150.61 0.005330.00260.0075
300.49 0.005760.003870.0053
450.47 0.006360.00330.0053
600.45 0.004730.002420.0036
9.33800.58 0.00320.002870.0041
50.67 0.00330.001480.0056
80.68 0.00360.001350.0063
150.62 0.00360.00210.0053
300.5 0.00430.003630.0041
450.48 0.00480.00320.0042
600.45 0.00390.00240.003
82.6798.700.6100.00920.009030.013
50.6600.00940.00560.016
120.6500.0110.0060.018
150.6400.0120.006580.019
300.5600.0210.0120.025
450.5100.01390.014520.014
600.4900.0110.011860.01
238.66148.900.600.0140.01560.019
50.6700.0150.007770.026
150.6400.01860.010260.029
300.5700.0250.01350.034
450.540.0050.020.018720.022
600.530.140.0190.01440.020
467.7722300.62 0.01940.019560.028
50.67 0.02230.011720.038
150.62 0.0230.018890.034
160.6 0.0250.022740.034
300.575 0.0380.02690.047
450.55 0.0260.02620.03
600.5 0.0250.028290.024
Disclaimer/Publisher’s Note: The statements, opinions and data contained in all publications are solely those of the individual author(s) and contributor(s) and not of MDPI and/or the editor(s). MDPI and/or the editor(s) disclaim responsibility for any injury to people or property resulting from any ideas, methods, instructions or products referred to in the content.