Abstract
The aim of this study was to characterize a Zn-Mg type soldering alloy and direct soldering of SiC ceramics with a copper substrate. The Zn1.5Mg solder exerts a wider melting interval. The temperature of the eutectic reaction was 365 °C, and the liquidus temperature was 405 °C. The microstructure of the soldering alloy is comprised of a zinc matrix. Segregation of binary eutectics in the form of (Zn) + Mg2Zn11 lamellas occurred on the boundaries of Zn grains. Additionally, the presence of a MgZn2 magnesium phase was observed in the solder matrix. The SiC/solder bond was formed due to magnesium distribution from solder to the boundary with SiC ceramics, where magnesium reacts with silicon, which is infiltered in SiC ceramics. By a mutual interaction, a new Mg2Si phase is formed. An interaction between the molten zinc solder and Cu substrate occurred on the boundary of the Cu/substrate joint at the formation of a transition zone composed of two new phases, namely the γCu (Cu5Zn8) non-wettable phase type, approximately 30 µm wide, and a wettable (CuZn4) phase type ε, approximately 12 µm wide. The average shear strength of a combined SiC/Cu joint fabricated using Zn1.5Mg solder was 44 MPa.
1. Introduction
Since the ban on using lead for soldering alloys, owing to its toxicity [1,2,3,4,5], immense research and development of new lead-free soldering alloys is in progress. This R&D is primarily oriented to the study of properties such as excellent wettability, thermal and electrical conductivity, corrosion resistance, and, last but not least, a favorable price. In recent years, mainly high-temperature, lead-free soldering alloys, based, for example, on Au-Sn, Zn-Al, or Zn-Sn [6,7,8,9], have been developed.
The Sn-based lead-free alloys with very low melting temperatures are typical. At present, these solders are usually employed in the electronic industry as a connecting material in soldering printed circuit boards [10,11]. However, due to their melting point, which is lower than 250 °C, they cannot meet the high demands for the applications in electronic power devices employed at elevated temperatures. Therefore, this fact requires further research on soldering alloys, such as Zn–based alloys that are capable of meeting the mentioned requirements [12,13].
The authors of the study [14] were successful in joining SiC ceramics by application of ultrasonic soldering technology. Two types of Zn–based solders were applied––namely, the non-eutectic alloy type Zn5Al3Cu and the eutectic alloy type Zn5Al. The specimens were heated at the temperature of 420 °C, followed by ultrasound assistance with a frequency of 20 kHz, 300 W power, and with acting times from 5 to 20 s. The authors studied the effect of ultrasound on the mechanical properties of soldered joints. The shear strength of Zn5Al soldered joints was 102 MPa with ultrasound acting for 5 s. At a prolonged time of ultrasound assistance, up to 20 s, the shear strength of 138 MPa was achieved. In the case of joints fabricated using Zn5Al3Cu solder and ultrasound acting for 5 s, the shear strength attained was 139 MPa, which approaches the maximum shear strength of a joint fabricated using Zn5Al solder. Thus, Cu addition resulted in improved shear strength. Additionally, the shear strength remained relatively constant with ultrasound assistance for 20 s.
The authors of the study [15] studied the microstructural and mechanical properties of soldered joints formed of a SiC substrate and Zn-Al-Mg type solder fabricated by ultrasonic soldering technology at 420 °C. From the measurements of DTA analysis, it follows that TS and TL temperatures occur within the range of 371.5 °C to 394.5 °C. The highest measured shear strength of a joint reached 148 MPa in the case of ultrasound assistance for 8 s. The formation of a 2 to 6 nm thick amorphous phase was observed on the substrate/solder boundary.
In the study [16], a Zn–based soldering alloy was studied. It was developed for ultra-high temperature applications, with alloying elements such as Al (4–6) wt. % and Cu (1–5) wt. %. That solder was designed in such a manner that it would exert the liquidus temperature within 655–675 K. The presence of Al in the solder improved the solder’s spreadability and its electric resistance. The content of selected alloying elements increased the hardness and tensile strength of the solder.
The study [17] dealt with Zn-Sb-based binary alloys destined for higher application temperatures. The alloy with a eutectic composition of Zn with 1.7 wt. % Sb exerted better mechanical properties. By increasing the Sb content to 2.2 wt. %, the alloy provided the highest tensile strength. The EDX and XRD analyses proved the presence of Zn and Zn4Sb3 phases in Zn-xSb alloys. Increasing the Sb content in the solder also increases electric resistance. The experimental results suggest that this solder could be a prospective alternative to Pb-containing solders.
Research on soldering ceramic or metallic materials using Zn-based solders is actively underway. Xiao et al. [18,19] carried out experiments employing Zn–3Al solder with ultrasound assistance to bond Cu with Cu or Cu with Al. They asserted that Zn–5Al solder is a more suitable option for soldering SiC ceramics due to its lower melting point (381 °C). However, the substantial presence of fragile Zn-Al eutectics unavoidably compromises the mechanical properties of the joints. Consequently, microstructure optimization becomes imperative via alloy structure design or by refining the soldering process.
Addressing this need, W.B. Guo et al. [20] conducted work that demonstrated the addition of Cu to Zn-Al solder facilitates structural modification by eliminating the brittle eutectic Zn-Al phase. This modification results in an enhancement of the mechanical properties of the joints. In summary, the research underscores the significance of optimizing the microstructure of Zn-based solder to ameliorate the mechanical properties of soldered joints, particularly in the context of SiC ceramics.
The study [21] dealt with the characterization of Zn-Mg-Sr-based soldering alloy and the soldering of ceramic SiC with Cu-SiC composite material using ultrasonic soldering. A reaction occurred as the liquid zinc solder interacted with the copper matrix of the composite substrate, leading to the formation of a new phase, γCu (Cu5Zn8). Shear strength measurements were conducted on various ceramic materials. The average shear strength of the SiC/Cu-SiC joint, produced with Zn3Mg1.5Sr solder, was determined to be 62 MPa. Soldering similar ceramic materials together resulted in a shear strength reaching approximately 100 MPa.
This work is aimed at studying Zn-Mg-based soldering alloys. The work is oriented mainly to a structural study of solder and fabrication of soldered joints from the combination of metallic (Cu) and non-metallic (SiC) materials. The solder characterization was performed by measuring the concentration of elements, such as ICP AES, DTA analysis of soldering alloy, and microstructural SEM/EDX analysis. Regarding the possibility of the practical application of this solder, the fabricated SiC/Cu joints were also analyzed from the viewpoint of shear strength, and the tests were extended to other ceramic substrates.
2. Materials and Methods
Once the weight ratios of the alloy in preparation were established, the individual components were subjected to weighing. Components with elevated purity of 4N were specifically chosen for the production of solder.
The production of solder in its liquid state occurred within an induction oven. The process unfolded in the following manner: The designated mixture was placed into a crucible. Subsequently, Zn was heated to a temperature of 700 °C, leading to its melting and complete fusion. Magnesium was wrapped with tin foil and immersed into the zinc melt. The molten material was poured into a graphite vessel, and this casting process was conducted without the application of a shielding atmosphere. The chemical composition of the soldering alloy, as outlined in Table 1, was experimentally determined. The chemical analysis was carried out using atomic emission spectrometry with induction coupled plasma (ICP-AES).

Table 1.
The formation of Zn-Mg alloy and the chemical analysis results by ICP-AES method [wt. %].
The analysis was performed utilizing the Spectro Vision EOP instrument. Prior to the ICP-AES analysis, the alloy samples underwent dissolution in appropriate chemical solutions composed of bases and acids. The analysis itself occurred on an emission atomic spectrometer featuring a pneumatic atomizer and sputtering chamber.
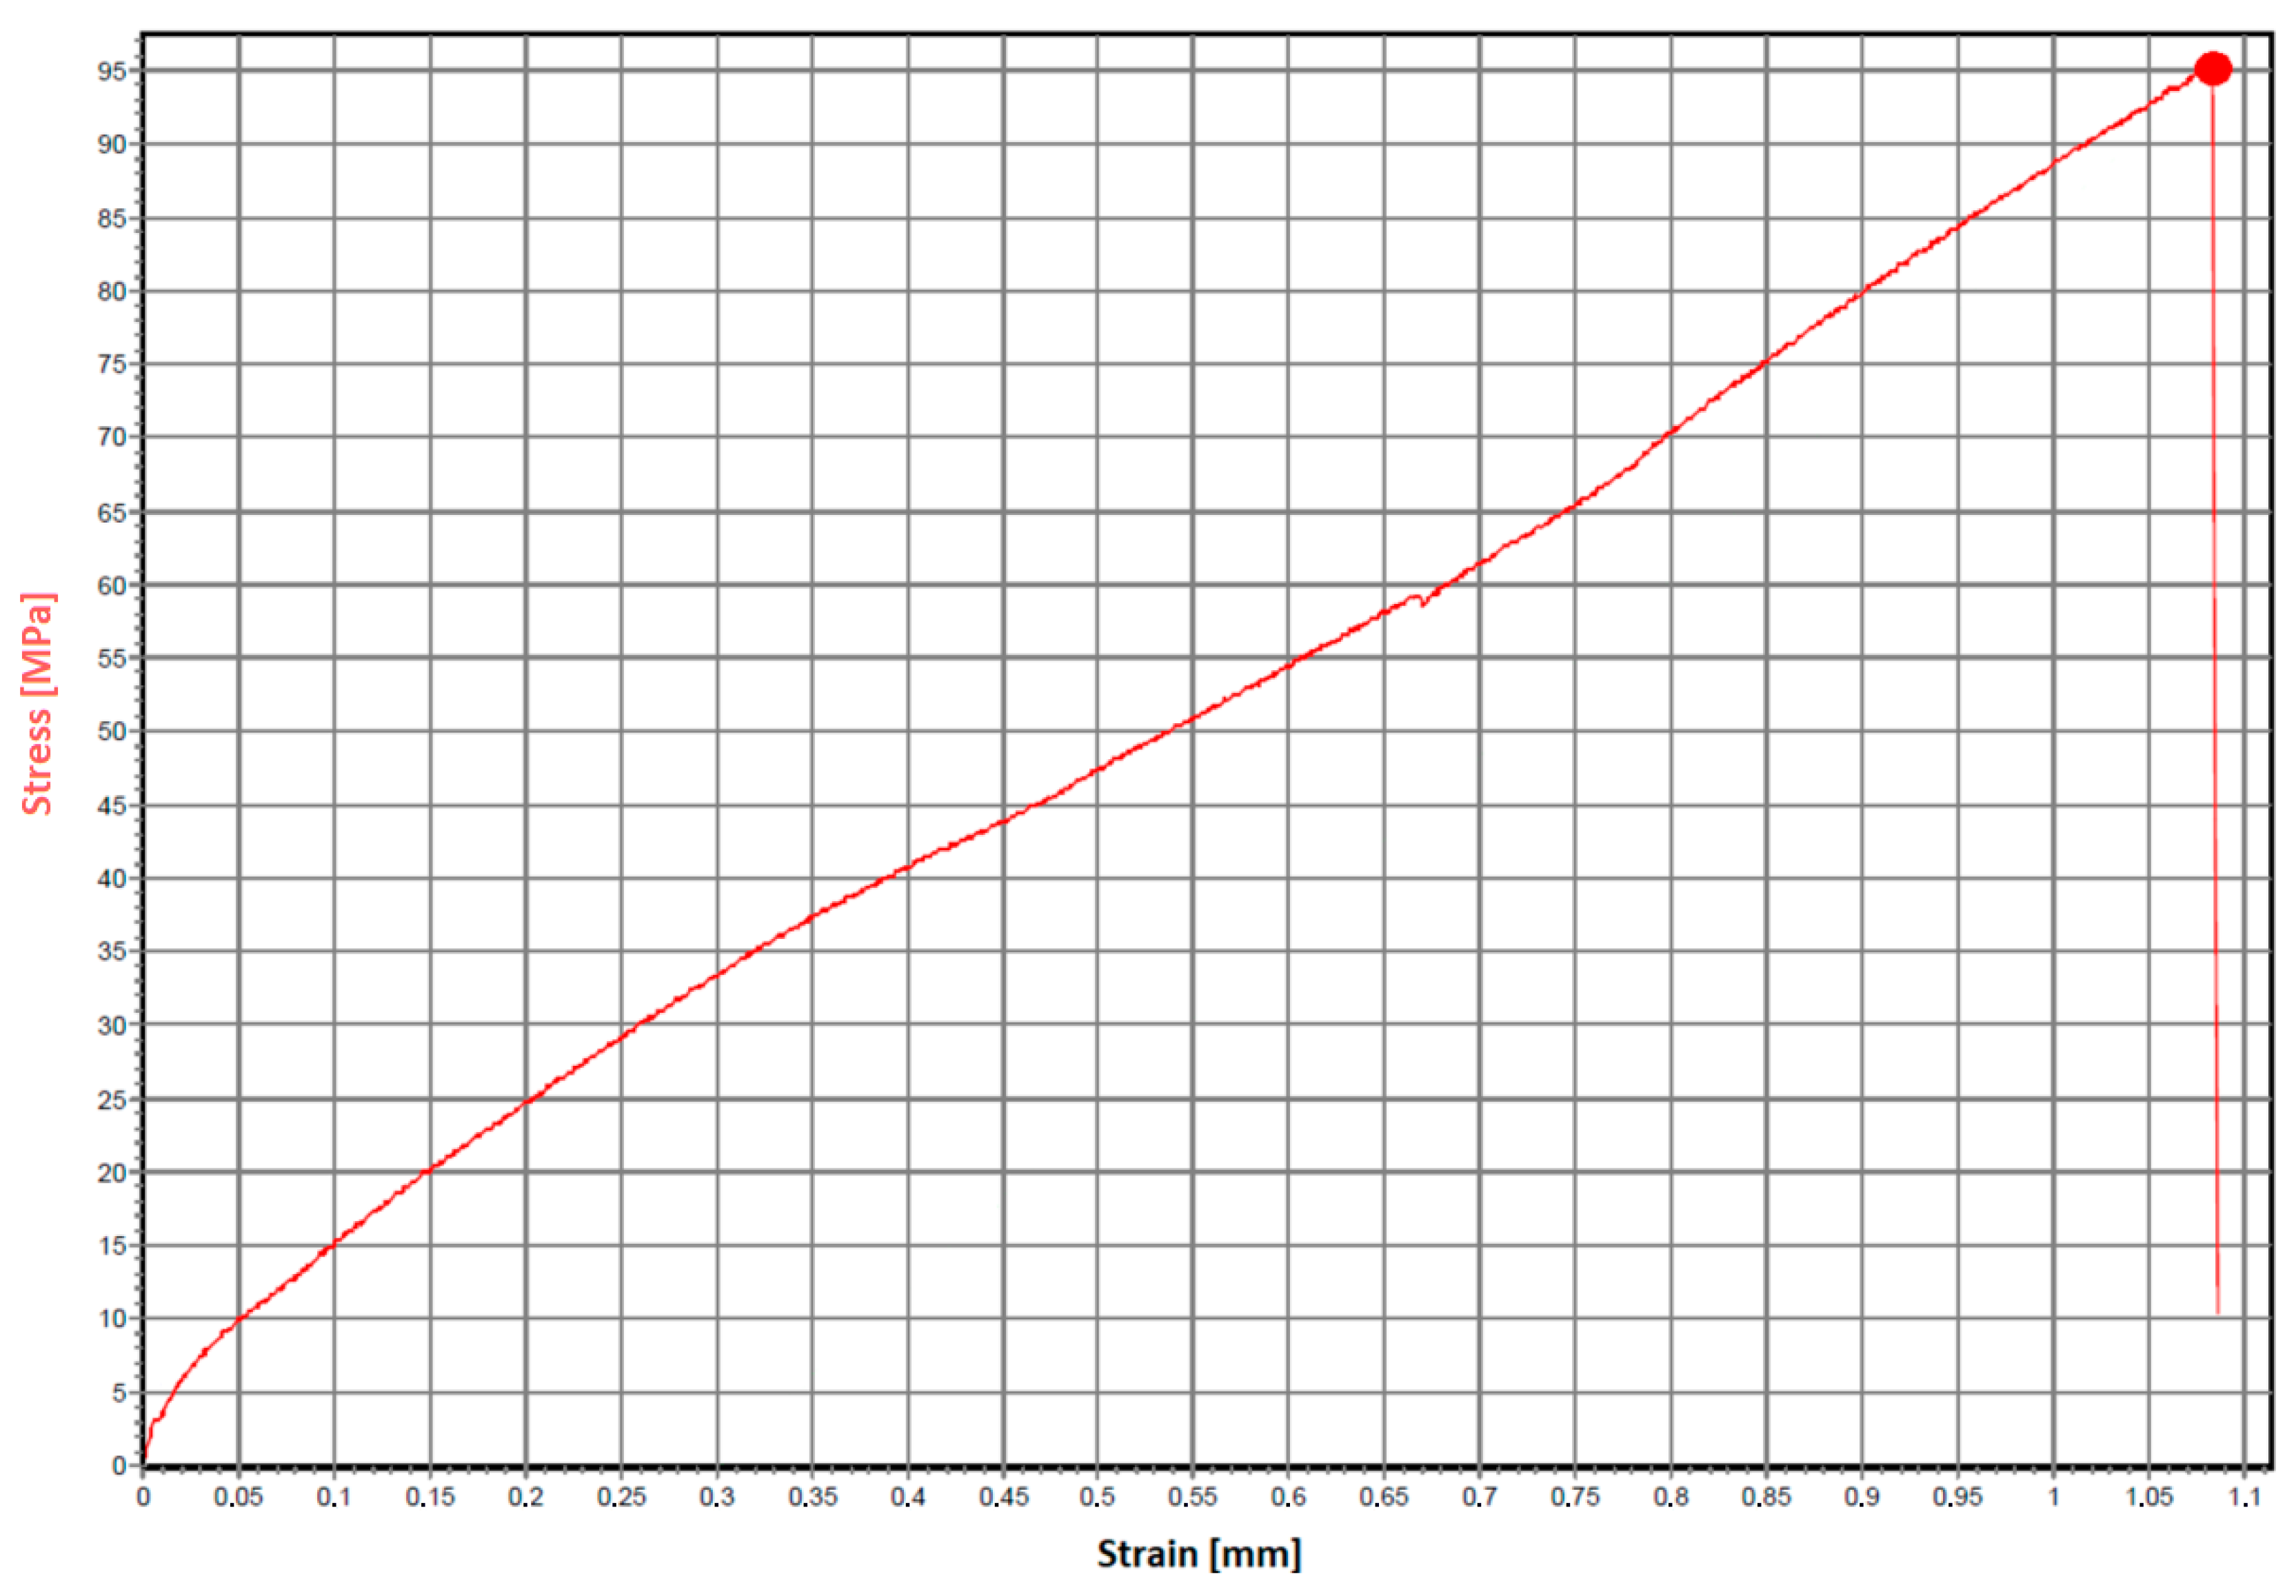
A specimen intended for the tensile test was precisely machined from the soldering alloy, as illustrated in Figure 1. The dimensions of the test piece in millimeters are shown in the same figure. The resulting tensile strength of the solder test specimen was 95 MPa, shown in Figure 2. From the graph, it can be seen that the yield strength of the solder was approximately 59 MPa.
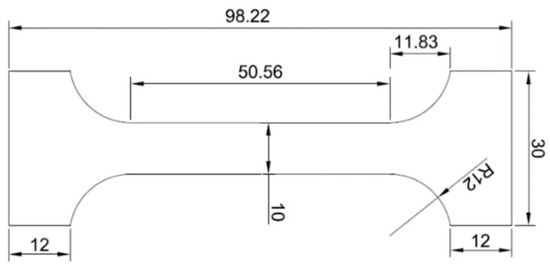
Figure 1.
A solder test specimen designed for tensile strength testing.
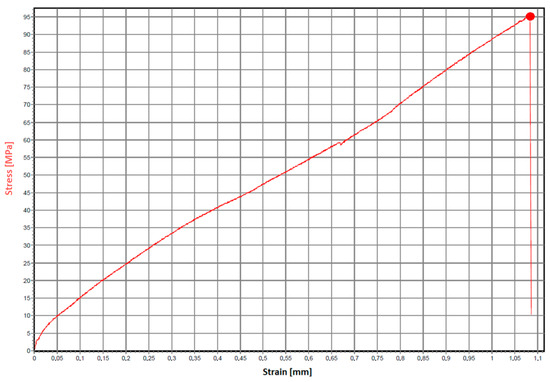
Figure 2.
Tensile strength test of the solder Zn1.5Mg.
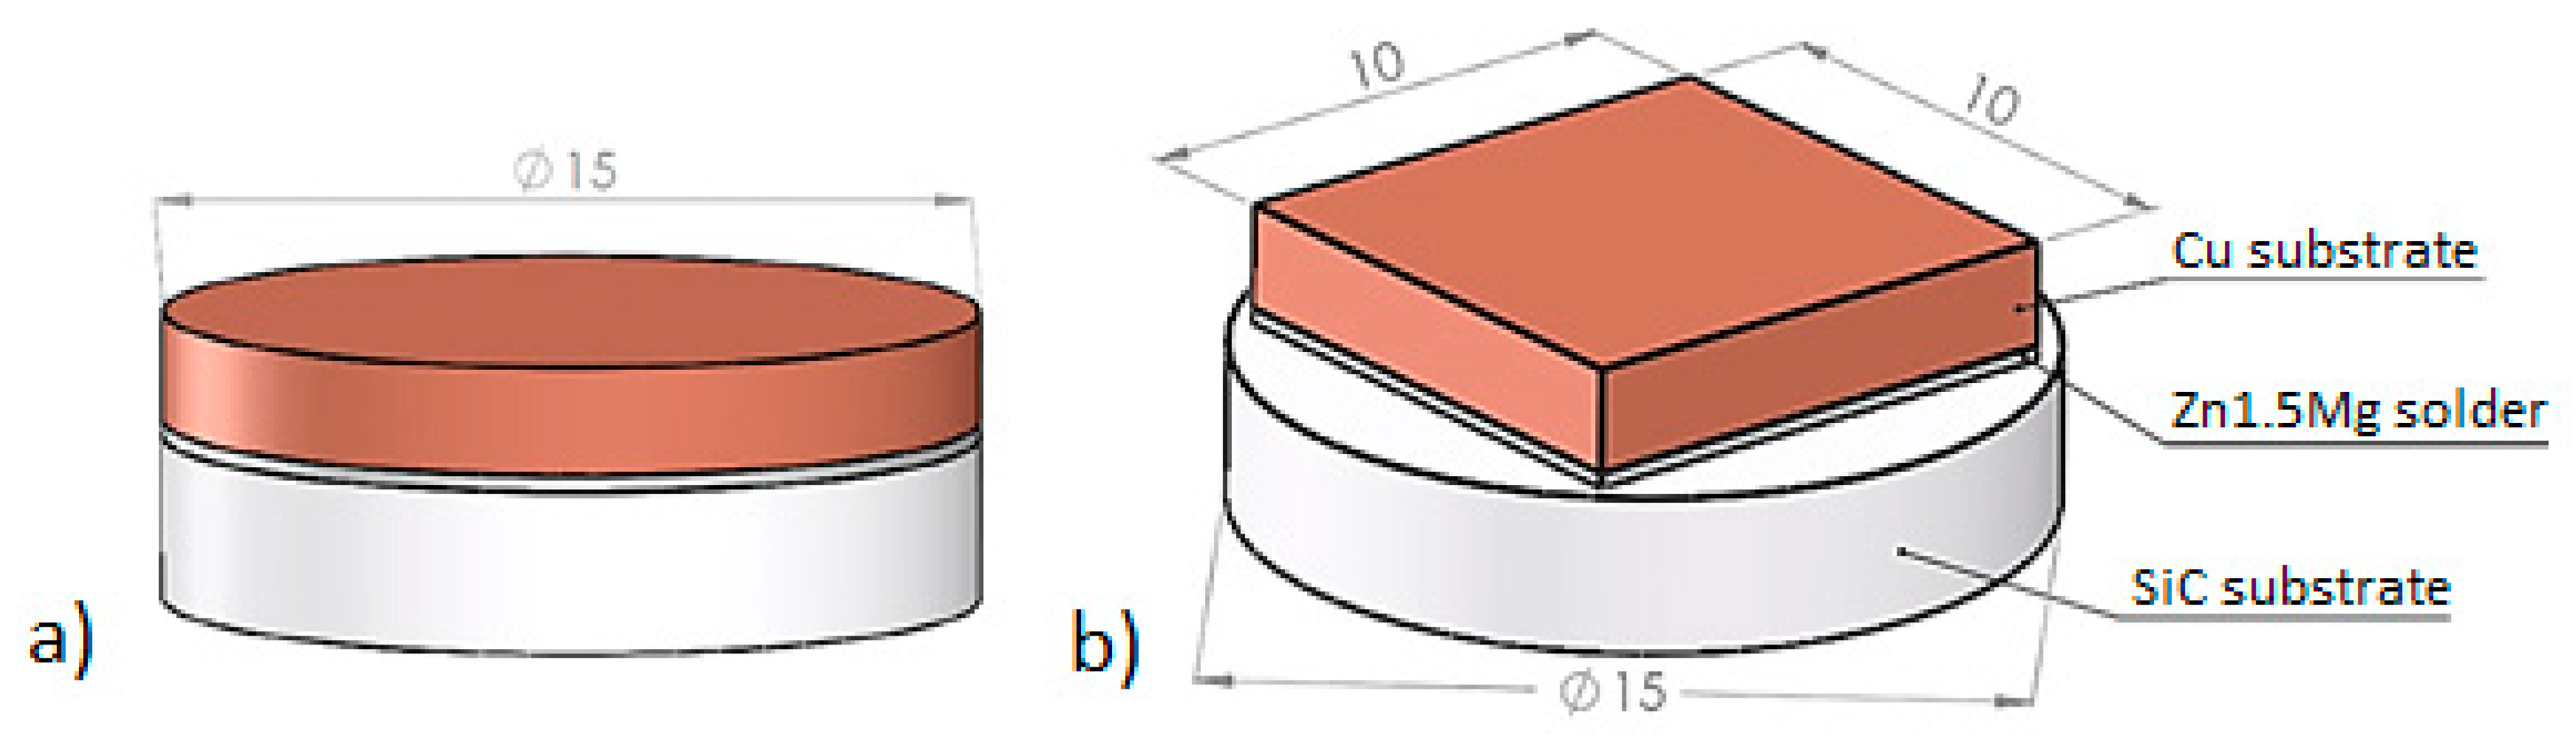
The experiments utilized substrates composed of the subsequent materials:
- Ceramic SiC substrate in the form of discs with dimensions Ø 15 × 3 mm,
- Cu substrate of 4N purity machined into dimensions Ø 15 × 2 mm and 10 × 10 × 2.5 mm.
Figure 3a illustrates the schematic representation of soldered joints created for the purpose of chemical analysis at the solder/substrate interfaces.
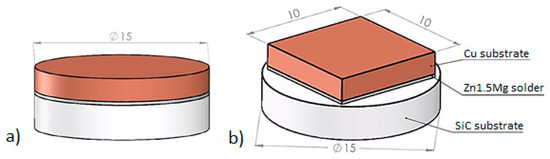
Figure 3.
Assembly of soldered joint (a) for the substrate/solder boundary analysis and (b) for the measurements of shear strength.
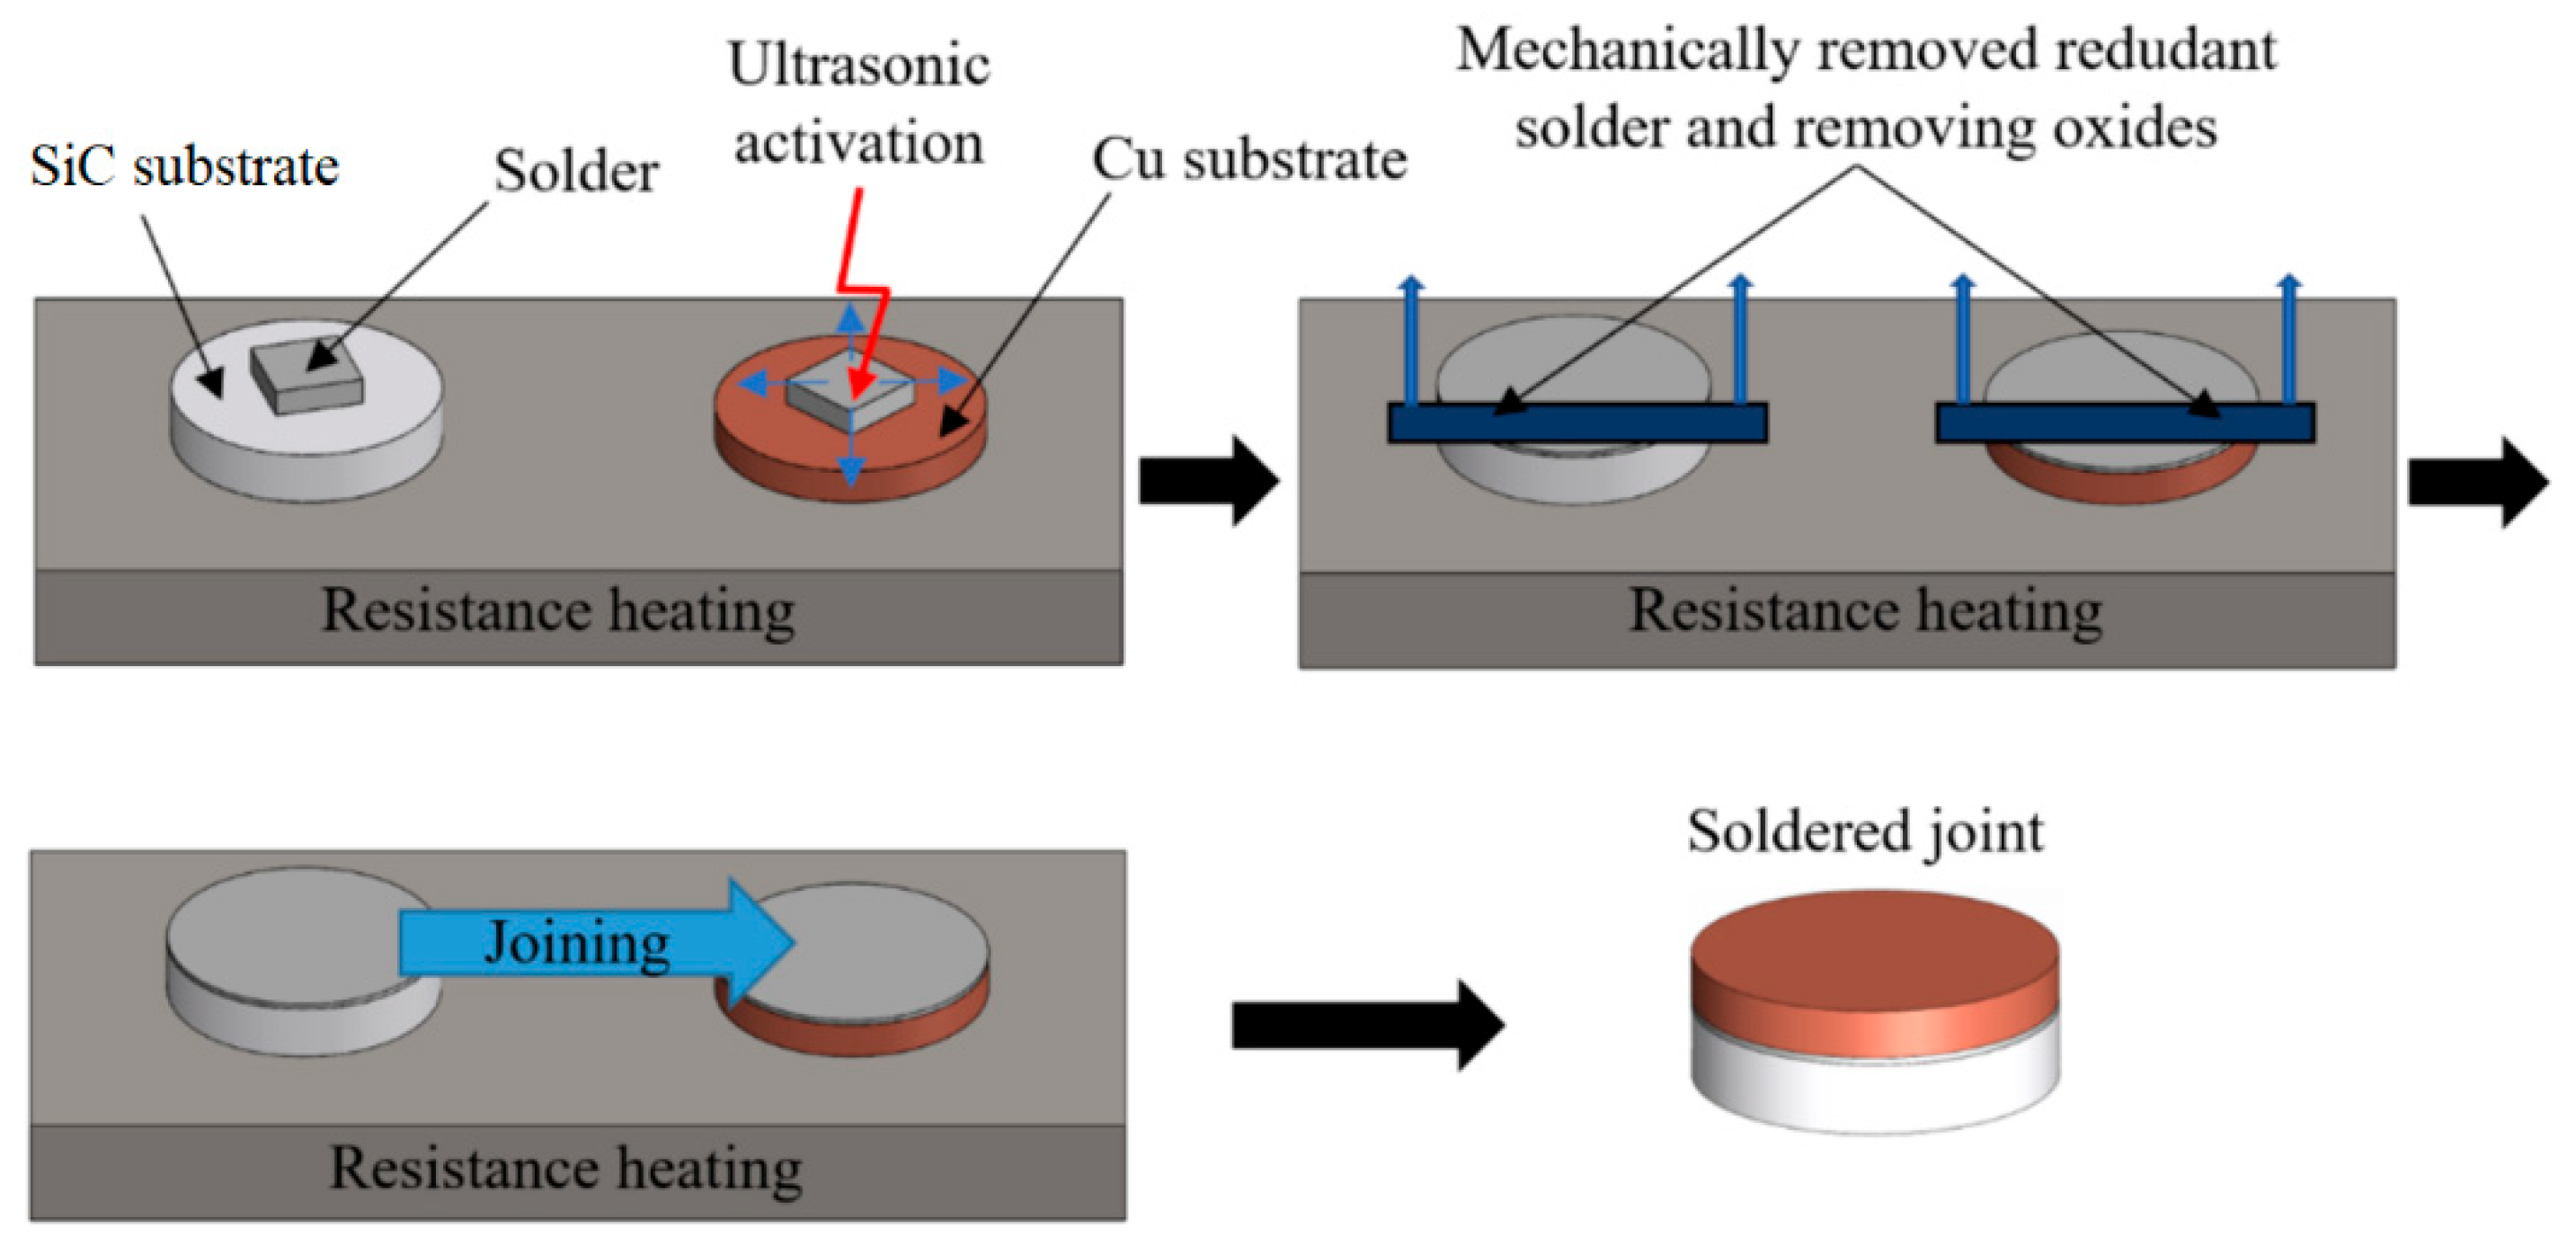
Fabrication of joints involved the use of a thermostatically controlled hot plate. On the hot plate, the SiC substrate was positioned, followed by the application of solder, and then heated to the designated soldering temperature. Soldering was carried out employing ultrasonic equipment, specifically the Hanuz UT2, with parameters detailed in Table 2. Activation of the solder was achieved using an enclosed ultrasonic transducer consisting of a piezo-electric oscillating system and a sonotrode made out of titanium with Ø 3 mm end tip. The soldering temperature, set at 380 °C, was consistently monitored using a NiCr/NiSi thermocouple on the hot plate. The ultrasonic power was applied for a duration of 5 s. The soldering process was conducted without the use of flux. Using ultrasonic activation, any surplus oxide layer on the solder surface was removed. A similar procedure was undertaken with the second substrate. Substrates, each bearing molten solder, were then aligned and combined to form the joint. The procedural representation is illustrated in Figure 4.
Table 2.
Soldering specifications.

Figure 4.
Illustration outlining the soldering process with the aid of ultrasound.
The metallographic preparation of samples from soldered joints adhered to standard procedures commonly employed for specimen processing. Grinding stages involved the utilization of silicon carbide (SiC) emery papers with granularities of 240, 320, and 1200 grains per square centimeter. Subsequent polishing steps employed diamond suspensions with grain sizes of 9 μm, 6 μm, and 3 μm. A final polish was executed using OP-S Struers (Struers, Paris, France) polishing emulsion with a granularity of 0.2 μm.
To examine the microstructure of the solder, scanning electron microscopy (SEM) was conducted on TESCAN VEGA 3 (Tescan Group Ltd., Brno, Czech Republic) and JEOL 7600 F microscopes (JEOL Ltd., Tokyo, Japan), equipped with an X-ray micro-analyzer (Microspec WDX-3PC, Microspec Corp., Fremont, CA, USA) for both qualitative and semi-quantitative chemical analyses. The solder’s phase composition was determined using X-ray diffraction analysis, carried out on specimens measuring 10 × 10 mm using a PANalytical X’Pert PRO XRD diffractometer (Malvern Panalytical Ltd., Malvern, UK).
Thermal analysis (TG/DTA) of Zn1.5Mg solder was conducted using the DTA SETARAM Setsys 18TM equipment (KEP Technologies Inc., Austin, TX, USA). The measurement system consisted of a cylindrical oven featuring a graphite heating element, a control thermocouple, a measuring bar, and a cooling medium. Both measured and reference specimens were positioned in Al2O3 crucibles, freely placed on the measuring bar, and in contact with two thermocouples, monitoring the temperature difference between the tested and reference samples. Prior to each analysis, the inner space underwent a 15-min wash with argon (6N purity), followed by vacuuming and replenishing with argon. Throughout the analysis, a constant dynamic atmosphere in the oven was maintained, with an argon flow rate of 2 L/h. Temperatures were recorded as the specimen was heated at a rate of 4 °C/min from room temperature to complete fusion. These temperatures were documented and analyzed using the SETSOFT program. Phase transformation temperatures within the liquidus–solidus range and in the solid state were determined from the evaluated DTA curves. Enthalpies of phase transformation were also derived from the areas under significant peaks.
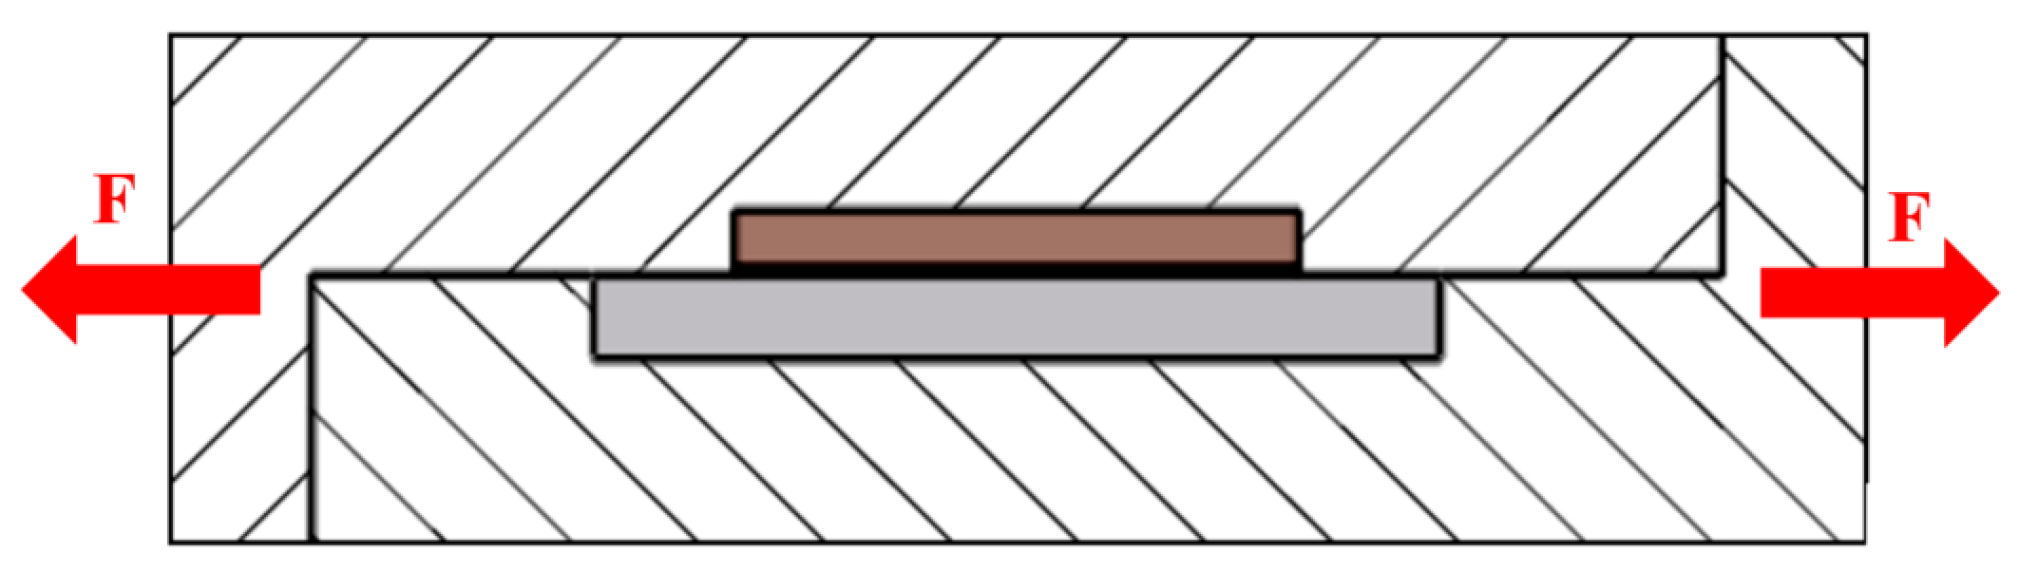
For the assessment of mechanical properties in soldered joints, a shear strength test was conducted. A schematic representation of the test specimen is depicted in Figure 3b. The shear strength was measured using versatile equipment type 5.250SP1-VM (Labortech Ltd., Opava, Czech Republic). A specially designed jig with the defined shape of the test piece was employed to alter the direction of the axial loading force on the test specimen (Figure 5). The shearing jig ensured uniform specimen loading for shear in the plane of the substrate/solder boundary.
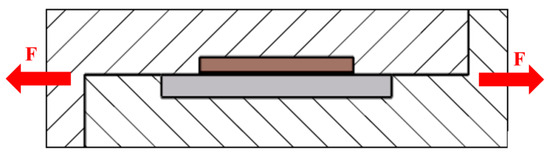
Figure 5.
Scheme of shear strength measurements.
3. Results
3.1. DTA Analysis
Differential scanning calorimetry (DSC) is a thermoanalytical technique in which the difference in the amount of heat required to increase the temperature of a sample and reference is measured as a function of temperature. The main reason for the DTA analysis was to determine the melting interval. The result is the DTA curve, which is actually a heat flux graph.
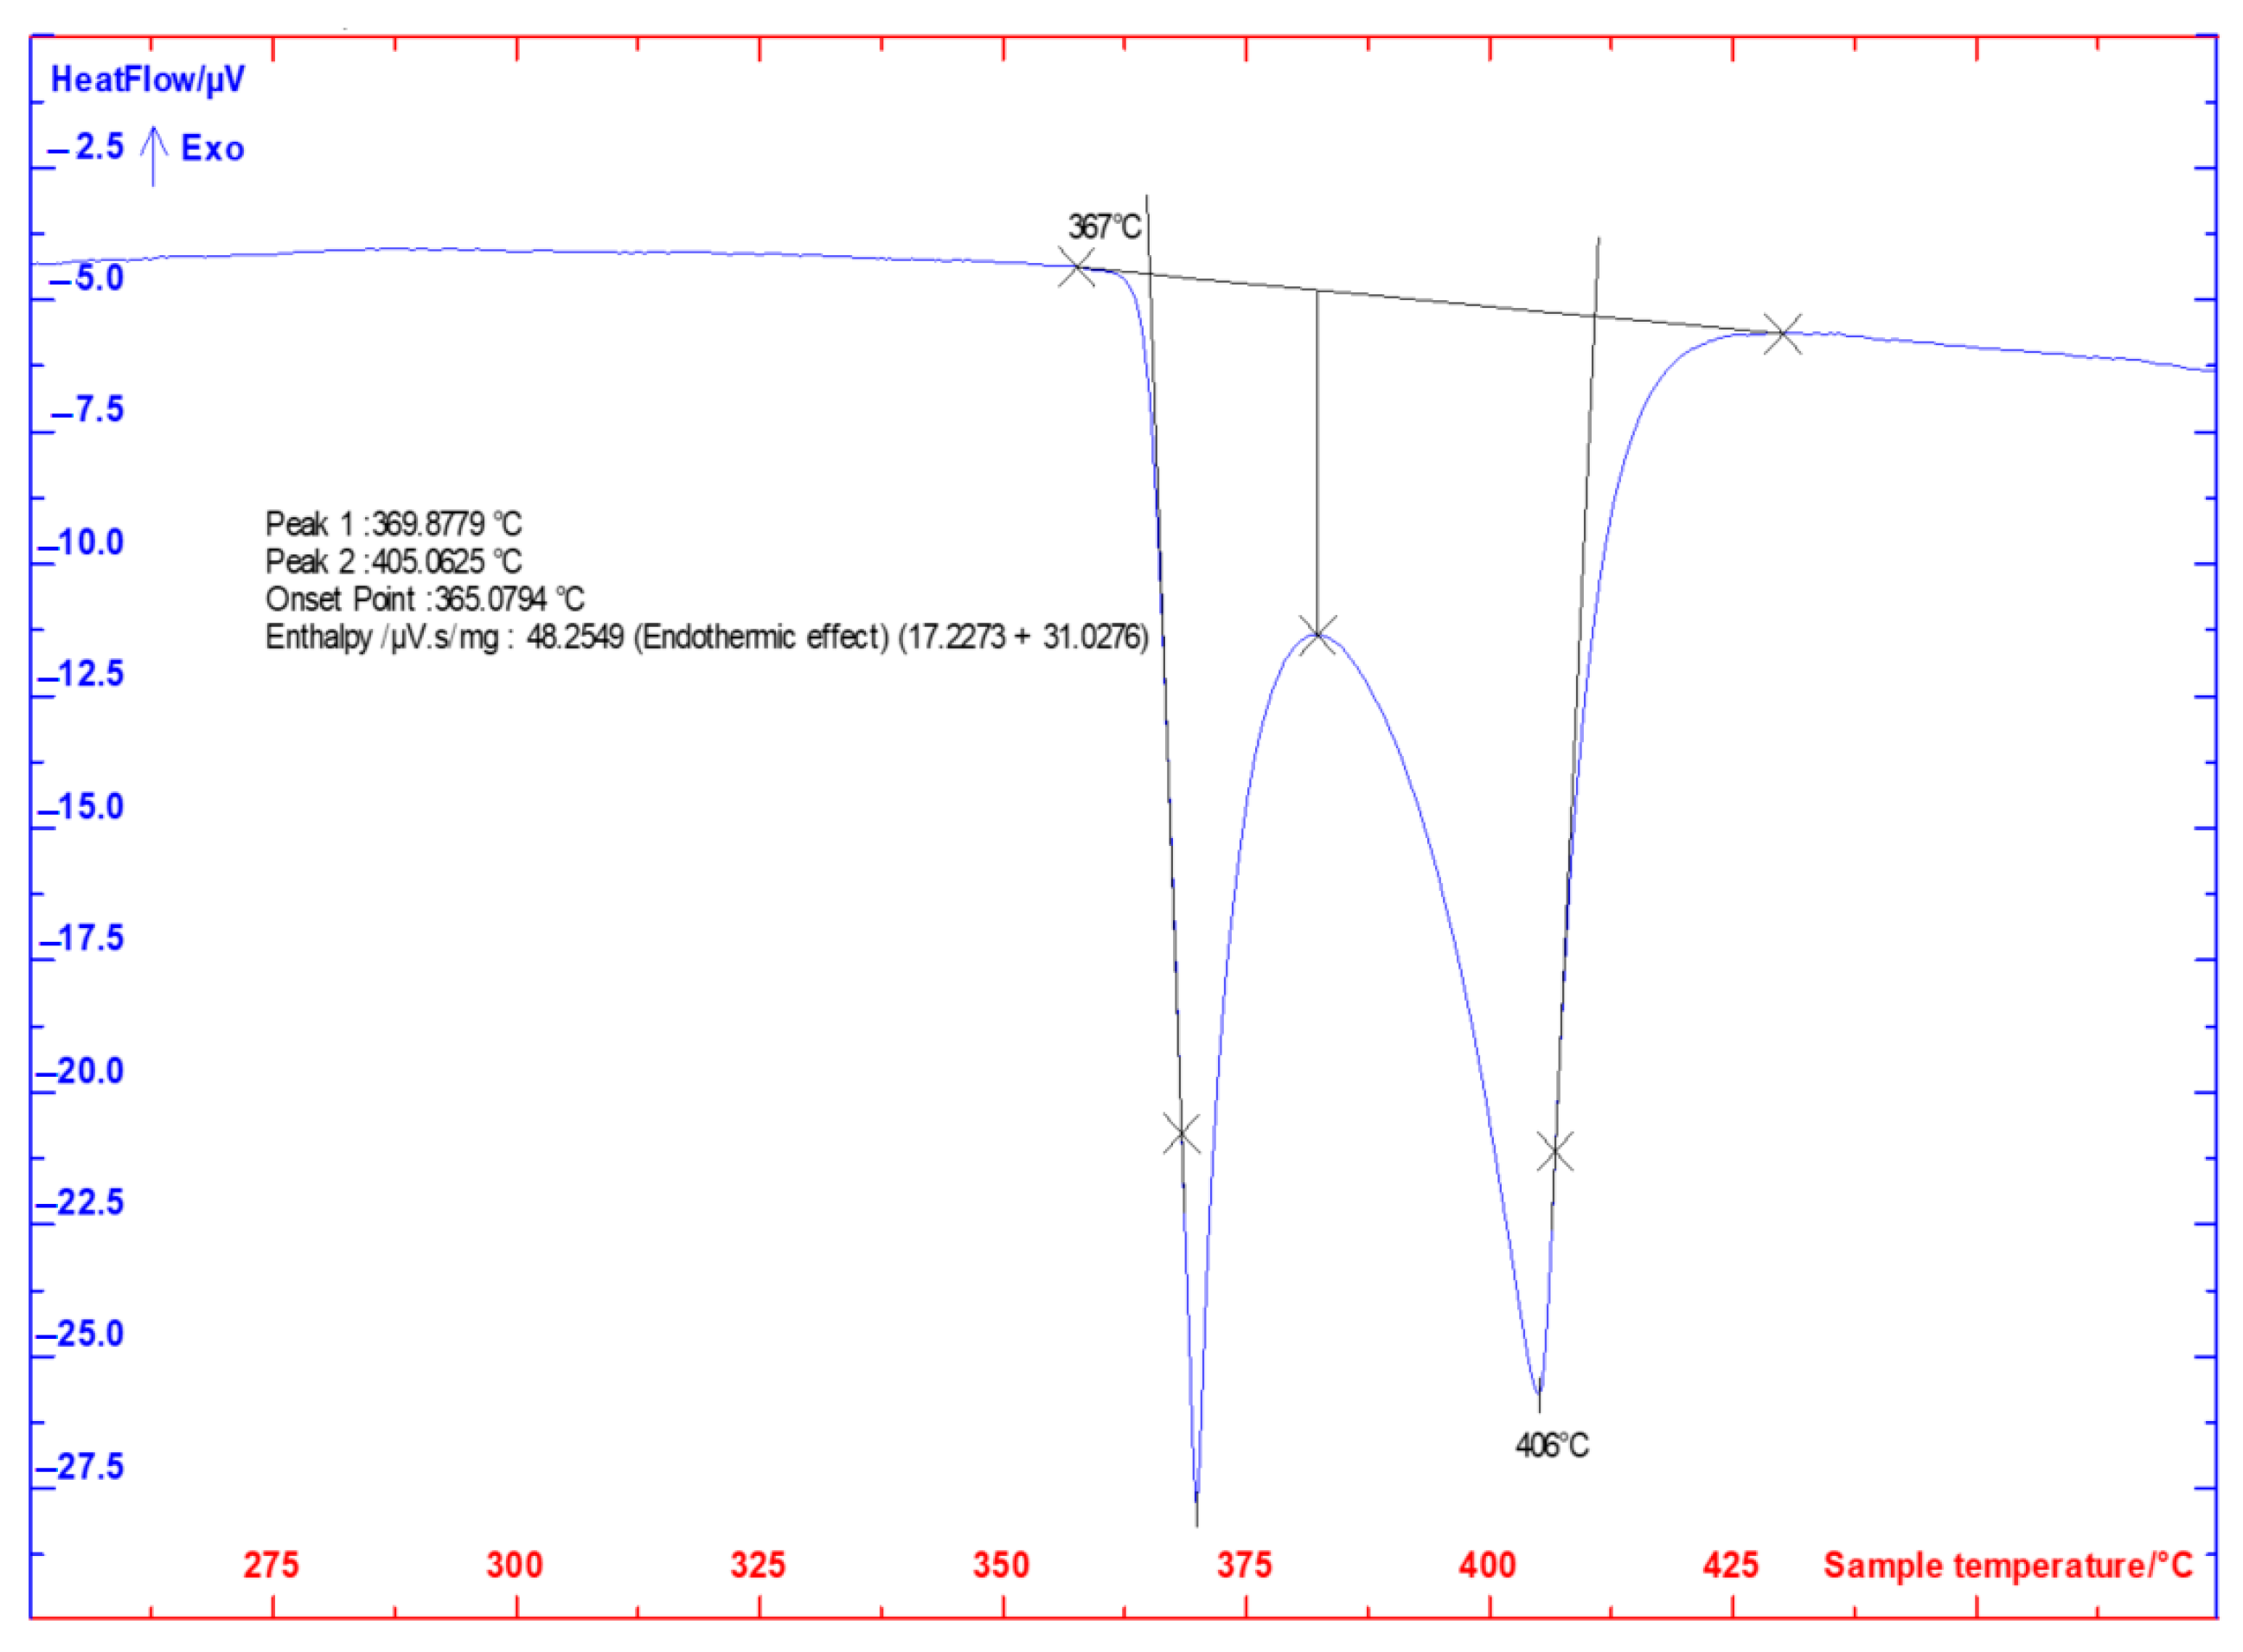
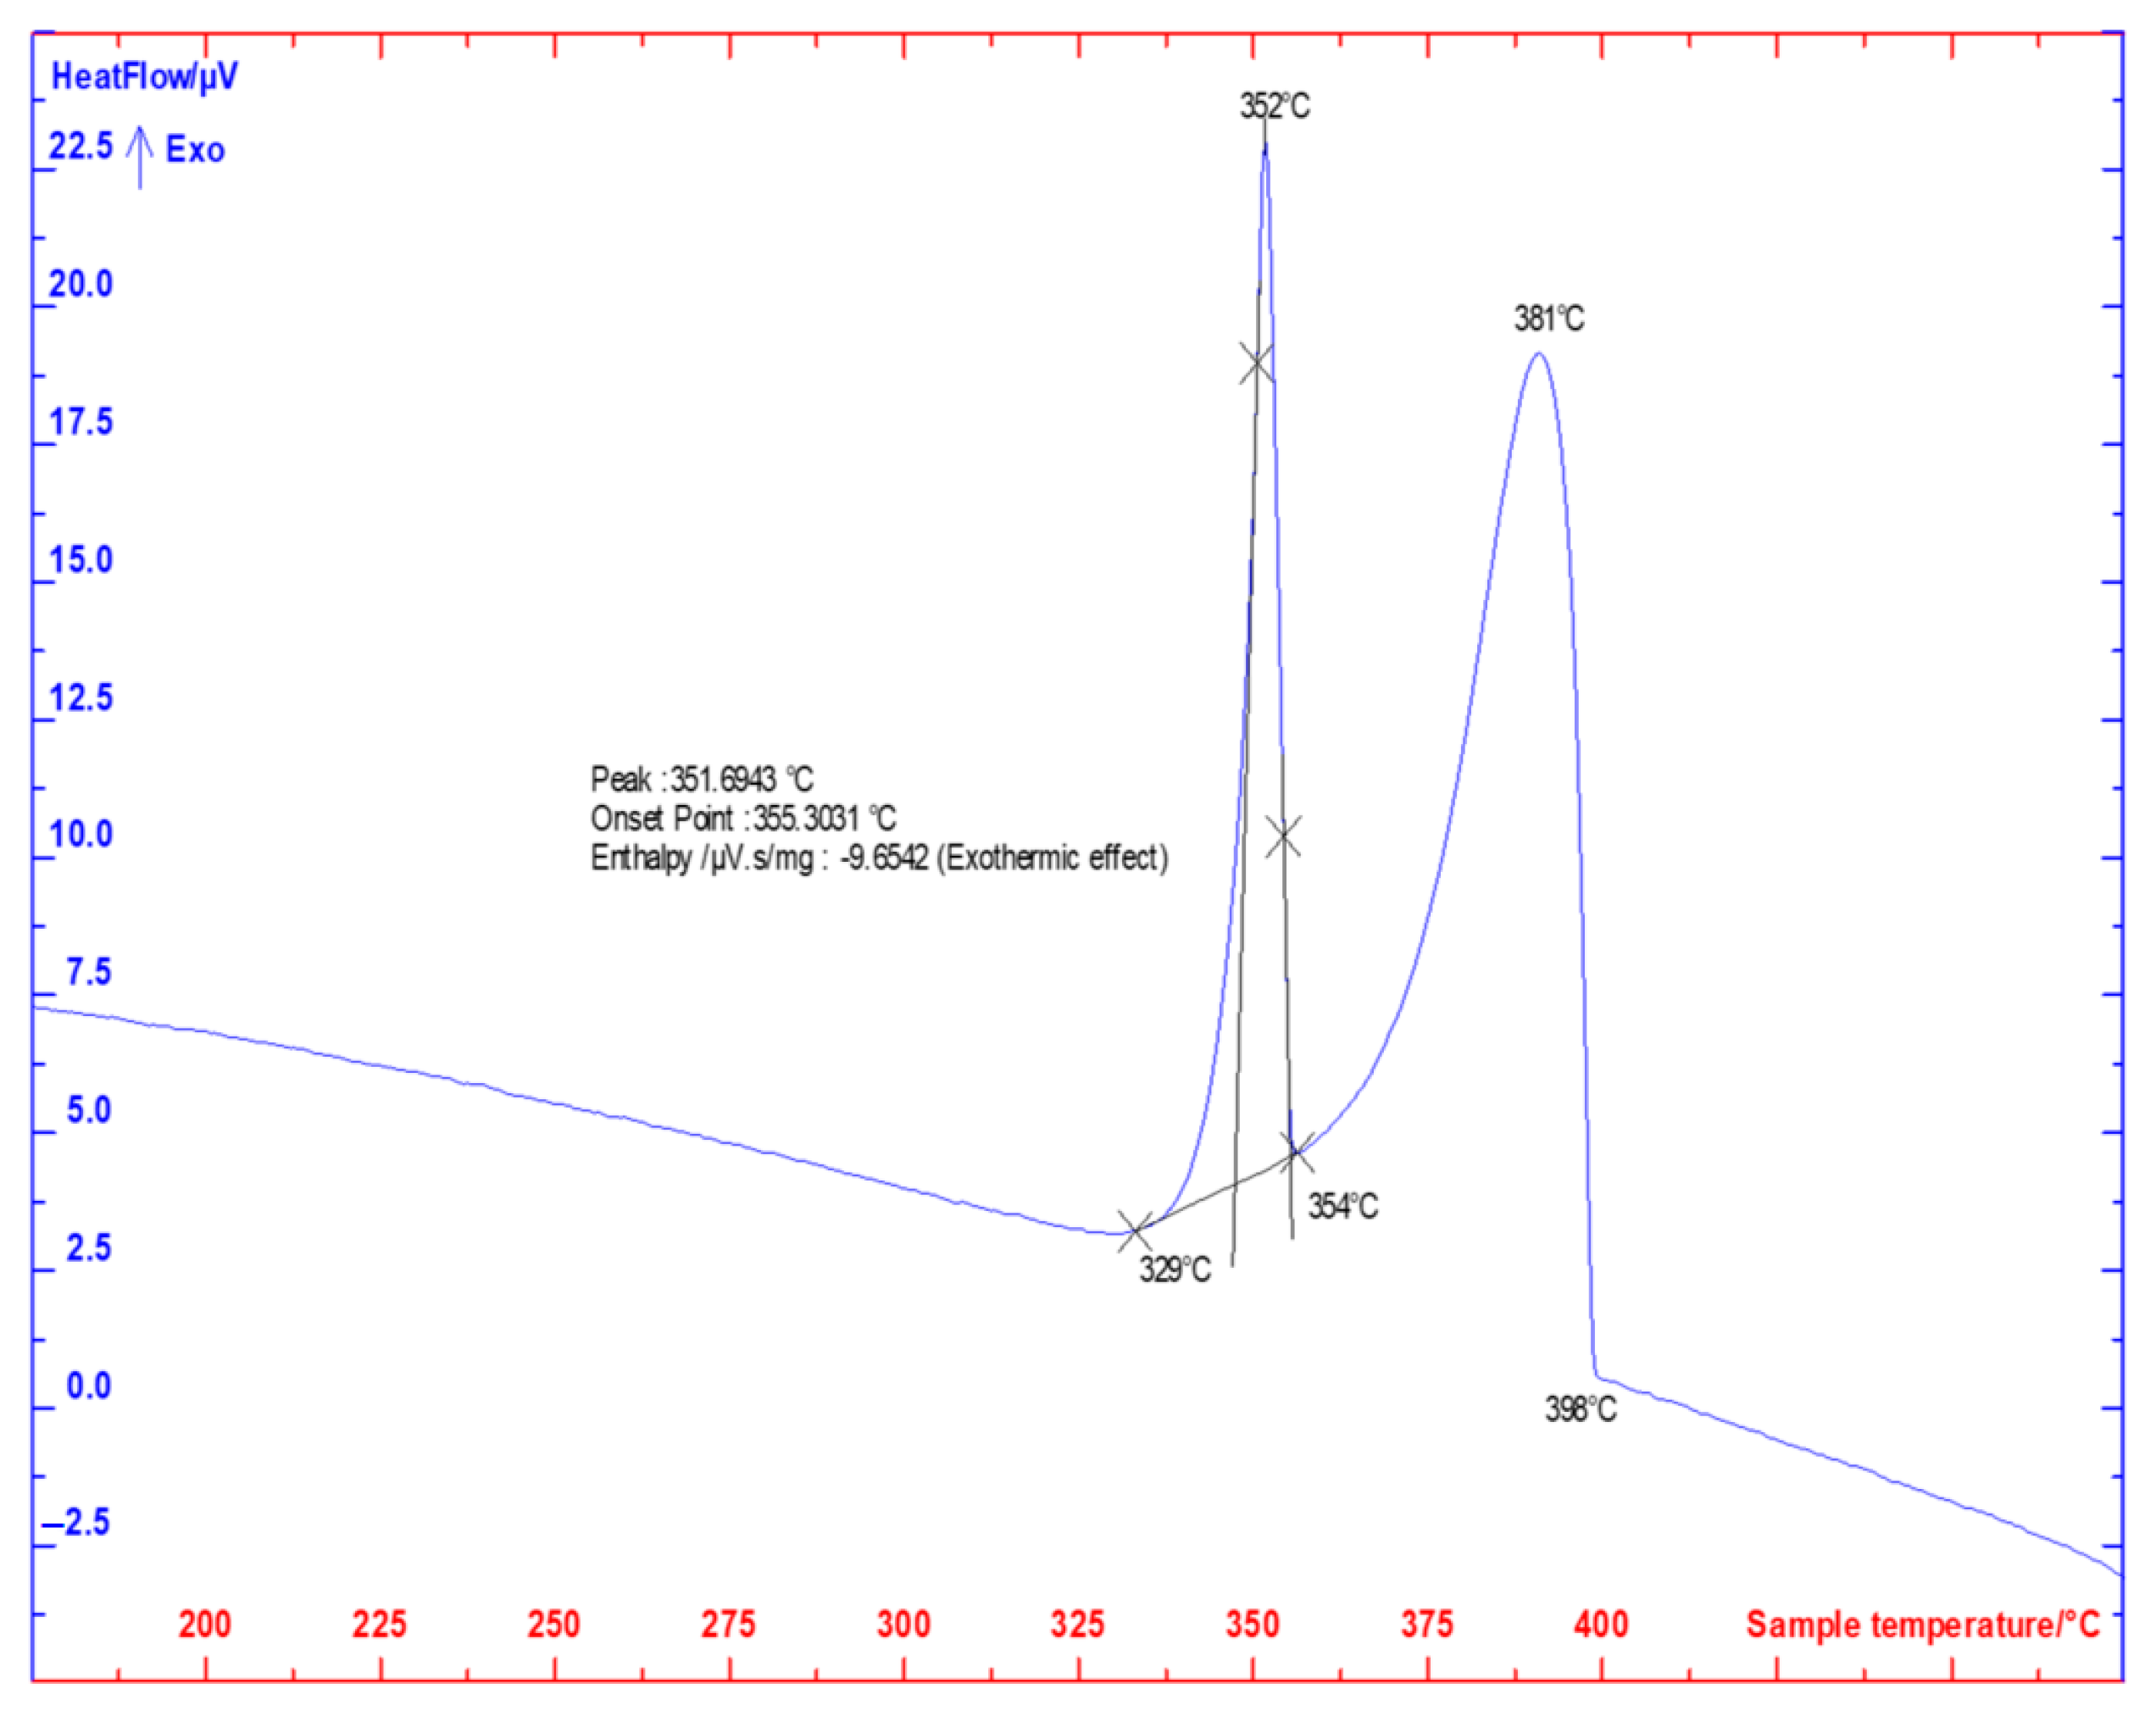
The DTA analysis was conducted on two occasions, employing a heating and cooling rate of 5 °C/min, as illustrated in Figure 6 and Figure 7. The significant temperatures associated with phase transformations in the Zn1.5Mg soldering alloy were established using TG/DTA analysis and are detailed in Table 3.
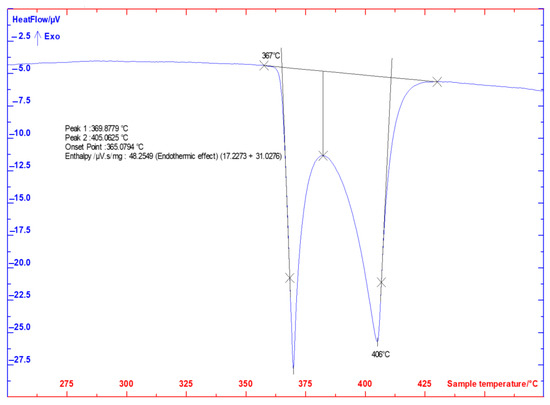
Figure 6.
DTA analysis of Zn1.5Mg solder, heating rate 5 °C/min, first measurement.
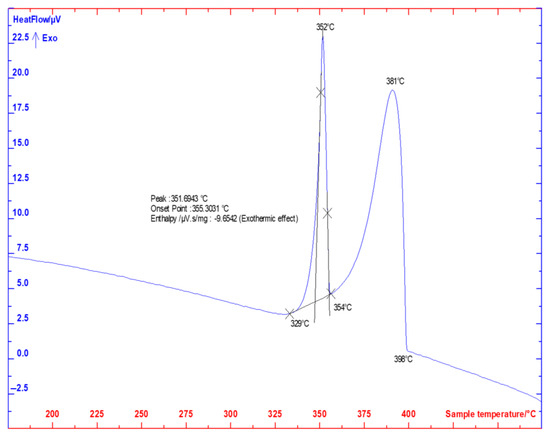
Figure 7.
DTA analysis of Zn1.5Mg solder, cooling rate 5 °C/min, second measurement.
Table 3.
Temperatures of phase transformations determined by DTA analysis.
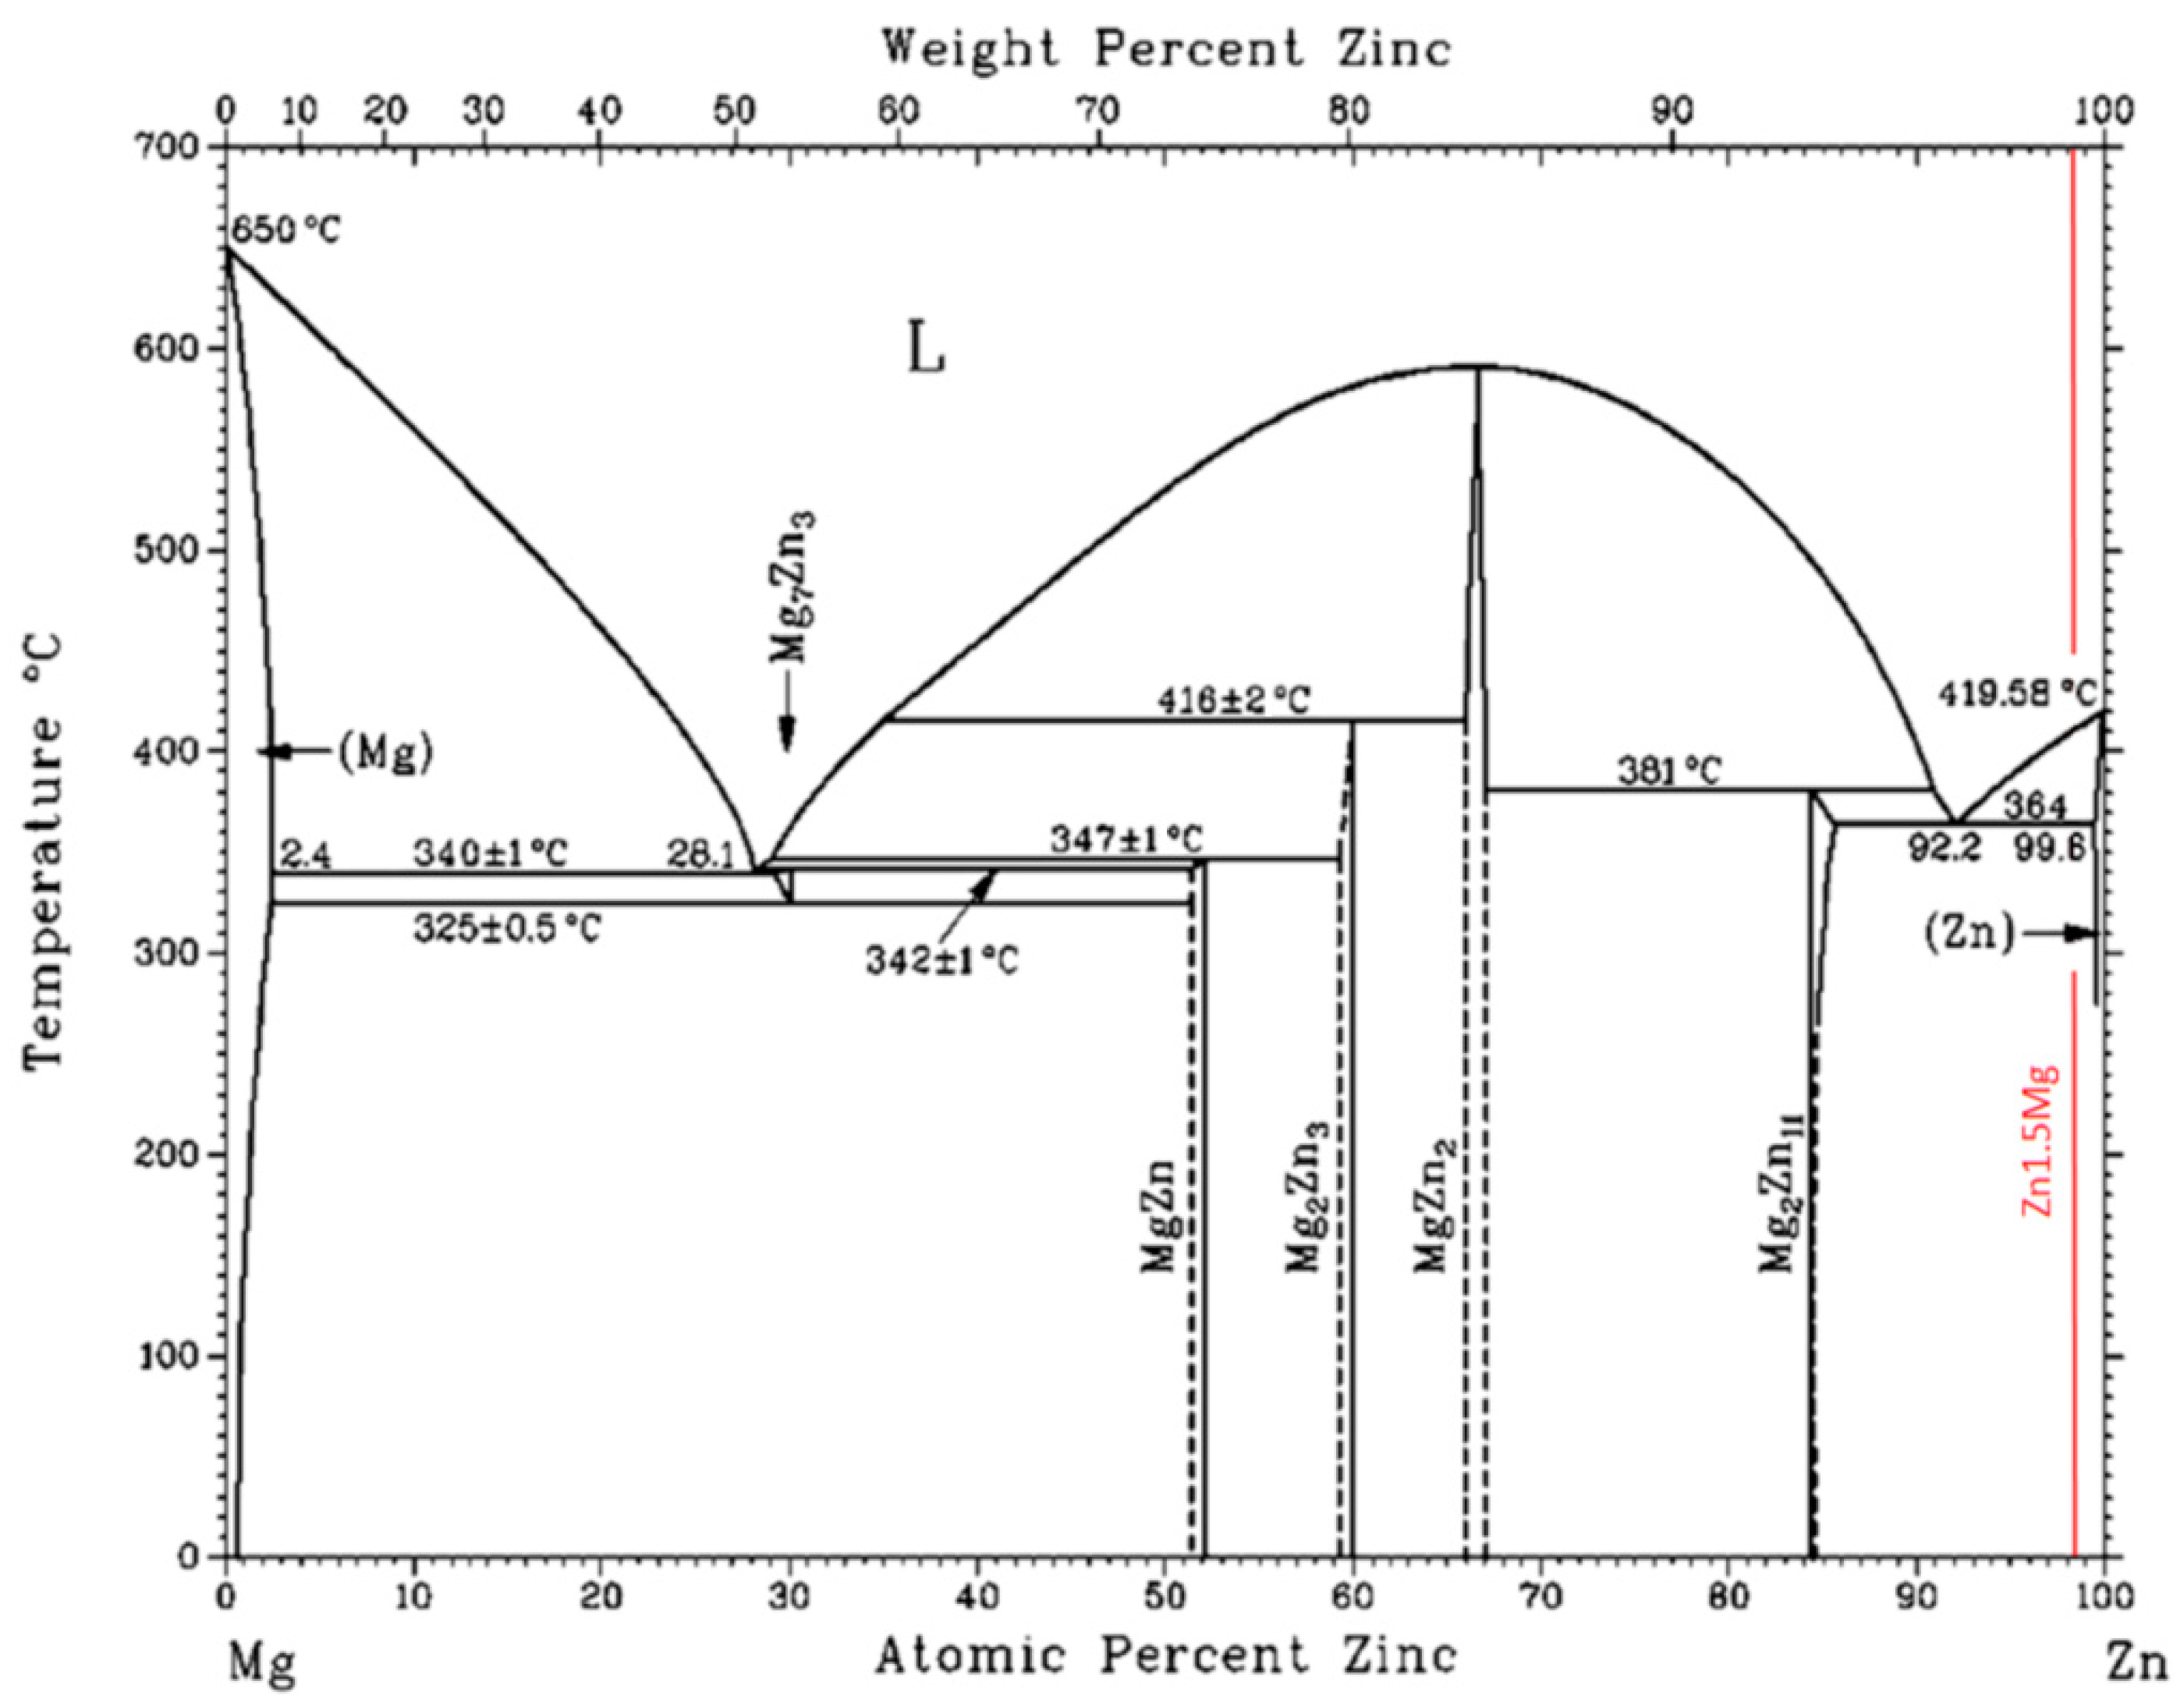
The DTA analyses suggest good agreement for the eutectic temperature TE at confrontation with the binary diagram Mg–Zn (Figure 8). Peak 1 corresponds to a reaction related to the formation of the MgZn2 phase. The liquidus temperature in the case of 4 at. % Mg, determined in accordance with Figure 8, was 395 °C. However, the DTA analysis defined this temperature as 405 °C. This may be caused by the fact that the alloy contained less magnesium than previously supposed–around 3 at. % Mg.

Figure 8.
Equilibrium binary diagram of the Mg-Zn system [22].
Table 4 defines the significant reactions in the Mg–Zn system, aligning with the diagram presented in Figure 8.
Table 4.
Significant reactions in the zinc-enriched zone of the Mg-Zn binary system [16].
3.2. Microstructure of Zn1.5Mg Solder
The microstructure of the Zn1.5Mg type soldering alloy, Figure 9, is formed of a zinc matrix. Segregation of binary eutectics in the form of lamellas occurred on the boundaries of Zn grains.
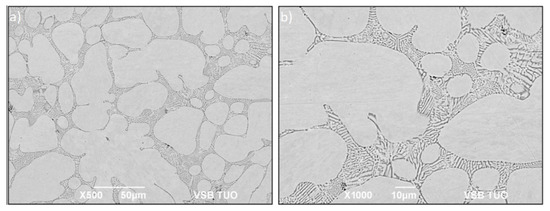
Figure 9.
Microstructure of Zn1.5Mg solder from SEM (BEI) in the condition after etching, (a) magnification 500×, (b) magnification 1000×.
The chemical composition of specific zones within the soldering alloy was identified via the utilization of EDX analysis. The designated measurement points, depicted in Figure 10, are annotated with numerical values ranging from 1 to 8. The results of EDX analysis are shown in Table 5.
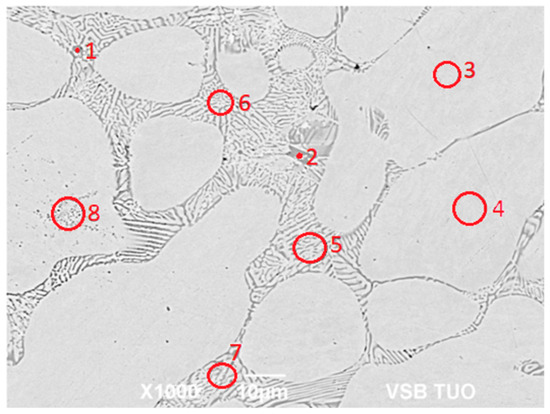
Figure 10.
Point EDX analysis of Zn1.5Mg solder.
Table 5.
Results of point EDX analysis of Zn1.5Mg solder.
In Spectrum 1 and 2 measurement points, small, rarely occurring constituents were observed, unanimously corresponding to the stochiometric formula of intermetallic compound type MgZn2. They were formed by the peritectic reaction at the temperature of 381 °C, in accordance with the Mg-Zn phase diagram shown in Figure 8. The Spectrum 3 and 4 measurement points showed primarily solidified large grains of pure zinc.
In the Spectrum 5 to 7 measurement points, the binary eutectics formed by the eutectic reaction at 364 °C were proven. It was comprised of pure zinc lamellas and an intermetallic compound of the type Mg2Zn11.
The Spectrum 8 measurement point identified small dark spots in the structure, corresponding to zinc oxide.
Even though the nominal composition of soldering alloy with 1.5 wt. % Mg, i.e., 4 at. % Mg, in accordance with the phase diagram, occurs on the right of the eutectic point (92.2 at. % Zn, 364 °C)–(Figure 8), formation of small islands of the MgZn2 phase took place, apparently during magnesium dissolution in the Zn melt. However, the constituents of this kind occurred relatively scarcely in the structure.
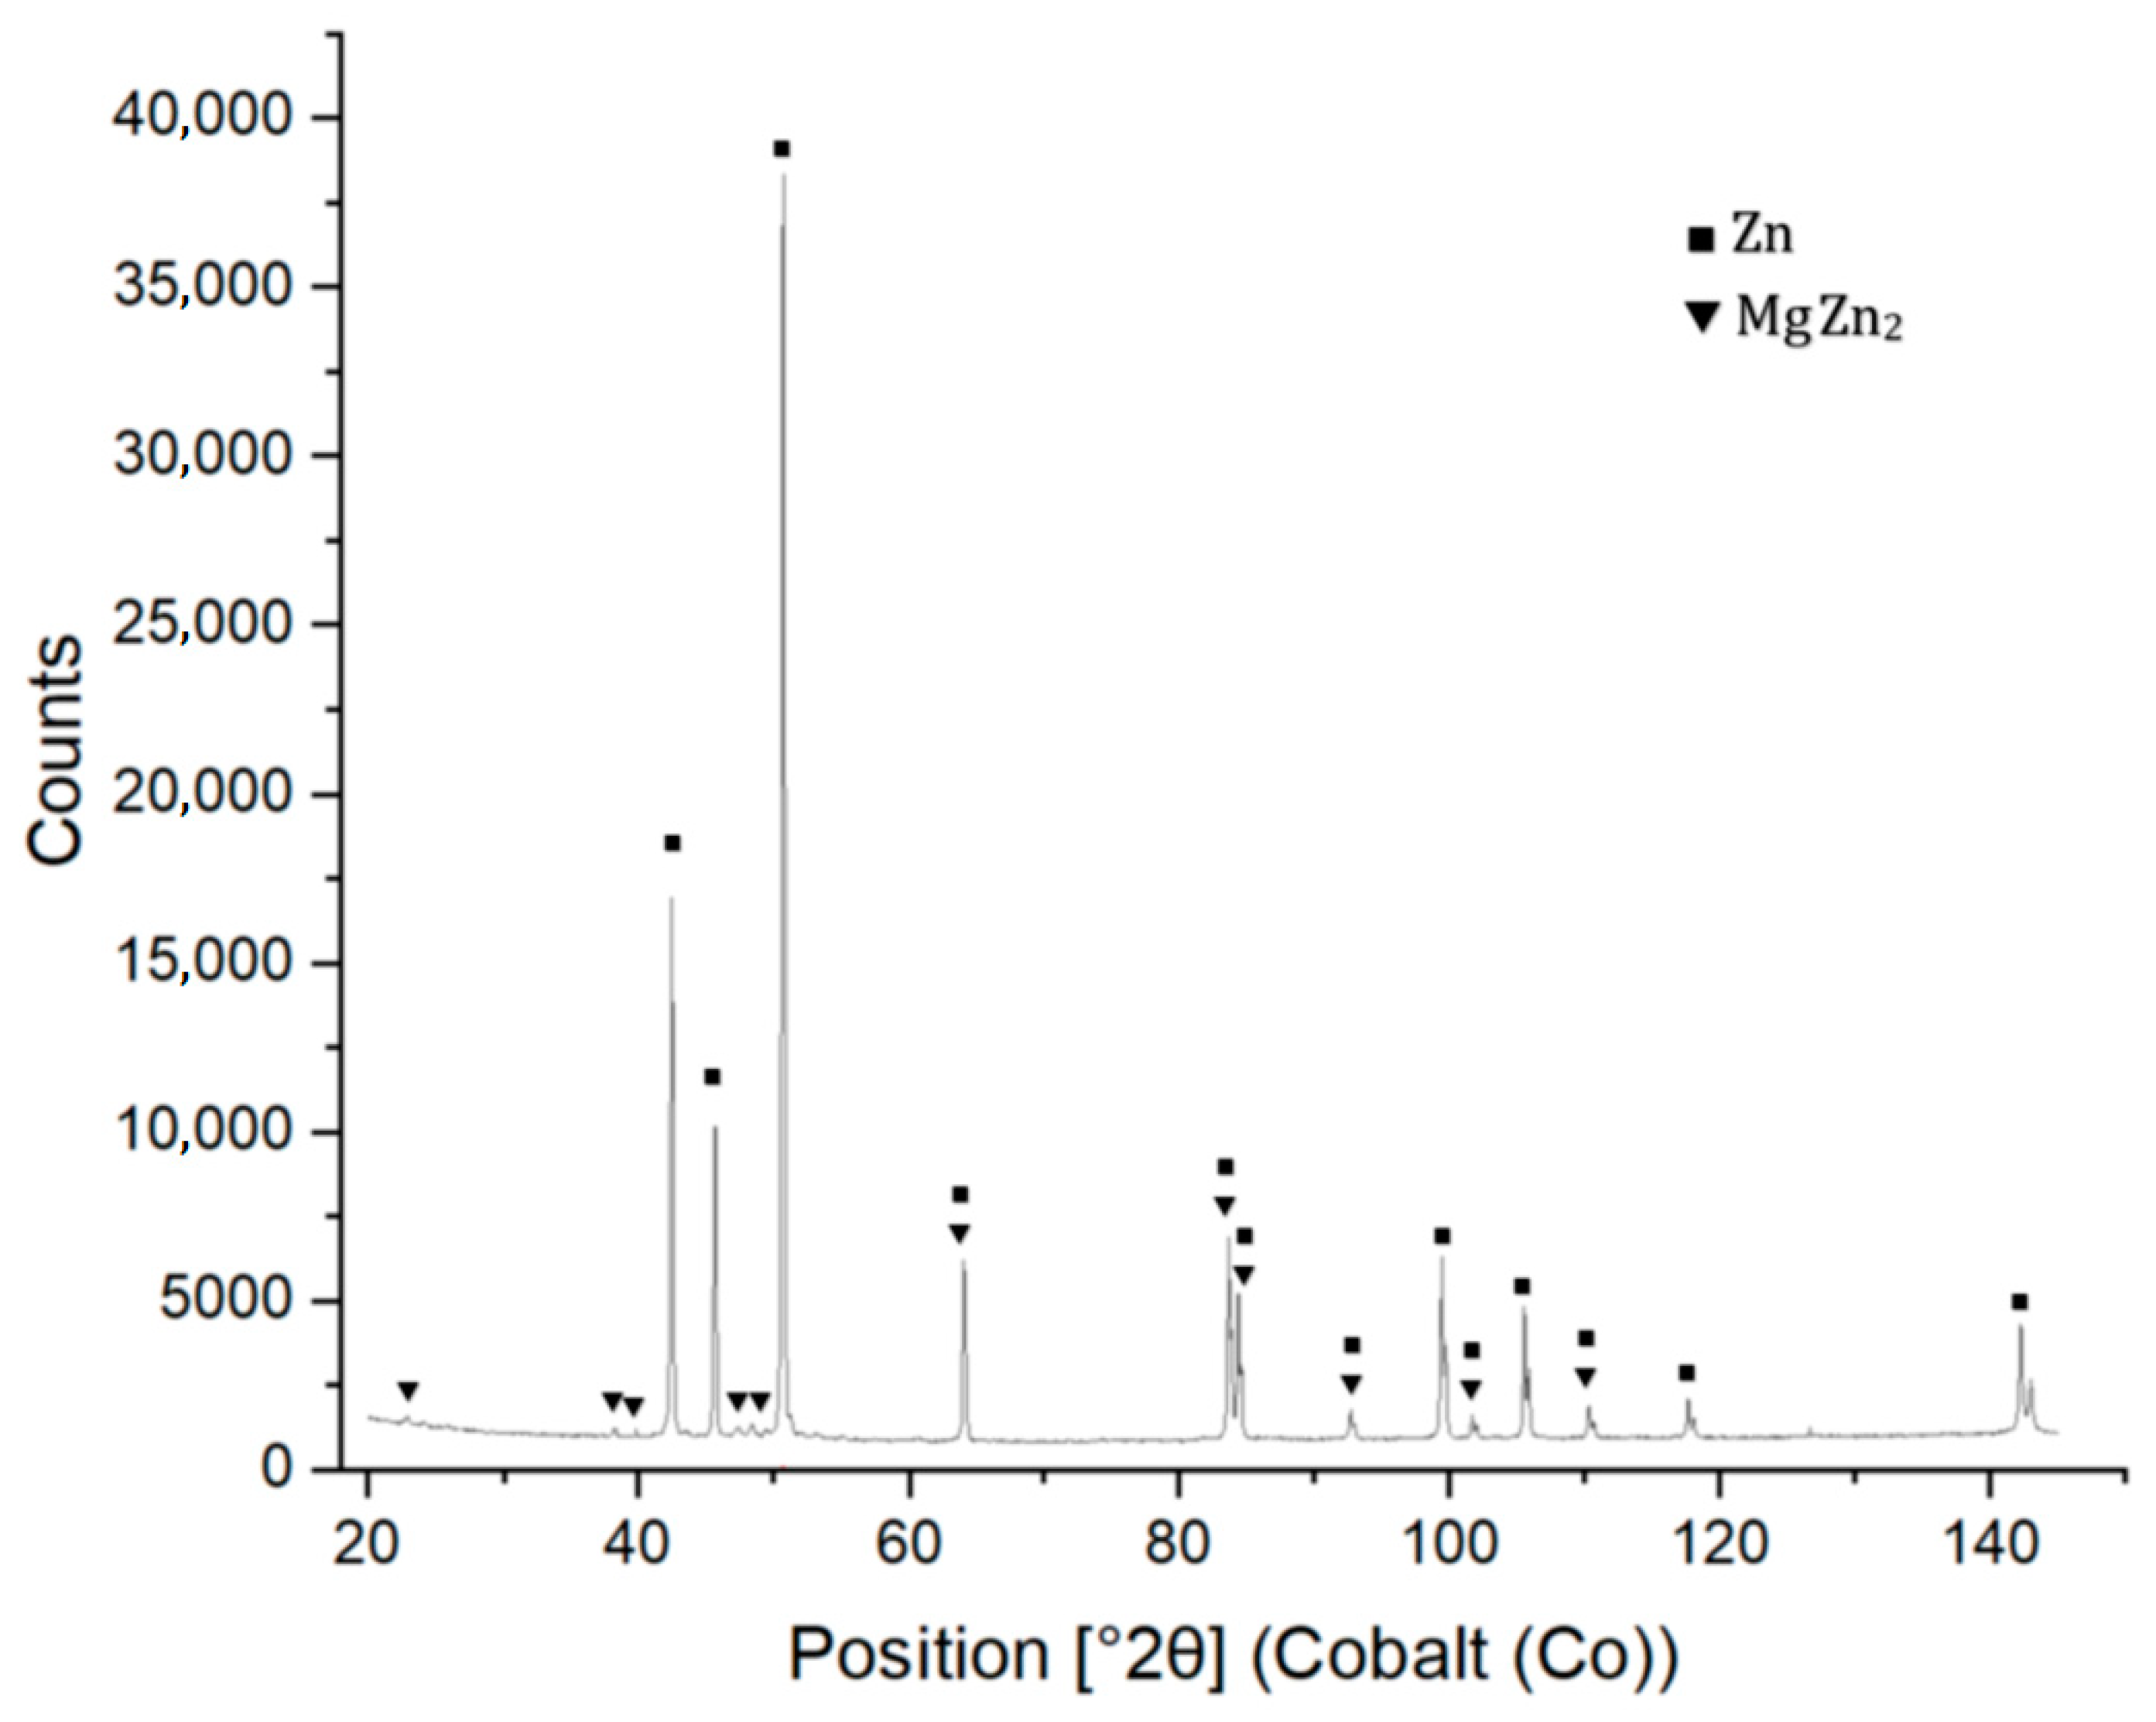
The XRD analysis of Zn1.5Mg solder, similar to the EDX analysis, verified the existence of a solid solution comprising zinc (Zn) and an intermetallic magnesium phase, specifically MgZn2. The detection of a fine Mg2Zn11 phase was not observed in the XRD analysis. The findings from the diffraction analysis are illustrated in Figure 11.
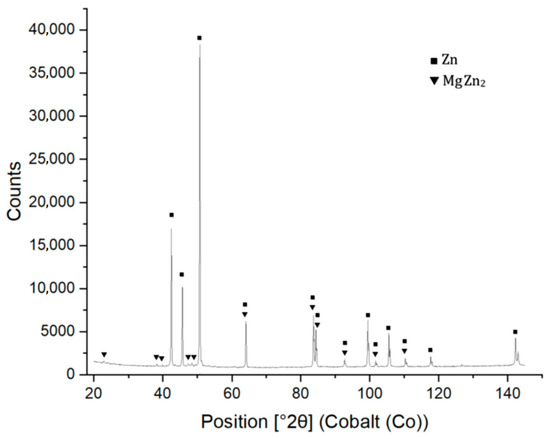
Figure 11.
XRD analysis of Zn1.5Mg solder.
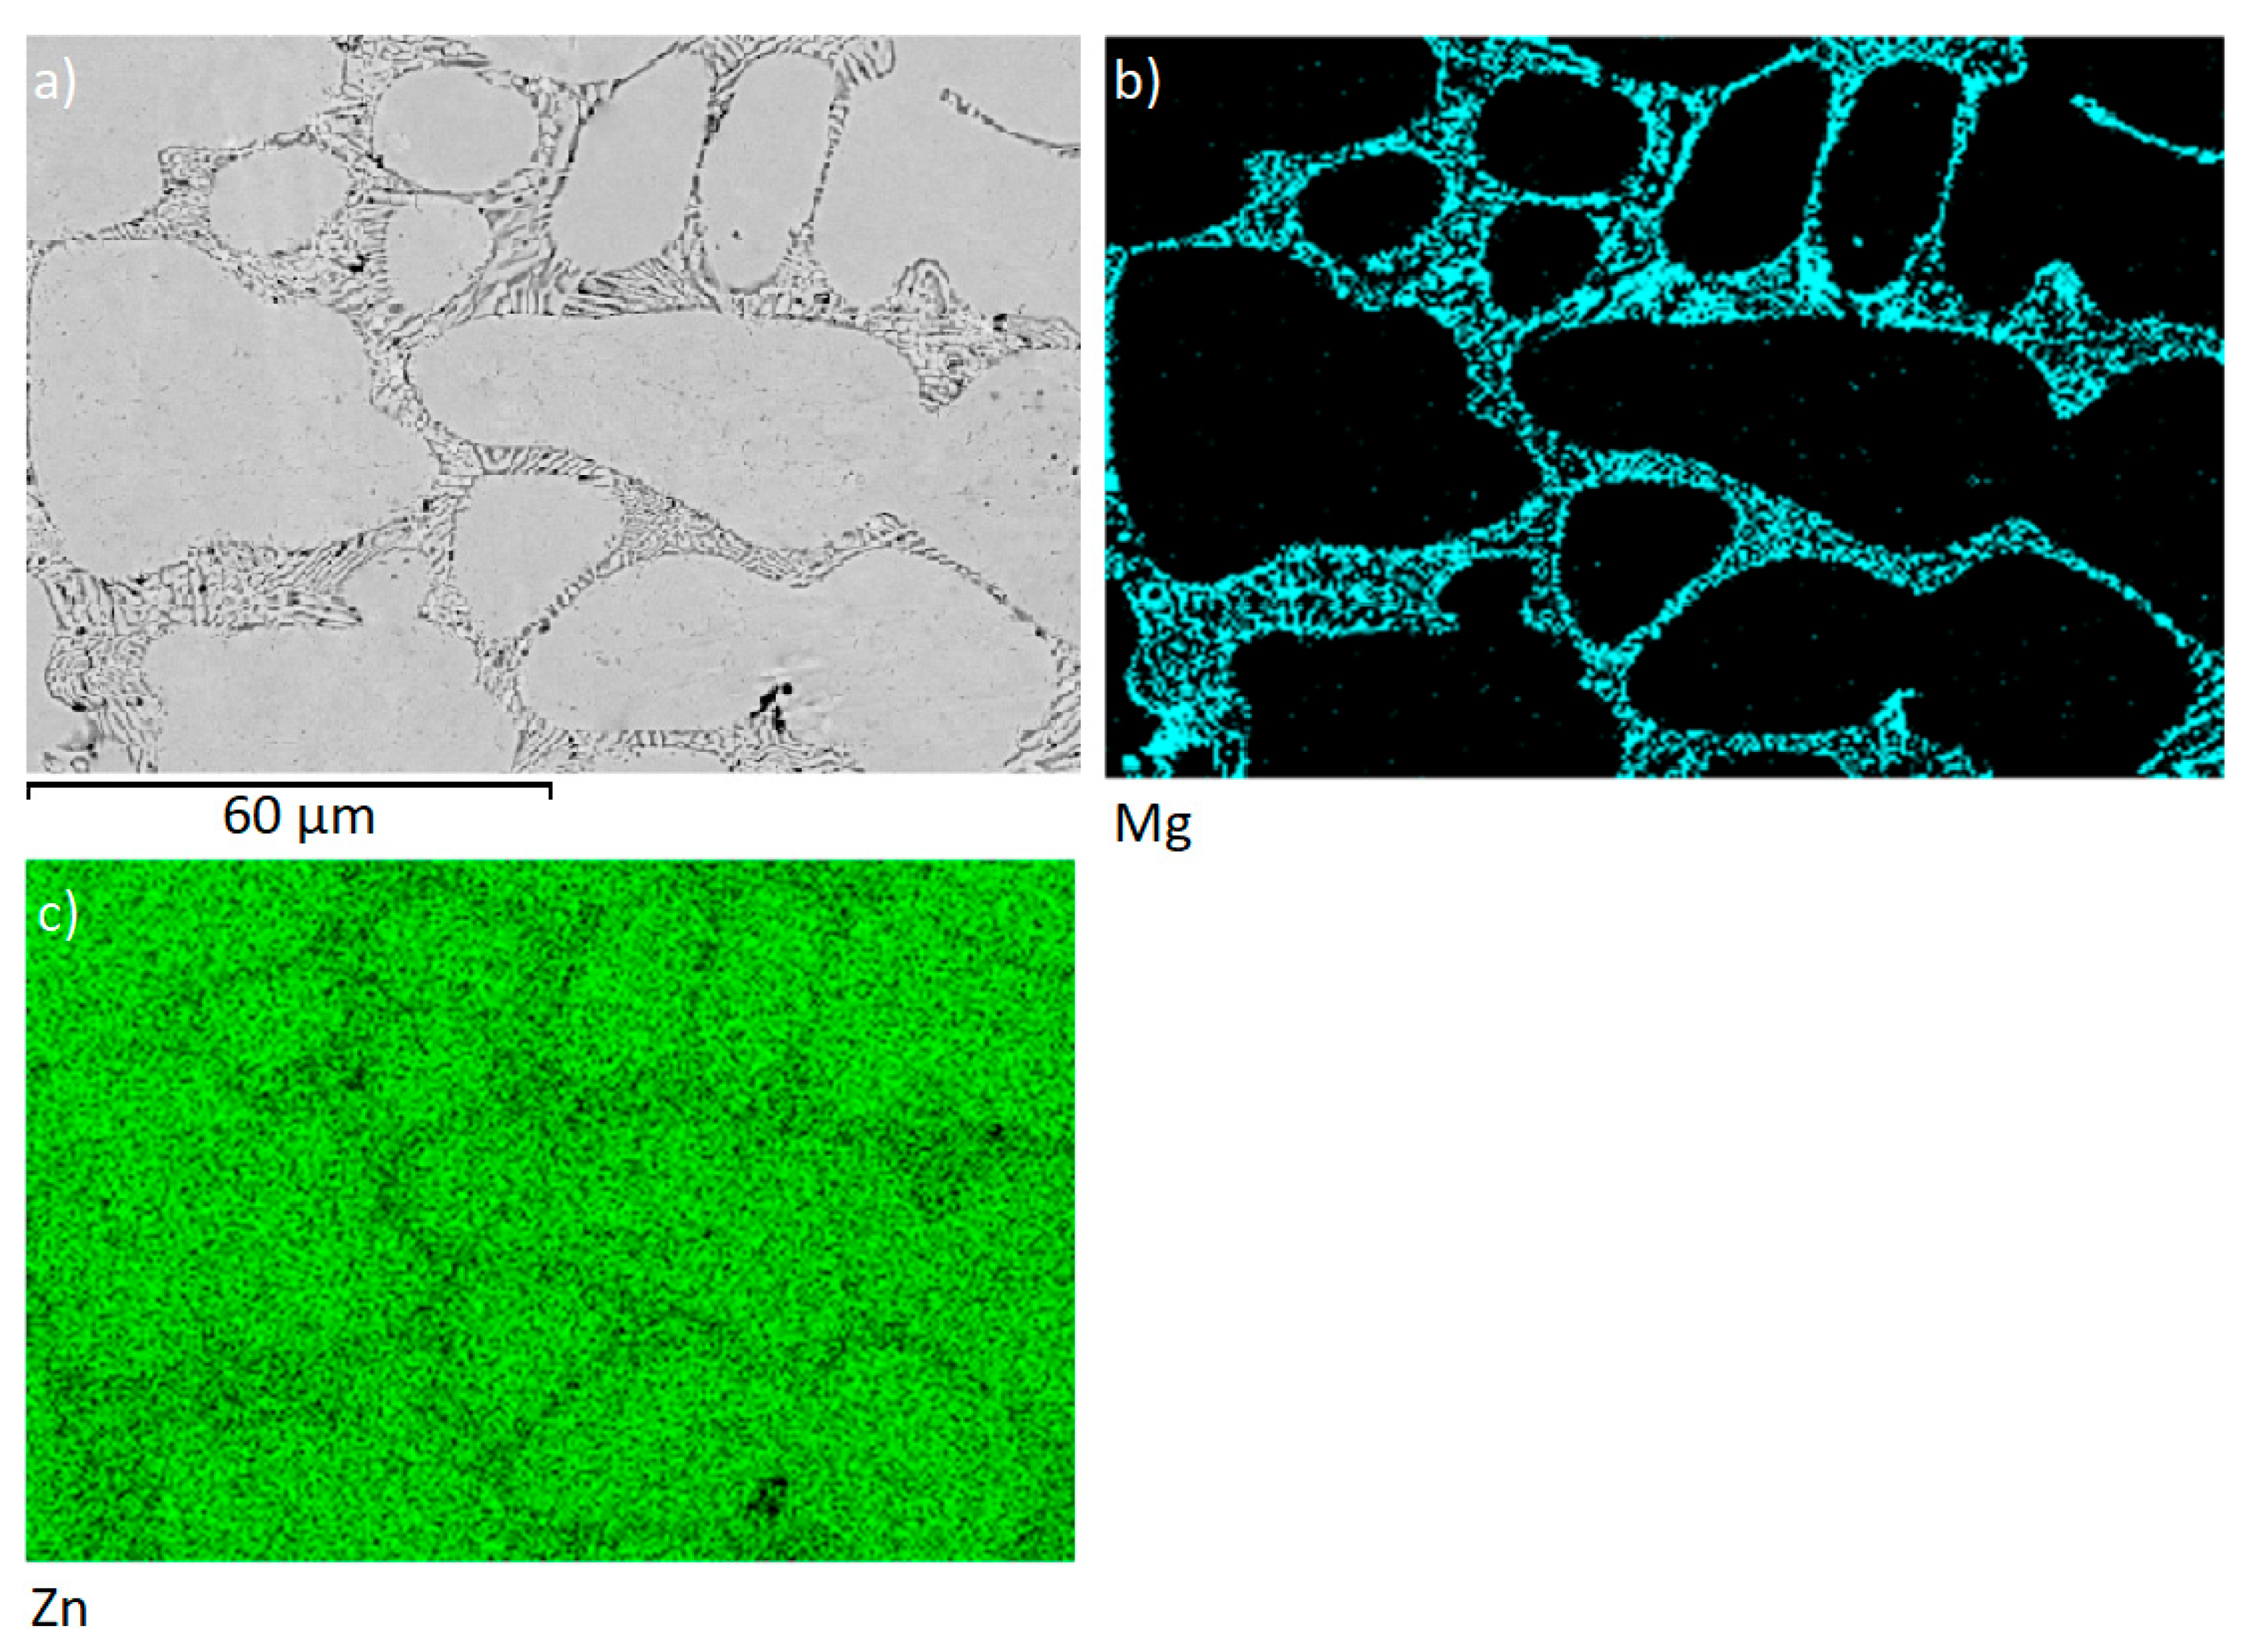
The planar distribution of the magnesium phase in the eutectic zinc matrix is documented in Figure 12. On the grain boundaries of the Zn matrix, segregation of binary eutectics (Zn) + Mg2Zn11 in the form of lamellas took place.

Figure 12.
Map of elements in solder microstructure (a) Zn1.5Mg, (b) Mg, (c) Zn.
3.3. Microstructure of the SiC/Zn1.5Mg/Cu Joint
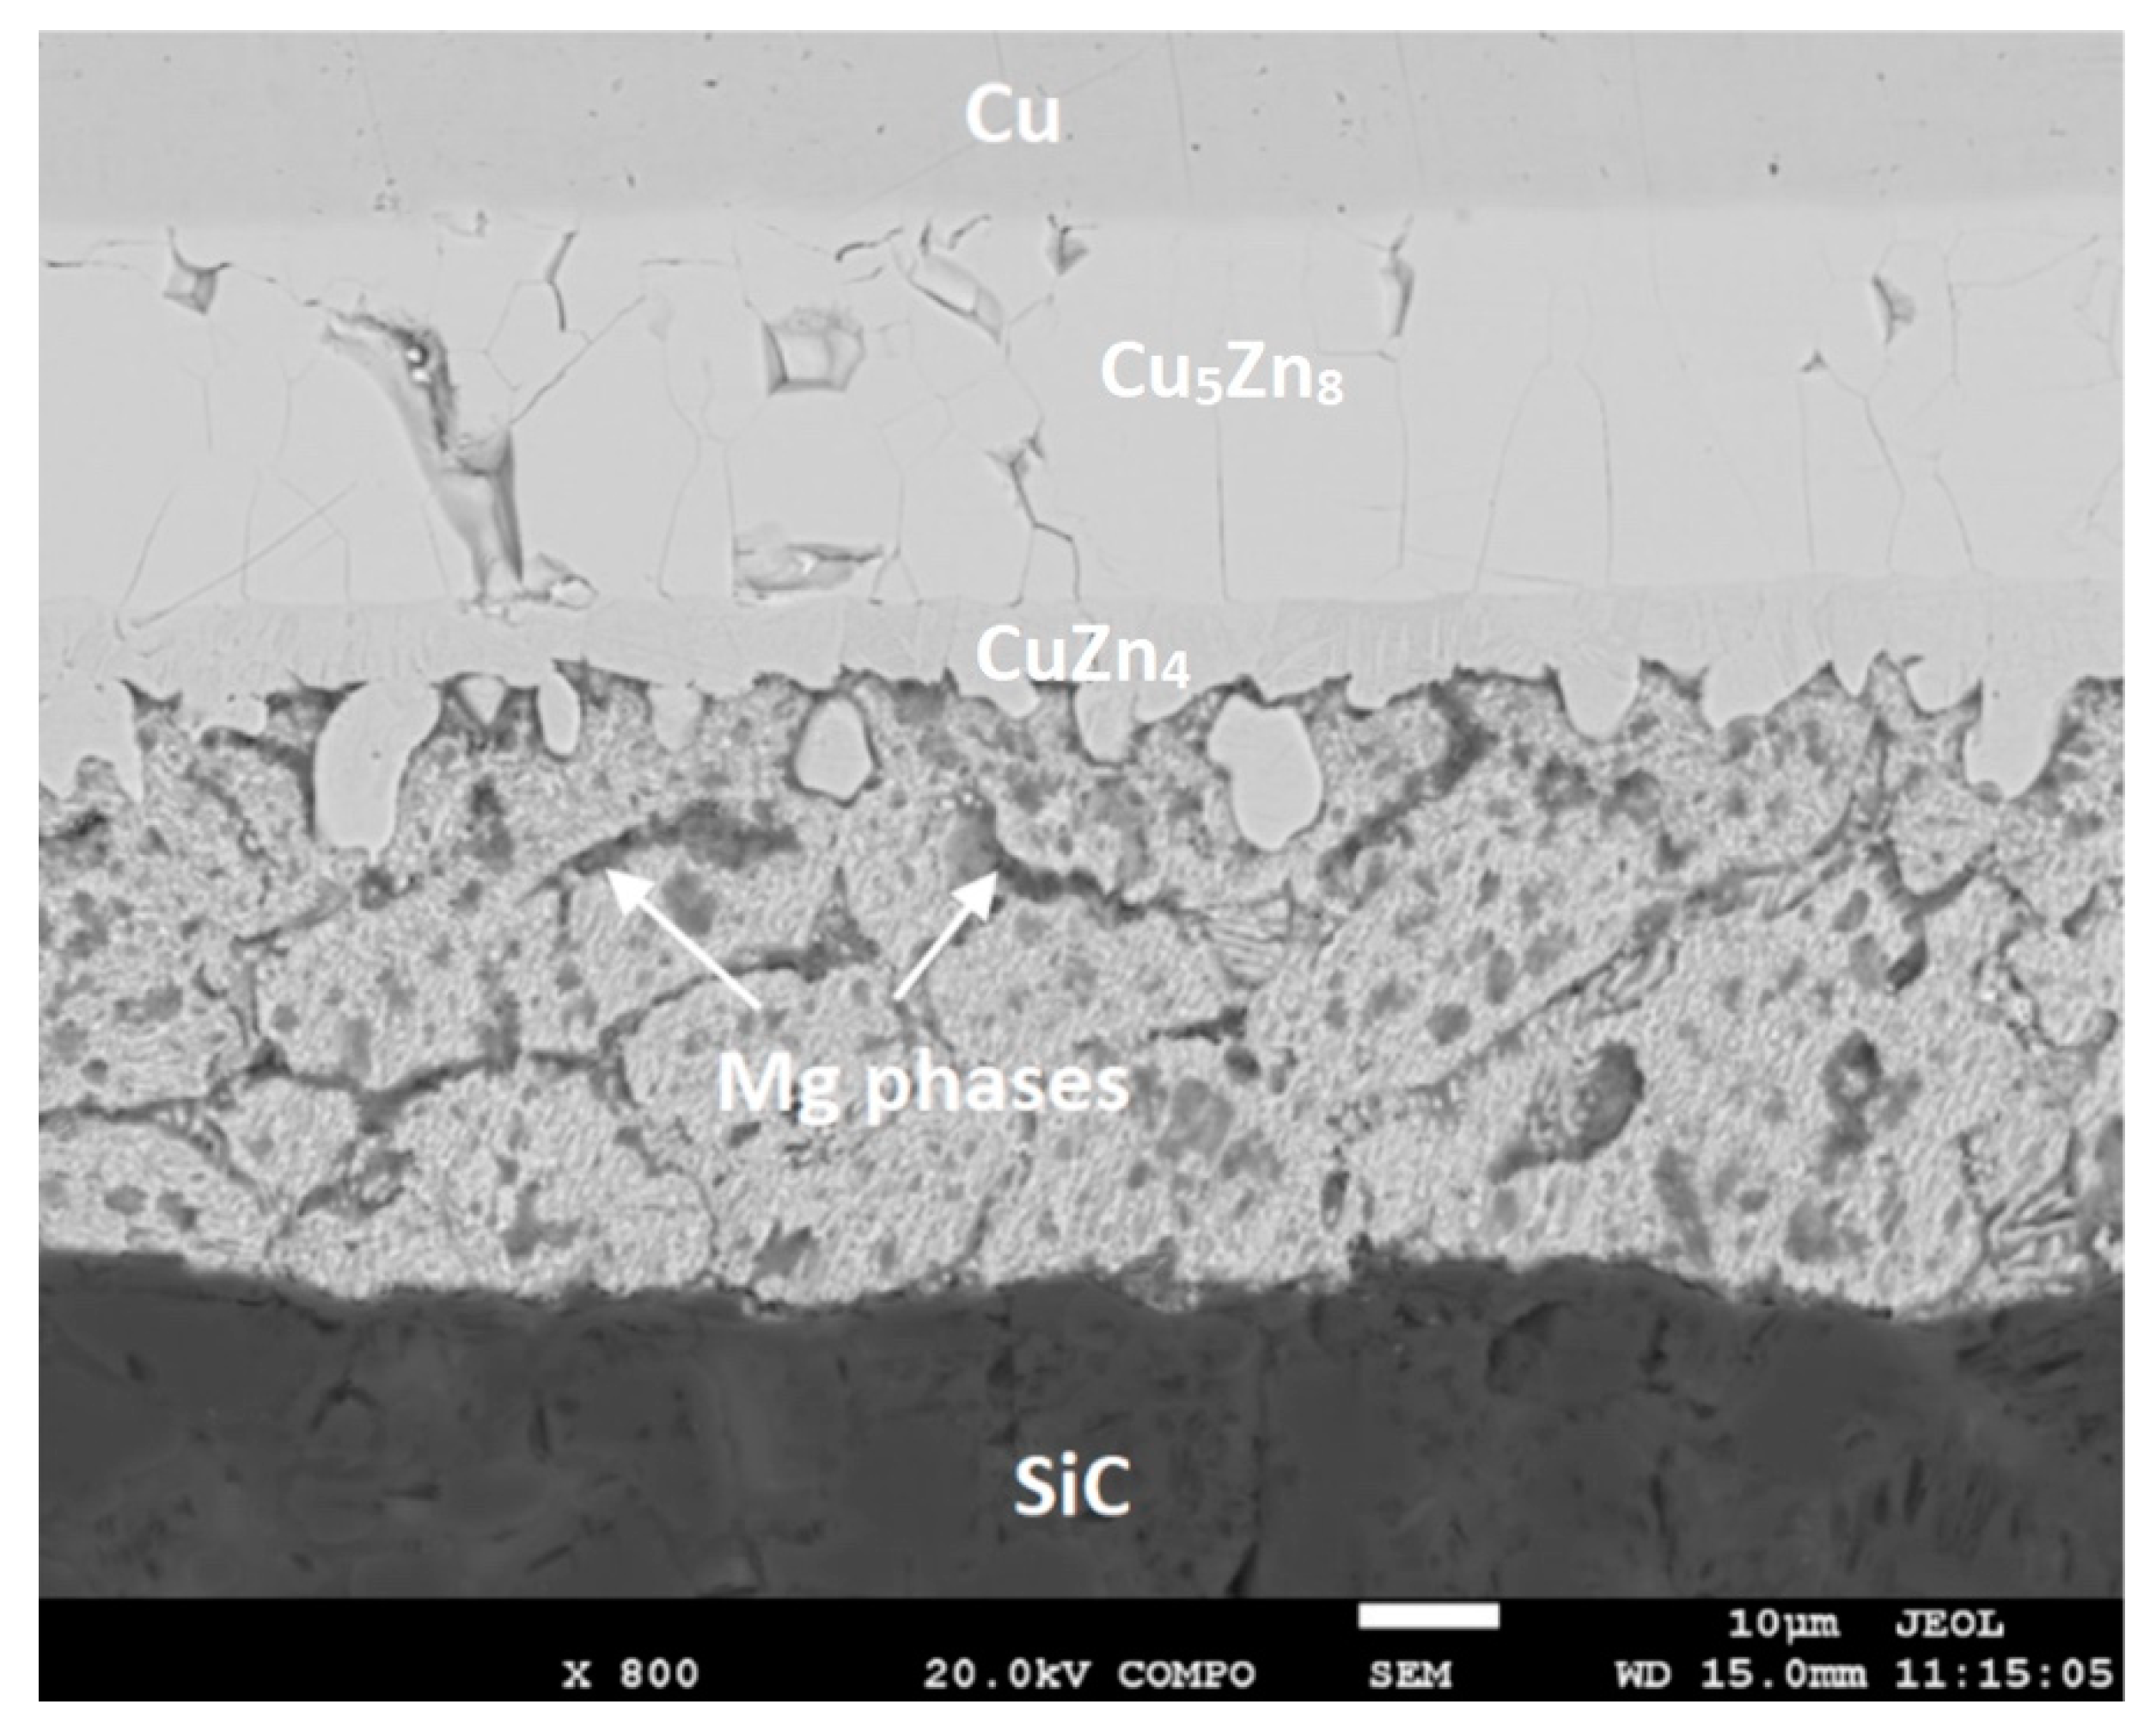
The soldered SiC/Zn1.5Mg/Cu joint was produced at 380 °C. Owing to ultrasonic activation, an acceptable joint, which did not contain cracks or inhomogeneities, was achieved in the soldering process. The image in Figure 13 illustrates the microstructure of the soldered joint. The thickness of the solder layer in the solder joint was approximately 60 µm.

Figure 13.
Microstructure of the boundary in the SiC/Zn1.5Mg/Cu joint from the SEM observation in BSE mode.
Figure 13 shows that the magnesium phases in the solder matrix have segregated on the boundaries of Zn grains. A massive transition zone was formed in the boundary of the Cu/Zn1.5Mg solder joint. It is composed of new intermetallic phases, which will be further analyzed in this work.
3.4. Analysis of the Transition Zone in the SiC/Zn1.5Mg Joint
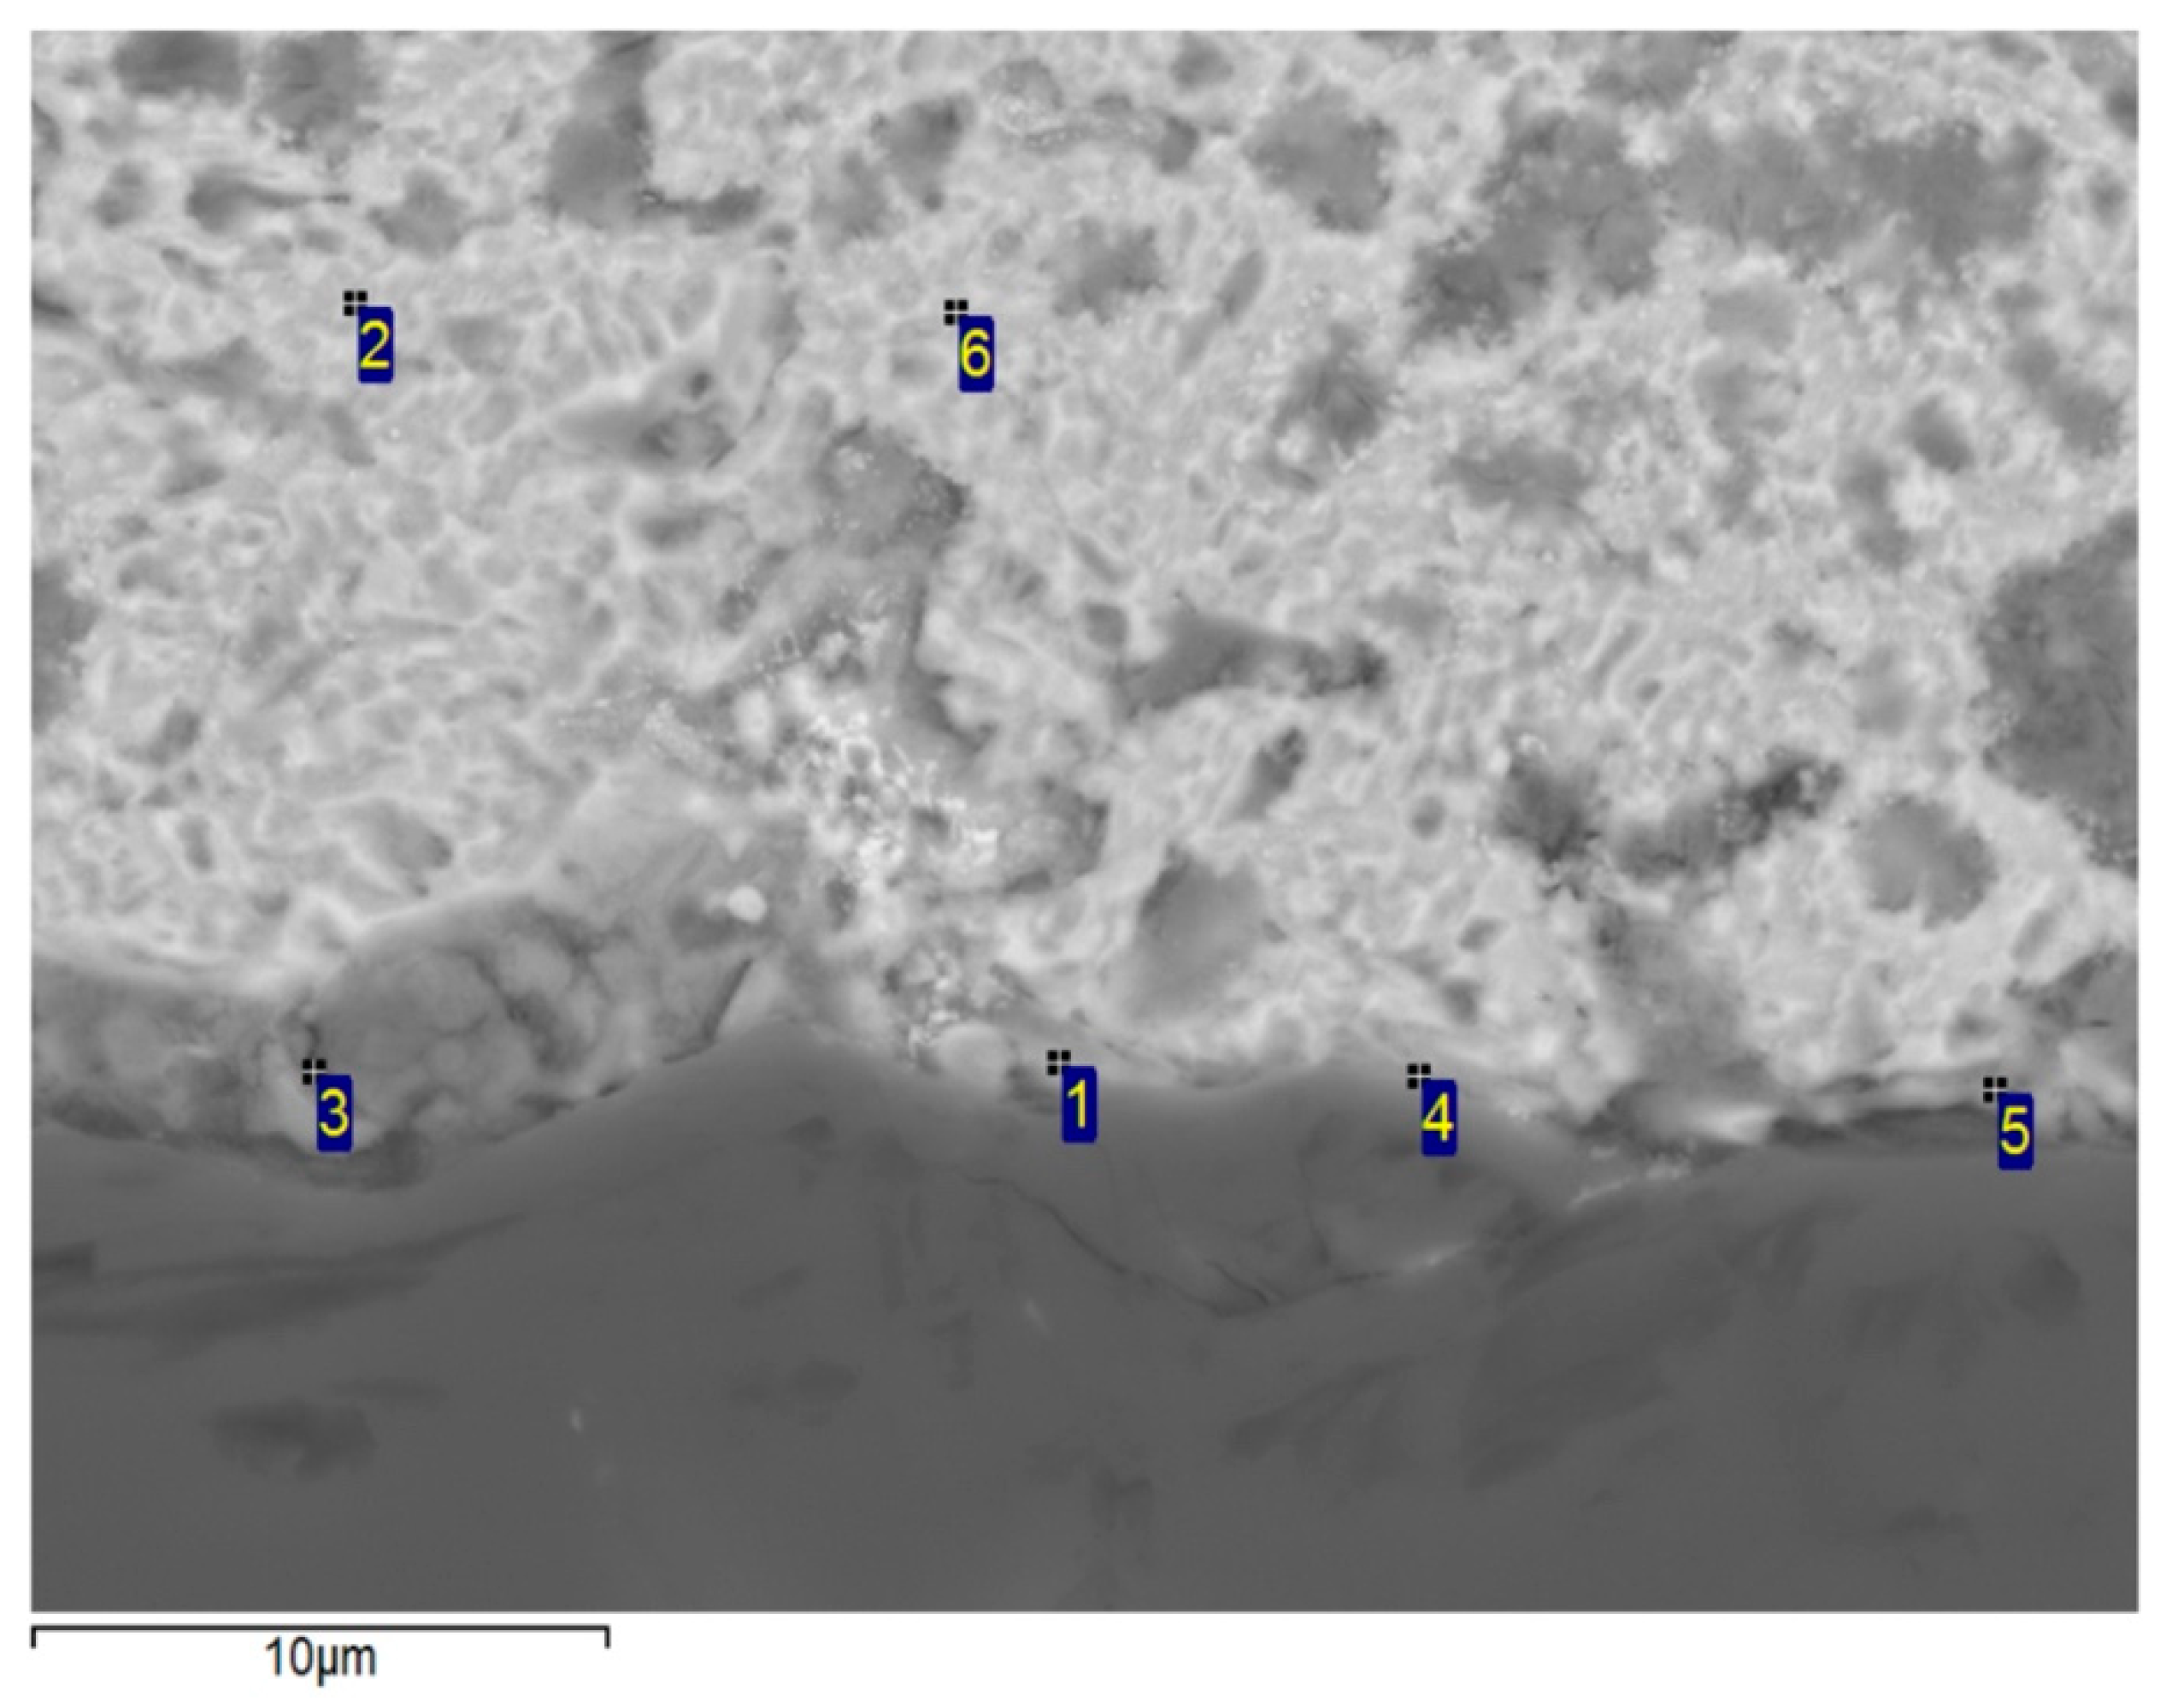
An undulated boundary with small depressions was formed at the SiC/solder boundary, resulting from the assistance of ultrasound power. A detail of this boundary is shown in Figure 14.
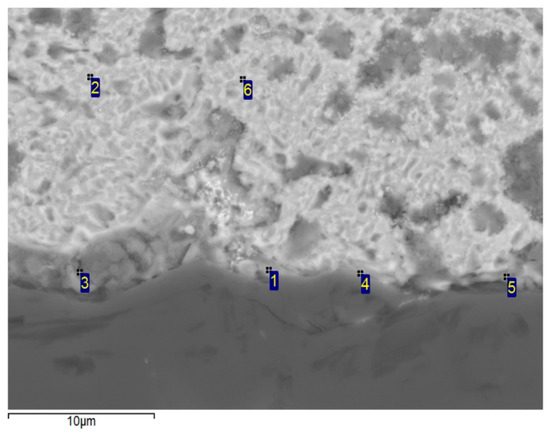
Figure 14.
EDX point analysis of SiC/Zn1.5Mg joint.
The chemical composition and identification of specific phases in the soldered joint were determined using the application of EDX analysis.
The measurement was carried out at six points, namely Spectrum 1 to 6–Table 6.
Table 6.
Results of point EDX analysis of SiC/Zn1.5Mg joint.
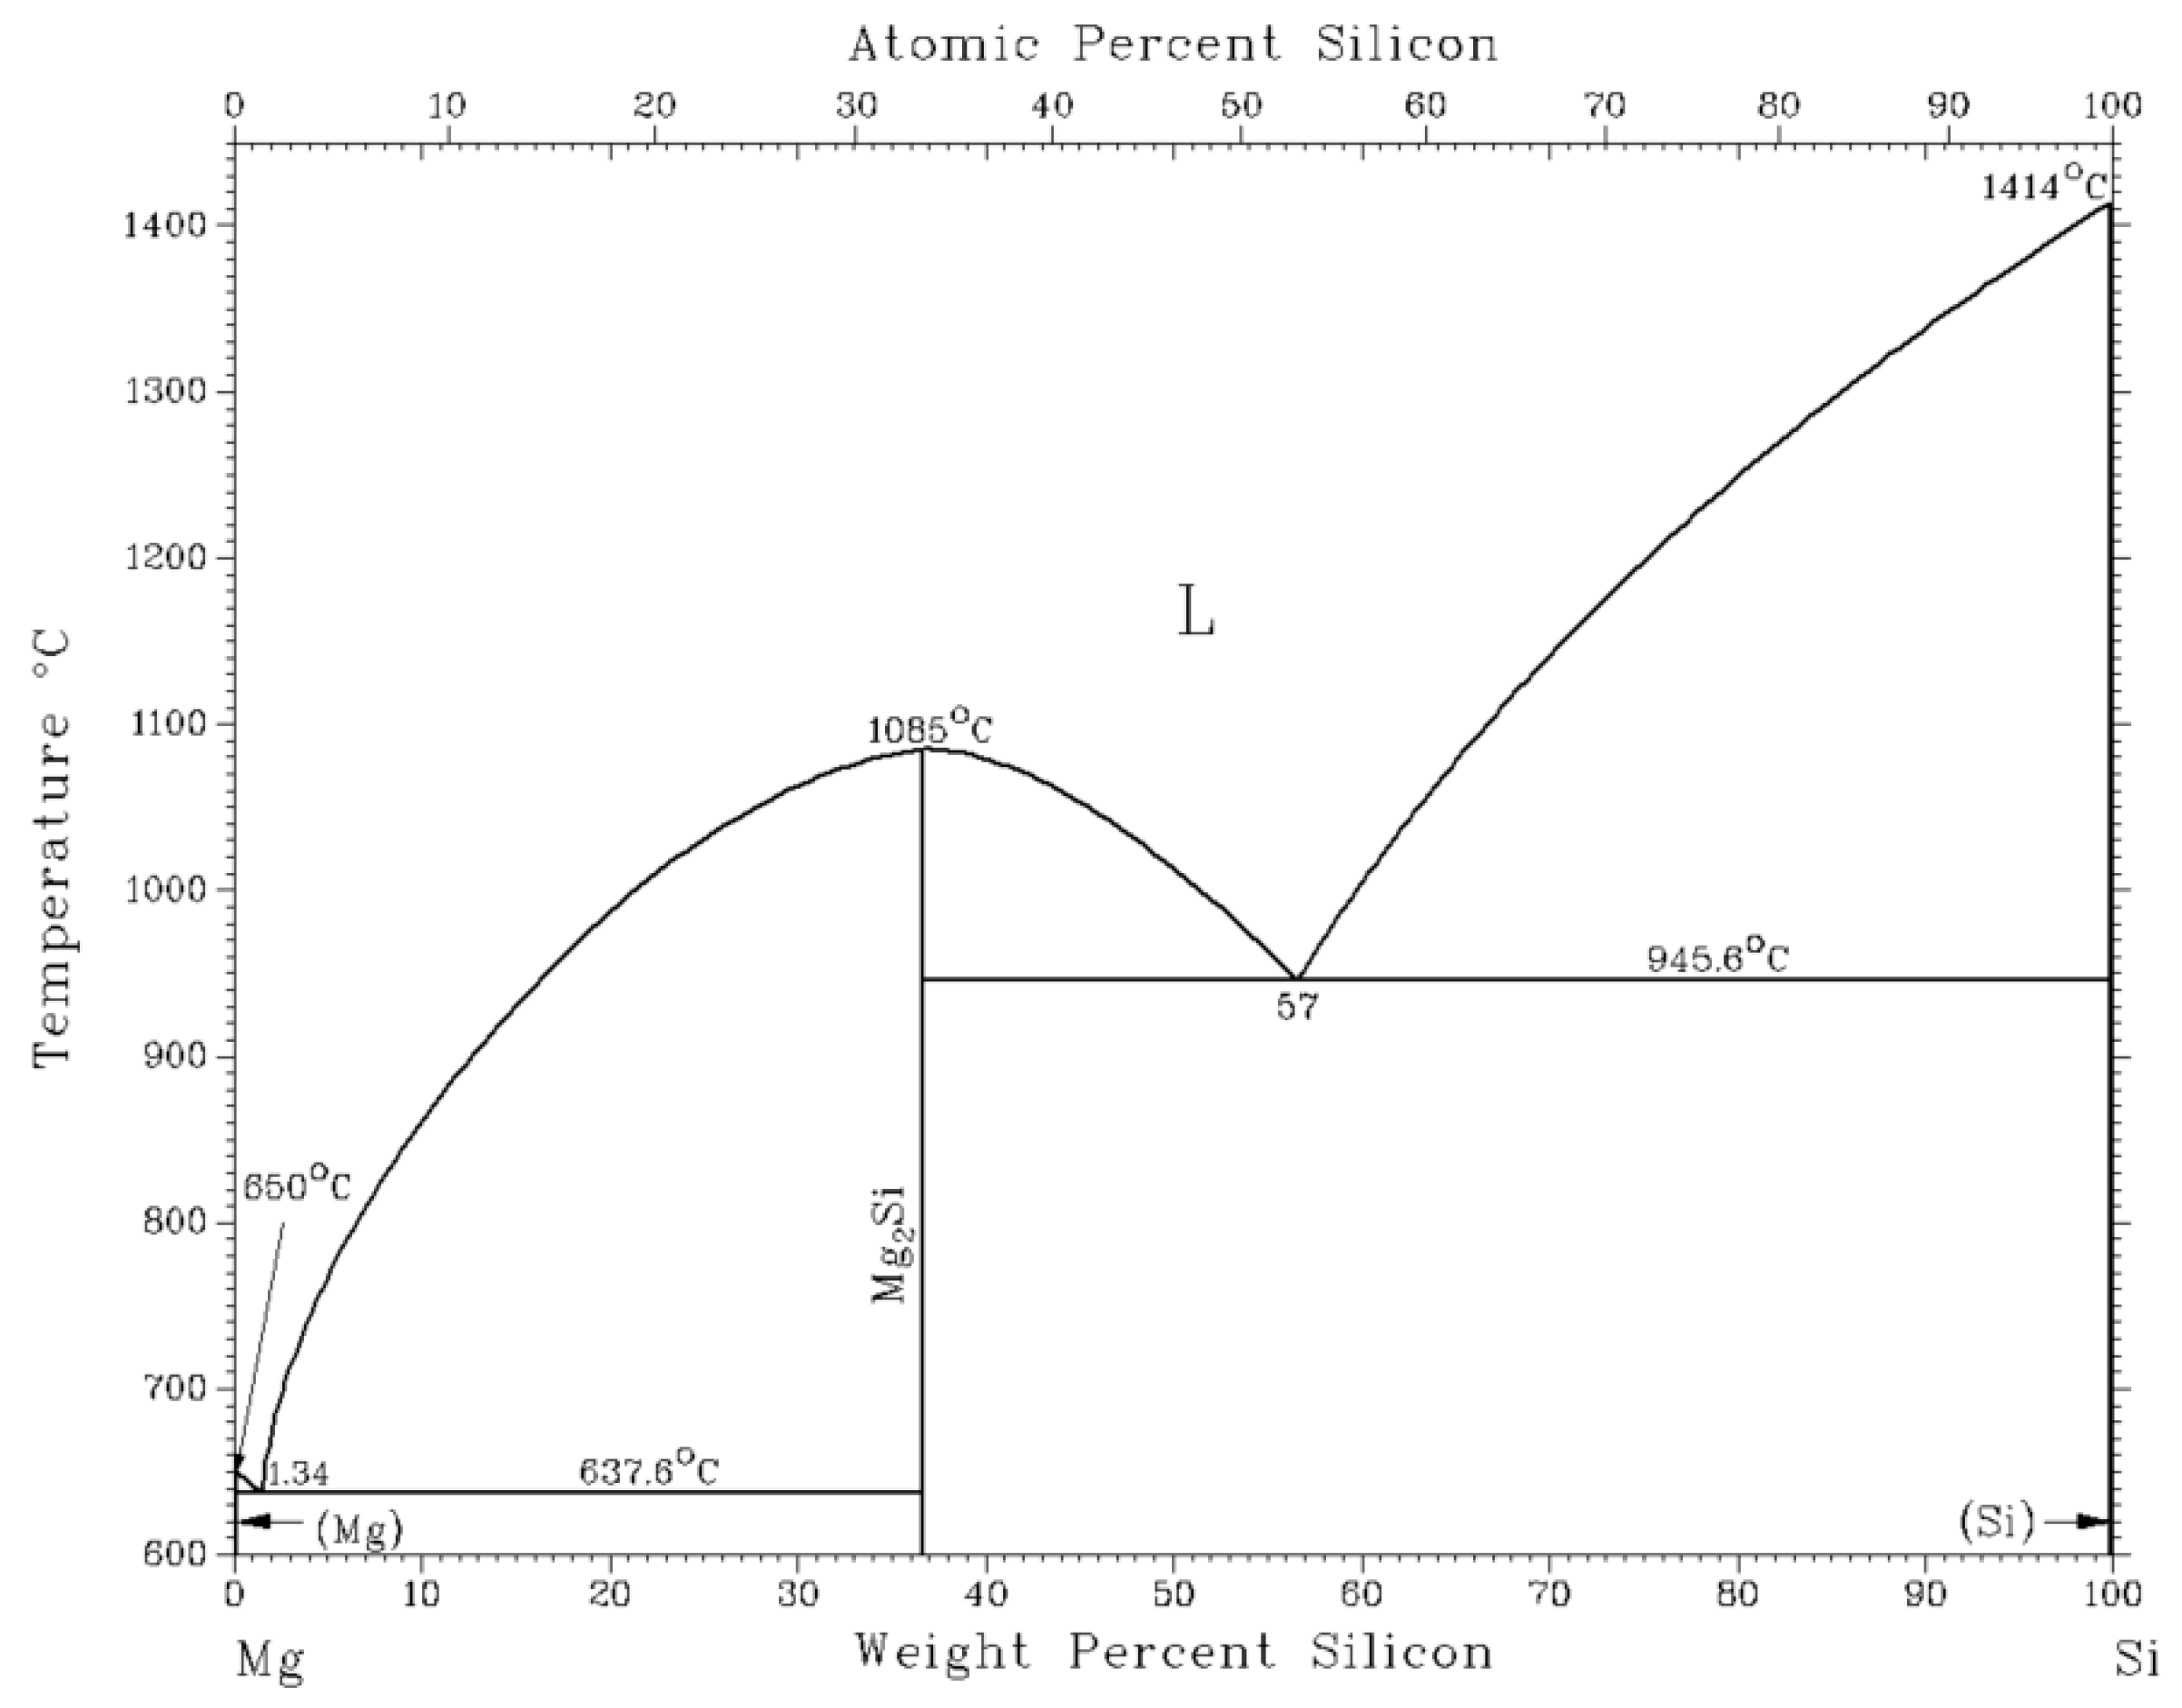
In the measurement points Spectrum 1, 3, 4, and 5, spot local analyses from the contact zone of Zn1.5Mg solder/SiC substrate were performed. The results were affected by the position of the measurement point in the boundary. The closer the measurement point to the SiC substrate, the higher the Si content observed. A narrow zone formed in the boundary, where an interaction occurred between Zn-Mg solder and the SiC substrate. Spectrum 5 slightly deviates in Zn and Si content compared to the three remaining point analyses. The average zinc content in this zone (Spectrums 1, 3, 4) is 64.4 at. % Zn, 29.2 at. % Si, 4.2 at. % Mg, and 2.2 at. % Cu. The presence of Cu in this zone may be due to conventional and diffusion processes of copper occurring in the solder under the effect of ultrasound, where the second joint was formed by the combination of Cu/Zn1.5Mg solder. The phase diagram Mg–Si (Figure 15) is of the eutectic type. One eutectic is formed by the reaction from the melt at 637.6 °C, resulting in the creation of a eutectic mixture of Mg2Si + Mg, whereas the second reaction takes place at 945.6 °C with the creation of a eutectic Mg2Si + Si mixture. Both Mg and Si elements are mutually practically insoluble.
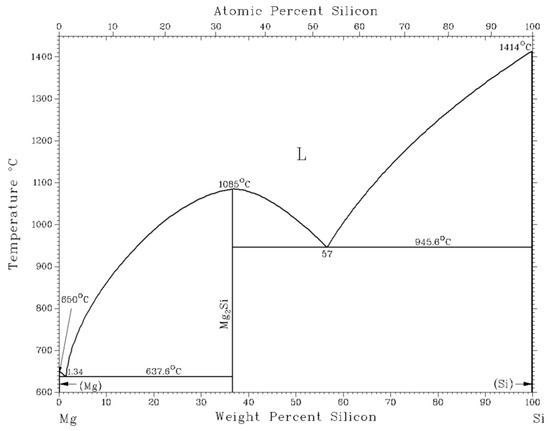
Figure 15.
Equilibrium binary diagram of Mg-Si [23].
Spectrum 2 and 6 measurement points are the zones with a high zinc content (about 96 at. %, about 3.3 at. % Cu and 1 at. % Mg). The solubility of Mg in zinc at normal temperatures is negligible (<1 at. %), similar to the copper solubility in zinc. In the peritectic reaction at the temperature of 425 °C in the Cu–Zn system, the copper content in the solid solution of Zn is 2.75 wt. % Cu. The Cu solubility in (Zn) gradually decreases with decreasing temperature. In this case, the solid solution of zinc with a low content of Cu and Mg is concerned.
The interaction between the solder and ceramic is well illustrated by the planar distribution of magnesium (Figure 16b) in the boundary of the SiC/Zn1.5Mg joint. In this joint boundary, the newly formed intermetallic phases of magnesium were segregated, which enhanced the bond formation.
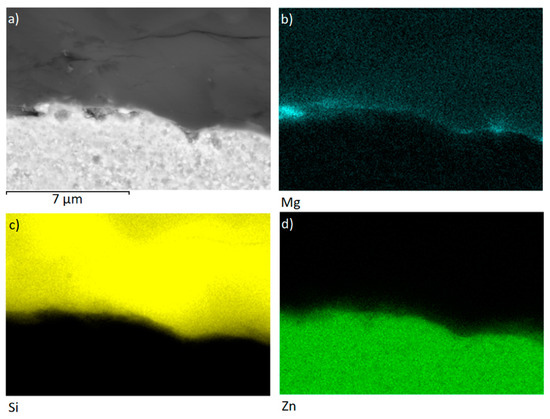
Figure 16.
The planar distribution of elements (b) Mg, (c) Si, and (d) Zn in the joint boundary (a) SiC/Zn1.5Mg.
The line analyses (Figure 17) illustrate the concentration profile along the SiC/solder boundary, covering a total length of 9 μm. The interaction between the solder and the SiC substrate took place predominantly at the boundary, resulting in the formation of an extremely thin layer, approximately 1 to 2 µm thick. There is also an apparent zinc and silicon interaction, which overlaps 2 µm in length.
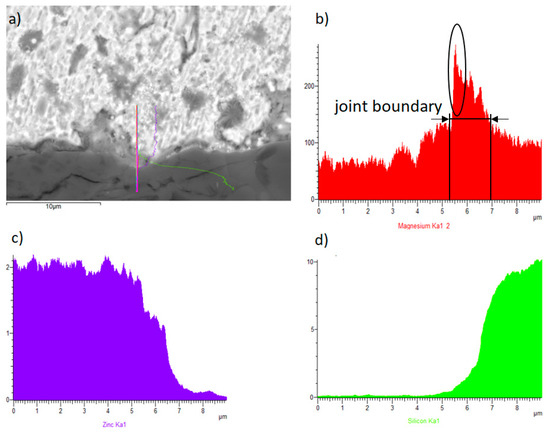
Figure 17.
The line EDX analysis of SiC/Zn1.5Mg joint, (a) transition zone with a marked line, (b) concentration profile of Mg, (c) Zn, and (d) Si elements.
From the results of point, planar, and line analyses, the following bond formation mechanism may be concluded: while soldering, magnesium from the solder is dispersed towards the interface with SiC ceramics, where zinc is also presented. It was found that magnesium reacts with silicon, which is infiltered in SiC ceramics. A new supposed Mg2Si phase is thus formed via mutual interaction. The resulting mechanical, chemical, and physical properties, along with bond strength, meet the standard benchmarks established in the industry.
3.5. Analysis of the Transition Zone in the Cu/Zn1.5Mg Joint
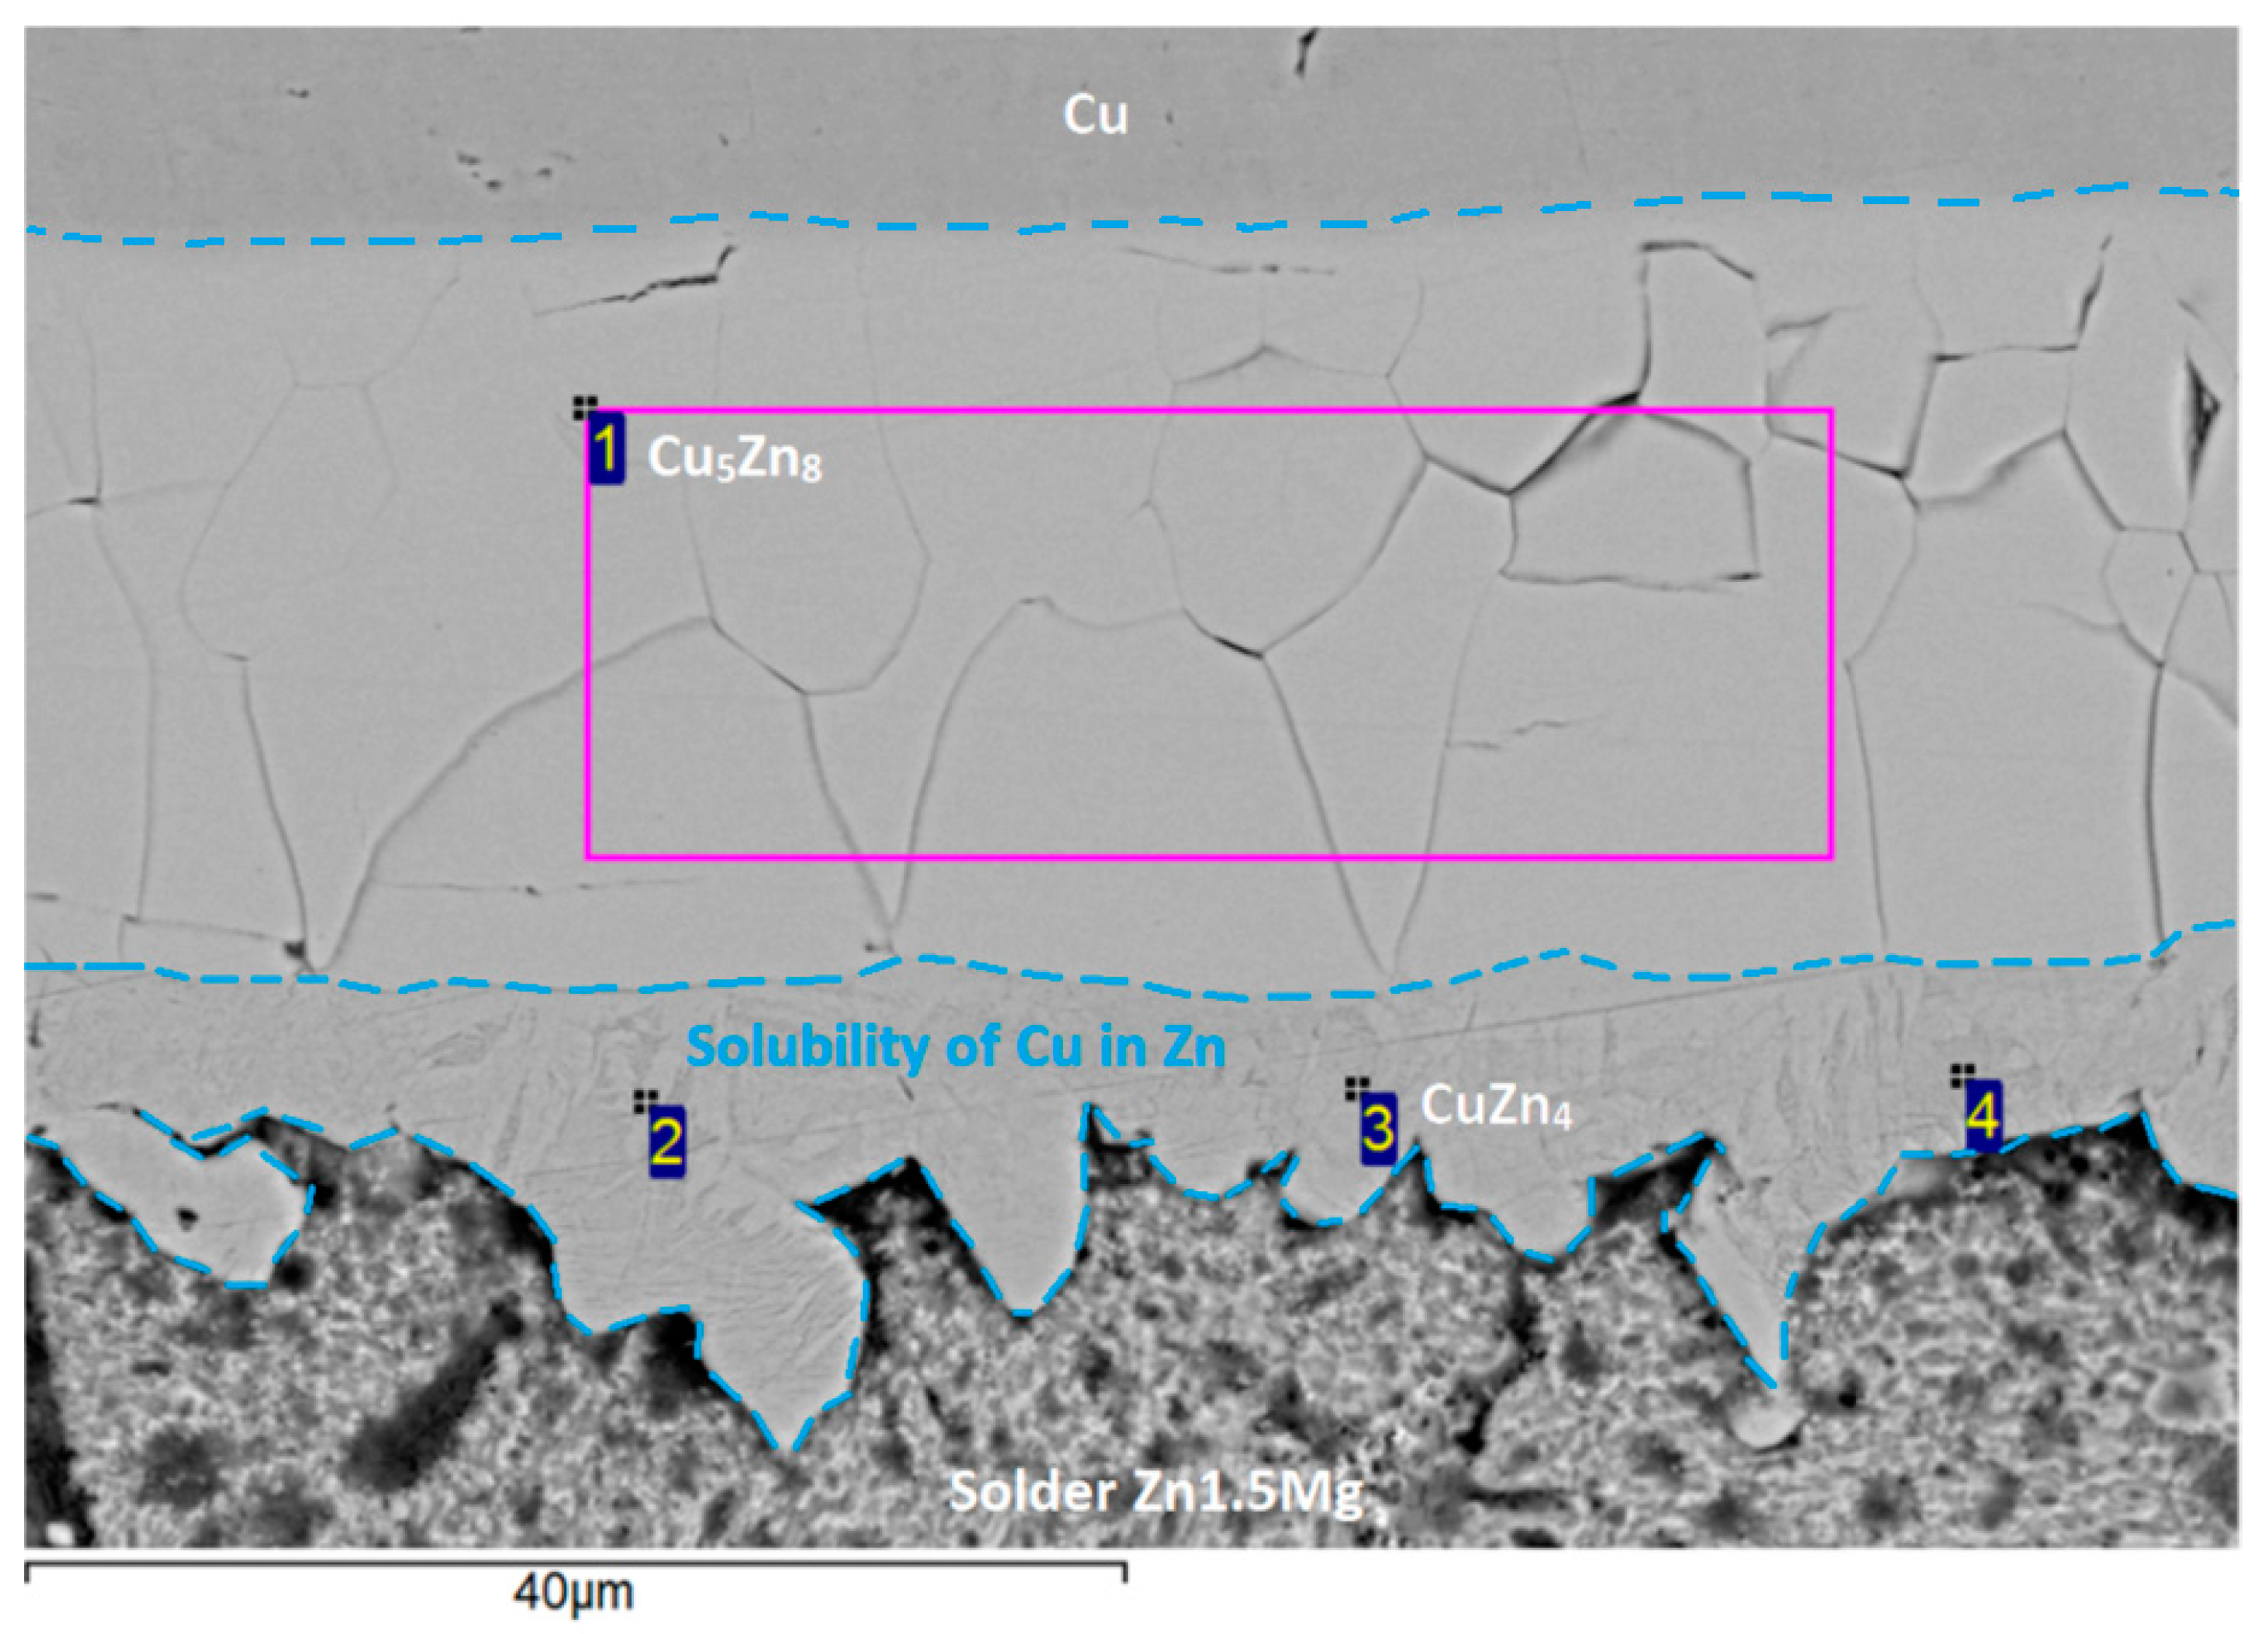
The analysis focused on the transition zone at the boundary of the Cu/Zn1.5Mg joint, where a significant interaction took place between the molten solder and the copper substrate, leading to the creation of a broad transition zone consisting of two novel Cu-Zn phases. The bonding process is primarily influenced by the presence of zinc from the solder. The copper solubility range in the zinc solder is minimally 35 µm. EDX analysis was utilized to examine the chemical composition of the distinct phases newly formed in the transition zone. The measurement results are presented in Figure 18 and Table 7 below.
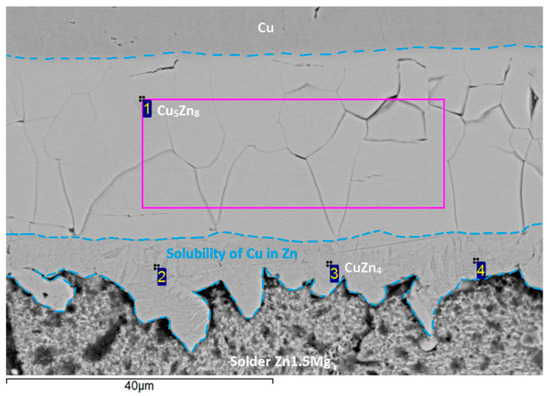
Figure 18.
EDX point analysis of boundary in Cu/Zn1.5Mg joint.
Table 7.
Results of point EDX analysis of Cu/Zn1.5Mg joint.
Measurement points for EDX analysis were chosen at four locations, ranging from Spectrum 1 to Spectrum 4.
In measurement point Spectrum 1, planar analysis was carried out in the one-phase zone, where the intermediary phase γ (electron compound type Cu5Zn8) was found in agreement with the binary diagram Cu–Zn [22]. It concerned a cubic lattice with 52 atoms.
The measurements in Spectrums 2 to 4 revealed a band zone containing about 84 at. % Zn and 16 at. % Cu. According to the binary diagram [22], it concerns a zone of ε phase (CuZn4 or Cu0.2Zn0.8, respectively).
In measurement point Spectrum 1, a zone of pure copper occurs–a composite matrix with Si admixture.
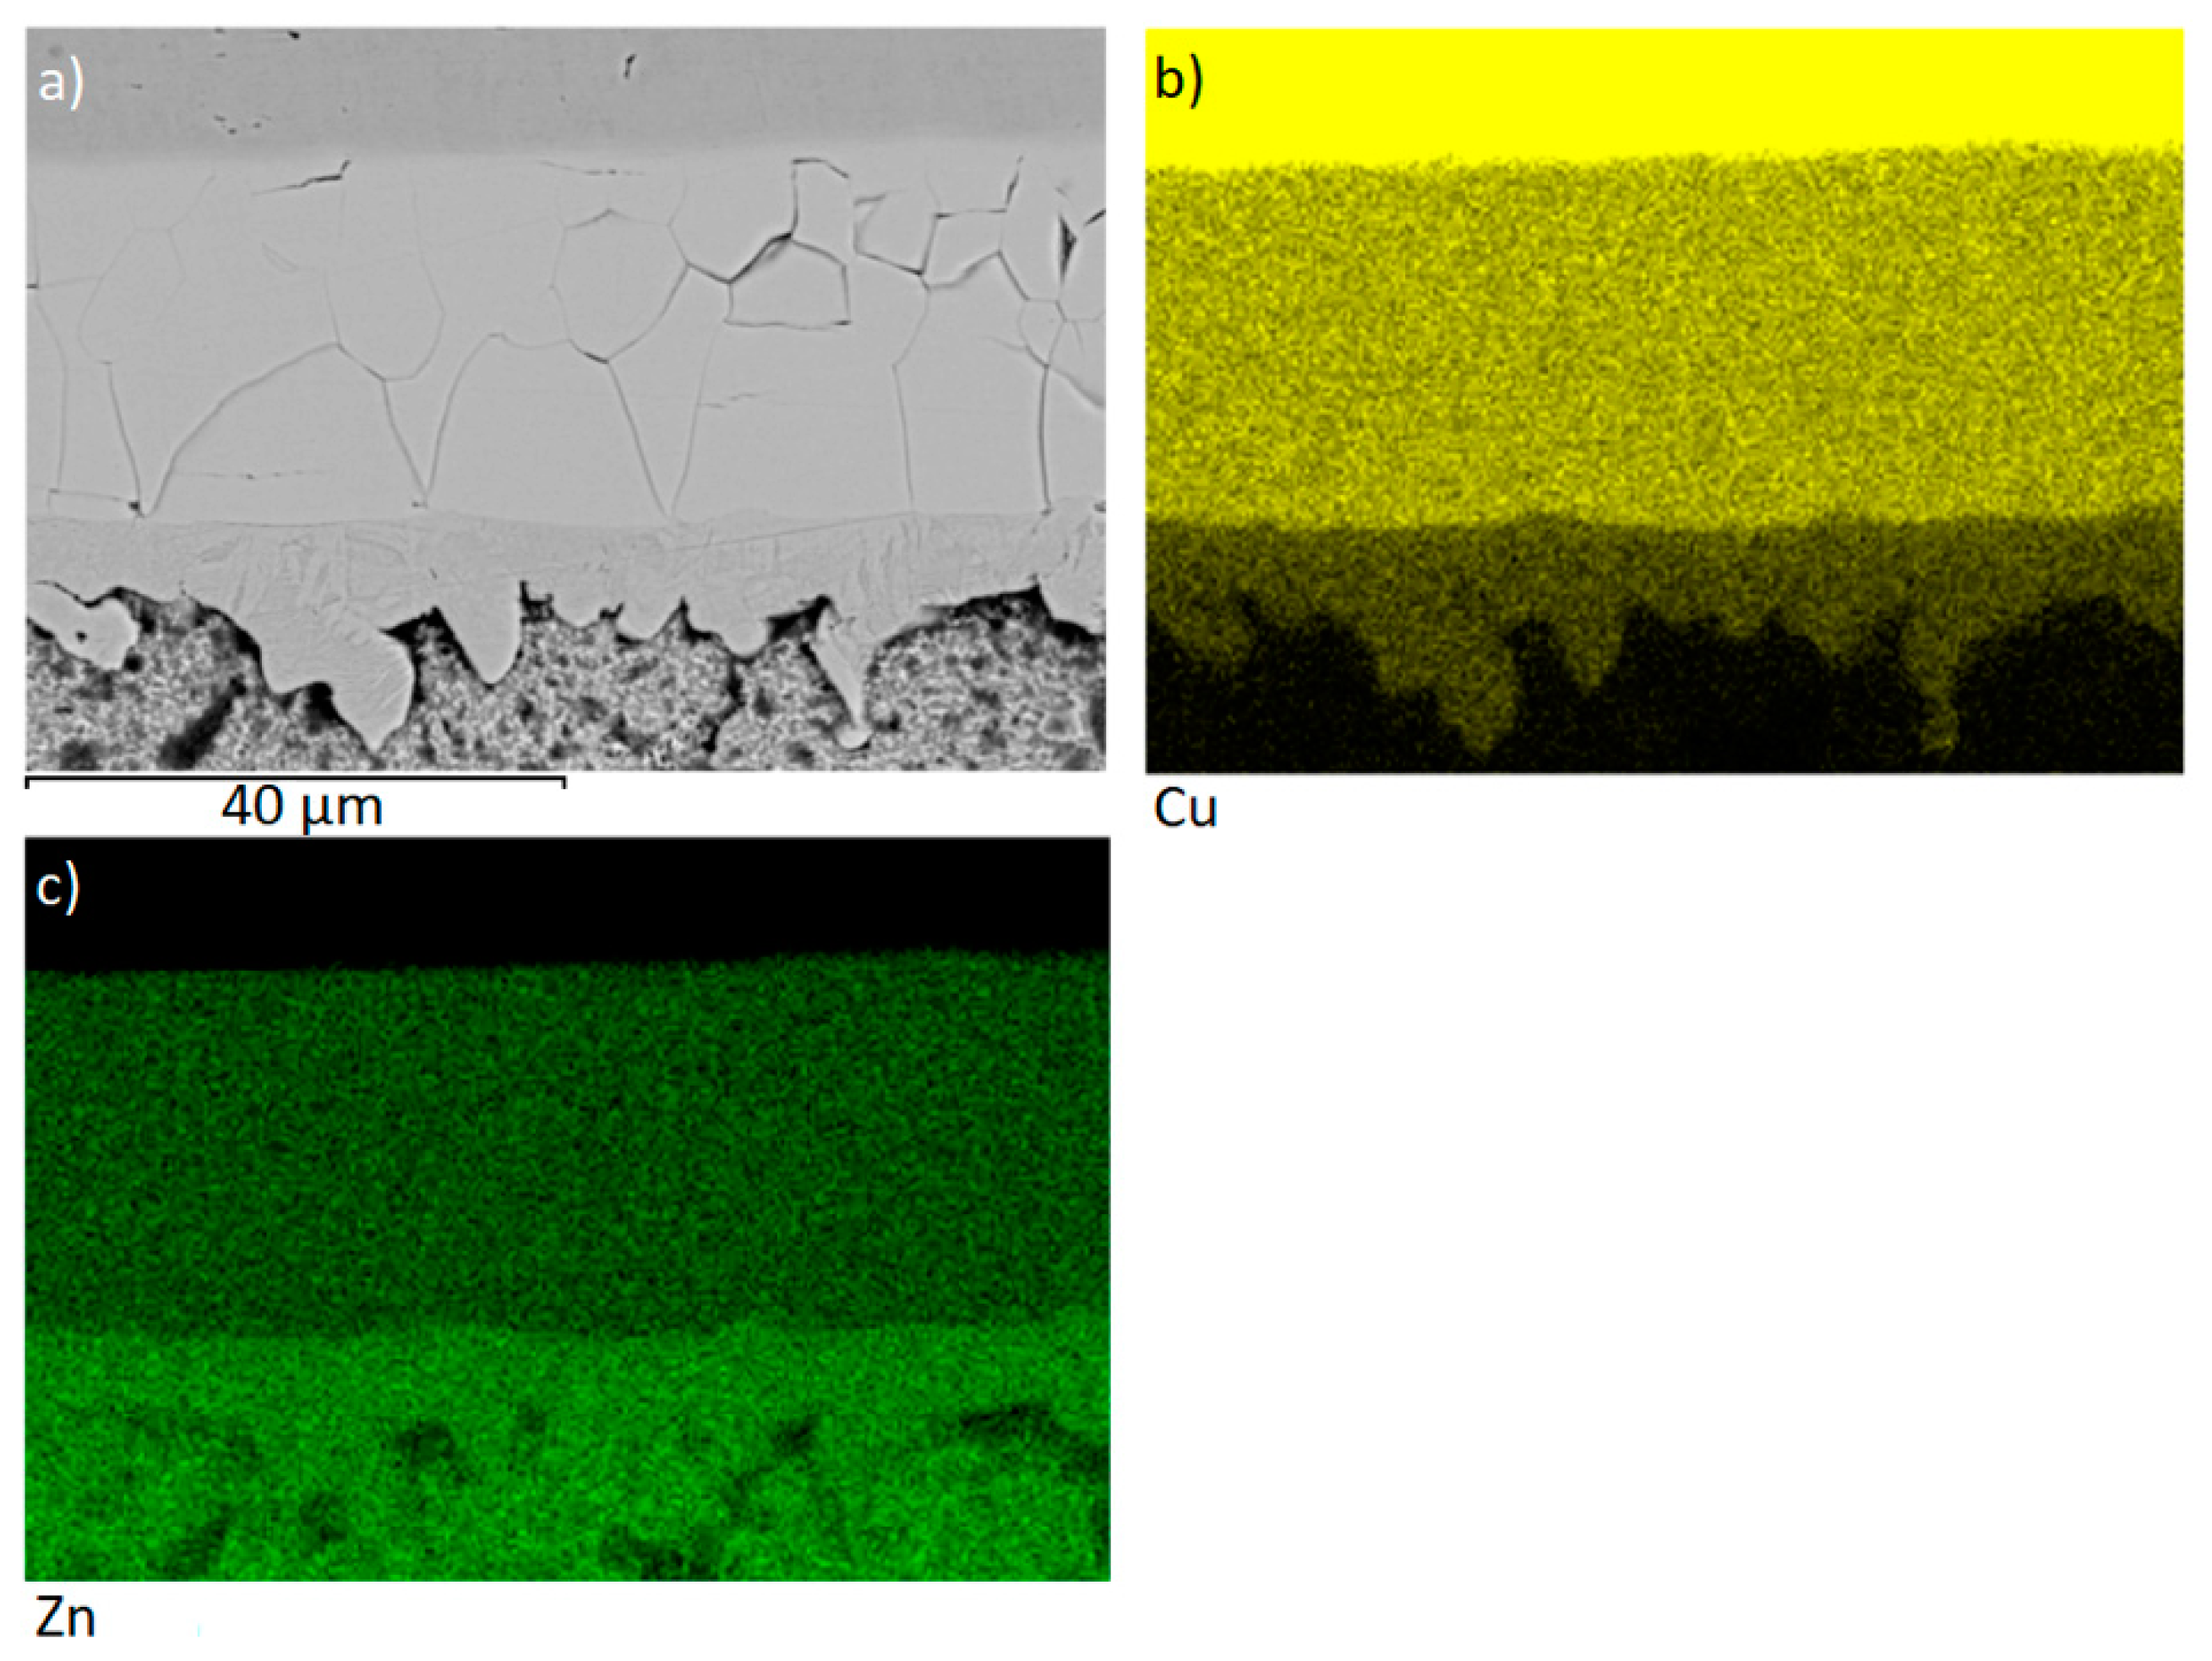
The map of Cu and Zn elements (Figure 19b,c) in the boundary of the Cu/Zn1.5Mg joint proves the presence of the γCu (Cu5Zn8) phase and the band zone of the ε (CuZn4) phase.
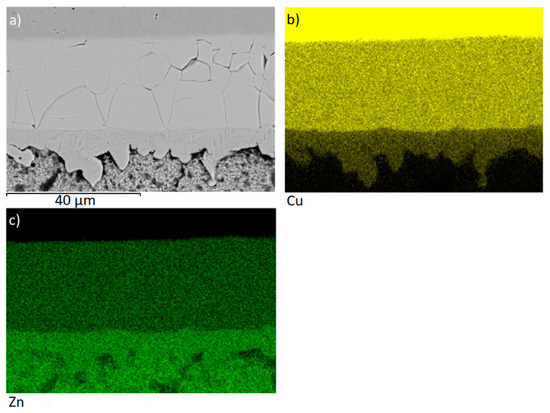
Figure 19.
Map of elements (a) in the boundary of Cu/Zn1.5Mg joint, (b) Cu, (c) Zn.
3.6. Shear Strength of Soldered Joints
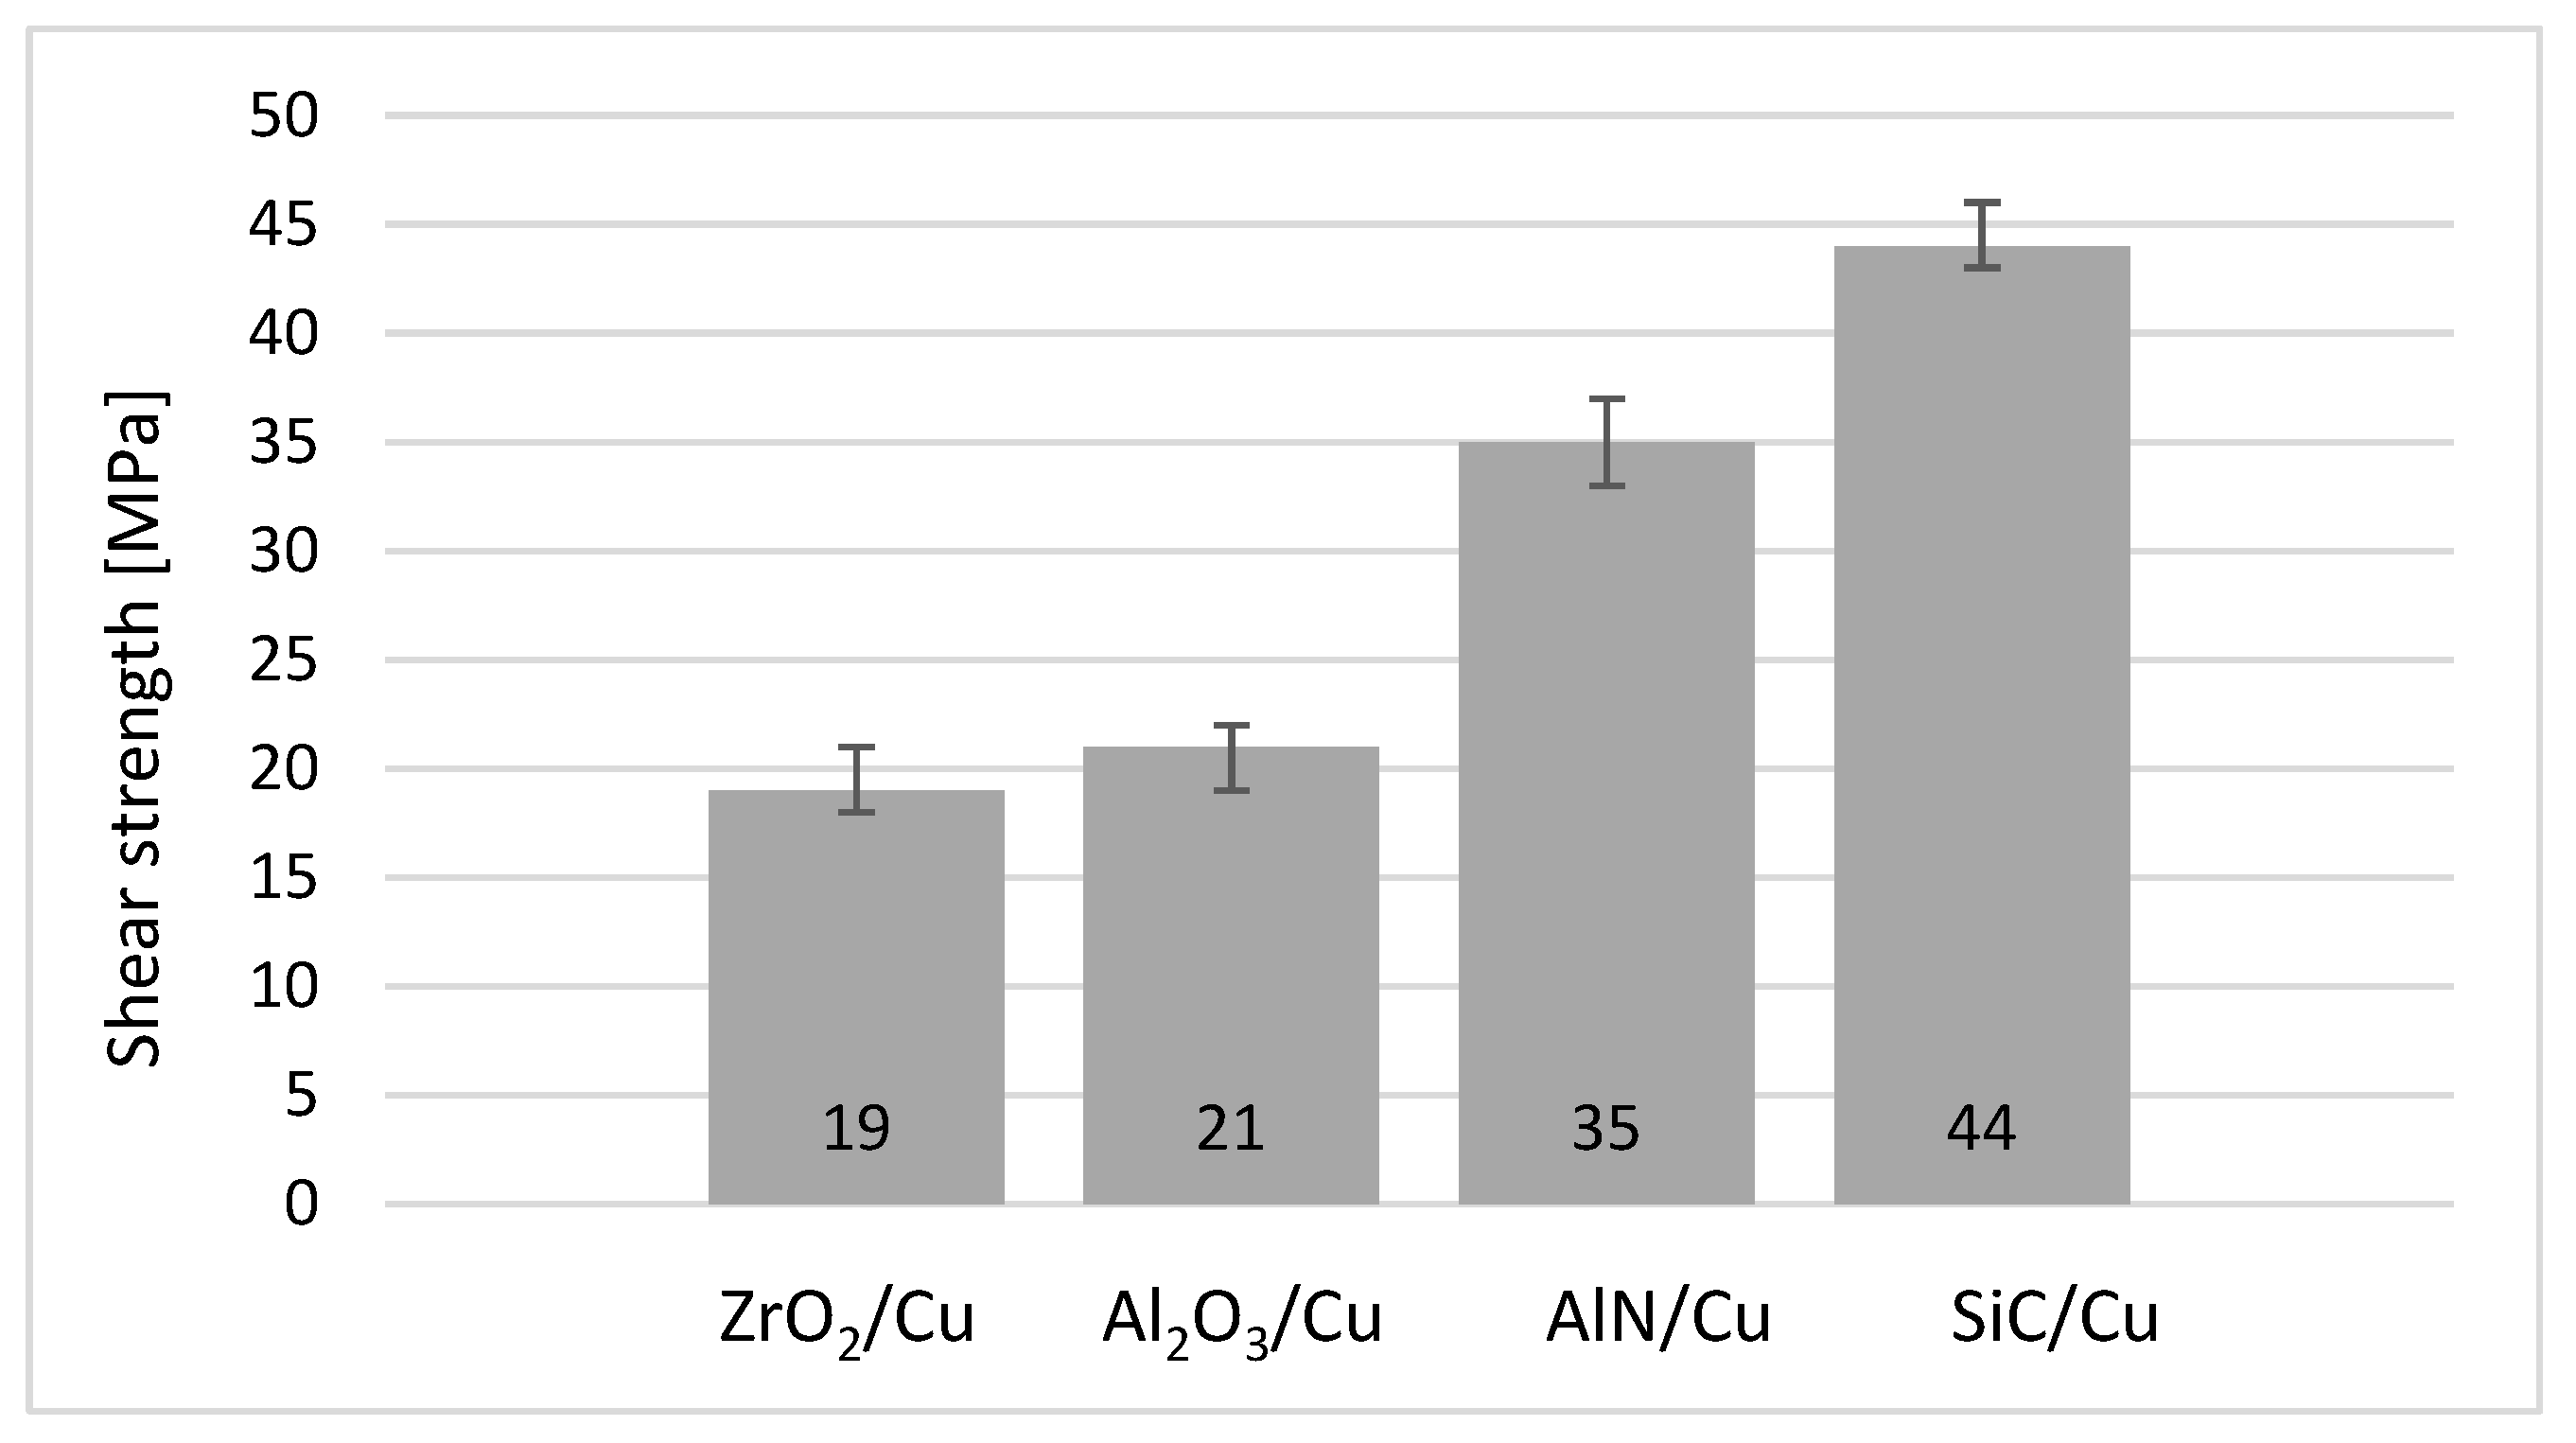
The primary focus of this study was on soldering a SiC ceramic with a copper substrate. To explore the versatility of Zn1.5Mg solder and its potential applications, shear strength testing was expanded to include other ceramic materials (ZrO2, Al2O3, and AlN). The various ceramic materials were soldered together with a Cu substrate, and measurements were conducted on three specimens of each material. The results of the average shear strength are presented in Figure 20. The SiC/Cu joint exhibited the highest average shear strength, reaching up to 44 MPa. In contrast, other combined joints showed considerably lower average shear strength values, ranging from 19 to 35 MPa. The fracture of the joint occurred on the ceramic material side. The ceramic remained partially covered with solder; the weakest point was on the ceramic/solder interface side. In oxide ceramics, the average shear strength values were lower than in nitridic ceramics, a phenomenon attributed to the reaction of magnesium with the surface of these ceramics.

Figure 20.
The shear strength of soldered joints fabricated by use of Zn1.5Mg solder.
In nitride and carbide ceramics, Mg reacts with the surface of the ceramic material to form a reaction-diffusion layer. In oxide ceramics, there is no diffusion bond, and therefore, the bond is less strong.
4. Conclusions
The objective of this research was to characterize the Zn-Mg type soldering alloy, specifically assessing its suitability for soldering SiC ceramics and a Cu substrate using ultrasonic soldering. The attained results are as follows:
- The melting temperature of the solder was determined using TG/DTA analysis, which revealed two significant peaks in the test record. The first peak corresponds to the reaction resulting in the formation of the MgZn2 phase, while the second peak corresponds to a eutectic reaction occurring at 365 °C. The liquidus temperature was determined to be 405 °C.
- The microstructure of type Zn1.5Mg soldering alloy is formed of a zinc matrix. Segregation of binary eutectics in the form of (Zn) + Mg2Zn11 lamellas occurred on the boundaries of Zn grains. The EDX and XRD analyses also proved the presence of magnesium phase type MgZn2 in the solder matrix.
- The formation of a SiC/solder bond occurred as a result of magnesium distribution from the solder to the interface with SiC ceramics, where Zn is also present. It was found that magnesium reacts with silicon, which is infiltered in SiC ceramics. By mutual interaction, the Mg2Si phase is formed.
- In the boundary of a Cu substrate/solder joint, a massive interaction between the molten zinc solder and copper substrate took place at the formation of a broad transition zone, which was formed of two new phases–namely, a non-wettable γCu (Cu5Zn8) phase 30 µm in width and a non-wettable ε (CuZn4) phase, 12 µm in width. The bond formation is thus affected mainly by Zn from the solder.
- The shear strength measurement was performed on several combinations of ceramic materials with the Cu substrate. The average shear strength of a combined SiC/Cu joint fabricated using Zn1.5Mg solder was 44 MPa. In oxidic ceramics, the average values of shear strength were considerably lower than in nitridic and carbidic ceramics. This is caused by the interaction of an active element (magnesium) with the surface of those ceramics.
Author Contributions
Conceptualization, R.K. and A.P.; methodology, R.K.; validation, R.K. and J.D.; formal analysis, J.D., P.G. and M.P.; investigation, R.K.; data curation, A.P.; writing—original draft preparation, R.K.; writing—review and editing, R.K.; visualization, M.S.; supervision, R.K.; project administration, A.P. All authors have read and agreed to the published version of the manuscript.
Funding
This work was supported by the Slovak Research and Development Agency under contract no. APVV-21-0054 and APVV-17-0025. The paper was also prepared with the support of the VEGA 1/0026/23: Modification of the structure and mechanical properties of solder alloys to increase the reliability of soldered joints in advanced electronic applications and VEGA 1/0237/24 Research of active soldering alloys filled with nanoparticles of ceramic materials.
Data Availability Statement
The original contributions presented in the study are included in the article, further inquiries can be directed to the corresponding author.
Acknowledgments
This contribution was elaborated in cooperation with the Technical University Ostrava (VŠB-TU Ostrava), FMT—Faculty of Materials Science and Technology, Department of Non-ferrous Metals, Refining and Recycling.
Conflicts of Interest
The authors declare no conflicts of interest.
References
- Yang, L.; Ma, S.; Mu, G. Improvements of microstructure and hardness of lead-free solders doped with Mo nanoparticles. Mater. Lett. 2021, 304, 130654. [Google Scholar] [CrossRef]
- Sonawane, P.; Raja, V.K.; Gupta, M. Mechanical properties and corrosion analysis of lead–free Sn-0.7Cu solder CSI joints on Cu substrate. Mater. Today Proc. 2021, 46, 1101–1105. [Google Scholar] [CrossRef]
- Pal, M.K.; Gergely, G.; Koncz-Horváth, D.; Gácsi, Z. Characterization of the interface between ceramic reinforcement and lead-free solder matrix. Surf. Interfaces 2020, 20, 100576. [Google Scholar] [CrossRef]
- Ghaleeh, M.; Baroutaji, A.; Al Qubeissi, M. Microstructure, isothermal and thermomechanical fatigue behaviour of leaded and lead-free solder joints. Eng. Fail. Anal. 2020, 117, 104846. [Google Scholar] [CrossRef]
- You, Y.; Kong, L.; Xu, J.; Xu, B.; Liu, G.; Yang, B. Prediction of activities of all components in Sn-Ag-Cu and Sn-Ag-Cu-Zn lead-free solders using modified molecular interaction volume model. Results Chem. 2021, 3, 100143. [Google Scholar] [CrossRef]
- Park, J.; Bae, S.; Son, I. Improved contact resistance and solderability of electrodeposited Au-Sn alloy layer with high thermal stability for electronic contacts. Appl. Surf. Sci. 2021, 551, 149405. [Google Scholar] [CrossRef]
- Kostolný, I.; Koleňák, R. Research of Interactions between Al Substrate and Zn-Al Solders. Procedia Eng. 2015, 100, 1319–1323. [Google Scholar] [CrossRef]
- Ma, L.; He, D.; Li, X.; Jiang, J. High-frequency induction soldering of magnesium alloy AZ31B using Zn-Al filler metal. Mater. Lett. 2010, 64, 596–598. [Google Scholar] [CrossRef]
- Wei, Y.; Liu, Y.; Zhao, X.; Tan, C.; Dong, Y.; Zhang, J. Effects of minor alloying with Ge and In on the interfacial microstructure between Zn-Sn solder alloy and Cu substrate. J. Alloys Compd. 2020, 831, 154812. [Google Scholar] [CrossRef]
- Yang, L.; Zhang, Y.; Dai, J.; Jing, Y.; Gao, J.; Zhang, N. Microstructure, interfacial IMC and mechanical properties of Sn-0.7Cu-xAl (x = 0 − 0.075) lead-free solder alloy. Mater. Des. 2015, 67, 209–216. [Google Scholar] [CrossRef]
- Amalu, E.; Ekere, N.N. Modelling evaluation of Garofalo-Arrhenius creep relation for lead-free solder joints in surface mount electronic components assemblies. J. Manuf. Syst. 2016, 39, 9–23. [Google Scholar] [CrossRef]
- Wu, B.; Leng, X.; Xiu, Z.; Yan, J. Microstructural evolution of SiC joints soldered using Zn-Al filler metals with the assistance of ultrasound. Ultrason. Sonochem. 2018, 44, 280–287. [Google Scholar] [CrossRef]
- Kumar, K.; Kripesh, V.; Shen, L.; Zeng, K.; Tay, A.A.O. Nanoindentation study of Zn-based Pb free solders used in fine pitch interconnect applications. Mater. Sci. Eng. A 2006, 423, 57–63. [Google Scholar] [CrossRef]
- Kolenak, R.; Kostolny, I.; Drapala, J.; Babincova, P.; Sahul, M. Characterizing the Soldering Alloy Type Zn–Al–Cu and Study of Ultrasonic Soldering of Al7075/Cu Combination. Metals 2021, 11, 27. [Google Scholar] [CrossRef]
- Chen, X.; Yan, J.; Ren, S.; Wang, Q.; Wei, J.; Fan, G. Microstructure, mechanical properties, and bonding mechanism of ultrasonic-assisted brazed joints of SiC ceramics with ZnAlMg filler metals in air. Ceram. Int. 2014, 40, 683–689. [Google Scholar] [CrossRef]
- Namhyun, K.; Hye, N.; Seong, K.; Chung, K. Alloy design of Zn–Al–Cu solder for ultra high temperatures. J. Alloys Compd. 2009, 467, 246–250. [Google Scholar] [CrossRef]
- Rahman, M.; Sharif, A. Characteristics of Zn–Sb based high temperature solder alloy. J. Mater. Sci. Mater. Electron. 2018, 29, 18417–18425. [Google Scholar] [CrossRef]
- Xiao, Y.; Li, M.Y.; Wang, L.; Huang, S.Y.; Du, X.M.; Liu, Z.Q. Interfacial reaction behavior and mechanical properties of ultrasonically brazed Cu/Zn–Al/Cu joints. Mater. Des. 2015, 73, 42–49. [Google Scholar] [CrossRef]
- Xiao, Y.; Ji, H.J.; Li, M.Y.; Kim, J. Ultrasound-assisted brazing of Cu/Al dissimilar metals using a Zn–3Al filler metal. Mater. Des. 2013, 52, 740–747. [Google Scholar] [CrossRef]
- Guo, W.B.; Luan, T.M.; He, J.S.; Yan, J.C. Ultrasonic-assisted soldering of fine-grained 7034 aluminum alloys using ZnAl filler metals. Mater. Des. 2017, 125, 85–93. [Google Scholar] [CrossRef]
- Kolenak, R.; Pluhar, A.; Drapala, J.; Babincova, P.; Pasak, M. Characterization of Zn-Mg-Sr Type Soldering Alloy and Study of Ultrasonic Soldering of SiC Ceramics and Cu-SiC Composite. Materials 2023, 16, 3795. [Google Scholar] [CrossRef] [PubMed]
- Massalski, T.B. Binary Alloy Phase Diagrams; ASM: Metals Park, OH, USA, 1996. [Google Scholar]
- Okamoto, H.; Schlesinger, M.; Mueller, E. ASM Handbook Volume 3: Alloy Phase Diagrams; ASM: Metals Park, OH, USA, 2016; ISBN 978-1-62708-070-5. [Google Scholar]


Disclaimer/Publisher’s Note: The statements, opinions and data contained in all publications are solely those of the individual author(s) and contributor(s) and not of MDPI and/or the editor(s). MDPI and/or the editor(s) disclaim responsibility for any injury to people or property resulting from any ideas, methods, instructions or products referred to in the content. |
© 2024 by the authors. Licensee MDPI, Basel, Switzerland. This article is an open access article distributed under the terms and conditions of the Creative Commons Attribution (CC BY) license (https://creativecommons.org/licenses/by/4.0/).