Article

A Multi-Agent Driving-Simulation Approach for Characterizing Hazardous Vehicle Interactions between Autonomous Vehicles and Manual Vehicles

1
Department of Smart City Engineering, Hanyang University Erica Campus, 55 Hanyangdaehak-ro, Sangnok-gu, Ansan 15588, Gyeonggi-do, Republic of Korea
2
Department of Road and Traffic Research, Korea Institute of Civil Engineering and Building Technology, (Daehwa-Dong) 283, Goyangdae-ro, Ilsanseo-gu, Goyang 10223, Gyeonggi-do, Republic of Korea
3
Department of Transportation and Logistics Engineering, Hanyang University Erica Campus, 55 Hanyangdaehak-ro, Sangnok-gu, Ansan 15588, Gyeonggi-do, Republic of Korea
4
Department of Highway & Transportation Research, Korea Institute of Civil Engineering and Building Technology, (Daehwa-Dong) 283, Goyangdae-ro, Ilsanseo-gu, Goyang 10223, Gyeonggi-do, Republic of Korea
*
Author to whom correspondence should be addressed.
Appl. Sci. 2024, 14(4), 1468; https://doi.org/10.3390/app14041468
Submission received: 17 January 2024 / Revised: 7 February 2024 / Accepted: 8 February 2024 / Published: 11 February 2024
(This article belongs to the Special Issue Advances in Intelligent Transportation Systems)

Abstract

:
The advent of autonomous vehicles (AVs) in the traffic stream is expected to innovatively prevent crashes resulting from human errors in manually driven vehicles (MVs). However, substantial safety benefits due to AVs are not achievable quickly because the mixed-traffic conditions in which AVs and MVs coexist in the current road infrastructure will continue for a considerably long period of time. The purpose of this study is to develop a methodology to evaluate the driving safety of mixed car-following situations between AVs and MVs on freeways based on a multi-agent driving-simulation (MADS) technique. Evaluation results were used to answer the question ‘What road condition would make the mixed car-following situations hazardous?’ Three safety indicators, including the acceleration noise, the standard deviation of the lane position, and the headway, were used to characterize the maneuvering behavior of the mixed car-following pairs in terms of driving safety. It was found that the inter-vehicle safety of mixed pairs was poor when they drove on a road section with a horizontal curve length of 1000 m and downhill slope of 1% or 3%. A set of road sections were identified, using the proposed evaluation method, as hazardous conditions for mixed car-following pairs consisting of AVs and MVs. The outcome of this study will be useful for supporting the establishment of safer road environments and developing novel V2X-based trafficsafetyinformation content that enables the enhancement of mixed-traffic safety.

1. Introduction

According to the crash statistics reported by the Korea Expressway Corporation, rear-end crashes accounted for approximately 76% of the total number of crashes that occurred on Korean freeways from 2013 to 2019 [1]. The advent of autonomous vehicles (AVs) is expected to innovatively reduce such rear-end crashes resulting from human-driver errors because AVs make evasive maneuvers more rapidly than MVs [2,3]. However, it is difficult to observe substantial safety benefits obtainable with AVs in the short-term because the mixed-traffic conditions in which AVs and manually driven vehicles (MV) coexist in the current road infrastructure will continue for a considerably long period of time. Therefore, the first step toward the enhancement of traffic safety on freeways is to understand the interactions between AVs and MVs under these circumstances. More specifically, the mixed car-following behavior between an AV and MV is of keen interest for evaluating the risk of rear-end crashes. The change in road alignments, including horizontal and vertical curves, is a significant factor affecting driving behavior [4,5]. Vehicles traveling in a section where the road-alignment changes are required to adjust the acceleration and operate the steering wheel. In this case, the driver’s improper decision making could lead to hazardous situations, leading to a greater crash potential. AVs driven by machines in support of sensor-based awareness of the surrounding environment will have significantly different driving behaviors from MVs driven by humans with various uncertainties. It is, therefore, important to understand the characteristics of a mixed car-following pair, which consists of an MV following an AV or an AV following an MV. An emerging question is ‘What road conditions would make the mixed car-following situations hazardous?’ This question motivates our study. The existing road conditions are devised to ensure the safety of the MV. However, vehicle interactions between AVs and MVs need to be evaluated to identify which geometric conditions are vulnerable in terms of mixed traffic safety. A hypothesis established in this study is that the different interactions observed for each driving pair of AVs and MVs would lead to different road conditions that are vulnerable to safety.
This study proposes a methodology to evaluate the driving safety of mixed car-following situations between AVs and MVs on freeways, which is fundamental to fully exploiting the benefit of crash prevention using AVs. The proposed methodology can be applied to identify hazardous road-alignment conditions for mixed car-following pairs. A multi-agent driving-simulation (MADS) technique, which is able to synchronize the space and time domains on the road by connecting two driving simulators, is conducted to evaluate driving safety. MADS experiments allow for effectively observing the interactions that occur when the subject vehicle follows the preceding vehicle. This study defined a driving simulator as an agent. The S C A N e R T M STUDIO program is used to simulate the road network and the maneuvering of the AV. Driving information for each vehicle is collected with driving experiments on AV pairs, mixed pairs, and MV pairs. A total of three safety indicators, including acceleration noise (AN), standard deviation of lane position (Std.LP), and average headways (Avg.HW), are used to identify the vehicle interaction of mixed car-following situations in terms of traffic safety. The evaluation results allow for identifying road-alignment conditions where mixed car-following pairs would experience relatively more hazardous situations.

2. Literature Review

This study aims to analyze the interaction between vehicles concerning the change in road alignments in mixed traffic conditions and to develop a driving-safety-evaluation method. From these perspectives, existing studies addressing mixed traffic and driving safety by road alignments are reviewed to draw research opportunities.

2.1. Interaction between AVs and MVs in Mixed Traffic Flow Crash Potential Index

Various studies have been conducted on evaluating safety using the market penetration rate (MPR) of AVs in mixed-traffic flow. The conflict rate decreased in the car-following situation when the MPR of AVs increased [6]. Yao et al. (2020) derived the analysis result that the standard deviation of speed was smaller when vehicles of the same type were driven than mixed traffic flow composed of different types of vehicles [7]. Guériau et al. (2020) found that the congestion level on freeways increased at 2.5% and 7% of AVs, whereas the congestion decreased when AVs occupied 20% of the traffic stream [8]. Mousavi et al. (2021) evaluated the impact of AVs’ MPRs on the number of traffic conflicts [9]. As the mixing rate of AVs increases, the number of rear-end conflicts decreases by 84–100%, and the number of lane-change conflicts decreases by 42–100%. Hou (2023) established a framework, which is composed of a traffic simulation and crash models, to assess the safety of mixed-traffic flow [10]. The increase in AVs’ MPRs leads to improved multi-vehicle safety and single-vehicle safety. Mahdinia et al. (2021) conducted an experiment to evaluate the car-following behavior of an MV following an AV in terms of traffic safety [11]. Driving safety is improved by decreasing the variation in speed and acceleration in addition to the increase in time-to-collision (TTC). Park et al. (2004) found that mixed traffic triggers unstable traffic flows and increases the frequency of conflict [12]. Gouy et al. (2014) revealed that an increase in the standard deviation of speed results in a decrease in safety based on an analysis of MV safety in mixed traffic [13].

2.2. Driving Safety by Road Alignments

A literature review of the existing studies on the effects of road-alignment changes on driving behavior and safety was conducted. Findley et al. (2012) presented that the horizontal curve is a critical element leading to hazardous situations because it would increase the driver’s workload [14]. Jung et al. (2021a) evaluated road alignments in terms of lateral driving safety based on heuristic and statistical analysis techniques [15]. It was identified that an increase in the length of the horizontal curve reduces the lateral driving safety of the vehicle. The driver’s ability to control the vehicle is reduced in the section where the horizontal curve radius is small and the longitudinal slope is downhill [5]. Jeong et al. (2017a) presented a curve radius that affects the lane departure and the average driving speed [4]. As the curve radius decreased, the frequency of crashes tended to increase [16]. Choudhari et al. (2020) analyzed the risk level regarding road-alignment parameters of two-lane horizontal curves. The risk sharply increase as the radius reduces below 100 m [17]. The lane-departure rate was the highest in the case of an uphill section with a curve radius of less than 3000 m. Gooch et al. (2016) found that the crash frequency decreases as the curve radius increases based on the relationship between the curve radius and crash frequency [18].

2.3. Research Opportunities
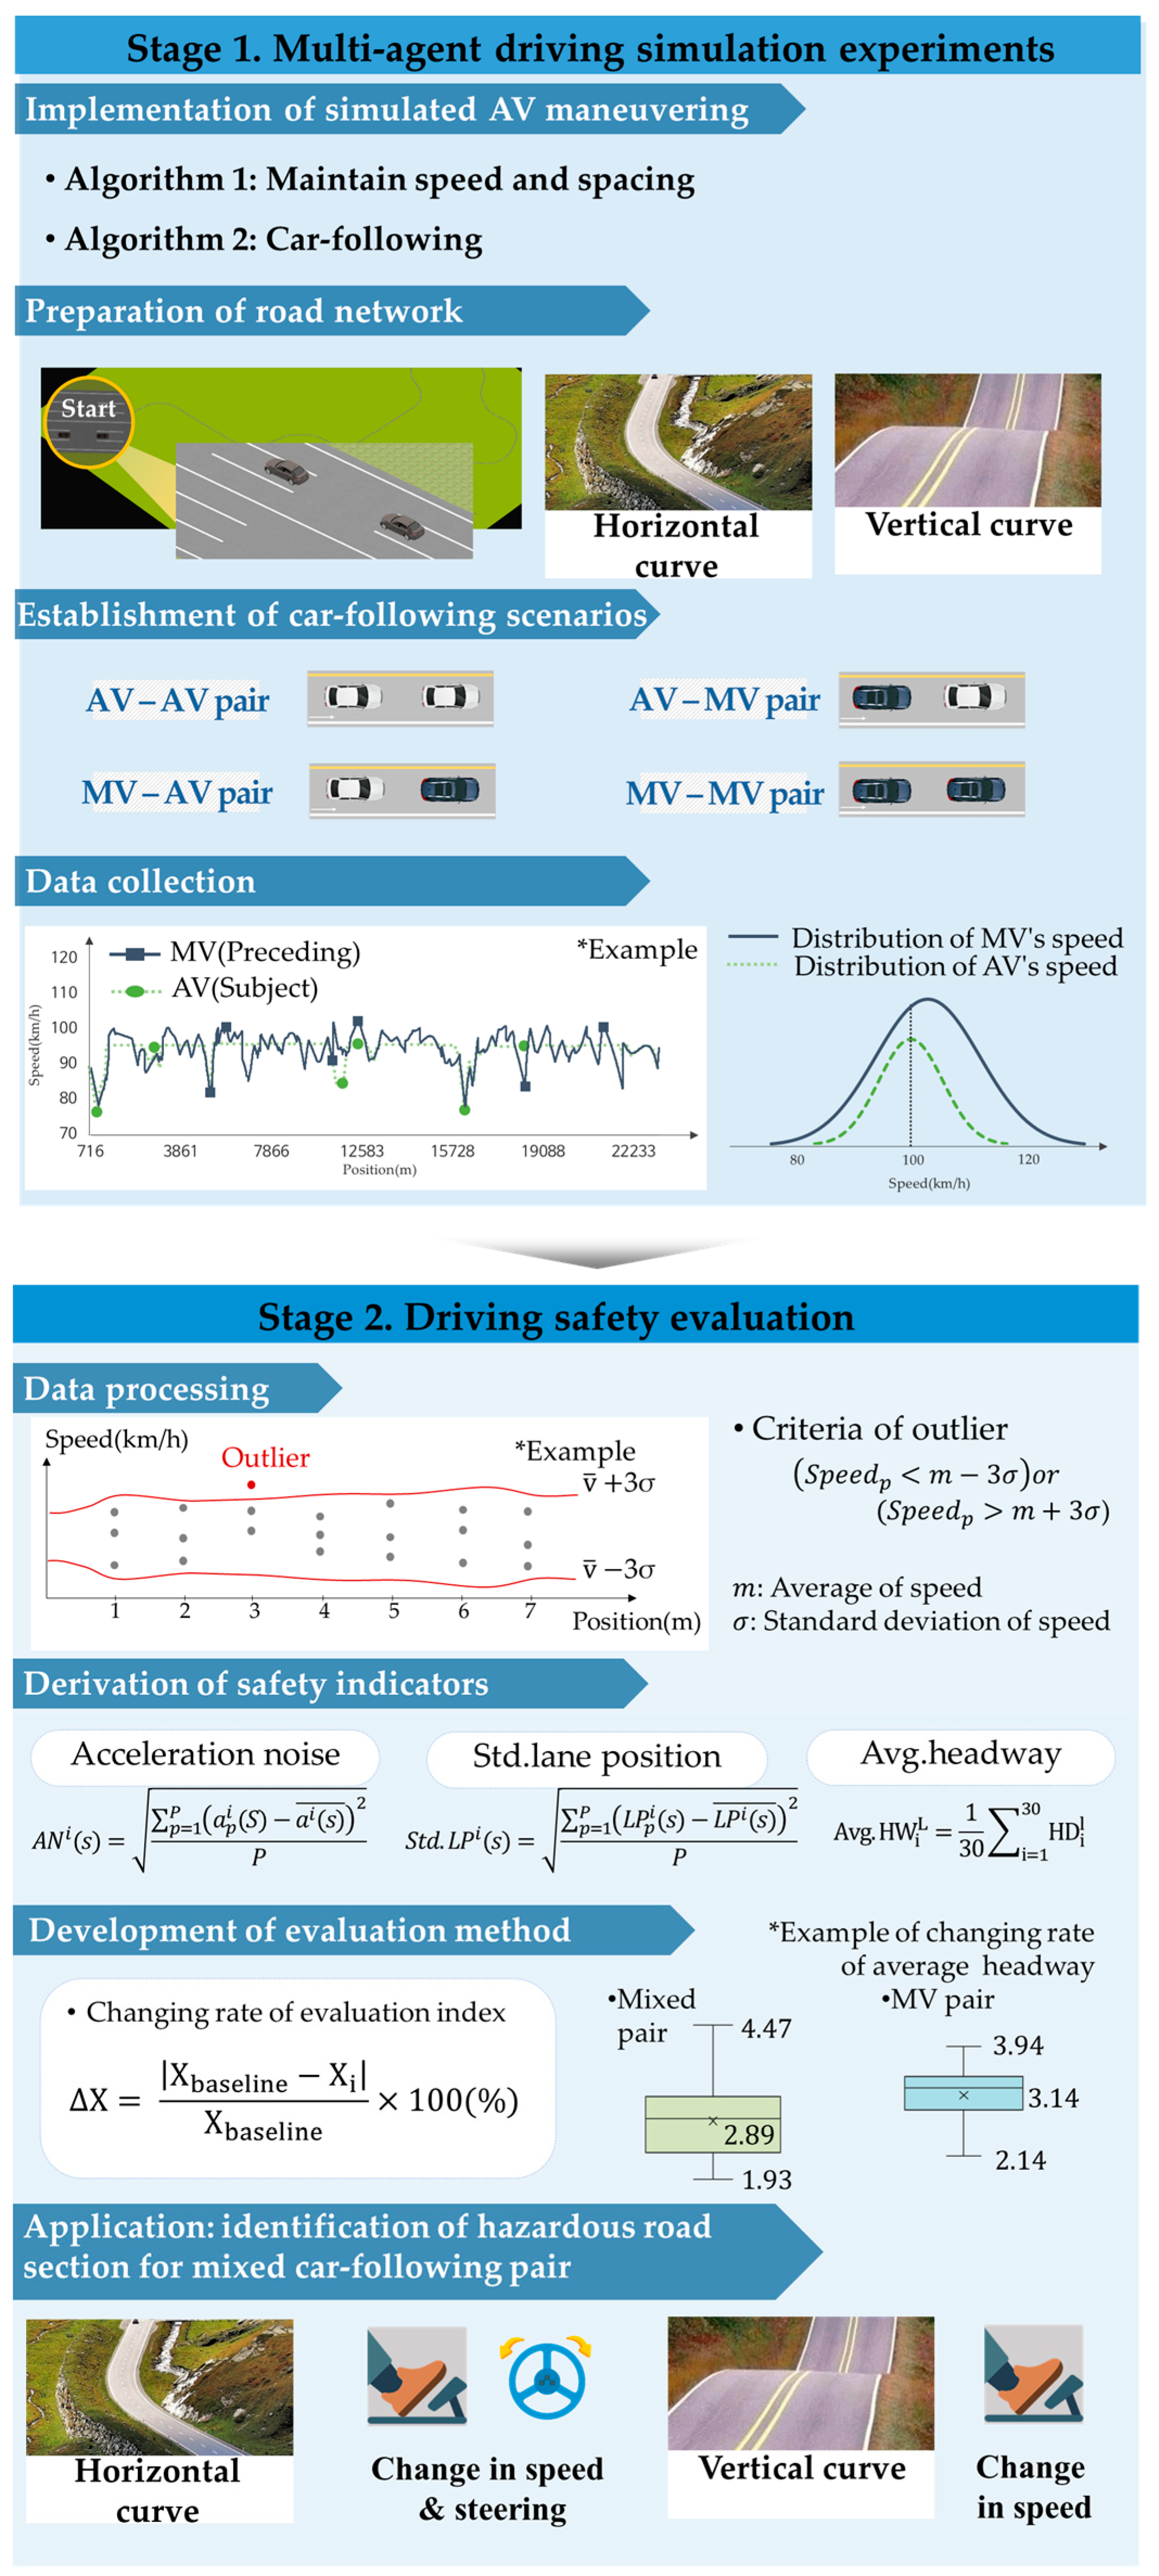
It was found that the safety of mixed traffic flow changed according to the market share of AVs in the traffic stream. In addition, the road-alignment condition is a significant factor associated with driving safety. Therefore, it is necessary to evaluate driving safety in the mixed traffic flow at the initial stage of the introduction of AVs. It should also be noted that vehicle interactions need to be investigated in different road-alignment conditions in terms of driving safety to derive effective countermeasures. Although previous studies to address mixed traffic flow have been widely conducted, less effort has been made to evaluate the vehicle interactions of AVs and MVs from the viewpoint of driving safety. Unlike existing studies, this study attempted to evaluate driving safety for different road-alignment conditions in the car-following situations of AVs and MVs, which is useful for drawing valuable insights for AV-related simulations, road design, and mixed traffic flow management.

3. Methodology

The proposed analysis framework is presented in Figure 1. This study consists of two stages. Stage 1 includes a method on how to simulate the maneuvering of AV in the driving simulation environment. An AV-driving control logic is implemented using the S C A N e R T M STUDIO program based on a thorough review of the characteristics of AV maneuvering that can be identified using the literature. Simulated road networks based on various alignment conditions and scenarios with different car-following pairs are created in the first stage. The proposed evaluation method including driving safety indicators and a comparison approach is presented in the second stage. Safety indicators are derived from the data derived from driving simulation experiments using outlier detection and correction. Regarding the safety evaluation, the rate of change of the safety indicator found using the target analysis road section compared to the baseline, which is a tangent and flat section, is used as the evaluation index in this study. It is then determined that the driving safety of mixed car-following pairs with a large change rate of the evaluation index would be reduced.

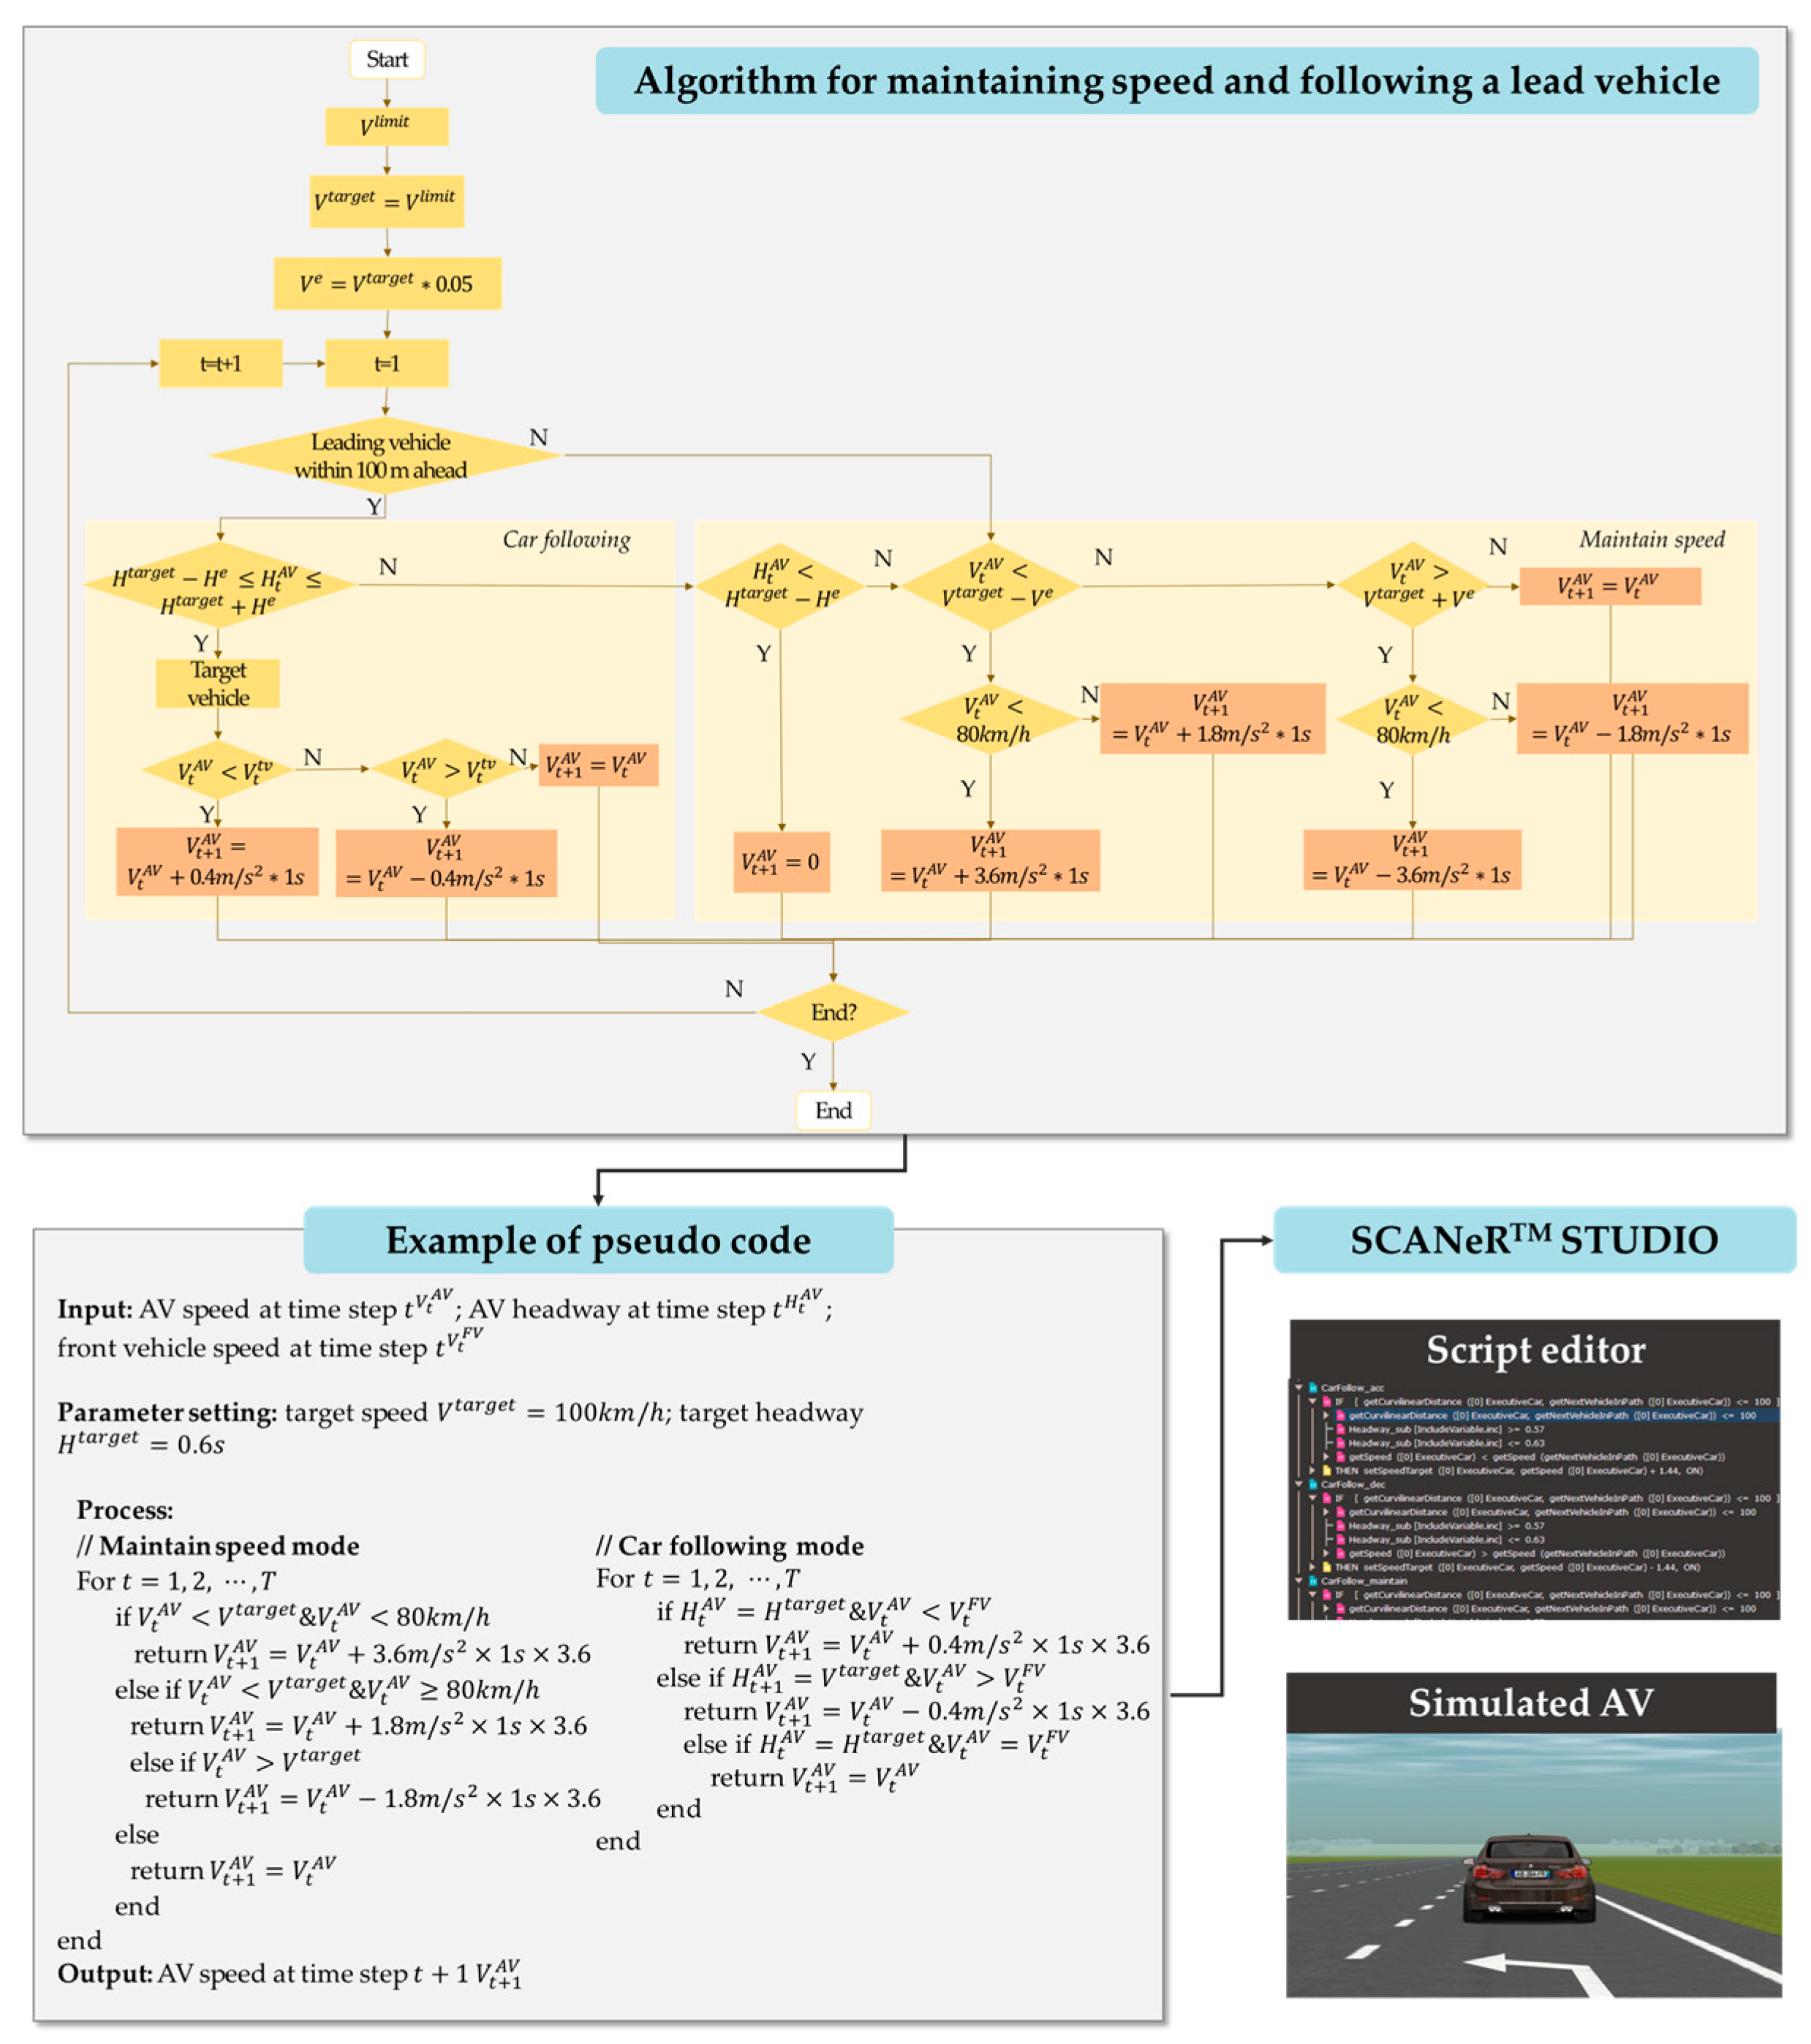
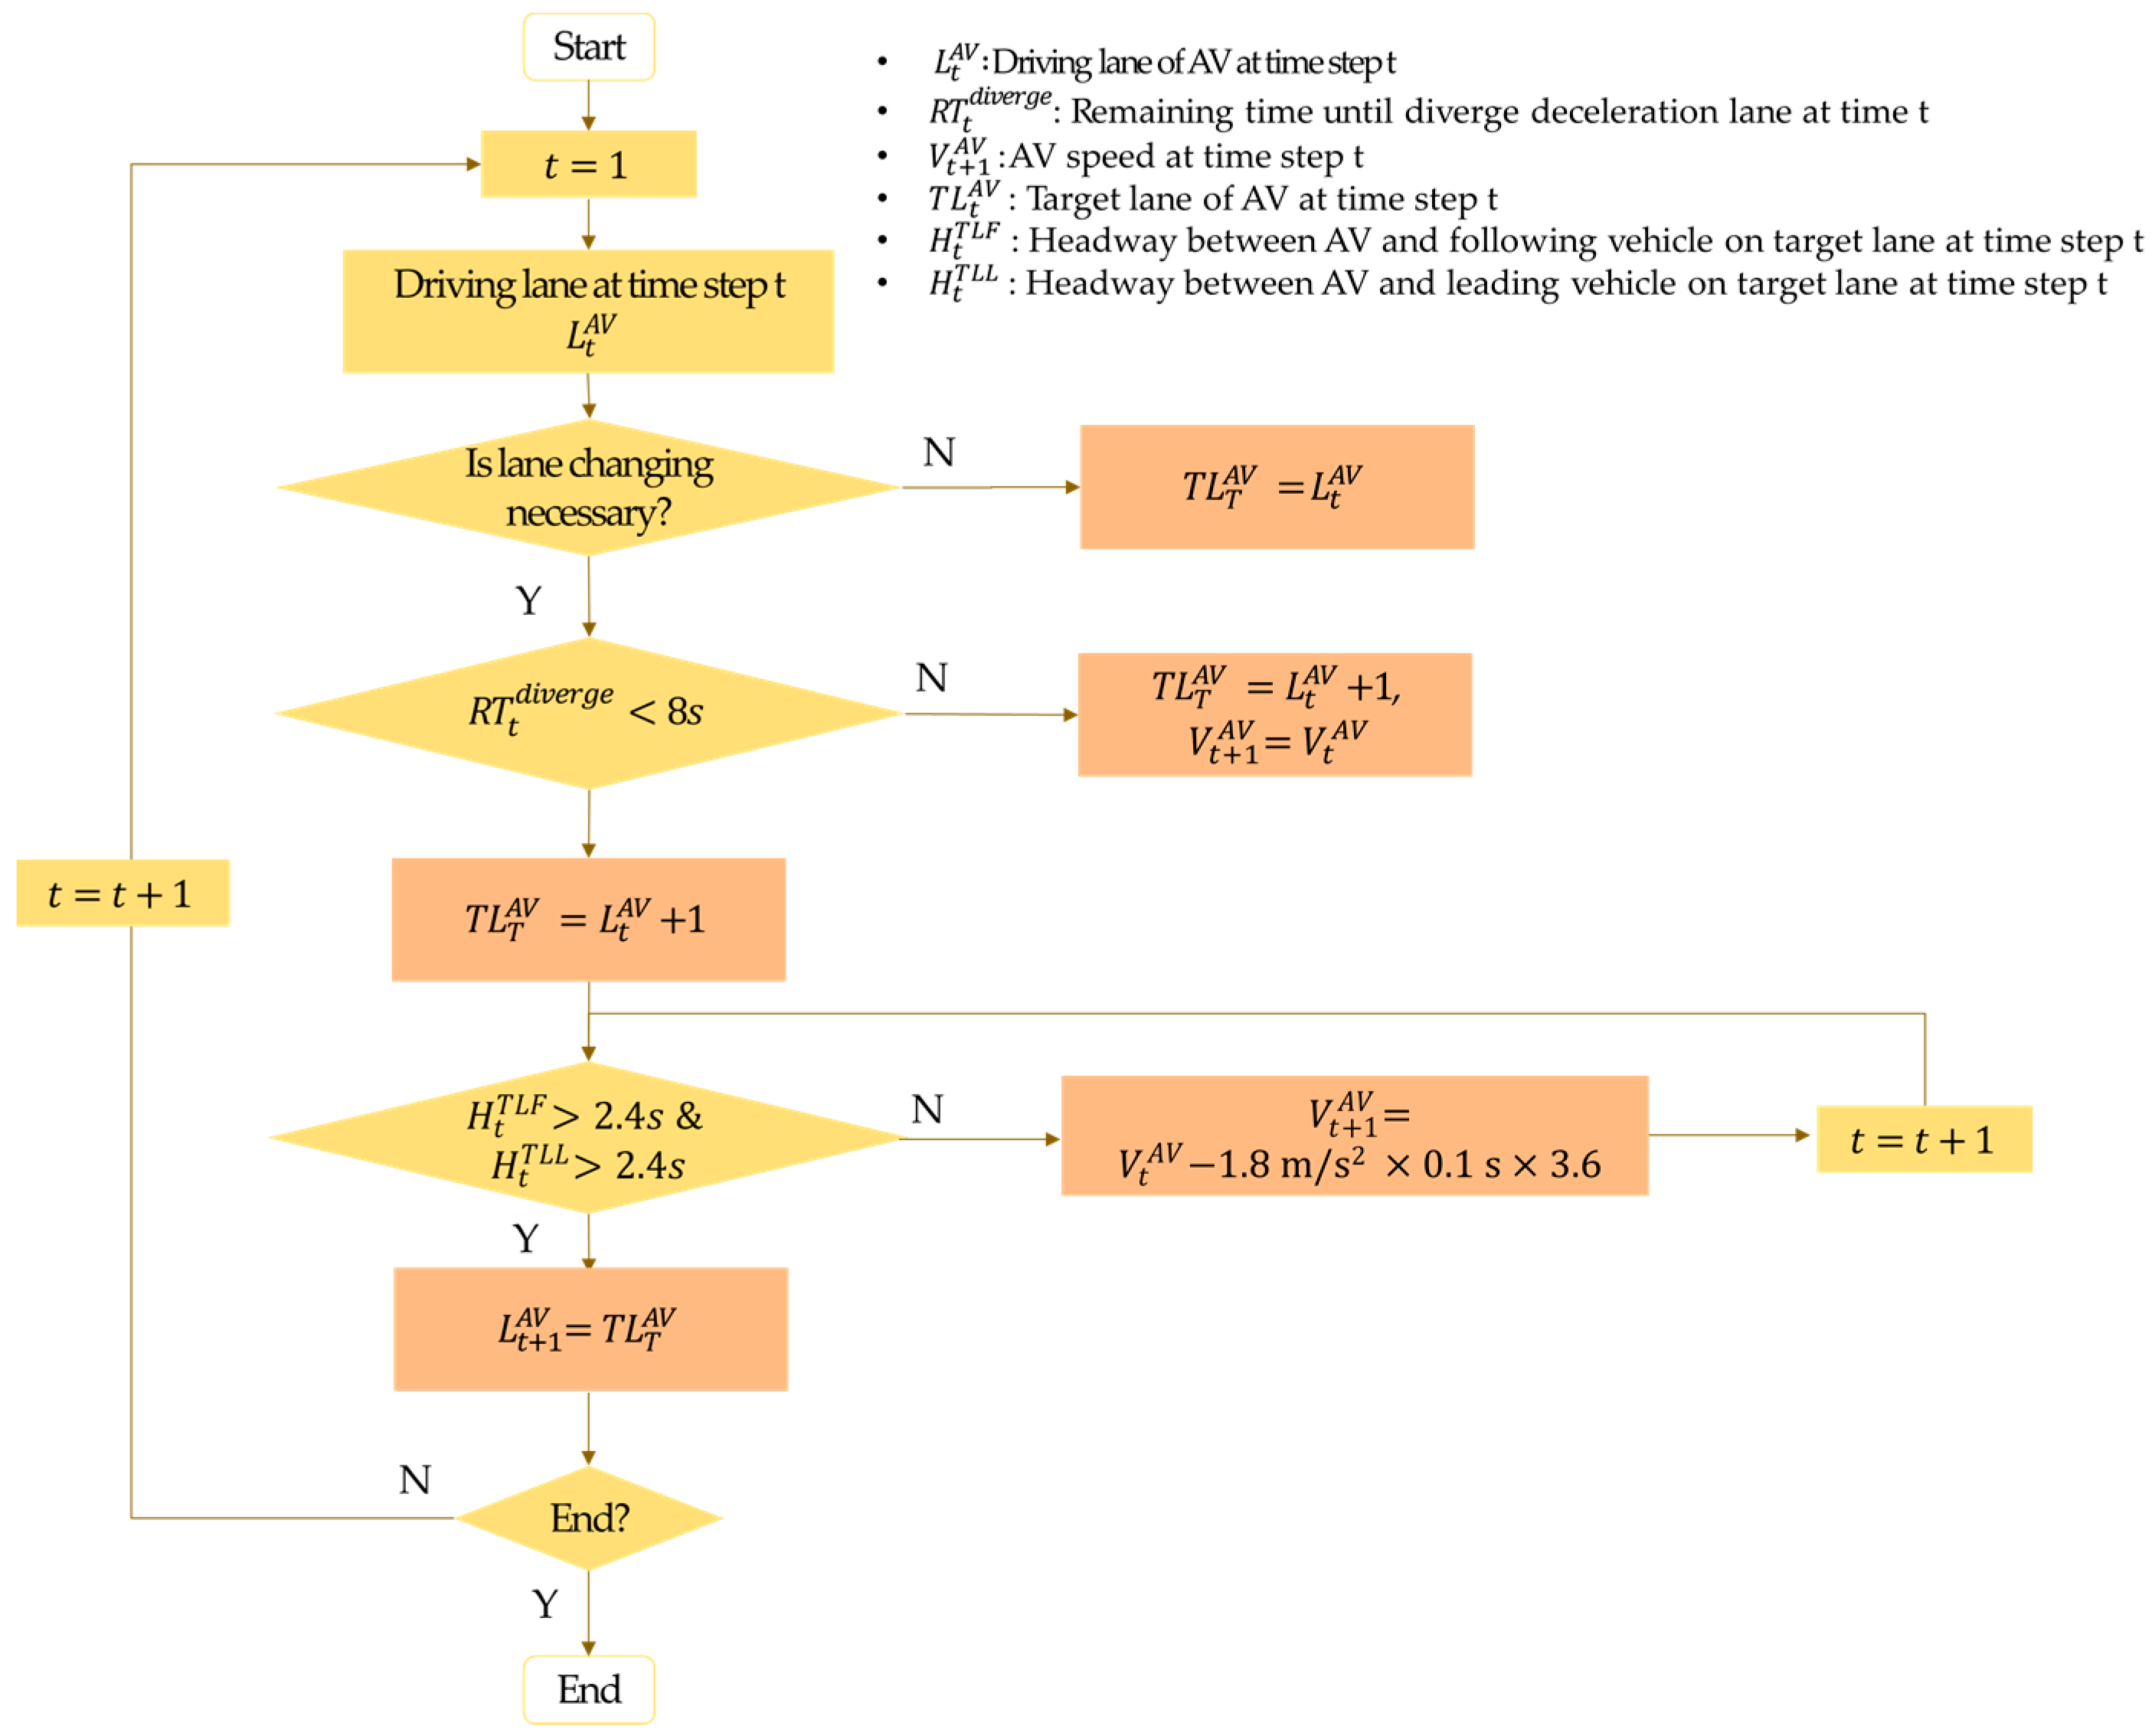
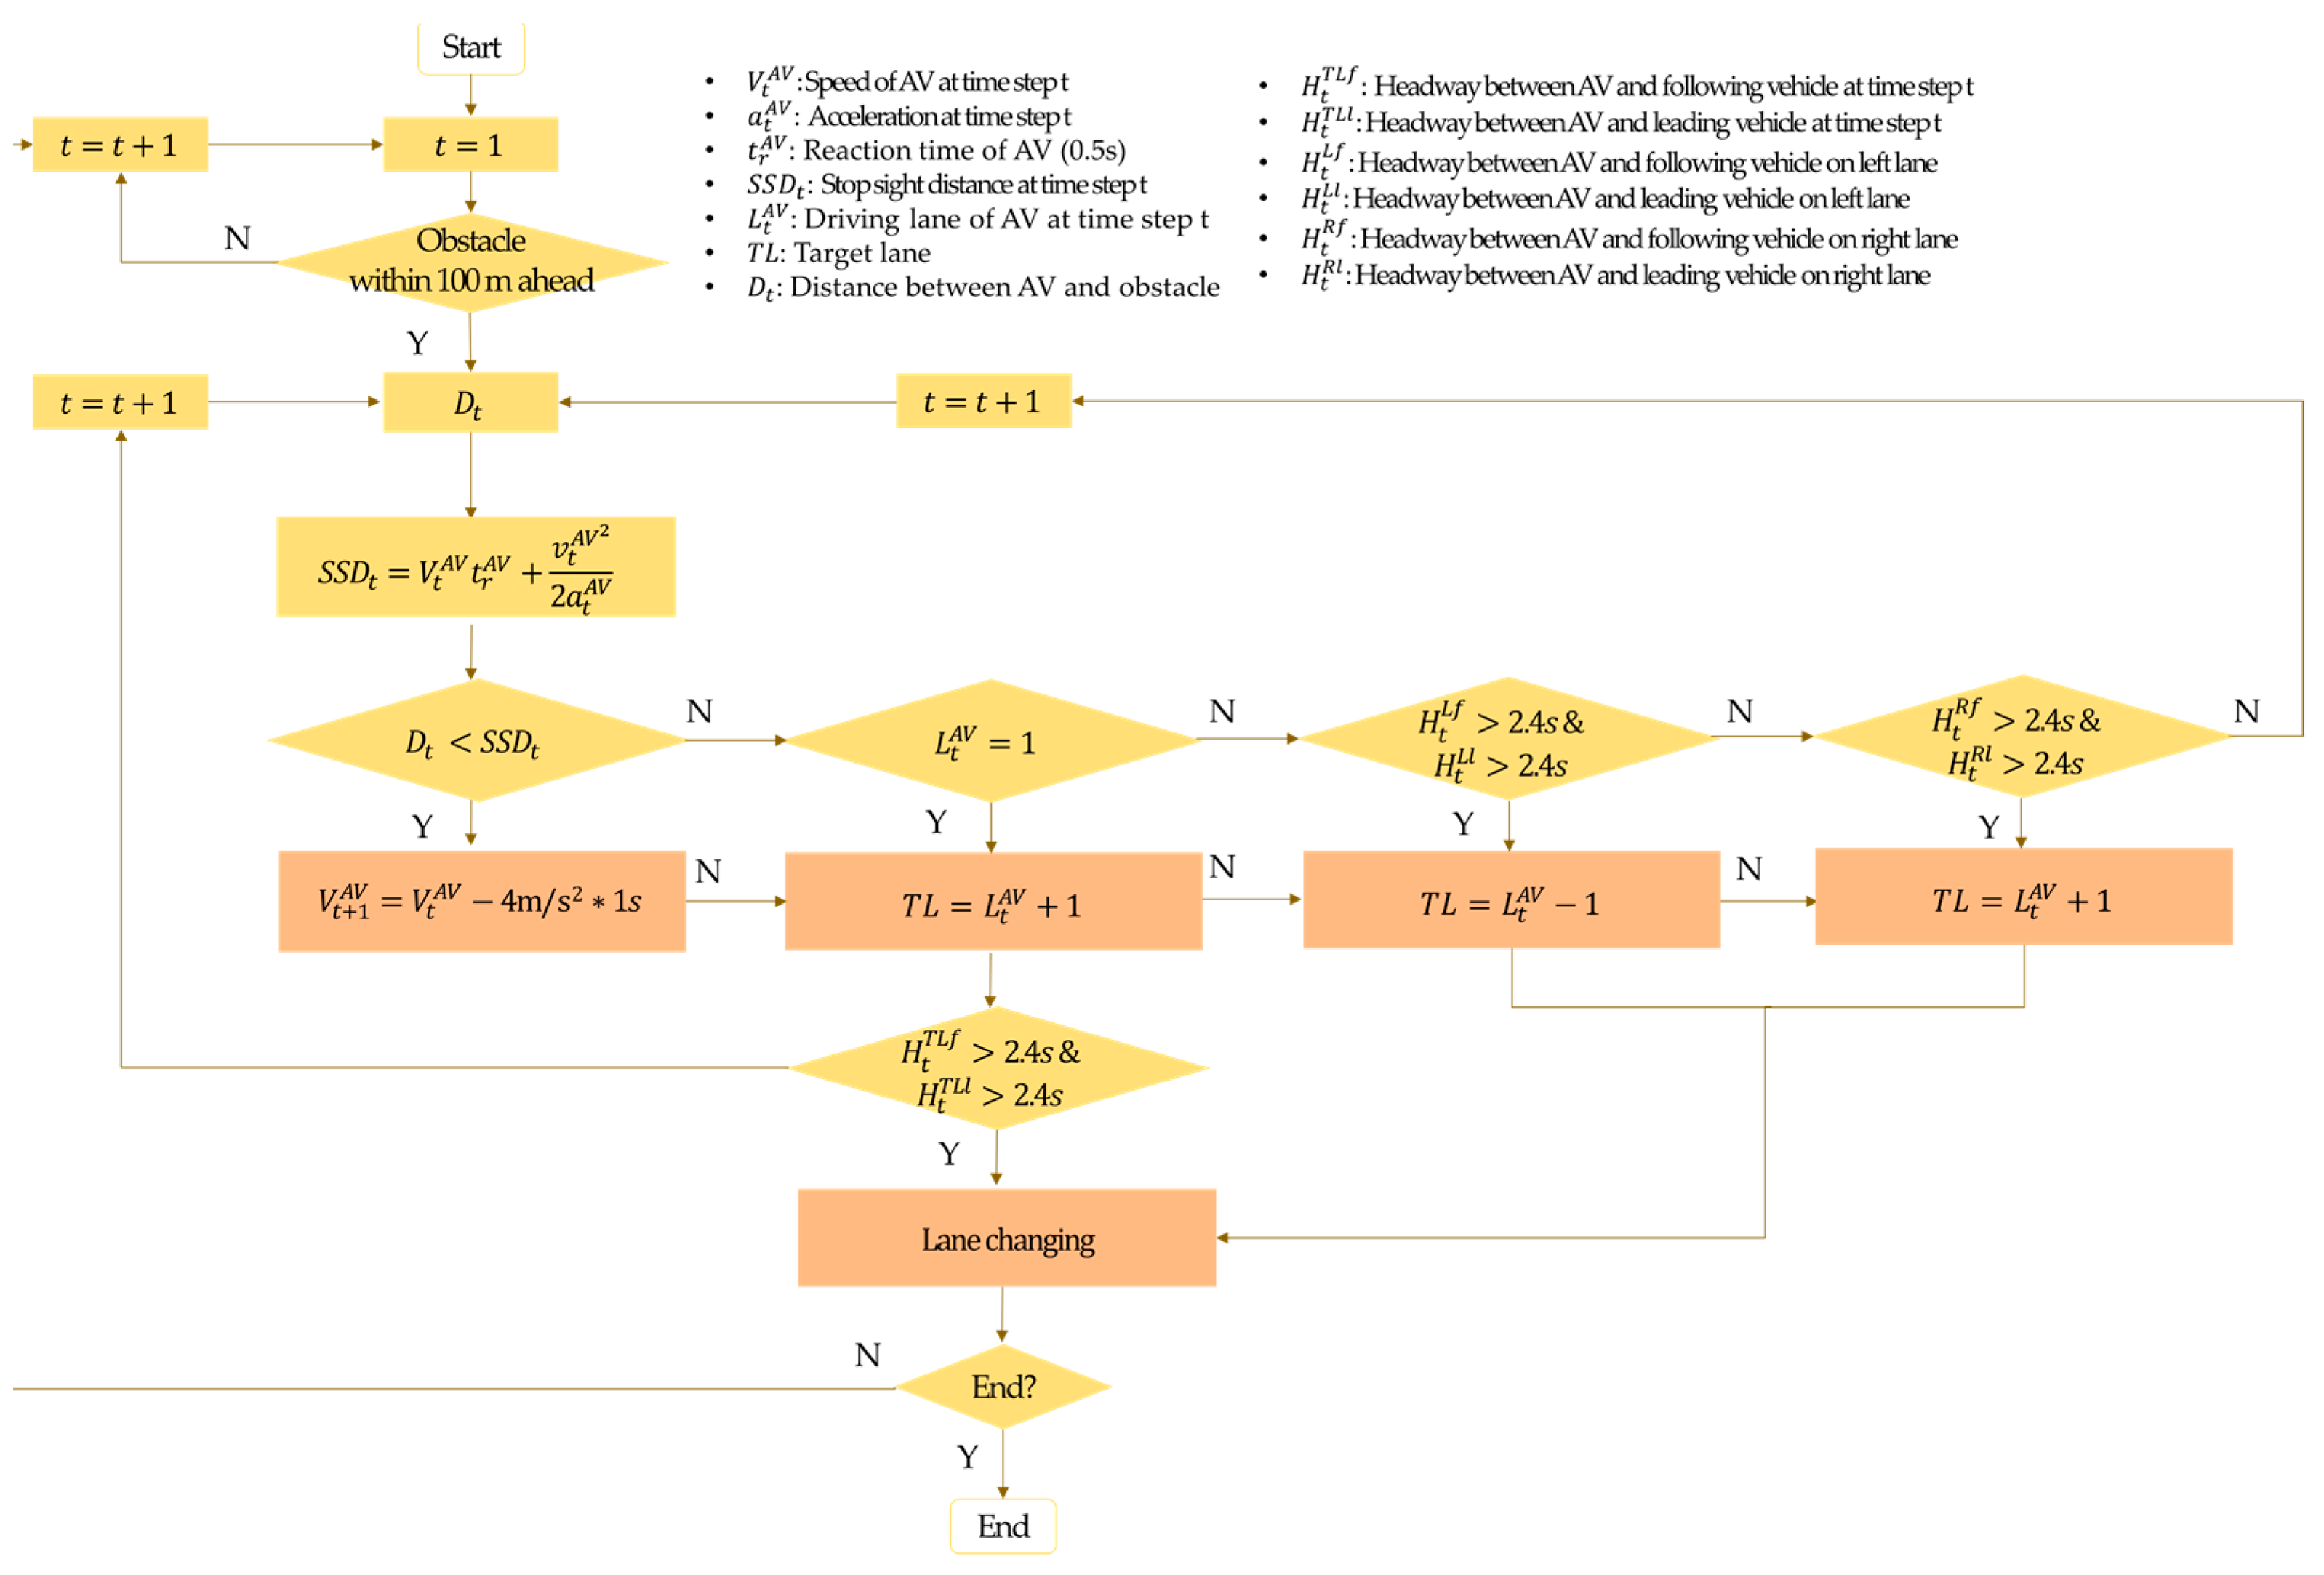
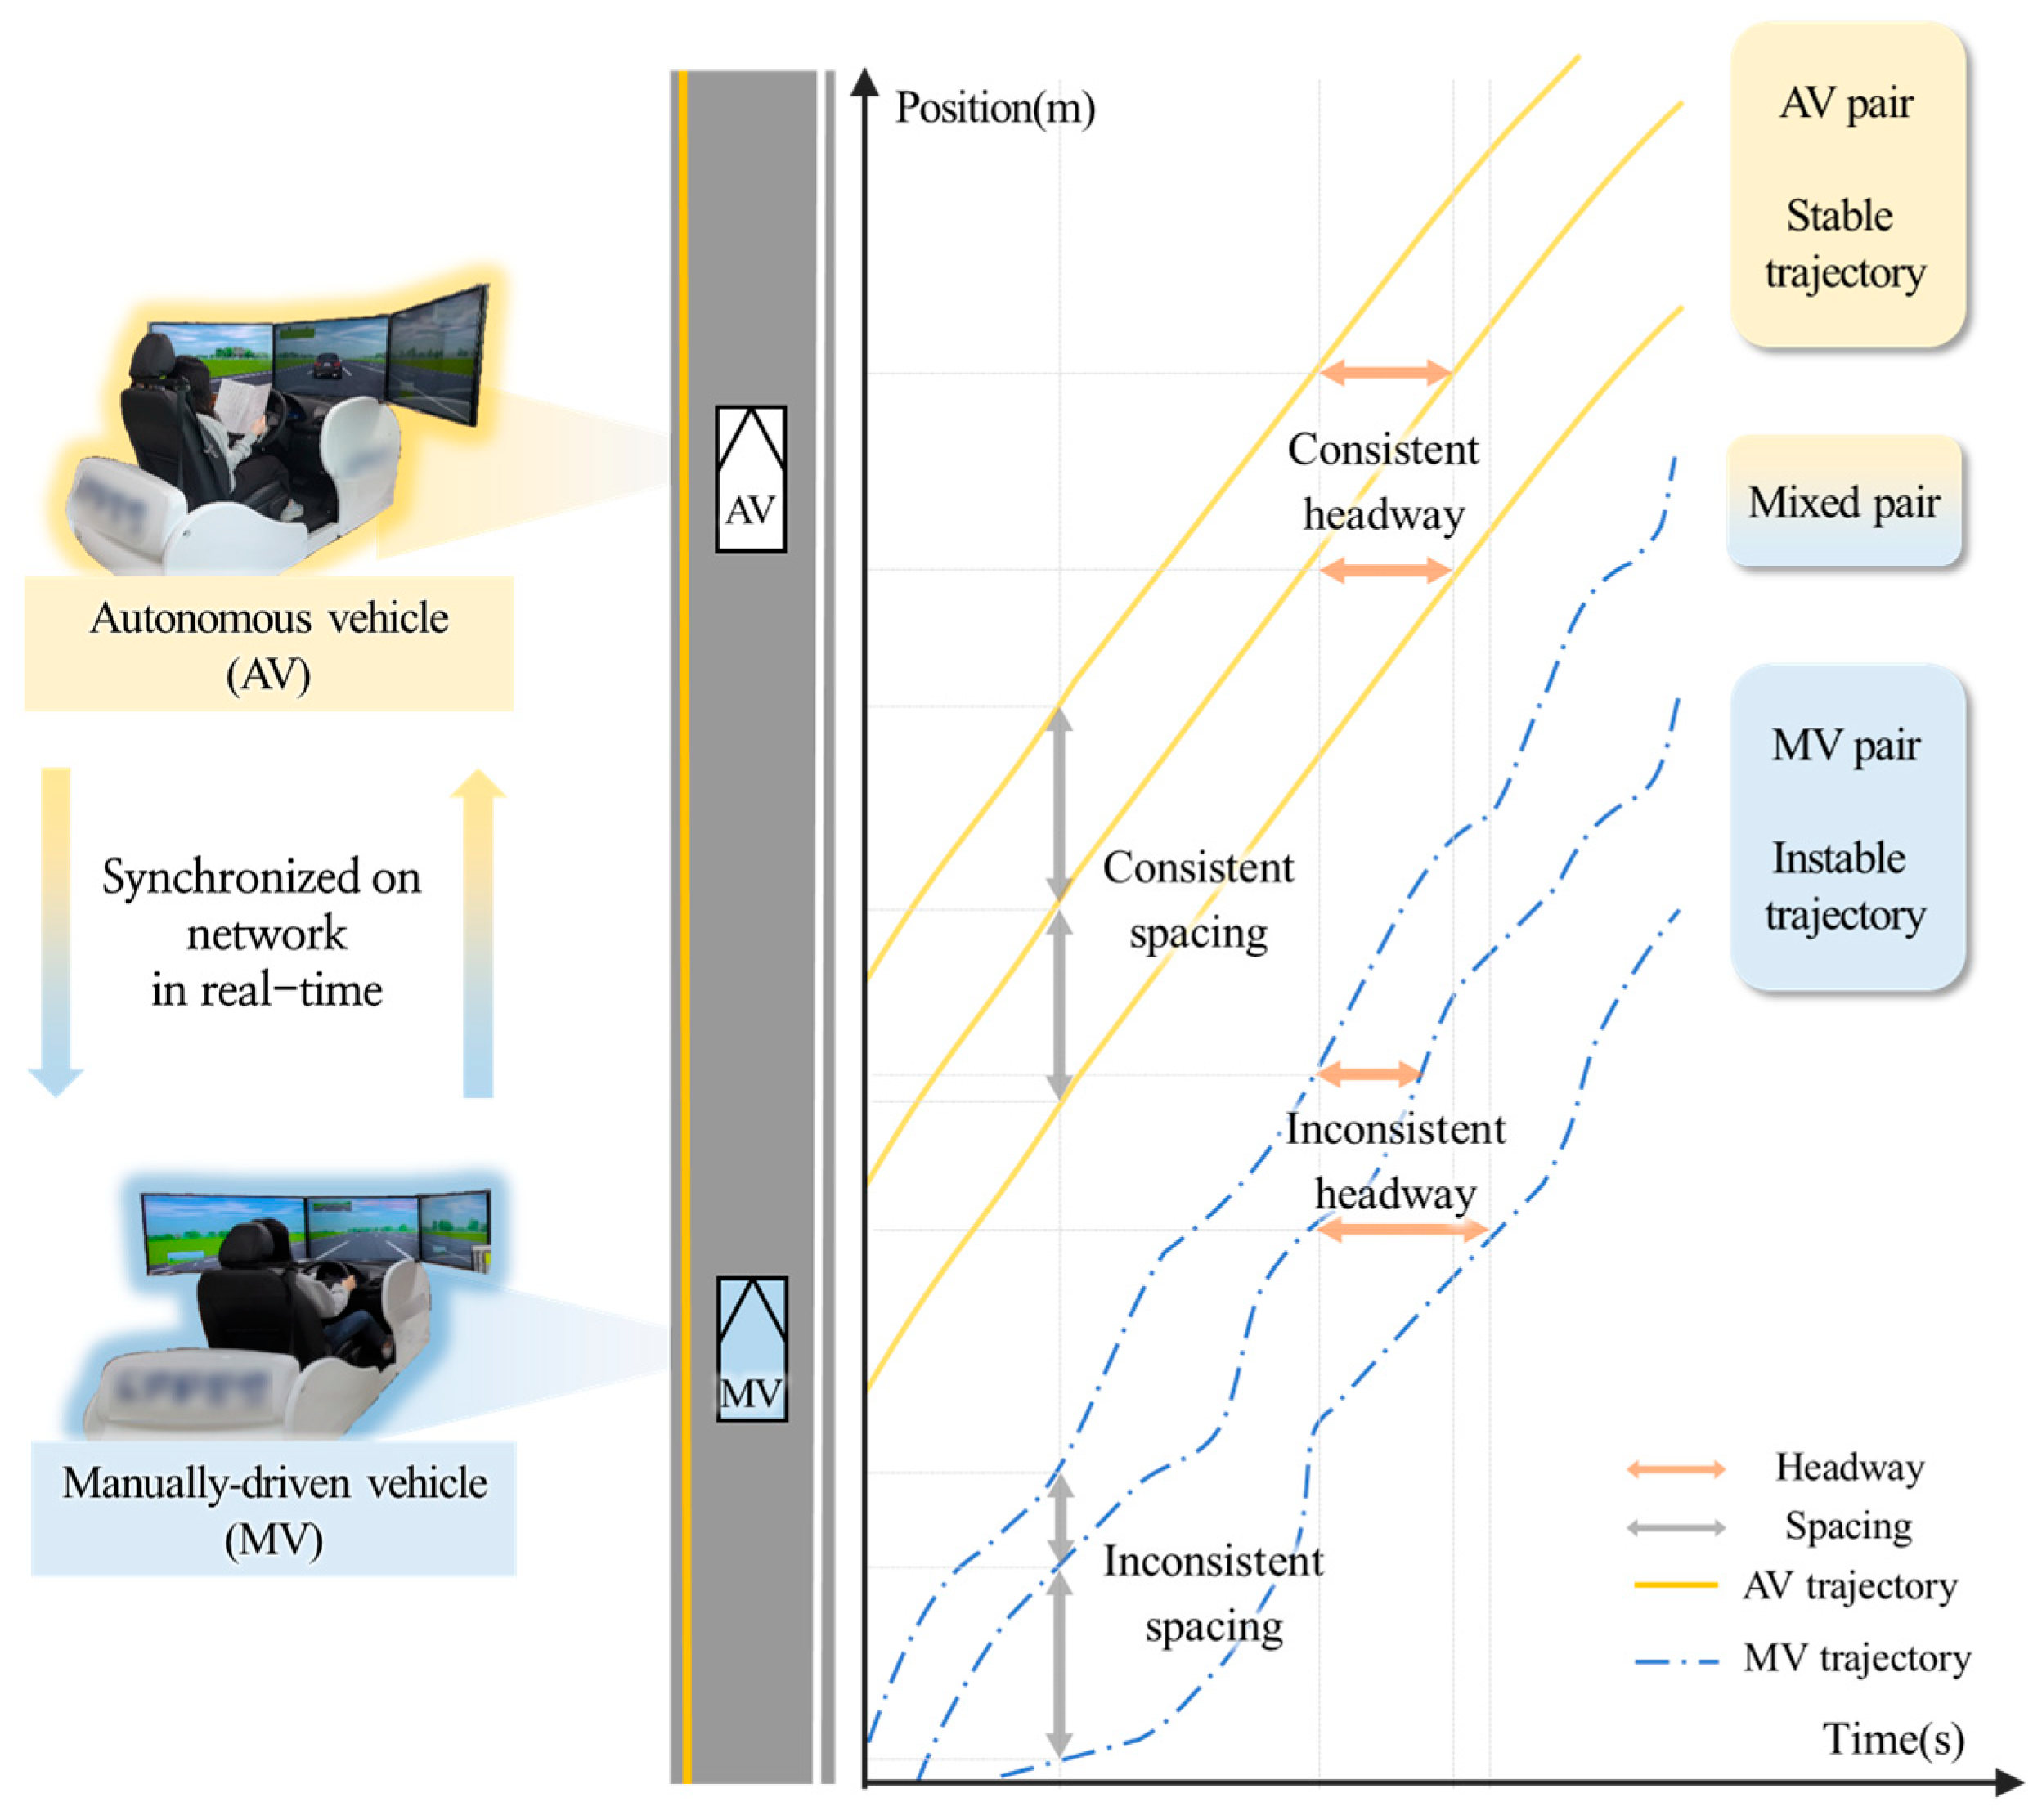
3.1. Simulation of AV Maneuvering

To ensure the reality of the simulated AV-driving behavior we were required to conduct effective and reliable simulation experiments. Actual AVs perform the process of recognizing surrounding situation using various vehicle sensors and communication functions to determine vehicle maneuvering. Simulating all these functions requires a lot of time and effort. Because the core of this study is not to fully implement the driving behavior of an AV on the simulation, but to understand under what conditions the vehicle interaction between AV and MV becomes dangerous, we proposed a method for abstracting the behavior of AVs. The abstraction refers to simplifying and condensing the essential concepts of autonomous driving systems and technologies. This study established three requirements of AV driving behavior to develop an AV maneuvering control algorithm based on an assumption that there exists a difference in driving behavior between AVs and MVs. The first requirement of AV maneuvering is ‘safety’. This requirement means that an AV does not create a dangerous situation by itself when there is no external stimulus such as the cutting in or cutting out of a nearby vehicle [19,20,21]. The second requirement is ‘deterministic’. The AVs determined their path, acceleration, and steering according to a predefined AV driving algorithm as defined in the previous studies [22,23,24]. The characteristics of a deterministic maneuver is that the AV always moves the same way under the same conditions. The last is ‘smoothness’. AVs show the smoothness driving characteristic unlike MVs because the longitudinal and lateral control functions of AVs maintain a constant driving speed and acceleration and adjust their lane offset to support stable driving [25,26]. Autonomous driving, to reflect the requirements of AV behavior, includes four functions: maintaining driving speed, following a vehicle, changing lanes, and merging in this study. Figure 2 illustrates the process of implementing each drivingfunction algorithm, using the script editor module of SCANeRTM STUDIO.
The standard deviation of acceleration, standard deviation of lane position, and standard deviation of spacing were used to evaluate the difference in driving behavior between an AV and MV. The feasibility of the simulated AV behavior was evaluated by applying the three indicators mentioned above to the data collected from driving simulations in a previous study conducted by the authors of this study [27]. The value of evaluation indicators found using the AV data was smaller than that of the MV. In addition, all indicators had statistically significant differences (p < 0.05) at the 95% confidence level. These results support the validity of the proposed AV simulation method. Figure 3 presents algorithmic descriptions of maintain speed and car following. Figure 4 presents algorithmic descriptions of lane changing. Figure 5 presents algorithmic descriptions of avoidance obstacles. Figure 6 presents algorithmic descriptions of merge.

3.2. Driving Simulation

It is necessary to establish a road network in which the vehicle can drive to perform a driving simulation. Road geometric characteristic information currently used in Korea’s freeway crash database was used to select the representative road-alignment conditions for simulation experiments [1]. The criteria for categorizing the horizontal curve length and longitudinal slope of the freeway accident data are shown in Table 1. The horizontal curves in the freeway accident data are categorized based on 500 m and 1000 m. Uphill and downhill are categorized by 1% and 3%, respectively. A total of 24 road sections, including various alignment conditions, were prepared. The radius of the horizontal curve was set equally to 710 m in consideration of the minimum required design standard [28]. In addition, a flat tangent section was placed between each analysis section to minimize the influence of the adjacent road-alignment characteristics and to independently evaluate the driving safety in each section. The length of the tangent section was 250 m, which corresponded to the minimum stopping distance [28]. The total length of the network was 22.3 km, which consisted of a horizontal curve, vertical curve, combined alignment, and tangent section.
The driving scenarios consist of three different car-following pairs. The scenarios include AV pairs, MV pairs, and mixed pairs. An AV pair is a case in which both the preceding vehicle and the following vehicle are AVs. An MV pair refers to a scenario where both the preceding vehicle and the following vehicle are MVs. Meanwhile, the mixed pair, which is the main concern of this study, is composed of A V L M V F pairs and M V L A V F pairs depending on the combination of AVs and MVs. The MV follows the AV in the A V L M V F pair, but the AV follows the MV in the M V L A V F pair.
An experimental environment was constructed in which a multi-agent driving simulator was interlocked to enable simultaneous travel in the same space after the two driving simulators were synchronized using the network. Figure 7 illustrates the concept of the multi-agent driving simulation. Each simulator is connected via the TCP/IP communication protocol. Simulators send driving status data including the positions, speeds, accelerations, brake powers, and angular velocities. SCANeR TM STUDIO is used to construct a simulation environment by designing 3D virtual reality for road alignments and scenarios. This study conducts a car-following situation between preceding and subject vehicles using MADS. In the simulated environment, two drivers drive at the same time. The driving simulation environment is designed to drive two vehicles on a three-lane freeway. Drivers can increase the vehicle speed up to 100 km/h. During the driving simulation experiment, the drivers do not overtake the preceding vehicle. Additionally, both the preceding vehicle and subject vehicle drivers are instructed to keep driving in the second lane without lane changes. Drivers can determine their driving behavior in accordance with the surrounding vehicles or road alignments. Vehicle trajectory data are found using each simulator through which the preceding and subject vehicles have traveled the network. The driving behavior of individual vehicles and vehicle interactions are analyzed using the discovered trajectory data.
The trajectory data include vehicle positions over time, which can be used to further derive both longitudinal driving behavior and lateral driving behavior. Longitudinal driving behavior is represented using the speed and acceleration of the vehicles. Lateral driving behavior information is represented using the lane position and lateral acceleration of the vehicles. Data were collected at 10 Hz. To identify the change in driving behavior with road-alignment conditions, data collected at 0.1 s intervals in the time domain need to be converted into the space domain in 1 m increments. Because outliers of trajectory data may affect the analysis results, proper preprocessing is needed to filter out outliers. In this study, the criterion for determining outliers was defined as a range that deviated from 99.7% of the data distribution.

3.3. Data Analysis

It is desirable to conduct a comparative evaluation rather than giving absolute meaning to the experimental results because the driving simulation does not perfectly reflect reality. For this purpose, this study defined a flat tangent road section without horizontal and vertical curves as the baseline condition to be compared. The rate of change of the safety indicator found from the target analysis road section compared to the baseline, which is shown as Equation (1), is used as the evaluation index. It is then determined that the driving safety of mixed car-following pairs with a large change rate of the evaluation index would be reduced. Selected safety indicators include the acceleration noise, the standard deviation of lane positions (Std.LP), and the average headway to evaluate the longitudinal driving safety, lateral driving safety, and inter-vehicle safety, respectively.
Δ x = x b a s e l i n e x s x b a s e l i n e × 100 %
where Δ x is defined as the rate of the safety indicator compared to the baseline, x b a s e l i n e is the evaluation index of the baseline, x s is the safety indicator found from section s , and s is the number of sections (1, 2, ⋯, S ).
Acceleration noise has been effectively used to evaluate the longitudinal driving safety of vehicles. The standard deviation of acceleration refers to the degree of variance of speed change [29]. A higher acceleration noise value negatively affects traffic safety. Increased acceleration noise indicates that there is decreased driving safety. The acceleration noise can be found using Equation (2).
A N i s = p = 1 P a p i S a i s ¯ 2 P A N ( s ) ¯ = i = 1 I A N i ( s ) I
where A N i ( s ) is defined as the acceleration noise at section s for driver i , A N ( s ) ¯ represents the average acceleration noise at section s , a p i represents acceleration at position p for driver i , a ¯ represents the average acceleration noise, and i represents driver ID (1, 2, …, I ).
Lateral driving safety represents the safety of the vehicle in a direction perpendicular to the driving direction. Lateral driving safety can be evaluated by identifying whether the vehicle travels well along the centerline of the lane when driving in a curved road section. The lane position is defined as the distance from the center of the lane to the center of the vehicle in this study. The value of the lane position is 0 when the center of the lane coincides with the center of the vehicle. The lane position is collected as a (−) value when the vehicle is driving on the left side of the lane center. The lane position is collected as a (+) value when the vehicle is driving on the right side of the lane center. The absolute value of the lane position is used for the driving safety evaluation. The Std.LP is the deviation of the lane position from the center of the lane. The higher the Std.LP, the higher the variance of the vehicle position. This indicator has been widely used for lateral safety evaluation [30,31]. The Std.LP can be found using Equation (3). When the rate of change of the Std.LP in the analysis section compared to the baseline is positive, it means that the driving safety deteriorates compared to the baseline.
S t d . L P i ( s ) = p = 1 P L P p i ( s ) L P i ( s ) ¯ 2 P
where S t d . L P i ( s ) is defined as the standard deviation of the lane position at section s for driver i , L P p i represents the lane position at position p for driver i , and L P ¯ represents the average lane position.
Headway represents the time from the point where the front bumper of the preceding vehicles has passed to the vehicle head of the subject vehicle in the car-following situation. Headway is used as an index for the analysis of the interaction between vehicles [32]. Acceleration and deceleration affect the headways, while each vehicle drives the road network. When the headways increase, the likelihood of collision between vehicles decreases [33,34]. The average headway represents an indicator to evaluate the safety of the interaction between preceding and subject vehicles. The average headway, which is found using Equation (4), decreases when the rate of the average headway on the analysis sections compared to the baseline is negative. A higher headway indicates a decrease in driving safety.
A v g . H W i ( s ) = i = 1 I H W i ( s ) I H W i ( s ) = p = 1 P H W p P
where H W i ( s ) is defined as the headway at section s for driver i and A v g . H W i ( s ) represents the average headway at section s for driver i .

4. Results

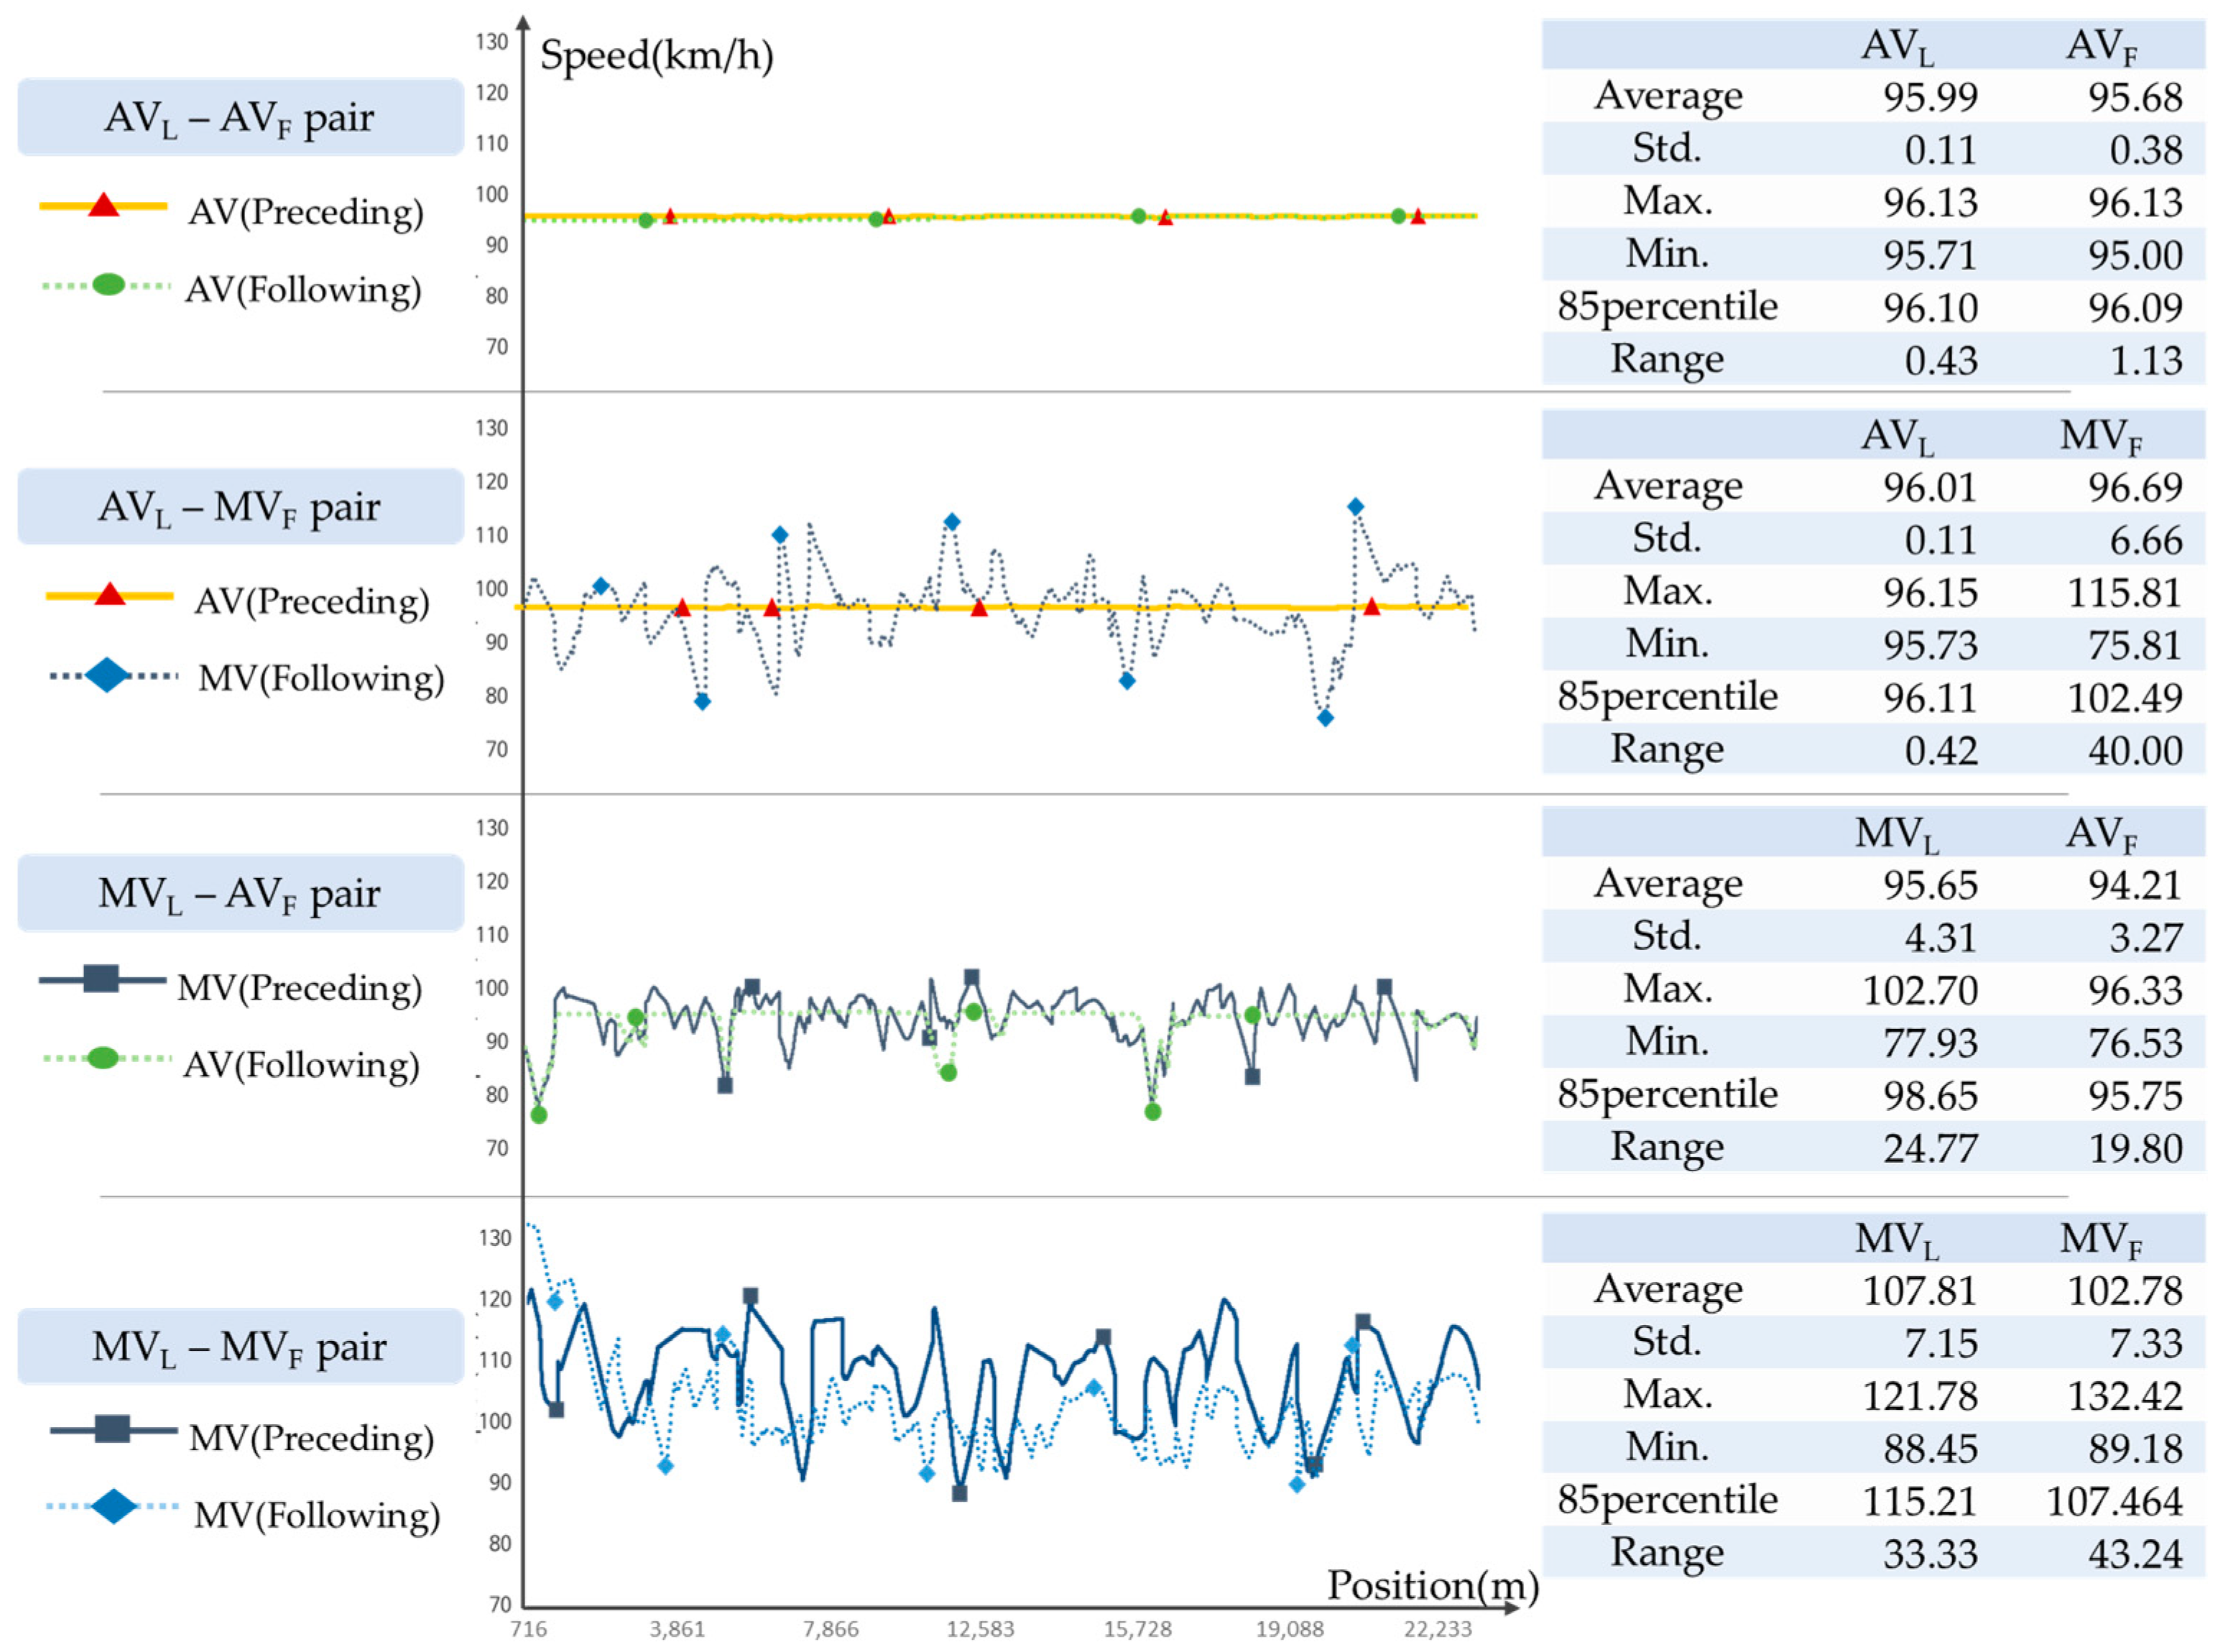
4.1. Analysis of Speed Profiles by Vehicle Pair

Descriptive statistics of driving speed are presented with examples of speed profiles for each car-following pair, as shown in Figure 8. In the A V pair, the average speed and the standard deviation of speed were observed to be approximately 95 km/h and 0.11–0.38 km/h, respectively. Additionally, the results of the speed ranges of 0.43 and 1.13 km/h of A V L and A V F showed that the driving behaviors of the two vehicles are quite similar. The mechanical and deterministic movement, which resulted from the maneuvering control logic, of the preceding A V L also had an effect on the movement of the following A V F . In the case where an M V follows an A V , which is the first scenario of the mixed pair ( A V L M V F ), the difference in the standard deviation of the speed between M V F and A V L was significantly large; although, the average driving speeds were similar, indicating that the driving behavior was meaningfully different. In addition, the speed range of A V L was 0.42 km/h, whereas the speed range of M V F was 40.00 km/h. Another interesting finding was observed with the second scenario of the mixed pair ( M V L A V F ). The standard deviation of speed for the A V F following M V L was observed to be 19.80 km/h, which indicates that the standard deviation of speed was larger than that of the AV pair. The stochastic movement resulting from the human driver also had an effect on the movement of the following A V . Therefore, it can be said that there is a significant difference in driving behavior between A V and M V that follow the preceding A V L . In the M V pair, the average driving speed was 100 km/h, which is the highest speed among all vehicle pairs. As expected, the largest speed variation was found in the M V pair. Because M V s are driven according to the human driver’s awareness and decisions, they are likely to make more frequent changes in driving speed with greater acceleration rates. When a vehicle pair consists of the same vehicle type, stable interaction between vehicles is found due to similar driving behavior [29]. The difference in the standard deviation of speed is 0.27 km/h in the A V L A V F pair and 0.18 km/h in the M V L M V F pair. On the other hand, in the case of mixed pairs, the standard deviations of speed were 6.55 km/h and 1.04 km/h for A V L M V F and M V L A V F , respectively.

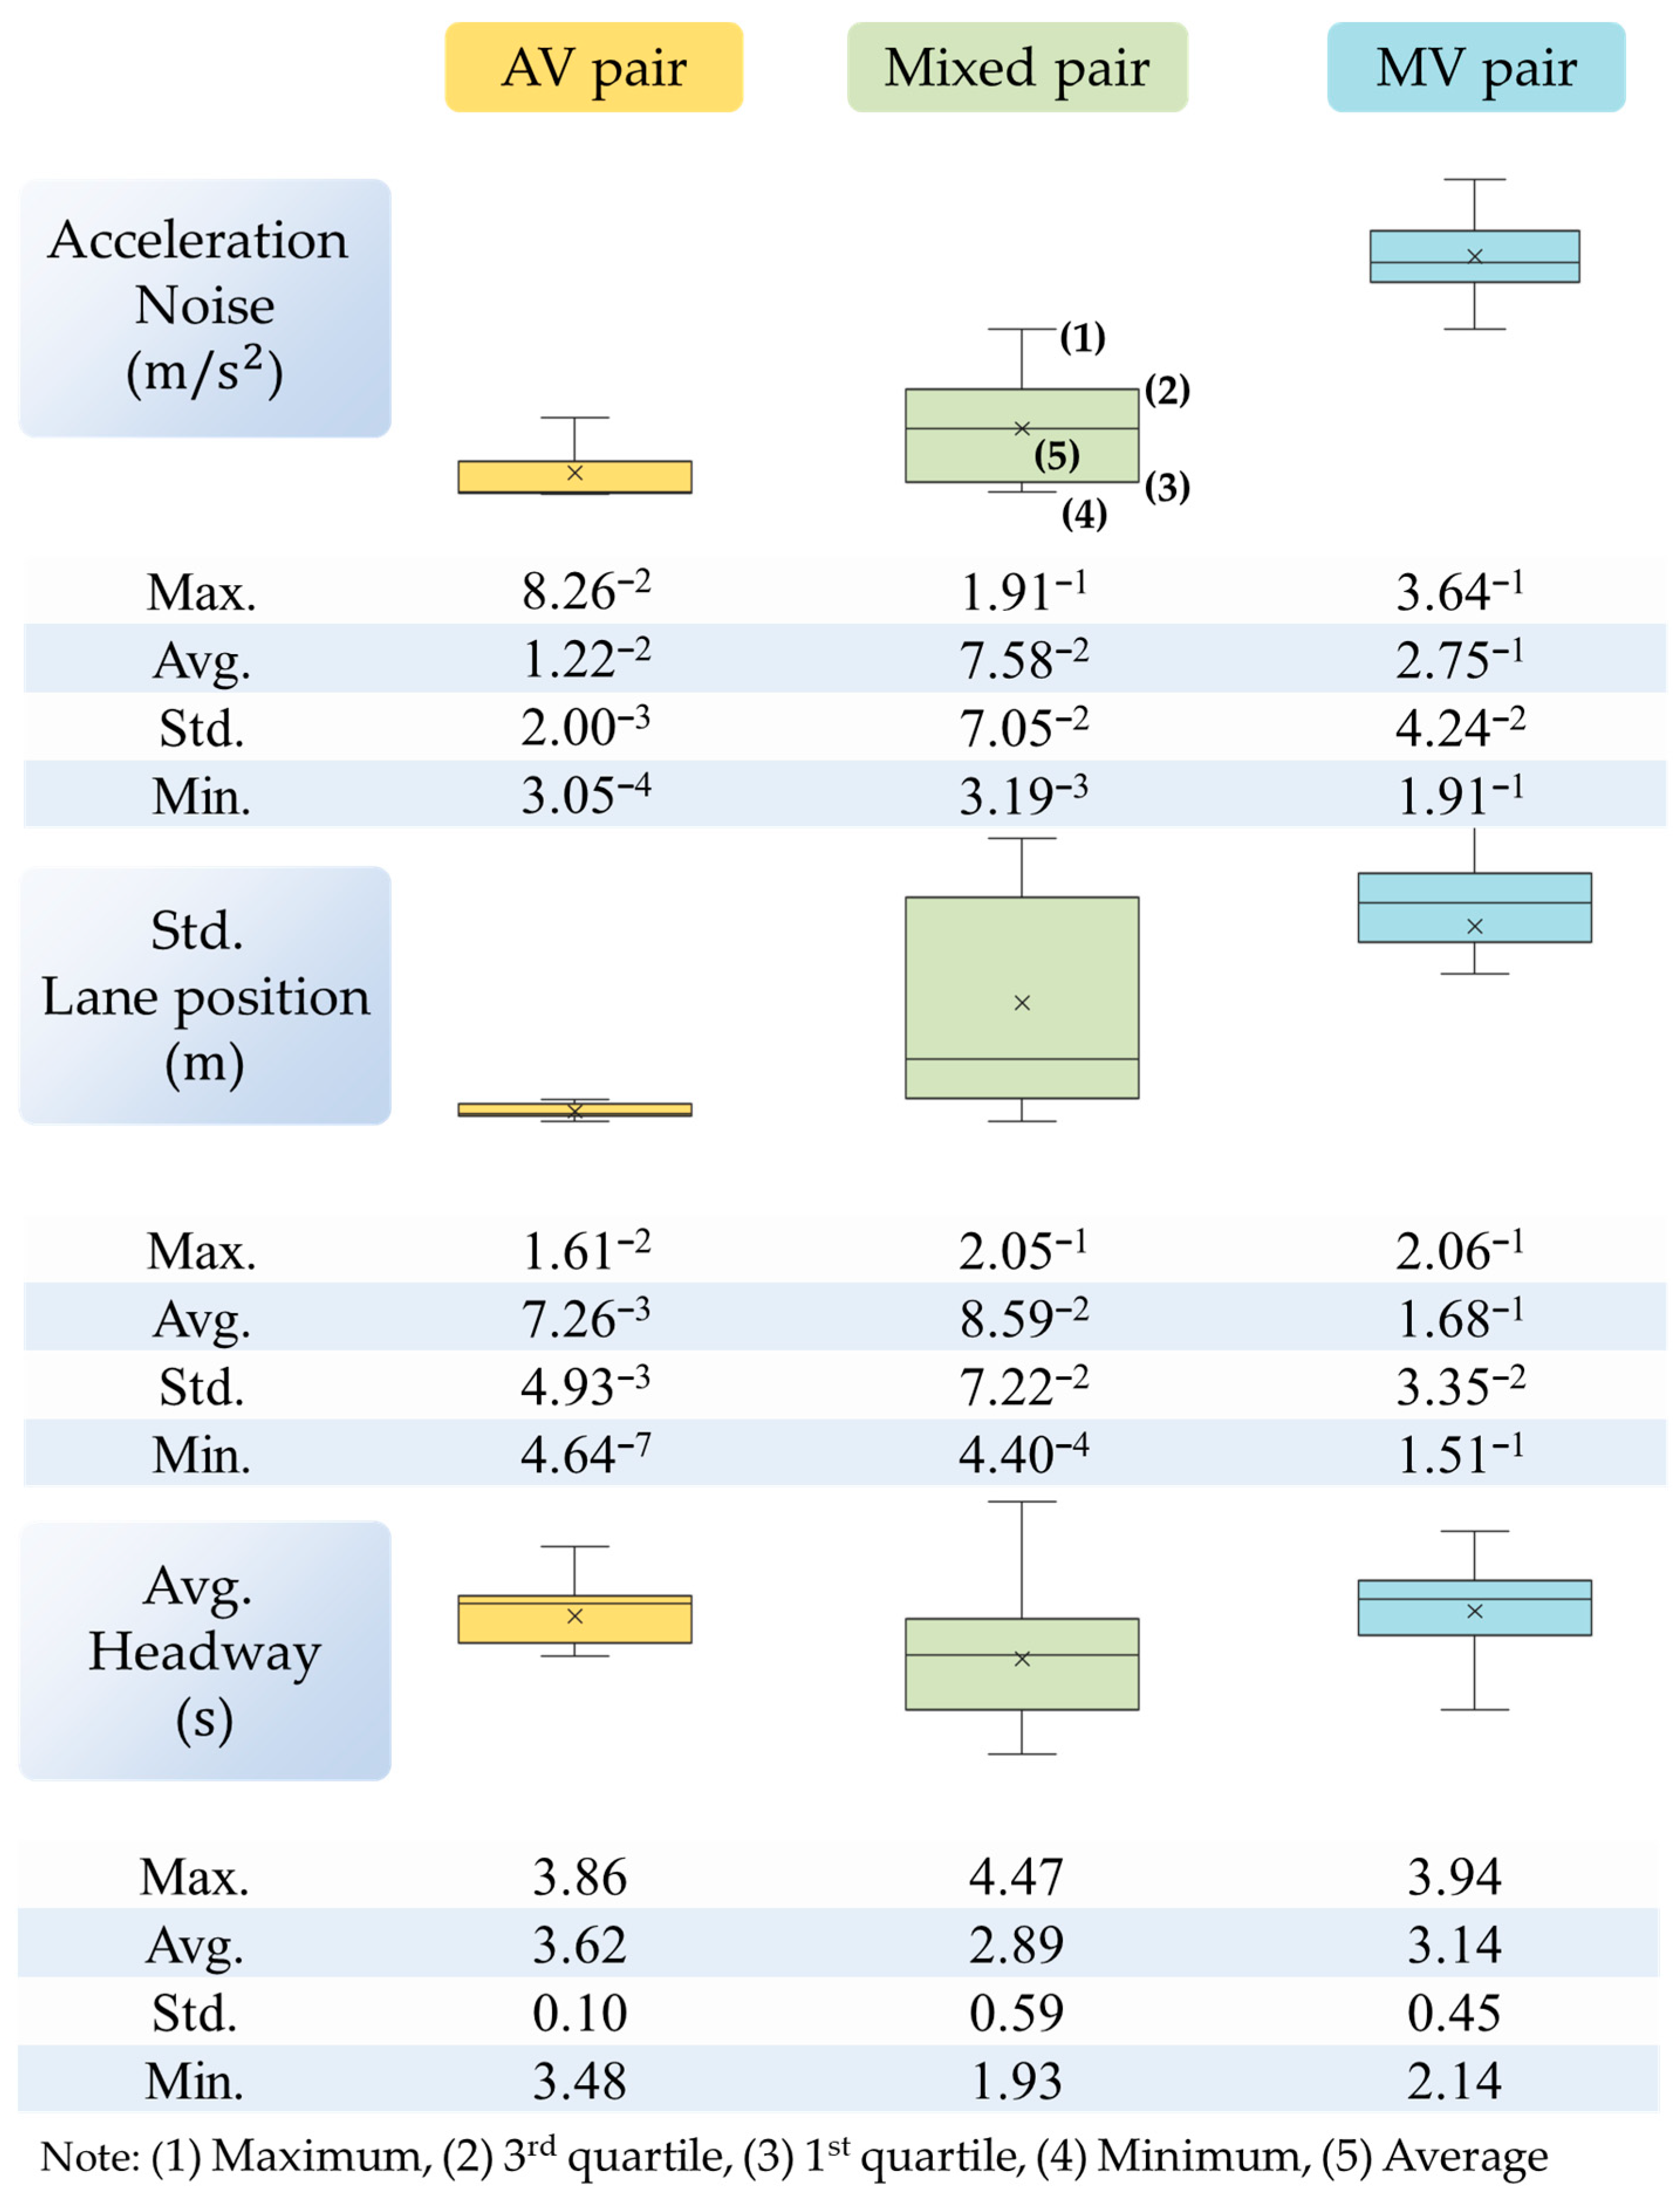
4.2. Driving Safety Evaluation

The evaluation results are summarized in Figure 9. Since the AV drives in accordance with maneuvering control algorithms, the acceleration noise of the AV pair ( 1.22 3   m / s 2 ) was smaller than that of the mixed pair ( 7.58 3   m / s 2 ), and it was 98.8% smaller than that of the MV pair ( 2.75 1   m / s 2 ). The Std.LP in the AV pair ( 7.26 3   m ) decreased by 92.5% compared to the mixed pair and by 96.2% compared to the MV pair. As a result of comparing the average headway, the average headway of the AV pair was 3.62 s, which represents the highest headway among other vehicle pairs, maintaining the widest spacing between preceding and following vehicles. The standard deviation of the headway of AV pairs is 0.10 s, which is the smallest among all vehicle pairs.
Analyses of variation (ANOVA) are performed for each safety indicator separately. The statistical analysis results are presented in Table 2. Significance probabilities of acceleration noise and Std.LP are 0.00 for all car-following pairs. Significance probabilities of Avg.HW are less than 0.05 for all car-following pairs. The safety indicators, in accordance with the 24 sections, have significant differences from the other pairs at the 95% significance level. The result of the ANOVA test implies that the proposed indicators are capable of discriminately explaining the difference in driving safety among scenarios.
A comparison of the evaluation index by road section is presented in Table 3. The acceleration noises in the baseline case are 0.01 2   m / s 2 for the AV pair, 0.05   m / s 2 for the mixed pair, and 0.1   m / s 2 for the MV pair. In the AV pair, the acceleration noise in Section 5–8, 10, 12, and 18 increased the most to 0.01. In the mixed pair, the acceleration noise increased by 225% compared to the baseline in Sections 14, 22, and 24. The highest acceleration noise was observed in Section 24 in the MV pair. The lateral driving safety characterized using the Std.LP was the worst for all pairs in Section 11. Section 11 has alignment characteristics of a right-curve length of 500 m and a downhill slope of 1%. In the case of driving to the right, the sight distance of the drive was shorter in the case of the right curve than in the case of the left curve [19], so the lateral driving safety of Section 11 was the worst in all vehicle pairs. With regard to the headway, the headway of the AV pair in Section 1 was 2.67 s, which was reduced by 55% compared to the baseline. The average headway of the mixed pair was 2.23 s, which was a 44% decrease in Section 16 and 24 compared to the baseline. A 45% reduction in the average headway was observed in Section 15 with the MV pair. Furthermore, the hazardous road conditions were found to be different for the AV pair, mixed pair, and MV pair. The longitudinal safety was poor in Section 24 for the MV pair and in Sections 24 and 14 for the Mixed pair. The hazardous road section for the AV pair is entirely different from that of the MV pair and mixed pair. With regard to the inter-vehicle interaction indicators, the hazardous road sections were different for the AV pair, mixed pair, and MV pair. These results prove that the hypothesis established in this study is valid.
A higher rate of change in the evaluation index refers to poorer driving safety. The section with the highest rate in the evaluation index is defined as the hazardous road section of driving safety in this study. The hazardous road sections for the mixed pairs of vehicfles are presented in Table 4. It was identified that the longitudinal driving safety was poor in the road section where the length of the horizontal curve was 1000 m and at 3% grade. With regard to lateral driving safety, a road section with a 500 m right curve and 1% downhill is relatively vulnerable in terms of the driving safety of the mixed pair. Inter-vehicle safety would deteriorate in a combined alignment section where the length of the horizontal curve is 1000 m while going downhill.
The existing roads have been designed based on ensuring the safety of MV pairs, and the traffic operation system has been continuously operated to prioritize the safety of MVs. To ensure safe operation in mixed traffic flow, it is necessary to understand the driving behavior of mixed pairs and AV pairs. Mixed pairs and AV pairs showed a difference in safety under different road conditions compared to MV pairs. For instance, in terms of longitudinal safety, the 24th section is the most vulnerable in MV pairs, while in the mixed pairs, both the 24th and 14th sections showed the lowest safety. Section 24 has a downhill slope, whereas Section 14 has an uphill slope. From a traffic management system perspective, Sections 24 and 14 have a compound alignment with a left curve and an uphill slope. In-vehicle warnings based on V2X for MVs can reduce crash potential due to safe driving behavior. Regarding safety due to interactions between preceding and following vehicles, Sections 16 and 23 show hazardous road conditions in mixed pairs. Although Sections 16 and 23 have different longitudinal slopes, they share the characteristics of having a downhill slope. From a road design perspective, installing transverse grooving for downhill slopes can prevent speeding and enhance safety. The results of this study can be used to prevent accidents in mixed traffic flow scenarios.

5. Conclusions

Understanding the characteristics of mixed car-following situations is of high importance for preparing for emerging automated driving systems because it is unlikely that the AV market will grow rapidly and soon. A variety of simulation experiments have been conducted to evaluate the impact of AVs on traffic stream performance and to identify the characteristics of AV maneuvering. However, we are not aware of any study that addresses the driving safety of the mixed car-following pair consisting of an AV and MV using different road-alignment conditions. The purpose of this study is to propose a methodology to identify what kind of geometric conditions would have a negative impact on the driving safety of mixed car-following situations on freeways.
A notable feature of this study is to adopt an MADS method to simulate the maneuvering of AVs and to evaluate the responsive behavior of MVs following AVs. Three safety indicators, including the acceleration noise, the standard deviation of the lane position, and the headway, were used to characterize the maneuvering behavior of the mixed car-following pairs in terms of driving safety. Then, the rate of change in the safety indicator compared to the baseline case, which is a flat tangent road section resulting in stable maneuvering, was applied to identify road-alignment conditions where mixed car-following pairs would experience relatively more hazardous situations. The evaluation results showed that a set of road sections with combined alignments led to higher risks to driving safety. The outcome of this study can be used to identify the road-alignment conditions in which mixed car-following pairs would experience hazardous situations. In addition, the outcome is expected to be used as a fundamental for the development of novel V2X-based traffic information content that enables ODD expansion of AVs and supports the more effective decision-making of MV drivers.
Although valuable insights were obtainable using systematic simulation experiments, several further studies should be conducted to draw more generalized results and create practice-ready outcomes. First, more efforts need to be made to develop maneuvering control logic for AVs. This study adopted publicly released general control schemes for following preceding vehicles. However, there are valuable opportunities to improve the control logic used in driving simulation experiments. To do this, real-world AV-maneuvering data will make our simulation experiment more realistic. Additionally, more extensive simulation experiments with a larger participant group need to be conducted. Connection and synchronization of more than two driving simulation environments would allow for more valuable results, which are fundamental to developing effective traffic management strategies to address mixed traffic conditions. Rather than simply comparing the evaluation index with the baseline case, a more sophisticated method could be devised. Lastly, in addition to the three safety indicators used in this study, continuous efforts are needed to find more salient indicators. Although there are various safety indicators, there is a need to consider the method for prioritizing safety indicators that can well represent the safety concerns of mixed traffic flow. Prioritized safety indicators for the safety evaluation of mixed traffic flow could enhance the quality of research and should be conducted in future studies.
The safety of mixed traffic flow can vary depending on the MPR of the AVs. Therefore, the AVs’ MPRs are important to consider in mixed traffic flow. However, the scope of this study does not cover it. For further research, safety analysis incorporating diverse mixed pair scenarios regarding AVs’ MPRs is essential. Furthermore, road conditions with poor safety will be similar to those of MV pairs in a low-level MPR scenario where an AV does not affect changes in driving safety among mixed pairs. The marginal point of AVs’ MPRs that influences changes in driving safety should be identified within the mixed pair. If hazardous road conditions are identified based on an AV’s MPR through further research, the results can be used as fundamental data for traffic management agencies to build or enhance road infrastructure according to actual AVs’ MPRs.

Author Contributions

Conceptualization, C.O., J.P. and D.Y.; methodology, C.O. and A.J.; formal analysis, A.J.; data curation, A.J. and Y.J.; writing—original draft preparation, A.J.; writing—review and editing, C.O.; supervision, C.O. All authors have read and agreed to the published version of the manuscript.

Funding

This research was funded by the Korea Agency for Infrastructure Technology Advancement (KAIA) grant funded by the Ministry of Land, Infrastructure and Transport (Grant RS-2021-KA160881, Future Road Design and Testing for Connected and Autonomous Vehicles).

Institutional Review Board Statement

Not applicable.

Informed Consent Statement

Not applicable.

Data Availability Statement

Data are contained within the article.

Conflicts of Interest

The authors declare no conflicts of interest.

References

  1. Korea Expressway Corporation. Korea’s Freeway Crash Database; Korea Expressway Corporation: Gimcheon-si, Republic of Korea, 2020. [Google Scholar]
  2. Liu, Q.; Wang, X.; Wu, X.; Glasser, Y.; He, L. Crash comparison of autonomous and conventional vehicles using pre-crash scenario typology. Accid. Anal. Prev. 2021, 159, 106281. [Google Scholar] [CrossRef]
  3. Wang, L.; Zhong, H.; Ma, W.; Abdel-Aty, M.; Park, J. How many crashes can connected vehicle and automated vehicle technologies prevent: A meta-analysis. Accid. Anal. Prev. 2020, 136, 105299. [Google Scholar] [CrossRef]
  4. Jeong, H.; Liu, Y. Horizontal Curve Driving Performance and Safety Affected by Road Geometry and Lead Vehicle. In Proceedings of the Human Factors and Ergonomics Society Annual Meeting; SAGE Publications: Los Angeles, CA, USA, 2017; Volume 61, pp. 1629–1633. [Google Scholar] [CrossRef]
  5. Eftekharzadeh, S.F.; Khodabakhshi, A. Safety Evaluation of Highway Geometric Design Criteria in Horizontal Curves at Downgrades. Int. J. Civ. Eng. 2014, 12, 326–332. [Google Scholar]
  6. Lee, S.; Jeong, E.; Oh, M.; Oh, C. Driving aggressiveness management policy to enhance the performance of mixed traffic conditions in automated driving environment. Transp. Res. Part A Policy Pract. 2019, 121, 136–146. [Google Scholar] [CrossRef]
  7. Yao, Z.; Hu, R.; Jiang, Y.; Xu, T. Stability and safety evaluation of mixed traffic flow with connected automated vehicles on expressways. J. Saf. Res. 2020, 75, 262–274. [Google Scholar] [CrossRef]
  8. Guériau, M.; Dusparic, I. Quantifying the impact of connected and autonomous vehicles on traffic efficiency and safety in mixed traffic. In Proceedings of the 2020 IEEE 23rd International Conference on Intelligent Transportation Systems (ITSC), Rhodes, Greece, 20–23 September 2020; pp. 1–8. [Google Scholar] [CrossRef]
  9. Mousavi, S.M.; Osman, O.A.; Lord, D.; Dixon, K.K.; Dadashova, B. Investigating the safety and operational benefits of mixed traffic environments with different automated vehicle market penetration rates in the proximity of a driveway on an urban arterial. Accid. Anal. Prev. 2021, 152, 105982. [Google Scholar] [CrossRef] [PubMed]
  10. Hou, G. Evaluating Efficiency and Safety of Mixed Traffic with Connected and Autonomous Vehicles in Adverse Weather. Sustainability 2023, 15, 3138. [Google Scholar] [CrossRef]
  11. Mahdinia, I.; Mohammadnazar, A.; Arvin, R.; Khattak, A.J. Integration of automated vehicles in mixed traffic: Evaluating changes in performance of following human-driven vehicles. Accid. Anal. Prev. 2021, 152, 106006. [Google Scholar] [CrossRef]
  12. Park, S.; Ritchie, S.G. Exploring the relationship between freeway speed variance, lane changing and vehicle heterogeneity. In Proceedings of the 83rd Annual Meeting of Transportation Research Board, Washington, DC, USA, 11–15 January 2004. [Google Scholar]
  13. Gouy, M.; Wiedemann, K.; Stevens, A.; Brunett, G.; Reed, N. Driving next to automated vehicle platoons: How do short time headways influence non-platoon drivers’ longitudinal control? Transp. Res. Part F Traffic Psychol. Behav. 2014, 27, 264–273. [Google Scholar] [CrossRef]
  14. Findley, D.J.; Hummer, J.E.; Zegeer, C.V.; Fowler, T.J. Modeling the Impact of Spatial Relationships on Horizontal Curve safety. Accid. Anal. Prev. 2012, 45, 296–304. [Google Scholar] [CrossRef]
  15. Jung, A.; Cho, E.; Jang, J.; Oh, C. Evaluation of Road Design Elements Affecting Lateral Driving Safety under High-Speed Driving Conditions. Int. J. Highw. Eng. 2021, 23, 69–79. [Google Scholar] [CrossRef]
  16. Bauer, K.M.; Harwood, D.W. Safety Effects of Horizontal Curve and Grade Combinations on Rural Two-Lane Highways. Transp. Res. Rec. 2013, 2398, 37–49. [Google Scholar] [CrossRef]
  17. Choudhari, T.; Maji, A. Risk Assessment of Horizontal Curves Based on Lateral Acceleration Index: A Driving Simulator-Based Study. Transp. Dev. Econ. 2021, 7, 2. [Google Scholar] [CrossRef]
  18. Gooch, J.P.; Gayah, V.V.; Donnell, E.T. Quantifying the Safety Effects of Horizontal Curves on Two-way, Two-lane Rural Roads. Accid. Anal. Prev. 2016, 92, 71–81. [Google Scholar] [CrossRef]
  19. Arvin, R.; Khattak, A.J.; Kamrani, M.; Rio-Torres, J. Safety evaluation of connected and automated vehicles in mixed traffic with conventional vehicles at intersections. J. Intell. Transp. Syst. 2021, 25, 170–187. [Google Scholar] [CrossRef]
  20. Deluka Tibljaš, A.; Giuffrè, T.; Surdonja, S.; Trubia, S. Introduction of autonomous vehicles: Roundabouts design and safety performance evaluation. Sustainability 2018, 10, 1060. [Google Scholar] [CrossRef]
  21. Morando, M.M.; Tian, Q.; Truong, L.T.; Vu, H.L. Studying the safety impact of autonomous vehicles using simulation-based surrogate safety measures. J. Adv. Transp. 2018, 2018, 6135183. [Google Scholar] [CrossRef]
  22. Wang, Z.J.; Chen, X.M.; Wang, P.; Li, M.X.; Zhang, H. A decision-making model for autonomous vehicles at urban intersections based on conflict resolution. J. Adv. Transp. 2021, 2021, 8894563. [Google Scholar] [CrossRef]
  23. Zhang, Y.; Guo, L.; Gao, B.; Qu, T.; Chen, H. Deterministic promotion reinforcement learning applied to longitudinal velocity control for automated vehicles. IEEE Trans. Veh. Technol. 2019, 69, 338–348. [Google Scholar] [CrossRef]
  24. Lillicrap, T.P.; Hunt, J.J.; Pritzel, A.; Heess, N.M.; Erez, T.; Tassa, Y.; Silver, D.; Wierstra, D. Continuous control with deep reinforcement learning. In Proceedings of the ICLR 2016, San Juan, Puerto Rico, 2–4 May 2016. [Google Scholar] [CrossRef]
  25. Paden, B.; Cáp, M.; Yong, S.Z.; Yershov, D.S.; Frazzoli, E. A Survey of Motion Planning and Control Techniques for Self-Driving Urban Vehicles. IEEE Trans. Intell. Veh. 2016, 1, 33–55. [Google Scholar] [CrossRef]
  26. Lee, J.W.; Litkouhi, B.A.
  27. Jo, Y.; Jung, A.; Oh, C.; Park, J.; Yun, D. Suitability Evaluation for Simulated Maneuvering of Autonomous Vehicles. J. Korea Inst. Intell. Transp. Syst. 2022, 21, 183–200. [Google Scholar] [CrossRef]
  28. Korean Society of Civil Engineering; Korean Association of Professional Road & Airport Engineers. Explanation of the Rules on the Standards of Structural Facilities in Roads; KSCE PRESS: Seoul, Republic of Korea, 2020; pp. 228–277. [Google Scholar]
  29. Ko, J.; Jang, J.; Oh, C. A Multi-Agent Driving Simulation Approach for Evaluating the Safety Benefits of Connected Vehicles. IEEE Trans. Intell. Transp. Syst. 2022, 23, 4512–4524. [Google Scholar] [CrossRef]
  30. Ali, Y.; Zheng, Z.; Haque, M.M.; Yildirimoglu, M.; Washington, S. Understanding the discretionary lane-changing behaviour in the connected environment. Accid. Anal. Prev. 2020, 137, 105463. [Google Scholar] [CrossRef] [PubMed]
  31. Lyu, N.; Cao, Y.; Wu, C.; Xu, J.; Xie, L. The effect of gender, occupation and experience on behavior while driving on a freeway deceleration lane based on field operational test data. Accid. Anal. Prev. 2018, 121, 82–93. [Google Scholar] [CrossRef] [PubMed]
  32. Beauchamp, E.; Saunier, N.; Cloutier, M. Study of automated shuttle interactions in city traffic using surrogate measures of safety. Transp. Res. Part C Emerg. Technol. 2022, 135, 103465. [Google Scholar] [CrossRef]
  33. Chen, Y.; Fu, R.; Xu, Q.; Yuan, W. Mobile Phone Use in a Car-Following Situation: Impact on Time Headway and Effectiveness of Driver’s Rear-End Risk Compensation Behavior via a Driving Simulator Study. Int. J. Environ. Res. Public Health 2020, 17, 1328. [Google Scholar] [CrossRef]
  34. Vogel, K. A comparison of headway and time to collision as safety indicators. Accid. Anal. Prev. 2003, 35, 427–433. [Google Scholar] [CrossRef]
Figure 1. Overall framework.
Applsci 14 01468 g001
Figure 2. Framework for simulating AV driving behavior.
Applsci 14 01468 g002
Figure 3. Algorithmic description of maintain speed and car following [27].
Applsci 14 01468 g003
Figure 4. Algorithmic description of lane changing [27].
Applsci 14 01468 g004
Figure 5. Algorithmic description of obstacle avoidance [27].
Applsci 14 01468 g005
Figure 6. Algorithmic description of merge [27].
Applsci 14 01468 g006
Figure 7. Conceptual illustration of MADS experiments.
Applsci 14 01468 g007
Figure 8. Example of a speed profile.
Applsci 14 01468 g008
Figure 9. Comparison of safety indicators by vehicle pair.
Applsci 14 01468 g009
Table 1. Road-alignment conditions by section.
Section IDRoad ConditionsSection IDRoad Conditions
CurveSlopeLengthCurveSlopeLength
1Left-500 m13Left1% uphill1000 m
2Left-1000 m14Left3% uphill1000 m
3Right-500 m15Right1% downhill1000 m
4Right-1000 m16Right 3% downhill1000 m
5-1% uphill120 m17Right1% uphill500 m
6-3% uphill360 m18Right 3% uphill500 m
7-1% downhill55 m19Left1% downhill500 m
8-3% downhill165 m20Left3% downhill500 m
9Left1% uphill500 m21Right1% uphill1000 m
10Left 3% uphill500 m22Right 3% uphill1000 m
11Right 1% downhill500 m23Left1% downhill1000 m
12Right 3% downhill500 m24Left3% downhill1000 m
Table 2. Results of ANOVA with safety indicators.
AV PairMixed PairMV Pair
NFp-ValueNFp-ValueNFp-Value
A N 303839.590.00304.250.00309.940.00
S t d . L P 30278,083.990.00303.390.003014.180.00
A v g . H W 30324,079.950.00303.900.00301.830.01
Table 3. Comparison of evaluation index by road sections.
Section IDAV PairMixed PairMV Pair
AN (ΔAN)Std.LP (ΔStd.LP)Avg.HW (ΔAvg.HW)AN (ΔAN)Std.LP (ΔStd.LP)Avg.HW (ΔAvg.HW)AN (ΔAN)Std.LP (ΔStd.LP)Avg.HW (ΔAvg.HW)
00.01−20.04−55.900.050.023.970.100.053.86
10.05−2
(400)
0.11−1
(2,749,900)
2.67 *
(−55)
0.11
(175)
0.09
(350)
3.94
(−1)
0.20
(89)
0.17
(240)
3.10
(−20)
20.04−2
(300)
0.08−1
(1,999,900)
2.97
(−50)
0.08
(100)
0.09
(350)
3.68
(−7)
0.17
(61)
0.16
(220)
3.44
(−11)
30.05−2
(400)
0.05−1
(1,249,900)
3.32
(−44)
0.08
(100)
0.09
(350)
3.73
(−6)
0.14
(32)
0.17
(240)
3.81
(−1)
40.04−2
(300)
0.03−1
(749,900)
3.62
(−39)
0.07
(75)
0.08
(300)
3.38
(−15)
0.16
(51)
0.16
(220)
3.80
(−1)
50.01 *
(9900)
0.05−5
(25)
3.84
(−35)
0.06
(50)
0.05
(150)
3.21
(−19)
0.14
(32)
0.09
(80)
3.55
(−8)
60.01 *
(9900)
0.01−4
(150)
3.98
(−33)
0.10
(150)
0.08
(300)
3.27
(−18)
0.22
(108)
0.17
(240)
3.38
(−12)
70.01 *
(9900)
0.01−4
(150)
4.08
(−31)
0.05
(25)
0.03
(50)
3.02
(−24)
0.11
(4)
0.06
(20)
3.34
(−13)
80.01 *
(9900)
0.01−4
(150)
4.16
(−29)
0.10
(150)
0.07
(250)
2.81
(−29)
0.18
(70)
0.12
(140)
3.51
(−9)
90.02−1
(1900)
0.11−1
(2,749,900)
4.28
(−27)
0.08
(100)
0.09
(350)
2.92
(−26)
0.17
(61)
0.17
(240)
3.40
(−12)
100.01 *
(9900)
0.12−1
(2,999,900)
4.45
(−25)
0.10
(150)
0.09
(350)
2.82
(−29)
0.24
(127)
0.16
(220)
3.29
(−15)
110.02−2
(100)
0.14−1 *
(3,499,900)
4.69
(−21)
0.07
(75)
0.11 *
(450)
2.53
(−36)
0.15
(42)
0.21 *
(320)
2.99
(−22)
120.01 *
(9900)
0.05−1
(1,249,900)
4.87
(−17)
0.10
(150)
0.09
(350)
2.71
(−32)
0.20
(89)
0.20
(300)
2.84
(−26)
130.01−1
(900)
0.08−1
(1,999,900)
5.05
(−14)
0.09
(125)
0.09
(350)
2.87
(−28)
0.28
(165)
0.18
(260)
3.27
(−15)
140.03−1
(2900)
0.09−1
(2,249,900)
5.17
(−12)
0.13 *
(225)
0.09
(350)
3.23
(−19)
0.24
(127)
0.16
(220)
2.26
(−41)
150.01−1
(900)
0.04−1
(999,900)
5.24
(−11)
0.08
(100)
0.09
(350)
2.59
(−35)
0.15
(42)
0.18
(260)
2.18 *
(−45)
160.03−1
(2900)
0.04−1
(999,900)
5.24
(−11)
0.10
(150)
0.10
(400)
2.23 *
(−44)
0.26
(146)
0.19
(280)
2.21
(−43)
170.02−1
(1900)
0.05−1
(1,249,900)
5.23
(−11)
0.08
(100)
0.09
(350)
2.76
(−30)
0.17
(61)
0.17
(240)
3.07
(−20)
180.01 *
(9900)
0.05−1
(1,249,900)
5.23
(−11)
0.12
(200)
0.09
(350)
2.75
(−31)
0.23
(117)
0.18
(260)
3.41
(−12)
190.02−1
(1900)
0.12−1
(2,999,900)
5.17
(−12)
0.07
(75)
0.09
(350)
2.62
(−34)
0.16
(51)
0.18
(260)
3.32
(−14)
200.05−1
(4900)
0.12−1
(2,999,900)
5.17
(−12)
0.09
(125)
0.10
(400)
2.65
(−33)
0.20
(89)
0.18
(260)
3.46
(−10)
210.01−1
(900)
0.04−1
(999,900)
5.24
(−11)
0.09
(125)
0.09
(350)
2.54
(−36)
0.18
(70)
0.18
(260)
3.02
(−22)
220.03−1
(2900)
0.04−1
(999,900)
5.24
(−11)
0.13*
(225)
0.09
(350)
2.60
(−35)
0.22
(108)
0.19
(280)
3.27
(−15)
230.01−1
(900)
0.09−1
(2,249,900)
5.17
(−12)
0.08
(100)
0.10
(400)
2.23 *
(−44)
0.19
(80)
0.18
(260)
2.72
(−29)
240.03−1
(2900)
0.09−1
(2,249,900)
5.17
(−12)
0.13 *
(225)
0.10
(400)
2.26
(−43)
0.42 *
(297)
0.20
(300)
2.73
(−29)
Unit: AN ( m / s 2 ), Std.LP (m), Avg.HW (s), Δ AN (%), Δ Std.LP (%), Δ Avg.HW (%). * Hazardous section.
Table 4. Identified hazardous road sections for mixed vehicle pairs.
Evaluation TargetSafety IndicatorEvaluation IndexMixed Pair
Longitudinal safetyAcceleration noise Δ A N 1000 m left curve 3% uphill
1000 m left curve 3% downhill
1000 m right curve 3% uphill
Lateral safetyStandard deviation of lane position Δ S t d . L P 500 m right curve 1% downhill
Inter-vehicle safetyAverage of headway Δ A v g . H W 1000 m right curve 3% downhill
1000 m left curve 1% downhill
Disclaimer/Publisher’s Note: The statements, opinions and data contained in all publications are solely those of the individual author(s) and contributor(s) and not of MDPI and/or the editor(s). MDPI and/or the editor(s) disclaim responsibility for any injury to people or property resulting from any ideas, methods, instructions or products referred to in the content.

