Article

Full-Wavefield Migration Using an Imaging Condition of Global Normalization Multi-Order Wavefields: Application to a Synthetic Dataset

1
College of Geo-Exploration Science and Technology, Jilin University, Changchun 130012, China
2
Jilin High-Grade Highway Engineering Co., Ltd., Changchun 130015, China
*
Author to whom correspondence should be addressed.
Appl. Sci. 2024, 14(4), 1389; https://doi.org/10.3390/app14041389
Submission received: 21 December 2023 / Revised: 5 February 2024 / Accepted: 6 February 2024 / Published: 8 February 2024
(This article belongs to the Special Issue Seismic Data Processing and Imaging)

Abstract

:
In marine seismic exploration, seismic signals comprise primaries that undergo first-order scattering, as well as multiples resulting from multi-order scattering events. Surface-related multiples involve multi-order scattering at the free surface interface between seawater and air and exhibit a smaller reflection angle and broader illumination compared to primaries. Internal multiples, originating from multi-order scattering among stratified layers, provide additional illumination compensation beneath the reflecting interface. However, in conventional primary migration, different-order wavefields may result in crosstalk artifacts. To address this issue, we developed a least-squares migration (LSM) method based on the multi-order wavefield global normalization condition. This methodology investigates the illumination effects and crosstalk artifacts associated with different-order surface-related and internal multiples, and then modifies the global normalization condition by incorporating an illumination compensation perspective. Virtual sources, represented by surface-related multiples and internal multiples, are integrated into the source compensation term, ultimately yielding a multi-order wavefield normalization condition. This normalization condition is subsequently combined with least-squares full-wavefield migration (LSFWM). Numerical experiments demonstrate that the normalization condition of multi-order wavefields can resolve the problem of weak deep imaging energy and promote the suppression of multiple crosstalk artifacts in the least-squares algorithm.

1. Introduction

Marine seismic data are accompanied by strong multiples, and addressing these multiples has become a crucial aspect of seismic processing. Traditional migration algorithms focus on primaries, and multiples are treated as noise and are removed from the data before seismic migration. However, in contrast to other interference noise, multiples represent true seismic responses that have experienced multiple scattering and contain information about subsurface structures. Multiples can be integrated into seismic migration and inversion as valuable signals. Compared to primaries, surface-related multiples can be regarded as plane sources at the free surface, offering an extended lateral illumination range relative to the sparser point sources. In terms of reflection angles and propagation paths, surface-related multiples have smaller reflection angles and longer propagation paths. Higher-order multiples generate even smaller reflection angles, leading to increased vertical resolution of the imaging results. Internal multiples are produced at strongly reflective interfaces in the subsurface, such as salt domes, and can be interpreted as additional secondary scattering sources between layers. This provides supplementary illumination beneath substantial shielding layers, such as salt domes. Many studies have demonstrated the advantages of utilizing multiple imaging [1,2,3,4,5,6,7,8,9,10,11,12,13,14].
Seismic migration imaging technology has played a positive role in obtaining underground reflection coefficients and geological structure investigations [15,16]. However, the migration results represent only approximate values of the subsurface reflection coefficients. To further seek the accurate distribution of underground structures, the least-squares technique is widely applied in migration imaging and tomographic inversion [17,18,19,20,21], yielding excellent results. LSM typically considers scenarios involving only primary reflections. However, when data contain both primary and multiple reflections, multiples generate a substantial amount of crosstalk artifacts, which pose significant constraints on the practical application of imaging techniques. Coherent artifacts of surface-related multiples primarily arise from improper correlation imaging between unrelated multi-order wavefields. Internal multiples have complex and variable paths, complicating the simulation of internal multiple paths during forward propagation and posing challenges in achieving correct imaging. Currently, various methods are utilized to suppress the crosstalk. One category of methods focuses on migration imaging conditions, such as migration using deconvolution-type imaging conditions [22,23,24] and stereographic imaging conditions [25]. Deconvolution is effective for short-period crosstalk, but it underperforms in suppressing strong coherent crosstalk events [26]. Another category of methods includes least-squares migration methods, which can be further classified into those that separate multiples for least-squares migration and those that utilize the simultaneous imaging of joint primaries and multiples for least-squares migration. Specifically, in least-squares reverse time migration of multiples (LSRTMM) containing primaries and surface-related multiples [27,28], surface-related multiples serve as plane sources, which, together with point sources, form the total downward wavefield for migration. Subsequently, the least-squares strategy is employed to suppress the crosstalk. The generalized internal multiple imaging (GIMI) method can simulate high-order internal scattering through interference and can subsequently develop least-squares suppression of artifacts [29,30]. Full-wavefield migration (FWM) offers various strategies for combining primary and multiple imaging [31,32,33,34,35] and uses closed-loop one-way wave operators and inversion strategies to simultaneously process data containing surface-related multiples and internal multiples. Another approach involves least-squares reverse time migration (LSRTM) for separately extracted multiples. LSRTM with controlled-order multiples migration (LSRTM-CM) [36] utilizes surface-related multiple elimination (SRME) to separate different-order multiples and then applies least-squares reverse time migration for direct multiple imaging. Subsequently, phase-encoded reverse time migration and LSRTM multiple imaging were developed [37,38]. In recent years, viscoacoustic LSRTM of separated multiples has also been investigated [39]. Another approach is the Marchenko imaging algorithm [40,41,42], which can be implemented by applying a reconstructed reference surface, directly circumventing crosstalk generated by internal multiples in the overburden. However, this method relies on dense sampling conditions, restricting its application to field data.
In this paper, we target full-wavefield imaging (surface-related multiples and internal multiples) and modify the global normalization conditions for all shots to consider the illumination of surface-related and internal multiple downward wavefields, which is further combined with least-squares migration. The remainder of this paper is organized as follows. First, we analyze the crosstalk artifacts and downward illumination wavefields of surface-related and internal multiples of different orders, and then we derive the global normalization conditions for multi-order wavefields in combination with amplitude normalization conditions and apply them to full-wavefield least-squares migration. Finally, we use synthetic data to verify our algorithm.

2. Methods

2.1. Different-Order Multiple Crosstalk Artifacts and Illumination Analysis

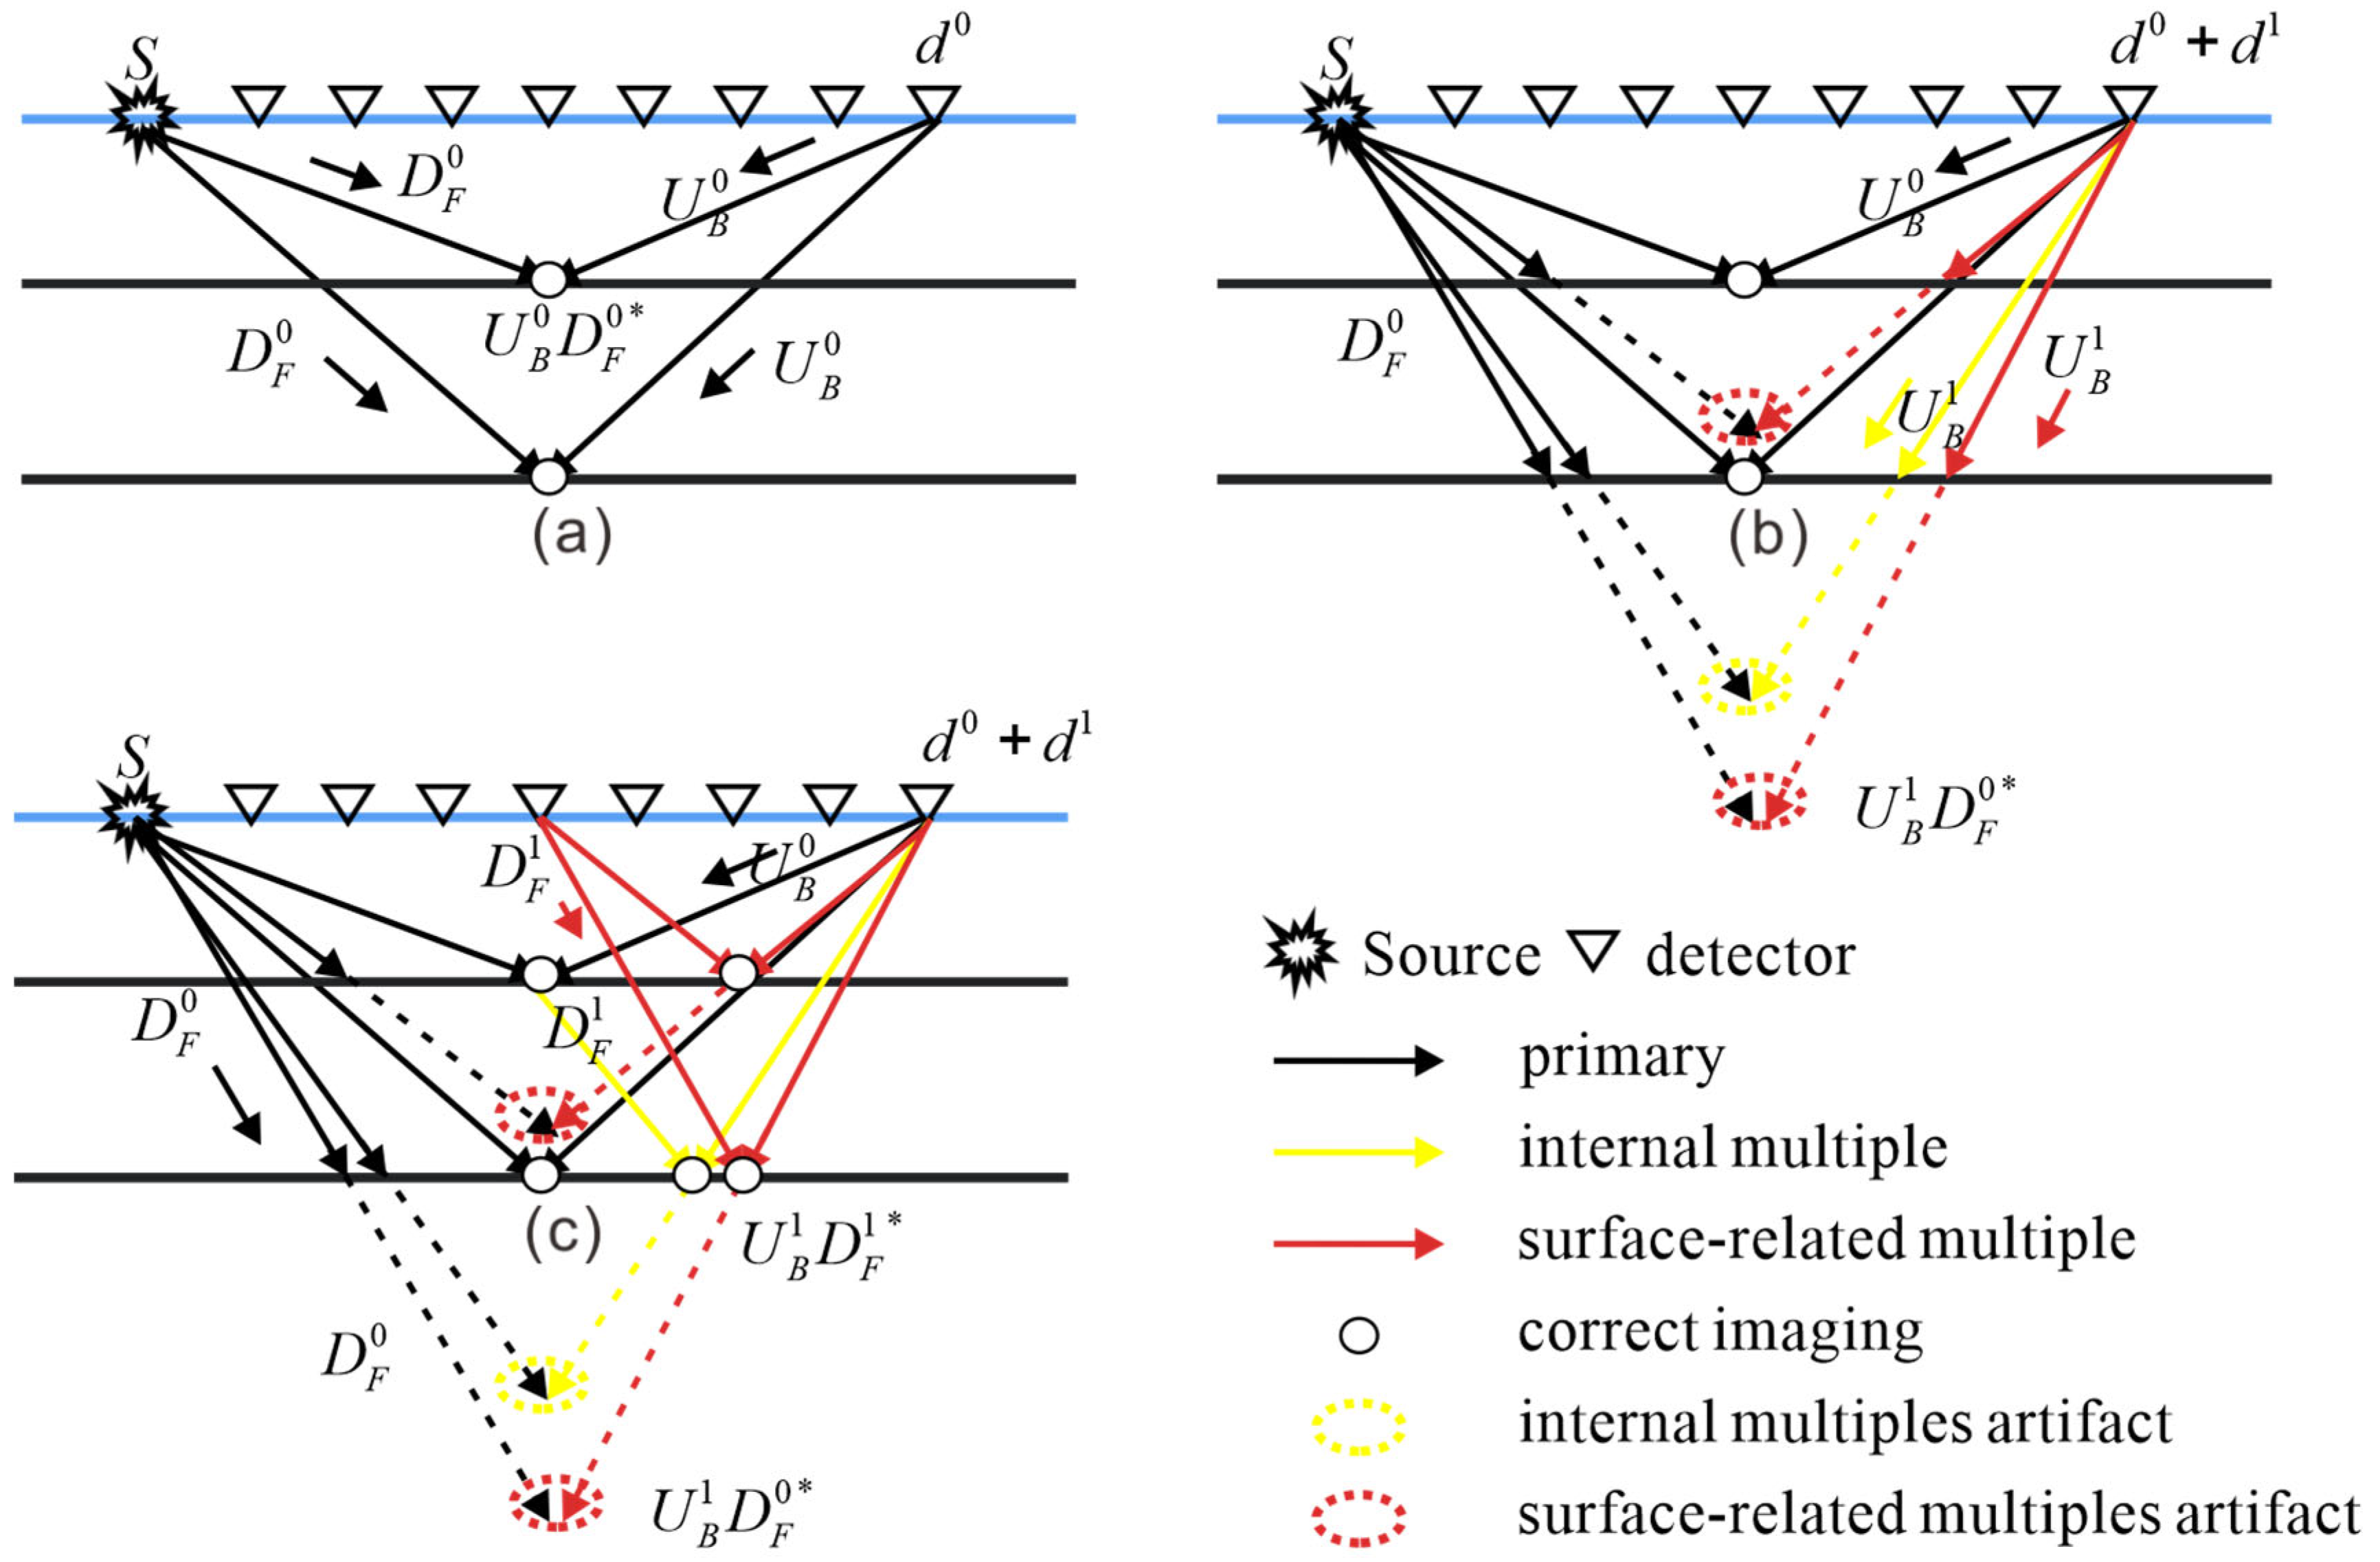
Seismic data contain various wavefield components, such as direct waves, primaries, multiples, and refracted waves. Both primaries and multiples act as authentic reflections of the subsurface, and they convey valuable information and constitute effective signals. In this paper, we define the primaries and all-order multiples as the full-wavefield data. Figure 1 is a schematic diagram of multiple paths. S denotes the source wavelet, D denotes the downward wavefields, U denotes the upward wavefields, and the subscript F denotes forward propagation. The superscript i denotes the ( i + 1 ) th - order scattering, where first-order scattering i = 0 corresponds to the primary wave, second-order scattering i = 1 is refers to first-order multiples, third-order scattering i = 2 refers to second-order multiples, and so on. d 0 denotes the seismic record of primaries, d 1 denotes the seismic record of first-order multiples, and d 2 denotes the seismic record of second-order multiples. Primaries d 0 are the wavefield with only one scattering event occurring in the subsurface S - D F 0 - U F 0 . Multiples are wavefields that, following the primary scattering event, re-inject into the medium as virtual sources and undergo multi-order scattering. d 1 denotes a second-order scattering event, and refers to a first-order multiple with a path of S - D F 0 - U F 0 - D F 1 - U F 1 . Multiples can be divided into surface-related multiples and internal multiples based on the location of the virtual sources. For surface-related multiples, the sea surface or other free surfaces act as secondary virtual sources for incidence (red line path in Figure 1b), while the virtual source of internal multiples is a strong subsurface reflector (yellow line path in Figure 1c). Figure 1d represents the sum of the primary wave, first-order surface-related multiples, and first-order internal multiples d 0 + d 1 . For clarity, only the first-order multiples are shown here. For ease of intuitive understanding, in Figure 1 and Figure 2, we consider only the first-order multiples and the primary wave as the full-wavefield data to illustrate the imaging of different orders of the wavefield.
Primary migration can be described as the zero-lag cross-correlation between the forward-propagating source wavelet and the primary wavefield at the receiver location:
I ( x ) = ω U B 0 ( x , ω ) D F 0 ( x , ω ) ,
where D F 0 ( x , ω ) is the complex conjugation of the primary downward forward propagation wavefield, U B 0 ( x , ω ) is the primary upward backward propagation wavefield, the subscript B denotes backward propagation, ω is the angular frequency, I ( x ) is the depth imaging result, and x denotes the image position.
When seismic data contain both primary and multiple waves, the receiver wavefield can be written as follows:
U = i U i ,
where U is the primary and all-order multiple upward wavefield. The superscript i denotes the ( i + 1 ) th - order scattering, for example, U 0 is the primary upward wavefield, U 1 is the first-order multiple upward wavefield, U 2 is the second-order multiple upward wavefield, and U 3 is the third-order multiple upward wavefield.
When the receiver wavefields contain both primaries and multiples simultaneously, crosstalk artifacts arise in the primary migration algorithm. The forward propagating primary wavefield and the backward propagation primary wavefield are correct imaging (the first term in the expanded form of Equation (3)), while different orders of surface-related and internal multiples are crosstalk artifacts and represent a type of strong coherent noise (the second term in the expanded form of Equation (3)).
I ( x ) = ω U B i ( x , ω ) D F 0 ( x , ω ) = ω U B 0 ( x , ω ) D F 0 ( x , ω )   correct   imaging   + ω U B 1 ( x , ω ) D F 0 ( x , ω ) + U B 2 ( x , ω ) D F 0 ( x , ω ) + U B 3 ( x , ω ) D F 0 ( x , ω ) +   c r o s s t a l k   a r t i f a c t ,
where U B i ( x , z , ω ) is the upward backward propagation wavefield of the ( i + 1 ) th - order scattering, that is, U B 0 ( x , ω ) denotes the primary upward backward propagation wavefield, U B 1 ( x , ω ) denotes the first-order multiple upward backward propagation wavefield, U B 2 ( x , ω ) denotes the second-order multiple upward backward propagation wavefield, and so on.
Full-wavefield migration (FWM) treats surface-related multiples and internal multiples as virtual sources in the source forward propagation process and uses the full-wavefield data containing multiples as the receiver wavefield. In accordance with the theory of controlled-order multiple migration [36], the imaging can be analytically decomposed into a composite of images generated by different orders of wavefields (Equation (4)).
I ( x ) = ω U B i ( x , ω ) D F j ( x , ω ) = ω U B 0 ( x , ω ) D F 0 ( x , ω )   primary   correct   imaging + ω U B 1 ( x , ω ) D F 1 ( x , ω ) + U B 2 ( x , ω ) D F 2 ( x , ω ) + U B 3 ( x , ω ) D F 3 ( x , ω ) + multiple   correct   imaging + ω U B 1 ( x , ω ) D F 0 ( x , ω ) + U B 2 ( x , ω ) D F 0 ( x , ω ) + U B 3 ( x , ω ) D F 0 ( x , ω ) + + ω U B 2 ( x , ω ) D F 1 ( x , ω ) + U B 3 ( x , ω ) D F 2 ( x , ω ) + U B 4 ( x , ω ) D F 3 ( x , ω ) +   c r o s s t a l k   a r t i f a c t + ω U B 0 ( x , ω ) D F 1 ( x , ω ) + U B 1 ( x , ω ) D F 2 ( x , ω ) + U B 0 ( x , ω ) D F 2 ( x , ω ) U B 2 ( x , ω ) D F 3 ( x , ω ) + U B 1 ( x , ω ) D F 3 ( x , ω ) + U B 0 ( x , ω ) D F 3 ( x , ω ) +   c r o s s t a l k   a r t i f a c t .
The source wavefields consist of the primary downward forward propagation wavefield D F 0 ( x , ω ) and the multiple downward forward propagation wavefield D F j ( x , ω ) ( j > 0 ) , and the receiver wavefields consist of the primary upward backward propagation wavefield U B 0 ( x , ω ) and the multiple upward backward propagation wavefield U B i ( x , ω ) ( i > 0 ) . According to the analysis of the expanded terms, Equation (4), U B 0 ( x , ω ) D F 0 ( x , ω ) is the correct imaging of the primary, ω U B i ( x , ω ) D F i ( x , ω ) is the correct imaging of the multiple. All the other components are considered crosstalk artifacts. Figure 2 illustrates the crosstalk artifact and correct imaging of each order of scattering in Equations (1), (3) and (4). Figure 2a corresponds to the application of the primary migration method to the processing of the primary wave data and represents a correct image without crosstalk artefacts. Figure 2b corresponds to the primary migration method applied to the full-wavefield data, where internal multiples and surface-related multiples cause crosstalk artefacts. Figure 2c corresponds to the full-wavefield migration method applied to the full-wavefield data, resulting in correct imaging of some surface-related and internal multiples. Compared to Figure 2b, the number of correctly imaged points is increased.
To analyze the crosstalk artifact and correct imaging of each order of scattering in Equations (1), (3) and (4), a full-wavefield modeling algorithm can be used to simulate different order multiples. The full-wavefield modeling algorithm (FWMOD) [43] can be used to simulate the full-wavefield data, including high-order scattering in the forward model. Equation (5) formulates the following modeling scheme for the downward wavefield:
D F z m = n = 0 m 1 W D z m , z n δ S z n ,
where D F z m is the downward forward propagation wavefield at the depth level z m , δ S z n represents the scattered wavefield at every grid point positioned at the depth level z n , matrix W D z m , z n represents a cumulative downward propagation operator that brings the scattered wavefield related to the depth level z n to the depth level z m , which is formulated as follows:
W D z m , z n = W D z m , z m 1 W D z m 1 , z m 2 × × W D z n + 1 , z n .
Equation (7) formulates the following modeling scheme for the upward wavefield:
U F z m = n = m + 1 N W U z m , z n δ S z n ,
where U F z m is the upward forward propagation wavefield at the depth level z m , matrix W U z m , z n represents a cumulative upward propagation operator that brings the scattered wavefield related to the depth level z n to the depth level z m , which is formulated as follows:
W U z m , z n = W U z m , z m + 1 W U z m + 1 , z m + 2 × × W U z n 1 , z n
The scattering operator δ S z m depends on the reflectivity operator R z m , the downward wavefield D F z m , and the upward wavefield U F z m ,
δ S z m = R z m D F z m + R z m U F z m ,
where R and R are the reflectivity matrices from above and below, R = R .
The formula for calculating the ( i + 1 ) th - order scattering wavefield M i l l u i two-way wavefield illumination is as follows:
M i l l u i ( z ) = ω n s h o t D F i ( z , ω ) D F i ( z , ω ) * + U F i ( z , ω ) U F i ( z , ω ) * ,
where n s h o t is the number of shots.
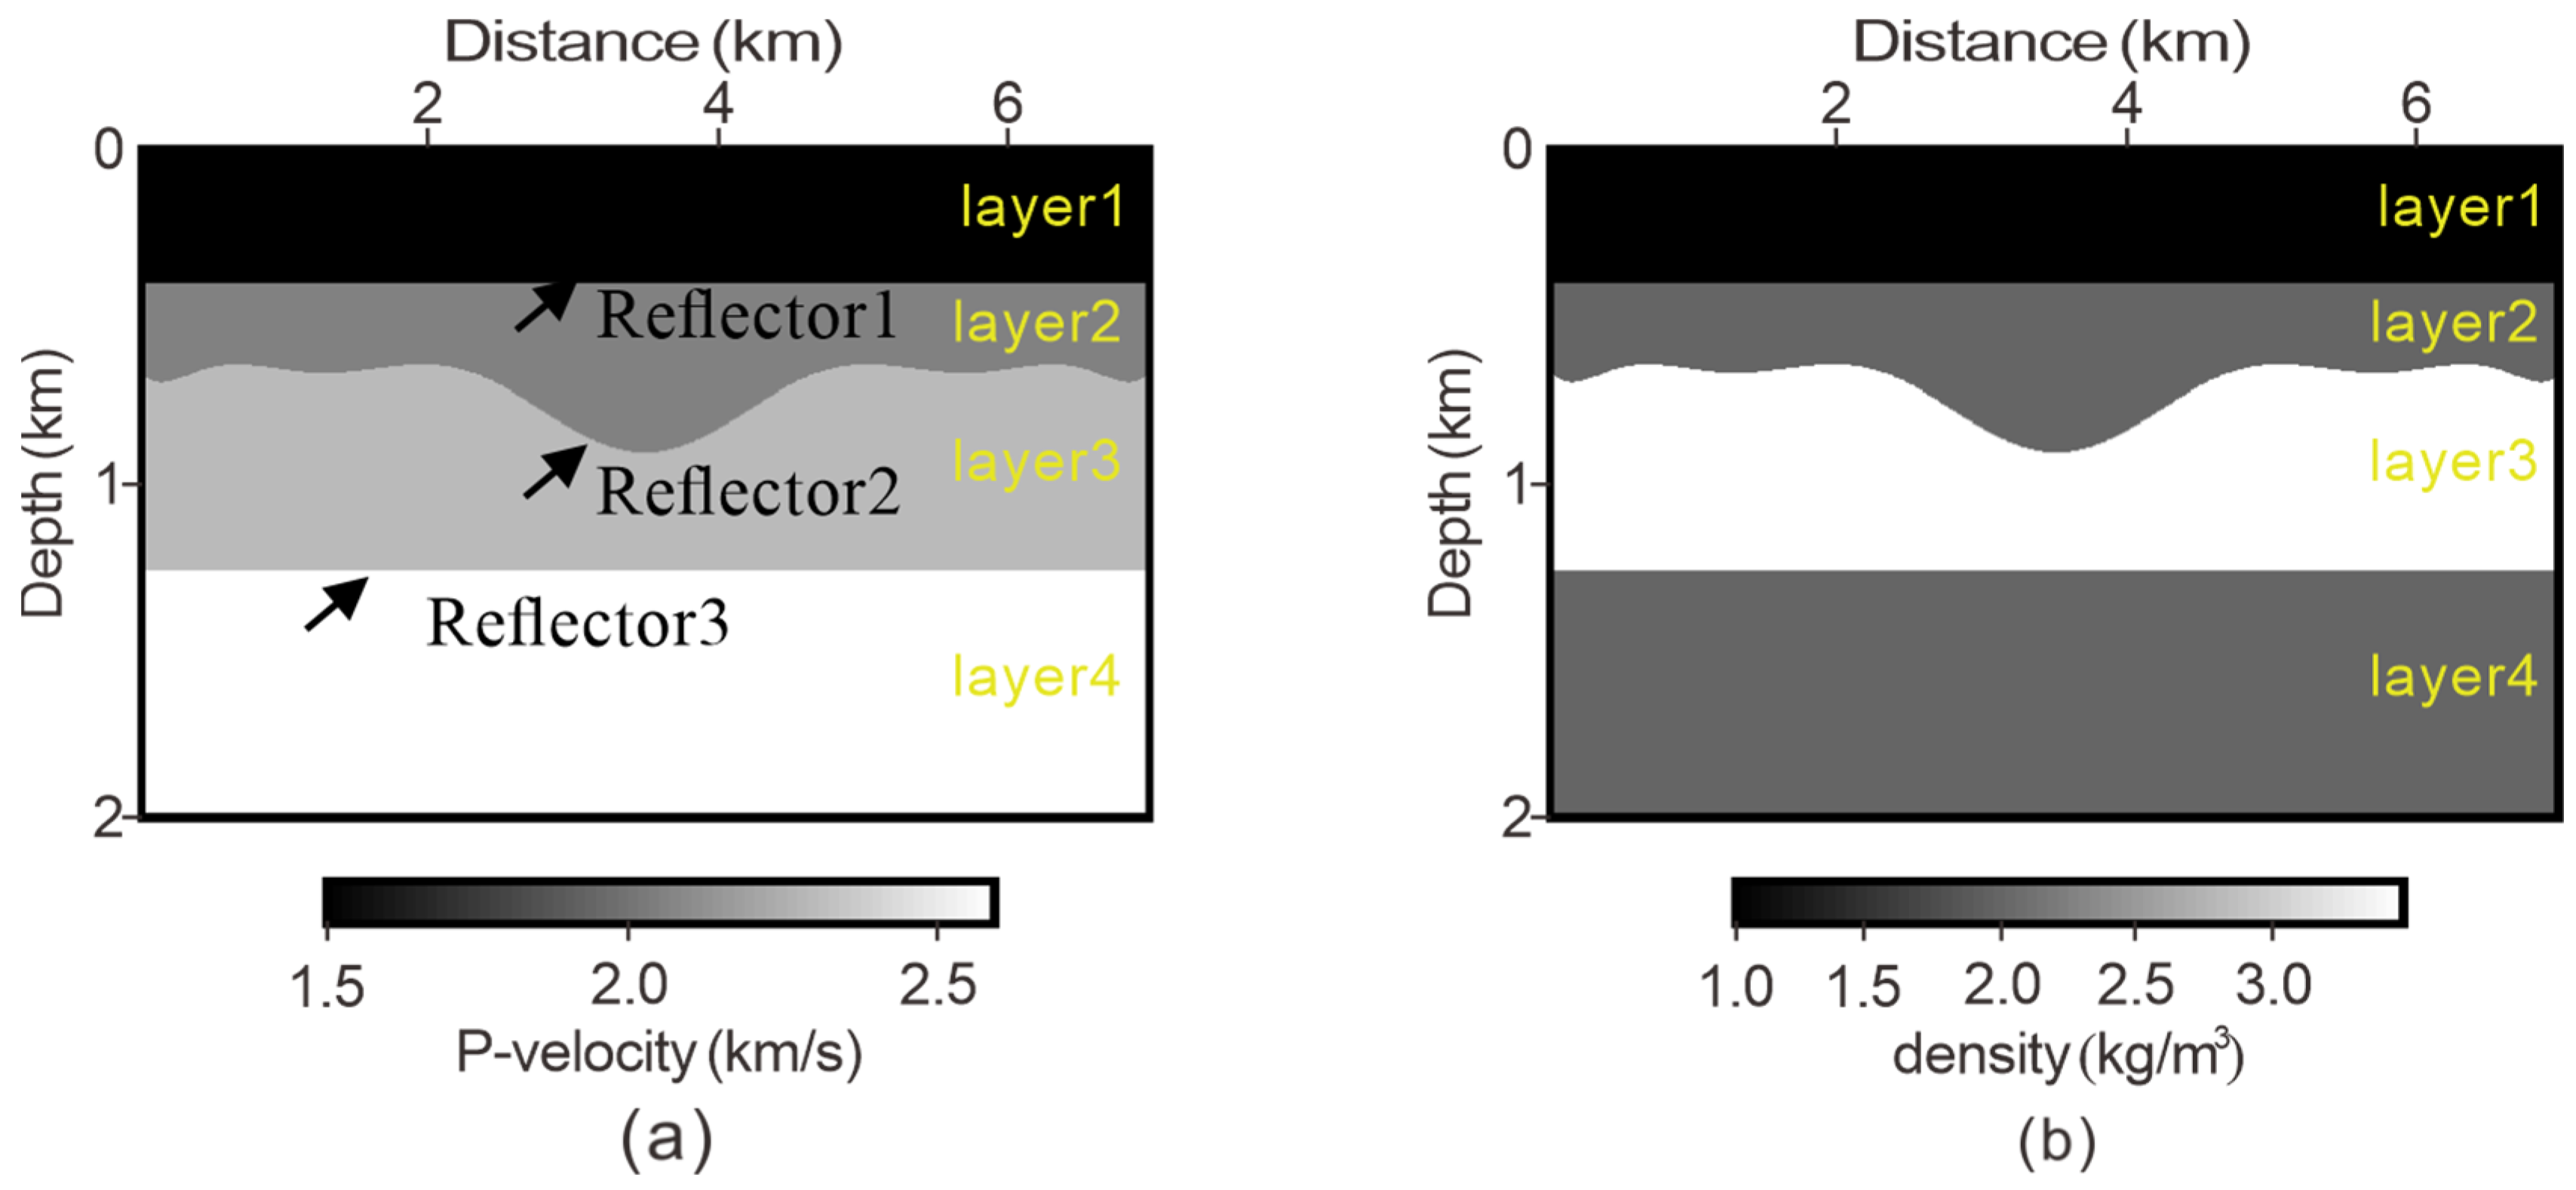
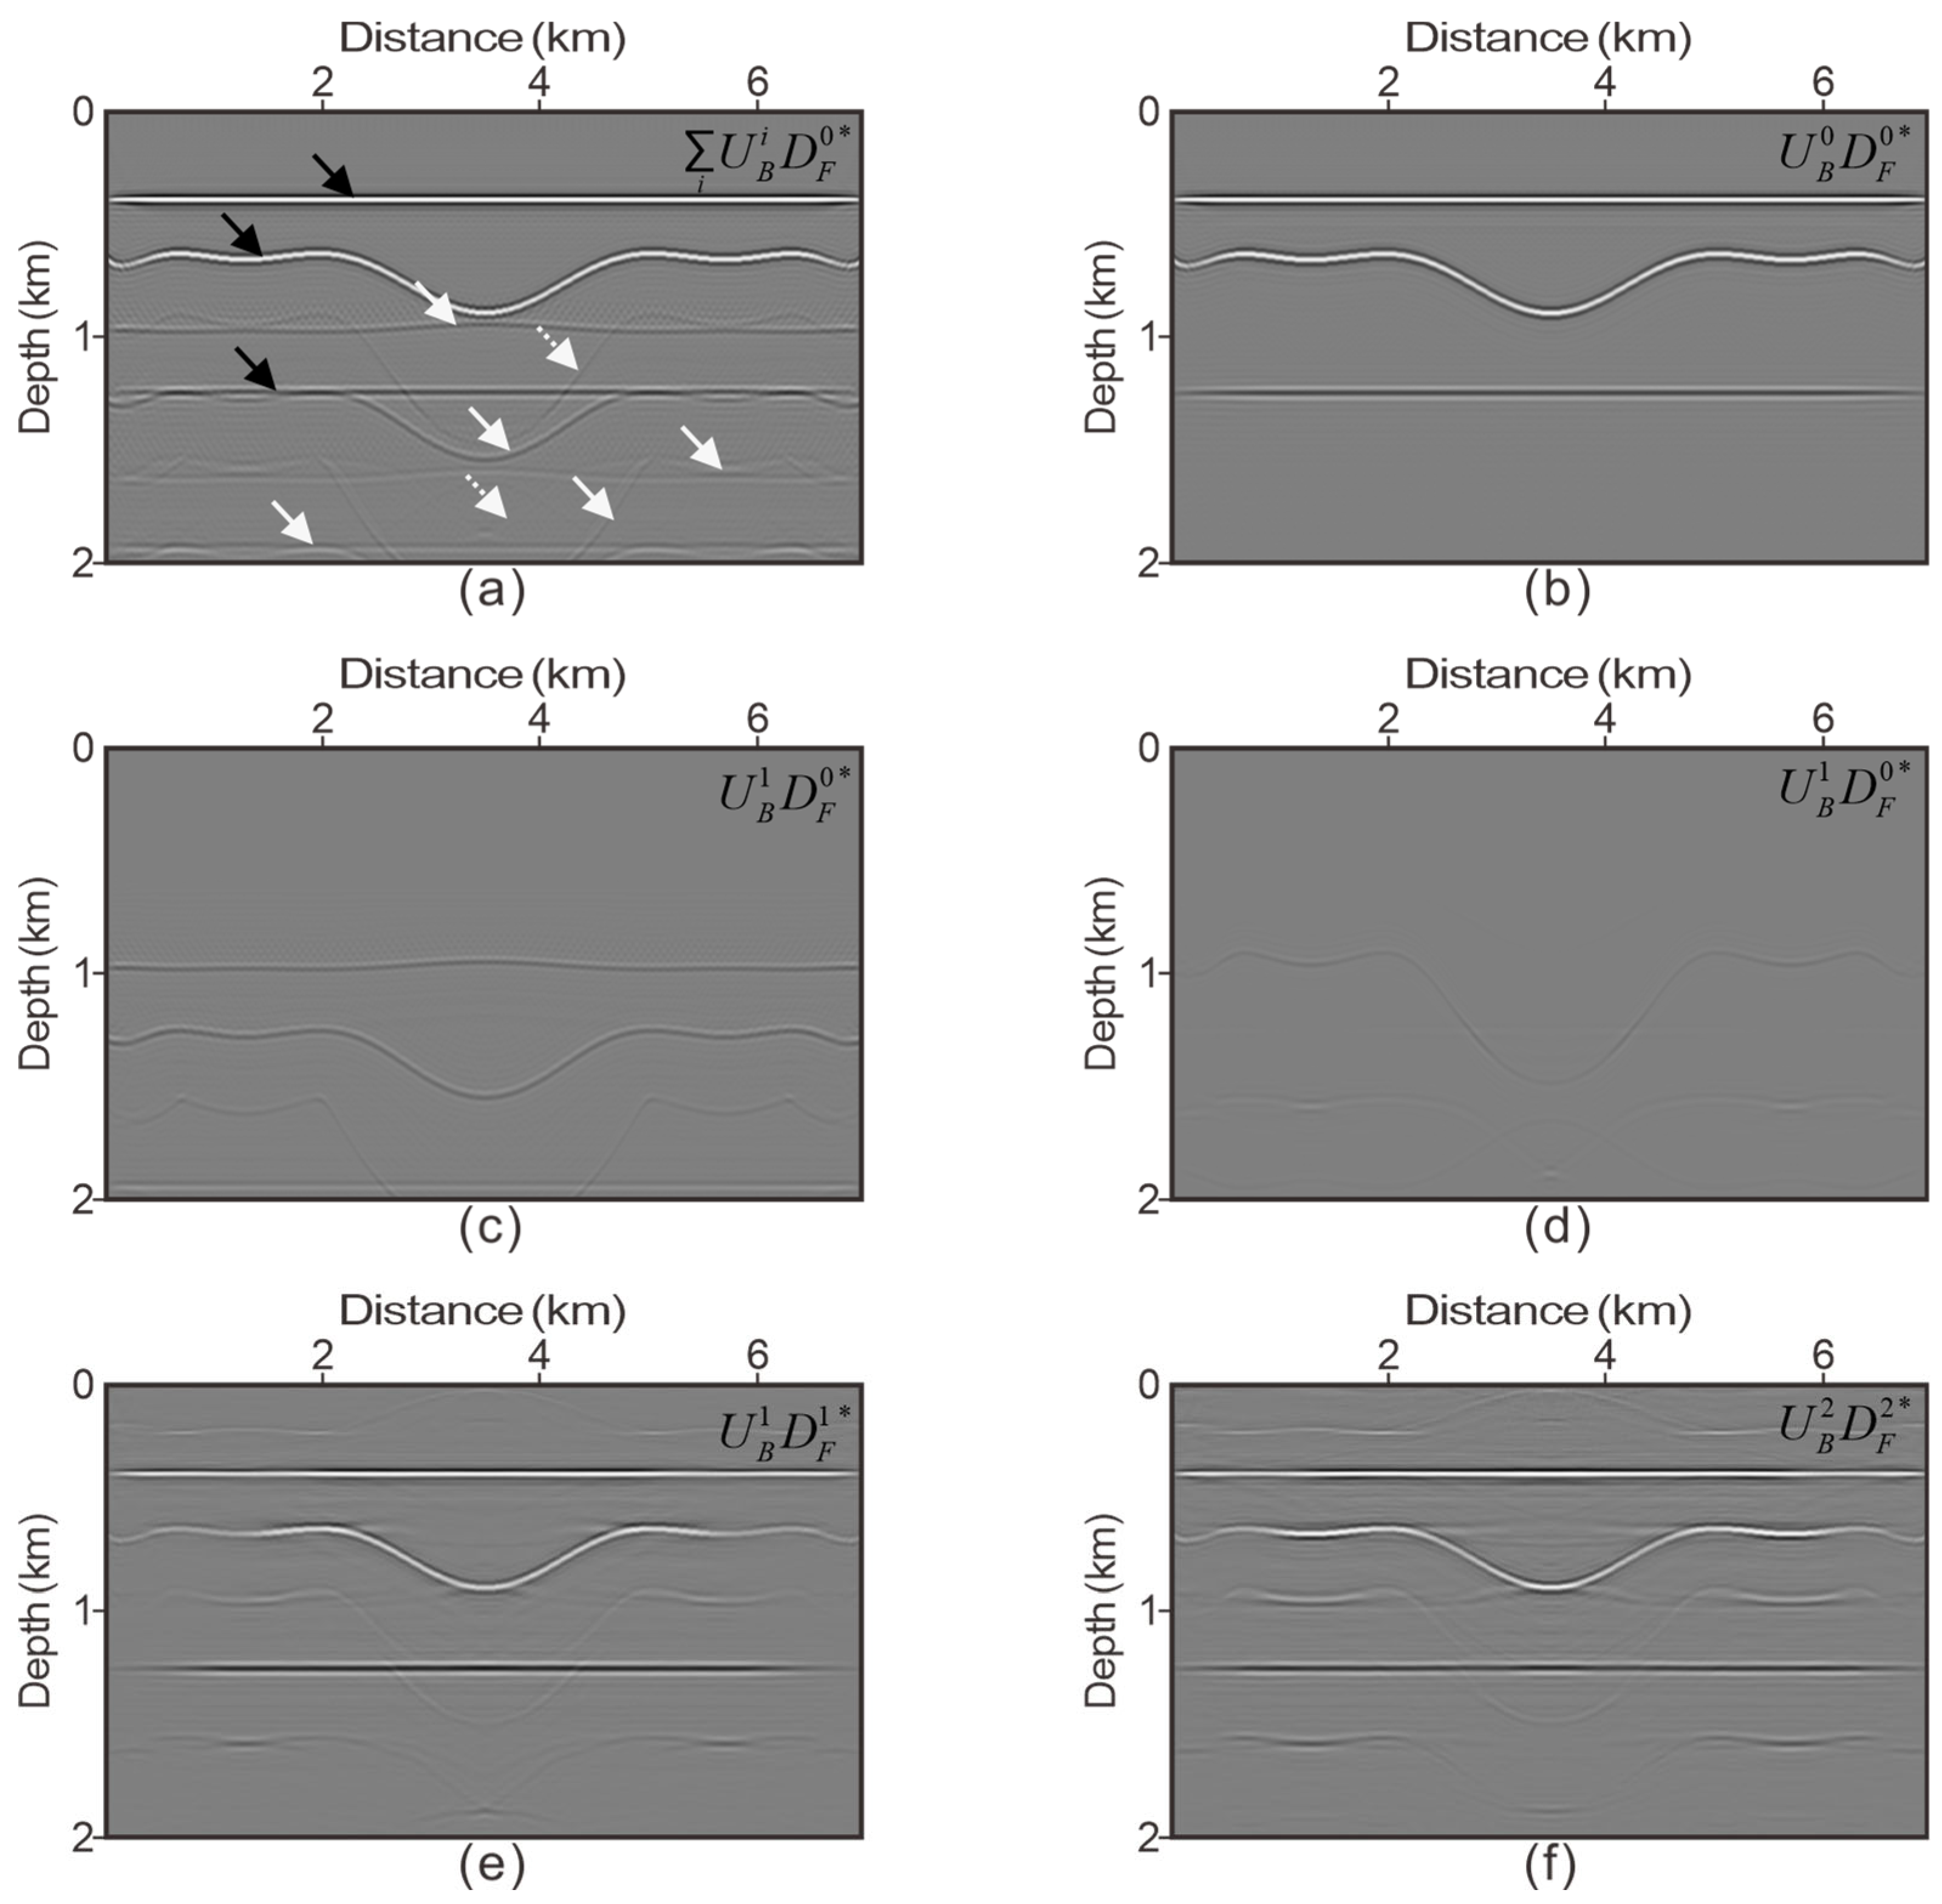
We use a simple four-layer model, and the velocity model and density model are shown in Figure 3. We then employed the FWMOD algorithm to generate primary waves and multiples of different orders. We performed migration imaging on each wavefield separately and obtained the crosstalk artifact and correct imaging results for each order’s scattering (Figure 4). Figure 4a displays an image of the primary migration of full-wavefield data, as described in Equation (3). Figure 4b illustrates an image of the primary migration of primary data, as described in Equation (1). Figure 4c,d demonstrates the crosstalk artifact of the first-order surface-related multiple and first-order internal multiple, respectively, as shown in Equation (4) U B 1 D F 0 . Figure 4e shows the correct imaging of the first-order surface-related multiple, corresponding to U B 1 D F 1 in Equation (4). Figure 4f shows the correct imaging of the second-order surface-related multiple, corresponding to U B 2 D F 2 in Equation (4).
Within the context of multiple imaging, both the surface-related multiples and internal multiples are incorporated during the source forward propagation process. The surface-related multiples and internal multiples can be regarded as new virtual sources, allowing for illumination analysis to be conducted on the primaries and different orders of multiples (Figure 5). The use of normalized amplitude is employed to represent the illumination intensity, achieved by dividing by the average energy of the first depth grid point illuminated by the primary wave. Figure 5a illustrates only primary wavefield illumination. Figure 5b shows the illumination of the primary wavefield and the internal multiple wavefield. Compared to Figure 5a, the illumination of the third layer is significantly increased. Figure 5c shows the illuminance of the primary wavefield and the surface-related multiplied wavefield. The illumination of the shallow layer is significantly increased compared to Figure 5a. Figure 5d illustrates the illumination intensity of the primary wavefield, surface-related multiple wavefields, and internal multiple wavefields (full-wavefield data). The full-wavefield data exhibit superior illumination performance compared to the primary.
Full-wavefield migration performs forward propagation of multiples from virtual sources in the migration process, providing additional illumination for the imaging process. This is analyzed in detail in the next section. By modifying the global normalization imaging condition, the illumination compensation of the multiples is added to the imaging process.

2.2. Multi-Order Wavefield Global Normalization Imaging Condition

The deconvolution imaging condition I d e c o was proposed by Claerbout [44].
I d e c o ( x ) = ω n s h o t U B ( x , ω ) D F ( x , ω ) ,
where U B ( x , ω ) denotes the backward-propagating upward wavefield at the receiver, and D F ( x , ω ) denotes the forward-propagating downward wavefield at the source.
The cross-correlation imaging condition I c o r r is as follows:
I c o r r ( x ) = ω n s h o t U B ( x , ω ) D F ( * x , ω ) .
Compared to the cross-correlation imaging condition, the deconvolution imaging condition has the instability of a zero denominator. Many methods have been proposed to improve this, and Equation (13) I s m d e c o is the well-known smoothing deconvolution imaging condition [16] of adding a smoothing window with a small number ε . This can ensure the stability of the algorithm, but the validity of its value is limited, to some extent, by the selection of the number ε . In primary imaging, the source’s forward wavefield only has a primary wavefield, while in multiple imaging, additional virtual source wavefields are involved, making the selection of an appropriate ε value more difficult.
I s m d e c o ( x ) = ω n s h o t U B ( x , ω ) D F ( * x , ω ) U B ( x , ω ) D F ( * x , ω ) + ε .
Equation (13) can be further improved to a global normalization imaging condition I g l (Equation (14)). For each single-frequency component, the denominator term considers the forward wavefields of all the shot points, and its physical meaning is the energy distribution of all the shots in the subsurface space. The advantage of this imaging condition is that, since it calculates each single-frequency component, it retains the resolution-improving characteristic of the deconvolution imaging condition while providing additional illumination compensation, promoting the subsequent least-squares migration.
I g l ( x ) = ω n s h o t U B ( x , ω ) D F ( * x , ω ) n s h o t U B ( x , ω ) D F ( * x , ω ) .
Considering that multiples can provide broader illumination, Equation (14) can be further improved by adding illumination compensation for multiple orders of surface-related multiples and internal multiples to the denominator term, resulting in a global-normalized imaging condition for multiple-order wavefields I m g l (Equation (15)), which can be used for both multiple and primary imaging frameworks.
I m g l ( x ) = ω n s h o t U B ( x , ω ) D F i ( x , ω ) n s h o t D F i ( x , ω ) D F i ( x , ω ) = ω n s h o t U B ( x , ω ) D F 0 ( x , ω ) + D F 1 ( x , ω ) + n s h o t D F 0 ( x , ω ) + D F 1 ( x , ω ) + D F 0 ( x , ω ) + D F 1 ( x , ω ) + .

2.3. Full-Wavefield Least-Squares Migration Imaging

The use of least-squares migration to eliminate imaging artifacts, improve the spatial resolution, and balance the imaging amplitude has been widely studied. It obtains the optimal reflection coefficient through least-squares fitting of the observed data and simulated data, and the mathematical expression is as follows:
J ( m ) = ω d 2 2 = ω d o b s L m 2 2 m = arg min ω d o b s L m 2 2 ,
where Equations (5)–(9) define L as the full-wavefield forward operator, m is the imaging result, and d o b s is the observed data.
The gradient term of the reflection coefficient can be expressed as follows:
g ( x ) = L T d o b s d c a l ,
where g ( x ) is the imaging gradient, L T is the adjoint operator of the forward operator L , and d c a l is the demigration data. For stability, we chose the steepest descent method:
m k + 1 ( x ) = m k ( x ) + α k g k ( x ) ,
where α k is the linear search step size for the kth iteration.
By incorporating the multi-order wavefield global normalization imaging condition, the gradient solution for full-wavefield migration becomes
L T d o b s = ω n s h o t U B ( x , ω ) D F 0 ( x , ω ) * n s h o t D F 0 ( x , ω ) D F 0 ( x , ω ) * ,
L T d o b s d c a l = ω n s h o t U B ( x , ω ) D F 0 ( x , ω ) + D F 1 ( x , ω ) + * n s h o t D F 0 ( x , ω ) + D F 1 ( x , ω ) + D F 0 ( x , ω ) + D F 1 ( x , ω ) + * ,
where δ U B ( x , ω ) is the residual data backward-propagating upward wavefield.
By applying the above algorithm, we established a least-squares migration method with a multi-order wavefield global normalization imaging condition, improving the resolution of the gradient term and providing additional illumination compensation for deep areas, which is beneficial for the inversion problem.

3. Results

3.1. Four-Layer Model: Finite Difference Data

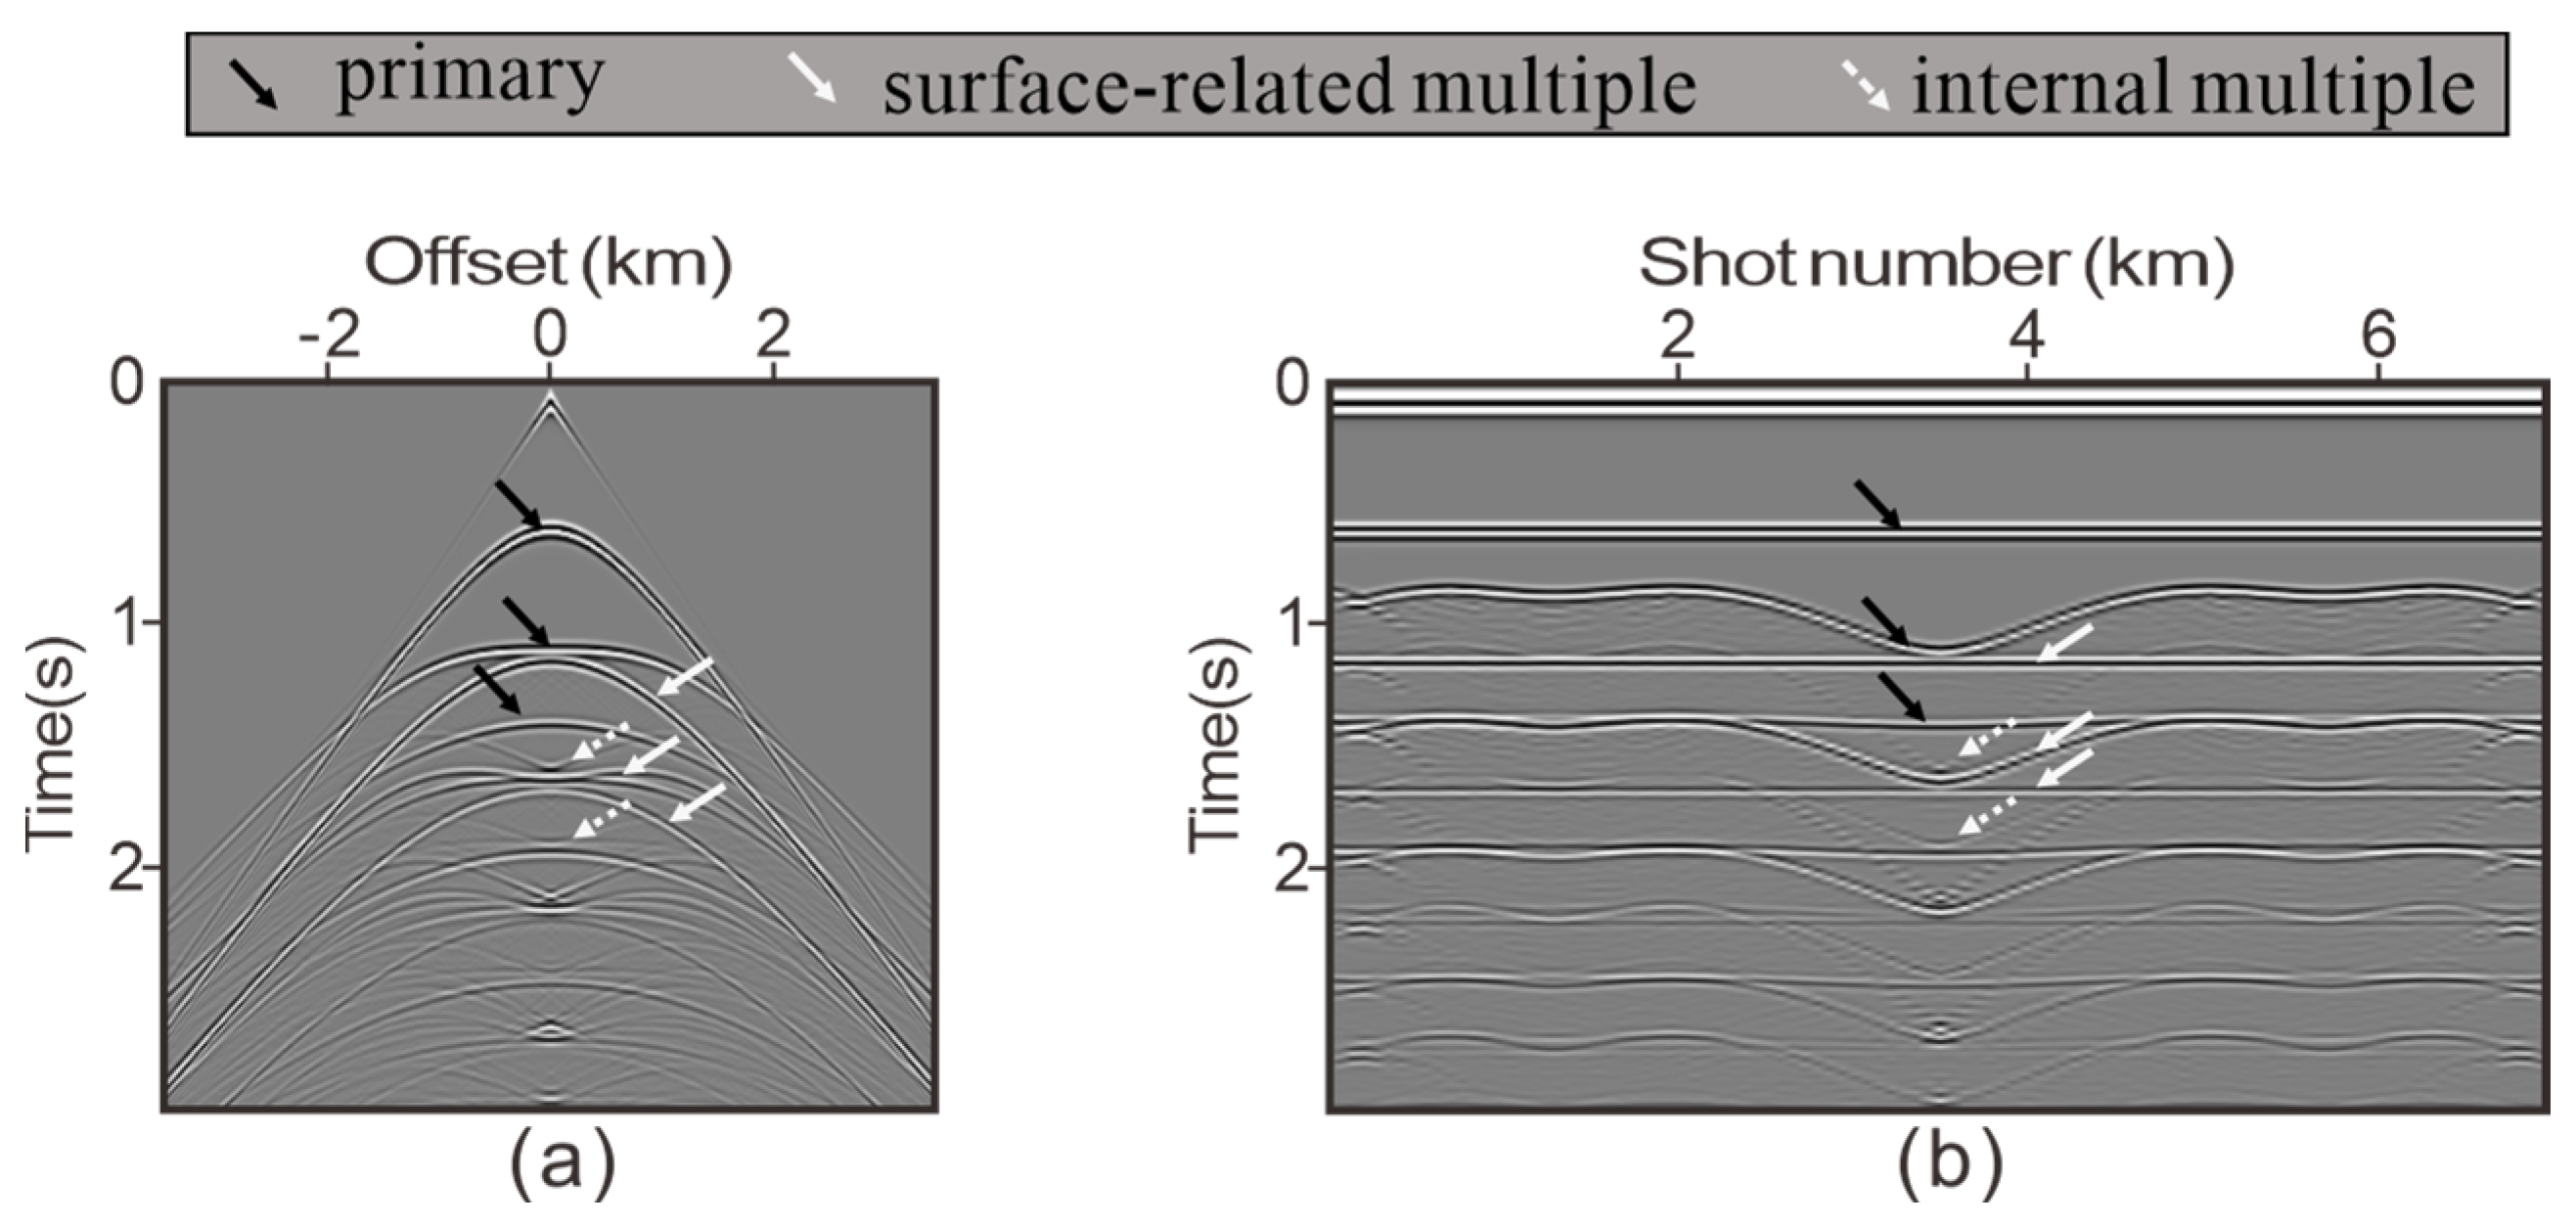
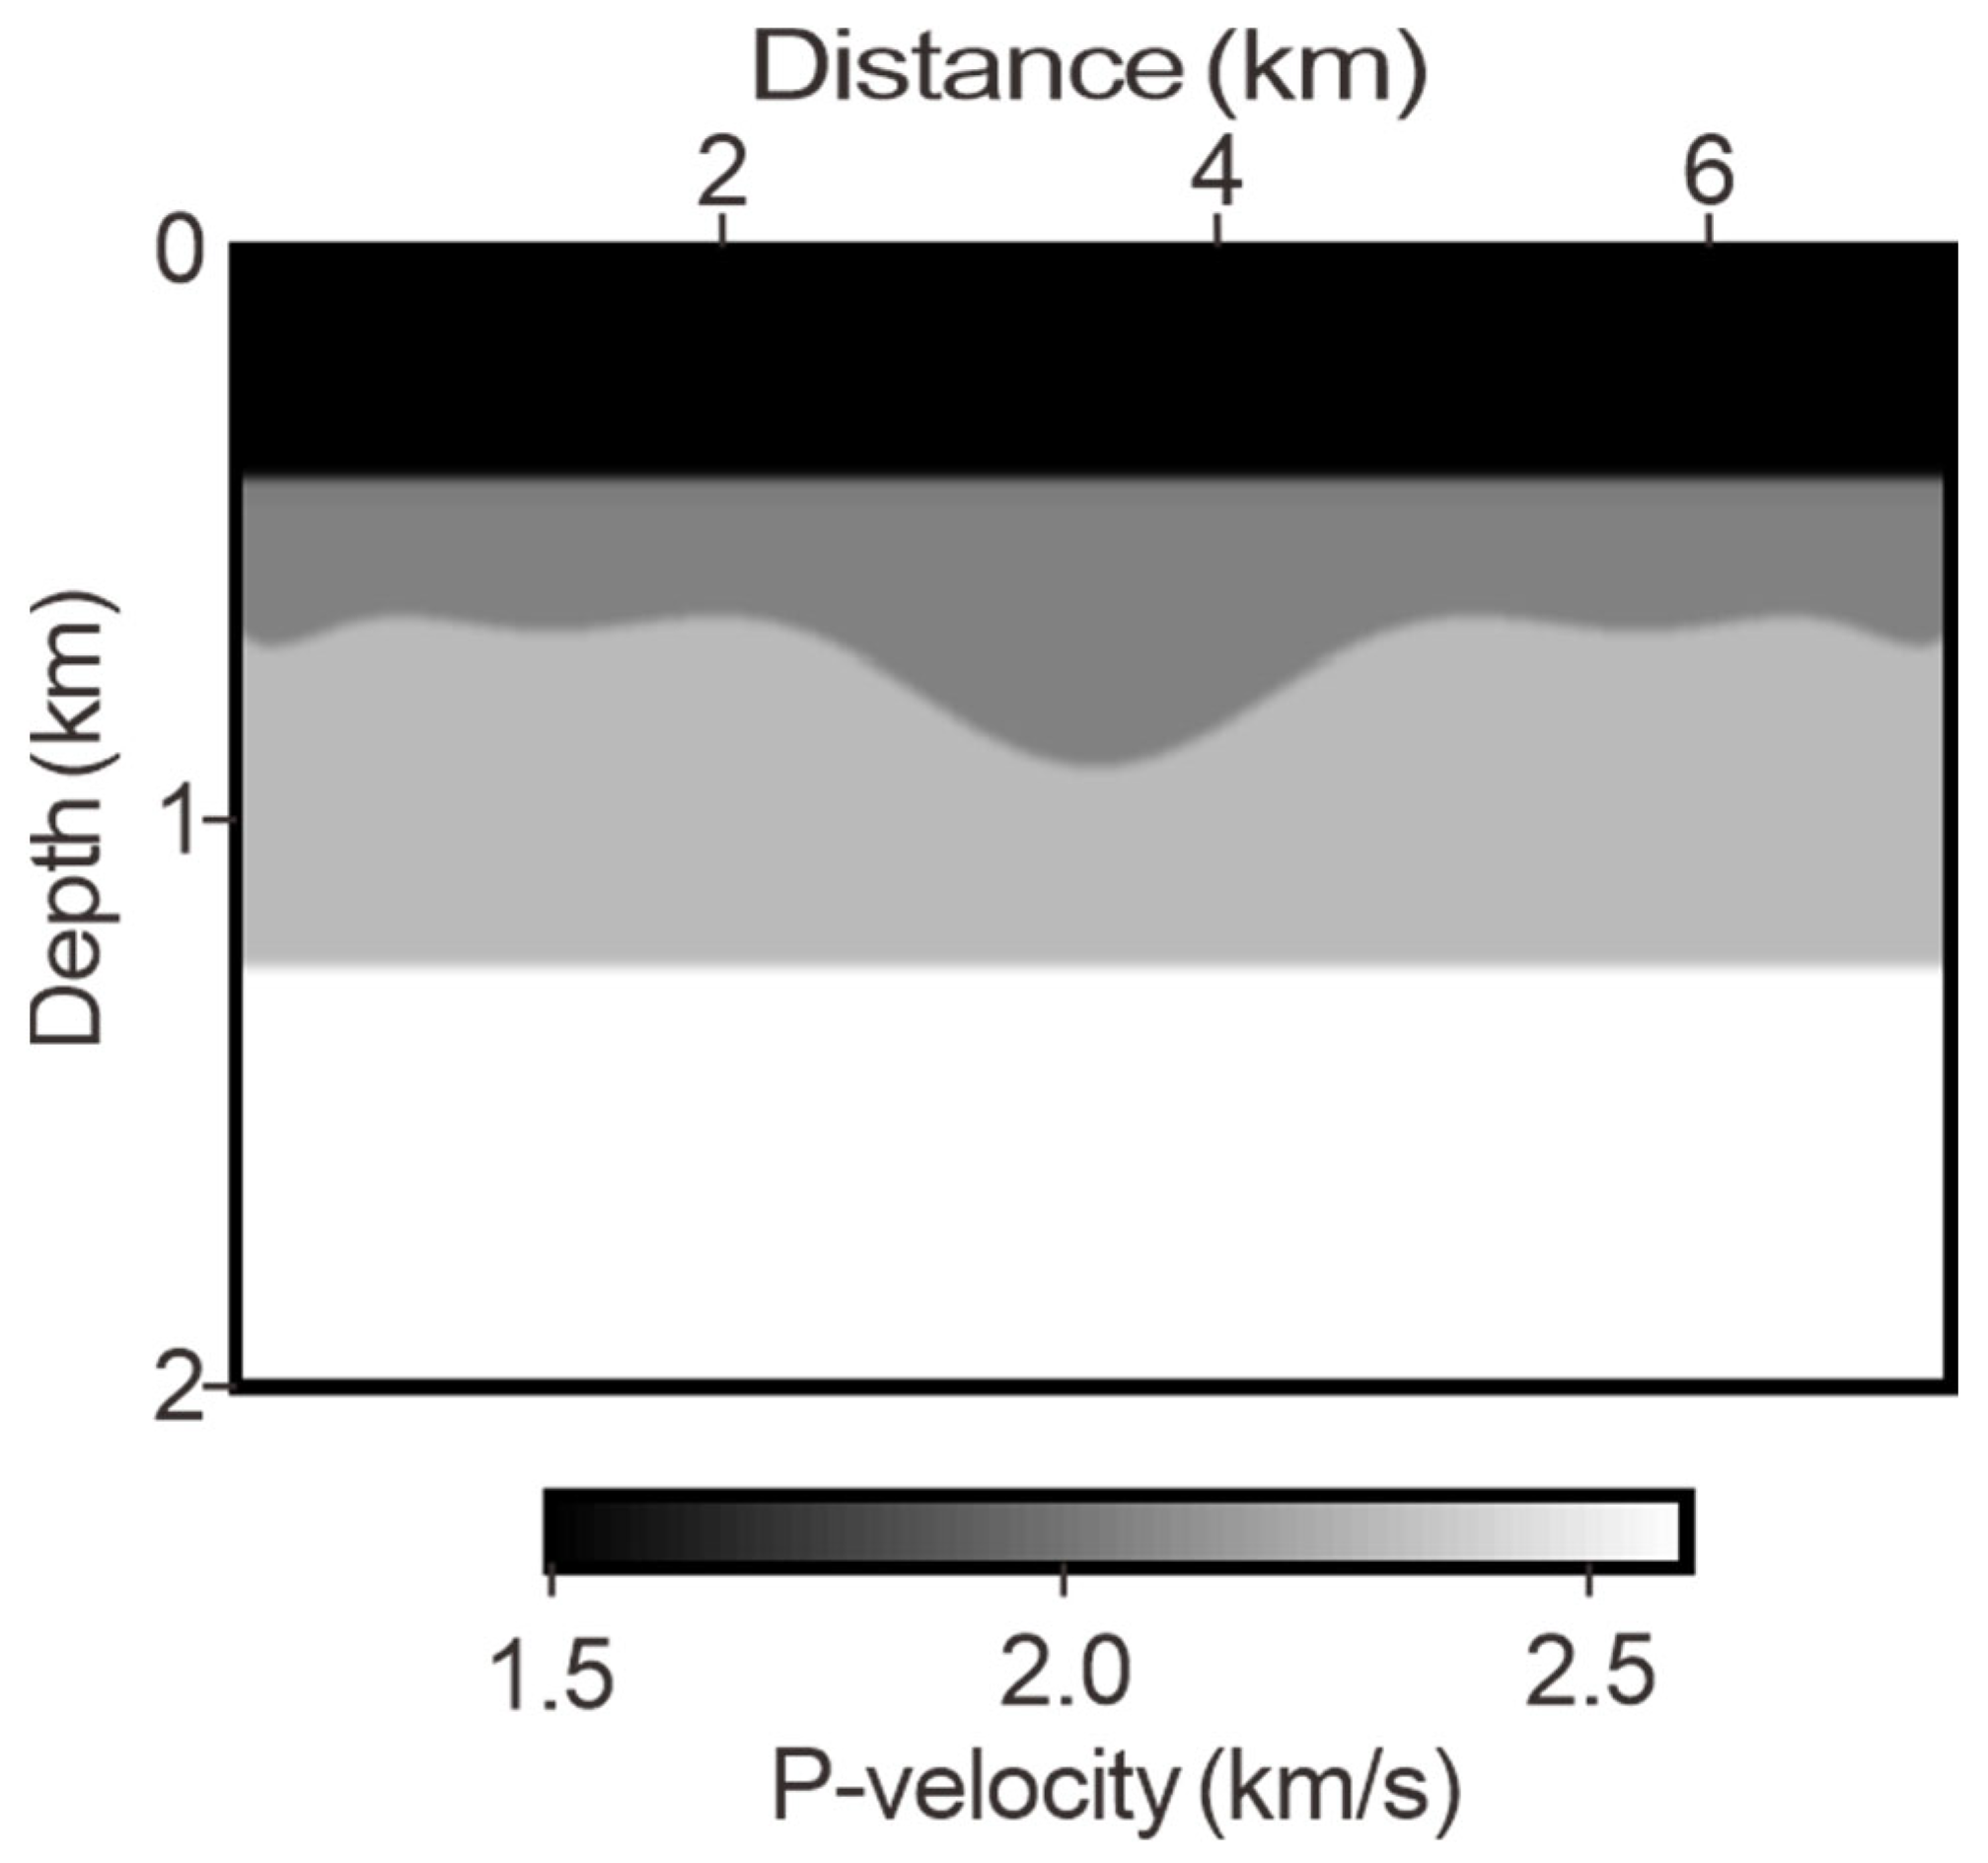
First, we used a simple four-layer model to verify the algorithm’s capability (Figure 3). The velocities of the model from top to bottom were 1500, 2050, 2300, and 2600 m/s, and the densities were 1, 2, 3.5, and 2 g/cm3. In this model, the third layer exhibited density inversion, forming two strong impedance interfaces above and below, leading to the development of internal multiples between the second and third layers. The parameters of this model do not directly correspond to the real lithology. The main objective was to use a simple four-layer model to visually demonstrate the interference artifacts of different-order multiples in imaging and the suppression effects of LSFWM. The model size was 701 × 401, with horizontal and vertical sampling of 10 m and 5 m, respectively. Figure 6 displays the reflection data of this experiment, which have been modeled by an acoustic finite difference modeling scheme. In Figure 6a, seismic data for a common-shot gather are represented, where the seismic records were obtained by fixing the source (keeping a specific shot point location) and arranging receivers to record the seismic signals. In Figure 6b, a common-offset section is depicted, where multiple shots are considered, the shot points are not fixed, and the distance from the shot point to the receiver is constant. The difference between the two lies in the different selections of the entire seismic matrix. The black arrows indicate the primaries. The solid white arrows and the dashed white arrows represent some surface-related multiples and internal multiples, respectively. A total of 101 shots were evenly distributed between 0 and 7 km, with 701 traces per shot and a trace interval of 10 m. The source wavelet was a Ricker wavelet with a dominant frequency of 15 Hz, and both the source and receiver depths were at 5 m. The simulated data, obtained using free surface conditions, contain primaries, surface-related multiples, and internal multiples. The receiver sampling interval was 4 ms, and the total recording time was 3 s. Due to the practical impossibility of obtaining a true velocity model, the migration velocity model (Figure 7) was derived by applying Gaussian smoothing to the true velocity model (Figure 3a).
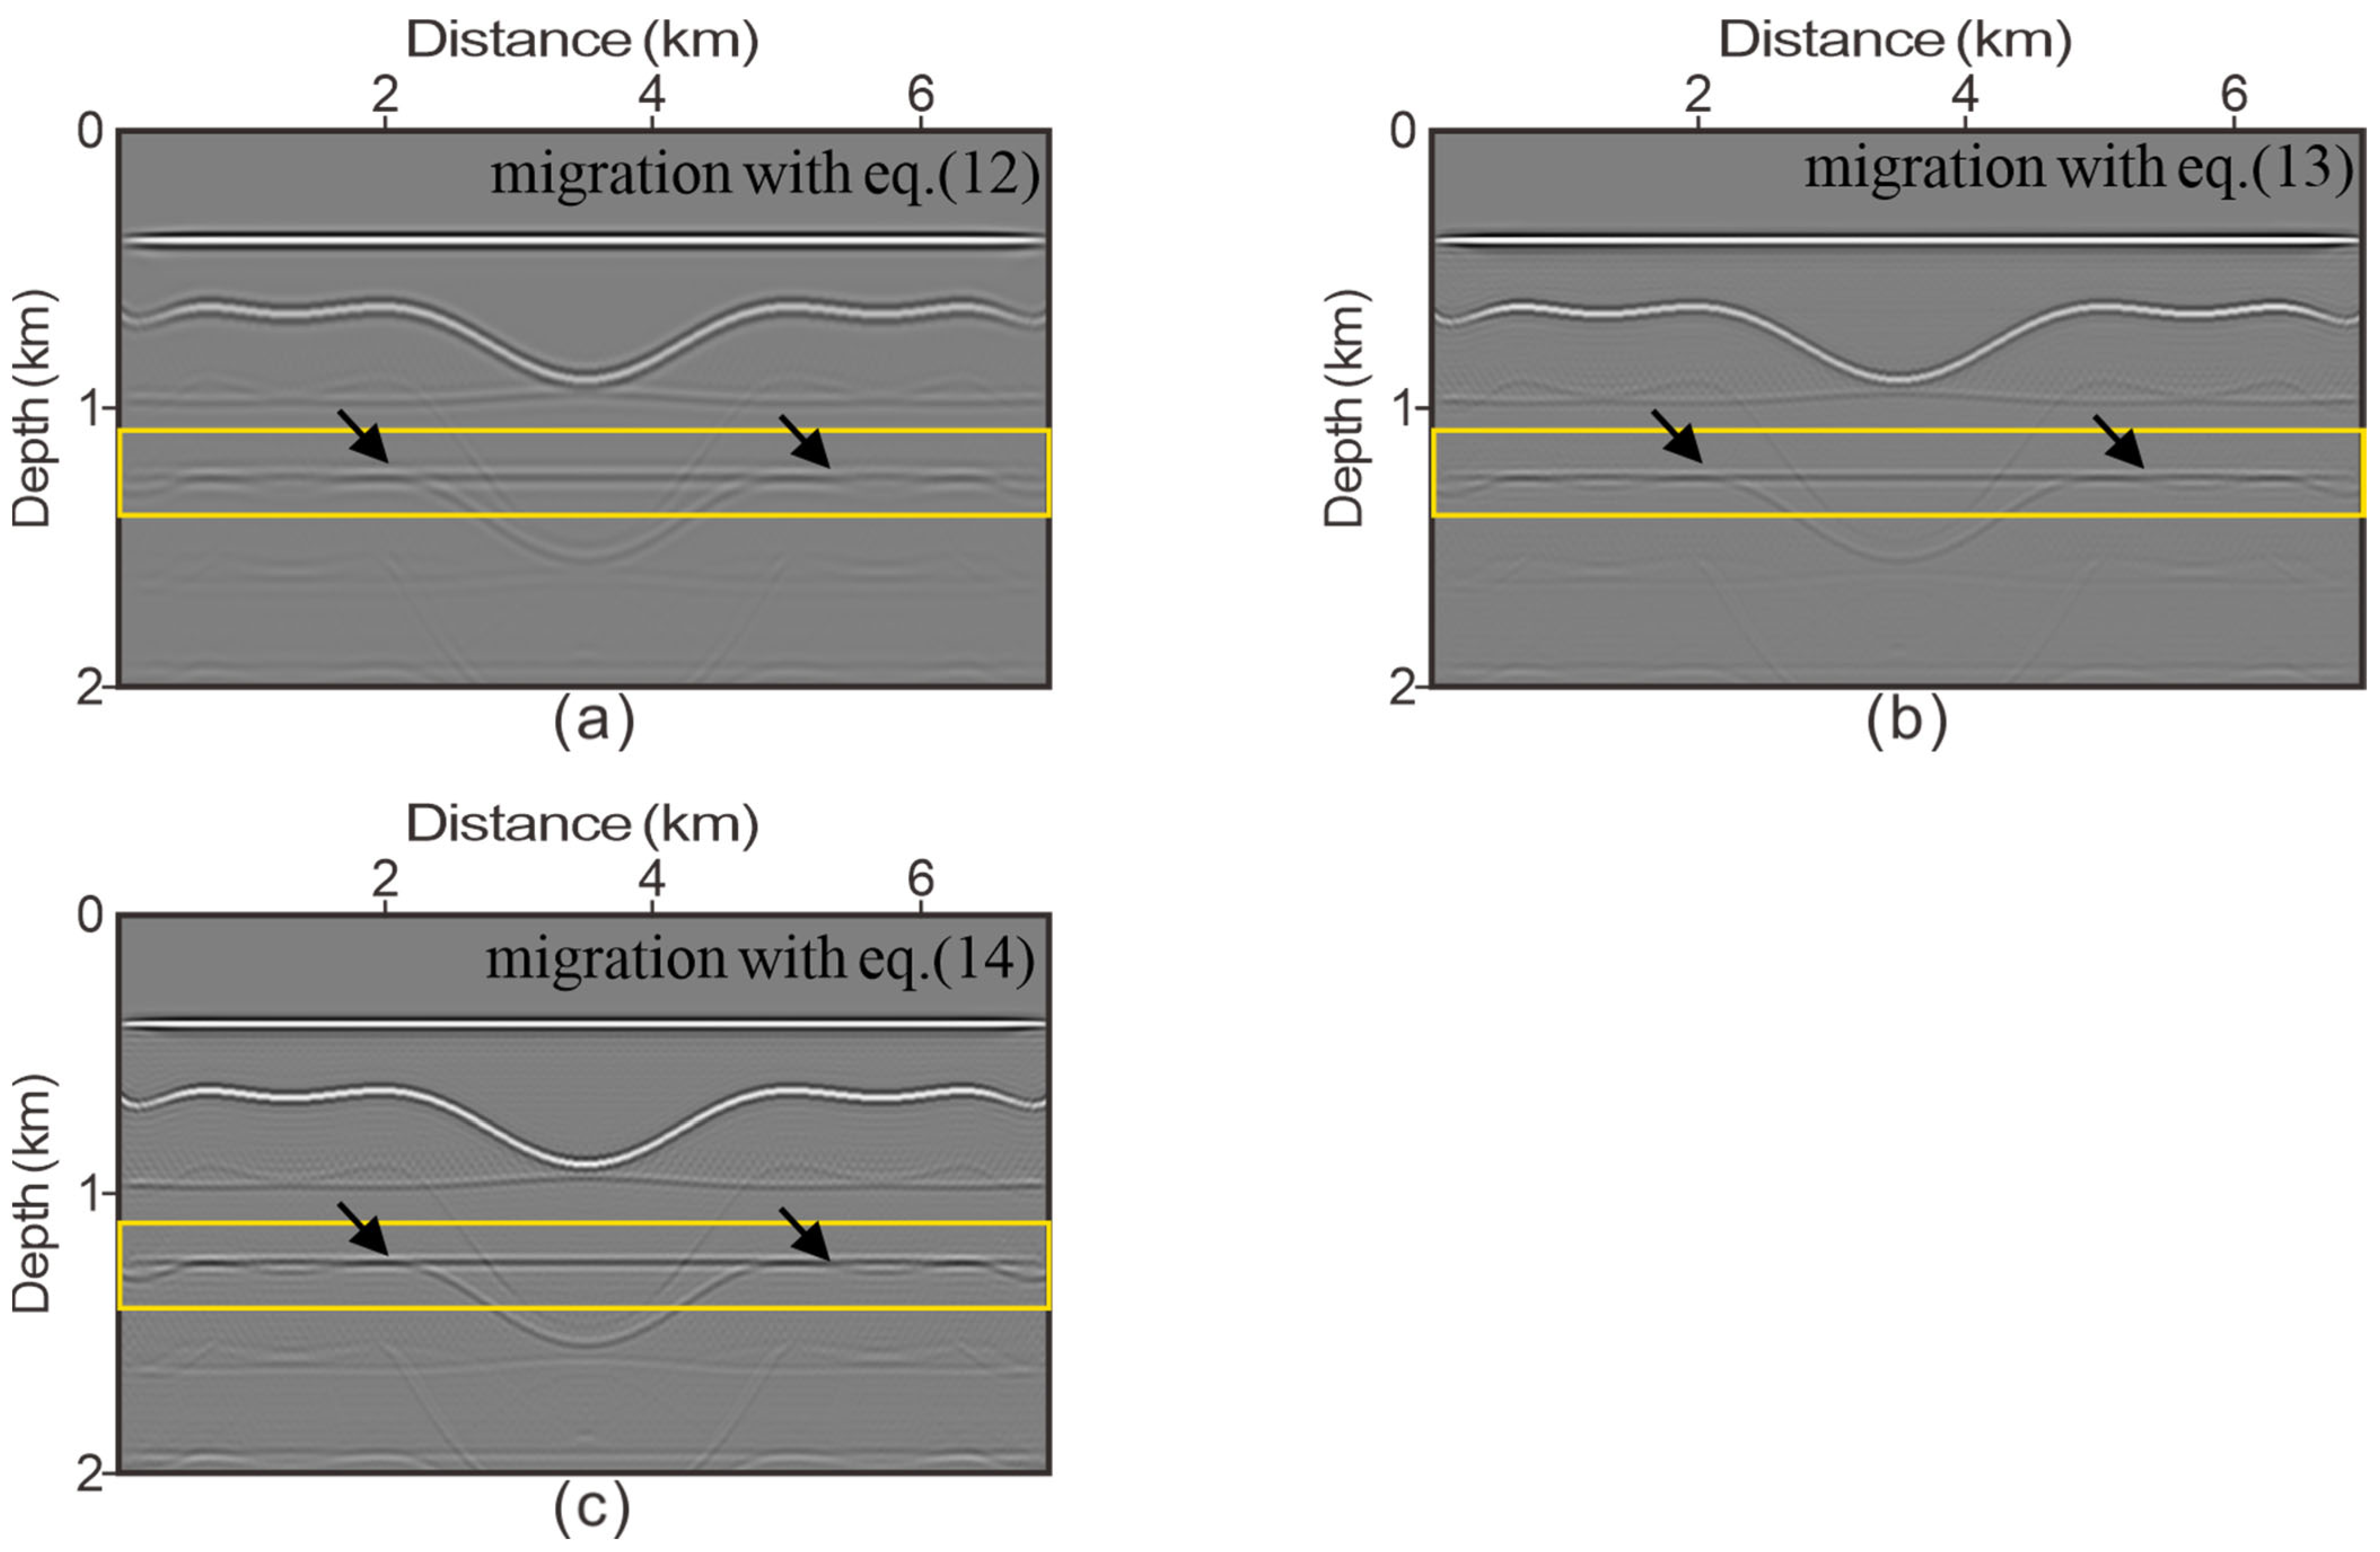
The full-wavefield data were migrated by employing three imaging conditions (Equations (12), (13) and (15)) (Figure 8). By comparing the yellow rectangles in Figure 8a–c, where the black arrows represent the true reflectors, it is evident that the coherency axis resolution is higher in Figure 8b,c compared to Figure 8a. Additionally, the energy in Figure 8c is stronger than in Figure 8b. This observation suggests the deconvolution imaging condition has higher resolution compared to the cross-correlation imaging condition. In addition, the multi-order wavefield normalization condition preserves the high-resolution benefit of the deconvolution imaging condition while offering supplementary deep energy compensation. This is attributed to the fact that, for each frequency, the summation of all the shots for the downward wavefield can function as an auxiliary source illumination condition for the imaging, thus facilitating amplitude compensation in deeper regions.
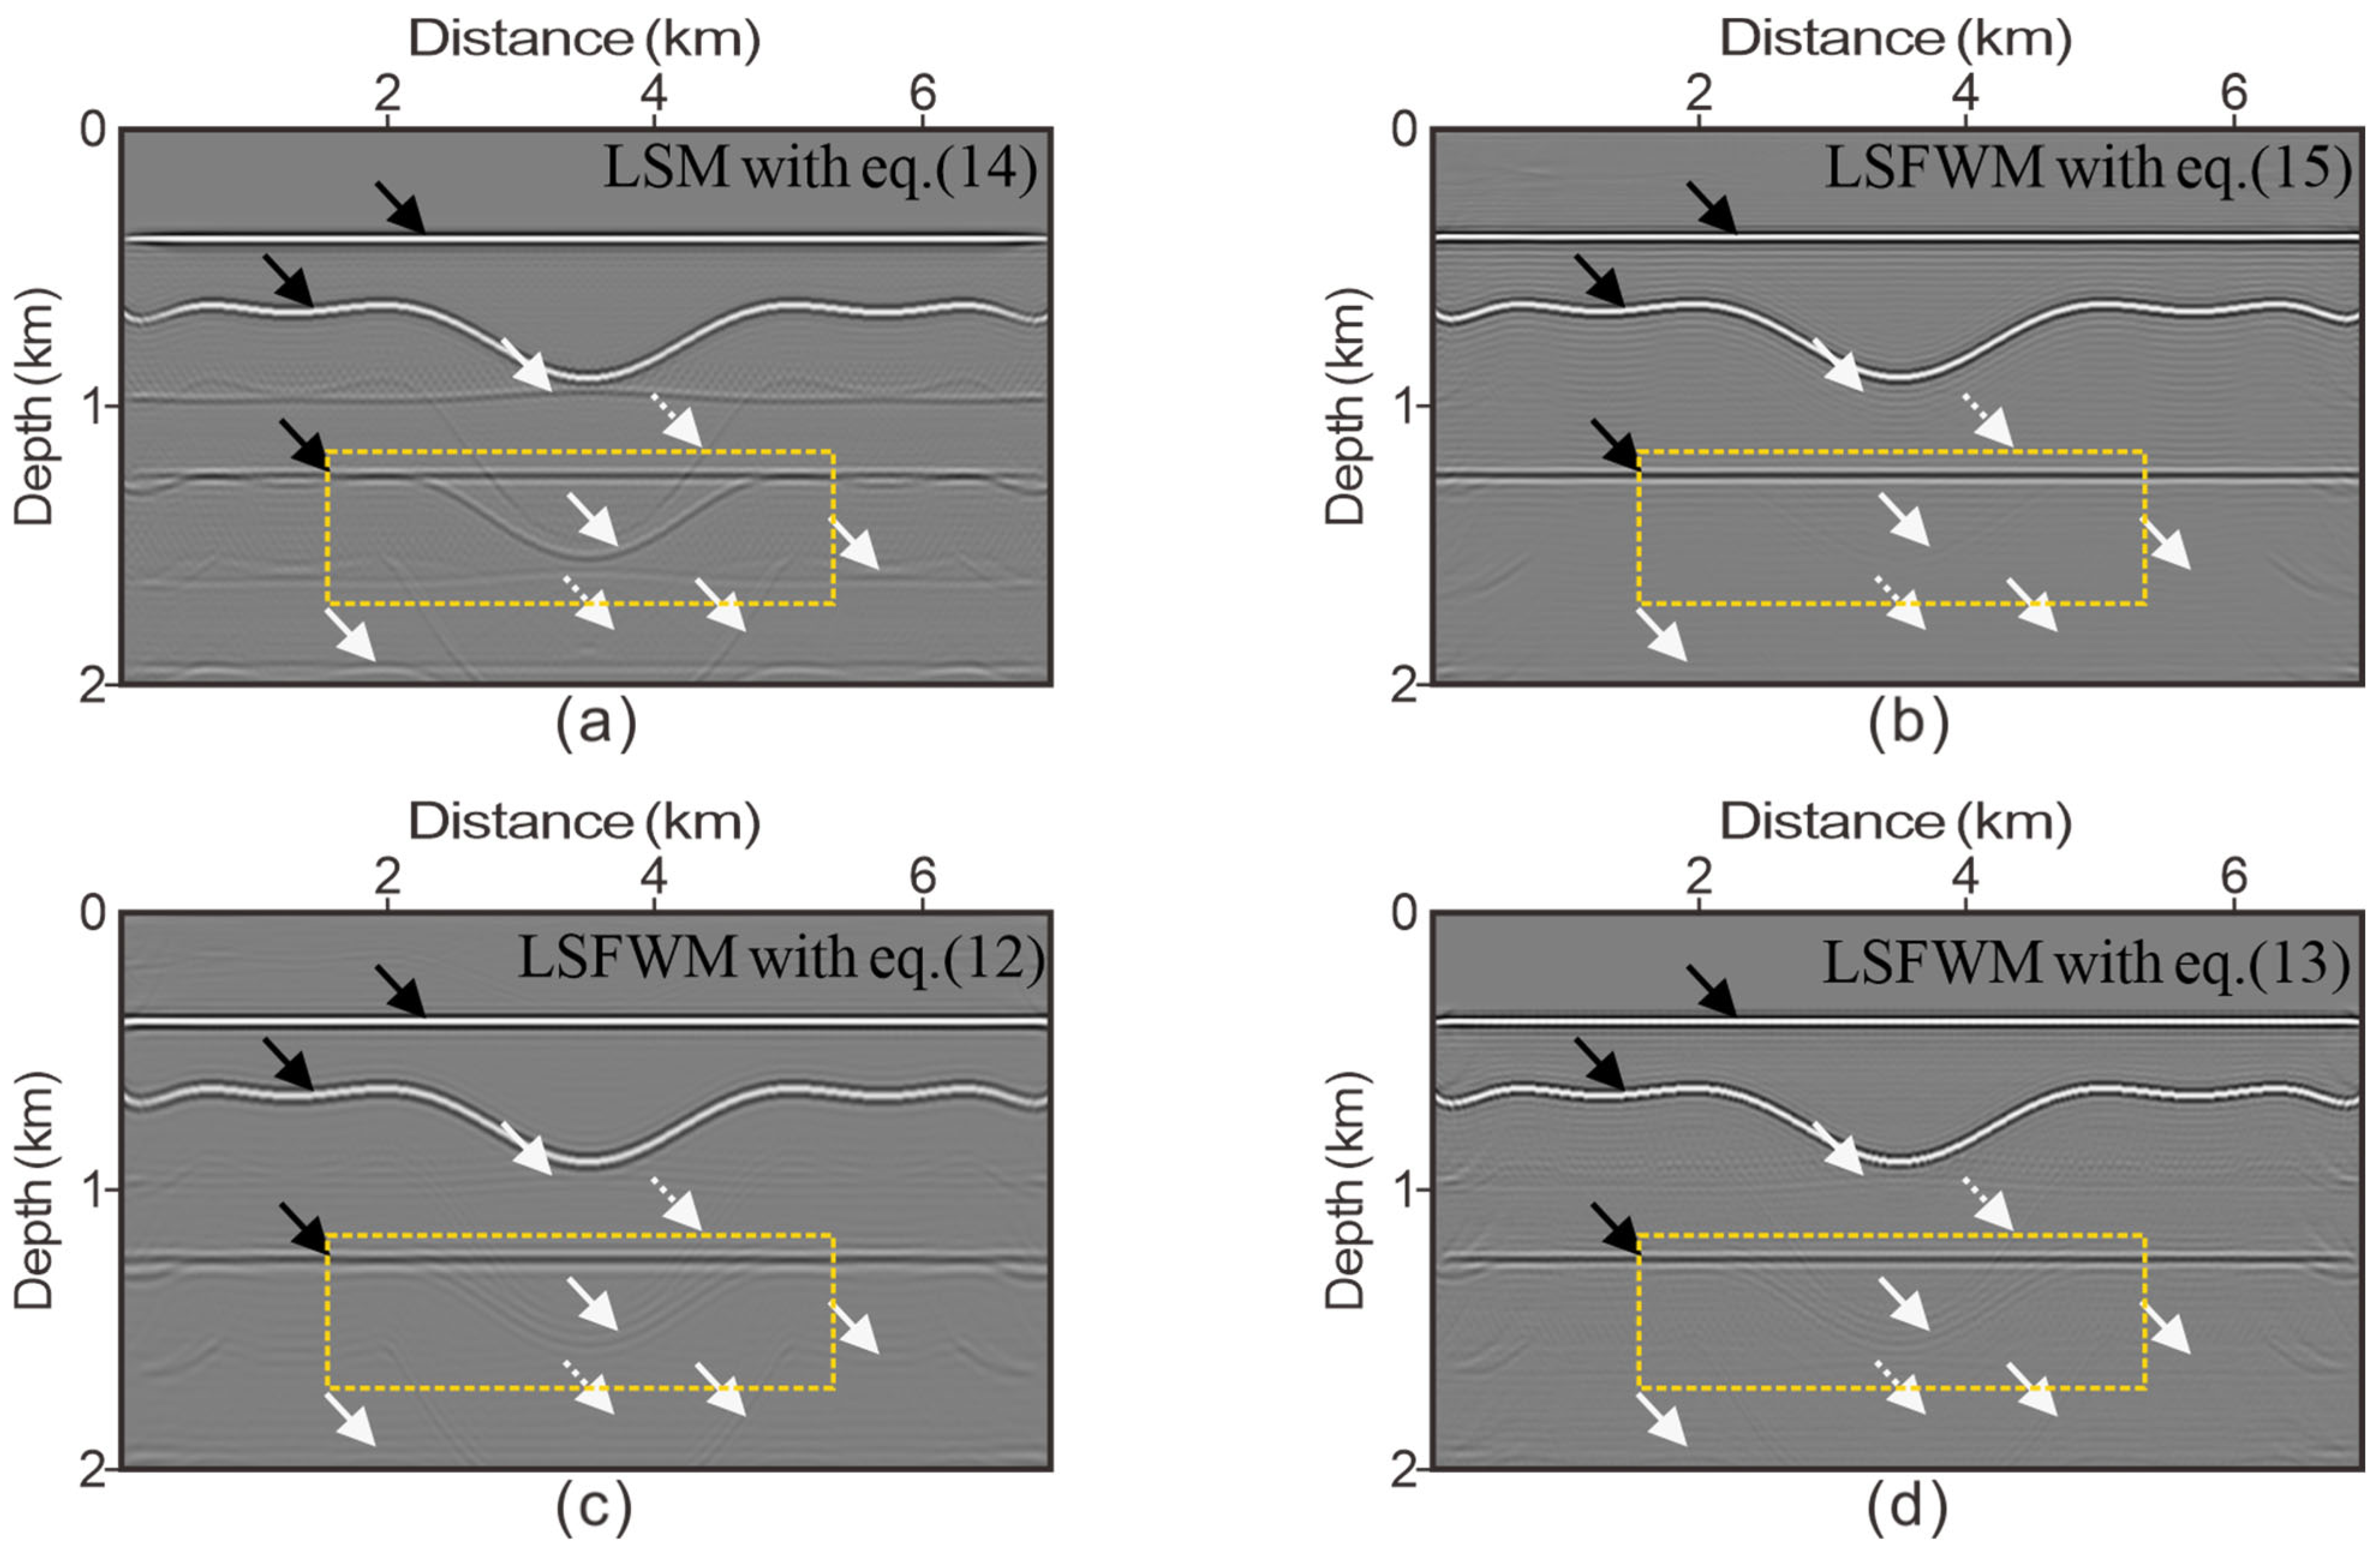
Figure 9 shows the suppression results for multiple interferences in least-squares full-wavefield migration. Figure 9a displays the least-squares primary migration. The black arrows are the result of primary wave correct imaging, the solid white arrows are the crosstalk artifacts of surface-related multiple, and the dashed white arrows are the crosstalk artifacts of internal multiple. Figure 9b–d illustrates least-squares full-wavefield migration using the imaging conditions from Equations (12), (13) and (15), respectively. Within the dashed yellow box, only one true horizontal reflector exists; the white arrows represent the multiple crosstalk artifacts. Figure 9a is a least-squares migration of the primary wave, incapable of suppressing the artifacts. Figure 9b–d approximately depicts the three true reflectors, exerting a certain degree of suppression onto the multiples. Upon careful examination of the position indicated by the white arrows within the dashed yellow box, it can be observed that in Figure 9b, the energy of the crosstalk artifacts is weakest at the location pointed to by the white arrows. This indicates that the global normalized imaging condition suppresses the crosstalk artifacts of multiples better than the other two imaging conditions. The reason for this is that the demigration operator relies on the gradient (migration result) and migration velocity in forward modeling, and the deconvolution-type imaging condition boasts a higher resolution than cross-correlation, which proves more advantageous for subsequent data residual processes. Multi-order wavefield normalization introduces new illumination conditions for each single-frequency component in the imaging results. During the first iteration, only the point sources of the shot gather and surface-related multiple illumination effects are considered. From the second iteration onward, virtual source illumination between layers is further incorporated, which in turn enhances the gradient term for each iteration.
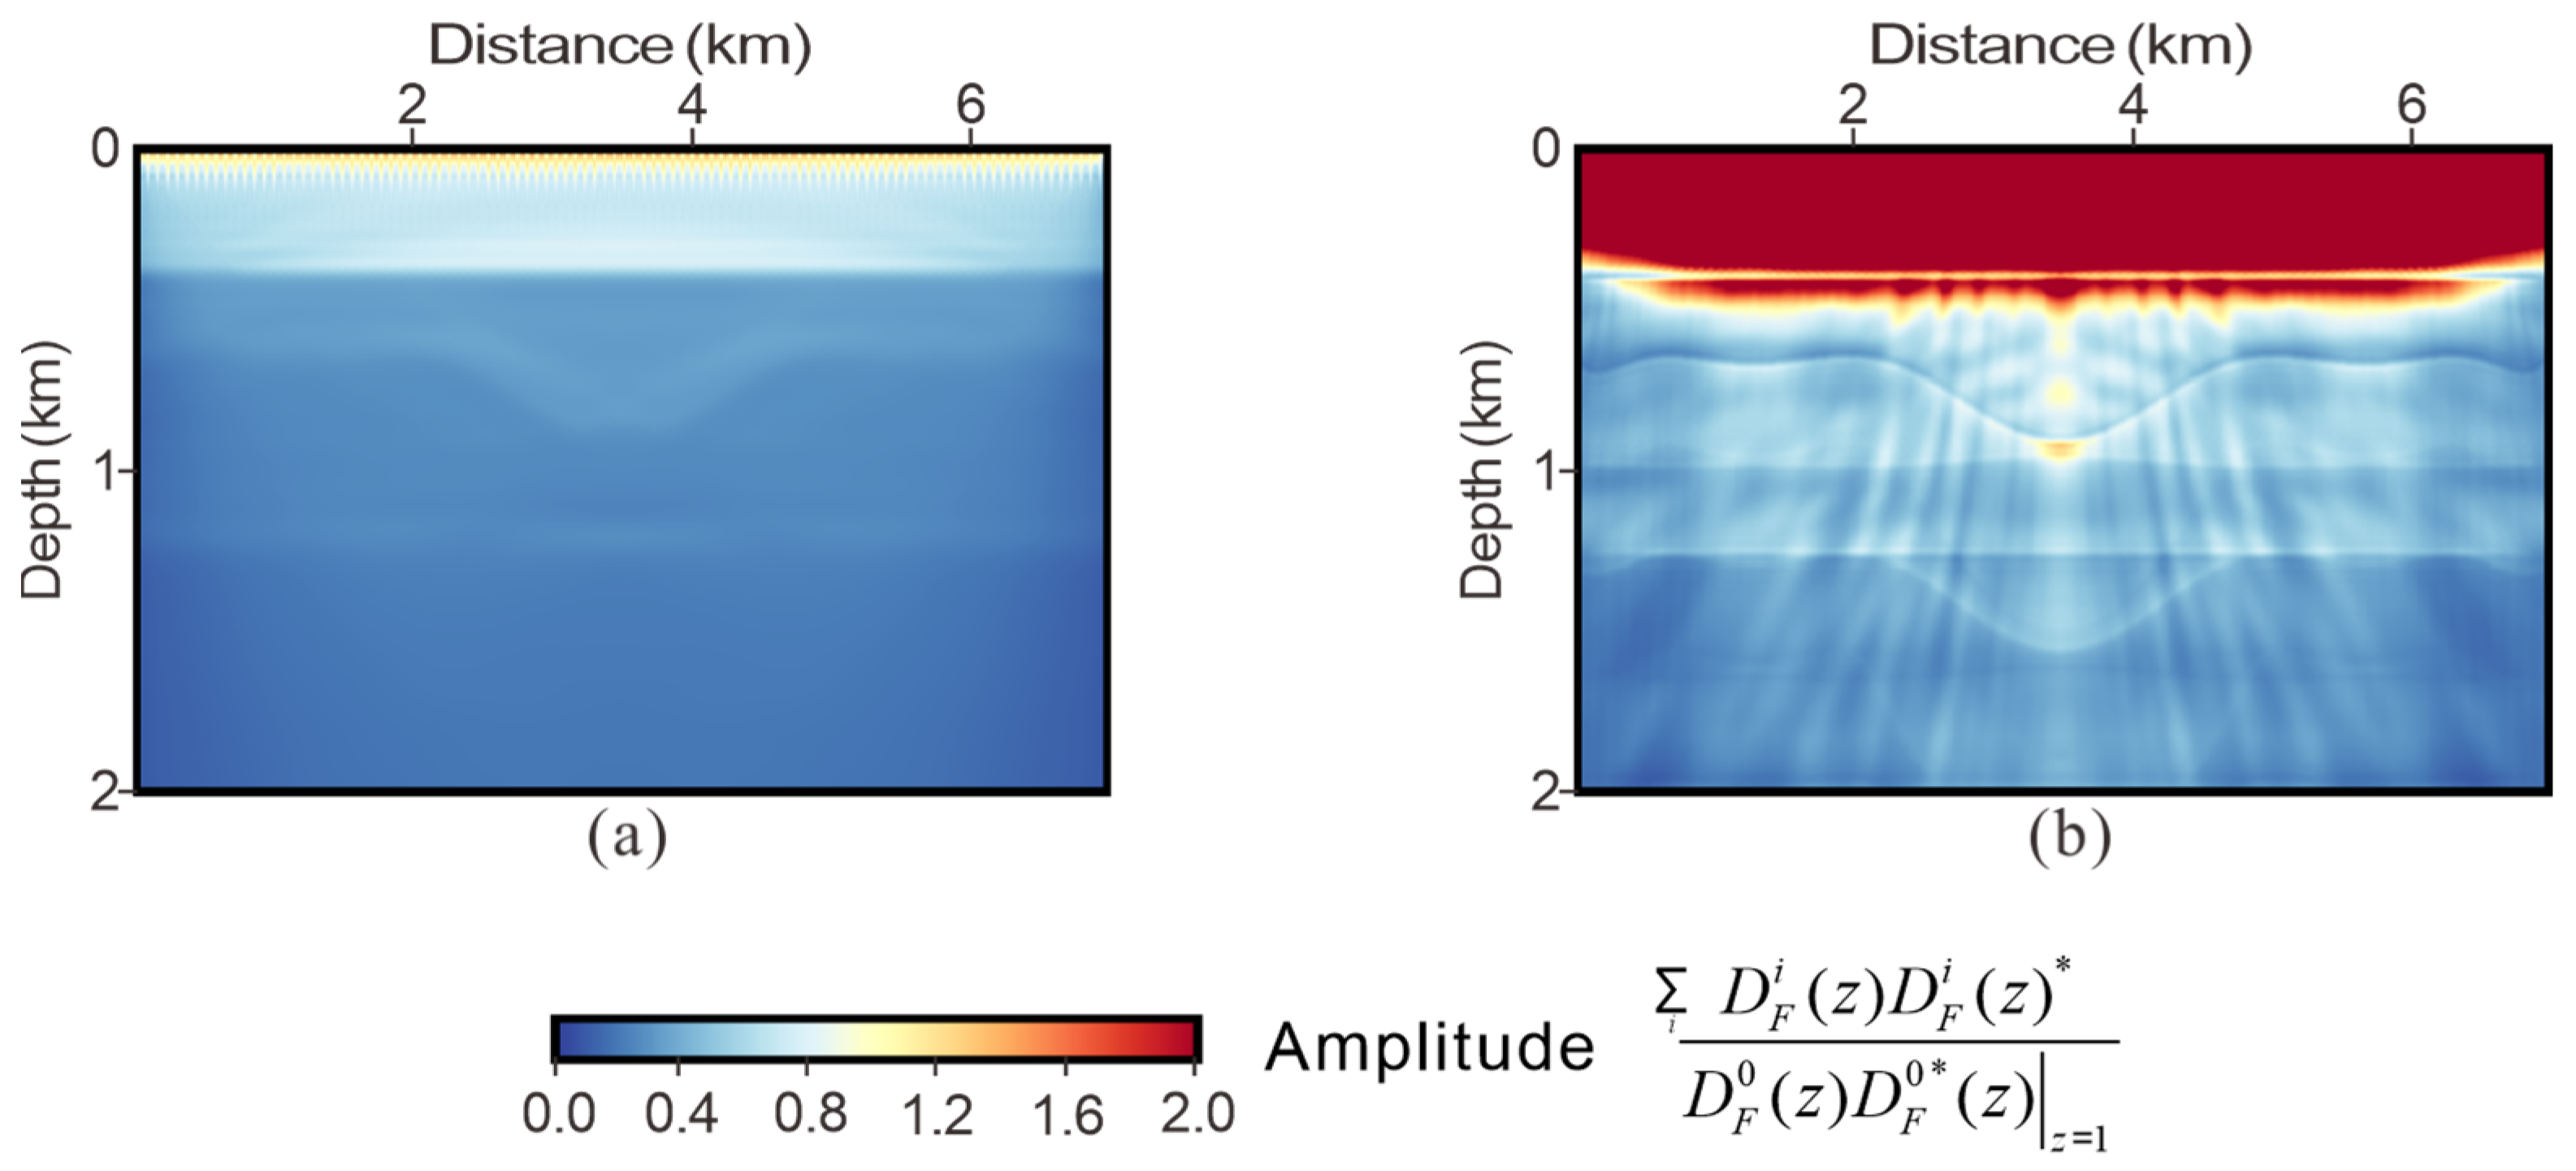
Figure 10a,b displays the multi-order wavefield illumination compensation (denominator term of Equation (15)) for the gradient term at the primary frequency of 15 Hz during the first and second iterations, respectively. It is evident that the illumination effect of the second iteration surpasses that of the first, thereby promoting subsequent iteration processes.

3.2. Pluto 1.5 Model: Finite Difference Data

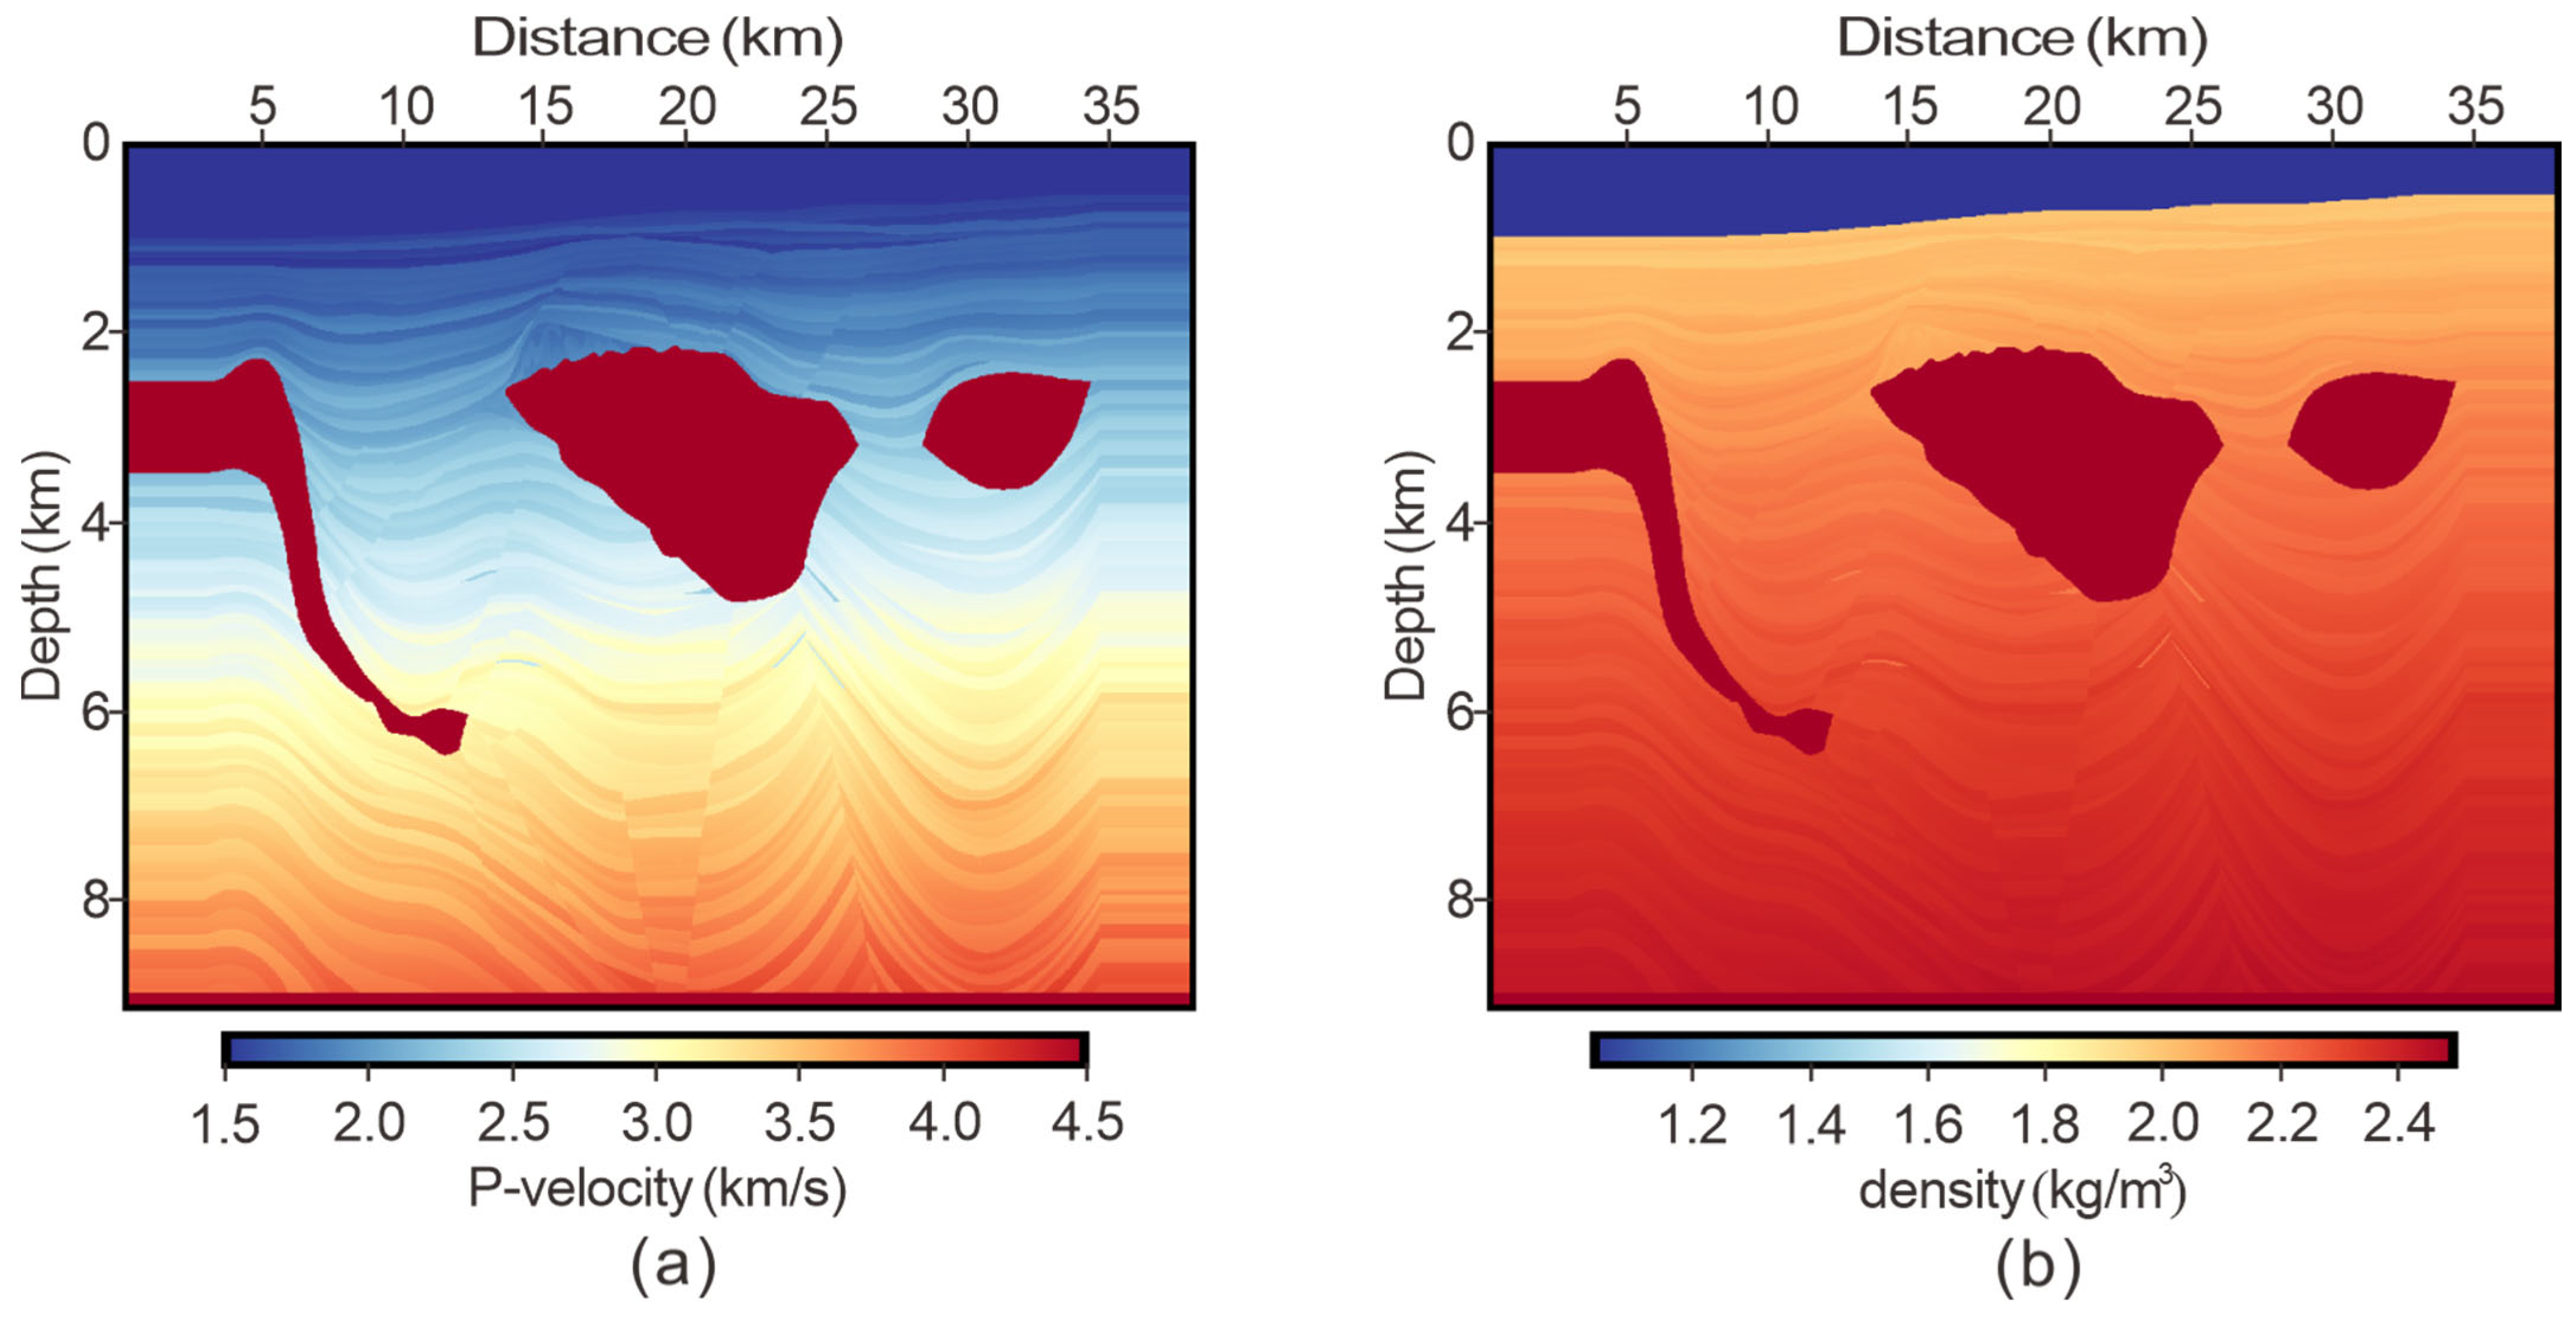
In the deepwater basin of the Gulf of Mexico, the main feature is the development of thick layers of salt rocks in the Neogene to Middle Jurassic [45,46]. Beneath large salt formations lies a target for oil and gas exploration. However, imaging below salt structures introduces the challenge of multiple reflections, leading to crosstalk artifacts. In order to simulate subsurface structures beneath salt more accurately, the Pluto 1.5 model (Figure 11) was utilized to validate the imaging efficacy of the proposed method for complex models. The Pluto 1.5 model is a publicly available geological model in geophysical community. It is derived from field exploration data and used for simulating primary and multiple wave signals beneath salt targets in the deepwater environment of the Gulf of Mexico [47].
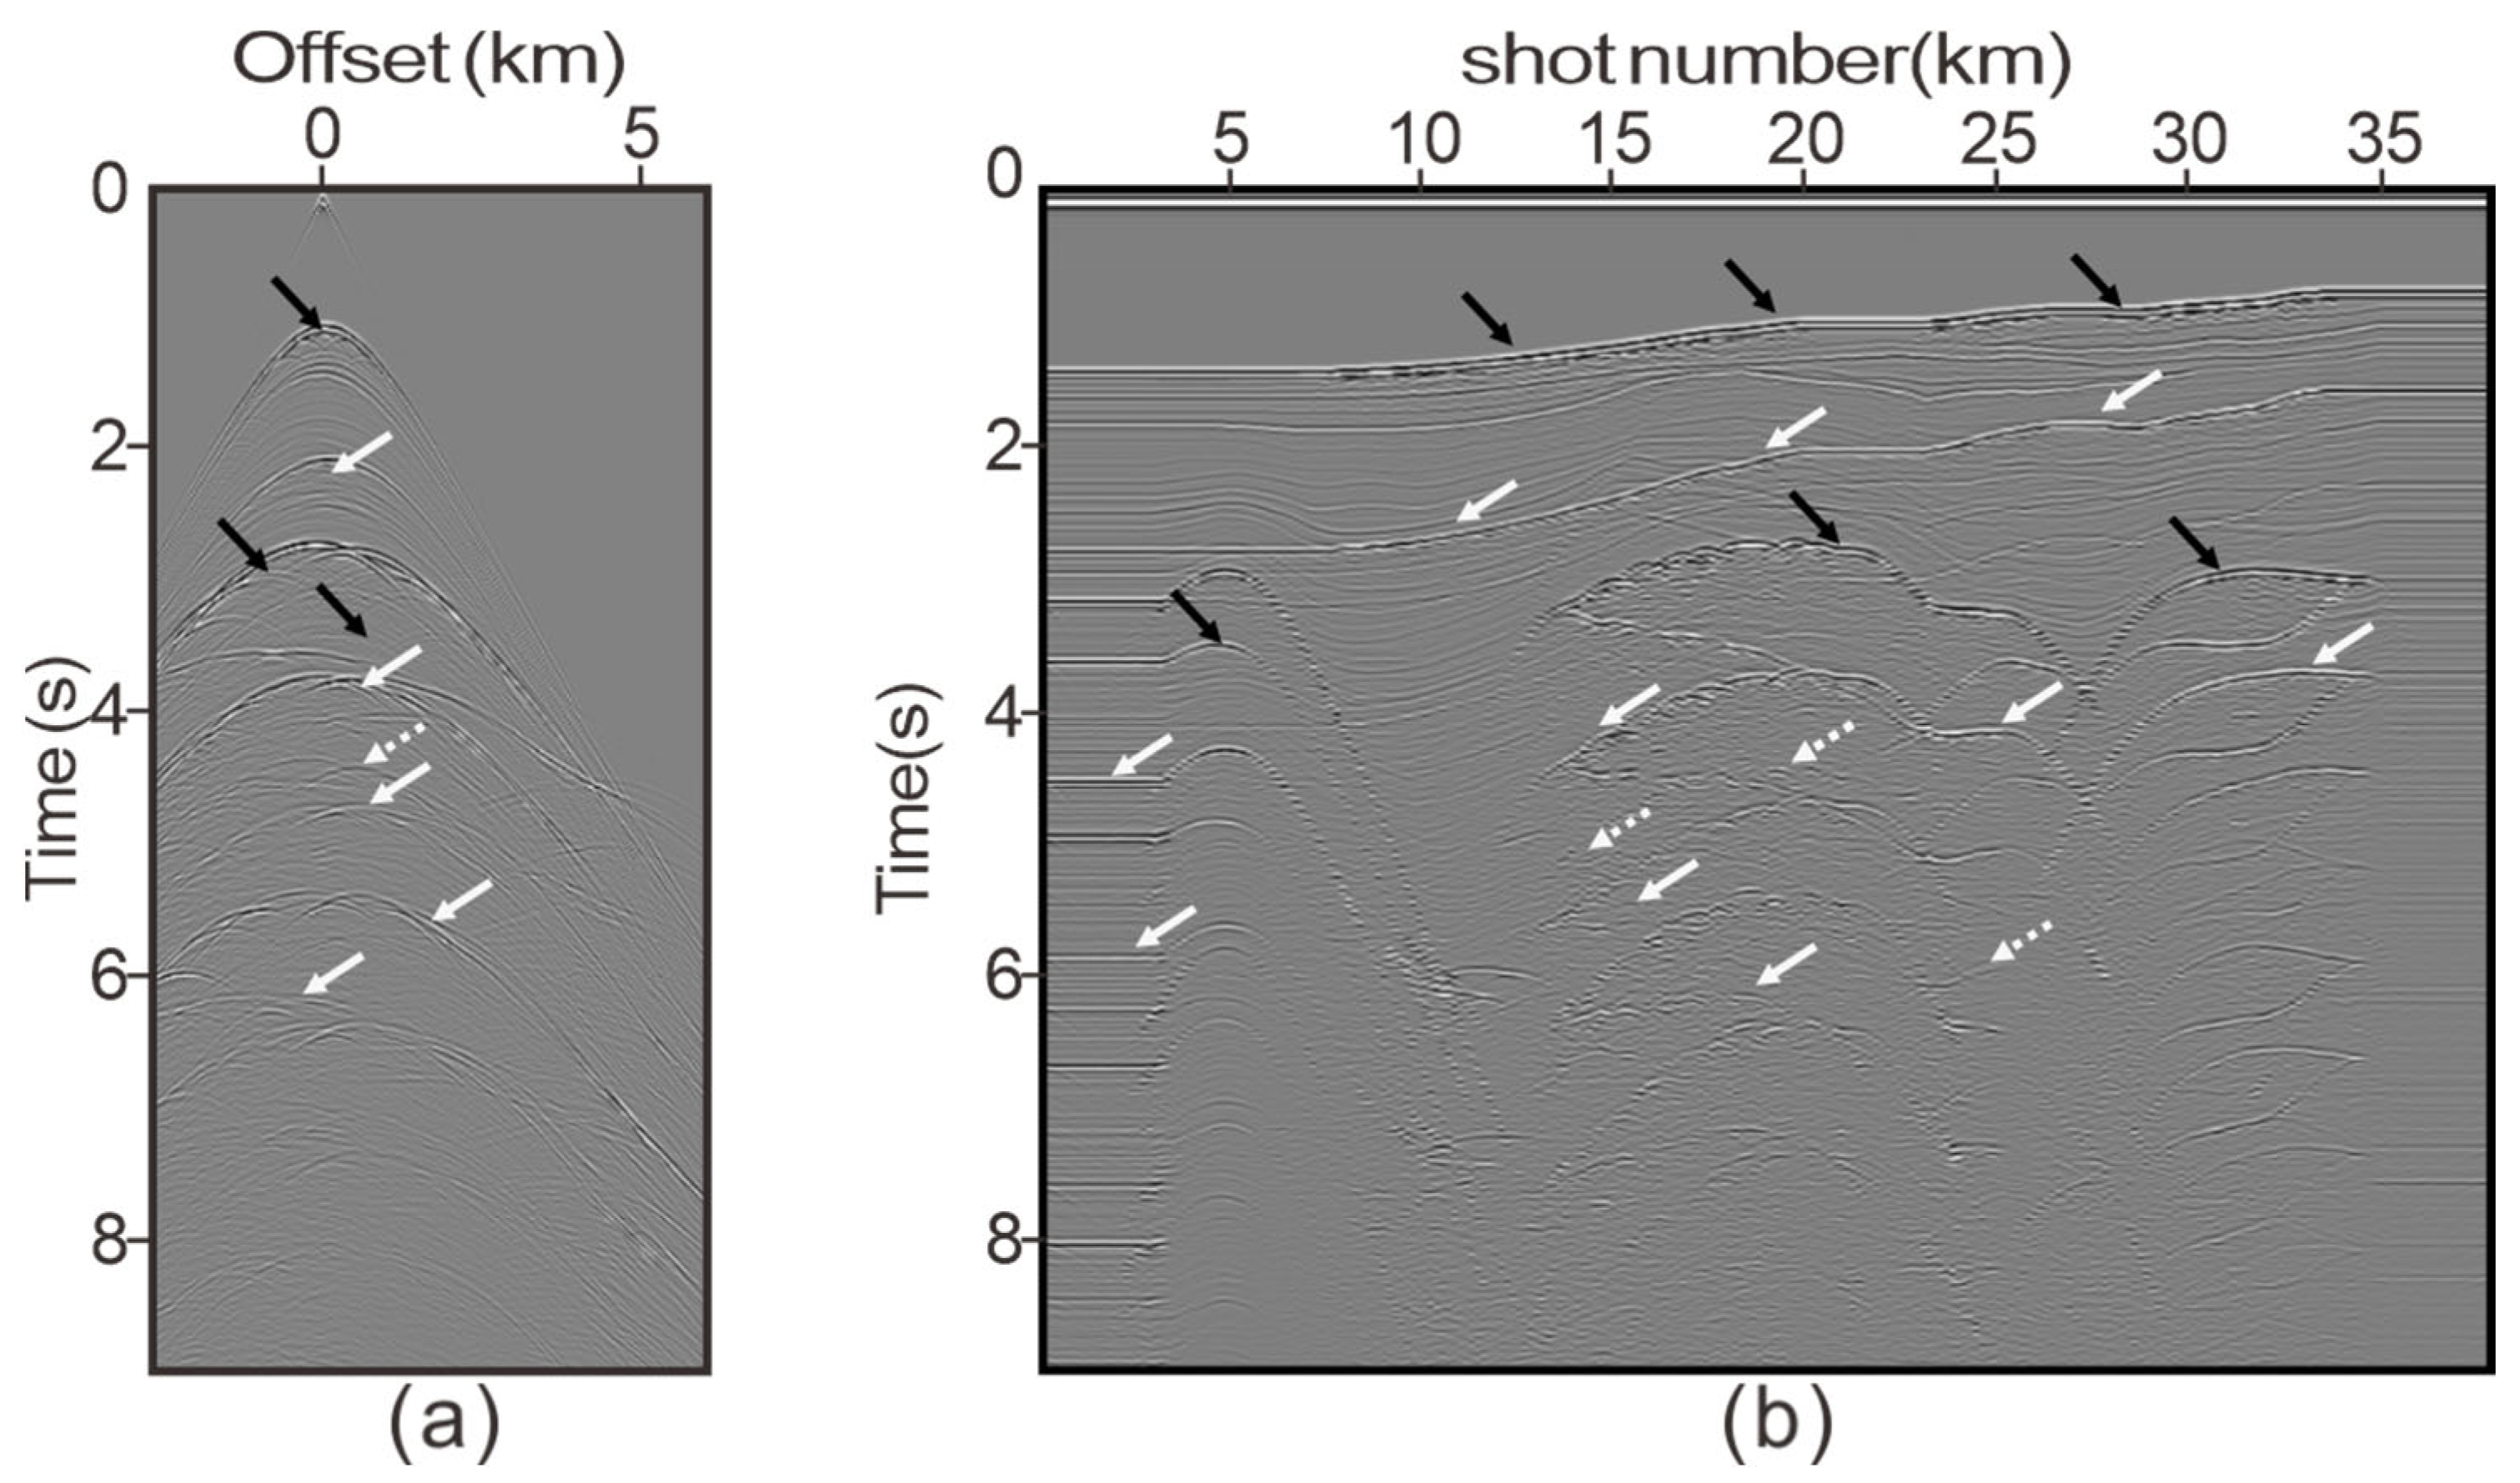
The model consists of a series of sedimentary layers, several normal and thrust faults, and three large salt domes. Upon analyzing the velocity and density models, several velocity and density reversals have been identified within the sedimentary layers, accompanied by strong impedance interfaces at the top and bottom of the salt domes, the seabed layer, and free surface conditions. The model exhibits significant surface-related multiples and internal multiples. The model’s original grid size (1201 × 6960) was adjusted to 1201 × 2501, with a horizontal spacing of 15.24 m and a vertical spacing of 7.62 m. There were 251 shots with a source spacing of 152.4 m, distributed across a range of 0–38 km. The source wavelet was a Ricker wavelet with a primary frequency of 15 Hz. The total recording time was 10 s, with a time sampling interval of 4 ms and 701 traces per shot, and a trace interval of 15.24 m. The source and the receiver depths were both at 7.62 m. Figure 12 displays the reflection data of this experiment, which have been modeled by an acoustic finite difference modeling scheme. Figure 12a shows the common-shot gather, while Figure 12b shows the common-offset gather. The black arrows indicate primaries. The solid white arrows and the dashed white arrows represent some surface-related multiples and internal multiples, respectively. The migration velocity model, shown in Figure 13, was obtained by Gaussian smoothing of the true velocity model (Figure 11a).
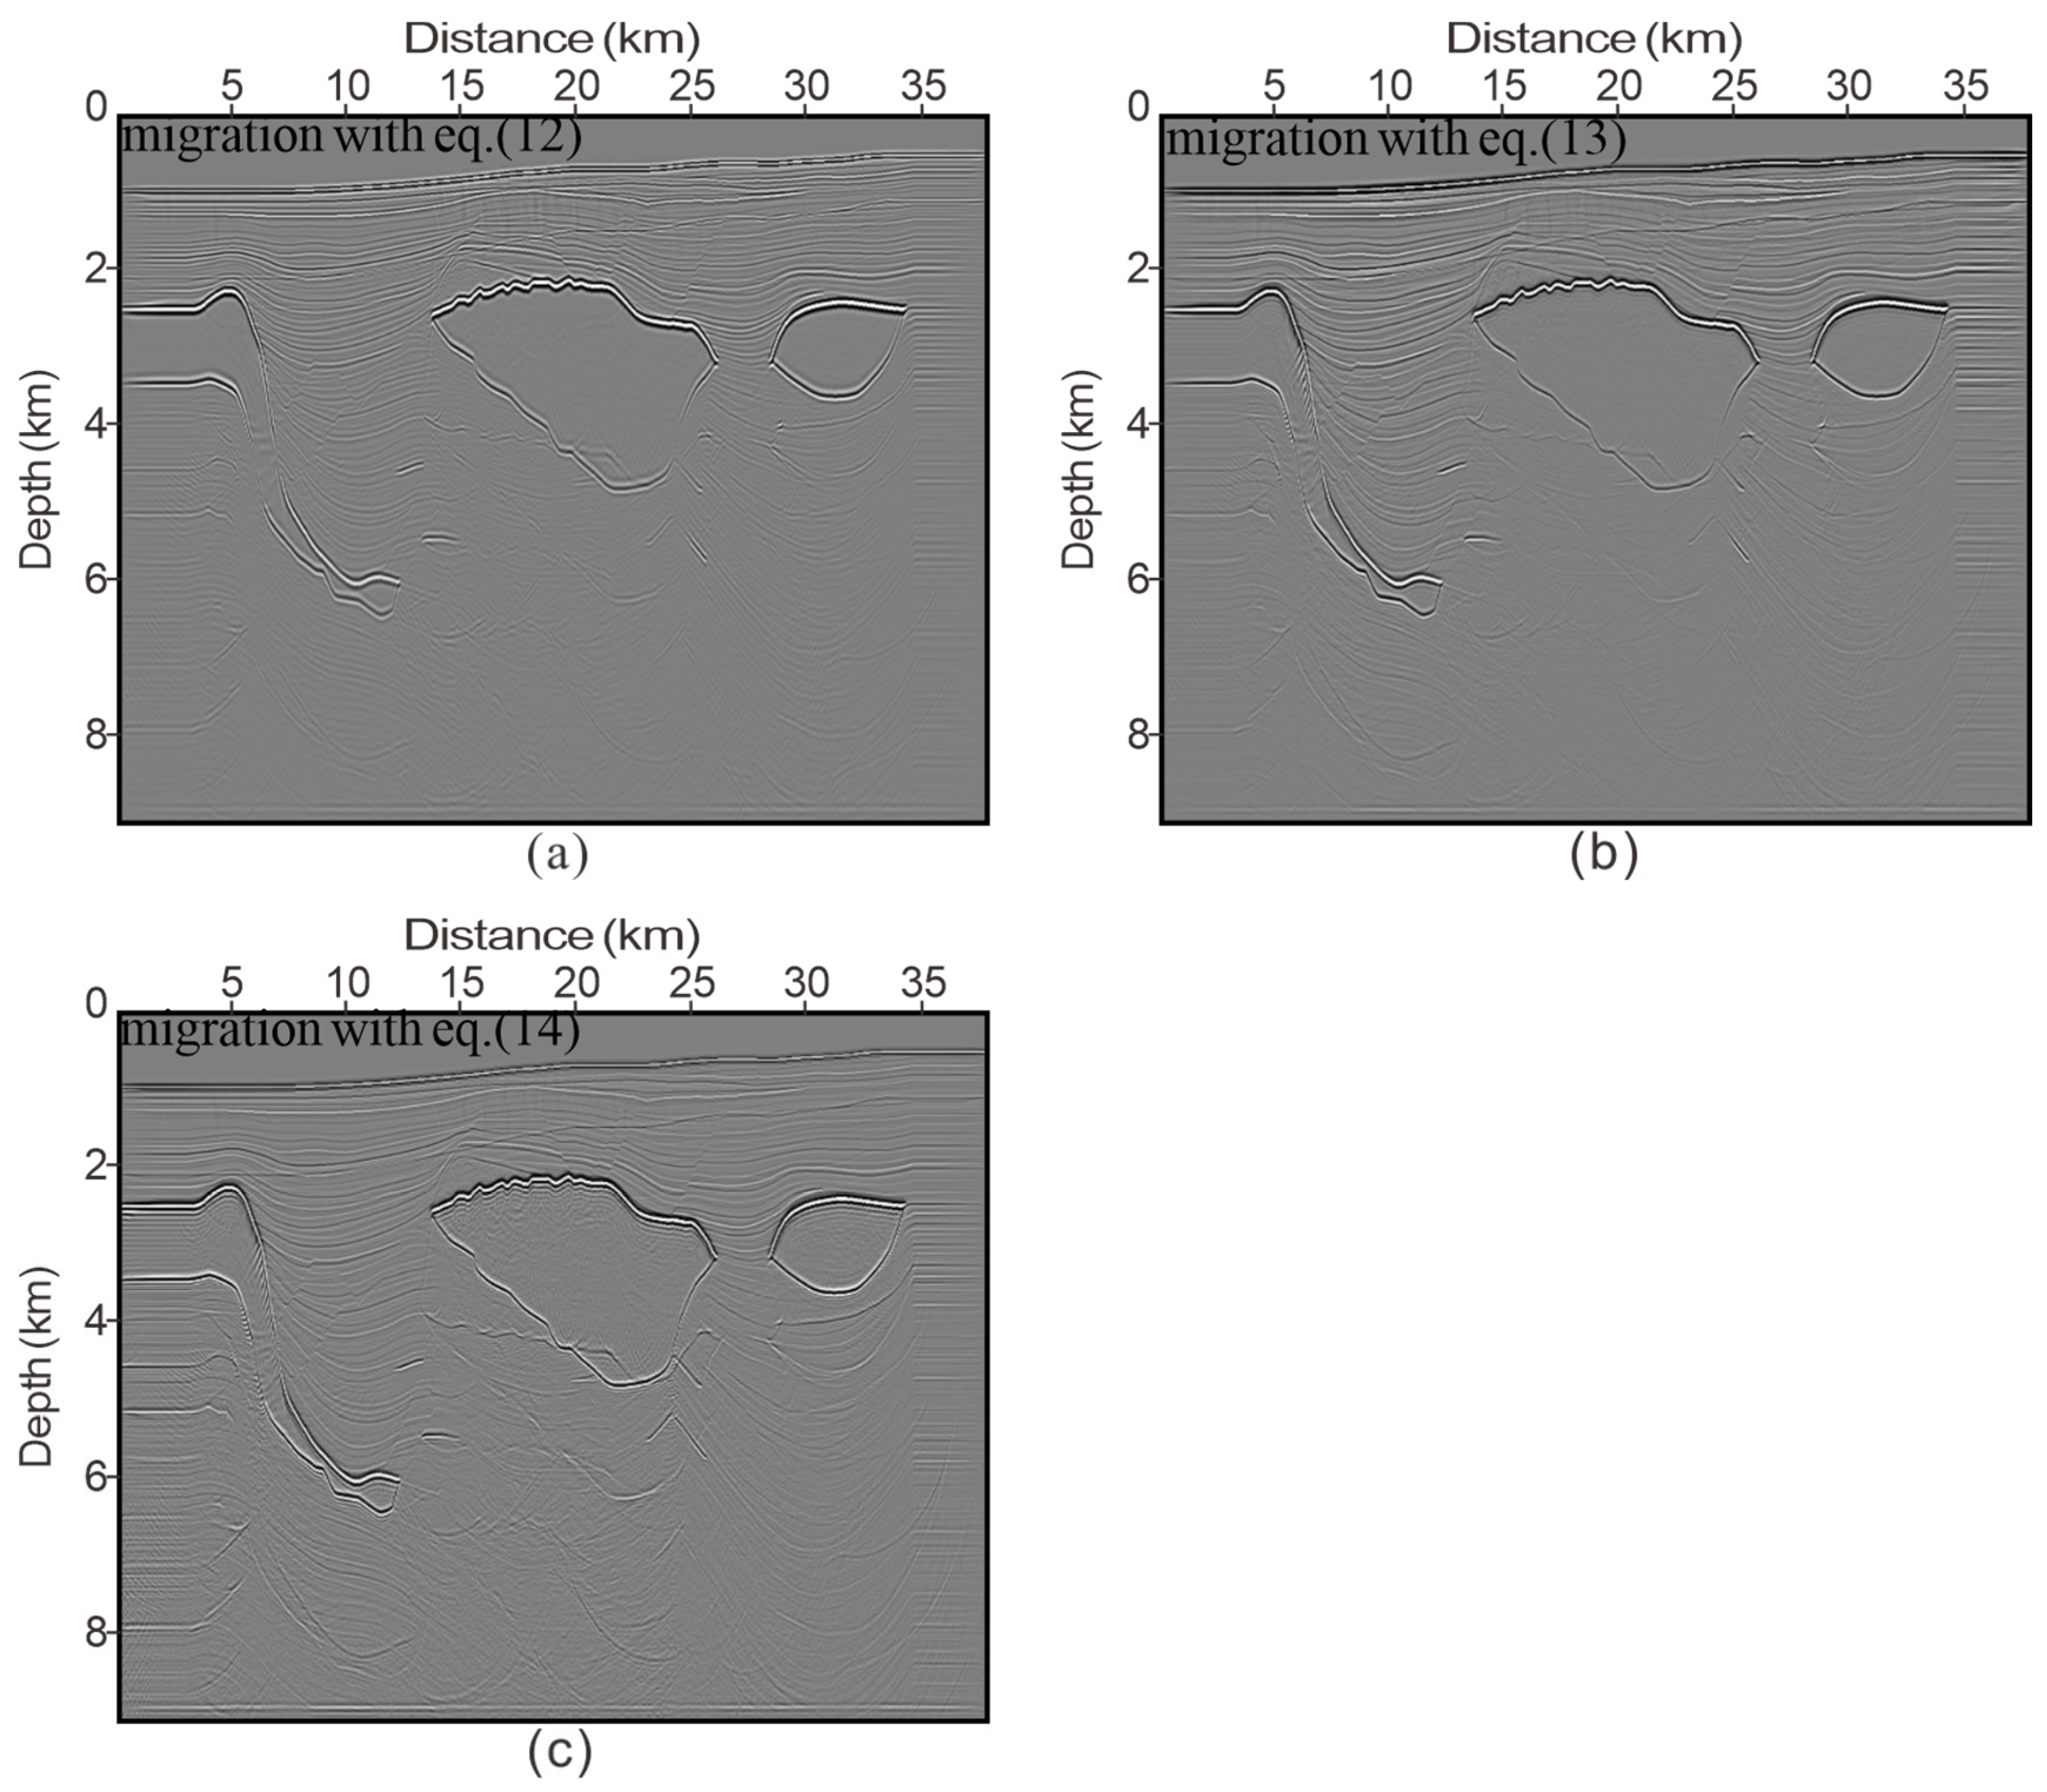
Three imaging conditions were applied to the full-wavefield data, producing migration results (Figure 14a–c). These migration results consistently demonstrate that the salt dome boundaries, sedimentary layers, and inclined faults possess comparable shallow imaging potentials. For the deep structures beneath the salt domes, which serve as strong shielding layers, the multi-order wavefield normalization imaging effect outperformed the other two conditions, providing enhanced deep illumination. Subsequently, we analyzed the multiple artifacts. The original data contain multiples, and the imaging is characterized by numerous interference artifacts. Among them, a shallow event nearly parallel to the seabed, marked by a white solid arrow extending from 1 to 2.5 km, is, in fact, a first-order surface-related multiple artifact associated with the seabed. Some unreasonable events are observed within the three salt domes, which are presumed to be caused by surface or internal multiples from the overlying layers. A multitude of strong interference artifacts appear below the salt domes, primarily due to the free surface-related multiple artifacts generated at the interface between the seawater surface and the salt dome (indicated by the solid white arrows), as well as the internal multiple artifacts formed between the seabed interface and the upper and lower interfaces of the salt dome (indicated by dashed white arrows).
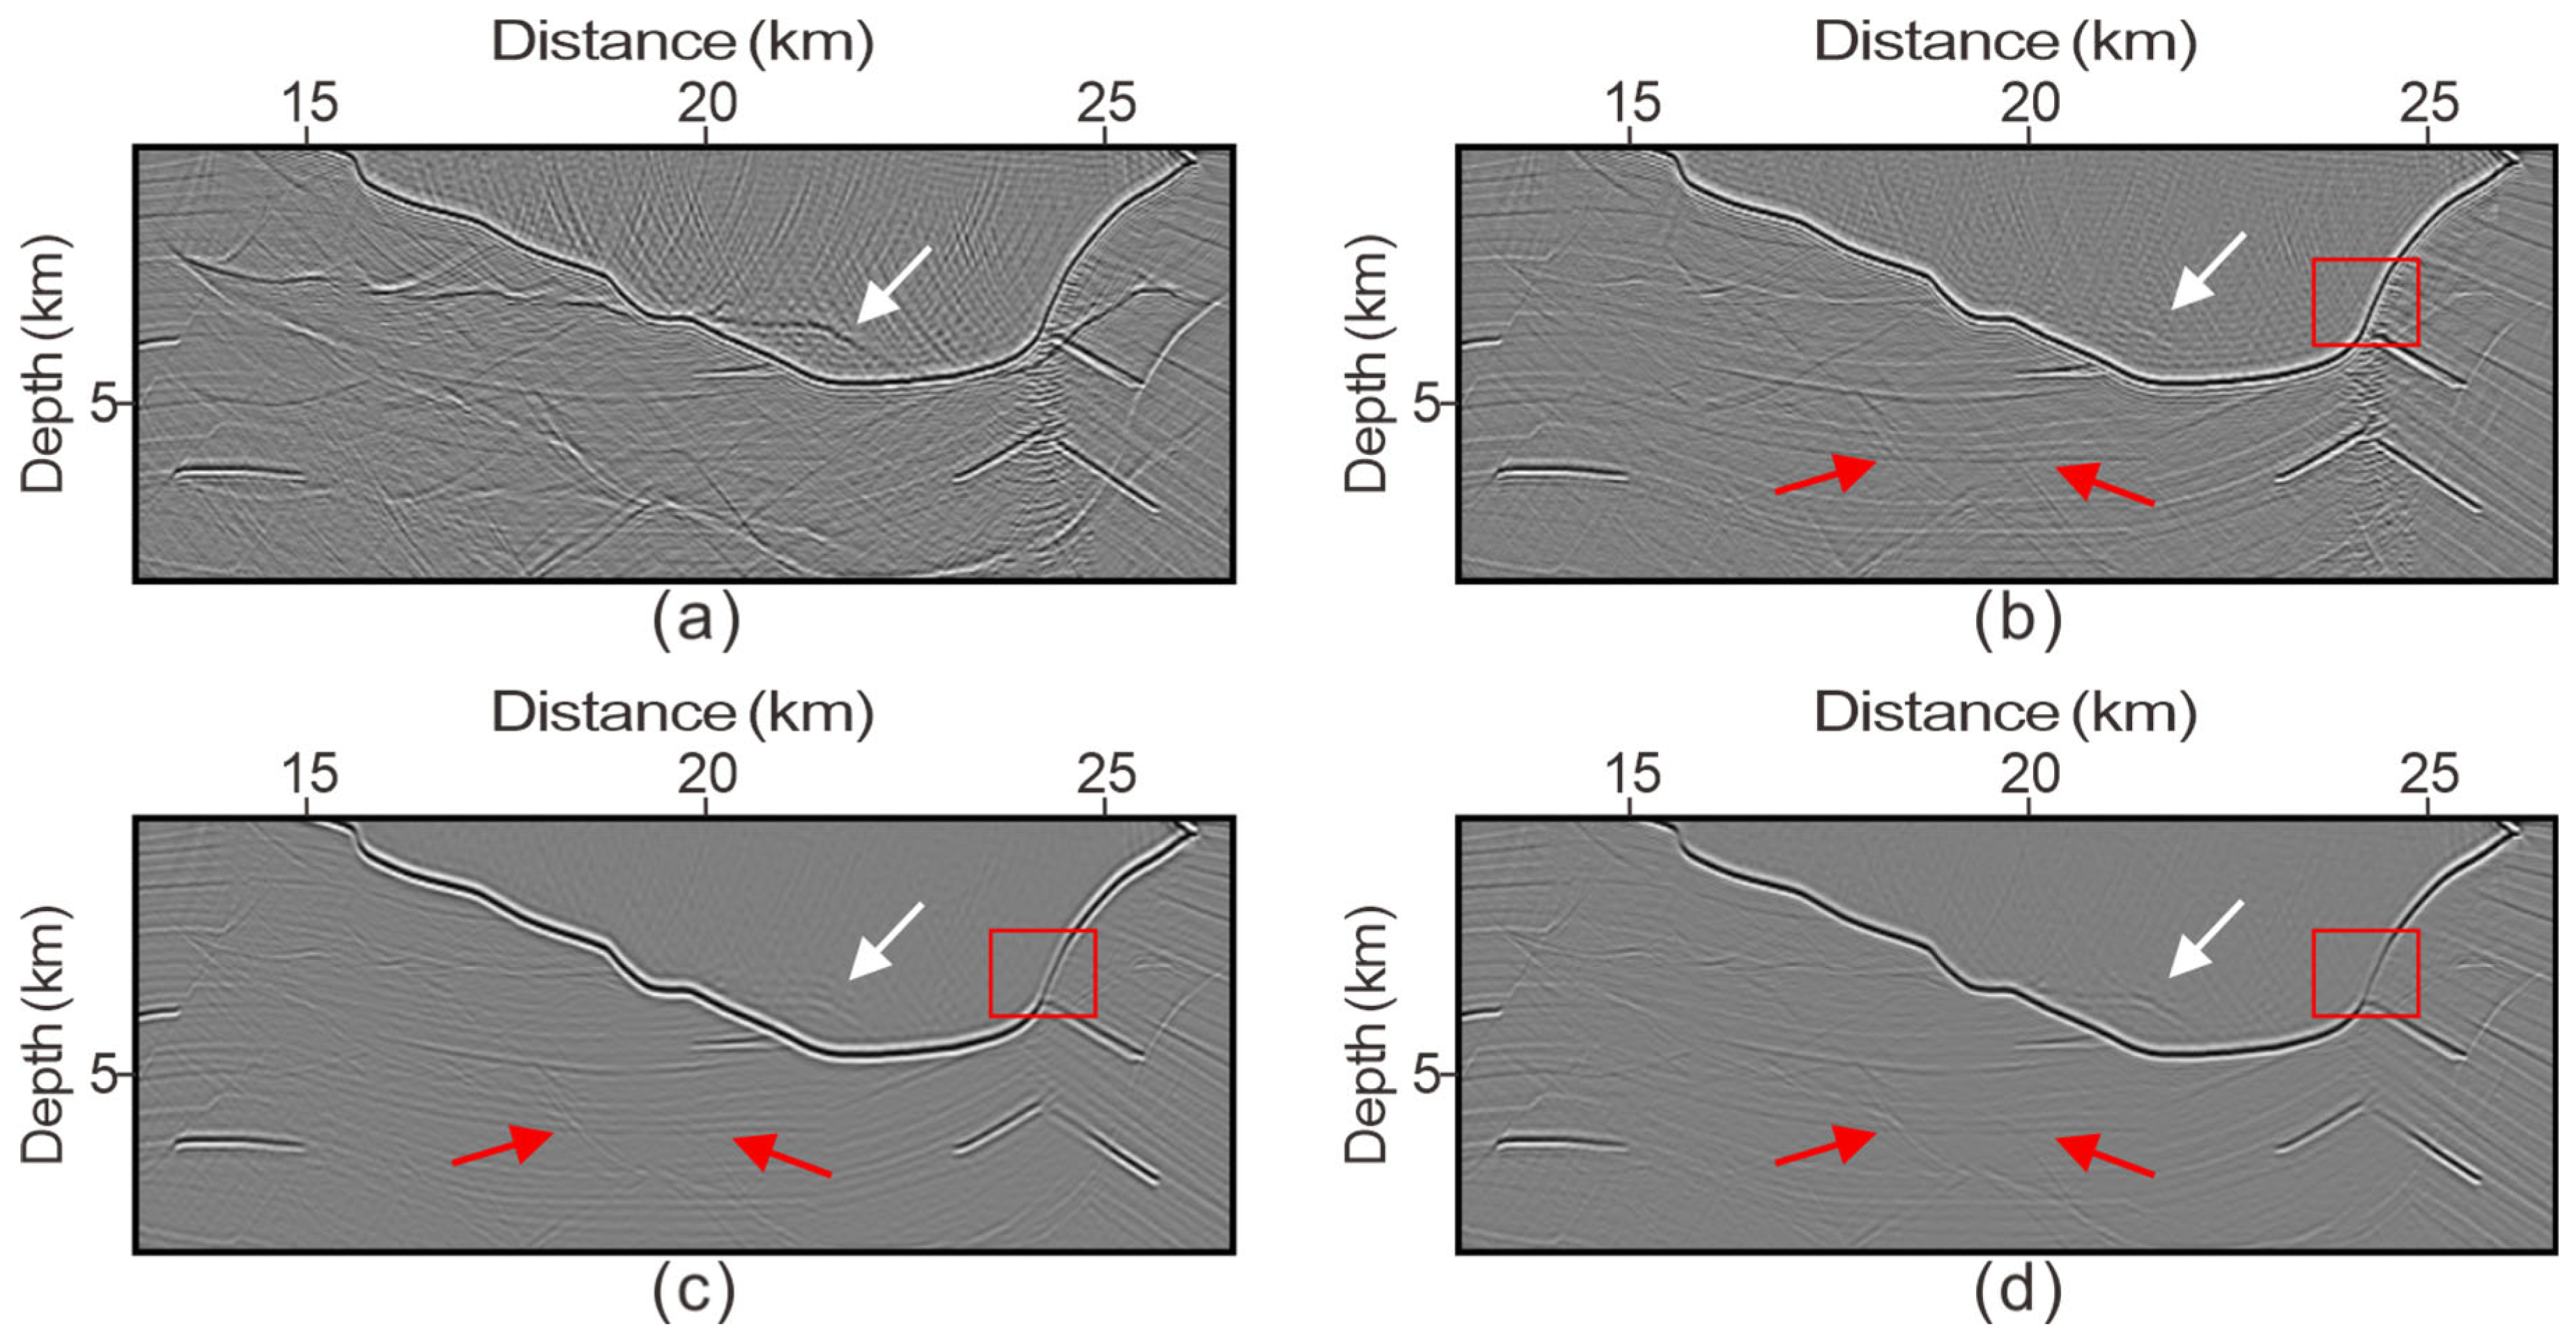
To eliminate the interference artifacts of multiples, the full-wavefield least-squares migration algorithm was used. Figure 15a shows the least-squares primary migration. Figure 15b–d shows the full-wavefield least-squares migration for multi-order wavefield global normalization, cross-correlation, and deconvolution conditions, with a focus on the analysis of multiples interference in the shallow layers and beneath the salt domes (indicated by a dashed red square).
Figure 16 presents an enlarged view of the depth range of 3.5–6.6 km in Figure 15. This can be primarily used to investigate the suppression effect beneath the salt domes. The artifacts below the salt domes are more complex than those in the shallow layer. The white arrows indicate the first-order surface-related multiple crosstalk artifacts formed between the free surface and the salt dome interface. These artifacts exhibit a strong energy and intricate morphology and significantly impede the identification of layers beneath the salt dome. Regarding deep artifact suppression, the multi-order wavefield normalization condition surpasses the previous two methods in mitigating interference. This superiority is attributed to the inherent nature of salt domes as strong shielding layers, which makes imaging below the salt domes a challenging task in migration. The cross-correlation and deconvolution imaging results of the full-wavefield migration show significantly lower coherence energy for subsalt imaging (as indicated by the red arrows) and salt dome flanks (as indicated by the red square) compared to the global normalized imaging conditions. This is because conventional imaging conditions fail to provide illumination compensation for deep layers, while the multi-order wavefield normalization imaging condition incorporates both the internal and surface-related multiple illumination effects, offering exceptional illumination of deep layers.

4. Conclusions

We conducted a numerical experiment to analyze the crosstalk artifacts of different-order multiples in marine seismic exploration, and examined the two-way illumination energy distribution of the full wavefield under the combination of primary waves, surface-related multiples, and internal multiples. From the perspective of full-wavefield illumination compensation, we propose a combination of multi-order wavefield global normalization conditions and full-wavefield least-squares migration. The algorithm introduces downward illumination wavefields of internal and surface-related multiples in the least-squares iteration, effectively suppressing multiple artifacts. Numerical experiments using a simple inter-layer model and the Pluto 1.5 model indicate that, when simulated marine seismic data simultaneously include both primary waves and multiples, the algorithm still yields satisfactory imaging results. Compared to conventional imaging conditions, this algorithm offers the following advantages: (1) it is equally stable but is not constrained by the choice of parameter ε (compared to smooth deconvolution conditions); (2) it provides broader illumination and has the potential for deep imaging; (3) it can suppress most multiple interference artifacts. In terms of its computational efficiency and working memory, this algorithm is essentially the same as the traditional cross-correlation imaging condition, with no additional cost.

Author Contributions

H.Z.: conceived and designed the algorithm; performed the experiments; analyzed the data; wrote the paper. D.W.: conceived and designed the algorithm; performed the experiments; analyzed the data; wrote the paper. L.L.: analyzed the data. All authors have read and agreed to the published version of the manuscript.

Funding

This research was supported in part by the National Natural Science Foundation of China (No. 42074151, No. 41374108), and Major Projects of the National Science and Technology of China (Grant No. 2016ZX05026-002-003).

Data Availability Statement

The data presented in this study are available on request from the corresponding author. The data are not publicly available due to privacy.

Conflicts of Interest

Author Lingxiang Li was employed by the company Jilin High-Grade Highway Engineering Co., Ltd. The remaining authors declare that the research was conducted in the absence of any commercial or financial relationships that could be construed as a potential conflict of interest.

References

  1. Berkhout, A.J.; Vershuur, D.J. Multiple technology: Part 2, Migration of multiple reflections. In SEG Technical Program Expanded Abstracts 1994; SEG Library: Houston, TX, USA, 1994; pp. 1497–1500. [Google Scholar]
  2. Guitton, A. Shot-profile migration of multiple reflections. In SEG Technical Program Expanded Abstracts 2002; SEG Library: Houston, TX, USA, 2002; pp. 1296–1299. [Google Scholar]
  3. Schuster, G.T.; Yu, J.; Sheng, J.; Rickett, J. Interferometric/daylight seismic imaging. Geophys. J. Int. 2004, 157, 838–852. [Google Scholar] [CrossRef]
  4. Brown, M.F.; Guitton, A. Least-squares joint imaging of multiples and primaries. Geophysics 2005, 70, S79–S89. [Google Scholar] [CrossRef]
  5. Muijs, R.; Holliger, K.; Robertsson, J.O.A. Prestack depth migration of primary and surface-related multiple reflections. In SEG Technical Program Expanded Abstracts 2005; SEG Library: Houston, TX, USA, 2005; pp. 2107–2110. [Google Scholar]
  6. Berkhout, A.J.; Verschuur, D.J. Imaging of multiple reflections. Geophysics 2006, 71, SI209–SI220. [Google Scholar] [CrossRef]
  7. Liu, Y.; Chang, X.; Jin, D.; He, R.; Sun, H.; Zheng, Y. Reverse time migration of multiples for subsalt imaging. Geophysics 2011, 76, WB209–WB216. [Google Scholar] [CrossRef]
  8. Liu, Y.; Hu, H.; Xie, X.-B.; Zheng, Y.; Li, P. Reverse time migration of internal multiples for subsalt imaging. Geophysics 2015, 80, S175–S185. [Google Scholar] [CrossRef]
  9. Ordoñez, A.; Söllner, W.; Klüver, T.; Gelius, L.J. Migration of primaries and multiples using an imaging condition for amplitude-normalized separated wavefields. Geophysics 2014, 79, S217–S230. [Google Scholar] [CrossRef]
  10. Zhang, D.; Schuster, G.T. Least-squares reverse time migration of multiples. Geophysics 2014, 79, S11–S21. [Google Scholar] [CrossRef]
  11. Zuberi, M.A.H.; Alkhalifah, T. Generalized internal multiple imaging. Geophysics 2014, 79, S207–S216. [Google Scholar] [CrossRef]
  12. Lu, S.; Whitmore, D.N.; Valenciano, A.A.; Chemingui, N. Separated-wavefield imaging using primary and multiple energy. Lead. Edge 2015, 34, 770–778. [Google Scholar] [CrossRef]
  13. Wong, M.; Biondi, B.L.; Ronen, S. Imaging with primaries and free-surface multiples by joint least-squares reverse time migration. Geophysics 2015, 80, S223–S235. [Google Scholar] [CrossRef]
  14. Nath, A.; Verschuur, D.J. Imaging with surface-related multiples to overcome large acquisition gaps. J. Geophys. Eng. 2020, 17, 742–758. [Google Scholar] [CrossRef]
  15. ul Haq, E.; Ji, Y.; Shahzad, K.; Mashwani, S.A.; Ullah, H.; Zaheer, M. Architectural complexities and morphological variations of the sediment waves of Plio-Pleistocene channel levee backslope of the Indus fan. Rud.-Geol.-Naft. Zb. 2022, 37, 39–54. [Google Scholar] [CrossRef]
  16. Yang, M.; Fang, Z.; Witte, P.; Herrmann, F.J. Time-domain sparsity promoting least-squares reverse time migration with source estimation. Geophys. Prospect. 2020, 68, 2697–2711. [Google Scholar] [CrossRef]
  17. Pranata, B.; Ramdhan, M.; Hanif, M.; Sulaiman, M.I.; Maulana, M.P.; Wandono; Widiyantoro, S.; Suhardja, S.K.; Hidayat, E.; Supendi, P.; et al. Seismic imaging beneath Sumatra Island and its surroundings, Indonesia, from local-regional P-wave earthquake tomography. Rud.-Geol.-Naft. Zb. 2023, 38, 119–132. [Google Scholar] [CrossRef]
  18. Hu, Y.; Gong, X.; Wang, B.; Wang, Z.; Han, L. Phase-Amplitude Least-Squares Reverse Time Migration With a Simultaneous-Source Based on Sparsity Promotion in the Time-Frequency Domain. IEEE Geosci. Remote Sens. Lett. 2022, 19, 1–5. [Google Scholar] [CrossRef]
  19. Qu, Y.M.; Ren, J.R.; Huang, C.P.; Li, Z.C.; Wang, Y.X.; Liu, C. 3-D Least-Squares Reverse Time Migration in Curvilinear-tau Domain. IEEE Trans. Geosci. Remote Sens. 2022, 60, 1–14. [Google Scholar] [CrossRef]
  20. Yuan, M.; Huang, J.; Liao, W.; Jiang, F. Least-squares Gaussian beam migration. J. Geophys. Eng. 2017, 14, 184–196. [Google Scholar] [CrossRef]
  21. Wu, S.; Wang, Y.; Zheng, Y.; Chang, X. Limited-memory BFGS based least-squares pre-stack Kirchhoff depth migration. Geophys. J. Int. 2015, 202, 738–747. [Google Scholar] [CrossRef]
  22. Valenciano, A.A.; Biondi, B. 2-D deconvolution imaging condition for shot-profile migration. In SEG Technical Program Expanded Abstracts 2003; SEG Library: Houston, TX, USA, 2003; pp. 1059–1062. [Google Scholar]
  23. Guitton, A.; Valenciano, A.; Bevc, D.; Claerbout, J. Smoothing imaging condition for shot-profile migration. Geophysics 2007, 72, S149–S154. [Google Scholar] [CrossRef]
  24. Poole, T.L.; Curtis, A.; Robertsson, J.O.; van Manen, D.-J. Deconvolution imaging conditions and cross-talk suppression. Geophysics 2010, 75, W1–W12. [Google Scholar] [CrossRef]
  25. Li, Z.; Li, Z.; Wang, P.; Zhang, M. One-way wave-equation migration of multiples based on stereographic imaging condition. Geophysics 2017, 82, S479–S488. [Google Scholar] [CrossRef]
  26. Lu, S.; Qiu, L.; Li, X. Addressing the crosstalk issue in imaging using seismic multiple wavefields. Geophysics 2021, 86, S235–S245. [Google Scholar] [CrossRef]
  27. Tu, N.; Herrmann, F.J. Fast imaging with surface-related multiples by sparse inversion. Geophys. J. Int. 2015, 201, 304–317. [Google Scholar] [CrossRef]
  28. Qu, Y.; Li, J.; Guan, Z.; Li, Z. Viscoacoustic reverse time migration of joint primaries and different-order multiples. Geophysics 2020, 85, S71–S87. [Google Scholar] [CrossRef]
  29. Alkhalifah, T.; Gou, Q. Subsurface wavefields based on the Generalized Internal Multiple Imaging. Geophys. J. Int. 2019, 219, 1212–1224. [Google Scholar] [CrossRef]
  30. Wang, G.; Guo, Q.; Alkhalifah, T.; Wang, S. Frequency-domain reflection waveform inversion with generalized internal multiple imaging. Geophysics 2021, 86, R701–R710. [Google Scholar] [CrossRef]
  31. Berkhout, A.J. Review Paper: An outlook on the future of seismic imaging, Part II: Full-Wavefield Migration. Geophys. Prospect. 2014, 62, 931–949. [Google Scholar] [CrossRef]
  32. Davydenko, M.; Verschuur, D.J. Full-wavefield migration: Using surface and internal multiples in imaging. Geophys. Prospect. 2017, 65, 7–21. [Google Scholar] [CrossRef]
  33. Davydenko, M.; Verschuur, D.J. Including and using internal multiples in closed-loop imaging—Field data examples. Geophysics 2018, 83, R297–R305. [Google Scholar] [CrossRef]
  34. Li, A.; Verschuur, D.J.; Abolhassani, S. Full wavefield migration based on eigen-decomposition propagation operators. In Proceedings of the 84th EAGE Annual Conference & Exhibition, Vienna, Austria, 5–8 June 2023; Volume 2023, pp. 1–5. [Google Scholar]
  35. Zhang, D.; Verschuur, D.J. Closed-loop surface-related multiple estimation with full-wavefield migration-reconstructed near offsets for shallow water. Geophysics 2021, 86, WC21–WC30. [Google Scholar] [CrossRef]
  36. Liu, Y.; Liu, X.; Osen, A.; Shao, Y.; Hu, H.; Zheng, Y. Least-squares reverse time migration using controlled-order multiple reflections. Geophysics 2016, 81, S347–S357. [Google Scholar] [CrossRef]
  37. Liu, Y.; Zhang, Y.; Zheng, Y. Reverse time migration of phase-encoded all-order multiples. Geophysics 2022, 87, S45–S52. [Google Scholar] [CrossRef]
  38. Zhang, Y.; Liu, Y. Phase-encoding-based least-squares reverse time migration of controlled-order multiples. Geophysics 2023, 88, S101–S113. [Google Scholar] [CrossRef]
  39. Li, J.; Qu, Y.; Li, M.; Li, Z. Viscoacoustic least-squares reverse-time migration of different-order free-surface multiples. Geophys. Prospect. 2023, 71, 29–47. [Google Scholar] [CrossRef]
  40. Wapenaar, K.; Broggini, F.; Slob, E.; Snieder, R. Three-Dimensional Single-Sided Marchenko Inverse Scattering, Data-Driven Focusing, Green’s Function Retrieval, and their Mutual Relations. Phys. Rev. Lett. 2013, 110, 084301. [Google Scholar] [CrossRef]
  41. Zhang, L.; Thorbecke, J.; Wapenaar, K.; Slob, E. Data-driven internal multiple elimination and its consequences for imaging: A comparison of strategies. Geophysics 2019, 84, S365–S372. [Google Scholar] [CrossRef]
  42. Staring, M.; Dukalski, M.; Belonosov, M.; Baardman, R.H.; Yoo, J.; Hegge, R.F.; van Borselen, R.; Wapenaar, K. Robust estimation of primaries by sparse inversion and Marchenko equation-based workflow for multiple suppression in the case of a shallow water layer and a complex overburden: A 2D case study in the Arabian Gulf. Geophysics 2021, 86, Q15–Q25. [Google Scholar] [CrossRef]
  43. Berkhout, A.J. Review Paper: An outlook on the future of seismic imaging, Part I: Forward and reverse modelling. Geophys. Prospect. 2014, 62, 911–930. [Google Scholar] [CrossRef]
  44. Claerbout, J.F. Toward a Unified Theory of Reflector Mapping. Geophysics 1971, 36, 467–481. [Google Scholar] [CrossRef]
  45. Zhao, Y.; Lu, J.; Liu, X.; Zhang, S. Oil and gas exploration in deep water area of Gulf of Mexico. Mar. Geol. Front. 2014, 30, 27–32. [Google Scholar]
  46. Turner, R.E.; Rabalais, N.N. The Gulf of Mexico. In World Seas: An Environmental Evaluation; Elsevier: Amsterdam, The Netherlands, 2019; pp. 445–464. [Google Scholar]
  47. Stoughton, D.; Stefani, J.; Michell, S. 2D Elastic Model for Wavefield Investigations of Subsalt Objectives, Deep Water Gulf of Mexico. In Proceedings of the 63rd EAGE Conference & Exhibition, Amsterdam, The Netherlands, 11–15 June 2001. [Google Scholar]
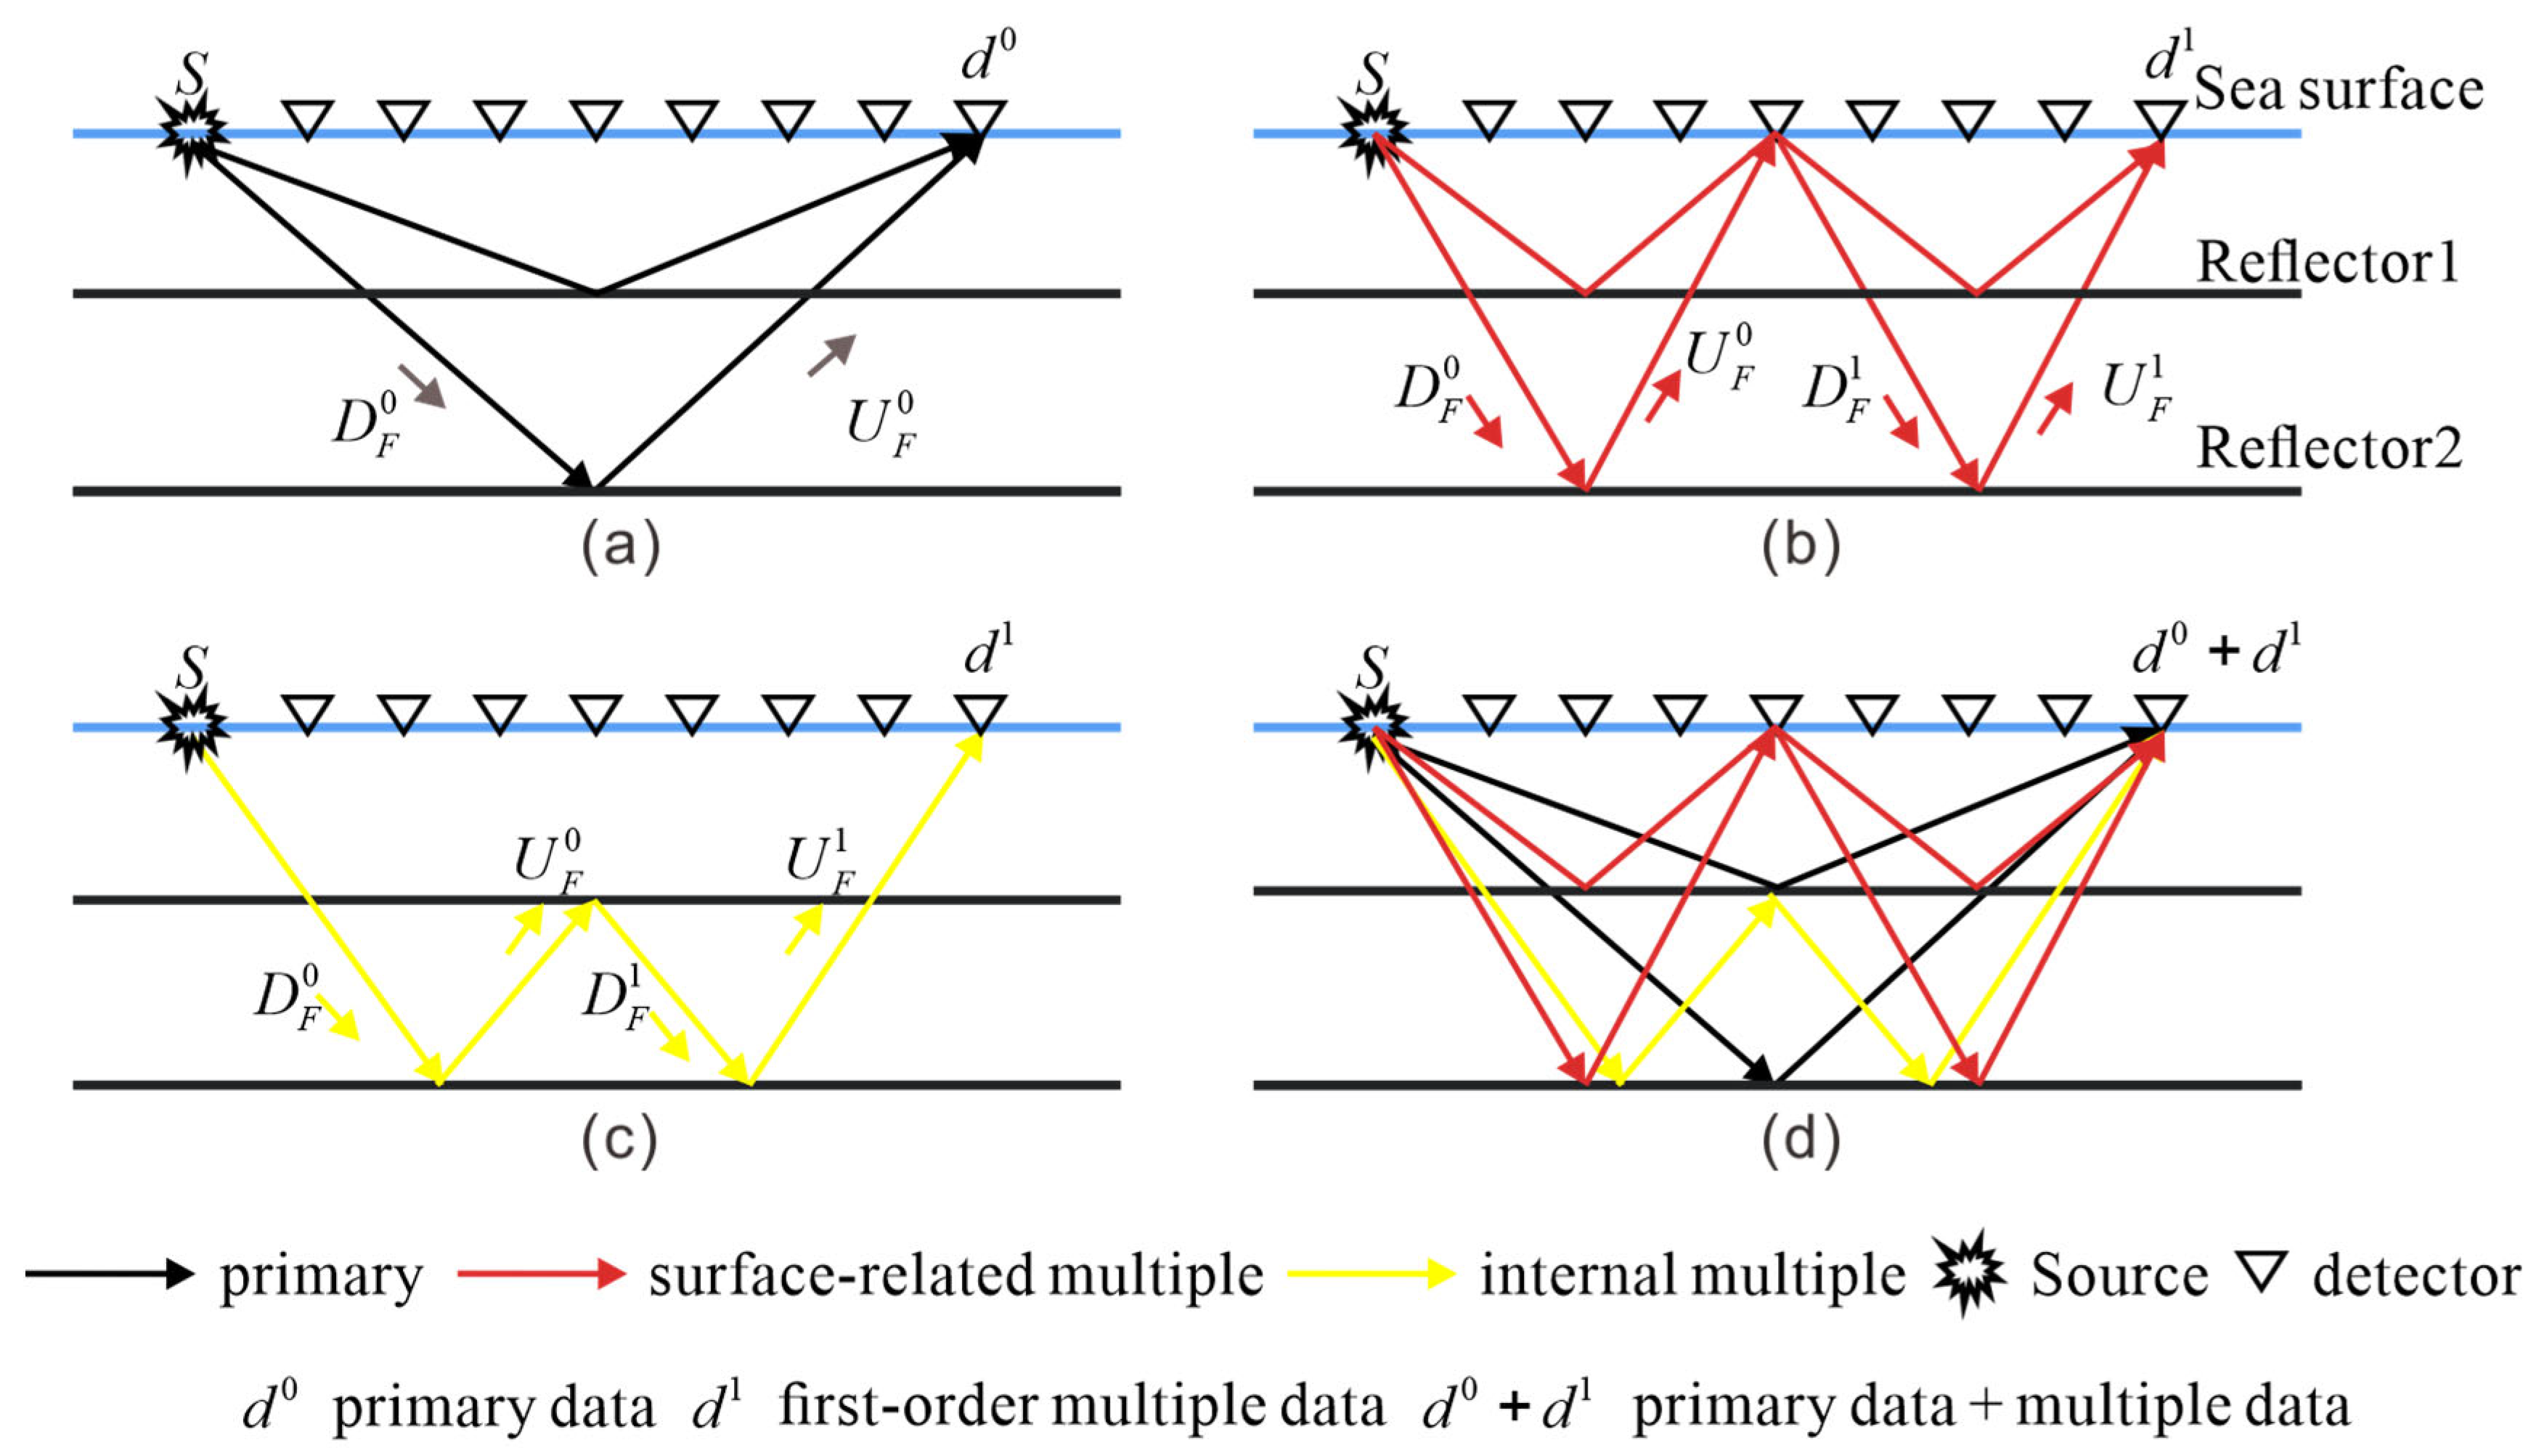
Figure 1. Schematic diagram of primary and multiple paths: (a) primary path S - D F 0 - U F 0 ; (b) surface-related multiple path S - D F 0 - U F 0 - D F 1 - U F 1 ; (c) internal multiple path S - D F 0 - U F 0 - D F 1 - U F 1 ; (d) sum of (ac).
Applsci 14 01389 g001
Figure 2. Schematic diagram of different-order wavefield imaging: (a) primary data with primary migration (Equation (1)); (b) full-wavefield data with primary migration (Equation (3)); (c) full-wavefield data with full-wavefield migration (Equation (4)).
Applsci 14 01389 g002
Figure 3. Four-layer model: (a) P-wave velocity model; (b) density model.
Applsci 14 01389 g003
Figure 4. The images generated by primaries and different orders of multiples: (a) U B i D F 0 full-wavefield data imaging result; (b) U B 0 D F 0 primary data imaging result; (c) U B 1 D F 0 first-order surface-related multiple crosstalk; (d) U B 1 D F 0 first-order internal multiples crosstalk; (e) U B 1 D F 1 first-order surface-related multiple correct imaging; (f) U B 2 D F 2 second-order surface-related multiple correct imaging.
Applsci 14 01389 g004
Figure 5. Normalized amplitude of two-way illumination of different order wavefield: (a) primary illumination; (b) primary and internal multiple illumination; (c) primary and surface-related multiple illumination; (d) full-wavefield (primary and surface-related multiple and internal multiple) illumination.
Applsci 14 01389 g005
Figure 6. Full-wavefield data of layer model computed with the finite difference method: (a) common−shot gather; (b) common−offset gather. The black arrow is primary wave, the solid white arrow is surface-related multiple, the dashed white arrow is internal multiple.
Applsci 14 01389 g006
Figure 7. Migration velocity model (Gaussian smoothing of the true velocity model).
Applsci 14 01389 g007
Figure 8. Migration results under three imaging conditions: (a) cross-correlation; (b) deconvolution; (c) global normalization. The black arrow is primary correct imaging, the yellow box indicates the area of interest.
Applsci 14 01389 g008
Figure 9. Least-squares migration results: (a) global normalization primaries migration; (b) global normalization full-wavefield migration; (c) cross-correlation full-wavefield migration; (d) deconvolution full-wavefield migration. The black arrow is primary correct imaging, the solid white arrow is surface-related multiple artifacts, the dashed white arrow is internal multiple artifacts, the yellow box indicates the area of interest.
Applsci 14 01389 g009
Figure 10. Downward wavefield illumination analysis of the single-frequency gradient term: (a) first iteration; (b) second iteration.
Applsci 14 01389 g010
Figure 11. Pluto 1.5 model: (a) P-wave velocity model; (b) density model.
Applsci 14 01389 g011
Figure 12. Full-wavefield data of Pluto model computed with the finite difference method: (a) common-shot gather; (b) common-offset gather. The black arrow is primary wave, the solid white arrow is surface-related multiple, the dashed white arrow is internal multiple.
Applsci 14 01389 g012
Figure 13. Migration velocity model (Gaussian smoothing of the true velocity model).
Applsci 14 01389 g013
Figure 14. Migration results under three imaging conditions: (a) cross-correlation; (b) deconvolution; (c) global normalization.
Applsci 14 01389 g014
Figure 15. Least-squares migration results: (a) global normalization primary migration; (b) global normalization full-wavefield migration; (c) cross-correlation full-wavefield migration; (d) deconvolution full-wavefield migration. The solid white arrow is surface-related multiple artifacts, the dashed white arrow is internal multiple artifacts, the red box indicates the area of interest.
Applsci 14 01389 g015
Figure 16. Least-squares migration local magnification: (a) global normalization primary migration; (b) global normalization full-wavefield migration; (c) cross-correlation full-wavefield migration; (d) deconvolution full-wavefield migration. The solid white arrow is surface-related multiple artifacts, the red arrow and the red box indicates the area of interest.
Applsci 14 01389 g016
Disclaimer/Publisher’s Note: The statements, opinions and data contained in all publications are solely those of the individual author(s) and contributor(s) and not of MDPI and/or the editor(s). MDPI and/or the editor(s) disclaim responsibility for any injury to people or property resulting from any ideas, methods, instructions or products referred to in the content.