Featured Application
The proposed processing technology can improve refraction waveform signal quality, which is convenient for picking.
Abstract
Traveltime picking accuracy is frequently affected by incoherent or random data noise. Within this context, we put forth a new denoising method called iterative interferometric denoising filtering. This method leverages the pseudo-Wigner distribution function to capture the offset and time-symmetric patterns of source wavelets convolved in seismic signals. Incoherent or random noises without this characteristic are eliminated via this approach. The processed data have waveform information distortion and more frequency components. However, the traveltime information can be considered correct, and the improved signal-to-noise ratio makes traveltime picking much more convenient. Our method’s practical applications in a synthetic and in two field datasets show that this technology can increase the signal-to-noise ratio, and the picked traveltime information can be used in traveltime tomography. These two field datasets were collected near the Aqaba Gulf and the Qademah fault, located in King Abdullah Economic City.
1. Introduction
Because of the modern petroleum technology explosion, the oil buried in simple and shallow areas has already been found. Advanced seismic imaging methods were developed to obtain images of subsurface geological structures to explore the remaining petroleum resources found in complex and deeper reservoirs. However, shallow regions with complex geological structures where the depth is less than 500 m will lead to distortion of the final seismic image. So, it is essential to construct an accurate near-surface velocity model for statics redatuming [1,2] to remove topography or shallow-region effects.
Refraction traveltime tomography is recognized as a standard approach for near-surface seismic imaging [3,4] and provides a broader ray convergence in subsurface circumstances within tens to hundreds of meters deep. This type of geophysical method inverts the subsurface velocity value distribution by fitting refraction traveltime. It requires traveltime calculation using a ray-tracing algorithm and back-projecting traveltime difference along ray paths to iterate the velocity model. Although wave equation-based traveltime inversion methods [5,6] could provide a better near-surface velocity model because they account for the phase difference, the computation cost is much more expensive because of the wave equation calculation. The refraction traveltime tomography result can also be utilized in geological surveys [7], initial velocity models for early-arrival waveform inversion (EWI) [8,9,10], joint geophysical inversion [11], and medical imaging [12].
However, incoherent data noises generated by the environment and instruments have unpredictable characters in space and time domains [13] and will decrease performance while picking the first-arrival traveltime [14,15]. Numerous denoising methods, including FX filters [16,17], KL transformations [18], singular value decomposition (SVD) methods [19], and Radon transforms [20], are used to suppress this type of noise. Kriegel et al. [21] utilize Principal component analysis (PCA) to downweigh datasets. However, all these approaches require some parameters to adjust the noise filter threshold; inappropriate parameters will damage useful information or cause noise elimination failure. Seismic interferometry [22] has been introduced to increase the microseismic waveform signal-to-noise (S/N) ratio [23] by fixing the correct picking of a reference first break on at least one trace and then applying cross-correlation to provide picking convenience. Further, this concept has been transferred to the refraction field [24,25,26]. In recent years, machine learning has also been used in the seismic denoising field [27].
The pseudo-Wigner distribution filter (pseudo-WDF) was first proposed in quantum statistics [28] to focus a symmetric pattern on the center location. This type of technology has been introduced into the frequency domain to propose the interferometric imaging condition; in this imaging condition, the incoherent wavefield fluctuations caused by random velocity perturbations can be canceled using cross-correlation operations [29,30,31]. Sava and Poliannikov [32] extended this technology into the spatial domain in Reverse Time Migration (RTM) to suppress the artifacts caused by inaccurate velocity models. Sava [33] applied the pseudo-WDF from the active-source geophysics field to an acoustic Time-reversal Imaging method (acoustic TRI method) for passive source location to decrease the artifacts resulting from sparse acquisition geometry and random velocity disturbances. Artifacts on image domains caused by these two factors do not exhibit a symmetric character, so they can be eliminated. Wang et al. [34] and Li et al. [35] applied the pseudo-WDF to the elastic Time-reversal Imaging method (elastic TRI method) to account for velocity inaccuracy and acquisition geometry sparsity. Then, this method was employed on separated P- and S-wavefields to capture a source image with a symmetric radiation pattern during time-reversal modeling and to demonstrate its resistance to random noises using the Monte Carlo test under surface acquisition geometry in the elastic TRI method [36]. In addition, this WDF was also used to make polarity corrections in passive source datasets [37] and to capture symmetric source radiation images in diffraction stack images of passive sources [38,39].
In the seismic industry, seismic data generated by controlled sources are essentially the convolution of the seismic source and subsurface reflectivity series [40]. The source used here is controlled, such as explosives, vibrioses, or air guns [41], and has a symmetric and regular pattern on its wavelet. Here, we applied pseudo-WDF in both the time and spatial domains directly to capture the dynamic character of wavelets convolved with each trace. Valuable information, including symmetric and regular-source wavelets, can be highlighted; hence, incoherent noises will be suppressed. The suggested approach is post-process auto-correlation in both the spatial and time domains. We should notice that there will be distortion in waveform information, and the frequency of the processed data will increase compared to that of the original seismograms. We can apply this method iteratively until the S/N ratio is acceptable for seismic data with intense incoherent data noises. Still, more iterations will lead to the damage of seismic data quality. This method is referred to as an interferometric denoising filter (IDF). Incoherent data noises will be decreased, so first-arrival traveltime information will be more noticeable and convenient to pick manually or automatically using many algorithms, including AI.
In the Methods section, we describe our method by focusing on the physical meaning of the formulas used here. Then, we present a synthetic numerical example and two field data cases to demonstrate the method’s potential. These two field datasets were recorded at the Gulf of Aqaba [42] and along the Qademah Fault [43,44], in Saudi Arabia. In these three numerical cases, the processed data are convenient for refraction traveltime picking and related refraction traveltime tomography applications.
2. Methods
The 1D pseudo-Wigner distribution function is used to apply auto-correlation to a window centered on each sample of the given signal. Here, the auto-correlation operation can capture the repeated pattern implicated in the signal. The corresponding formula is displayed as Equation (1):
where is the independent variable, d is the original signal regarded as input, and is the output signal. The variable represents a window, and indicates each variable in this window.
For a seismic dataset consisting of useful signals and incoherent noises that can be viewed as Gaussian random noise, the seismic data equal the sum of the signal and the noise as shown in Equation (2):
where is the seismic dataset, is the useful signal, and represents the incoherent noise. In this equation, and represent offset and time variables, respectively.
In addition, as seen in Equation (3), the useful signal is equal to the convolution of the source wavelet with regular characters and Green’s function (the response of an impulse):
Here, is related to Green’s function for the subsurface medium, and is the source wavelet.
Seismic data are recorded in the time domain, where the horizontal axis represents the offset, and the vertical axis represents the time. In the time dimension, the source wavelet convolved with the reflectivity series has a symmetric and regular pattern, which can be captured by Equation (1). In the offset dimension, refraction wave mode has its characteristic pattern and can be highlighted using pseudo-WDF. In this case, we apply pseudo-WDF to both offset and time directions of the data domain (Equation (4)):
Here, is the data processed using our IDF method. and are the local offset and time windows used in our proposed IDF procedure. The independent parameters and are space and time variables in a local window scanning in the domain. This function essentially imposes autocorrelation operations in each direction in one offset–time local window. For example, Figure 1a shows a seismic dataset without noise, with a regular pattern in both the time (Figure 1b) and offset (Figure 1c) dimensions. In contrast, Figure 1d–f shows an example with only noise.
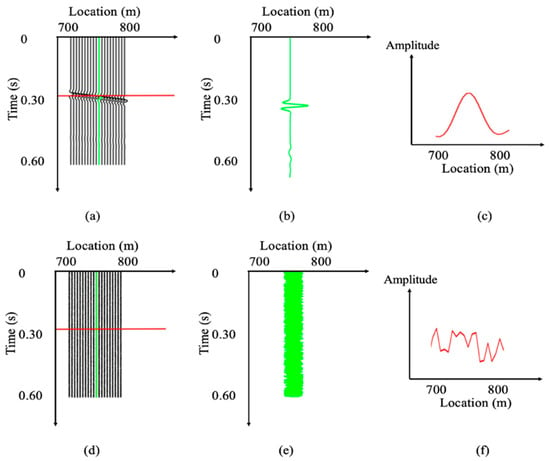
Figure 1.
(a) A set of noiseless data. (b) One trace (green line in (a)). (c) The space profile (red line in (a)). (d) A set of pure random noise without a signal. (e) One trace (green line in (d)). (f) The space profile (red line in (d)).
It is apparent that the useful signal convolved with the source wavelet exhibits a regular and symmetric pattern in both time and space domains (Figure 1b,c). Still, incoherent data noises do not (Figure 1e,f). So, the convolution of the source wavelet and Green’s function component, which has a symmetric kinematic character in both the time and offset domains, can be highlighted using the pseudo-WDF formula shown in Equation (4). In the meantime, the incoherent data noises, which do not have this type of regular character in either the time or spatial domain, are suppressed relative to useful signals. It is noticeable that this function increases the difference between each wave mode in a trace. Hence, the size of the local window used to apply the IDF should be as small as possible to avoid including other wave modes in the IDF window. However, the window size should also be more significant than half the wavelength (in offset dimension) and half the period (in time dimension). These criteria guarantee that the regular pattern around the wavelet center is included in the selected window [36]. However, in real applications, the wavelength and period are not only determined by the source wavelet but also by other factors, such as velocity variation, attenuation, and subsurface structure, so it is impossible to define the constant time and spatial value of the interferometric window used in this application.
The following flowchart describes the details of the proposed method and how to filter incoherent noise:
- Normalize each trace in the processed seismic data and define a rough interval around the initial guess of the first-arrival time. In this method, there will be a rough offset-time window , which can be used to isolate the early-arrival waveform we want.
- Apply the rough window to the seismic data (d) to obtain the muted early-arrival waveform (WD).
- Apply the proposed interferometric denoising filter (IDF) on the muted waveform (WD) to focus the information with regular and symmetrical patterns on both time and offset domains; in the meantime, the incoherent noise will be suppressed.
- Normalize each trace in the processed seismic data again.
- Check the S/R ratio; if it does not improve enough, repeat steps 3 and 4.
During this workflow, the incoherent noise will be eliminated iteratively. However, more iterations will destroy useful information. Hence, we can stop processing once the seismic data S/N ratio is acceptable. Usually, 3–4 iterations are enough to give good results.
3. Synthetic Example
In this section, we created synthetic data using a two-layer model, shown in Figure 2a. The velocities of the first and second layers are constant at 500 m/s and 1500 m/s, respectively. We used fourth-order space and second-order time finite-difference staggered-grid algorithms to calculate the acoustic wave equation [45]. To avoid virtual reflection from numerical boundaries, we implemented an auxiliary differential equation of the complex-frequency-shifted perfectly matched layer (ADE CFS-PML) as the absorbing boundary [46]. A 30 Hz central frequency Ricker wavelet was employed as the source wavelet. We calculated 5200 time steps with 0.25 ms step intervals. The calculated 20th common shot gather (CSG) is shown in Figure 2b. This synthetic example has 121 sources and receivers with 5 m source and receiver intervals.
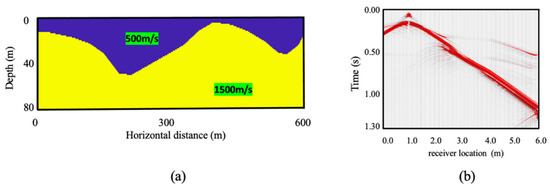
Figure 2.
(a) The velocity model used to create synthetic data. (b) The 20th common shot gather (CSG) of the synthetic data without noise.
The noiseless data were muted by a tapered window around the trial’s initial first-arrival traveltime. Figure 3 shows a common shot gather (CSG) and a corresponding zoom-in on the seismic data. Figure 4a shows the same CSG (Figure 3) after adding noise. Here, a set of Gauss numbers, with a maximum value of 50% of the normalized seismic data amplitude peak, were generated and then added to the muted seismogram as incoherent noise. Figure 4a represents the 20th noisy CSG and a zoom-in on the part of the seismogram in the blue box; it is obvious that this type of noise will lead to trouble during first-arrival traveltime picking. In real applications, this type of problem will cause high labor costs and uncertainty in the picked traveltimes; even tomography results in degradation. The 20th CSG after one iteration of the proposed method and the corresponding zoom-in of the blue box are displayed in Figure 4b. We can see that the incoherent data noises were eliminated, mainly because this type of data noise does not have a symmetrical character and is suppressed. This processed result will allow geophysicists to conveniently pick a traveltime and the subsequent traveltime tomography inversion.
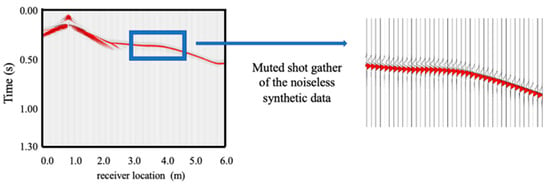
Figure 3.
The muted 20th CSG without noise and the related zoom.
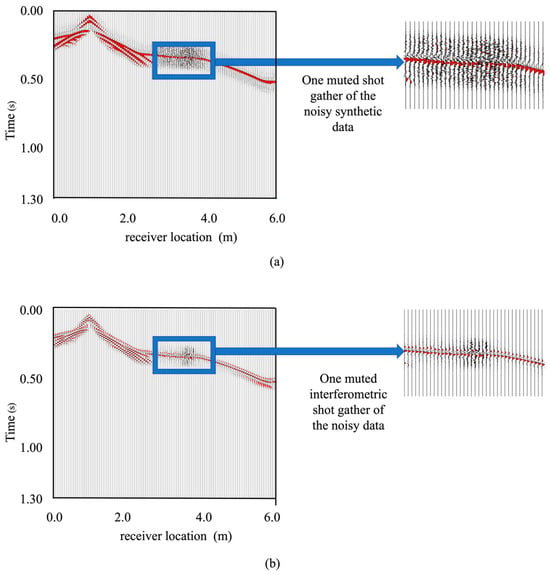
Figure 4.
(a) The muted 20th CSG with noise and the related zoom. (b) After applying IDF, the muted 20th interferometric CSG, and the corresponding zoom.
The 70th trace of the 20th CSG before and after applying the IDF is shown in Figure 5a,b; it is noticeable that the dynamic information is distorted through our proposed method with pseudo-WDF. We utilized the Fourier transform to obtain the amplitude spectrum before and after iterative IDF for frequency domain analysis, and the processed results are shown in Figure 5c. It is apparent that the peak frequency of the wavelet increased compared to that of the original wavelet because incoherent noise was eliminated, so our method’s ability to keep kinematic characteristics was demonstrated. This comparison indicates that, after the proposed IDF method, the head wave could support inversion methods based on traveltime information, such as traveltime tomography [3] and wave equation traveltime inversion [6], but it would not be suitable for FWI, which fits waveform information [47].

Figure 5.
(a) Trace no. 70 of the noisy seismic data. (b) The same trace after applying IDF. (c) The amplitude spectrum of seismic data before (black line) and after (blue line) IDF process.
We used in-house software to pick the first-arrival traveltime information for this set of synthetic data. We found that the processed data were much easier to pick than noisy data. The corresponding traveltime difference between manually picking information on original noiseless and interferometric noisy data was minimal (Figure 6). This comparison demonstrated that most of the differences were less than a fourth of the source wavelet period (20 ms; Figure 6b); hence, the proposed IDF method can be used in first-arrival traveltime picking, which is essential in near-surface velocity model building.
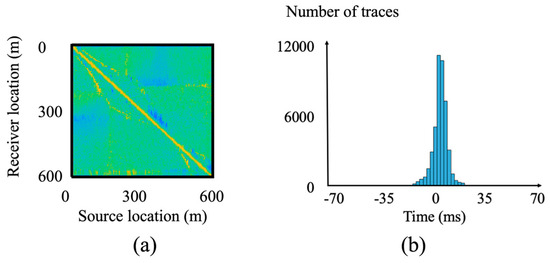
Figure 6.
(a) The traveltime difference between picking results on original (clean) data and on interferometric noisy data after applying IDF. (b) A histogram of traveltime difference.
4. Field Data Example
4.1. Gulf of Aqaba
A seismic survey recorded near the Gulf of Aqaba in Saudi Arabia is also used here to demonstrate the feasibility of the proposed IDF method. A Google map of the area is shown in Figure 7 [48]. The recorded 2D profile, indicated by a green line, crosses a normal fault (red line) in Figure 7b. A total of 120 sources and 120 geophones with 2.5 m spacing were used to record these data. A 200 lb accelerated weight drop was used to generate seismic energy. Figure 8a shows the first common shot gather (CSG) as an example of the recorded data. A taper time window with three periods was applied around the first-arrival traveltime, and the resulting CSG is displayed in Figure 8b.
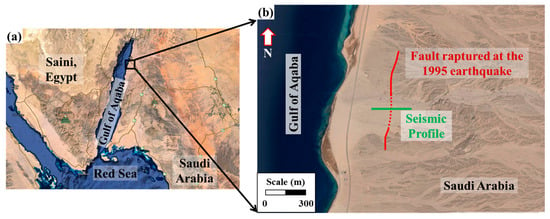
Figure 7.
(a) A Google Earth satellite image depicts the study area, located on the eastern side of the Gulf of Aqaba, north of Saudi Arabia. (b) The seismic profile is represented by the green line, and the normal fault is denoted by the red line. The solid segments of the red line represent the visible parts of the fault, while the dashed segment indicates the concealed portion of the fault.

Figure 8.
The 1st CSG in (a) original, (b) muted, and (c) muted IDF data recorded at the Gulf of Aqaba.
The proposed IDF was applied to the muted data, and the result is shown in Figure 8c. The IDF-processed seismic data had a greater S/N ratio than the seismograph before the IDF application (Figure 8b). Similar to the synthetic example, we manually picked the first-arrival traveltime information of the original and IDF datasets. The traveltime difference map and histogram are displayed in Figure 9a,b, respectively. The comparison demonstrates that the IDF dataset’s first-arrival traveltime is more accurate than the original dataset.
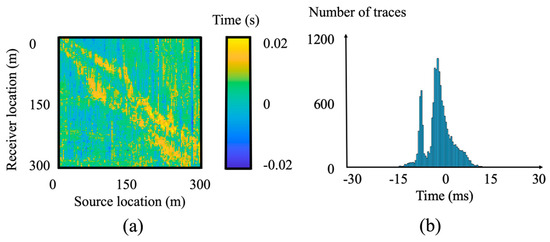
Figure 9.
(a) The picking traveltime difference between original and IDF datasets. (b) A histogram of traveltime difference.
We utilized the first-arrival traveltime information picked from original and IDF-processed seismograms as the input information for refraction traveltime tomography. Here, we utilized a conjugate gradient to iterate the velocity model and utilized the modified total variation regularization [4] as the regularization term to constrain the tomogram in each iteration. Figure 10a,b are refraction traveltime tomography results using traveltime information picked from original and IDF-processed datasets as the input information. Both of these tomograms indicate the fault located in the middle of the acquisition test line, which is in accordance with the fault represented by the red line shown in Figure 7b, and are concerned with the geology of the site. In this case, the kinematic characters of the IDF-processed dataset could support traveltime tomography used for the statics and initial velocity model of EWI.

Figure 10.
The traveltime tomography result using the first-arrival traveltime information picked from (a) original and (b) IDF-processed datasets.
4.2. Qademah Fault in King Abdullah Economic City
We also applied the IDF method to seismic data recorded near King Abdullah Economic City (KAEC) in Saudi Arabia, established a few years ago and very close to the Red Sea. According to the geological survey, the Red Sea coastal plain faults are hidden under the coastal plain sediments. One of these proposed faults is the Qademah fault, a normal rotational fault 25 km long that has been detected and mapped [43,44]. This field dataset includes a 2D seismic profile with 264 sources and geophones with 2 m intervals. The recorded total time and time intervals are 5 s and 1 ms, respectively. Figure 11a,b show the corresponding surface geology map and 40th CSG (only 301 time steps are displayed); the peak frequency of the recorded data was found to be 20 Hz.
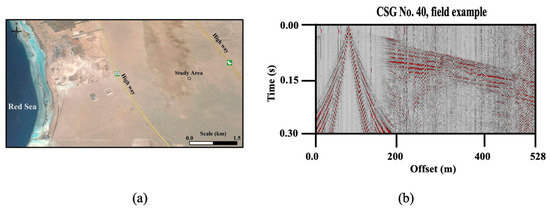
Figure 11.
(a) A surface geology map showing the location of the Qademah fault [43]. (b) The 40th CSG of field data collected near the Qademah fault.
A tapered window, which was centered around the initial guess of the first-arrival traveltime value, was applied, and the muted CSG is displayed in Figure 12a. The yellow, blue, and black boxes indicate three seismic slices which have obvious random or incoherent data noise, which may lead to first-arrival traveltime picking problems. Using the proposed IDF technology, the artifacts in seismic data become far fewer and easier to pick, as Figure 12b shows. Figure 13a represents the first-arrival traveltime difference between manually picking information on the original and muted datasets. The corresponding histogram of the entire dataset is displayed in Figure 13b. Most traveltime difference values were less than a quarter of the dominant period (10 ms) of the source wavelet; this degree of traveltime difference will not lead to traveltime tomography failure. It illustrates that iterative IDF will keep correct traveltime information while decreasing data noise. In addition, traveltime tomography using first-arrival traveltime information picked from the original and processed IDF datasets is shown in Figure 14a,b. Although there are some differences between these two tomograms, both of them could indicate the normal fault in the middle of the 2D seismic profile.
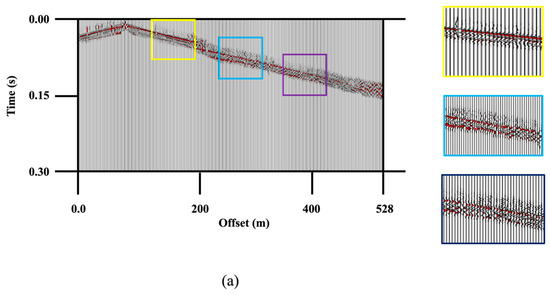
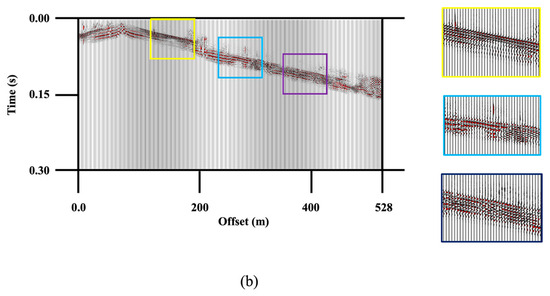
Figure 12.
The 40th CSG of (a) original field data and (b) the IDF-processed dataset. The zoom-in of yellow, blue, and purple boxes are some seismic slices which have strong random noises.
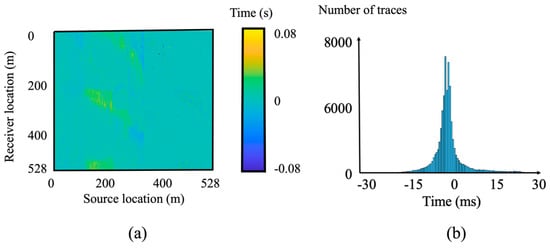
Figure 13.
(a) The first-arrival traveltime difference between manually picking information on original and muted datasets. (b) A corresponding histogram of the entire dataset.

Figure 14.
Traveltime tomography using first-arrival traveltime information picked from (a) original and (b) processed IDF datasets.
5. Computation Cost
Our advocated method used symmetric patterns in both the spatial and temporal domains. This type of pattern can be used as a reliable indicator for early-arrival waveforms convolved with source wavelets. To evaluate the computational cost of the proposed method (Equation (4)), we can assume the trace number in our denoted window and the number of time steps of the temporal interferometric window as . For each interferometric window, the total number of grid points utilized in Equation (4) is as follows:
The values of and are supposed to agree with the proposed criteria in the Methods section. As an example, we assume = 10 and = 10 in an interferometric calculation; the total number of grid points used for an interferometric window calculation will be about 100. If there are 10,000 points in the offset-time domain in which we want to impose our interferometric filter in each iteration, the number of extra calculation operations is about 106. This number is not a challenging task for any CPU.
6. Conclusions
We present the interferometric denoising filter (IDF) theory to eliminate random or incoherent noises in first-arrival traveltime picking. Our proposed method could increase the S/N ratio and keep accurate traveltime information for picking. Using our methodology, the dynamic character is distorted and has higher frequency components than the original dataset. This methodology is based on auto-correlation operations to find regular patterns that random or incoherent data noises do not have. We applied it to synthetic data generated by the forward algorithm. It is obvious that the random or incoherent data noises were eliminated, and the slight difference between the picked traveltime from the original and the IDF-processed data proves that the kinematic character kept well. In addition, two sets of field data, gathered in the Gulf of Aqaba and King Abdullah Economic City (KAEC) near the Qademah fault, are used to demonstrate the proposed approach’s feasibility. We compare picked traveltime and corresponding tomography results in these two field datasets. Both show great agreement with the picking information on original seismic data (although the picking procedure is complex due to the noise) and the corresponding traveltime tomography result. In the future, we could investigate the application of our proposed method in different fields, including geophysical case studies, environmental engineering, and pattern capture in other types of datasets. Furthermore, exploring the potential of the waveform, which is processed by our iterative IDF procedure and has a higher frequency component in waveform inversion application, is valuable.
Author Contributions
Methodology, H.Q.; Software, Y.Z.; Validation, H.Q., Y.Z. and S.M.H.; Formal analysis, Y.Z. and C.L.; Investigation, H.Q., S.M.H. and C.L.; Data curation, S.M.H.; Writing—original draft, C.L.; Writing—review & editing, S.M.H.; Project administration, H.Q. and Y.Z.; Funding acquisition, H.Q. All authors have read and agreed to the published version of the manuscript.
Funding
This research was funded by the China Geological Survey Project (DD20230010); the China Geological Survey Project (DD20230324); and the National Natural Science Foundation of China (41904065).
Institutional Review Board Statement
Not applicable.
Informed Consent Statement
Not applicable.
Data Availability Statement
The data presented in this study are available on request from the corresponding author due to the pre-approvals required from KAUST and KFUPM.
Acknowledgments
The author would like to thank King Abdullah University of Science and Technology (KAUST) and King Fahd University of Petroleum and Minerals (KFUPM) for their permission to use their land seismic data in this study.
Conflicts of Interest
The authors declares no conflicts of interest.
References
- Zhu, X.; Sixta, D.; Angstman, B. Tomostatics: Turning-ray tomography + static corrections. Lead. Edge 1992, 11, 15–23. [Google Scholar] [CrossRef]
- Jiang, W.; Zhang, J.; Bell, L. 3D seismic geometry control and corrections by applying machine learning. Geophysics 2019, 84, P87–P96. [Google Scholar] [CrossRef]
- Zhang, J.; Toköz, M.N. Nonlinear refraction traveltime tomography. Geophysics 1998, 63, 1726–1737. [Google Scholar] [CrossRef]
- Jiang, W.; Zhang, J. First-arrival traveltime tomography with modified total-variation regularization. Geophys. Prospect. 2017, 65, 1138–1154. [Google Scholar] [CrossRef]
- Woodward, M. Wave equation tomography. Geophysics 1991, 57, 15–26. [Google Scholar] [CrossRef]
- Luo, Y.; Schuster, G.T. Wave-equation traveltime inversion. Geophysics 1991, 56, 645–653. [Google Scholar] [CrossRef]
- Zelt, C.A.; Barton, P.J. Three-dimensional seismic refraction tomography: A comparison of two methods applied to data from the Faeroe Basin. J. Geophys. Res. Solid Earth 1998, 103, 7187–7210. [Google Scholar] [CrossRef]
- Sheng, J.; Leeds, A.; Buddensiek, M.; Schuster, G.T. Early arrival waveform tomography on near-surface refraction data. Geophysics 2006, 71, U47–U57. [Google Scholar] [CrossRef]
- Jiang, W.; Zhang, J. Imaging complex near-surface land area with joint traveltime and waveform inversion. In Proceedings of the 2015 Workshop: Depth Model Building: Full-Waveform Inversion, Beijing, China, 18–19 June 2015; Volume 2015, pp. 142–145. [Google Scholar]
- Yu, H.; Hanafy, S.M. An application of multiscale early arrival waveform inversion to shallow seismic data. Near Surf. Geophys. 2014, 12, 549–557. [Google Scholar] [CrossRef]
- Jiang, W. 3-D joint inversion of seismic waveform and airborne gravity gradiometry data. Geophys. J. Int. 2020, 223, 746–764. [Google Scholar] [CrossRef]
- Li, Z.; Zhang, J.; Liu, D.; Du, J. CT image-guided electrical impedance tomography for medical imaging. IEEE Trans. Med. Imaging 2019, 39, 1822–1832. [Google Scholar] [CrossRef] [PubMed]
- Sacchi, M. Statistical and Transform Methods in Geophysical Signal Processing; Department of Physics, University of Alberta: Edmonton, AB, Canada, 2002. [Google Scholar]
- Fernhout, C.; Zwartjes, P.; Yoo, J. Automatic first break picking with deep learning. IOSR J. Appl. Geol. Geophys. (IOSR-JAGG) 2020, 8, 24–36. [Google Scholar]
- Han, S.; Liu, Y.; Li, Y.; Luo, Y. First arrival traveltime picking through 3D U-NET. IEEE Geosci. Remote Sens. Lett. 2021, 19, 1–5. [Google Scholar]
- Soubaras, R. Signal preserving noise attenuation by the f-x prediction filter. In SEG Technical Program Expanded Abstracts; Society of Exploration Geophysicists: Houston, TX, USA, 1994; pp. 1576–1579. [Google Scholar]
- Sacchi, M.; Kuehl, H. Arma formulation of f-x prediction error filters and projection filters. J. Seism. Explor 1994, 9, 185–197. [Google Scholar]
- Ulrych, T.; Freire, S.; Siston, P. Eigenimage processing of seismic sections. In SEG Technical Program Expanded Abstract; Society of Exploration Geophysicists: Houston, TX, USA, 1988. [Google Scholar] [CrossRef]
- Golub, G.H. Matrix Computations, 3rd ed.; The Johns Hopkins University Press: Baltimore, MD, USA, 1996. [Google Scholar]
- Zhou, B.; Greenhalgh, S.A. Linear and parabolic-p revisited. Geophysics 1994, 59, 1133–1149. [Google Scholar] [CrossRef]
- Kriegel, H.; Kroger, P.; Schubert, E.; Zimek, A. A general framework for increasing the robustness of PCA-based correction clustering algorithms. Sci. Stat. Database Manag. Lect. Notes Comput. Sci. 2008, 5069, 418–435. [Google Scholar]
- Schuster, G.T. Seismic Interferometry; Cambridge University Press: Cambridge, UK, 2009. [Google Scholar]
- Iqbal, N.; Al-Shuhail, A.A.; Kaka, S.I.; Liu, E.; Raj, A.G.; McClellan, J.H. Iterative interferometry-based method for picking microseismic events. J. Appl. Geophys. 2017, 140, 52–61. [Google Scholar] [CrossRef]
- Dong, S.; Sheng, J.; Schuster, G.T. Theory and Practice of Refraction Interferometry. 76th Annual International Meeting. In SEG Expanded Abstracts; Society of Exploration Geophysicists: Houston, TX, USA, 2006; pp. 3021–3025. [Google Scholar]
- Al-Hagan, O.; Hanafy, S.; Schuster, G.T. Iterative supervirtual refraction interferometry. Geophysics 2014, 79, Q21–Q30. [Google Scholar] [CrossRef]
- Hanafy, S.M.; Schuster, G.T. Parsimonious refraction interferometry and tomography. Geophys. J. Int. 2017, 209, 695–712. [Google Scholar] [CrossRef][Green Version]
- Li, Y.; Ma, Z. Deep learning-based noise reduction for seismic data. J. Phys. Conf. Ser. 2021, 1861, 012011. [Google Scholar] [CrossRef]
- Wigner, E. On the Quantum correlation for thermodynamic equilibrium. Phys. Rev. 1932, 40, 749–759. [Google Scholar] [CrossRef]
- Borcea, L.; Papanicolaou, G.; Tsogka, C. Coherent interferometric imaging in clutter. Geophysics 2006, 71, SI165–SI175. [Google Scholar] [CrossRef]
- Borcea, L.; Papanicolaou, G.; Tsogka, C. Adaptive interferometric imaging in clutter and optimal illumination. Inverse Probl. 2006, 22, 1405. [Google Scholar] [CrossRef]
- Borcea, L.; Papanicolaou, G.; Tsogka, C. Coherent interferometry in finely layered random media. Multiscale Model. Simul. 2006, 5, 62–83. [Google Scholar] [CrossRef]
- Sava, P.; Poliannikov, O. Interferometric imaging condition for wave-equation migration. Geophysics 2008, 73, S47–S61. [Google Scholar] [CrossRef]
- Sava, P. Micro-earthquake monitoring with sparsely sampled data. J. Pet. Explor. Prod. Technol. 2011, 1, 43–49. [Google Scholar] [CrossRef]
- Wang, C.; Cheng, C.Y.J.; Liu, H. Microseismic seismic events location of surface and borehole observation with reverse-time focusing using interferometry technique. Chin. J. Geophys. 2013, 56, 584–597. [Google Scholar]
- Li, Z.; Sheng, W.W.G.; Cui, Q.; Zhou, D. Time-reverse microseismic hypocenter location with interferometric imaging condition based on surface and downhole multi-components. Chin. J. Geophys. 2014, 49, 666–671. [Google Scholar]
- Zhou, Y.; Zhang, Q.; Zhang, W. PS interferometric imaging condition for microseismic source elastic time-reversal imaging. Geophys. J. Int. 2022, 229, 505–521. [Google Scholar] [CrossRef]
- Xu, J.; Zhang, W.; Chen, X.; Guo, Q. An effective polarity correction method for microseismic migration-based location. Geophysics 2020, 85, KS115–KS125. [Google Scholar] [CrossRef]
- Zhang, Q.; Zhang, W. An efficient diffraction stacking interferometric imaging location method for microseismic events. Geophysics 2022, 87, KS73–KS82. [Google Scholar] [CrossRef]
- Zhang, Q.; Zhang, W.; Wu, X.; Zhang, J.; Kuang, W.; Si, X. Deep learning for efficient microseismic location using source migration based imaging. J. Geophys. Res. Solid Earth 2022, 127, e2021JB022649. [Google Scholar] [CrossRef]
- Aki, K.; Richards, P. Quantitative Seismology; University Science Books: Herndon, VA, USA, 1995. [Google Scholar]
- Lay, T.; Wallace, T. Modern Global Seismology; Academic Press: Cambridge, MA, USA, 1995. [Google Scholar]
- Hanafy, S.M. Iterative Super-Virtual Refraction Interferometry and Traveltime Tomography of Seismic Data: Field Example at Gulf of Aqaba; EAGE Conference & Exhibition: London, UK, 2019; pp. 3–6. [Google Scholar]
- Roobol, M.; Kadi, K. Cenozoic Faulting in the Rabigh Area, Central-West Saudi Arabia (Including the Sites of King Abdullah Economic City and King Abdullah University of Science and Technology); Saudi Geological Survey Technical Report; Saudi Geological Survey: Jeddah, Saudi Arabia, 2008. [Google Scholar]
- Hanafy, S.M. Mapping the Qademah fault with traveltime, surface-wave, and resistivity tomograms. In SEG Technical Program Expanded Abstracts; Society of Exploration Geophysicists: Houston, TX, USA, 2015. [Google Scholar]
- Levander, A. Fourth-order finite-difference P-SV seismograms. Geophysics 1998, 53, 1425–1436. [Google Scholar] [CrossRef]
- Zhang, W.; Shen, Y. Unsplit complex frequency-shifted PML implementation using auxiliary differential equations for seismic wave modeling. Geophysics 2010, 75, T141–T154. [Google Scholar] [CrossRef]
- Virieux, J.; Operto, S. An overview of full-waveform inversion in exploration geophysics. Geophysics 2009, 74, WCC1–WCC26. [Google Scholar] [CrossRef]
- Hanafy, S.; Sigurjon, J.; Yann, K. Imaging normal faults in alluvial fans using geophysical techniques: Field example from the coast of Gulf of Aqaba, Saudi Arabia. In SEG Technical Program Expanded Abstracts; Society of Exploration Geophysicists: Houston, TX, USA, 2014. [Google Scholar]
Disclaimer/Publisher’s Note: The statements, opinions and data contained in all publications are solely those of the individual author(s) and contributor(s) and not of MDPI and/or the editor(s). MDPI and/or the editor(s) disclaim responsibility for any injury to people or property resulting from any ideas, methods, instructions or products referred to in the content. |
© 2024 by the authors. Licensee MDPI, Basel, Switzerland. This article is an open access article distributed under the terms and conditions of the Creative Commons Attribution (CC BY) license (https://creativecommons.org/licenses/by/4.0/).