Article

Design of Reinforced Ribs for Spaceborne Parabolic Cylindrical Reflector Antenna Based on Topology Optimization and Parametric Analysis

1
Key Laboratory of Microwave Remote Sensing, National Space Science Center, Chinese Academy of Sciences, Beijing 100190, China
2
School of Astronomy and Space Science, University of Chinese Academy of Sciences, Beijing 100049, China
3
School of Aeronautics and Astronautics, University of Chinese Academy of Sciences, Beijing 100049, China
*
Authors to whom correspondence should be addressed.
Appl. Sci. 2024, 14(4), 1385; https://doi.org/10.3390/app14041385
Submission received: 12 January 2024 / Revised: 30 January 2024 / Accepted: 3 February 2024 / Published: 8 February 2024
(This article belongs to the Section Mechanical Engineering)

Abstract

:
The normal operation of spaceborne parabolic cylindrical reflector antennas under various operating conditions relies on maintaining the root mean square (RMS) of the reflector surface’s deformation within reasonable limits. In engineering practice, the designing of reinforced ribs is the primary way to control the RMS of the reflector surface. However, the layout and dimensions of reinforced ribs for many existing designs rely on the experience of the designer and lack a theoretical foundation. This leads to suboptimal layouts and dimensions in many designs, deviating from the optimal design. To address these concerns, this study proposes a comprehensive design approach that combines both topology optimization and parametric analysis. Optimization and parametric analysis were conducted for a large-sized spaceborne composite parabolic cylindrical reflector antenna. The layout and dimensions of the reinforced ribs were reconstructed based on the optimization results and parametric analysis. This study also obtained the influence of the height and thickness of the reinforced ribs on the RMS of the reflector surface. Subsequently, utilizing antenna temperature field simulations as thermal excitation inputs, finite element thermal distortion analyses were conducted for the reflector surfaces without reinforced ribs, with the original reinforced ribs designed based on empirical methods, and with optimized reinforced ribs. In comparison to the original design of the reinforced ribs, the optimized design, without an increase in the volume of the reinforced ribs, reduced the RMS of the reflector surface from 0.6025 mm to 0.5561 mm, resulting in an optimization ratio of 7.7%. Moreover, when compared to the reflector surface without reinforced ribs, the optimized design achieved a 17.9% reduction in RMS.

1. Introduction

Sea surface salinity, as one of the crucial parameters for monitoring climate change on Earth, plays an important role in the global water cycle [1,2]. MICAP (microwave imager combined active and passive) has been chosen as one of the primary Chinese payloads for ocean salinity observations in the future [3]. In order to meet the detection requirements, considering the high gain characteristics of the parabolic cylindrical antenna, MICAP adopted and designed a parabolic cylindrical reflector antenna [1,4,5]. However, the periodic high and low temperatures of the reflector antenna in orbit can cause thermal deformation of the reflector surface, causing it to deviate from the original surface design [6]. These deformations can cause the degradation of antenna electrical performance, influencing detection accuracy [5,7,8]. The root mean square (RMS) of the reflector surface’s deformation has been used to describe the extent of deformation of the antenna reflector surface and serves as a crucial metric to assess whether this affects the antenna’s electrical performance [9]. In engineering, this is a primary way to enhance the stability of antennas and reduce the RMS by designing reinforced ribs for the antennas [10].
In addressing the enhancement of structural stability through the design of reinforced ribs, numerous scholars have conducted extensive research. Research predominantly falls into two categories: ① Investigating the influence on structural stability by selecting different materials and parameters for the reinforced ribs. Li et al. [11] conducted simulations by varying the number and height of reinforced ribs for a reflector antenna. The results revealed two conclusions: increasing the number of reinforced ribs significantly enhanced the rigidity of the reflector surface, with a more pronounced effect when increasing the number of circumferential reinforced ribs. Additionally, increasing the height of the reinforced ribs could improve the fundamental frequency of the antenna structure. Zhou et al. [12] conducted simulation and experimental research on the thermal deformation of a spaceborne honeycomb sandwich construction rigid reflector. Their study found that, with a constant thickness of the adhesive layer, the thermal deformation of the honeycomb played an important role in the honeycomb sandwich structure. Therefore, the stiffness of the honeycomb should be increased to reduce the thermal deformation of the honeycomb sandwich structure. This finding has reference value for reinforced ribs made with honeycomb sandwich structures. ② Designing more efficient reinforced ribs using different approaches. Zhou et al. [13] divided a reflector antenna into several regions, designed reinforced ribs at the boundaries of each region, and then designed reinforced ribs in both circumferential and radial directions, based on the characteristics of the reflector surface. Finally, auxiliary reinforced ribs were placed on the contours of the reflector surface, forming the final layout. The design ultimately improved the overall structural stability, while reducing weight. In contrast to traditional designs that are reliant on designer expertise, topology optimization, by setting response types, response constraints, and optimization objectives, facilitates the calculation of material layouts and appropriate dimensions. This has been widely studied in fields such as structural design [14,15,16]. Liu et al. [17] adopted the minimization of overall structural flexibility as the optimization objective, with the total mass of the primary mirror as the response constraint. Size optimization of the height of reinforced ribs was then performed, ultimately demonstrating the significant effectiveness of the reinforced rib structure in reducing optical surface deviations caused by self-weight and polishing pressure loads. In addressing the primary mirror assembly of large-aperture space telescopes, Qu et al. [18] employed a topology optimization method with multiple objectives to achieve the goal of maximizing structural stiffness, combined with parametric optimization. By designing the layout of reinforced ribs and selecting appropriate size parameters, the root mean square (RMS) value of the mirror surface was ultimately reduced to 3.58 nanometers. Chen et al. [19] reconstructed the layout and thickness of reinforced ribs using topology and size optimization, to minimize the ribs’ weight. Wang et al. [20] established an optimization model by setting the normal acceleration of a specific region as the topology optimization objective. The layout of the ribs was reconstructed, and different optimal layouts were obtained based on different excitation conditions. Niu et al. [21] proposed an integrated approach that combined the topology of damping layers and the layout of stiffeners, achieving the goal of reducing the vibration of thin-walled reinforced structures in dynamic environments.
The above papers are compared with the research in this paper, as shown in Table 1.
To address the issues of thermal deformation during the in-orbit operation of the parabolic cylindrical reflector antenna of MICAP and the lack of a theoretical foundation for the selection of reinforced rib dimensions, this study proposes a comprehensive design approach integrating both topology optimization and parametric analysis. The primary objective of this research was to demonstrate the superiority of the optimized layout and dimensions of the reinforced ribs based on the topology optimization results, and to elucidate the impact of the reinforced ribs’ height and thickness on the root mean square (RMS) of the reflector surface’s deformation displacement.
The remaining sections of this paper are organized as follows: In Section 2, we establish a theoretical model for the temperature field and external heat flux of the antenna in orbit and conduct simulation calculations. The lowest temperature of the antenna under extreme in-orbit conditions is obtained as the thermal excitation input for finite element thermal distortion analyses. Finite element thermal distortion analyses are then conducted on the antenna with the originally designed reinforced ribs based on empirical methods, as well as the antenna without reinforced ribs. In Section 3, the antenna undergoes topology optimization, parametric analysis, model reconstruction, and RMS comparison. Topology optimization’s objective is minimizing the maximum thermal deformation within a designed region, and the response constraint is the volume fraction. Parametric analysis focuses on the height and thickness of reinforced ribs. The layout and dimensions of the reinforced ribs were reconstructed based on the topology optimization and parametric analysis. The influence pattern of the height and thickness on the RMS of the reflector surface was also obtained. After calculating the RMS of the reflector surface with the optimized reinforced ribs, RMS comparisons were made between the reflector surfaces without reinforced ribs, the original design reinforced ribs based on empirical methods, and the optimized reinforced ribs.

2. Finite Element Analysis of the Original Structure

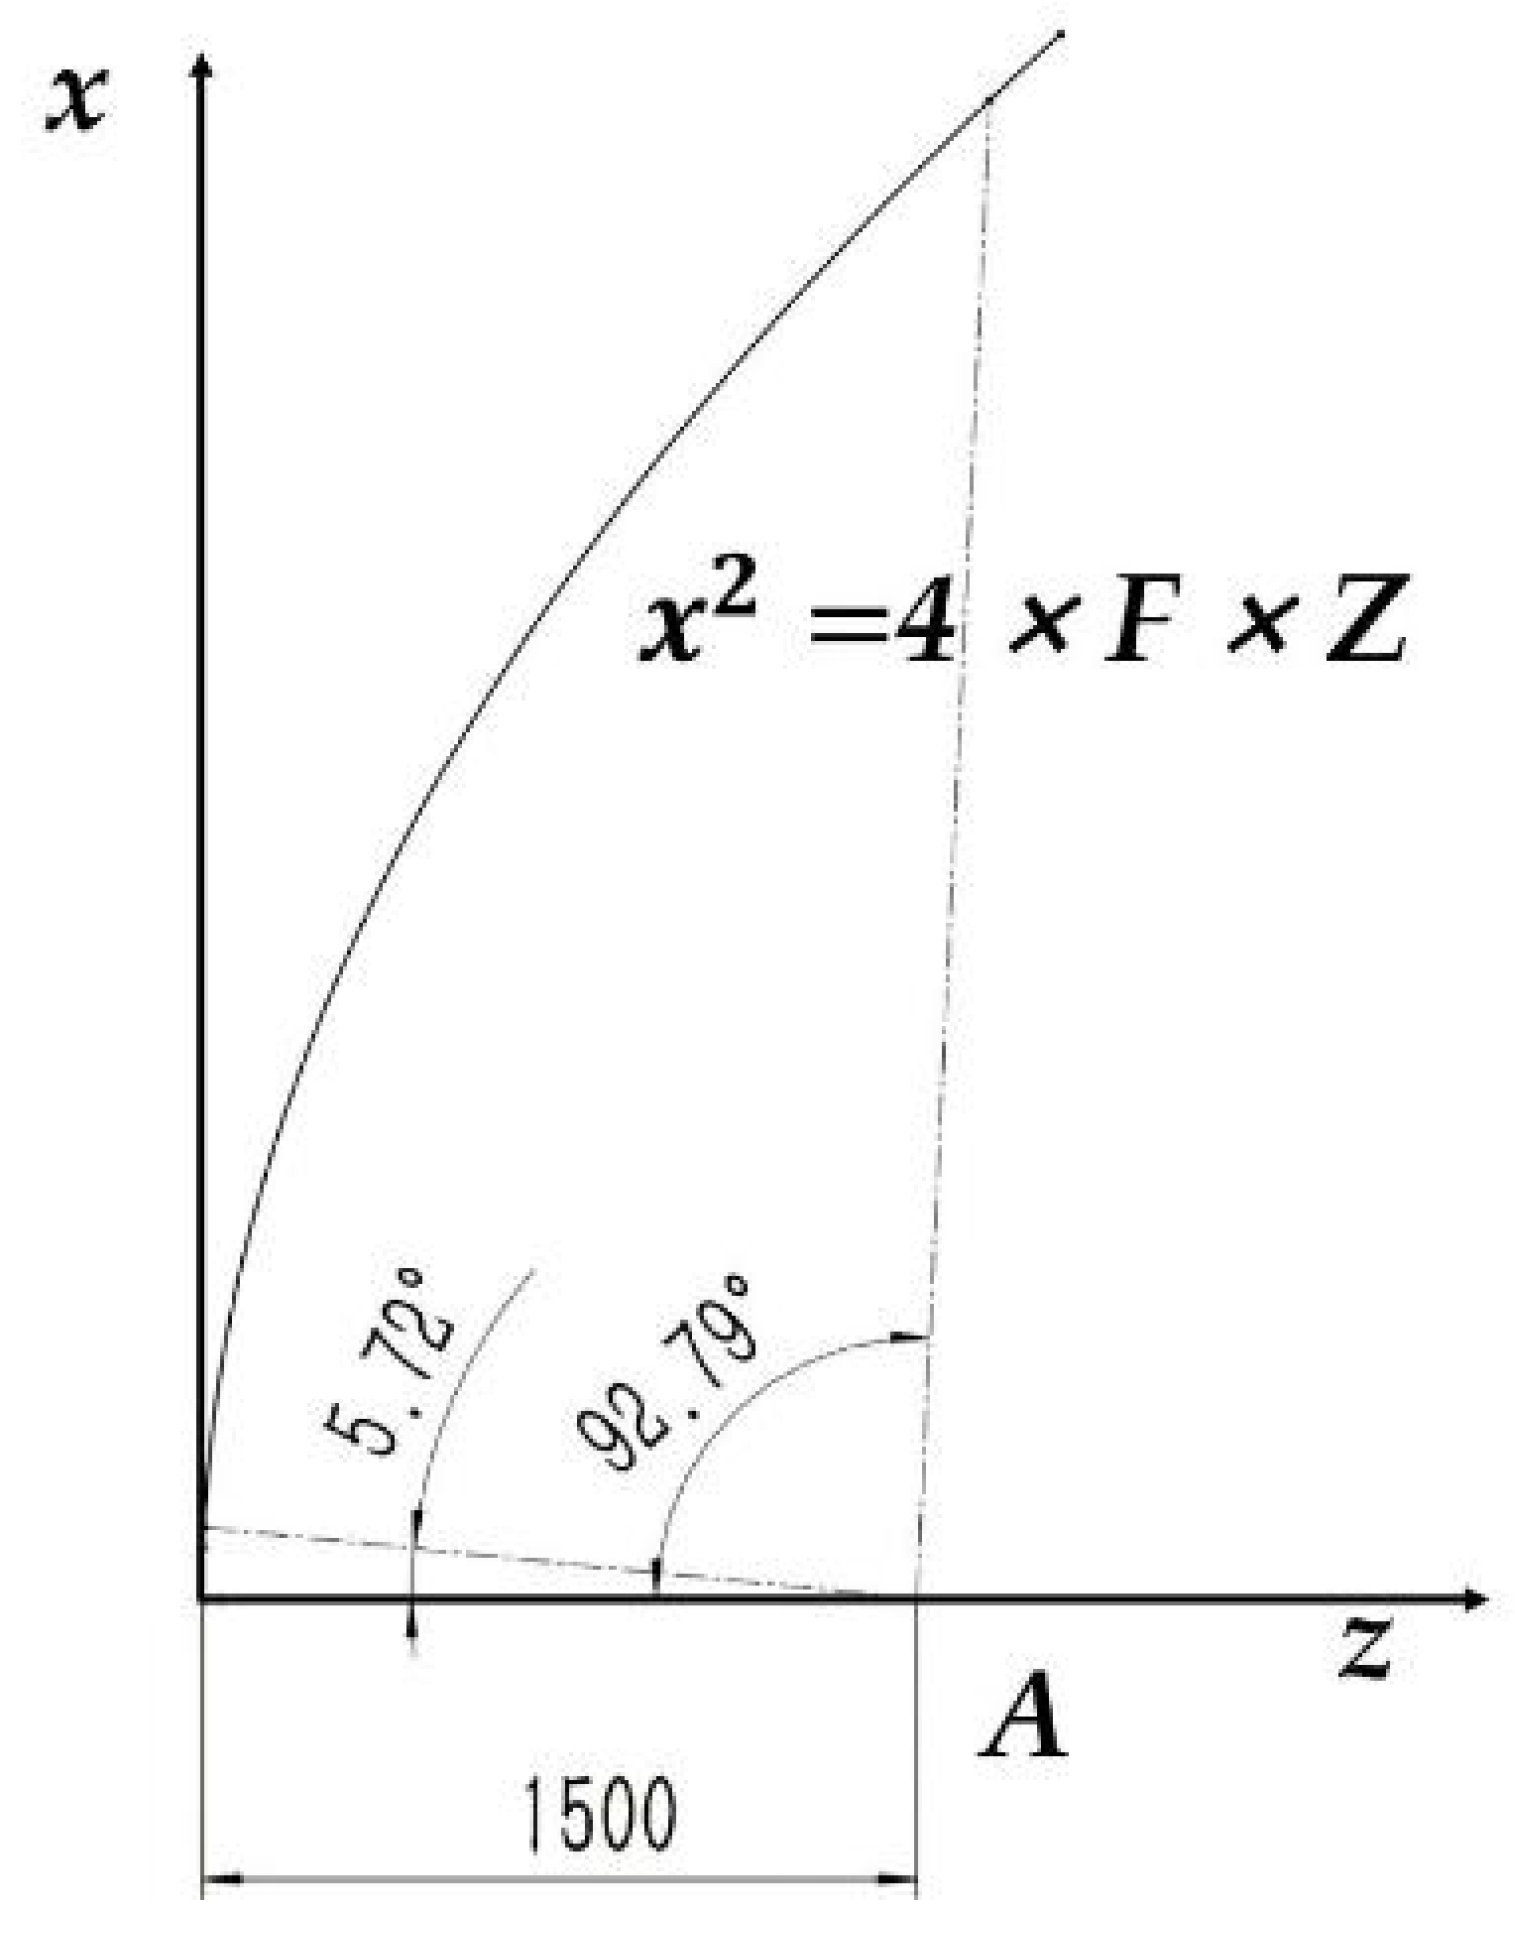
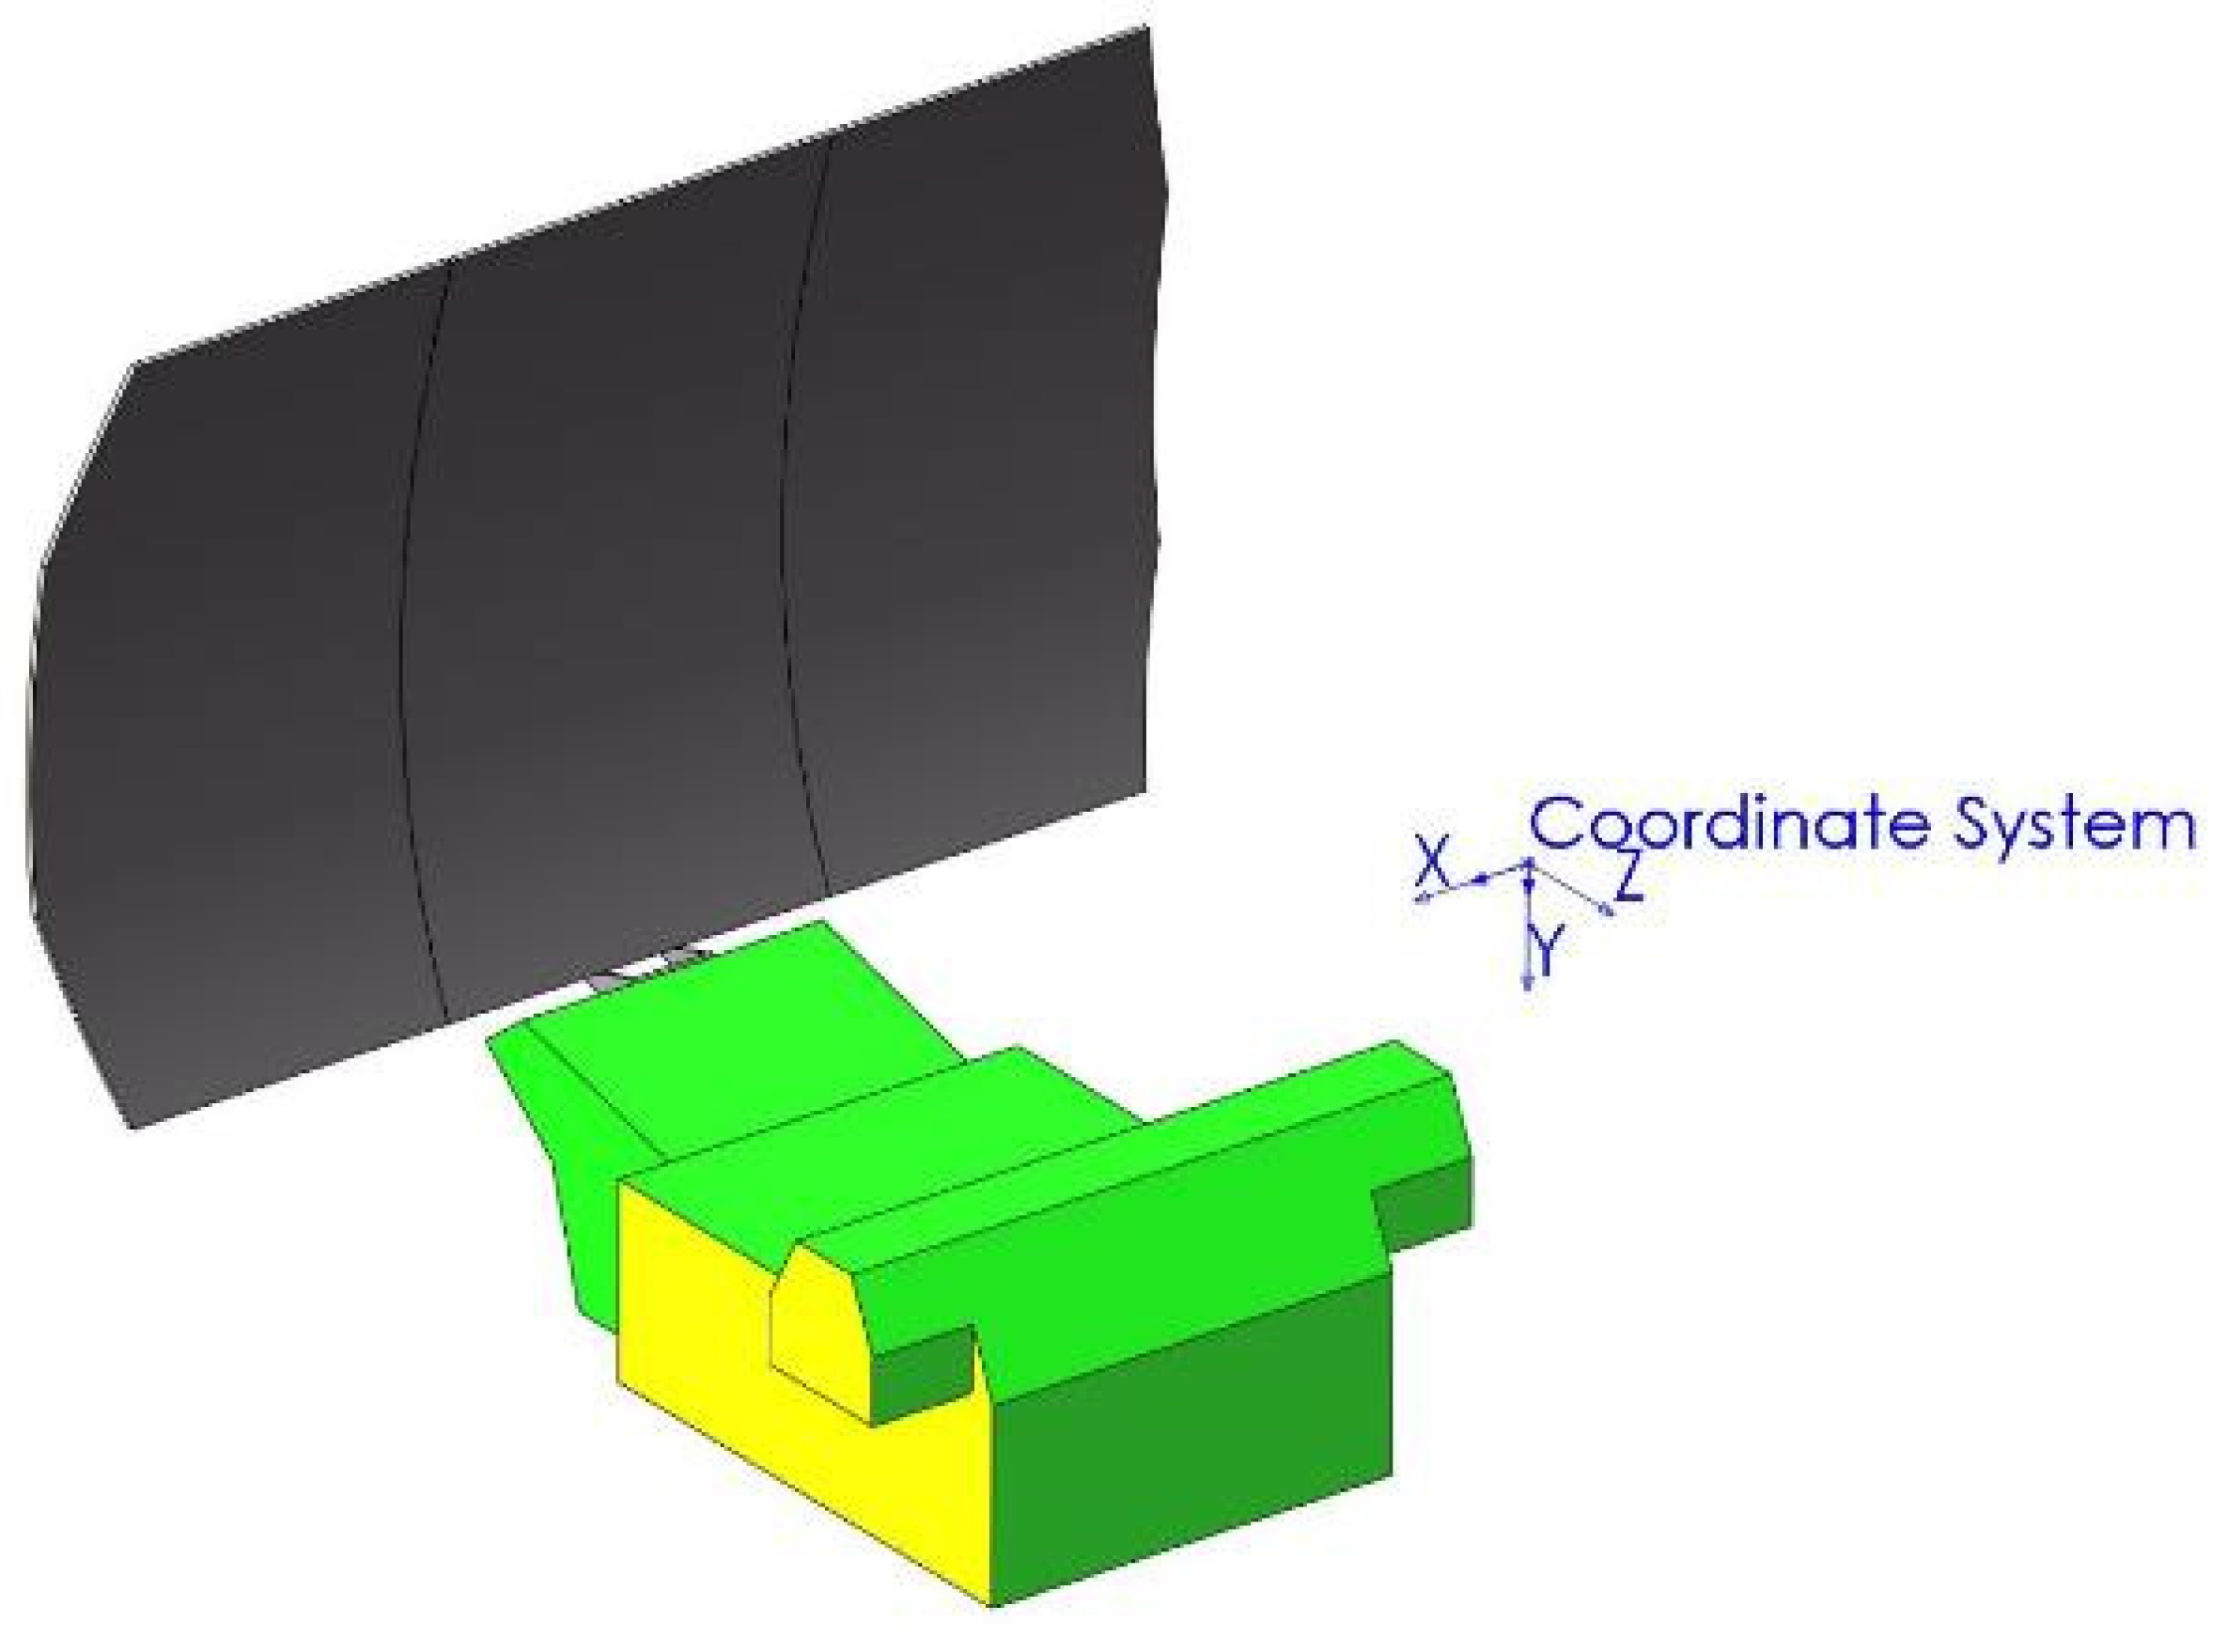
2.1. Introduction of the Reflector Antenna

MICAP is a package of active and passive microwave instruments including an L-band scatterometer and L/C/K band radiometers. The scatterometer and radiometers share the parabolic cylinder reflector antenna with linear array feeds.
The dimensions of the parabolic cylindrical reflector antenna’s generatrix were designed as illustrated in Figure 1.
As shown in Figure 1, the equation of the parabola is x 2 = 4 × F × Z , where the focal distance F equals 1500 mm. Then, selecting two lines that are 5.72 degrees and 92.79 degrees from the z-axis, respectively, and that intersect with the parabola, the parabola between the two intersection points is the generatrix of the parabolic cylindrical reflector surfaces.
A structural concept diagram of the parabolic cylindrical antenna is shown in Figure 2. The overall structure consists of three reflector surfaces, two sets of side hinge mechanisms, one set of root hinge mechanisms, and one set of feed source compartment structures. The overall connection relationship is as follows: the left and right reflector surfaces are connected to the central reflector surface through the side hinge mechanisms, and the central reflector surface is connected to the feed source compartment through the root hinge mechanism.
The size of a single reflector surface is 1.91 × 3.5 m, and the final overall size after deployment in orbit is 5.6 × 3.5 m. Through preliminary analysis, it was determined that due to the larger size of the antenna reflector surface, its influence on RMS would be significantly higher than the feed source compartment. Therefore, the subsequent finite element analysis, topology optimization, parametric analysis, and RMS calculations only focus on the antenna reflector surface.

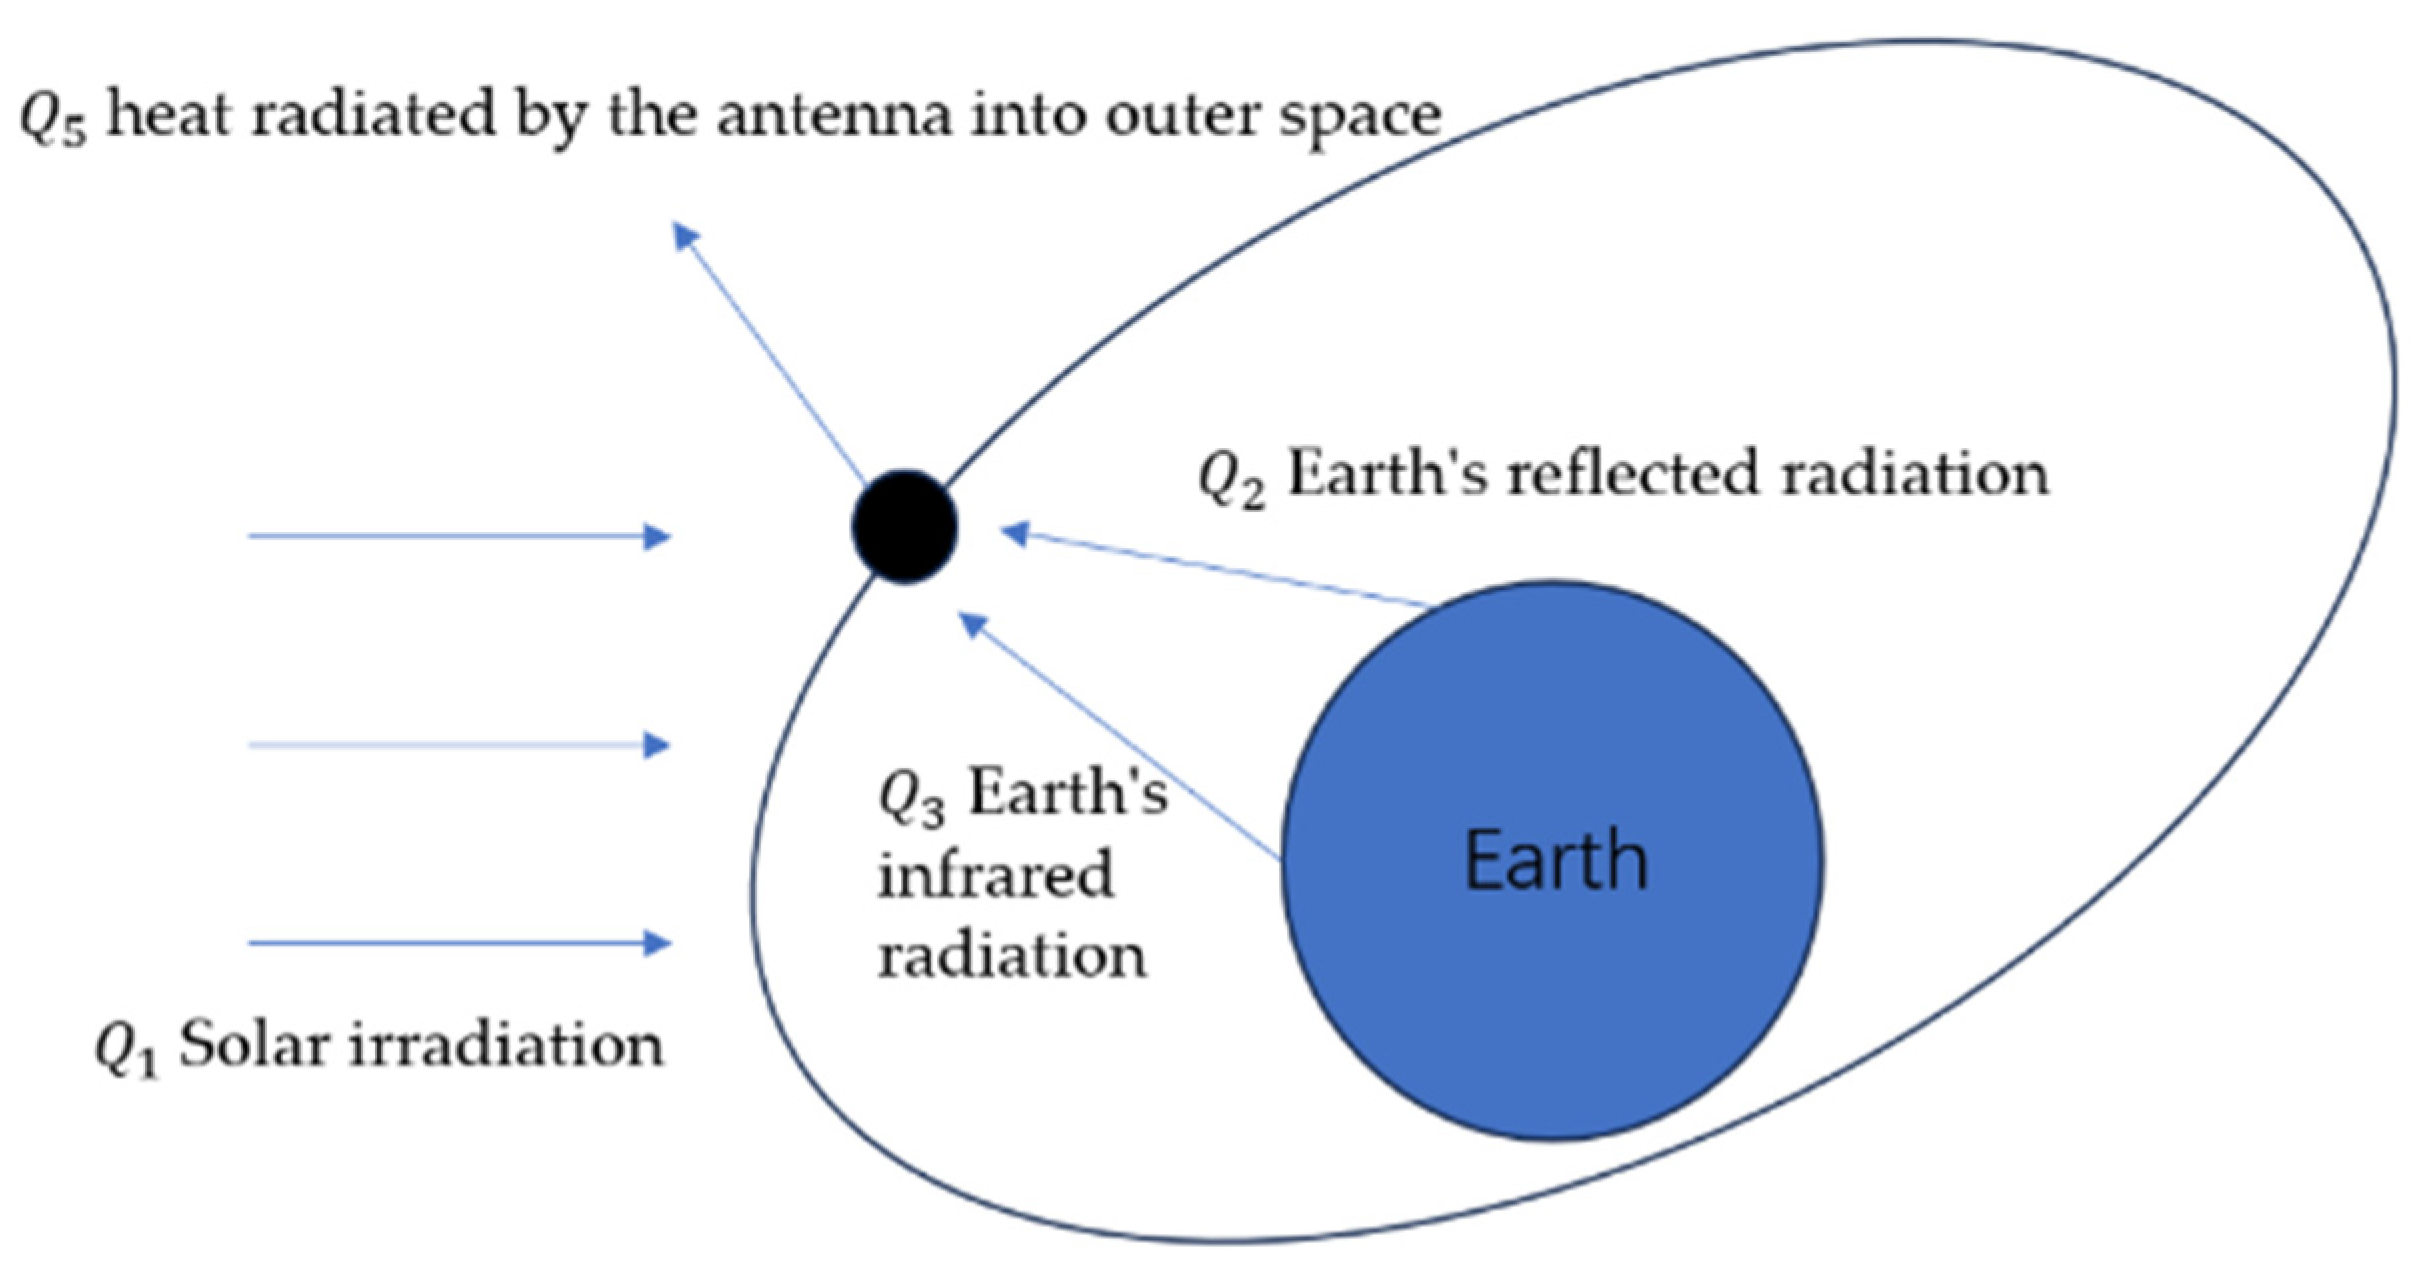
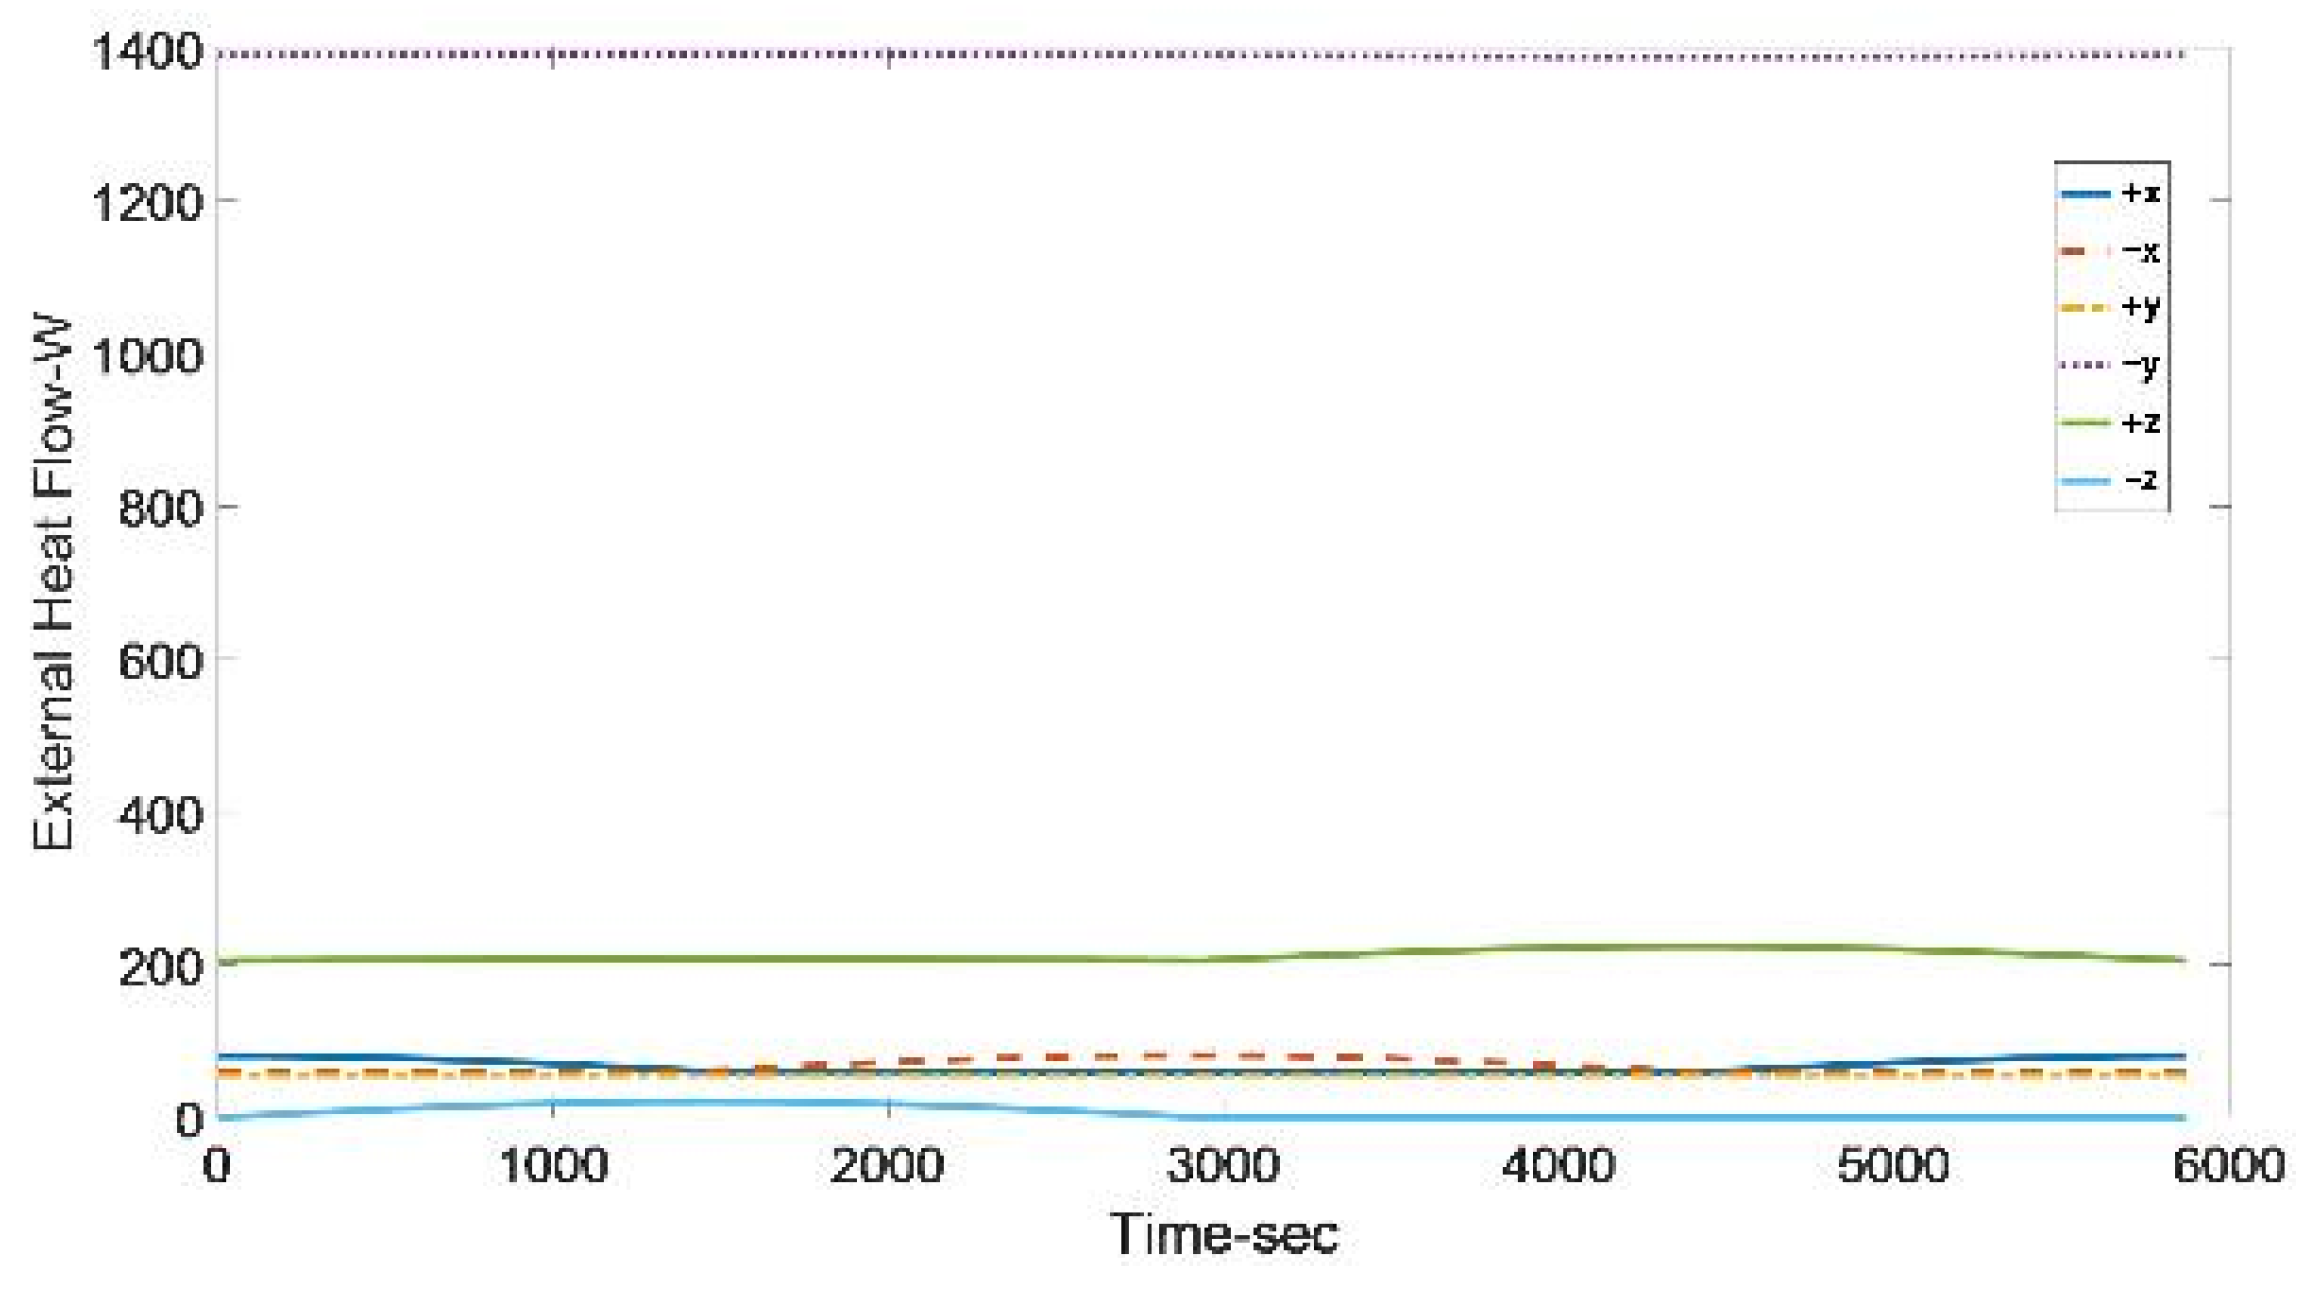
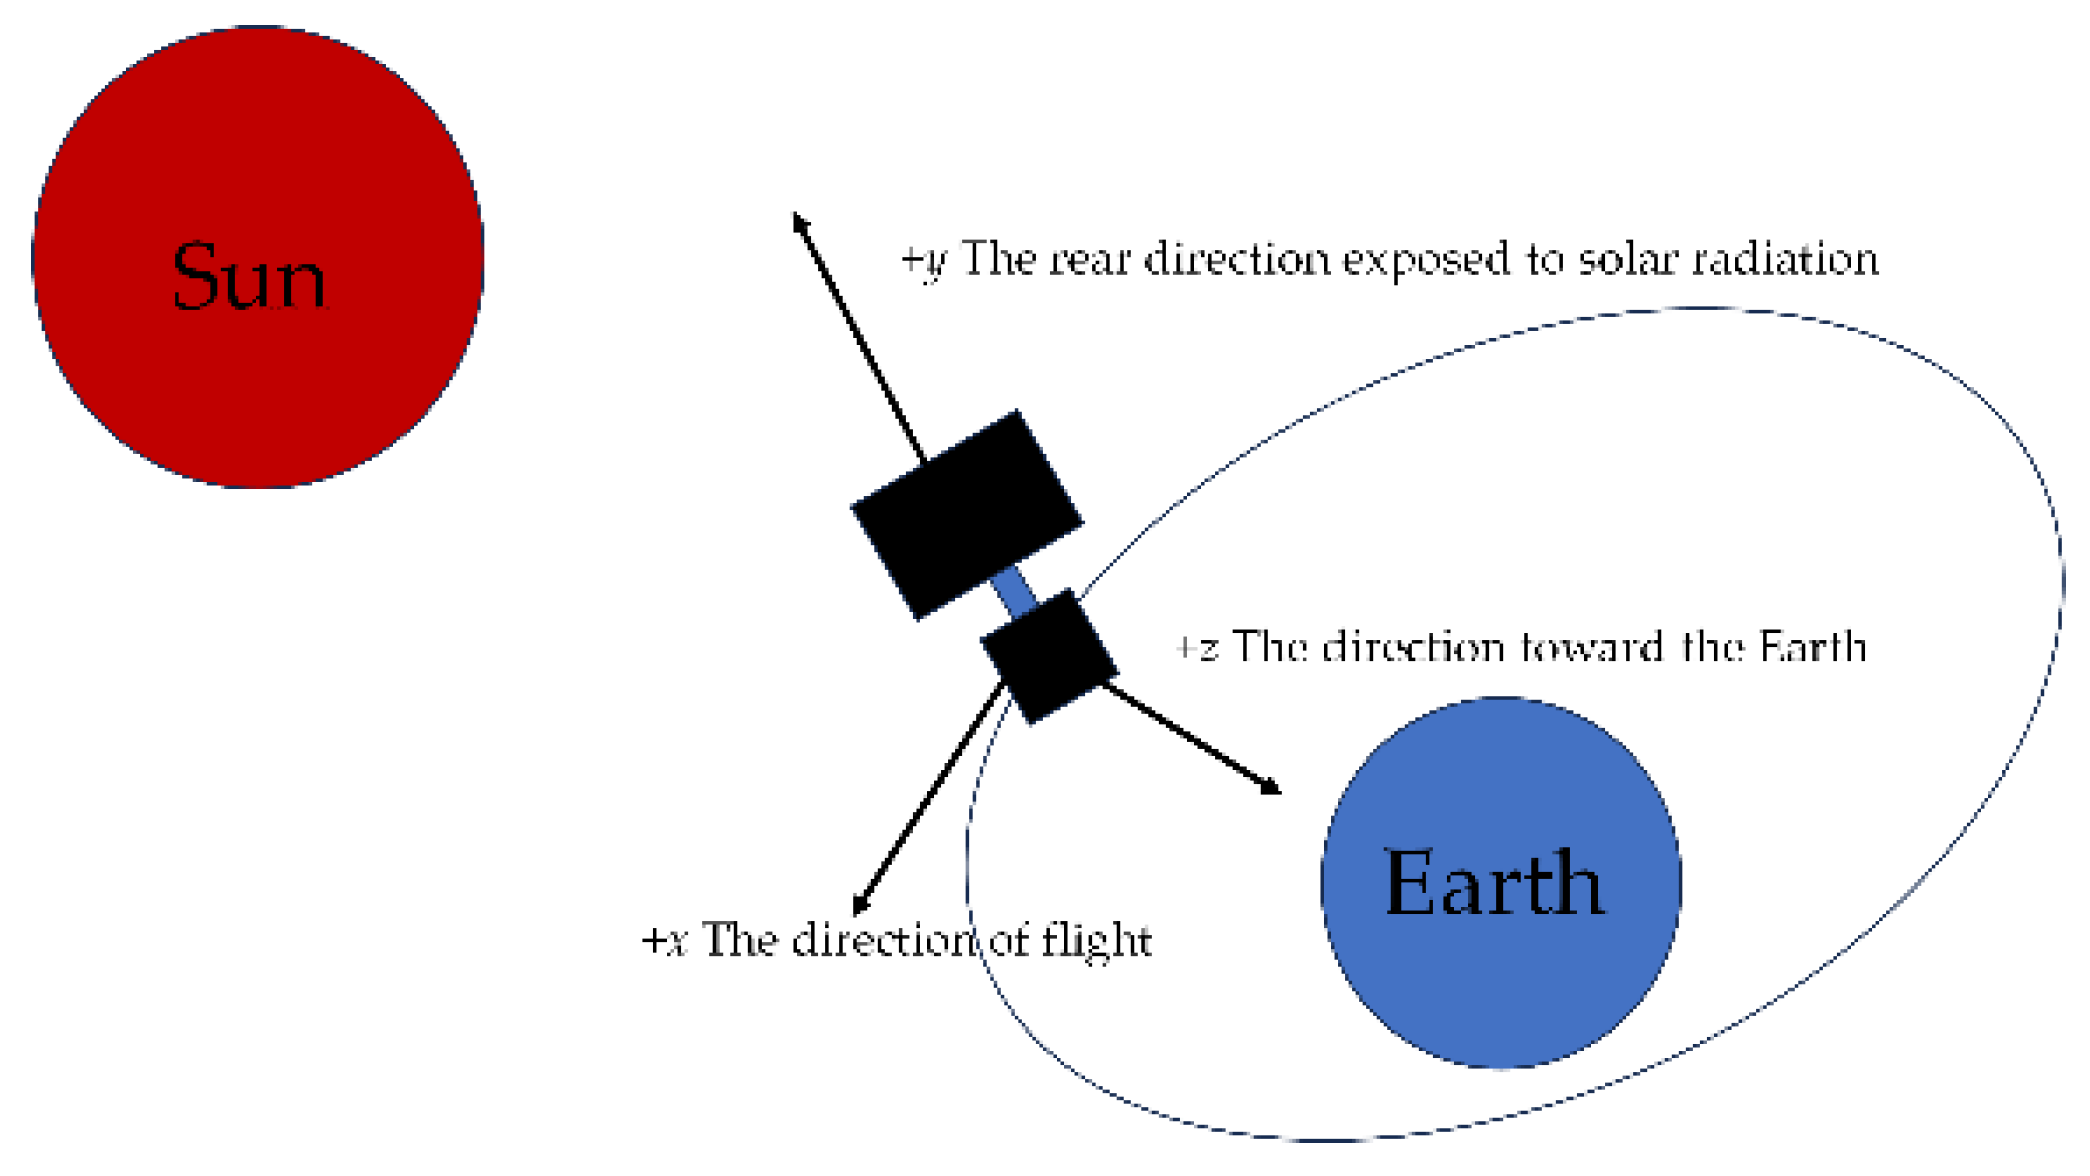
2.2. Theoretical Model and Simulations of Temperature Field and External Heat Flow in Orbit

The main types of heat transfer for the antenna during in-orbit operation are thermal radiation and heat conduction, and the equations for thermal radiation and heat conduction are as follows:
Q r a d = ε A σ 0 T 4
q x = k T x
where Q r a d represents the radiation heat of the antenna. ε is the emissivity of the antenna, whose value is less than 1. A represents the surface area of the antenna, measured in square meters. σ 0 is the Stefan–Boltzmann constant, its value equals 5.67 × 10 8   W / ( m 2 · K 4 ) . T denotes the absolute temperature of the blackbody, measured in Kelvin.
When calculating the heat flux density, it needs to specify the direction of temperature change. Equation (2) takes the x-direction as an example. q x represents the heat flux density in the x-direction, measured in W/ m 2 . k is the thermal conductivity, measured in W/m·K. T x represents the temperature gradient in the x-direction, with units in K/m.
The thermal equilibrium relationship during the in-orbit operation of the antenna can be expressed as
Q 1 + Q 2 + Q 3 + Q 4 = Q 5 + Q 6
where Q 1 is the heat absorbed by the antenna from solar irradiation. Q 2 is the heat absorbed by the antenna from Earth’s reflected radiation. Q 3 is the heat absorbed by the antenna from Earth’s infrared radiation. Q 4 is the heat generated by the antenna during in-orbit operation. Q 5 is the heat radiated by the antenna into outer space. Q 6 is the change in internal energy of the antenna. The thermal equilibrium of the satellite in orbit is shown in Figure 3.
Equation (3) considers the satellite as a whole, representing the overall thermal equilibrium relationship. When this is discretized, there are temperature differences between different nodes, which lead to heat conduction and thermal radiation between nodes. The equation of the thermal balance for discretized nodes can be obtained as in [22]:
m j c j d T j d t = Q e x t e r n a l _ j + q j + k = 1 N E k j T k T j + k = 1 N G k j T k 4 T j 4
where subscripts j and k represent grid nodes, m is mass, c is the heat capacity of the antenna material, T is temperature, and t is time. Q e x t e r n a l is the rate of external heat flux. q is the power of the internal heat source in the antenna. E k j and G k j represent the linear heat transfer coefficient and radiation coefficient between node j and node k .
Therefore, the left side of the equation represents the rate of change in internal energy for node j of the antenna. On the right side of the equation, Q e x t e r n a l _ j is the rate of external heat flux heating at node j , and q j is the self-generated heating power of the antenna at node j . k = 1 N E k j T k T j represents the sum of all heat conduction rates flowing into node j , while k = 1 N G k j T k 4 T j 4 denotes the sum of all radiation heat transfer rates flowing into node j .
In this study, Equation (4) is considered a periodic transient equation, which means that the external heat flux is a periodic variable over cycles. This is defined as follows:
Q e x t e r n a l _ j ( t + τ 0 ) = Q e x t e r n a l _ j ( t )
The magnitude of external heat flux, such as solar radiation, depends on the angle between the sun and the satellite’s orbital plane. φ S , serving as an indicator describing the sun’s position, is obtained through calculations based on the date used to determine the sun’s location:
φ S = D a t e D a t e 0 365.25 × 360
s i n   β = c o s i · s i n   I · s i n   φ S + s i n   i · s i n   Ω · c o s   φ S s i n   i · c o s   I · c o s   Ω · s i n   φ S
Equation (6) [22] describes the solar position using the ecliptic longitude φ S , where D a t e represents the calculation date, and D a t e 0 represents the vernal equinox date. In Equation (7) [22], β represents the angle between the sun and the orbital plane, I represent the inclination of the celestial body’s orbit relative to the ecliptic. Ω represents the right ascension of the ascending node of the sun, and i represents the orbital inclination.
β servs as a primary determinant of the illumination conditions for different surfaces of the satellite. Based on the satellite’s orbital parameters, a simulation was performed of the external heat flux reaching the satellite from various directions when considering the maximum and minimum values of the beta angle, which are shown in Figure 4 and Figure 5.
As shown in Figure 6, +x represents the direction of the antenna’s in-orbit flight, +z is the direction toward the Earth, and +y is the rear direction exposed to solar radiation.
The external heat flow in Figure 4 and Figure 5 is the sum of solar irradiation, Earth’s reflected radiation, and Earth’s infrared radiation. Because the −y surface is the sun-illuminated surface, the magnitude of the external heat flux reaching the −y surface should be the greatest among the six directions. This is confirmed in both Figure 4 and Figure 5.
As for the measurement points, based on the previous simulations, extreme temperatures will occur at the upper ends of the three reflector surfaces, and nine temperature measurement points were set, as shown in Figure 7a and corresponding to a discrete grid, as illustrated in the Figure 7b:
Based on the external heat flux data in orbit, the temperature variation over time for temperature measurement points on the antenna reflector surface under extreme low-temperature conditions could be obtained, as shown in Figure 8.
Figure 8 shows the temperature variation of the temperature measurement points over time. As shown in Figure 8, the temperature variation of the measuring points over time followed a regular pattern. This aligns with our assumption of the external heat flux being a periodic function. It can be observed that during the in-orbit operation of the antenna, the lowest temperature under extreme low-temperature conditions is −113.65 °C.

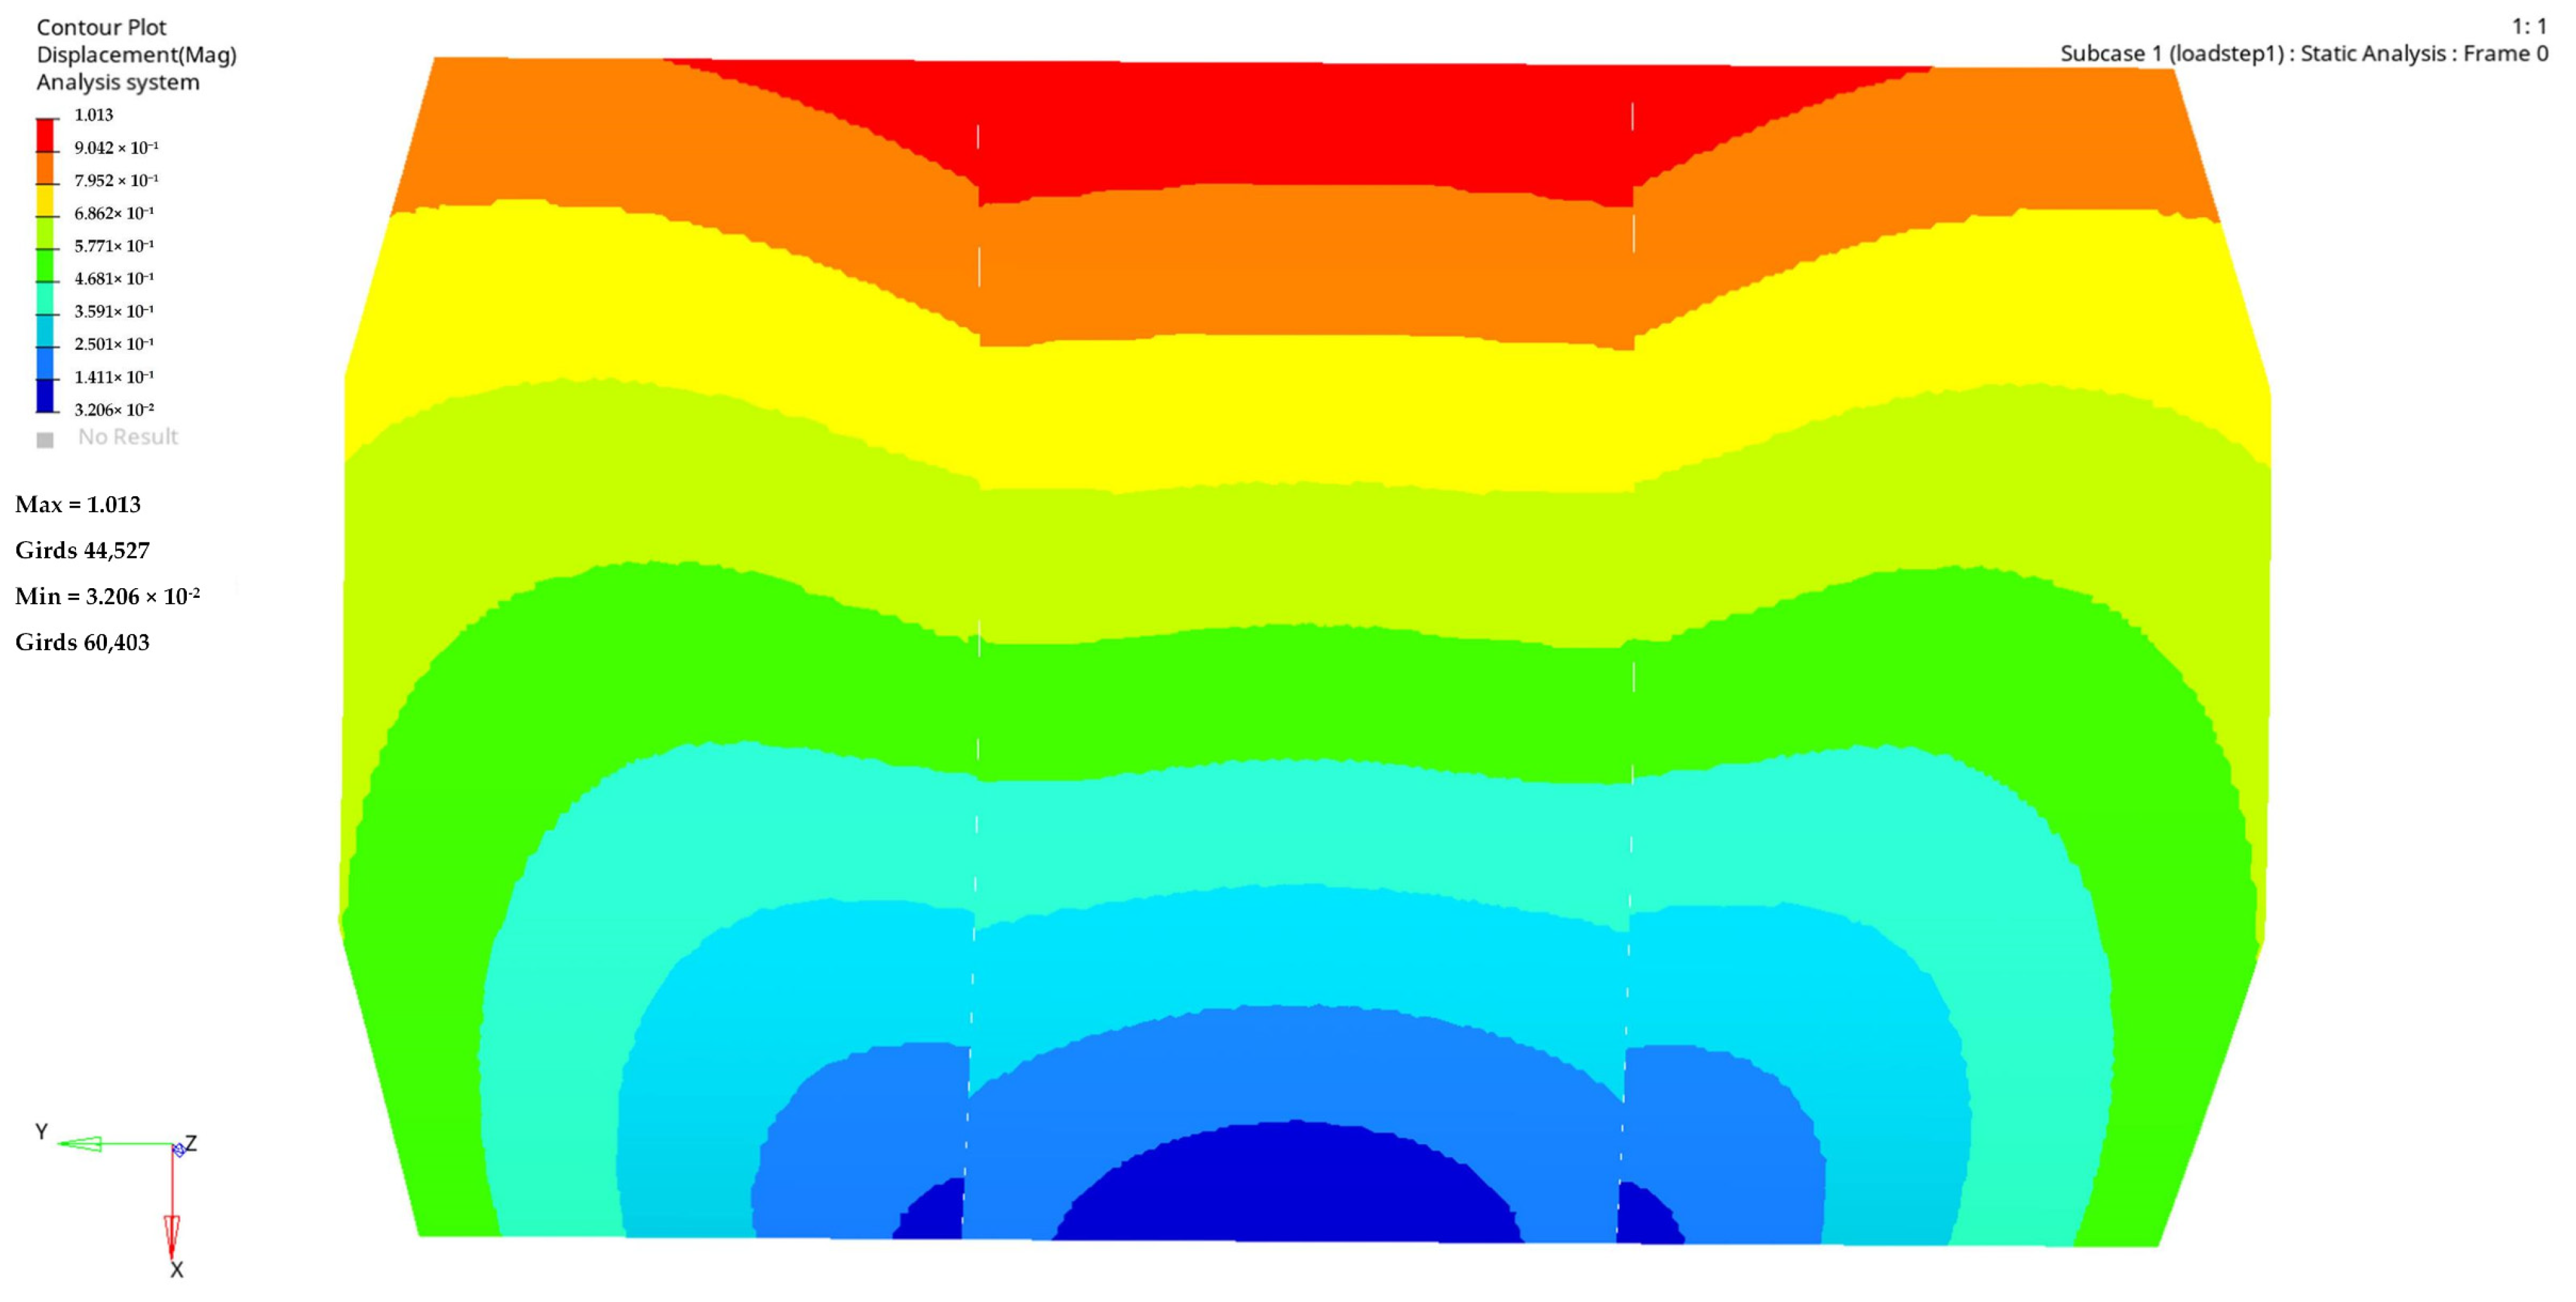
2.3. Finite Element Thermal Analysis of the Original Structure

This model is subject to three constraint conditions: the connection between the left and right reflector surfaces and the central reflector surface through the side hinge mechanisms, and the bolt fixation between the base and the feed source compartment. The central position of the side hinge mechanism is located at the midpoint of the x-axis projection of the reflector surfaces, with lengths extending 100 mm along both the +x and −x directions. Therefore, RBE2 was used to equivalent the side hinge mechanisms and the bolt fixation. Fixed constraints conditions were set at the center of the bolts. Shell elements were used to model the reflector surfaces and the original reinforced ribs, as illustrated in Figure 9 and Figure 10.
The equation for thermal expansion of the antenna in orbit is as follows:
V = V 0 × α × T
where V is the volume increase due to thermal expansion. V 0 is the original volume of the antenna. α is the volume expansion coefficient with units of ° C 1 . T represents the change in temperature.
The reflector and base of the antenna both adopt a honeycomb sandwich panel structure. The core of the honeycomb sandwich panel is made of aluminum honeycomb. The skin is symmetrically layered with 4 layers of M40JB/cyanate ester carbon fiber, with a single layer thickness of 0.1 mm. To ensure polarization of electrical performance, the surface layer has a layering pattern of −45°/90°/45°/0°. The specific parameters are detailed in Table 2, and a sample of the honeycomb sandwich structure is shown as Figure 11:
Based on the simulation calculations in Section 2.2, it was determined that during the in-orbit operation of the antenna, the lowest temperature experienced would be −113.65 °C. Therefore, applying a temperature excitation of −113.65 °C to the reflector surfaces with the original reinforced ribs layout (height of 80 mm, thickness of 20 mm) and the surfaces without reinforced ribs, a deformation contour map of the reflector was obtained, as shown in Figure 12 and Figure 13.
From Figure 12, it can be observed that the deformations were relatively small near the fixed constraints. As the distance from the constraint points increased, the deformations gradually became larger. The maximum deformation occurred at the upper end of the central reflector plate, with a maximum deformation value of 1.013 mm.
Compared to the reflector surface with reinforced ribs in Figure 12, the deformation trend of the reflector surface without reinforced ribs shows differences. For the left reflector surface, the lower-left corner region experienced a larger deformation compared to the upper-left corner region. Similarly, for the right reflector surface, the lower-right corner region exhibited a larger deformation compared to the upper-right corner region. This trend differed from that observed in Figure 12. The maximum deformation still occurred at the upper end of the central reflector surface, with a maximum deformation value of 1.247 mm.
In the in-orbit operation of the parabolic reflector antenna, the antenna surface undergoes deformation under various loads, resulting in displacements at each node on the reflector surface. This leads to deviation of the reflector surface from the smooth curvature envisioned during theoretical design, as illustrated in Figure 14. Root mean square (RMS), as a parameter describing the actual extent of reflector deformation, is one of the crucial indicators influencing the antenna’s electrical performance. Its definition is as follows:
R M S = 1 N n = 1 N r n 2
where r n represents the displacement value of the respective nodes under the corresponding conditions.
r n = ( x n x n ) 2 + ( y n y n ) 2 + ( z n z n ) 2
Extracting node information from the models of Figure 12 and Figure 13, the RMS of the antenna reflector surface was calculated using Equation (9). The RMS under the original reinforced rib layout was determined to be 0.6025 mm, while the RMS in the absence of reinforced ribs was 0.6774 mm. The optimization ratio of the RMS of the antenna surface for the original reinforced layout compared to the antenna without reinforced ribs was 11.1%.

3. Topology Optimization and Parametric Analysis

3.1. Topology Optimization Mathematical Model

This study employs the solid isotropic material with penalization (SIMP) model for topology optimization calculations. In this approach, the ‘element density’ of each element in the designed region of the finite element model serves as the design variable. The element density takes continuous values between 0 and 1. After the optimization process, an element density value of 1 or close to 1 indicates that the material at that element’s position is crucial and should be retained in the design. Conversely, an element density value of 0 or close to 0 signifies that the material at that element’s position is not essential and can be removed, thus achieving efficient material utilization. The selection of the SIMP method involves choosing porous materials during the original material selection, with a theoretical model as follows:
E i = 1 ρ i P E m i n + ( ρ i ) P E 0
where E i is the interpolated elastic modulus, ρ i is the relative density value of the element (a numerical value between 0 and 1, where 0 represents a void at that element, and 1 represents the presence of material at that element), E m i n is the elastic modulus of the porous portion, P denotes the penalty factor, and E 0 is the elastic modulus of the solid portion.
This study chose the maximum thermal deformation in each iteration as the optimization objective, aiming for displacement minimization. The specific mathematical model is as follows:
ρ = [ ρ 1 , ρ 2 , ρ 3 , , ρ n ] T
O b j e c t i v e = m i n m a x ( f ρ )
f ρ = ( D i s p 1 ρ 1 r 1 , D i s p 2 ρ 2 r 2 , D i s p 3 ρ 3 r 3 , , D i s p n ρ n r n )
D i s p n = ( x n x n ) 2 + ( y n y n ) 2 + ( z n z n ) 2
s . t .   i = 1 n ρ i V i V 0 V f r a c t i o n               0 ρ i 1
where Equation (12) is the optimization objective equation, aiming at minimizing the displacement of the maximum thermal deformation within the design area in each iteration calculation. Equation (13) is the objective function, which is the absolute value of the displacement of all nodes within the optimization target area. r n is the reference value for the response, determined based on the response type. Regarding this setting, r n equals 1, which means f ρ is the displacements of all nodes on the reflector surface. Equation (14) represents the absolute value of the displacement for the nth node. In Equation (15), V f r a c t i o n is the volume fraction of the region requiring the design of reinforced ribs relative to the original reflector surface volume. Upper or lower limits can be independently set, and for this optimization, an upper limit of 0.3 was imposed.
Topology optimization calculations can be performed using finite element method software. Many commercial software packages such as Hypermesh, Ansys, Creo, etc., can perform optimization calculations based on mathematical models and settings, achieving topology optimization objectives and enabling further parametric analysis. This study chose Hypermesh and Optistruct to carry out the optimization calculations.

3.2. Topology Optimization Settings

  • Design variable: Unit density of all the nodes on the three reflector surfaces;
  • Establish responses: The total displacement of all the nodes on the reflector surfaces, the volume fraction of the reinforced ribs relative to the volume of the reflector surfaces;
  • Basic and total thickness: The basic thickness equals 20 mm, which is the thickness of the reflector surface, the total thickness equals to 40 mm. The difference between the total and basic thickness is the height of the reinforced ribs;
  • Response constraint and boundary constraint condition: Upper value was 0.3 for the volume fraction, the centers of the two bolts were set as fixed constraints;
  • Objective: The maximum thermal deformation among design variables, which means the maximum value of the total displacement of the nodes;
  • Minimum and maximum member sizes: The minimum member size refers to the allowable minimum scale in regions with a unit density of 1 in the optimization results. The minimum member size must be greater than two times the average size of the elements. The maximum member size constraint indicates that the dimensions in all directions in regions with a unit density of 1 in the optimization results cannot all exceed this size. The maximum member size must be greater than twice the minimum member size. For this setting, the minimum member size equaled 40 mm and the maximum member size equaled 80 mm.

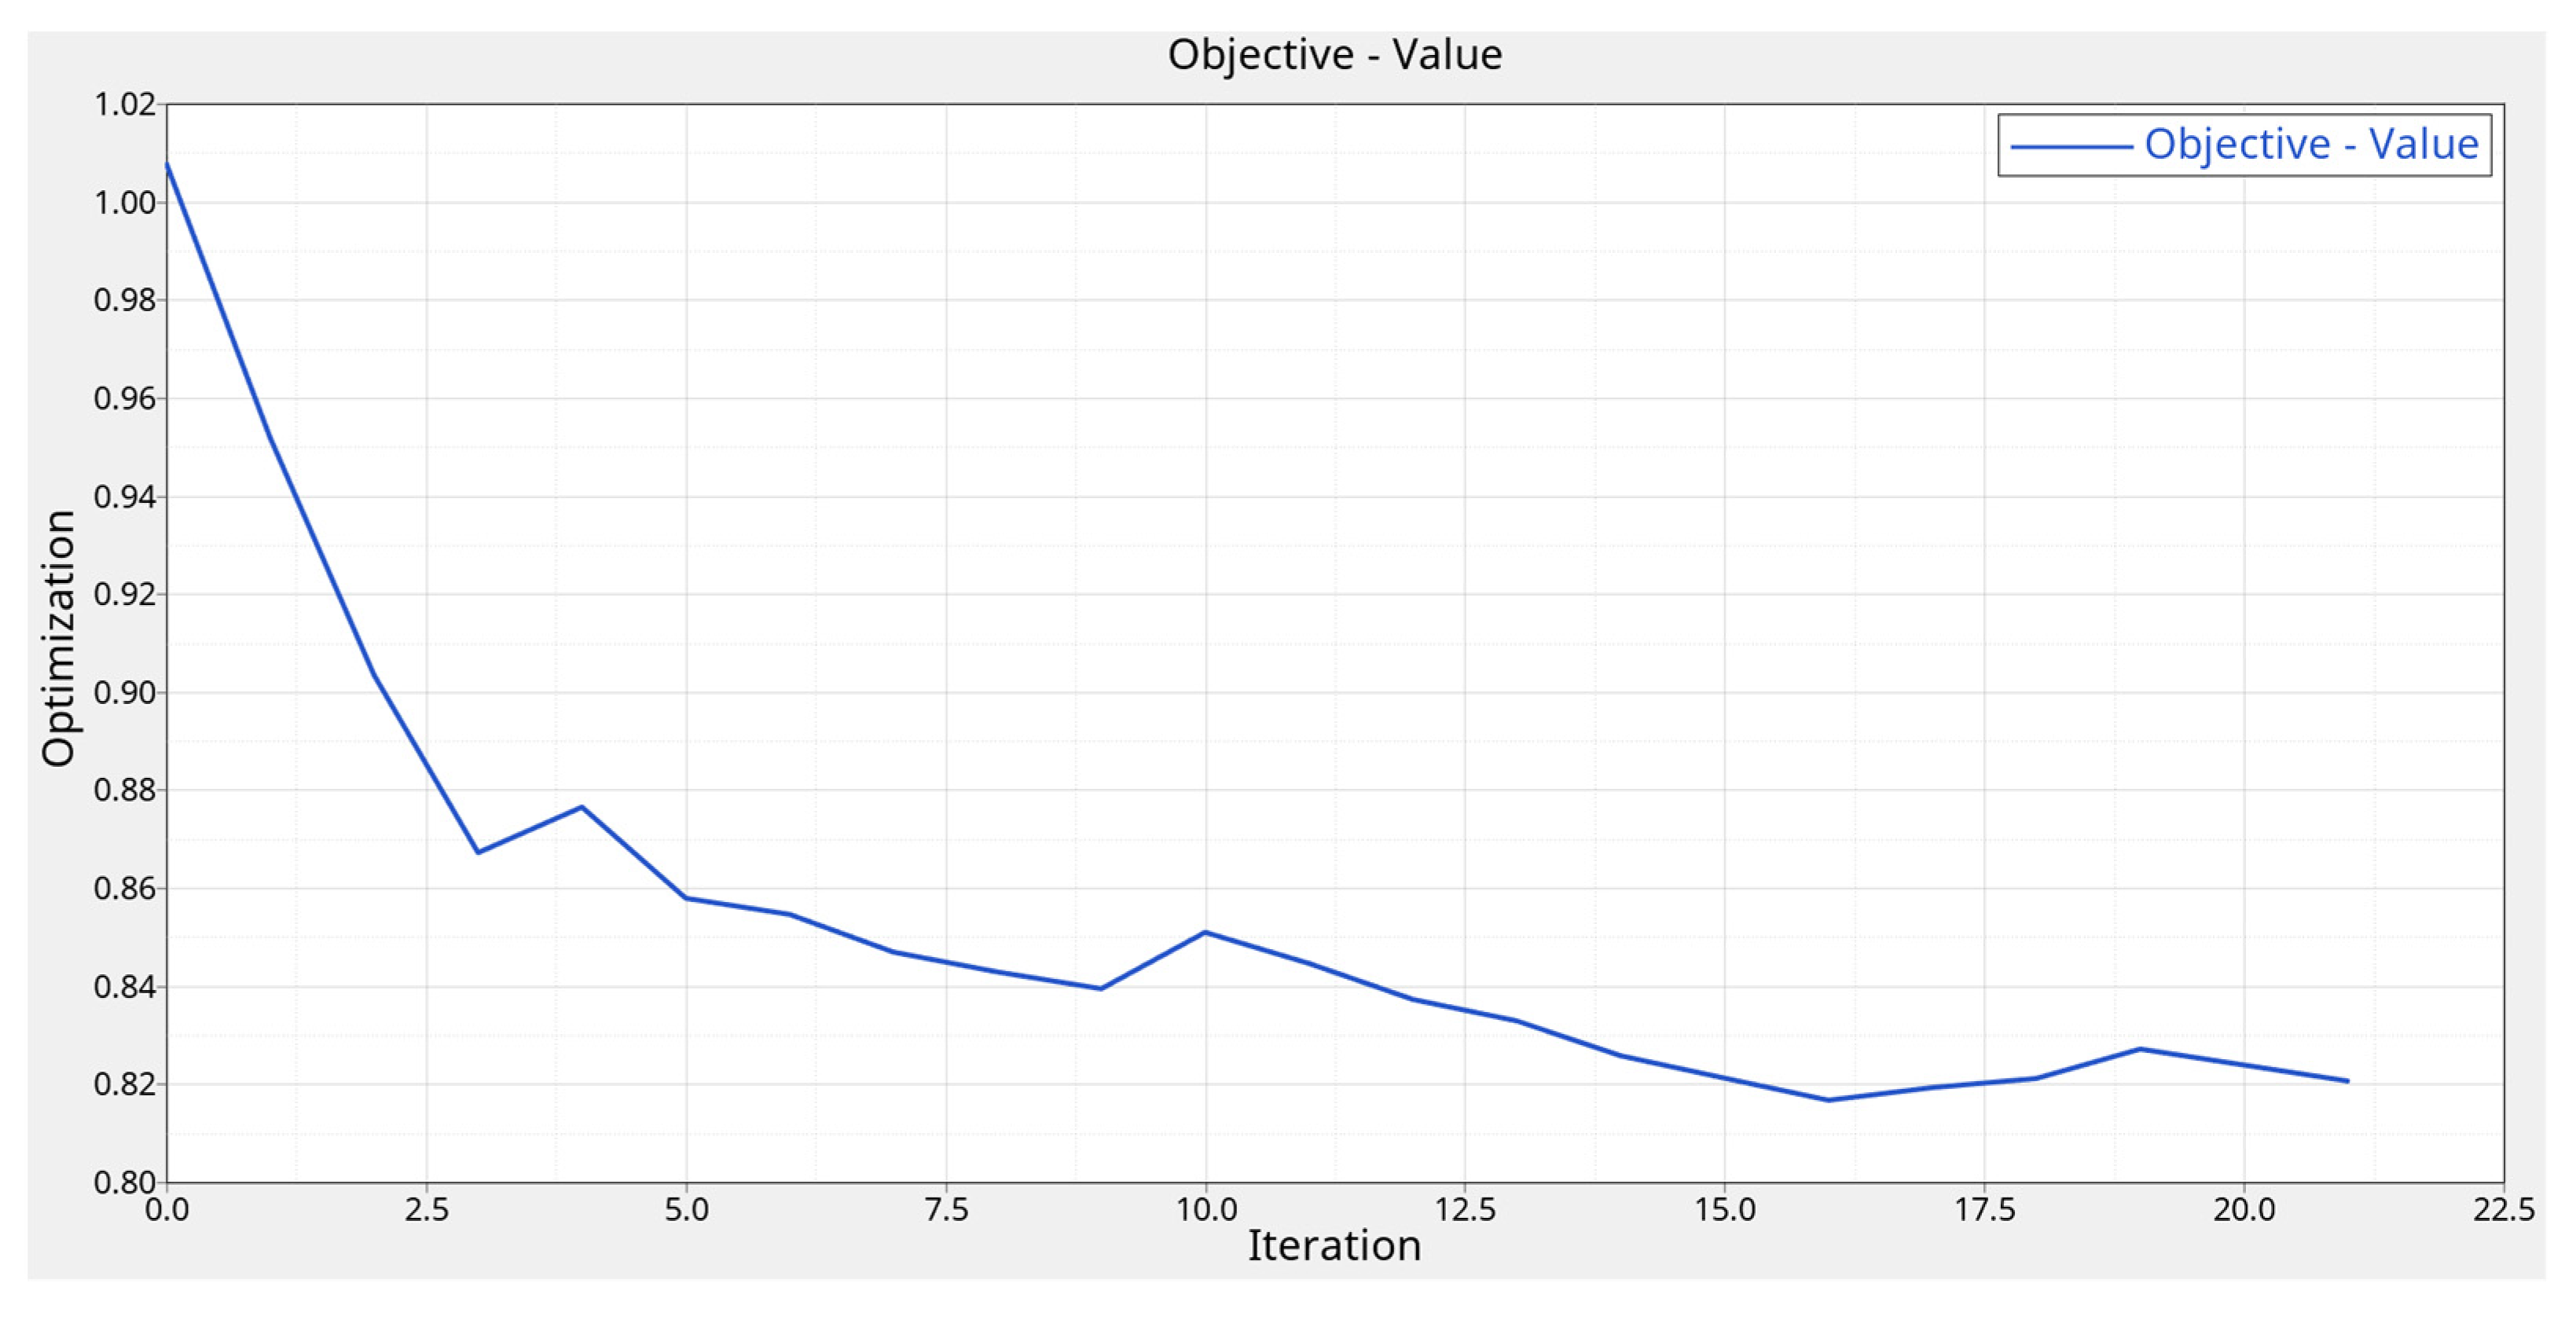
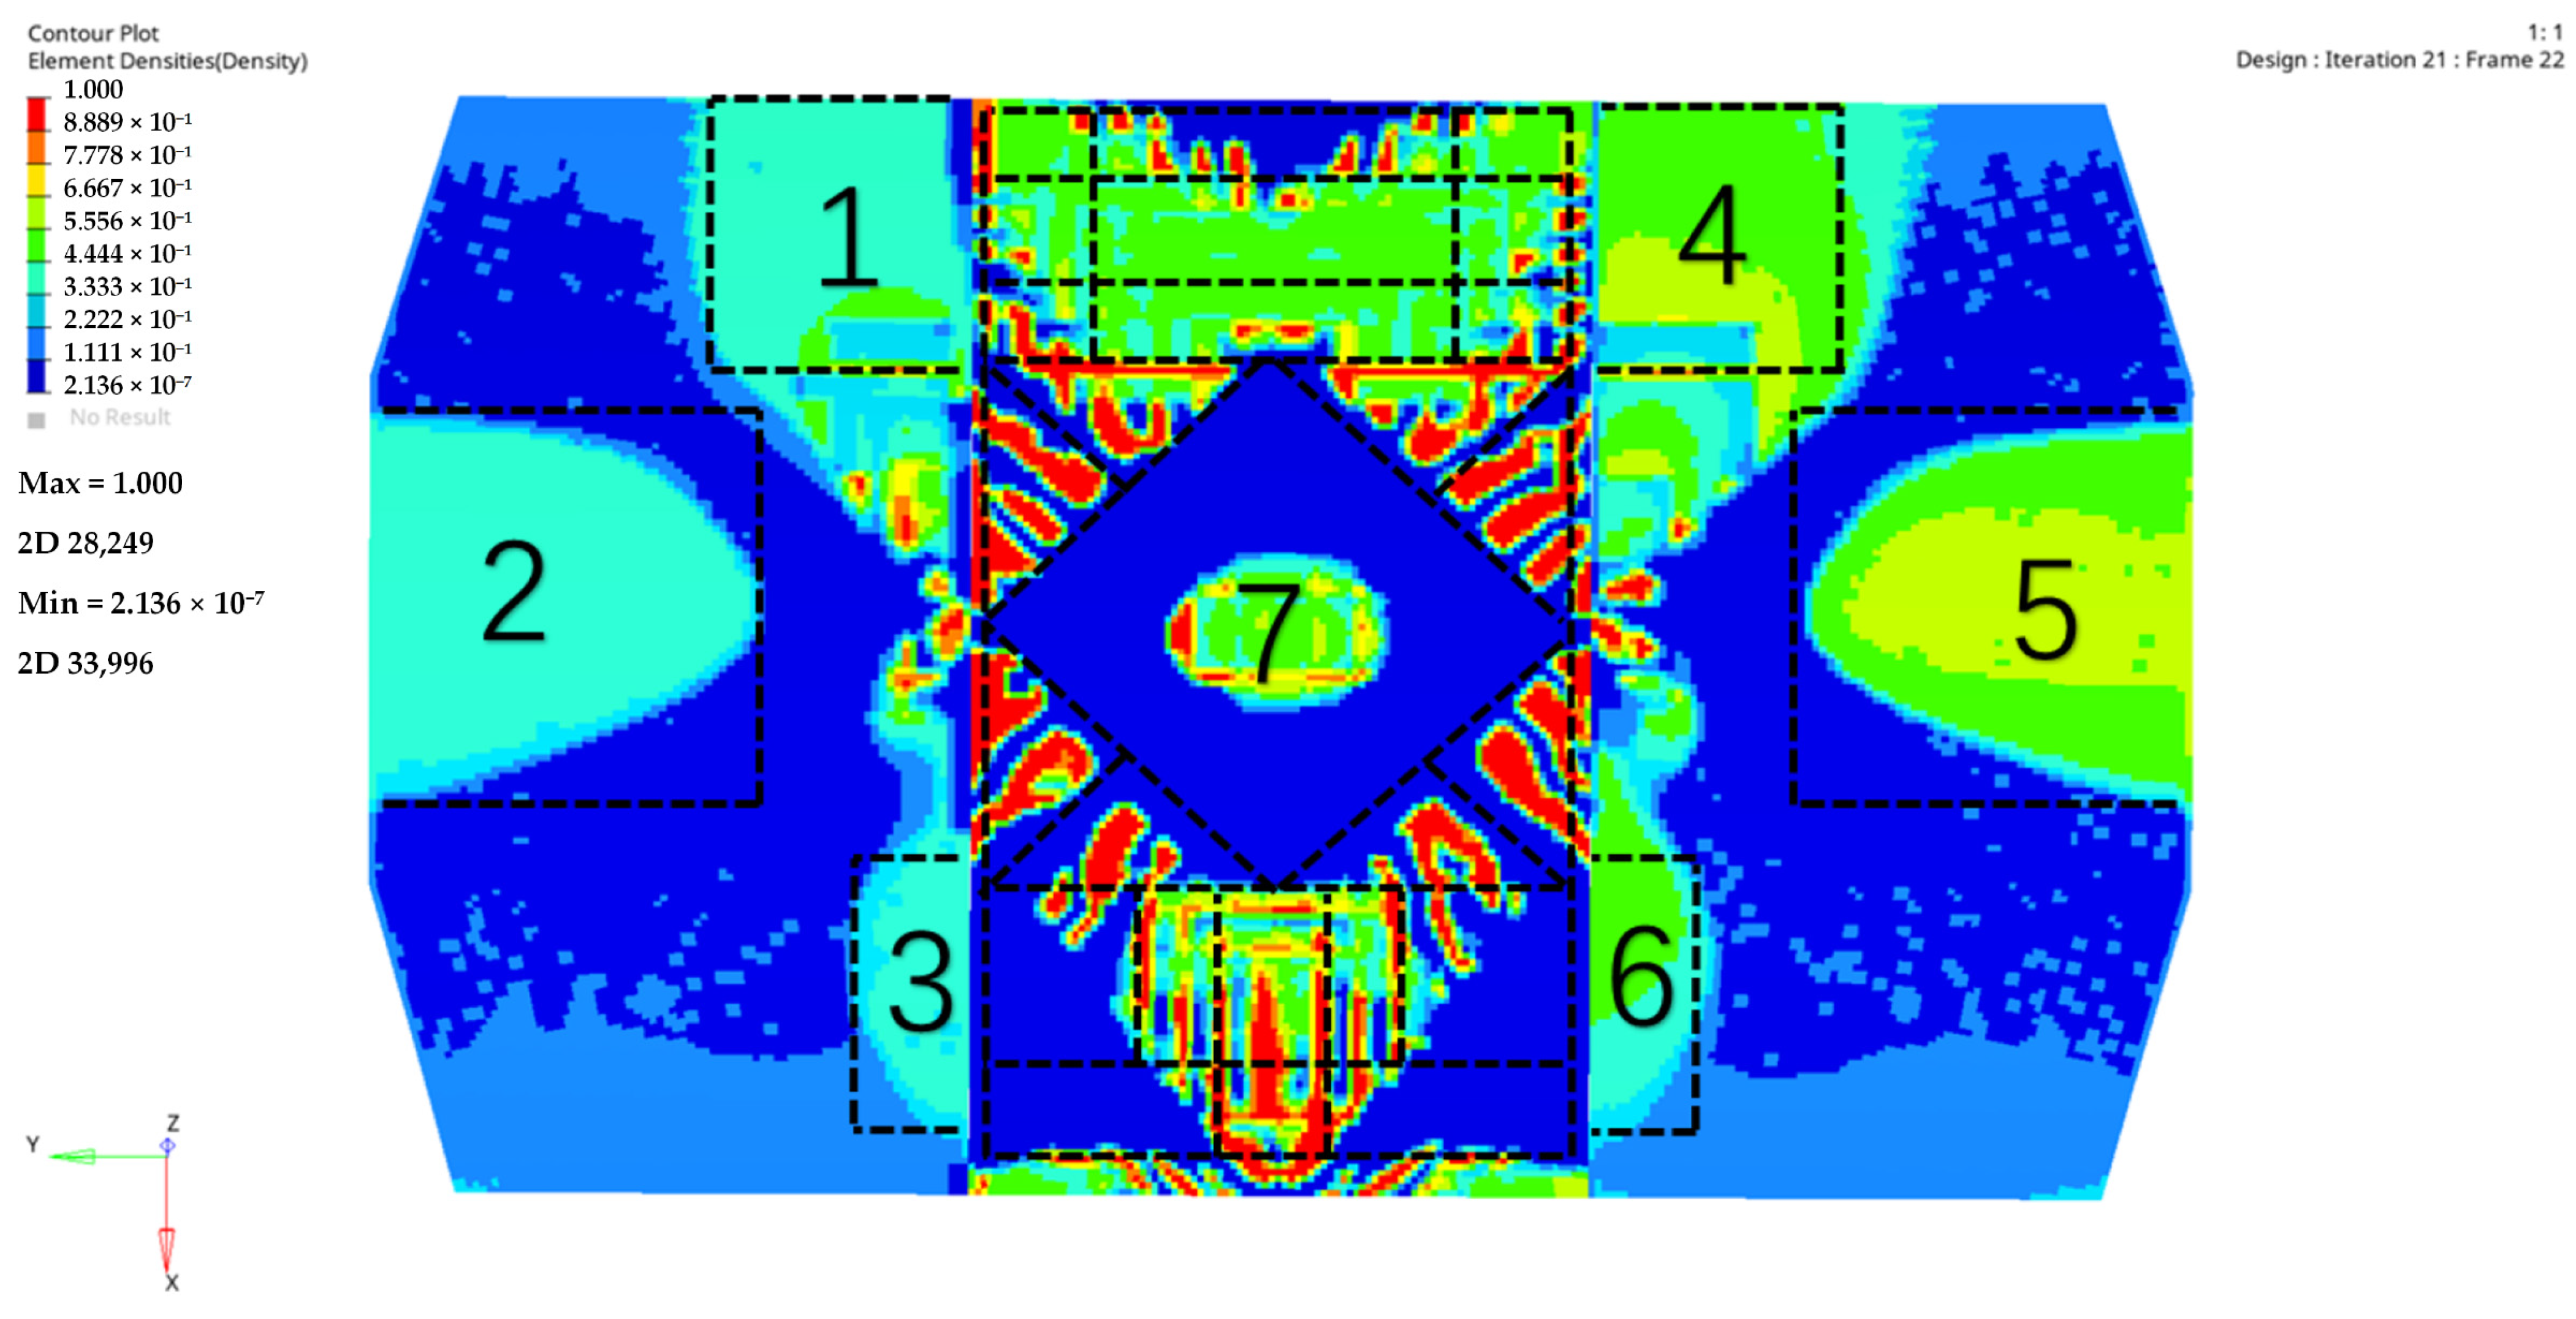
3.3. Topology Optimization Process and Reconstruction of the Layout of Reinforced Ribs

After 21 iterations, the maximum displacement variation within the designed region was as illustrated in Figure 15. The absolute values of displacements for all nodes within the optimized design region were consistently below 0.82 mm:
The topology optimization results are illustrated in Figure 16. The overall principle of the reinforced rib design is to preserve regions with high unit density during the design process, while discarding regions with densities close to or equal to zero. The specific design process for the reinforced ribs is as follows:
① Feature extraction for high-density regions: High-density regions are identified, primarily concentrated in the central and lower regions of the intermediate reflector surface. Based on the trends in high-density regions, slant and vertical reinforced ribs are extracted.
② Design of moderate-density regions: For regions with moderate density, designing is conducted considering the deformation characteristics of the reflector surface without reinforced ribs. For the medium density areas of 1–6 on the left and right reflector surfaces, the deformation in areas 1 and 4 was significant, and cross reinforcement ribs were used. Regions 2 and 5 were compared to regions 1 and 4, and the deformation was smaller, so horizontal and vertical ribs were adopted. Due to the position close to fixed constraints and a deformation approaching zero, only transverse ribs were designed in regions 3 and 6.
The resulting layout for the reinforced ribs is depicted in Figure 17.

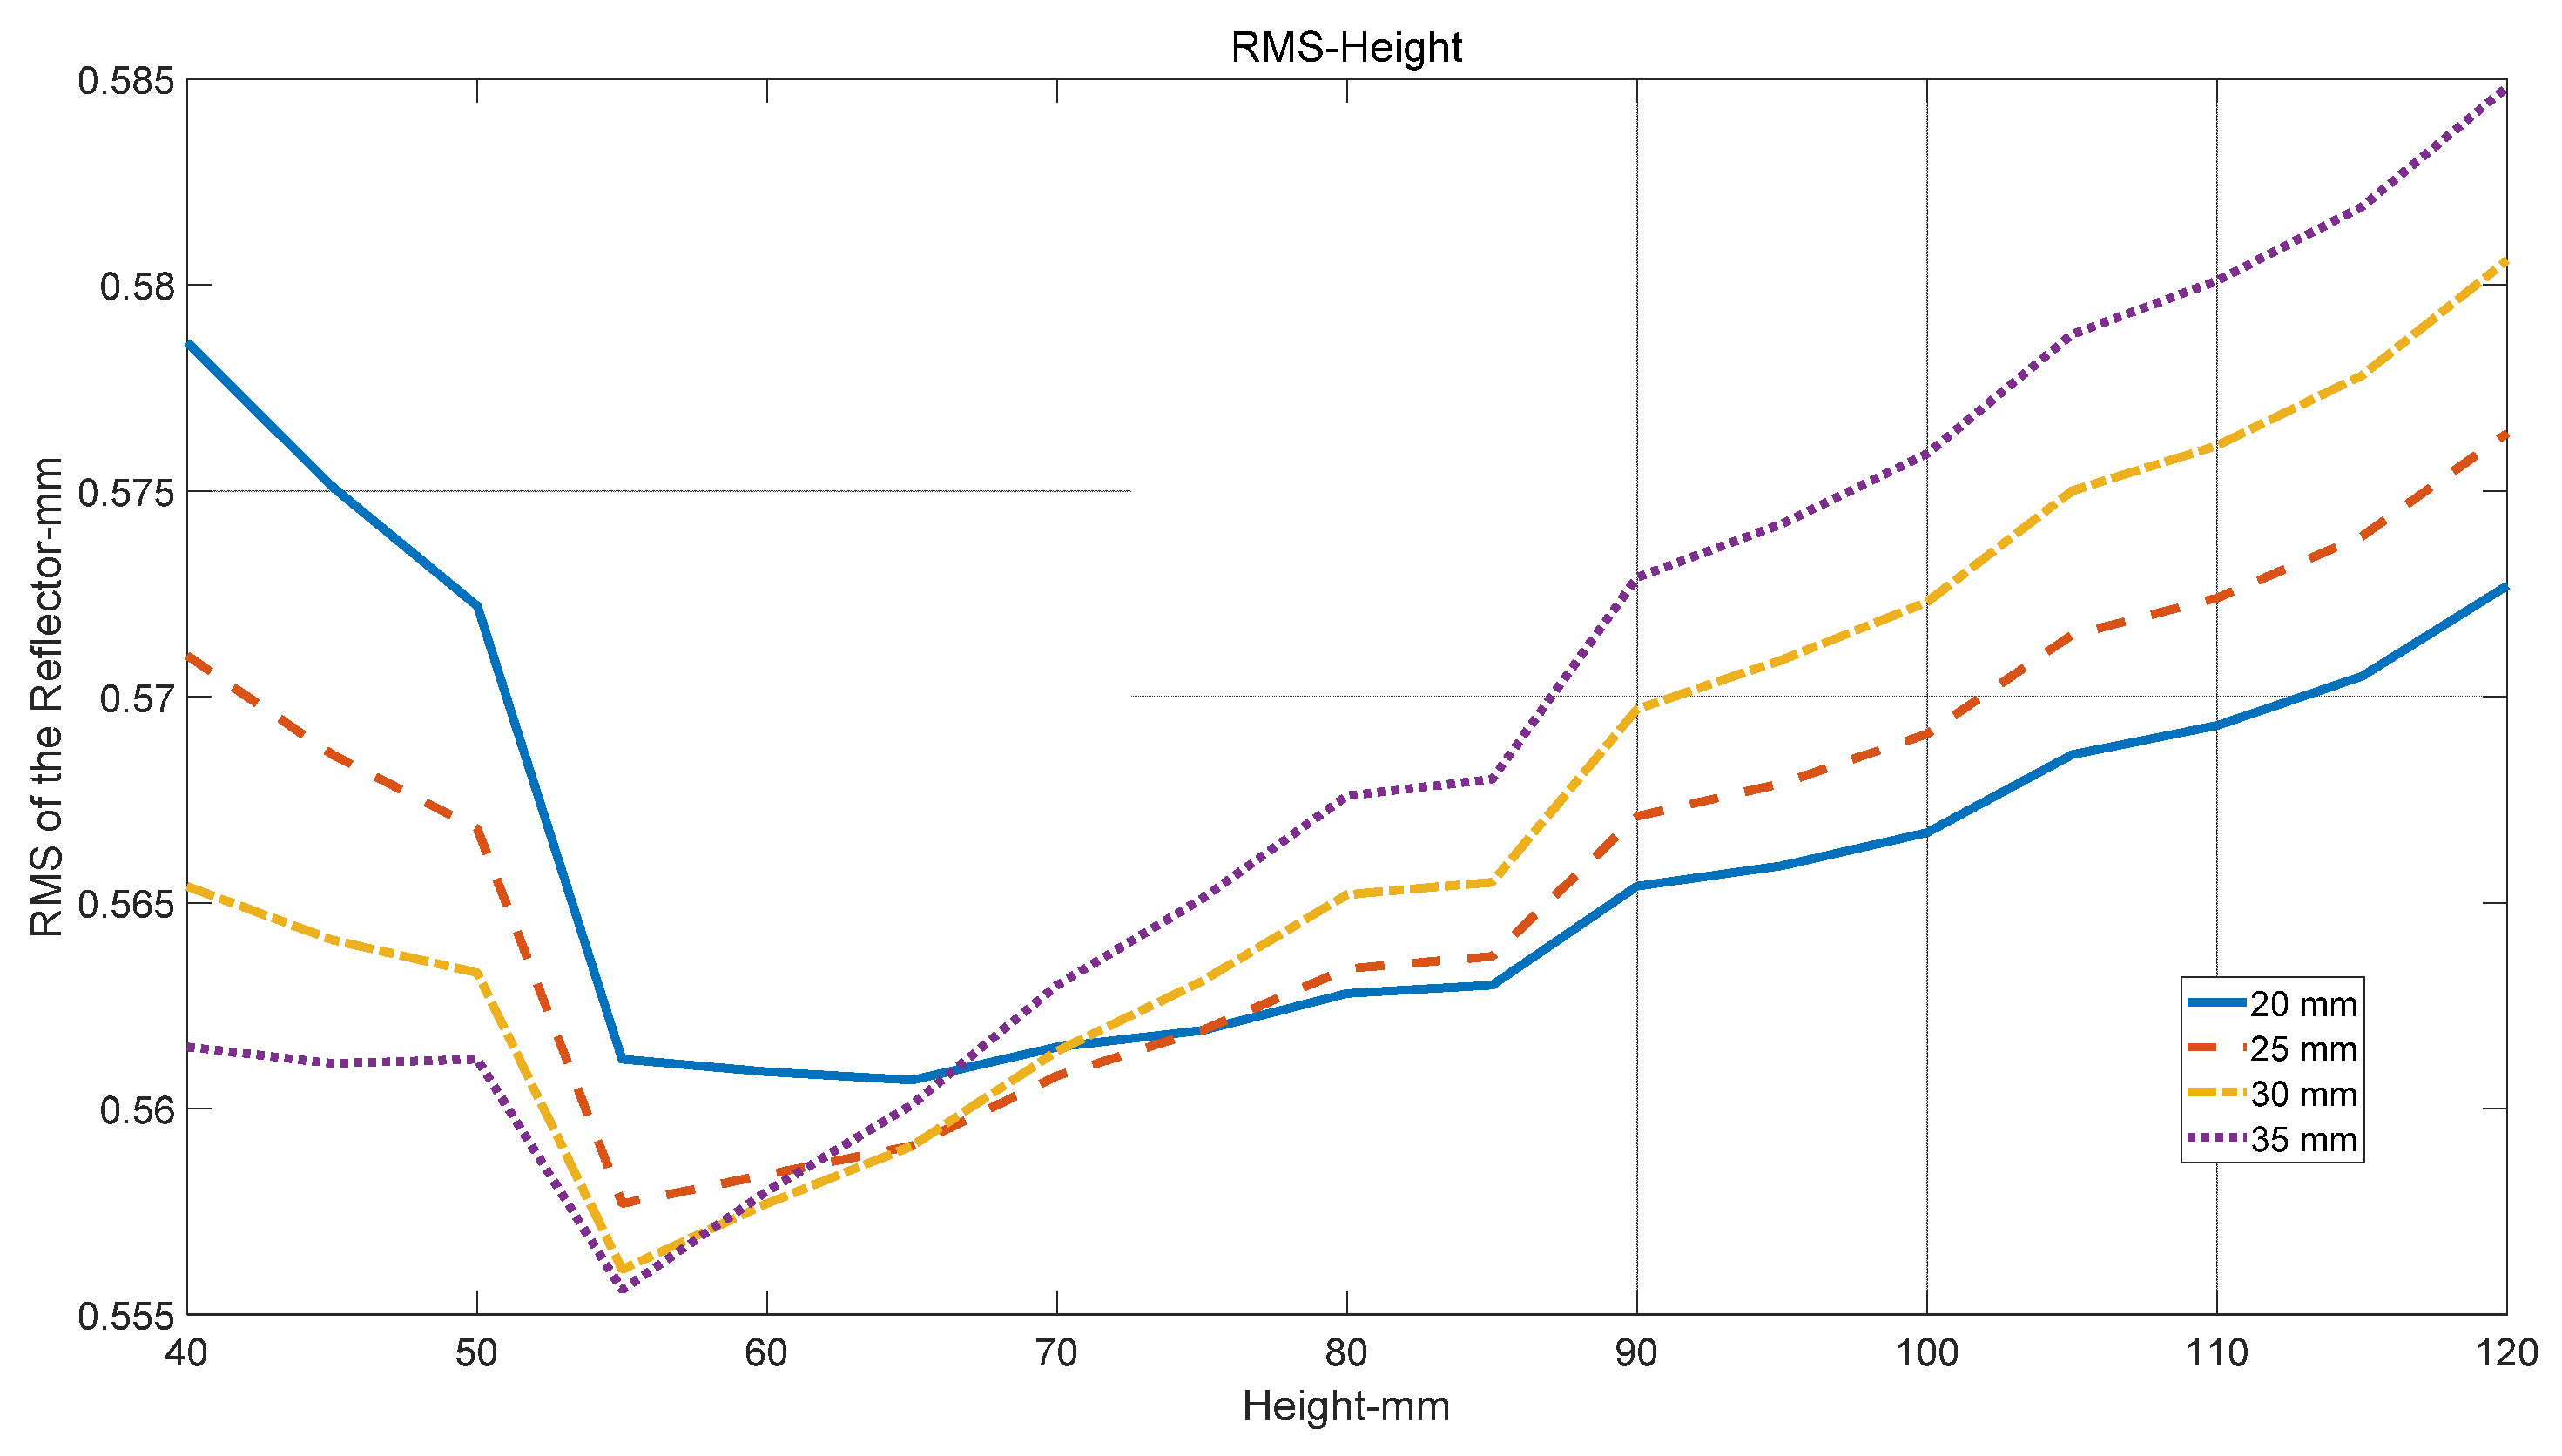
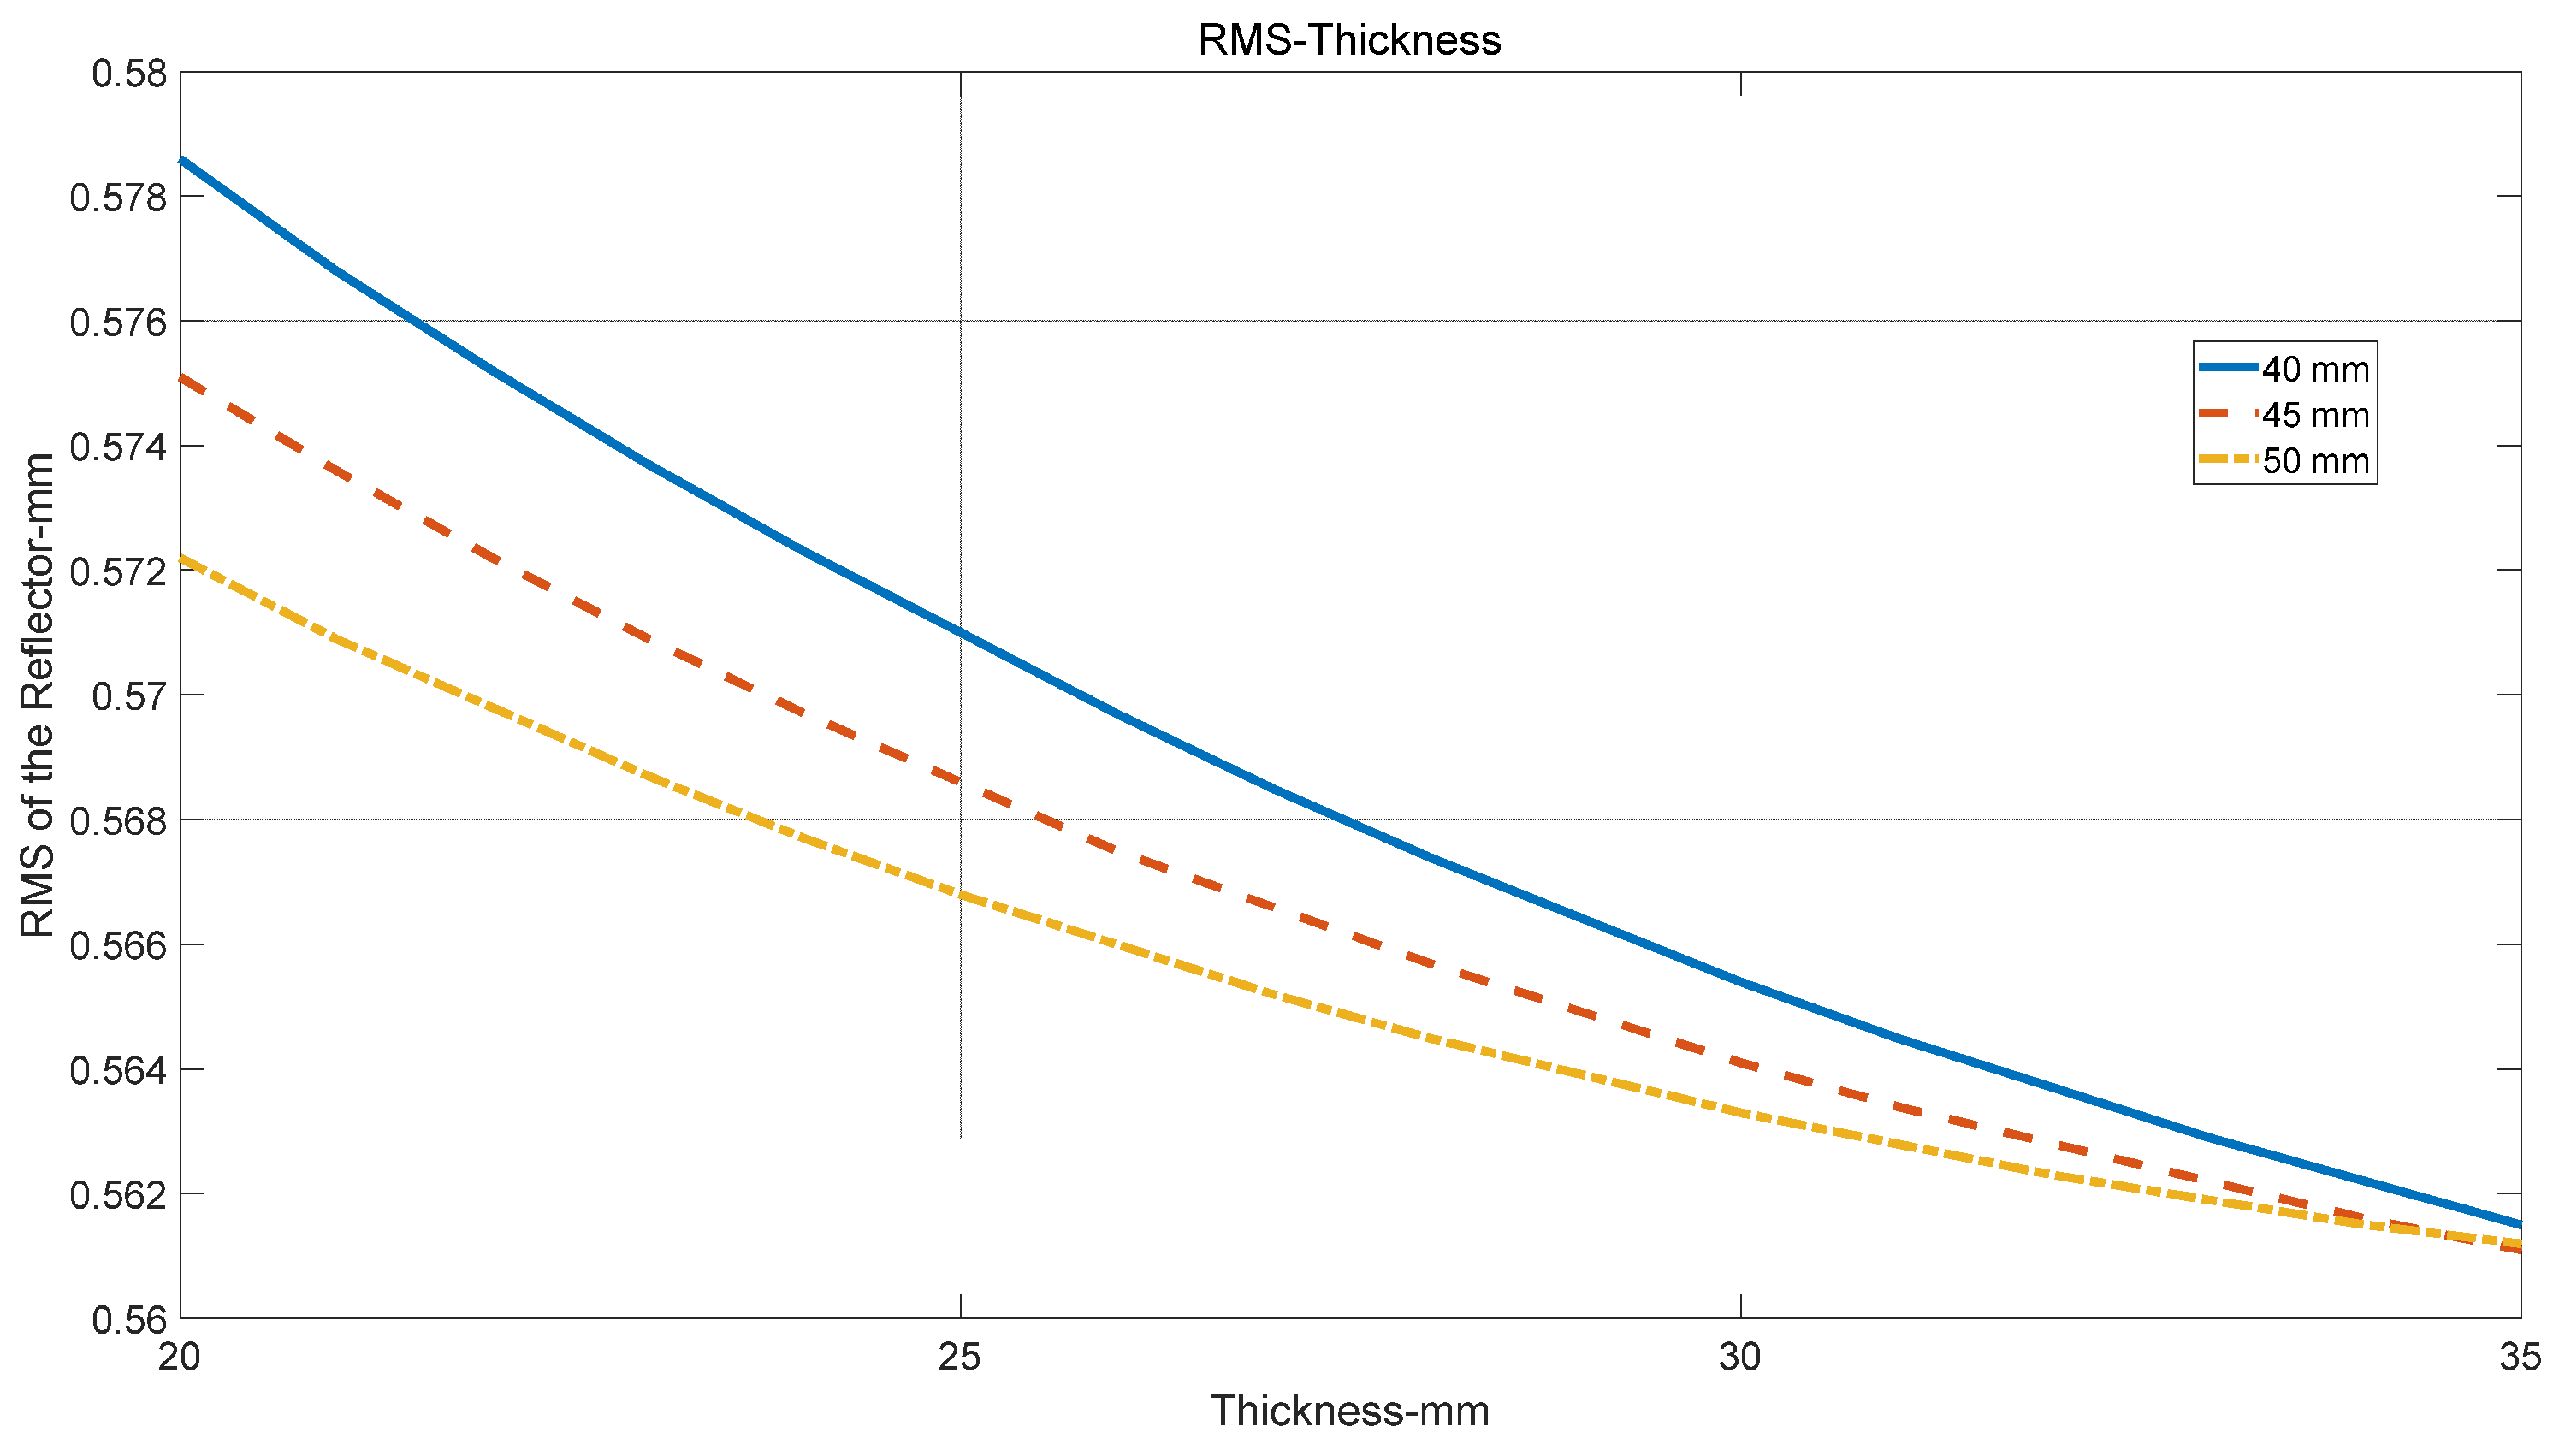
3.4. Parametric Analysis

Once the layout of the reinforced ribs had been determined, the selection of the dimensions of the reinforced ribs also determined their effectiveness in reducing the RMS of the reflector surface. In existing designs, the choice of the height and thickness of the reinforced ribs largely relied on the designer’s experience. Moreover, there has been a scarcity of research on the impact patterns of these two parameters on the RMS of the reflector surface. If the influence patterns of the height and thickness of reinforced ribs, which are made of composite materials, on the RMS of the reflector surface can be determined, this would not only provide suitable design parameters for the reinforced ribs but also offer a valuable reference for future engineering designs.
Due to the distance constraints between the antenna and the entire satellite, along with the weight requirements, the height of the reinforced ribs needed to be controlled within the range of 30 mm to 120 mm. The thickness had to be constrained within the range of 20 mm to 35 mm.
First, the effect of varying the reinforced rib height on the RMS of the reflector surface was simulated. The variation in the reinforced ribs’ height at thicknesses of 20 mm, 25 mm, 30 mm, and 35 mm was simulated. Simulation calculations for the reflector RMS of the reflector surface at intervals of 5 mm were performed, ranging from a height of 30 mm to 120 mm. The characteristic curves were obtained, as shown in Figure 18, depicting the change in the RMS of the reflector surface with varying back reinforced rib heights for specific rib thickness conditions.
From Figure 18, it can be observed that, under the four thickness conditions, the RMS of the reflector surface did not linearly decrease with the increase in reinforced rib height. In the height range of 40 mm to 55 mm for reinforced ribs, the RMS of the reflector surface decreased with the increase in height for all four thicknesses. This range is referred to as the reduction interval of RMS for the reflector surface. In the height range of 55 mm to 65 mm for reinforced ribs, under the 20 mm thickness condition, the RMS of the reflector surface showed a relatively flat trend within this interval, while for the other three thicknesses, the RMS increased with the height of the reinforced ribs. Additionally, the slope relationships changed, with the 35 mm curve having the steepest slope, followed by 30 mm, and lastly, 25 mm. This range was identified as the turning point interval of the RMS of the reflector surface. In the height range of 65 mm to 120 mm for reinforced ribs, the RMS of the reflector surface linearly increased with the increase in back reinforced rib height. This range was identified as the growth interval of the RMS for the reflector surface.
Next, simulations were conducted to investigate the influence of the reinforced rib thickness on the RMS of the reflector surface. Heights were selected from the reduction interval, turning point interval, and growth interval: 40 mm, 45 mm, 50 mm, 65 mm, 80 mm, 100 mm, and 120 mm. The influence of thickness on the RMS of the reflector surface was simulated at different reinforced rib heights. Thickness varied from 20 mm to 35 mm, with calculations conducted at 1 mm intervals. The obtained patterns of the RMS of the reflector surface variation with reinforced rib thickness are illustrated in Figure 19, Figure 20 and Figure 21.
It can be observed that the RMS of the reflector surface effectively decreased with the increase in reinforced rib thickness at different heights within the reduction interval (40 mm, 45 mm, and 50 mm). For the turning point interval, specifically at a back reinforced rib height of 65 mm, the RMS of the reflector surface showed no significant increase or decrease with the increase in the thickness of the reinforced rib. In the growth interval (80 mm, 100 mm, and 120 mm), the RMS of the reflector surface gradually increased with the augmentation of back reinforced rib thickness.
In the reduction interval, both the height and thickness of the reinforced rib had a positive influence on the RMS of the reflector surface. Indicating that reducing the RMS could be achieved by increasing the height and thickness of the reinforced rib. However, in the turning point interval, their influence was not significant, as there was no clear trend of increase or decrease. In the growth interval, both the height and thickness of the reinforced rib negatively influenced the RMS of the reflector surface. Compared with the other interval parameters, increasing the height and thickness of the reinforced rib in this interval not only increased the volume and weight of the reinforced rib but also increased the RMS of the reflector surface. This deviates from the original intentions of the reinforced rib design.
Considering various engineering factors, including weight, the final decision was to set the height of the reinforced rib at 55 mm and the thickness at 30 mm. Applying the same temperature excitation as in Section 2.3, the deformation contour of the reflector was as illustrated in Figure 22.
The information of the reflector nodes of the model in Figure 22 was extracted and, through Equation (9), it was calculated that the RMS of the optimized surface was 0.5561 mm.
The optimized ratios of the reconstructed model to the model under the original reinforced rib layout and without reinforced ribs are shown in Table 3:

4. Conclusions

At present, the design of reinforced rib layouts and dimensions for parabolic cylindrical reflector antennas is an area worthy of attention. Many existing designs relied on the engineering experience of designers, lacking a theoretical foundation. Moreover, there is a scarcity of studies investigating the impact of reinforced rib parameters on the RMS of the reflector surface. In this study, focusing on the parabolic cylindrical reflector antenna of MICAP, we proposed a design approach that combines topology optimization and parametric analysis. Based on the optimization results, a new layout for the reinforced ribs was designed and a parametric analysis was conducted on the new layout of the reinforced ribs. By obtaining suitable height and thickness values, we also elucidated the impact patterns of these two parameters on the RMS of the antenna’s reflector surface under the new layout. Using simulated thermal excitations from orbital external heat flux and antenna temperature fields, finite element thermal distortion analyses were performed on the different models, comparing the RMS of the antenna’s reflector surface before and after optimization. In comparison to the original reinforced rib design, the optimized RMS was reduced by 7.7%, without additional volume. When compared to the reflector surface without reinforced ribs, the optimization resulted in a reduction of 17.9% in RMS.
However, the influence of height and thickness on the RMS of the reflector surface antenna was limited to a specific layout. Subsequent efforts should focus on generalizing these patterns, to enhance their broader significance.

Author Contributions

Conceptualization, P.K., W.F. and H.L.; methodology, P.K. and W.F.; software, P.K. and M.L.; validation, P.K. and D.W.; formal analysis, P.K.; investigation, P.K. and M.L.; resources, H.L; data curation, W.F. and H.L.; writing—original draft preparation, P.K.; writing—review and editing, W.F. and H.L.; visualization, P.K.; supervision, W.F. and H.L.; project administration, H.L. All authors have read and agreed to the published version of the manuscript.

Funding

This research received no external funding.

Informed Consent Statement

Not applicable.

Data Availability Statement

The data presented in this study are available on request from the corresponding author. The data are not publicly available due to confidentiality reasons as the project is not completed. The project is expected to be completed by December 2024.

Conflicts of Interest

The authors declare no conflict of interest.

References

  1. Liu, H.; Zhu, D.; Niu, L.J.; Wu, L.; Wang, C.Y.; Chen, X.; Zhao, X.; Zhang, C.; Zhang, X.K.; Yin, X.B.; et al. MICAP (microwave imager combined active and passive): A new instrument for chinese ocean salinity satellite. In Proceedings of the IEEE International Geoscience and Remote Sensing Symposium (IGARSS), Milan, Italy, 26–31 July 2015; pp. 184–187. [Google Scholar]
  2. Liu, H.; Zhang, X.K.; Niu, L.J.; Zhao, X.; Zhang, C.; Wu, J.; Yan, J.Y.; Wu, Q.; Zhang, W.G. A combined L-band synthetic aperture radiometer and fan-beam scatterometer for soil moisture and ocean salinity measurement. In Proceedings of the IEEE International Geoscience and Remote Sensing Symposium (IGARSS), Munich, Germany, 22–27 July 2012; pp. 4644–4647. [Google Scholar]
  3. Guo, T.S.; Guo, X.; Liu, H.; Han, D.H.; Zhang, C.; Huo, C.X.; Tang, Y.Y.; Niu, L.J.; Li, G.; Wu, J. Study of the Real-Time Onboard Radio Frequency Interference Detection and Mitigation Strategy for MICAP L-Band Radiometer. IEEE Trans. Geosci. Remote Sens. 2022, 60, 14. [Google Scholar] [CrossRef]
  4. Yue, X.Q.; Qiu, Y.Y.; Cao, H.J.; Wang, C.S.; You, F. Optimal Design of Mechanical and Electronic Synthesis for Reflective Antenna Structures. Mod. Radar 2007, 29, 73. [Google Scholar] [CrossRef]
  5. Duan, B.Y. Review of antenna structural design with mechatronics in China. Mechatronics 2002, 12, 657–667. [Google Scholar] [CrossRef]
  6. Kumar, C.; Srinivasan, V.V.; Lakshmeesha, V.K.; Pal, S. Performance of an Electrically Small Aperture, Axially Displaced Ellipse Reflector Antenna. IEEE Antennas Wirel. Propag. Lett. 2009, 8, 903–904. [Google Scholar] [CrossRef]
  7. Duan, B.Y.; Qi, Y.H.; Xu, G.H.; Wang, W.T. Study on optimization of mechanical and electronic synthesis for the antenna structural system. Mechatronics 1994, 4, 553–564. [Google Scholar] [CrossRef]
  8. Lei, J.; Wan, J.; Fu, D.; Fu, G. Design and analysis of a multi-beam parabolic reflector antenna. J. Xidian Univ. 2003, 30, 399–402. [Google Scholar] [CrossRef]
  9. Lopatin, A.V.; Rutkovskaya, M.A.; Gantovnik, V.B. Accuracy analysis of the reflective surface of the umbrella-type antenna. J Spacecr. Rockets 2008, 45, 149–151. [Google Scholar] [CrossRef]
  10. Liu, J.S.; Hollaway, L. Design optimisation of composite panel structures with stiffening ribs under multiple loading cases. Comput. Struct. 2000, 78, 637–647. [Google Scholar] [CrossRef]
  11. Li, W.; Zhang, M.; Zhu, D.; Liu, H. Simulation and Optimization of Composite Parabolic Antenna with Stiffening Ribs. Aerosp. Mater. Technol. 2015, 45, 27–31. [Google Scholar] [CrossRef]
  12. Zhou, T.; Ye, Z.; Shi, Y.; Liang, Y.; Hao, X.; Qian, Y. Thermal distortion for honeycomb sandwich construction rigid reflector of satellite antenna. Acta Mater. Compos. Sin. 2018, 35, 2065–2073. [Google Scholar] [CrossRef]
  13. Zhou, T.; Liang, Y.; Wu, W.; Wu, X.; Ye, Z.; Dong, B. Lightweight Design of Spaceborne CFRP Rigid Antenna Reflector. Aerosp. Shanghai 2022, 39, 137–149. [Google Scholar] [CrossRef]
  14. Liu, J.K.; Ma, Y.S. A survey of manufacturing oriented topology optimization methods. Adv. Eng. Softw. 2016, 100, 161–175. [Google Scholar] [CrossRef]
  15. Meng, L.; Zhang, W.H.; Quan, D.L.; Shi, G.H.; Tang, L.; Hou, Y.L.; Breitkopf, P.; Zhu, J.H.; Gao, T. From Topology Optimization Design to Additive Manufacturing: Today’s Success and Tomorrow’s Roadmap. Arch. Comput. Method Eng. 2021, 28, 269. [Google Scholar] [CrossRef]
  16. Zhu, B.L.; Zhang, X.M.; Zhang, H.C.; Liang, J.W.; Zang, H.Y.; Li, H.; Wang, R.X. Design of compliant mechanisms using continuum topology optimization: A review. Mech. Mach. Theory 2020, 143, 34. [Google Scholar] [CrossRef]
  17. Liu, S.T.; Hu, R.; Li, Q.H.; Zhou, P.; Dong, Z.G.; Kang, R.K. Topology optimization-based lightweight primary mirror design of a large-aperture space telescope. Appl. Opt. 2014, 53, 8318–8325. [Google Scholar] [CrossRef] [PubMed]
  18. Qu, Y.J.; Jiang, Y.R.; Feng, L.J.; Li, X.P.; Liu, B.; Wang, W. Lightweight Design of Multi-Objective Topology for a Large-Aperture Space Mirror. Appl. Sci. 2018, 8, 2259. [Google Scholar] [CrossRef]
  19. Chen, T.Y.; Wang, C.B. Topological and sizing optimization of reinforced ribs for a machining centre. Eng. Optimiz. 2008, 40, 33–45. [Google Scholar] [CrossRef]
  20. Wang, J.P.; Chang, S.; Liu, G.; Liu, L.; Wu, L.Y. Optimal rib layout design for noise reduction based on topology optimization and acoustic contribution analysis. Struct. Multidiscip. Optim. 2017, 56, 1093–1108. [Google Scholar] [CrossRef]
  21. Niu, B.; Yan, J.; Mao, Y.; Liu, H. Collaborative Design Optimization of Damping Layers and Stiffener Layout of Thin-walled Stiffened Plate Structures for Dynamics Performances. China Mech. Eng. 2021, 32, 1912–1920. [Google Scholar] [CrossRef]
  22. Miao, J.Y.; Zhong, Q.; Zhao, Q.W.; Zhao, X. Spacecraft Thermal Control Technologies, 1st ed.; Beijing Institute of Technology Press: Beijing, China, 2021; pp. 290–300. [Google Scholar]
Figure 1. The dimensions of the generatrix.
Applsci 14 01385 g001
Figure 2. Structural concept diagram of the parabolic cylindrical antenna.
Applsci 14 01385 g002
Figure 3. Schematic diagram of satellite thermal equilibrium.
Applsci 14 01385 g003
Figure 4. The external heat flux curves at the minimum value of the beta angle.
Applsci 14 01385 g004
Figure 5. The external heat flux curves at the maximum value of the beta angle.
Applsci 14 01385 g005
Figure 6. The flight coordinate system during in-orbit operation.
Applsci 14 01385 g006
Figure 7. (a) Setting the measuring points; (b) setting measuring points of the discrete grid.
Applsci 14 01385 g007
Figure 8. Temperature variation curve of the measuring points over time.
Applsci 14 01385 g008
Figure 9. Finite element model of the antenna reflector (front view).
Applsci 14 01385 g009
Figure 10. Finite element model of the antenna reflector (back view).
Applsci 14 01385 g010
Figure 11. Sample of honeycomb sandwich structure.
Applsci 14 01385 g011
Figure 12. Thermal deformation contour plot of the antenna with the original layout of reinforced ribs.
Applsci 14 01385 g012
Figure 13. Thermal deformation contour plot of the antenna without reinforced ribs.
Applsci 14 01385 g013
Figure 14. Conceptual diagram of the deformation of the parabolic antenna.
Applsci 14 01385 g014
Figure 15. Optimization process curve.
Applsci 14 01385 g015
Figure 16. Topology optimization result.
Applsci 14 01385 g016
Figure 17. Layout of reconstructed reinforcing ribs.
Applsci 14 01385 g017
Figure 18. RMS of the reflector surface at thicknesses of 20, 25, 30, and 35 mm.
Applsci 14 01385 g018
Figure 19. RMS of the reflector surface at heights of 40, 45, and 50 mm.
Applsci 14 01385 g019
Figure 20. RMS of the reflector surface at a height of 65 mm.
Applsci 14 01385 g020
Figure 21. RMS of the reflector surface at heights of 80, 100, and 120 mm.
Applsci 14 01385 g021
Figure 22. Deformation contour map of the antenna with the new layout and dimensions of reinforced ribs.
Applsci 14 01385 g022
Table 1. Literature research.
LiteratureResearch Gate
[11]Reflector antenna simulations through varying the number and height of the reinforced ribs, no parametric analysis for the thickness of reinforced ribs
[13]Reflector antenna, no optimization and parametric analysis for reinforced ribs
[17]Primary mirror topology optimization with the objective of the minimization of the overall structural flexibility, size optimization for height, no analysis for the thickness of reinforced ribs
[19]Used topology and size optimization to obtain the rib layout and thickness, no analysis for the height of the ribs
[20]Used topology optimization to obtain the rib layout, no analysis for rib height and thickness
This studyReflector antenna, uses topology optimization to obtain the layout of reinforced ribs, parametric analysis on thickness and height of reinforced ribs
Table 2. Relevant parameters of composite materials.
Young’s ModulusPoisson’s RatioDensityThermal
Expansion
Coefficient
Thermal ConductivityHeat
Capacity
Honeycomb Sandwich Panel1927.85 MPa0.332530 k g / m 3 1.8 × 10 6 /°C3.2 W/m·K678.9 J/kg·K
Table 3. Summary of the results comparison.
RMS without Reinforced Ribs
(Case 1)
RMS with Original Back Reinforced Rib Layout
(Case 2)
RMS after the Reconstruction of the Back Reinforced Rib Layout
(Case 3)
The volume of reinforced ribs./ 0.129417   m 3 0.128966   m 3
RMS0.6774 mm0.6025 mm0.5561 mm
Optimized ratio/11.1% (Compared to Case 1)7.7% (Compared to Case 2)
17.9% (Compared to Case 1)
Disclaimer/Publisher’s Note: The statements, opinions and data contained in all publications are solely those of the individual author(s) and contributor(s) and not of MDPI and/or the editor(s). MDPI and/or the editor(s) disclaim responsibility for any injury to people or property resulting from any ideas, methods, instructions or products referred to in the content.

