Article

Ball Tracking Based on Multiscale Feature Enhancement and Cooperative Trajectory Matching

1
School of Information and Communication Engineering, Communication University of China, Beijing 100024, China
2
Collaborative Innovation Center, Communication University of China, Beijing 100024, China
3
School of Computer and Cyber Sciences, Communication University of China, Beijing 100024, China
*
Author to whom correspondence should be addressed.
Appl. Sci. 2024, 14(4), 1376; https://doi.org/10.3390/app14041376
Submission received: 8 January 2024 / Revised: 31 January 2024 / Accepted: 6 February 2024 / Published: 7 February 2024
(This article belongs to the Special Issue Advances in Intelligent Information Systems and AI Applications)

Abstract

:
Most existing object tracking research focuses on pedestrians and autonomous driving while ignoring sports scenes. When general object tracking models are used for ball tracking, there are often problems, such as detection omissions due to small object sizes and trajectory loss due to occlusion. To address these challenges, we propose a ball detection and tracking model called HMMATrack based on multiscale feature enhancement and multilevel collaborative matching to improve ball-tracking results from the entire process of sampling, feature extraction, detection, and tracking. It includes a Heuristic Compound Sampling Strategy to deal with tiny sizes and imbalanced data samples; an MNet-based detection module to improve the ball detection accuracy; and a multilevel cooperative matching and automatic trajectory correction tracking algorithm that can quickly and accurately correct the ball’s trajectory. We also hand-annotated SportsTrack, a ball-tracking dataset containing soccer, basketball, and volleyball scenes. Extensive experiments are conducted on the SportsTrack, demonstrating that our proposed HMMATrack model outperforms other representative state-of-the-art models in ball detection and tracking.

1. Introduction

Sports videos have always been a favorite type of entertainment video for most audiences. With the rapid development of Internet technology, the number of videos has increased dramatically, and the number of online video users has also increased. The intelligent processing of sports video technology has emerged because it is difficult to process such a large number of sports videos manually. It is necessary to obtain more accurate semantic knowledge for object analysis in sports videos, including recognition of athlete movements, analysis of competition tactics, and prediction of competition results. However, obtaining object location information and object category identification is the most basic and essential. Object tracking, a basic task in computer vision, can meet this need. Object tracking technology has been applied in many real-world fields, such as security surveillance systems [1], autonomous vehicles [2], and sports video broadcasts [3]. Balls, players, referees, coaching teams, and spectators on the court are the main objects in sports video object tracking. Among them, ball tracking is essential to object tracking in sports videos. In team ball sports, the movement of the ball is the core and driving force of movement for all other objects. Sports interactions such as cooperation and confrontation between athletes and the behavior of referees are closely related to the trajectory of the ball on the field.
With the application of deep learning technology in ball object-tracking tasks, existing research has achieved initial results. Ball-tracking methods based on deep learning generally follow two steps: ball detection and ball tracking. Existing research also mainly improves from these two aspects. The detection results are often the input of the tracking process, so the improvement of ball-tracking accuracy largely depends on the accuracy of the ball detector. Kamble et al. [4,5] added a classification confidence branch to the detection model, obtained the detection bounding box, and divided the image blocks into three categories, balls, players, and backgrounds, making the positioning of balls more accurate in the tracking phase. Kukleva [6] used a method based on a fully convolutional neural network with automatic encoding and decoding structure: first, generate a ball candidate area on the original image [7], then calculate the distance between the candidate area and the truth ball, delete the wrong candidate area by setting a threshold, and detect the model output containing the confidence of the ball and the diameter of the ball. In the tracking stage, existing research mainly focuses on solving the problems of motion blur and deformation caused by the fast movement of balls and trajectory incoherence caused by occlusion and out-of-drawing. Using a bounding box overlap probability measurement algorithm [4] can generate a more robust ball trajectory from tracking loss and recovery; estimating the ball’s position through the extended Kalman filter [8] can better cope with sports videos. Uncertainty in ball movement: the ball’s motion state is modeled based on time-varying fission filters [9], and the relative space filter is used to correct the trajectory, integrating spatiotemporal information. Dong et al. [10] consider the volleyball flight process. The most influential air resistance and gravity factors are used to simulate the ball’s motion state, and a trajectory correction algorithm based on time–motion characteristics is proposed. The WITHDRAW model [11] combines center-of-mass tracking with an improved Kalman filter to estimate the ball’s trajectory accurately. Zhao et al. [12] combined the MeanShift algorithm with adaptive object area size to improve Kalman filter tracking estimation, improving tracking accuracy and speed. Zhang et al. [13] utilize Harris corner detection, SURF feature extraction, and a particle swarm optimization algorithm to improve basketball tracking results. Roman et al. [14] preset a fixed basketball size and search for basketball position points in the scene using RANSAC (Random Sample Consensus). In a posterior step, the sphere center is fitted using z-score values eliminating outliers from the sphere. Huang [15] embed graph convolution to effectively aggregate deep features. On the other hand, most recent sports video detection and tracking techniques directly adapt general detection and tracking methods to sports-specific applications. For instance, Naik et al. [16], Vicent et al. [17], and Huang [15] all employ the YOLO series of methods, while Kevca et al. [18] employ several classic general lightweight detection models. While this straightforward adaptation may be convenient, it often overlooks the unique challenges encountered in sports scenarios, such as motion blur, occlusion, and other issues.
Although specific progress has been made in ball tracking in sports videos, these methods use the same method to uniformly handle balls and human objects on the court in sports analysis systems, ignoring the analysis of the unique attributes of ball objects. First, the number of active ball objects on the playing field is far smaller than that of humans. There is only a fixed number of balls moving on the court, unlike the number of players, which is uncertain. The trajectory of the ball is fixed and continuous to the same target, while the trajectories of the players on the court belong to multiple players with different identities. Second, ball objects are smaller in size. The ball object covers a small pixel area, resulting in relatively few available features, which could be more conducive to extracting abstract-level features. Third, locating the bounding box of the ball is more challenging. Under the IoU evaluation standard, balls occupy a small proportion of pixels in the image, causing the error impact caused by the offset of the object bounding box to be much larger than the general scale. Fourth, due to the complexity of the background and movement in sports competition videos, ball objects can easily blend into the background and become difficult to detect. Due to its high speed of movement, the ball usually appears blurred in the image. Precise boundary determination is difficult, which brings greater challenges to detection and tracking.
Based on the above analysis and benefiting from small object detection and multiobject tracking, this paper proposes a ball detection and tracking method based on multiscale feature enhancement and multilevel collaborative matching to improve tracking results from multiple angles. Specifically, for the complex problem of the ball being too small and moving on the court, our goal is to capture more discriminating features and explore tracking algorithms based on the ball’s motion characteristics. Through data enhancement, the size of the data set is expanded, the diversity of the data set is enriched, and the proportion of small ball object samples is increased to enhance the generalization ability of the detection model. Multiscale feature learning can integrate the spatial location information of low-level features and the abstract semantic information of high-level features to improve small object detection capabilities while reducing the amount of calculation as much as possible. A certain correlation exists between objects and objects and between objects and backgrounds. By capturing this potential relationship context, detection performance can be improved. Considering object recall, positive and negative sample distribution, and calculation amount, the prior anchor frame is abandoned, and the confidence of the object’s existence and the bounding box coordinates is directly predicted through key point estimation, which improves the performance of small object detection while reducing problems. Complexity. The ball constantly tracks the same object, avoiding the ID assignment process during the tracking process. Unlike single-object tracking, all links in the object motion analysis process of sports competition videos are automatic, and there is no prior information about the object position and category in the first frame. Therefore, we use a simplified multiobject tracking method and rule matching to generate the ball’s trajectory online. Then, based on the characteristics of the generated ball trajectory, we automatically correct it through a simple linear motion model to improve the accuracy of tracking in batch processing. According to the above ideas, this article comprehensively improves ball-tracking accuracy from multiple perspectives, such as sampling strategy, feature extraction, ball object detection trajectory generation, and trajectory correction.
The contributions of our approach are summarized as follows:
  • We propose a heuristic composite sampling strategy. In our method, local region sampling and global image sampling are used for data augmentation;
  • We propose an anchor-free detection network with a classifier. Among them is the backbone network, a new multiscale feature enhancement and context information fusion network specially designed for balls;
  • We propose a tracking algorithm for multilevel collaborative trajectory matching and correction. Automatically correcting the trajectory for different generated trajectory states can provide more stable tracking;
  • We propose a ball-tracking data set specifically for sports match videos. The data set involves three sports, soccer, basketball, and volleyball, and the annotation information is all manually produced.

2. Related Work

2.1. Anchor-Free Detection

Balls in sports videos belong to the category of small objects, and the tracking results of small objects largely depend on the quality of the detector. Therefore, we discuss small object detection models in this section. In object detection, anchor boxes are multiple bounding boxes with different sizes and aspect ratios generated in the center of each image pixel. The current mainstream object detection algorithms are divided into anchor-based and anchor-free. Although the object detection algorithm based on the anchor frame mechanism can use a dynamic anchor frame size setting mechanism to improve a particular small object detection performance, compared with larger anchor boxes, the detector selects fewer small object anchor boxes, resulting in an imbalance of positive and negative samples, which is detrimental to small object detection. Secondly, the anchor box introduces too many hyperparameters, such as the number of anchor boxes, size, aspect ratio, etc. The research idea of the anchor-free mechanism is to change the original operation of using anchor boxes to select objects to position objects based on key points. CornerNet [19] turns the detection of the object box into a pair of key points, namely the upper left corner and the lower right corner, thus eliminating the trouble of designing the anchor. In addition, corner pooling helps CNNs better locate corner locations. ExtremeNet [20] also turns object detection into a key point estimation problem, including four extreme points and one center point of the object, and these five geometrically calibrated points form an object box. FSAF [21] is based on the online feature selection capability of the feature pyramid structure (FPN). It can dynamically allocate each instance to the most suitable feature layer during training, work with anchored module branches during inference, and output prediction results in a parallel manner. CenterNet [22] defines the object as a single point, that is, the center point of an object box. The detector uses key point estimation to find the center point and regress other object characteristics, such as size, 3D position, orientation, and posture. Anchor-free detection effectively solves the difficulty of small object detection caused by the predetermined fixed size and aspect ratio of the anchor frame. It has been applied in remote sensing images [23], face detection [24], surveillance pedestrian detection [25], and tennis ball detection in sports video [26]. We improve the ball detection and tracking model based on anchor-free CenterNet. CenterNet uses three key points, namely the upper left corner point, the center point, and the lower right corner point. A pair of detected corner points and embeddings are used to detect potential object frames; then, the detected center key point determines the final frame position. The acquisition of center points can enhance the network’s discrimination ability and reduce redundant and wrong object frames.

2.2. Ball Tracking by Detection

Siamese networks [27,28,29] mainly perform similarity matching through Siamese networks. This single-object tracking method requires manually selecting the object in the initial image, traversing each position in subsequent video frames, and determining the position through similarity comparison. However, in sports competition videos, there is no information about the object in the first frame. It is necessary to automatically provide each frame, including the object information in the first frame of the video and the algorithm for reappearing after the object disappears in the middle frame. The tracking-by-detection algorithm [30] means that the object information in each image is obtained through the detection algorithm before tracking. It first detects the object and then matches it to the existing trajectory. The number of tracking objects and the type of tracking object are all determined by the results of the detection algorithm.
The detection-based object tracking algorithm process mainly includes detecting the object position in each frame, predicting the position where the object will appear in the next frame, and then comparing and correlating the predicted position with the detection results of the next frame. When there are multiple tracking objects, it is also necessary to distinguish based on object characteristics to determine which existing trajectory the new tracking result is associated with. Another important feature of ball tracking is that the number of ball objects that need to be tracked in each frame does not fluctuate within a certain range like the number of players that need to be tracked. Therefore, it can be considered that the same object is tracked at any time, which avoids the identity ID allocation link in the tracking process and reduces the complexity of the tracking problem.

2.3. Kalman Filter

The Kalman filter [31] is a key processing flow in the detection-based object tracking algorithm. It is essentially a linear minimum variance estimation algorithm, which can be divided into two stages: prediction and update. The core is to use the previous state to predict the current state, and then through observation, the information corrects the prediction results and is more suitable for predicting the state sequence in the dynamic system, so it can be used to estimate the detection state in the object motion trajectory.
The state transition equation and observation equation in Kalman filtering can be expressed by Equations (1) and (2), where A represents the state transition matrix, H is the observation matrix, u k 1 represents the control parameters, and W and V represent the process noise and observation noise matrices, respectively.
x k = A x k 1 + B u k 1 + W k 1
y k = H x k + V k 1
Let W and V be Gaussian white noise with a mean value of 0, where Q and R, respectively, represent the covariance matrices of their respective distributions. In order to simplify the calculation, they are generally taken as constants. In the actual prediction process, since the true noise cannot be known, and there will be errors in the prediction and observation processes, there will also be errors between the final prediction results x k and the true values x k . Assuming that the error also obeys the normal distribution with mean 0 and covariance P k , and the resulting predicted covariance is P k , then the complete Kalman filter formula can be obtained as Equations (3)–(7).
x ^ k = A x ^ k 1
x ^ k = x ^ k + K k ( y k H x ^ k )
P k = A P k 1 A T + Q
K k = P k H T H P k + R
P k = ( I K k H ) P k
Equation (3) represents the a priori prediction output, and Equation (4) represents the posterior prediction output y k , modified using the observation results. K k represents the Kalman gain, I represents the identity matrix and uses Equations (5) to (7) to complete the state corresponding to the future moment k through iterative prediction and parameter update.

3. Methods

3.1. Method Overview

Our proposed HMMATrack for ball detection and tracking includes 3 sequentially executed modules, as shown in Figure 1: Heuristic Compound Sampling Strategy, MNet-based detection, Tracking of Multilevel Cooperative Matching, and automatic trajectory correction.

3.2. Heuristic Compound Sampling Strategy

For the small size of balls in sports video, if we simply increase the resolution of the input image to increase the pixel size of the soccer detection frame, it is feasible from a sampling point of view. However, the amount of calculation and memory usage will increase exponentially. Most pixels are invalid background areas. If we only use random sampling, the number of negative samples in the sample will be much larger than the positive. Because one ball is on the court at most and occupies a small proportion of the area, this creates a severe sample imbalance. Therefore, we apply a heuristic composite sampling strategy that can cope with small object sizes and imbalanced data samples. We perform difficult sample mining to improve ball detection and tracking capabilities in complex motion situations.

3.2.1. Tiling

Tiling [32] divides images with larger resolutions into smaller images by dividing them into multiple overlapping patches. The small patch generated by tiling sampling will be used as a new image without scaling. The relative size of the ball in the patch will be larger than that of the entire image after scaling, thereby reducing the difficulty of detection. In order to obtain the global features of the image, we will also use the original image as training data. The purpose of dividing patches with overlapping is to retain the objects at the boundaries of each patch and prevent the integrity of the patch edge objects from being lost due to cropping. Specifically, N represents the number of input frames, w and h represent frame width and height, and r w , r h represent the sampling reduction factor of w and h. The number of samples after tilling is N r w r h . The patch width w t i l i n g and height h t i l i n g obtained by sampling are calculated by Equations (8) and (9).
w t i l i n g = 4 w 3 r w + 1
h t i l i n g = 4 h 3 r h + 1

3.2.2. Heuristic Sampling

Cropping leads to many useless background patches due to the undersized balls. Patches containing balls are positive samples, whereas patches that do not contain balls are negative samples. The positive and negative samples will be seriously imbalanced. The number of ball samples of different shapes also shows a long-tailed distribution. Imbalanced morphological distribution will eventually reduce the model’s generalization ability in real detection scenarios. To tackle this dilemma, we proposed sampling positive and negative samples according to categories while mining complex samples. The Heuristic Compound Sampling Strategy covers different image granularities: patch-level and image-level.
Considering the balance of positive and negative samples, we adopted a heuristic rule to sample patches containing balls and patches with only background information. For the positive sample, assuming the coordinates of the center point of the true ball labeling box and the size, use Equations (10) to (11) to obtain the horizontal and vertical clipping offsets and Equations (12) and (13) to obtain the corresponding clipping boundaries. A ball patch can be obtained according to Equations (10) to (13). Repeating the above process can obtain a set of multiple positive samples. Negative sample sampling is from any part of the original image that does not include the ball.
o f f x = m a x ( 0 , r a n d o m ( w , p s i z e w ) )
o f f y = m a x ( 0 , r a n d o m ( h , p s i z e h ) )
b o r d e r x = [ m a x ( 0 , x 0 o f f x ) , m a x ( 0 , x 0 o f f x ) + p s i z e ]
b o r d e r y = [ m a x ( 0 , y 0 o f f y ) , m a x ( 0 , y 0 o f f y ) + p s i z e ]
where w and h represent the width and height of the original image, p s i z e represents patch size, and x 0 and y 0 represent the center point of the object box.

3.2.3. Hard Sample Mining

We classify sports video images into two types, easy and difficult, according to the complexity of the sports competition scene. Simple refers to a clear boundary between the ball and the background, which can be easily distinguished and has the least classification difficulty, as Figure 2a shows. Difficulties include different factors such as occlusion, motion blur, and background blending. Occlusion means that part of the ball is covered by the player, but the complete position of the ball can still be inferred based on the remaining part, as shown in Figure 2b. Motion blur refers to the fact that when the ball is moving at high speed, and due to shooting reasons, the ball has a relatively long shadow, no obvious boundaries, and the most severe deformation, as shown in Figure 2c. Background integration means that the ball is completely integrated into a similar background, such as billboards, auditoriums, etc., as shown in Figure 2d. This article uses simple samples as the benchmark when constructing the training data set. For each difficult situation, resampling is performed according to the resampling factor. The samples marked as difficult are repeated multiple times to form a new training fine-tuning data set. In this way, we perform difficult sample mining to improve ball detection capabilities in complex motion situations.

3.3. Detection Based on MNet

3.3.1. CenterNet

CenterNet [22] is a single-stage detection model without anchor boxes, which we use as the base detection model. In CenterNet, an input RGB image I R H × W × 3 is passed through the feature extraction network backbone to obtain the feature map A R H r × W r × 3 , where r is the downsampling multiple of the feature map relative to the input, which is generally determined by the backbone. For example, in the VGG, the feature output from the image input to the final stage will be downsampled 5 times, while in the ResNet [33], it will be downsampled 4 times. The shared feature map will be processed by different branches to obtain the corresponding key point heat map, position offset, and size (width and height). The heatmap h e a t m a p R H r × W r × C represents the confidence prediction of the object’s potential location, C represents the total number of categories to be detected, and the value at each position represents the probability score of the object there. The center point position offset o f f s e t R H r × W r × 2 represents the deviation between the predicted position and the real position when a key point in the heatmap is mapped back to the input. This deviation is caused by rounding the key point position after downsampling and is optional. The size w h R H r × W r × 2 represents the width and height of the object pointed to by each point in the heat map. During training, it is necessary to create a corresponding object label for each sample according to the central point confidence h e a t m a p , o f f s e t , and w and h according to the output dimensions.
The advantage of CenterNet is that it is simple and efficient and has excellent detection performance on large and medium objects in general data sets. However, its limitation is that it is not fully designed for small object detection and cannot effectively retain the feature information of small objects. In addition, sports tasks in specific competition field scenarios are also temporarily unavailable. We combined small object detection and improved the result from the perspective of multiscale feature extraction to enhance the small object detection capability of moving videos.

3.3.2. MNet

Balls in sports videos are small objects. The backbone network for small object feature extraction needs to consider multiple aspects, such as the amount of calculation, the receptive field, and the abstraction level of the features. The feature level continues to become abstract as the network deepens, and the receptive field will also become larger with convolution and pooling. However, as the amount of calculation continues to increase, the spatial location information is weakened. During the convolution operation, a certain level of features often only uses the same specification of convolution, and the capture of local context semantics is relatively weak. Therefore, multiple groups of parallel convolutions are used to capture the local semantics in different areas, and then mutual fusion forms a richer comprehensive semantics. To sum up, we redesigned the multiscale feature enhancement backbone network (MNet) from the perspectives of multiscale feature fusion, context learning, and integration. Its core modules are the MC Block and Upsample Block. The improved backbone network structure is shown in Figure 3.
Multiscale feature enhancement and local contextual feature fusion block (MC Block) is the feature extraction module in the backbone network of this chapter, which can increase the receptive field and complete local context fusion. As shown in Figure 3b, the MC Block first uses a down sampling convolution to reduce the size of the feature map to reduce the amount of calculation, and then we use a set of dilated [34] convolutions with expansion rates of 1 with different steps s { 1 , 2 , 3 , 4 } to process feature map. The convolution of each branch can be regarded as focusing on the local feature map of different area sizes. Among them, the stride s = 1 convolution is the basic branch, and the s > 1 branch is the enhancement branch. To facilitate concatenation, we establish corresponding padding values across distinct branches. Subsequently, we concatenate the feature maps generated by multiple branches that possess identical dimensions. The concatenation of multiple branches can be regarded as the fusion of local contexts of different scales. Since we use dilated convolution, the model does not bring additional weight parameters while increasing the receptive field, so the backbone network will become relatively lightweight. After the features of multiple branches are spliced, convolution is used to reduce the dimensionality, and then residual connections are performed in the form of residual blocks in ResNet. Note that when the downsampling part and enhancement branch are removed, the MC Block degenerates into the classic residual block structure. The upsampling module restores the feature map to its original resolution size. We use a simple bilinear interpolation method to increase the resolution and then use a convolution with a stride of 1 to add details.
Figure 3. The architecture of MNet. (a) MNet. The input image shape is 256 × 256 × 3. After 3 MC downsampling blocks, the feature map size is 32 × 32 × 256, and then it is restored to 256 × 256 × 3 after 3 Up Blocks. (b) MC block contains 4 groups of different scale feature extraction branches. The output features of each branch are concatenated and then residual connections are performed. (c) Up block uses bilinear interpolation to complete upsampling.
Applsci 14 01376 g003
The improved backbone network focuses on the detection of small objects. Compared with other backbone networks, there are fewer downsampling steps. Therefore, with the same input size, MNet has the largest output space size, which brings a certain performance improvement. Secondly, MNet uses dilated convolution to balance the network depth and receptive field and limit the scale of model parameters.

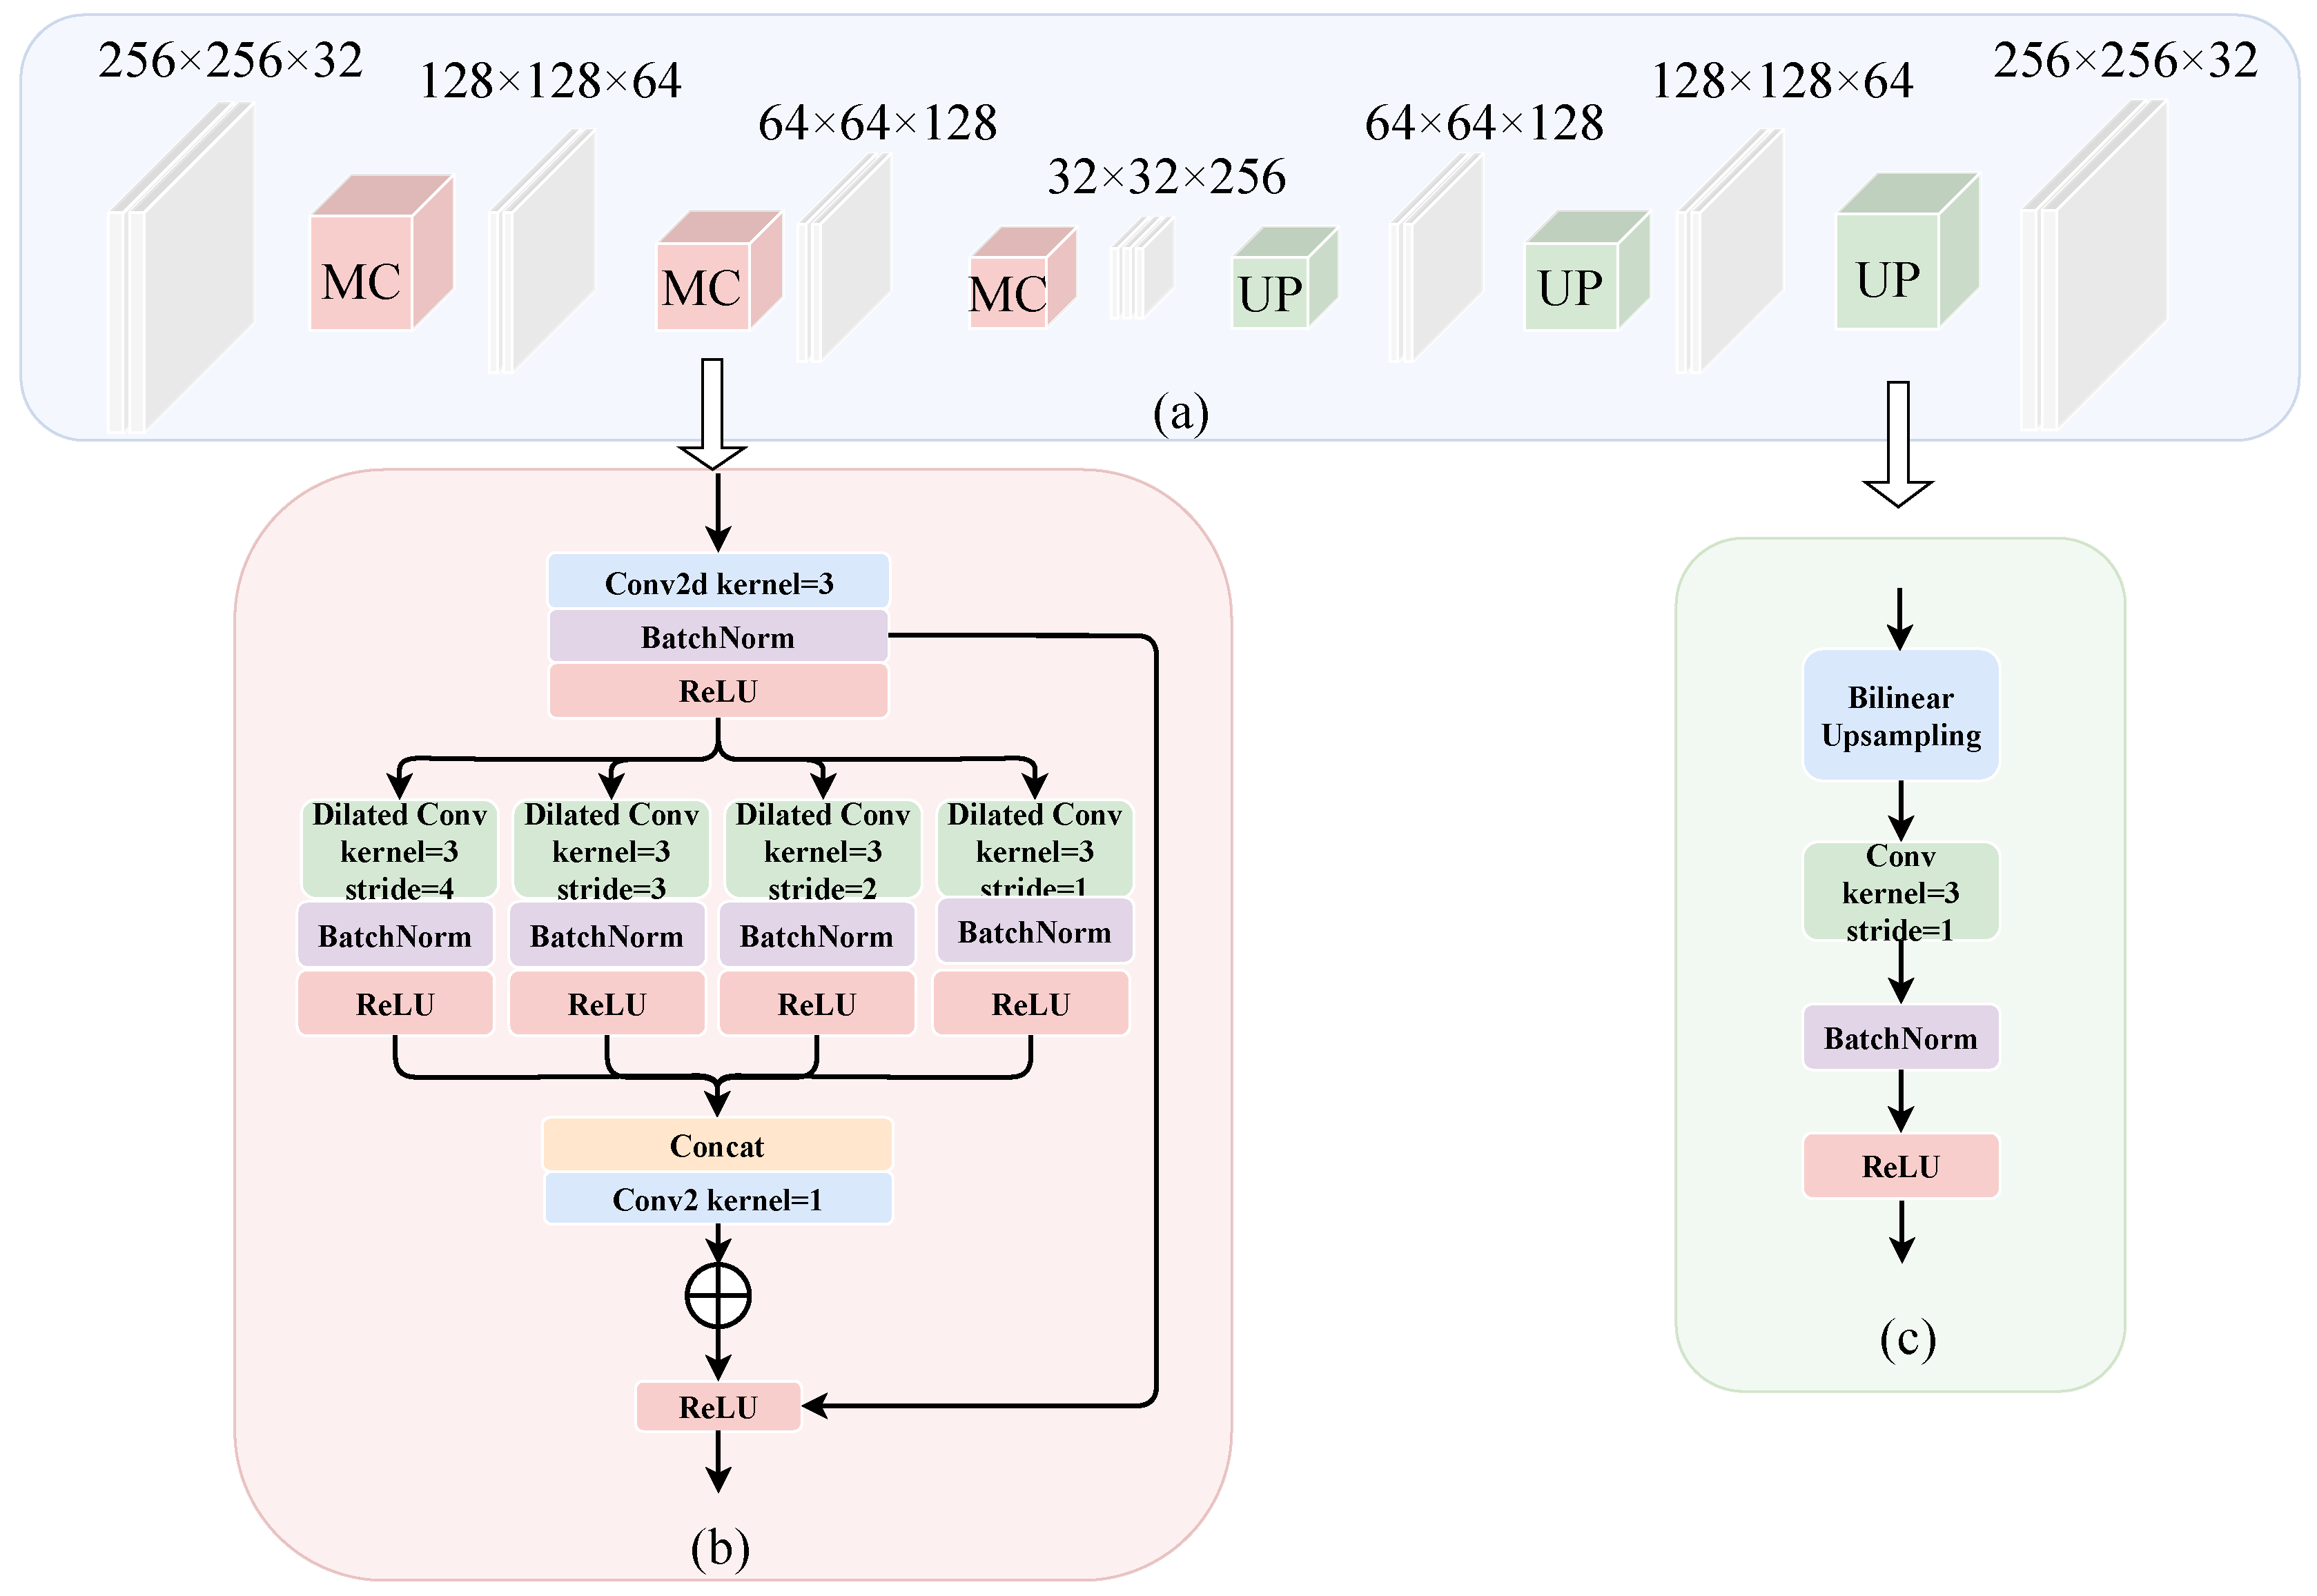
3.3.3. Detection Module

Ball detection has a priori characteristics. In general, it can be considered that in a sports match, the number of balls in each frame does not exceed 1. Under this simple assumption, this article converts global detection into regional detection, that is, it first determines the original image area RoI (Region of Interest, RoI) [35] where the ball may appear and then performs conventional detection tasks on this RoI to output soccer. The precise detection frame is similar but not identical to RPN. In order to enhance the detection accuracy of soccer and reduce the computational cost, based on the basic structure of CenterNet, the heuristic composite sampling strategy and multiscale-enhanced backbone network mentioned above are used to improve it into a new ball detection model with a foreground and background classifier. Specifically, for the complete input image, the local area patch needs to be cut out through the heuristic composite sampling strategy mentioned above. Each patch contains a label, whether it belongs to the background or the foreground. That is, it contains a ball or does not contain a ball. Each patch needs to extract features through the MNet we proposed and then output the center point prediction, detection frame size prediction, and classifier prediction.
p is the true position of a certain object key point in the picture, and c is the category. p ^ = p r is the position on the low-resolution image corresponding to p, then Equation (14) is the heat map estimate of category c.
Y x y c = e x p ( ( x p ^ x ) 2 + ( y p ^ y ) 2 2 σ p 2 )
where σ p represents the standard deviation appropriate to the object size. If the radius of the label area formed by the two objects overlaps, the overlapping area will take the maximum value. The objective function during training is Focal Loss, which is the logistic regression function at the pixel level shown as Equation (15).
L k = 1 N ( 1 Y ^ x y c ) α l o g ( Y ^ x y c ) , i f Y x y c = 1 ( 1 Y x y c ) β ( Y ^ x y c ) α l o g ( 1 Y ^ x y c ) , o t h e r w i s e
where α and β are the hyperparameters when training according to the Focal Loss set in CornerNet, and N is the total number of samples that control the loss normalization of all positive samples. For each real object frame k and its boundary position data, its real size can be obtained by S k = ( x 2 ( k ) x 1 ( k ) , y 2 ( k ) y 1 ( k ) ) , so the width and height size output of the object can still be trained through L1 loss, shown as Equation (16).
L s i z e = 1 N k 1 N | S ^ p k S k |
The improved predictor we proposed uses r = 1 equal resolution processing in ball detection, and its advantage is that it can remove the prediction of the center point offset. At the same time, a classifier is added to determine whether the current Patch contains a ball. Finally, each Patch will get a 0 < y ^ < 1 probability output to indicate whether other predictions corresponding to the current Patch are valid. For foreground or background classification problems, the cross-entropy function can be used as the objective function for classifier prediction. Assuming that the true label corresponding to the i-th patch is y i { 0 , 1 } , the corresponding loss of the training set containing a total of N patch samples is shown in Equation (17).
L c o n f = 1 N i = 1 N y i l o g ( y ^ i ) + ( 1 y i ) l o g ( 1 y ^ i )
Equation (18) is the final ball detection loss.
L d e t = L k + λ s i z e L s i z e + λ c o n f L c o n f
where λ s i z e and λ c o n f are the balance factors. λ s i z e will always be set to 0.1 and λ c o n f set to 1. In the prediction stage, the entire image is first cropped into multiple overlapping patches. After each patch passes the detection model, a prediction set of classification, center point, and size will be obtained. Find the corresponding center point coordinates and size based on the index corresponding to the patch with the highest classification prediction probability, and then add the center point coordinates to the offset during tiling to obtain the ball detection frame relative to the entire image.

3.4. Ball Tracking

We divide the ball-tracking process into two stages: multilevel collaborative matching and automatic trajectory correction. In the multilevel collaborative matching stage, the simplified multiobject tracking method and rule matching are mainly used to generate the ball motion trajectory online. In the automatic trajectory correction stage, the trajectory generated by multilevel collaborative matching is automatically corrected mainly through a simple linear motion model, and the tracking accuracy is increased in the form of batch processing.

3.4.1. Multilevel Cooperative Matching

Kalman filter matching. Use the latest box of the existing trajectory and Kalman filter to estimate the position of the next box; calculate the distance between the selected box and the estimated box in turn. According to the ball detection algorithm described above, multiple detection results can be obtained in the form of tiling in the image. Assume that each detection result object is D i , and a capacity of M can be maintained based on the confidence score of each detection. A small root heap is used to construct a candidate set D that needs to be searched for potential detection objects as a continuation trajectory. The Kalman filter matching branch is the preferred method in the multilevel collaborative trajectory matching stage, that is, the appropriate observation object is first selected in the form of distance calculation and matching in D as the output of the Kalman filter matching process. Different from the classic object tracking algorithm [30], in the process of calculating the distance, the original IoU distance is replaced by the distance between the center points of the detection objects. Assume that the trajectory frame at time k 1 in the current trajectory is T k 1 , calculate the distance between each candidate detection D i and the estimated value T k at the time of k by Equation (19).
d ( i , k ) ( 1 ) = α + tanh ( λ D i T k ) + β
where α and β are balance factors, with a value of 0.5, and λ is a scaling factor, with a value of 0.02.
Linear motion matching. Based on the assumption that the ball moves in a straight line at a uniform speed, linear screening selects new candidate detections from D by judging whether the object at different times complies with simple linear motion. Considering that different videos may have different frame rates, and even the movement speed of the ball at different times in the same video is very different, the linear model only considers the latest trajectory results k 1 moments and the current detection D i to be filtered. Assuming that the latest tracking T k 1 in the trajectory is valid, the rate is v k 1 , and its position is S k 1 , then the current i-th detection is based on a simple linear model. The prediction of the location can be expressed as Equation (20).
S k = S k 1 + v k 1 + δ
Equation (20) needs to always calculate the speed corresponding to the last valid detection. This process can also be simplified according to the characteristics of the ball scene, that is, ignoring the motion direction information, calculating the speed of each valid detection in the sum D Distance, and finding the one with the minimum distance; if it is less than the threshold, it can be used as a new detection to continue the trajectory, then add the trajectory result set and update to end the linear filtering process. δ is the fluctuation bias constant, which generally takes the side length of the last detected ball boundary box. If the position of the candidate detection D i is S i , then the linear motion matching distance is shown in Equation (21).
d ( i , k ) ( 2 ) = S k S i 2
Appearance features match. Feature matching uses the appearance features of the ball set in advance to match the most likely detection in D after both Kalman filtering and linear motion matching fail or multiple detection frames are matched. By constructing the appearance feature set of the ball in advance, the single confidence level in the detection model is supplemented by calculating the degree to which the new detection matches the extracted features, thereby reducing the probability of false detection in the detection set. Considering computational efficiency and performance, this paper uses the method of manually constructing a ball HOG feature [36] library as a feature basis to calculate the matching degree of ball appearance features. First, in the training data set, soccer, basketball, and volleyball balls were intercepted in different motion states, i.e., ball instance, then the HOG features of each ball sample were extracted to construct the matrix h l , and then the same method was used to calculate the HOG feature h i of each candidate detection. Equation (22) indicates that at this time, the candidate detection that has the minimum average distance and meets the threshold can be used as the final matching detection.
d ( i , l ) ( 3 ) = m i n { 1 N h i h l }
The pseudocode of multilevel collaborative matching is shown as Algorithm 1.
Algorithm 1 Multilevel Cooperative Matching
Require: Detection indices D = { D 1 , , D i , , D M } , Track indices T = { T 1 , , T k 1 }
Ensure: New track T
1:Initialization set of matches M
2:Initialization set of unmatched detections U D
3:for  D i in D  do
4:    Compute KF matching distance d ( 1 ) ( i , k )
5:    Compute LM matching distance d ( 2 ) ( i , k )
6:    if  d ( 1 ) ( i , k ) > t ( 1 ) and d ( 2 ) ( i , k ) > t ( 2 )  then
7:         M D i
8:    end if
9:end for
10:for  D i in M  do
11:    Compute the minimize AF matching distance d ( 3 ) ( i , l )
12:     T k = D i
13:     T T k
14:end for
15:return  T

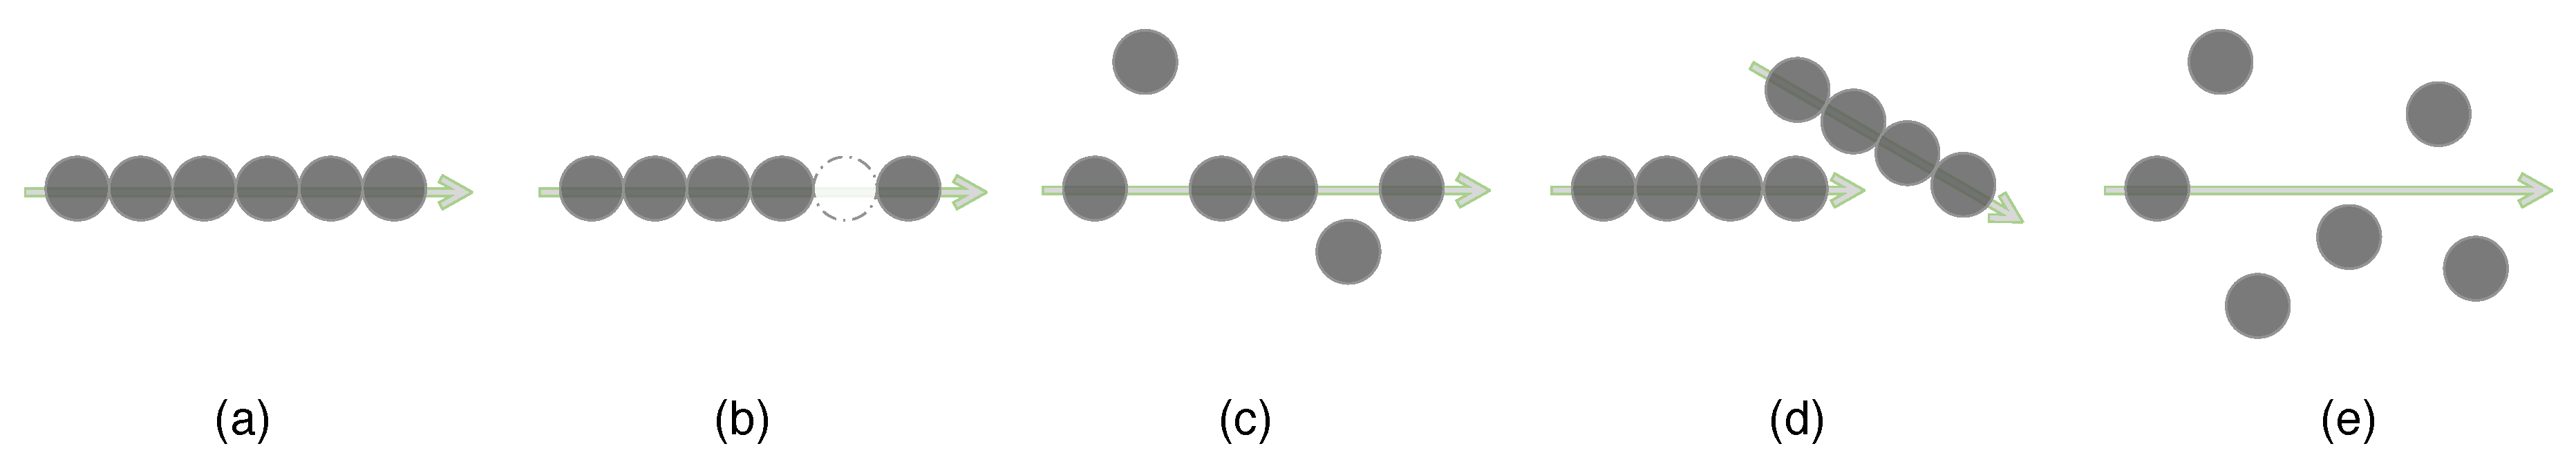
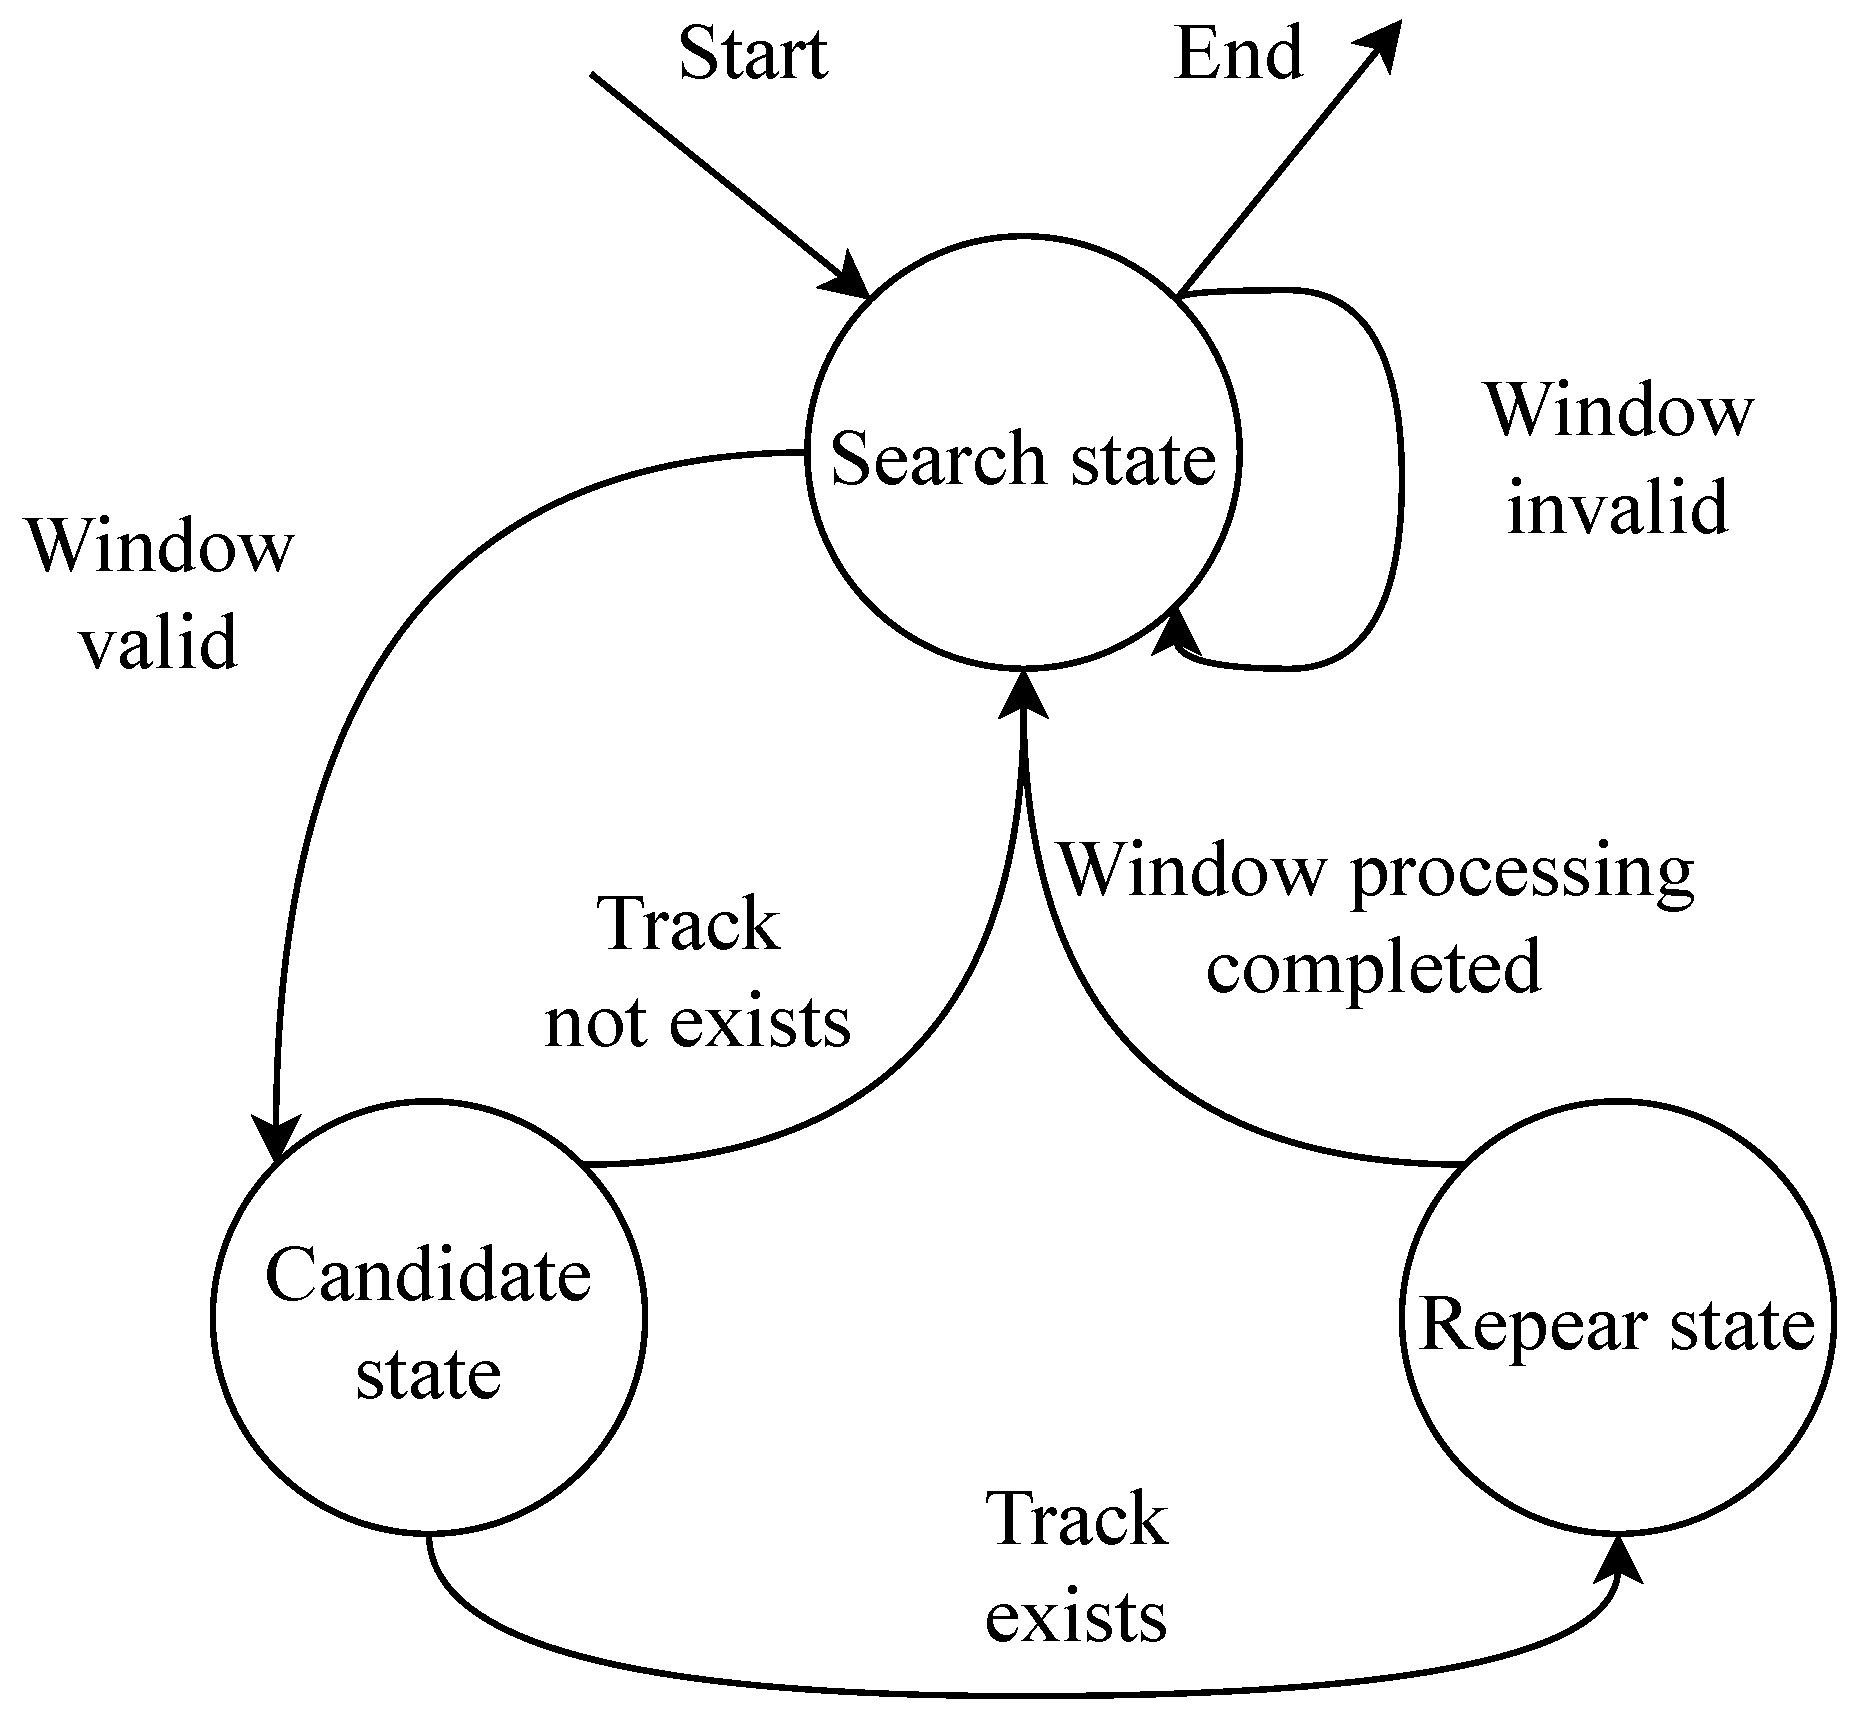
3.4.2. Automatic Trajectory Correction

Automatic trajectory correction aims to provide a more stable tracking trajectory in an online and lower-cost form, and it always tends to retain more detection to form a longer trajectory. Multilevel collaborative matching processing can produce sufficiently accurate ball-tracking trajectories when the accuracy of ball detection is relatively high. However, in most cases, due to complex sports scenes, the results of ball detection are not reliable enough, so additional processing is required. Automatic trajectory correction improves the accuracy of the trajectory, thereby enhancing the performance of motion behavior analysis.
Trajectory analysis. There are several forms that a trajectory segment that has not undergone automatic trajectory correction may be in. Among them, Figure 4a represents a complete and smooth trajectory, which is the ideal state. At this time, each detection represents the state of the ball at a certain moment to the greatest extent possible. No correction processing is required. Figure 4b represents that part of the detection is missing in a section of the trajectory, causing the trajectory to be interrupted. For example, the ball is blocked by a player. In this case, only interpolation is needed based on the position of the missing frame. Figure 4c represents a small amount of misdetection in a section of the trajectory, but it does not affect the main body of the movement trajectory. This kind of situation often occurs when the image quality is poor, and the player part is extremely similar to the ball. In view of this, such situations need to be corrected based on the before and after detection results of false detection. Figure 4d represents a relatively drastic change in the spatial position of the ball during this time period, resulting in two far-apart trajectory segments. The possible reason is that the ball flew out of the screen at this time or the camera switched. For this kind of situation, you only need to handle the boundary between the two fragments before and after. Figure 4e represents the extreme case of case Figure 4c. When there are no balls in the picture for a long time, a large number of false detections cause the trajectory segments to become very messy, and any subset composed of detection cannot meet the requirements of forming a smooth trajectory, i.e., a minimum threshold, so these illegal detections need to be discarded until new trajectory segments appear.
Trajectory correction algorithm. Automatic trajectory correction adopts the idea of sliding windows and the form of a finite state machine (FSM) [37] to handle the above situations automatically. Finite state machines can be divided into three states, showed as Figure 5. The search state is used to find the left boundary of a suitable sliding window. If found, a sliding window can be constructed and entered into the candidate state for verification processing. Otherwise, the left pointer will be moved until it is found or reaches the end. The candidate state is to check whether the detection set in the current window can extend the ball trajectory. Trajectory fragments may both extend the old trajectory and serve as a new beginning. Extending the old trajectory as much as possible can reduce the number of trajectory segments and improve the overall stability of tracking. The repair state is to repair the deviation detection in the window according to the simple linear motion model or to interpolate the missing detection to improve the tracking accuracy as much as possible.
Candidate states look for the most promising detection within the window. Use Equation (21) to determine whether detection i and detection j satisfy a linear relationship. If satisfied, they will vote against each other, and the detection with the most votes in the final window and exceeding a certain proportion threshold will be elected as the anchor detection to be used to repair the status benchmark. If no detection is selected, discard the detection if the detection on the left side of the window has not been repaired, and move the window one step forward to search for anchor detection in the new window. If the detection on the left has been repaired, then only move the window.
The repair state first calculates the distance between each detection and the anchor detection. If the simple linear motion model is satisfied, it is marked as repaired. If the current detection is an invalid detection, the two detections closest in time to the detection are used for interpolation. When there are no such two detections, the position is interpolated using Equation (21), and the frame number difference between the current detection and the anchor detection is marked as repaired. Similarly, if the current detection is not satisfied, you only need to use Equation (21) to recalculate and replace. When all detections are in the repair state, move the window pointer forward by at least a distance greater than half the window capacity.

4. Experiments

4.1. Data Set and Evaluation

4.1.1. SportsTrack

There is currently no public sports competition broadcast video data set, including basketball, soccer, or volleyball, that specifically contains object ball detection and tracking. We used a small-scale manual annotation method to build a relatively high-quality object tracking data set containing soccer, basketball, and volleyball competition broadcast videos as a supplement to the research data. The self-built data set is named SportsTrack. The competition videos used for annotation are all from professional public competition broadcast videos. On the premise of complying with the rules of video use and dissemination, 4K ultra-high-definition soccer competition videos and 1080 p high-definition basketball and volleyball competition videos were selected and downloaded as source videos. Several clips from long-range shots were intercepted from the original video; each clip was no longer than 15 s, and the complex conditions of detection and tracking were fully taken into account to increase the difficulty of the task and finally formed a video with multiple resolutions and high image quality, creating a relatively high-precision ball object tracking data set covering three sports scenes: soccer, basketball, and volleyball. It can be used for the detection and tracking tasks of soccer, basketball, and volleyball at the same time. The relevant parameter information of the self-built data set SportsTrack is shown in Table 1. Soccer has a corresponding 4K version, and basketball and volleyball have corresponding 1080 p versions.
Compared with other sports-related tracking data sets, our self-built data set SportsTrack has the following three advantages:
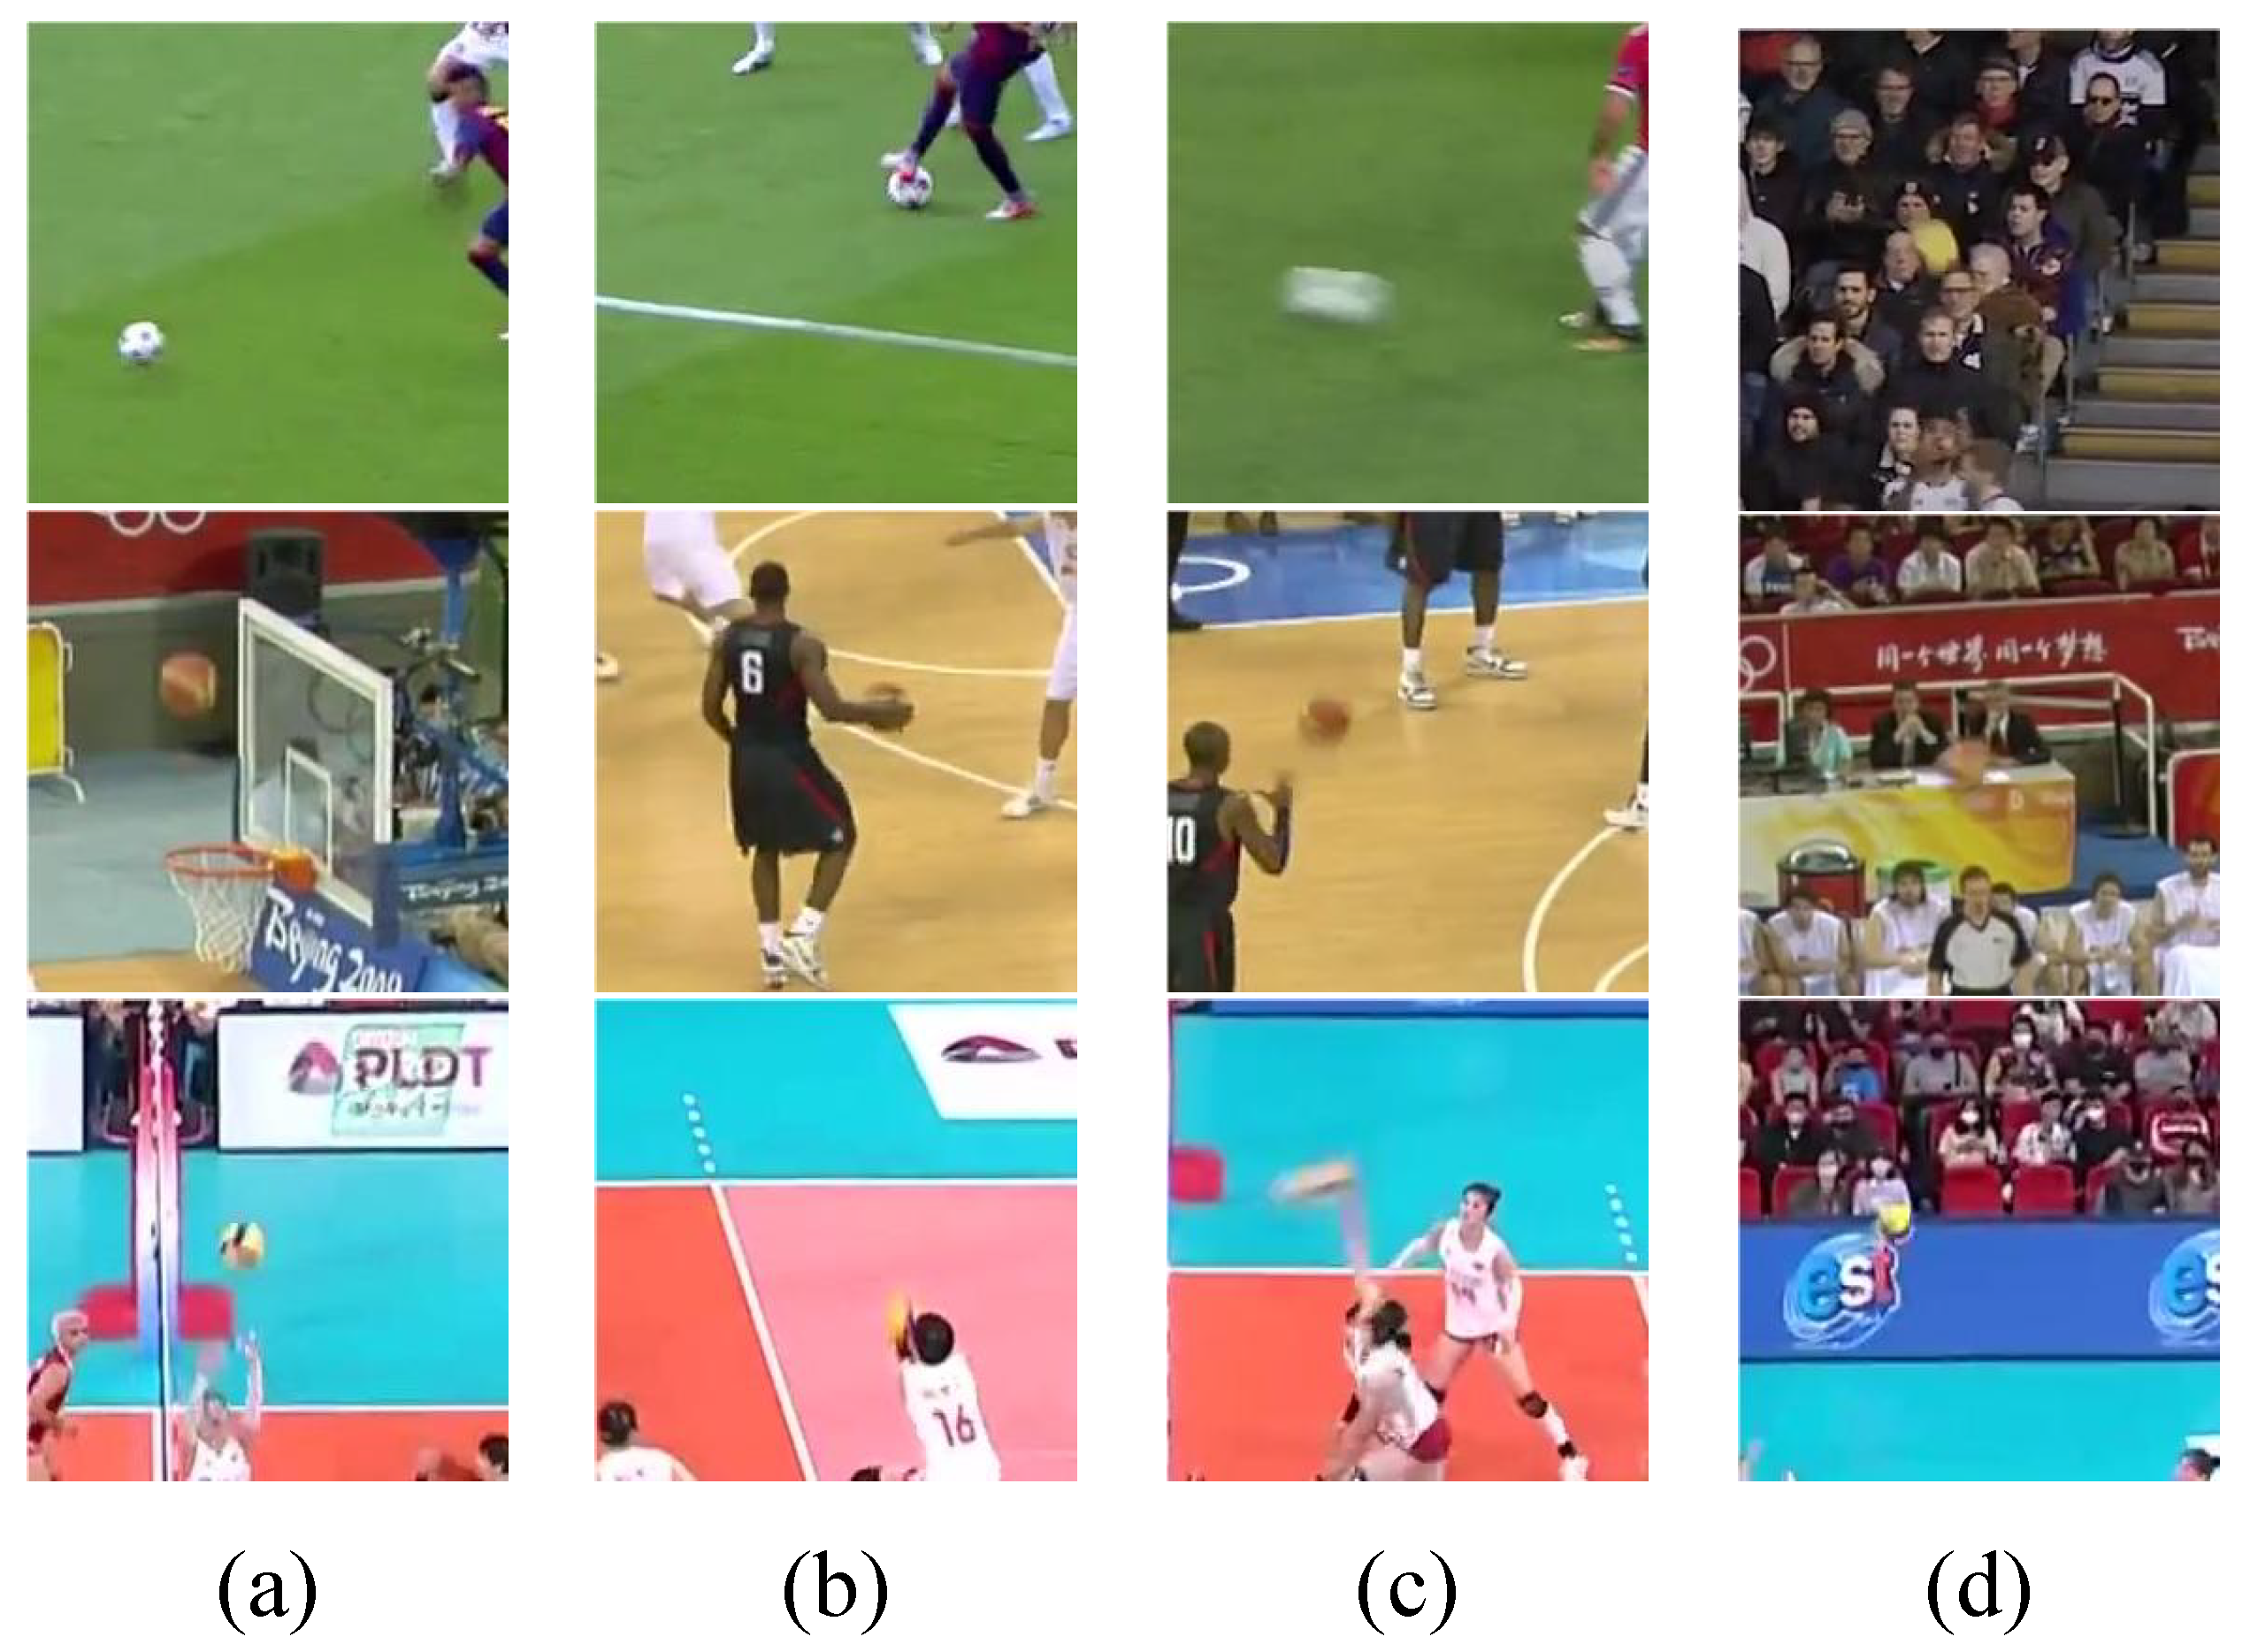
  • Contains multiple types of resolutions and higher resolutions. Soccer videos have larger stadiums, farther objects from the shooting camera, and smaller objects. The resolution of the collected competition broadcast videos reaches 4K, which can provide richer detailed information;
  • Covers multiple complex sports scenes. Our data set contains three important team ball sports: soccer, basketball, and volleyball. Compared with other previous object tracking data set scenarios, the movement form and background information of the object in the video are more complex;
  • The annotation information comes from manual annotation and has undergone secondary manual quality inspection, so the annotation accuracy is high.

4.1.2. Data Partition

In the detection model training, we adopt the joint data set training mode and use the public SoccerDB [38], APIDIS [39], and VolleyballVision [40] data sets as auxiliary training. SoccerDB [38] is a comprehensive soccer scene data set proposed by Xinhua Zhiyun that can be used for various tasks such as object detection, action recognition, temporal segmentation, and highlight detection [5]. The images used for the soccer detection task are crawled from the Internet or sampled from competition videos. There are 45,732 frames of images belonging to the competition videos. In order to ensure the efficiency of training and the relative balance of sample distribution, SoccerDB is eliminated during training. There are no objects or samples containing sparse objects, and there are 40,615 frames of images used for training after screening. The advantage of SoccerDB is that it is large in scale and includes the detection and annotation of soccer balls, players, and goals. However, the disadvantage is that all annotation data are generated by detectors rather than manual annotations, resulting in a large number of annotation errors. In addition, the image quality is relatively poor. APIDIS [39] is a basketball scene data set provided by the UCLouvain image and signal processing team of ICTEAM in Belgium that can be used for event detection, object detection, and tracking. The video sequences in the data set come from the European APIDIS project. The data set used for the available basketball tracking task contains 12,907 frames with a video resolution of 1600 × 1200. The advantage of the APIDIS data set is that the data set annotations are all manual annotations and are relatively accurate. The disadvantage is that all video clips come from the same basketball competition, and the scene is relatively singular. VolleyballVision [40] is a volleyball detection data set provided by the Roboflow computer vision platform and Dong-A University. The images used to detect come from public images on the Internet. There are 25,239 images containing volleyball, 17,679 training sets, 2539 test set images, and 5021 verification set images. Annotation information is provided, but the verification set image is the source. The images in the training set and test set were processed, so we only selected a total of 20,218 images in the training set and test set in the original VolleyballVision as the volleyball detection auxiliary training set. The advantage of VolleyballVision is that it is large in scale, including indoor, outdoor, hard volleyball, air volleyball, beach volleyball, and other scenes. The disadvantage is that all images are single images and not derived from video sequences. There is no continuity or correlation between the images in the data set, and it can only be used for volleyball detection tasks without tracking annotations.
The division of the joint training set and test set used for detection is shown in Table 2. In addition, this paper also randomly divides 25% of the entire set as a detection training set for model search and ablation experiments, while the test set remains unchanged.

4.1.3. Evaluation

To evaluate the tracking performance of balls, these benchmarks adopt commonly used evaluation metrics for single-object tracking: precision, P, normalized precision, P N o r m , and area under the success curve, AUC.

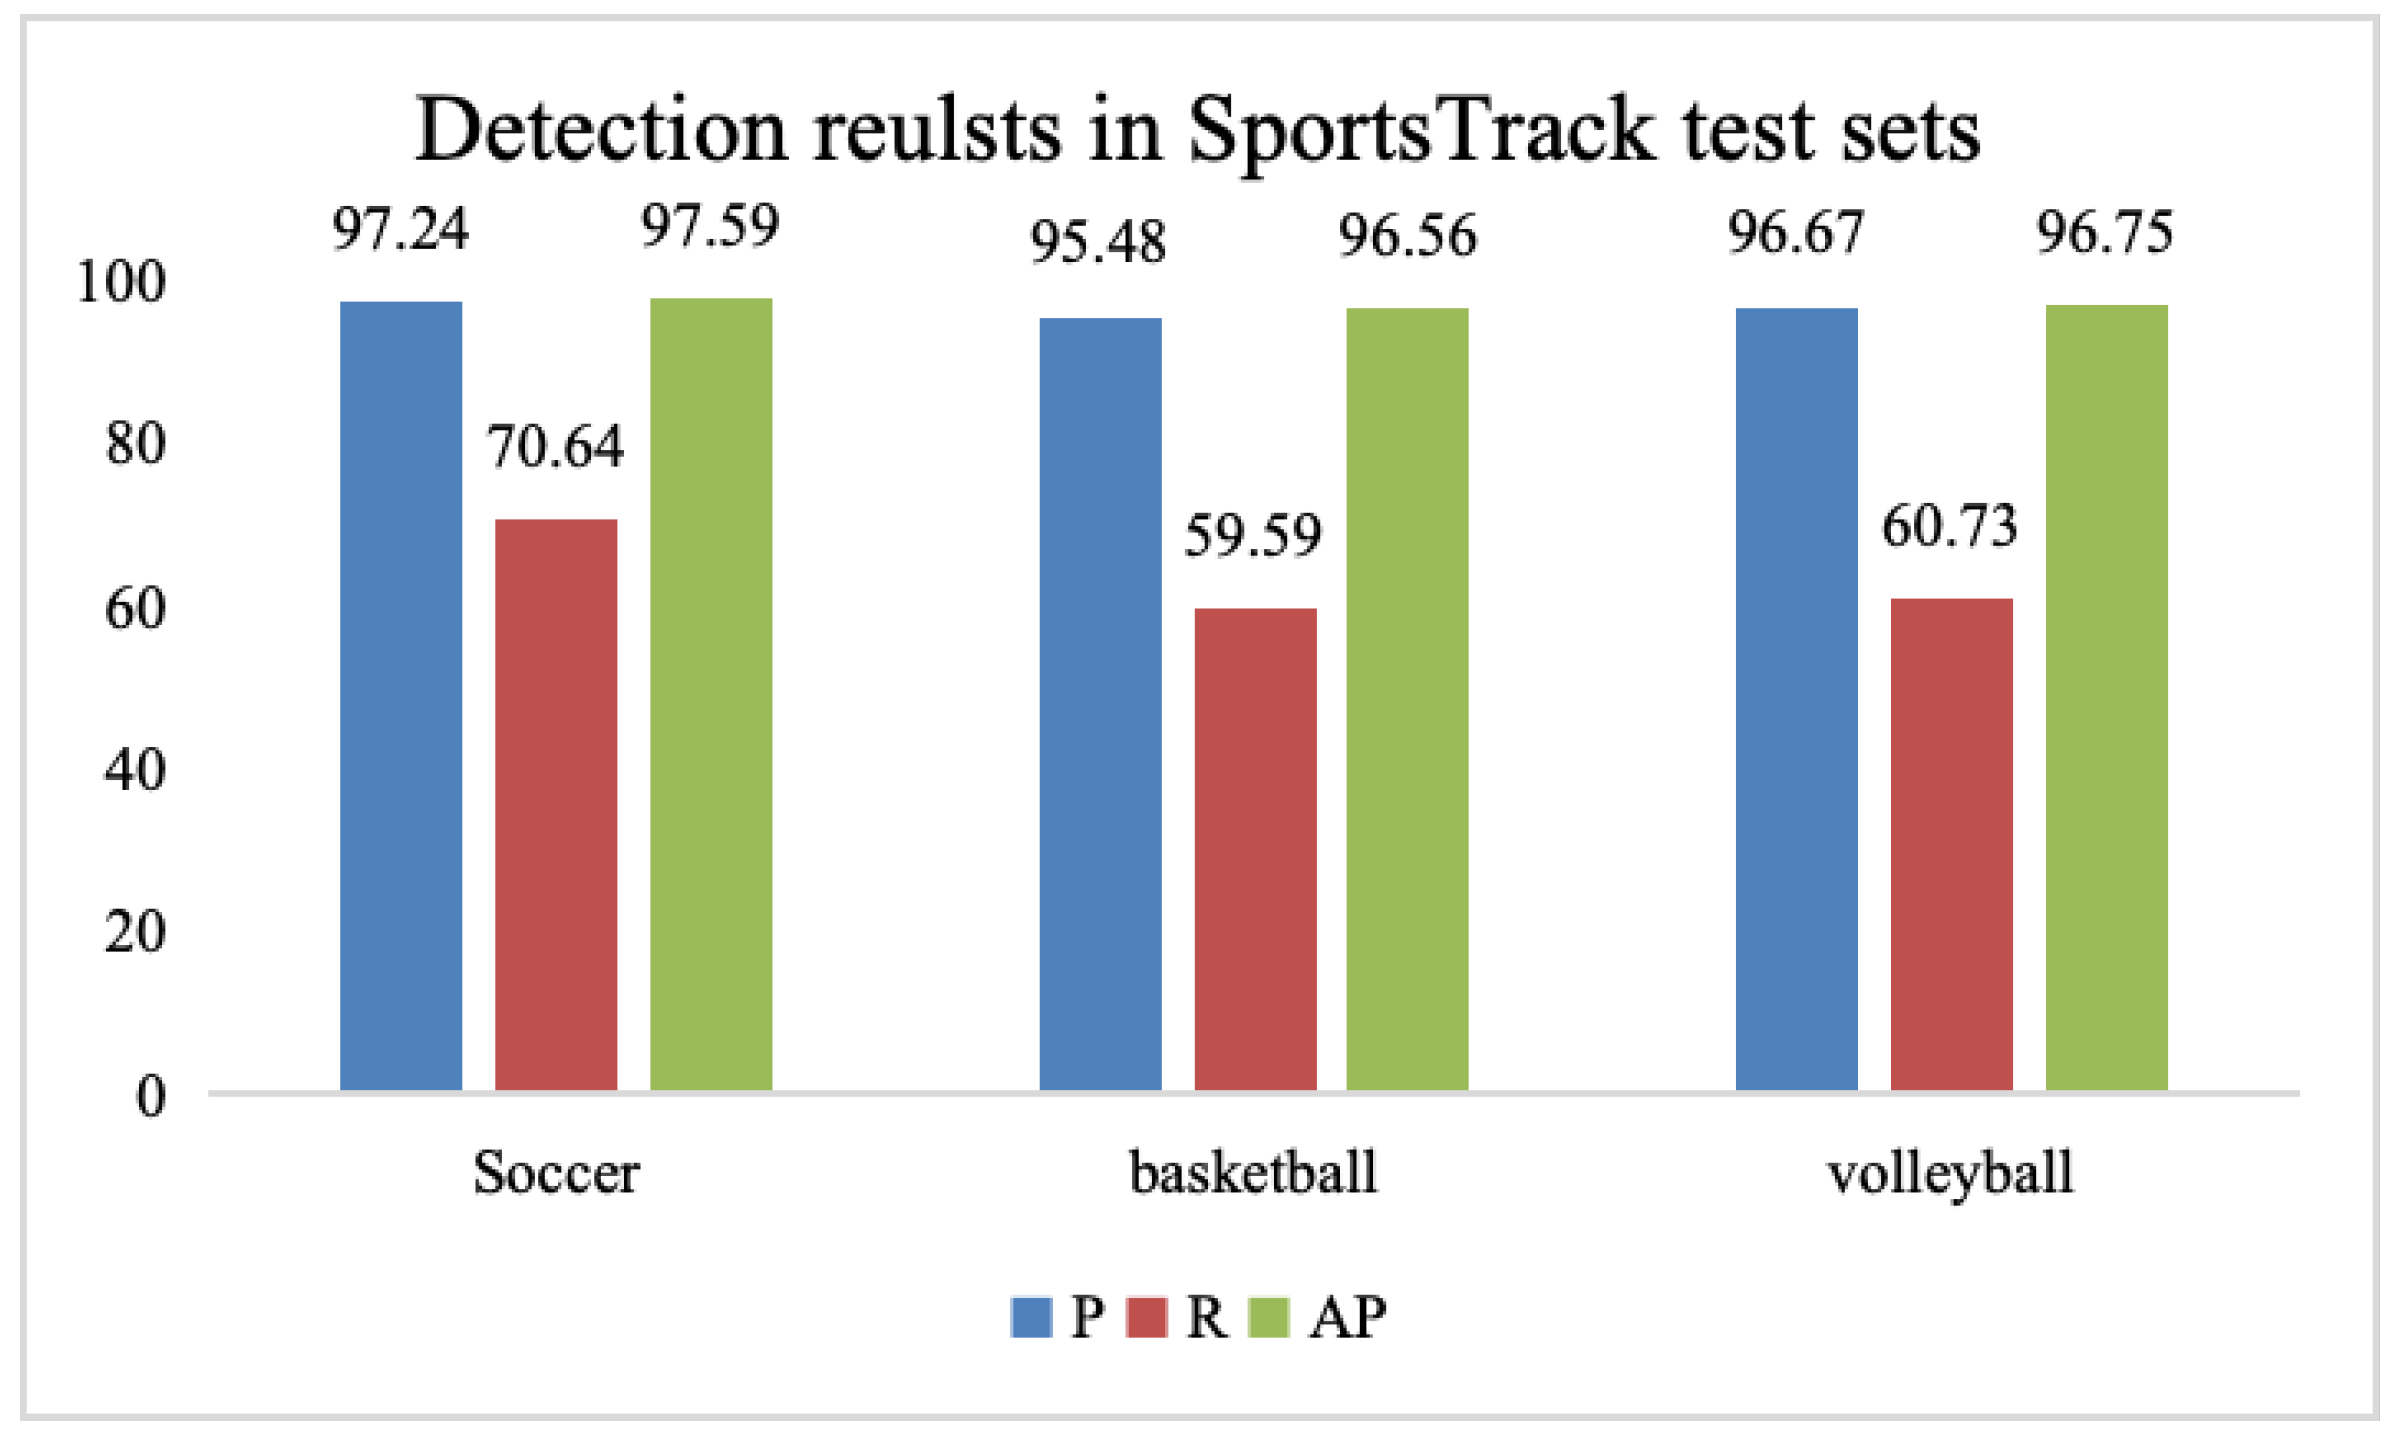
4.2. Performance Comparison with Other Ball-Tracking Methods

In order to fully evaluate the effectiveness and advancement of our proposed method, we selected six of the currently best-performing single-object tracking methods and open-source ball-tracking methods in the comparative experimental evaluation of ball-tracking results, including UNINEXT [41], OSTrack [42], STACK [43], Deepsport [44], VolleyVision [45], and EKF [8]. UNINEXT reformulates diverse instance perception tasks into a unified object discovery and retrieval paradigm and can flexibly perceive different types of objects by simply changing the input prompts. OSTrack unifies feature learning and relationship modeling by connecting template search image pairs with bidirectional information flow. Through mutual guidance, discriminative object-oriented features can be dynamically extracted. In the in-network candidate early elimination module, a strong similarity prior to calculation in a single-stream framework is added, which can significantly improve the reasoning efficiency. STACK transforms object tracking into a direct bounding box prediction problem and predicts it through an encoder–decoder transformer structure. The encoder models the global spatiotemporal feature dependencies between the object object and the search region, while the decoder learns a query embedding to predict the spatial location of the object object. Deepsport proposes to solve the task of diameter, localization, and confidence of a basketball obtained from a calibrated monocular camera by estimating information about the basketball’s diameter in pixels and the true ball’s diameter in meters. VolleyVision combines the YOLO detection model and the DaSiamRPN single-object tracking method to form a volleyball tracking system that can quickly and efficiently locate and track volleyballs in videos. EKF reduces the missed ball rate by determining the candidate position of the soccer ball instead of trying to identify the soccer ball’s position, calculating the distance between the soccer ball and the candidate soccer ball, removing incorrect soccer candidate positions through a threshold, and finally estimating the ball’s position through the extended Kalman filter’s location.
Table 3 lists the results of our proposed method and other methods on the tracking result indicators AUC, P, and P N o r m on the SportsTrack test set. As can be seen from the table, the method we proposed has the best overall tracking effect in soccer, basketball, and volleyball. It can be seen from the comparison results that on P N o r m , our method has achieved the highest results in three types of balls (soccer, basketball, and volleyball), which are 87.9%, 84.7%, and 84.6%, respectively. In terms of AUC, our method is more than 2.9% higher than other comparison methods on the basketball test set; it is more than 4.4% higher than other methods on the volleyball test set. On P, our method is more than 6% higher than other methods on the basketball test set; it is more than 3.7% higher than other methods on the volleyball test set. FPS is the abbreviation of frame per second, which represents the average inference speed of the model. In our model, the detection algorithm, trajectory matching algorithm, and trajectory correction algorithm are processed in stages. The FPS of our model in Table 3 is the overall processing speed calculated by adding the processing times of the three stages. Therefore, the overall processing speed of our model is slower compared with other SOTA comparison methods. Nonetheless, the speed of our tracking method, 28.2, is close to real-time processing standard (FPS = 30) and can be adapted to ball tracking in sports broadcast videos.
To evaluate the overall performance of the proposed HMMATrack, we analyzed the detection results, as shown in Figure 6. Among them, P represents the detection precision, R represents the recall rate, and AP represents the average precision of IoU = 50, and the threshold is set to 0.3. As can be seen from the figure, our detection algorithm exhibits higher accuracy; however, its complete recall is relatively low, indicating that there is a large number of undetected instances in the algorithm. The framework we adopt belongs to the detection-based tracking category, which may explain the insufficient tracking performance. Going forward, our focus will be on improving the recall of our detection algorithms.
Figure 7 shows the advantages of our method for ball tracking in the presence of occlusion, motion blur, and blend in the background. Figure 7 shows an example of tracking results comparing our method with other methods. We selected three situations with tracking difficulties: occlusion, motion blur, and background blending. In frames 29 to 36 of the fourth clip of SportsTrack’s basketball test set, the player’s hands obscured the basketball. (a) and (b) in Figure 7 are screenshots of the basketball part of these eight consecutive images. Other methods did not track the basketball, as shown in Figure 7a. In contrast, our method tracks all basketballs with hand occlusion. In frames 352 to 359 of the first clip of SportsTrack’s soccer test set, the soccer ball blends into the background of the auditorium. Figure 7c,d is screenshots of the soccer part of these eight consecutive images. Other methods did not track the soccer player, as shown in Figure 7c. In contrast, our method tracks the entire ball in a situation where the ball is very similar to the head in the audience, as shown in Figure 7d. In the first clip of SportsTrack’s volleyball test set, motion blur occurs from frames 97 to 104 due to the excessive speed of the volleyball. Figure 7e,f is screenshots of the volleyball part of these eight consecutive images. The blurred volleyball was not tracked by other methods, as shown in Figure 7e. In contrast, our method tracks all volleyballs, as shown in Figure 7f.

4.3. Ablation Experiments

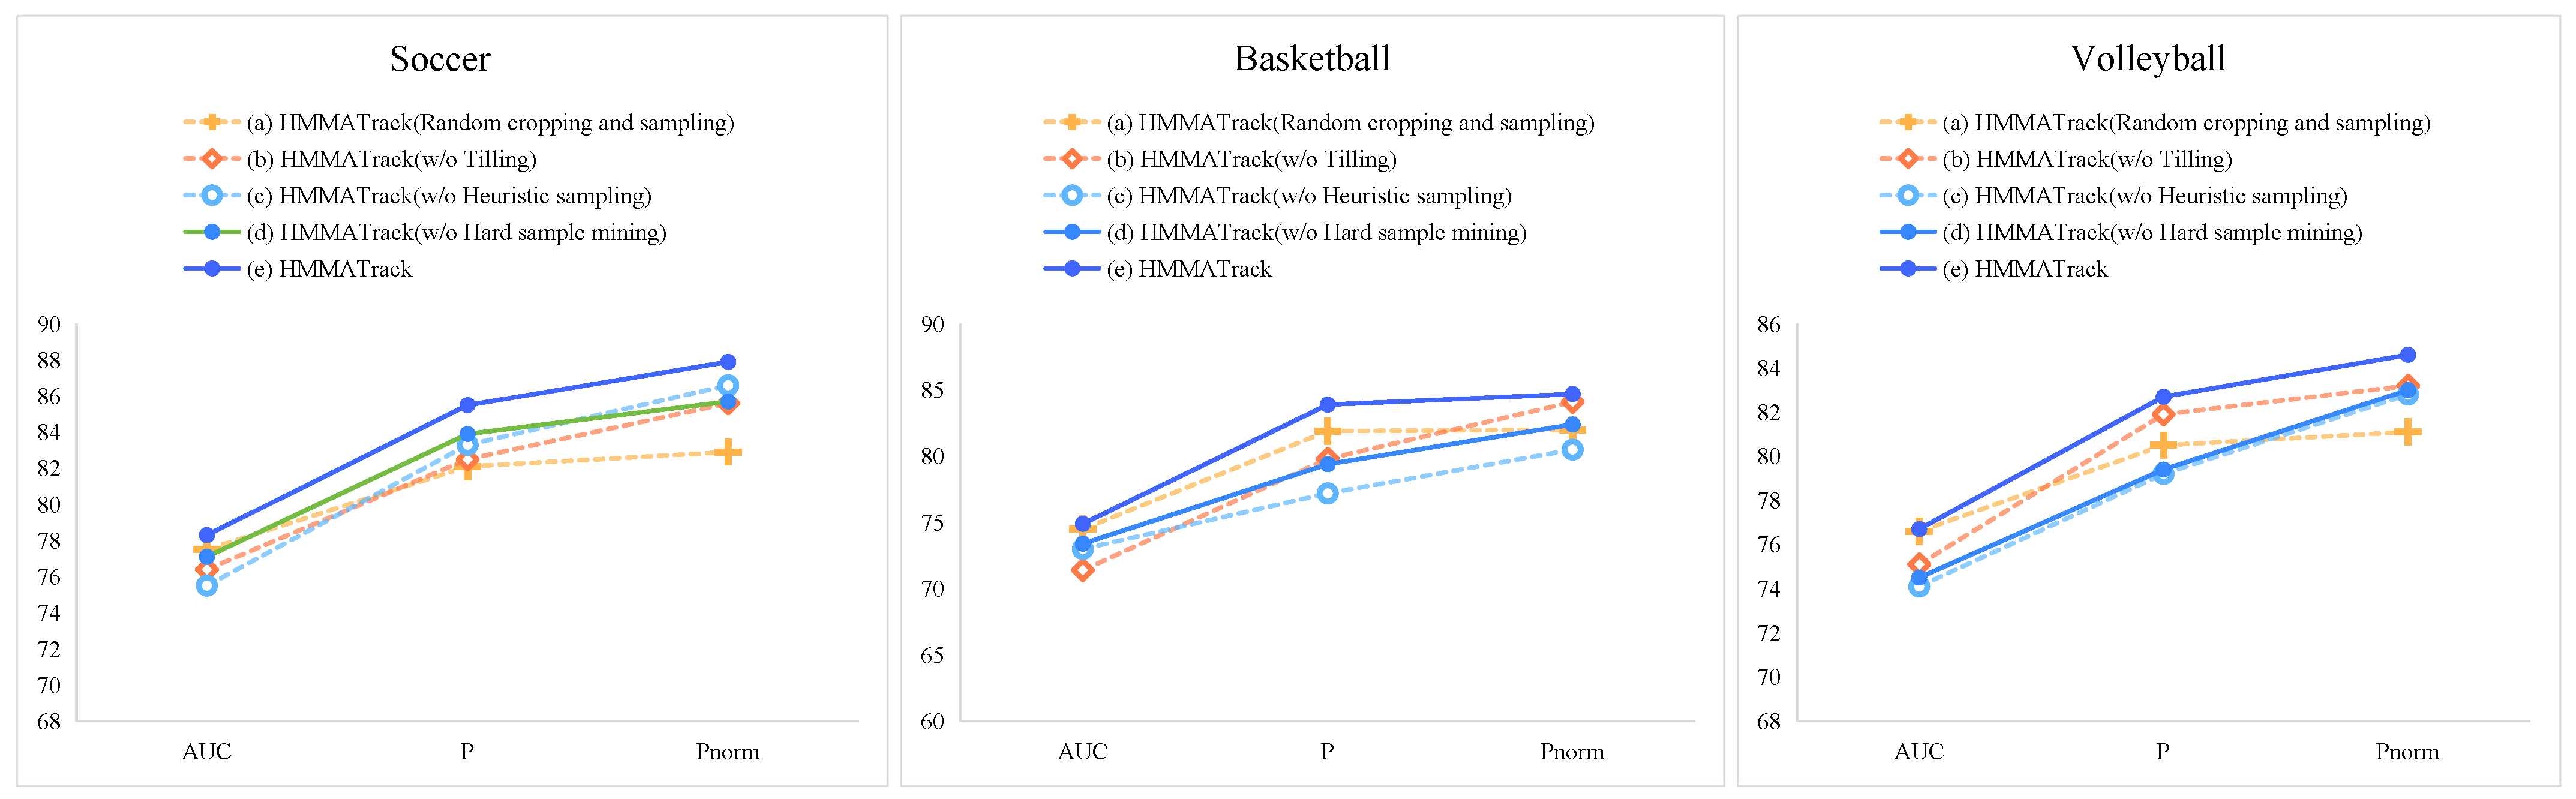
4.3.1. Analysis of the Effectiveness of the Heuristic Composite Sampling Strategy

First, we conducted ablations on the components of the Heuristic Compound Sampling Strategy. In the actual video of the ball team sports competition, there are long-shot videos, close shots, and close-up videos. Even in the same long shot or panoramic shot, as the position of the ball changes in the court, the position between the ball and the camera will also change. Therefore, the relative size of the balls changes as the camera moves or the ball itself moves. We not only want to detect and track smaller balls in the distance but also capture larger balls in the distance. Secondly, in actual sports videos, there is only one valid ball object by default. Therefore, after the original image is randomly cropped to the size of the network input, there is a large gap in the number of positive samples containing the ball object and negative samples that do not contain the object, resulting in positive and negative samples being severely imbalanced. Finally, there are often unusual situations such as occlusion and motion blur in team ball sports scenes. In order to verify the effectiveness of the heuristic composite sampling strategy, we constructed different sampling strategies for ablation experiments: (a) HMMATrack random cropping and random sampling, and other structures remain unchanged; (b) HMMATrack (w/o tilling): the tilling sampling mechanism is not used, and the detection and tracking network remains unchanged; (c) HMMATrack (w/o heuristic sampling): heuristic sampling is not used, and other structures remain unchanged; (d) HMMATrack (w/o hard sample mining): uses random sampling without distinguishing between hard samples and ordinary samples, and other structures remain unchanged; and (e) HMMATrack: complete sampling, detection, and tracking pipeline. From the results of Figure 8, it can be seen that the tracking effect obtained by using the complete sampling strategy is the best.

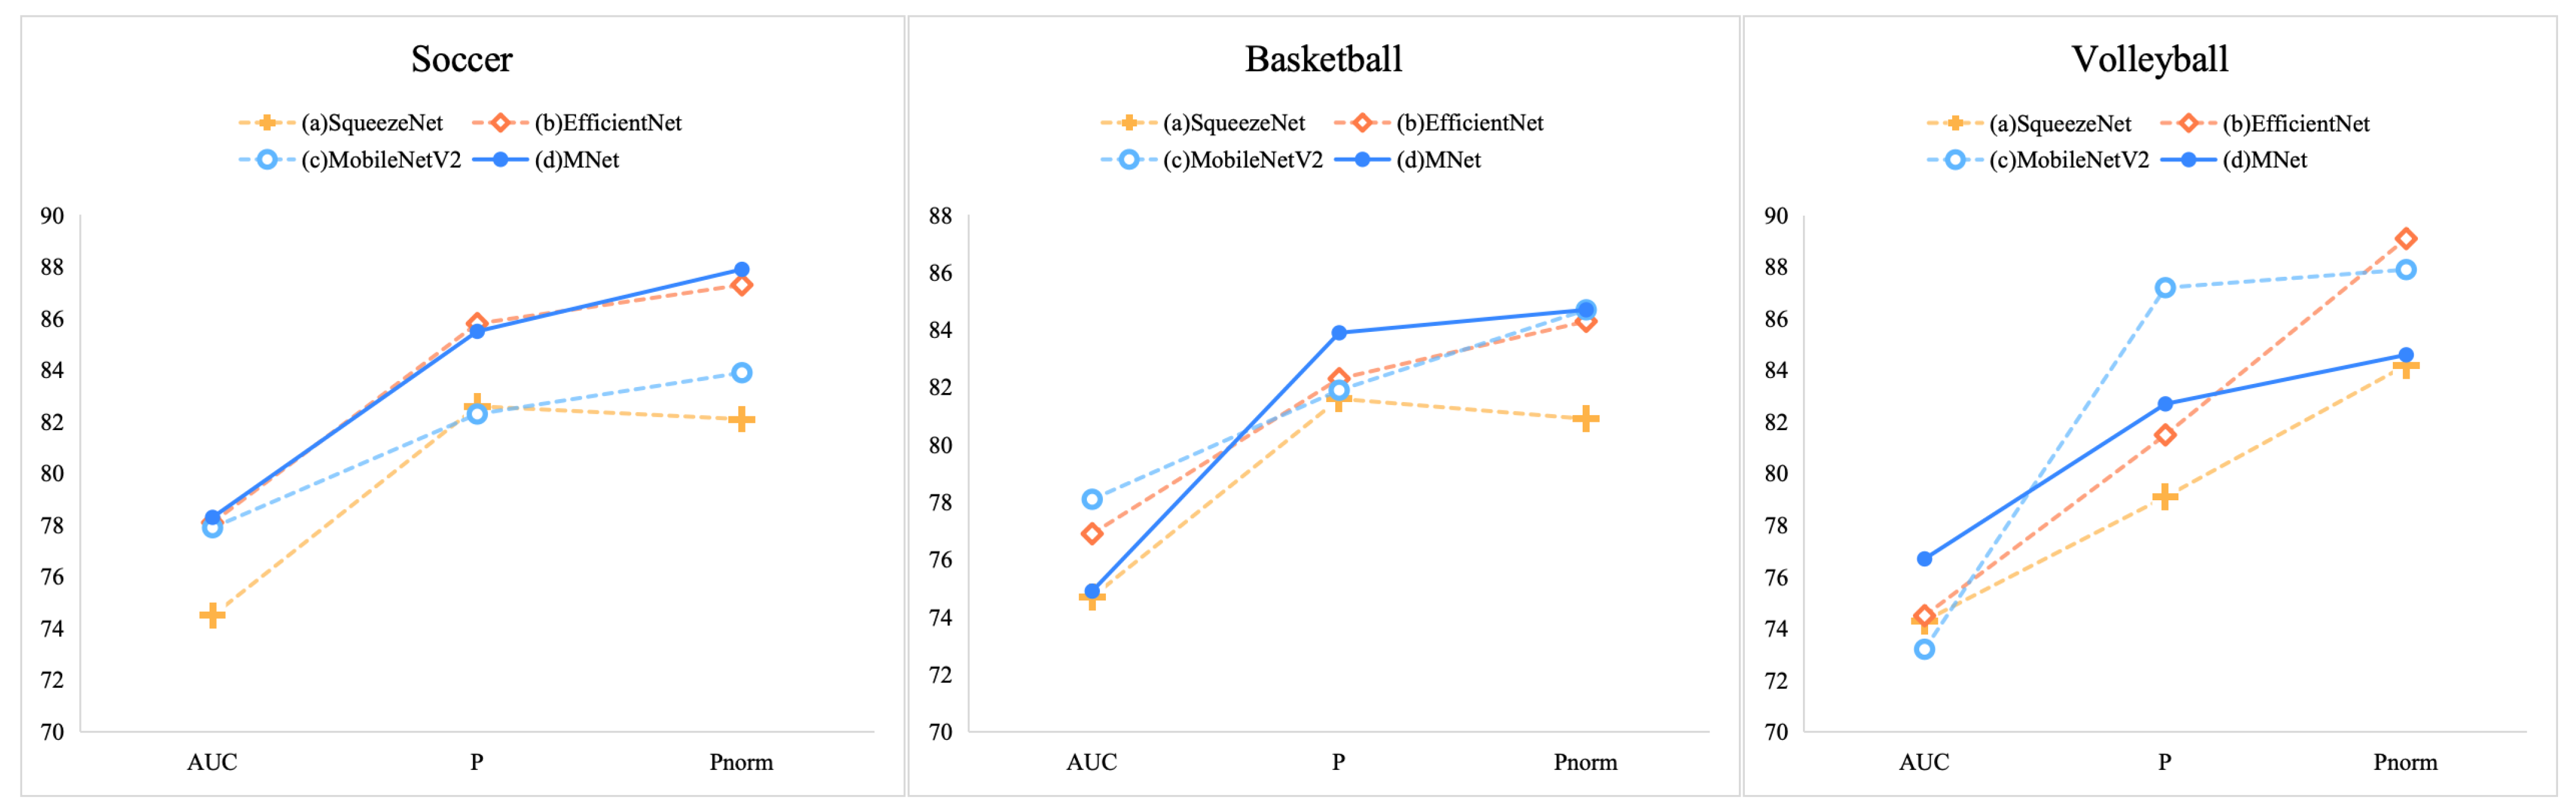
4.3.2. Analysis of the Effectiveness of MNet Backbone Network

In order to verify the effect of the MNet backbone network proposed in this article, we conduct lightweight backbone networks SqueezeNet [46], EfficientNet [47], and MobileNetV2 [48] as comparison models. Four sets of comparative experiments were designed: (a) SqueezeNet; (b) EfficientNet; (c) MobileNetV2; and (d) MNet. In these comparative experiments, only the backbone network was modified, and other structures remained consistent. It can be seen from Figure 9 that using the MNet backbone network proposed in this article can better capture smaller ball objects.

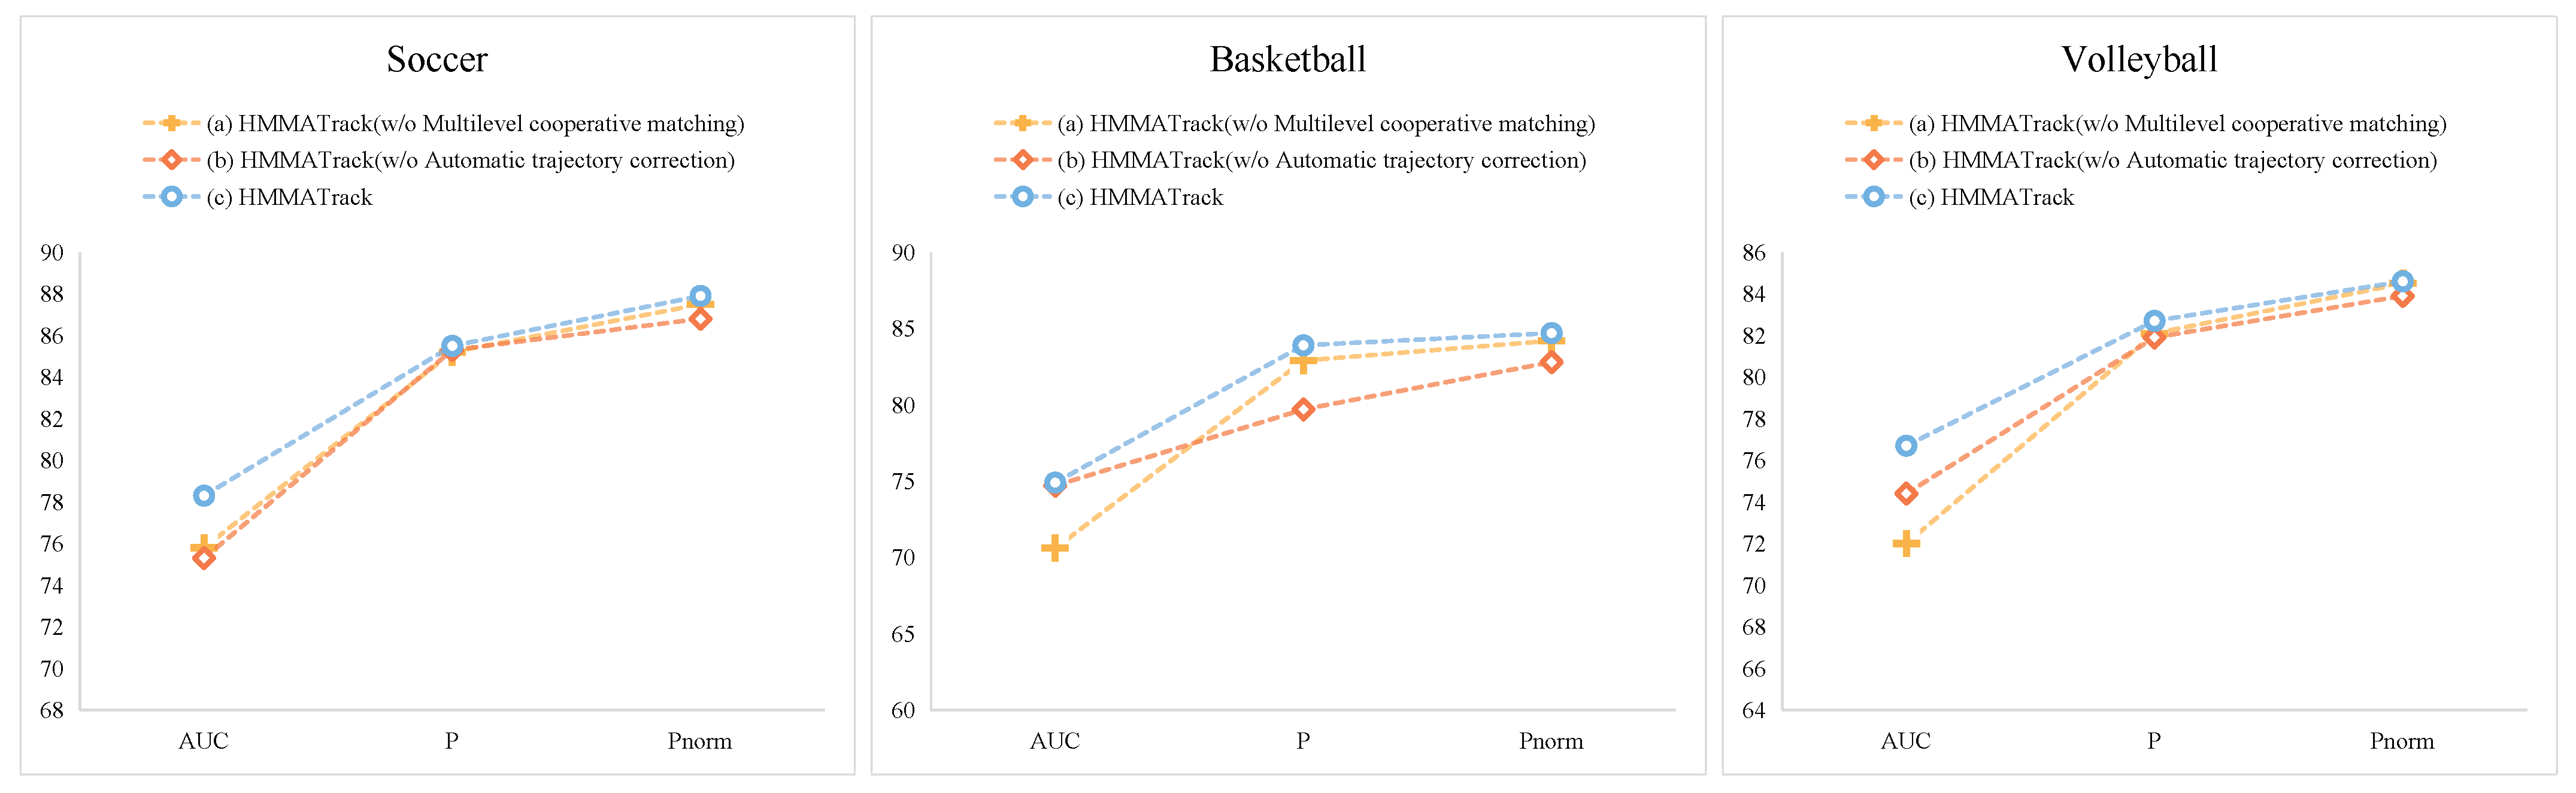
4.3.3. Tracking Module Effectiveness Analysis

In order to further objectively analyze the effectiveness of our proposed tracking algorithm, we designed three sets of comparative experiments: (a) HMMATrack (w/o multilevel cooperative matching): does not use multilevel cooperative matching but only uses the classic Kalman filter matching algorithm other structures remain unchanged; (b) HMMATrack (w/o automatic trajectory correction): the automatic trajectory correction module is not used, and other structures remain unchanged; and (c) HMMATrack: the complete HMMATrack framework. It can be seen from Figure 10 that the ball trajectory obtained by the tracking model using the complete trajectory correction algorithm has better continuity.
Table 4 objectively evaluates the effectiveness of each functional module design from the three indicators of AUC, P, and P N o r m . Table 4 shows the average results of different network structures on the three indicators of AUC, P, and P N o r m for three ball objects. It can be seen from the table that the algorithm that only performs random cropping and random sampling without any other sampling strategies performs the worst in terms of AUC, P, and P N o r m . Compared with the MNet network, the algorithm using ResNet-18 as the backbone network has lower AUC, P, and P N o r m indicators. On the contrary, the network that adds a complete heuristic composite sampling strategy, MNet detection module and multilevel collaboration, and automatic matching and tracking function modules performs the best in the three indicators of AUC, P, and P N o r m .

5. Conclusions

We propose a ball detection and tracking method based on multiscale feature enhancement and multilevel collaborative matching, which can improve the tracking effect from the whole process of visual target tracking, including a heuristic composite sampling module, an MNet small object detection module, a multilevel collaborative matching module, and an automatic trajectory correction module. We designed a heuristic composite sampling strategy in which we apply the tiling mechanism, heuristic sampling, and a complicated sample mining mechanism. This module specifically targeted sports scenes and small objects that can balance samples and improve the detection effect of small ball objects. Secondly, we designed a new backbone network, MNet, which, based on the anchor-free detection model, can effectively improve the detection effect of balls under occlusion and motion blur. We also designed a tracking module based on multilevel collaborative matching and automatic trajectory correction, which can effectively improve the continuity of the ball trajectory. We also manually annotated a ball-tracking data set named SportsTrack containing three sports scenes: basketball, soccer, and volleyball. Finally, we studied detailed comparison and ablation experiments on SportsTrack, and the results demonstrate the advancement of our proposed HMMATrack.

Author Contributions

Conceptualization, Q.W.; methodology, X.H.; supervision, Q.W. and Y.W.; validation, Y.W.; writing—original draft, X.H.; writing—review and editing, X.H. All authors have read and agreed to the published version of the manuscript.

Funding

This research was funded by Beijing’s new audiovisual industry to support the construction of “four centers”(23JCB002).

Institutional Review Board Statement

Not applicable.

Informed Consent Statement

Not applicable.

Data Availability Statement

The data presented in this study are available in references [38,39,40].

Conflicts of Interest

The authors declare no conflicts of interest.

References

  1. Gobhinath, S.; Sophia, S.; Karthikeyan, S.; Janani, K. Dynamic Objects Detection and Tracking from Videos for Surveillance Applications. In Proceedings of the 2022 8th International Conference on Advanced Computing and Communication Systems (ICACCS), Coimbatore, India, 25–26 March 2022; IEEE: New York, NY, USA, 2022; Volume 1, pp. 419–422. [Google Scholar]
  2. Rangesh, A.; Trivedi, M.M. No blind spots: Full-surround multi-object tracking for autonomous vehicles using cameras and lidars. IEEE Trans. Intell. Veh. 2019, 4, 588–599. [Google Scholar] [CrossRef]
  3. Yu, X.; Leong, H.W.; Xu, C.; Tian, Q. Trajectory-based ball detection and tracking in broadcast soccer video. IEEE Trans. Multimed. 2006, 8, 1164–1178. [Google Scholar] [CrossRef]
  4. Kamble, P.R.; Keskar, A.G.; Bhurchandi, K.M. A convolutional neural network based 3D ball tracking by detection in soccer videos. In Proceedings of the Eleventh International Conference on machine vision (ICMV 2018), Munich, Germany, 1–3 November 2018; SPIE: Bellingham, WA, USA, 2018; Volume 11041, pp. 730–737. [Google Scholar]
  5. Kamble, P.R.; Keskar, A.G.; Bhurchandi, K.M. A deep learning ball tracking system in soccer videos. Opto-Electron. Rev. 2019, 27, 58–69. [Google Scholar] [CrossRef]
  6. Kukleva, A.; Khan, M.A.; Farazi, H.; Behnke, S. Utilizing temporal information in deep convolutional network for efficient soccer ball detection and tracking. In Proceedings of the RoboCup 2019: Robot World Cup XXIII 23, Sydney, NSW, Australia, 23–23 July 2019; Springer: Berlin, Germany, 2019; pp. 112–125. [Google Scholar]
  7. Van Zandycke, G.; De Vleeschouwer, C. Ball 3D Localization From A Single Calibrated Image. arXiv 2022, arXiv:2204.00003. [Google Scholar]
  8. Najeeb, H.D.; Ghani, R.F. Tracking ball in soccer game video using extended Kalman filter. In Proceedings of the 2020 International Conference on Computer Science and Software Engineering (CSASE), Duhok, Iraq, 16–18 April 2020; IEEE: New York, NY, USA, 2020; pp. 78–82. [Google Scholar]
  9. Cheng, X.; Liang, L.; Ikenaga, T. Automatic data volley: Game data acquisition with temporal-spatial filters. Complex Intell. Syst. 2022, 8, 4993–5010. [Google Scholar] [CrossRef]
  10. Dong, J.; Cheng, X.; Ikenaga, T. Multi-physical and temporal feature based self-correcting approximation model for monocular 3D volleyball trajectory analysis. In Proceedings of the 2021 17th International Conference on Machine Vision and Applications (MVA), Virtual, 25–27 July 2021; IEEE: New York, NY, USA, 2021; pp. 1–4. [Google Scholar]
  11. Guan, S.; Li, X. WITHDRAWN: Moving target tracking algorithm and trajectory generation based on Kalman filter in sports video. J. Vis. Commun. Image Represent. 2019, in press. [CrossRef]
  12. Zhao, K.; Jiang, W.; Jin, X.; Xiao, X. Artificial intelligence system based on the layout effect of both sides in volleyball matches. J. Intell. Fuzzy Syst. 2021, 40, 3075–3084. [Google Scholar] [CrossRef]
  13. Zhang, B.; Zhang, Y.; Alshawi, B.; Alturki, R. Basketball flight trajectory tracking using video signal filtering. Mob. Netw. Appl. 2023, 1–13. [Google Scholar] [CrossRef]
  14. Roman-Rivera, L.R.; Pedraza-Ortega, J.C.; Aceves-Fernandez, M.A.; Ramos-Arreguín, J.M.; Gorrostieta-Hurtado, E.; Tovar-Arriaga, S. A Robust Sphere Detection in a Realsense Point Cloud by USING Z-Score and RANSAC. Mathematics 2023, 11, 1023. [Google Scholar] [CrossRef]
  15. Huang, G. An Effective Volleyball Trajectory Estimation and Analysis Method With Embedded Graph Convolution. Int. J. Distrib. Syst. Technol. (IJDST) 2023, 14, 1–13. [Google Scholar] [CrossRef]
  16. Naik, B.T.; Hashmi, M.F. YOLOv3-SORT: Detection and tracking player/ball in soccer sport. J. Electron. Imaging 2023, 32, 011003. [Google Scholar] [CrossRef]
  17. Vicente-Martínez, J.A.; Márquez-Olivera, M.; García-Aliaga, A.; Hernández-Herrera, V. Adaptation of YOLOv7 and YOLOv7_tiny for soccer-ball multi-detection with DeepSORT for tracking by semi-supervised system. Sensors 2023, 23, 8693. [Google Scholar] [CrossRef]
  18. Keča, D.; Kunović, I.; Matić, J.; Sovic Krzic, A. Ball Detection Using Deep Learning Implemented on an Educational Robot Based on Raspberry Pi. Sensors 2023, 23, 4071. [Google Scholar] [CrossRef]
  19. Law, H.; Deng, J. Cornernet: Detecting objects as paired keypoints. In Proceedings of the European Conference on Computer Vision (ECCV), Munich, Germany, 8–14 September 2018; pp. 734–750. [Google Scholar]
  20. Zhou, X.; Zhuo, J.; Krahenbuhl, P. Bottom-up object detection by grouping extreme and center points. In Proceedings of the IEEE/CVF Conference on Computer Vision and Pattern Recognition, Long Beach, CA, USA, 15–20 June 2019; pp. 850–859. [Google Scholar]
  21. Zhu, C.; He, Y.; Savvides, M. Feature selective anchor-free module for single-shot object detection. In Proceedings of the IEEE/CVF Conference on Computer Vision and Pattern Recognition, Long Beach, CA, USA, 15–20 June 2019; pp. 840–849. [Google Scholar]
  22. Zhou, X.; Wang, D.; Krähenbühl, P. Objects as points. arXiv 2019, arXiv:1904.07850. [Google Scholar]
  23. Zhou, H.; Guo, W.; Zhao, Q. An Anchor-Free Network for Increasing Attention to Small Objects in High Resolution Remote Sensing Images. Appl. Sci. 2023, 13, 2073. [Google Scholar] [CrossRef]
  24. Zhu, J.; Li, D.; Han, T.; Tian, L.; Shan, Y. Progressface: Scale-aware progressive learning for face detection. In Proceedings of the Computer Vision—ECCV 2020: 16th European Conference, Glasgow, UK, 23–28 August 2020; Proceedings, Part VI 16. Springer: Berlin, Germany, 2020; pp. 344–360. [Google Scholar]
  25. Wolpert, A.; Teutsch, M.; Sarfraz, M.S.; Stiefelhagen, R. Anchor-free small-scale multispectral pedestrian detection. arXiv 2020, arXiv:2008.08418. [Google Scholar]
  26. Tian, B.; Zhang, D.; Zhang, C. High-speed tiny tennis ball detection based on deep convolutional neural networks. In Proceedings of the 2020 IEEE 14th International Conference on Anti-Counterfeiting, Security, and Identification (ASID), Xiamen, China, 30 October–1 November 2020; IEEE: New York, NY, USA, 2020; pp. 30–33. [Google Scholar]
  27. Tao, R.; Gavves, E.; Smeulders, A.W. Siamese instance search for tracking. In Proceedings of the IEEE Conference on Computer Vision and Pattern Recognition, Las Vegas, NV, USA, 27–30 June 2016; pp. 1420–1429. [Google Scholar]
  28. Zhu, Z.; Wang, Q.; Li, B.; Wu, W.; Yan, J.; Hu, W. Distractor-aware siamese networks for visual object tracking. In Proceedings of the European Conference on Computer Vision (ECCV), Munich, Germany, 8–14 September 2018; pp. 101–117. [Google Scholar]
  29. Li, B.; Yan, J.; Wu, W.; Zhu, Z.; Hu, X. High performance visual tracking with siamese region proposal network. In Proceedings of the IEEE Conference on Computer Vision and Pattern Recognition, Salt Lake City, UT, USA, 18–23 June 2018; pp. 8971–8980. [Google Scholar]
  30. Luo, W.; Xing, J.; Milan, A.; Zhang, X.; Liu, W.; Kim, T.K. Multiple object tracking: A literature review. Artif. Intell. 2021, 293, 103448. [Google Scholar] [CrossRef]
  31. Kalman, R.E. A new approach to linear filtering and prediction problems. J. Basic Eng. Mar. 1960, 82, 35–45. [Google Scholar] [CrossRef]
  32. Ozge Unel, F.; Ozkalayci, B.O.; Cigla, C. The power of tiling for small object detection. In Proceedings of the IEEE/CVF Conference on Computer Vision and Pattern Recognition Workshops, Long Beach, CA, USA, 16–17 June 2019. [Google Scholar]
  33. He, K.; Zhang, X.; Ren, S.; Sun, J. Deep residual learning for image recognition. In Proceedings of the IEEE Conference on Computer Vision and Pattern Recognition, Las Vegas, NV, USA, 27–30 June 2016; pp. 770–778. [Google Scholar]
  34. Yu, F.; Koltun, V.; Funkhouser, T. Dilated residual networks. In Proceedings of the IEEE Conference on Computer Vision and Pattern Recognition, Honolulu, HI, USA, 21–26 July 2017; pp. 472–480. [Google Scholar]
  35. Ren, S.; He, K.; Girshick, R.; Sun, J. Faster R-CNN: Towards real-time object detection with region proposal networks. Adv. Neural Inf. Process. Syst. 2015, 28, 91–99. [Google Scholar] [CrossRef]
  36. Dalal, N.; Triggs, B. Histograms of oriented gradients for human detection. In Proceedings of the 2005 IEEE Computer Society Conference on Computer Vision and Pattern Recognition (CVPR’05), San Diego, CA, USA, 20–25 June 2005; IEEE: New York, NY, USA, 2005; Volume 1, pp. 886–893. [Google Scholar]
  37. Liu, C.; Huynh, D.Q.; Reynolds, M. Toward occlusion handling in visual tracking via probabilistic finite state machines. IEEE Trans. Cybern. 2018, 50, 1726–1738. [Google Scholar] [CrossRef]
  38. Jiang, Y.; Cui, K.; Chen, L.; Wang, C.; Xu, C. Soccerdb: A large-scale database for comprehensive video understanding. In Proceedings of the 3rd International Workshop on Multimedia Content Analysis in Sports, Seattle, WA, USA, 16 October 2020; pp. 1–8. [Google Scholar]
  39. Kumar, K.; De Vleeschouwer, C. Discriminative label propagation for multi-object tracking with sporadic appearance features. In Proceedings of the IEEE International Conference on Computer Vision, Sydney, Australia, 1–8 December 2013; pp. 2000–2007. [Google Scholar]
  40. Kaczmarek, K. Volleyball Tracking Dataset. 2023. Available online: https://universe.roboflow.com/kamil-kaczmarek-txftt/volleyball-tracking-bdtqj (accessed on 5 October 2023).
  41. Yan, B.; Jiang, Y.; Wu, J.; Wang, D.; Luo, P.; Yuan, Z.; Lu, H. Universal instance perception as object discovery and retrieval. In Proceedings of the IEEE/CVF Conference on Computer Vision and Pattern Recognition, Vancouver, BC, Canada, 17–24 June 2023; pp. 15325–15336. [Google Scholar]
  42. Ye, B.; Chang, H.; Ma, B.; Shan, S.; Chen, X. Joint feature learning and relation modeling for tracking: A one-stream framework. In Proceedings of the European Conference on Computer Vision, Tel Aviv, Israel, 23–27 October 2022; Springer: Berlin, Germany, 2022; pp. 341–357. [Google Scholar]
  43. Yan, B.; Peng, H.; Fu, J.; Wang, D.; Lu, H. Learning spatio-temporal transformer for visual tracking. In Proceedings of the IEEE/CVF International Conference on Computer Vision, Montreal, BC, Canada, 11–17 October 2021; pp. 10448–10457. [Google Scholar]
  44. Van Zandycke, G.; De Vleeschouwer, C. 3d ball localization from a single calibrated image. In Proceedings of the IEEE/CVF Conference on Computer Vision and Pattern Recognition, New Orleans, LA, USA, 18–22 June 2022; pp. 3472–3480. [Google Scholar]
  45. VolleyVision. 2023. Available online: https://github.com/shukkkur/VolleyVision (accessed on 5 October 2023).
  46. Iandola, F.N.; Han, S.; Moskewicz, M.W.; Ashraf, K.; Dally, W.J.; Keutzer, K. SqueezeNet: AlexNet-level accuracy with 50x fewer parameters and <0.5 MB model size. arXiv 2016, arXiv:1602.07360. [Google Scholar]
  47. Tan, M.; Le, Q. Efficientnet: Rethinking model scaling for convolutional neural networks. In Proceedings of the International Conference on Machine Learning. PMLR, Long Beach, CA, USA, 9–15 June 2019; pp. 6105–6114. [Google Scholar]
  48. Sandler, M.; Howard, A.; Zhu, M.; Zhmoginov, A.; Chen, L.C. Mobilenetv2: Inverted residuals and linear bottlenecks. In Proceedings of the IEEE Conference on Computer Vision and Pattern Recognition, Salt Lake City, UT, USA, 18–23 June 2018; pp. 4510–4520. [Google Scholar]
Figure 1. The framework of the proposed HMMATrack model. The left part is the Heuristic Compound Sampling Strategy, which includes three mechanisms: tiling sampling, composite (patch level and image level) sampling, and hard sample resampling. The upper right part is the MNet-based detection module. The lower right part is the tracking module including multilevel collaborative trajectory matching and automatic trajectory correction, where trajectory matching includes Kalman filter matching, linear motion matching, and appearance feature matching.
Applsci 14 01376 g001
Figure 2. Examples of easy and hard samples: (a) simple samples; (b) occlusion samples; (c) motion blur samples; (d) background integration samples.
Applsci 14 01376 g002
Figure 4. The analysis of ball tracklets: (a) smooth normal trajectory; (b) smooth but incomplete trajectory with a small number of missing detections; (c) trajectory with a small amount of deviation; (d) old trajectory segment ends and new trajectory segment begins; (e) cluttered detection collection of results.
Applsci 14 01376 g004
Figure 5. Automatic trajectory correction with sliding windows and finite state machine. The search state finds the starting boundary of the sliding window; the candidate state verifies whether the detection is added to the existing trajectory; the repair state repairs deviated detections or supplements missing detections by interpolation.
Applsci 14 01376 g005
Figure 6. MNet-based detection results on P, R, AP in SportsTrack test data.
Applsci 14 01376 g006
Figure 7. Examples of comparisons of results with other methods: (a,b), respectively, show partial screenshots of the tracking results of Deepsport and HMMATrack on frames 29 to 36 of episode 4 of the basketball test set; (c,d), respectively, show partial screenshots of the tracking results of UNINEXT and HMMATrack on frames 352 to 359 of episode 1 of the football test set; (e,f), respectively, show partial screenshots of the tracking results of OSTrack and HMMATrack on frames 97 to 104 in episode 1 of the volleyball test set.
Applsci 14 01376 g007
Figure 8. Heuristic composite sampling ablation analysis on soccer, basketball, and volleyball test data sets.
Applsci 14 01376 g008
Figure 9. MNet backbone ablation analysis on soccer, basketball, and volleyball test data sets.
Applsci 14 01376 g009
Figure 10. Tracking module ablation analysis on soccer, basketball, and volleyball test data sets.
Applsci 14 01376 g010
Table 1. Self-built data set SportsTrack.
ObjectTrainTestFrameGTPixelFPS
Soccer21641196336032821280 × 72030
Basketball21961464366034981280 × 72030
Volleyball21601400360035201280 × 72030
Table 2. Training and test data set partitioning.
Data SetObjectTrainTest
SoccerDBSoccer40,615-
VolleyballVisionVolleyball20,218-
APIDISBasketball12,907-
SportsTrackSoccer/Basketball/Volleyball65204060
Table 3. Comparison results with other state-of-the-art methods on AUC, P, and P N o r m in the SportsTrack test set including soccer, basketball, and volleyball. The best results are in bold. FPS is the average inference speed.
MethodSoccerBasketballVolleyball
AUC P P Norm AUC P P Norm AUC P P Norm FPS
UNINEXT78.586.187.563.769.071.261.667.770.330.3
OSTrack76.181.684.271.677.579.572.379.081.969.7
STACK66.572.975.057.963.465.556.762.264.835.6
Deepsport63.770.072.872.077.980.460.766.769.228.6
VolleyVision67.073.075.159.865.167.270.476.278.957.3
EKF64.470.172.366.872.675.257.364.066.316.4
Ours78.385.587.974.983.984.776.782.784.628.2
Table 4. Comparison of ablation experiment evaluation results of HMMATrack. The best results are in bold.
ModulesNetworkAUCP P Norm
Sampling Module(a) Random cropping and sampling76.281.583.0
(b) w/o Tilling74.381.484.3
(c) w/o Heuristic sampling74.279.983.3
(d) w/o Hard sample mining75.080.983.7
MNet Backbone(a) SqueezeNet74.581.182.4
(b) EfficientNet76.583.286.9
(c) MobileNetV276.483.885.5
Track Module(a) w/o Multilevel cooperative matching78.883.485.4
(b) w/o Automatic trajectory correction74.882.384.5
HMMATrack76.684.085.7
Disclaimer/Publisher’s Note: The statements, opinions and data contained in all publications are solely those of the individual author(s) and contributor(s) and not of MDPI and/or the editor(s). MDPI and/or the editor(s) disclaim responsibility for any injury to people or property resulting from any ideas, methods, instructions or products referred to in the content.

