Article

Impacts of Flight Operations on the Risk of Runway Excursions

1
College of Safety Science and Engineering, Civil Aviation University of China, Tianjin 300300, China
2
College of Mining Engineering, North China University of Science and Technology, Tangshan 063210, China
3
School of Environment, Tsinghua University, Beijing 100084, China
*
Author to whom correspondence should be addressed.
Appl. Sci. 2024, 14(3), 975; https://doi.org/10.3390/app14030975
Submission received: 20 November 2023 / Revised: 8 January 2024 / Accepted: 19 January 2024 / Published: 23 January 2024
(This article belongs to the Special Issue Ergonomics and Human Factors in Transportation Systems)

Abstract

:
The Quick Access Recorder (QAR), as an onboard device used for monitoring and recording flight parameters, has been extensively installed on various types of aircraft. Recently, there has been a significant focus on studying the typical flight safety event of runway excursions based on QAR data. However, there is limited research that combines the analysis of runway excursion risks with flight operations, and there is also a scarcity of studies that divide the investigation of the landing phase into multiple key stages. In this paper, we propose a comparative analysis of operational characteristics and risks associated with runway excursions from the perspective of operational styles. A total of 2087 flights were classified on the basis of touchdown distance, taxiing distance, and magnetic heading changes and were divided into three styles based on these indicators. Subsequently, we analyze flight operations and attitudes at five key stages: runway threshold, flare, speed brake deployment, touchdown, and reverse thrust activation. Furthermore, we employ the selection criteria of pilot proficiency levels to filter out standard operational curves. The curve similarity is used to compare the difference between the actual operating curves and the standard curves. Finally, we employ typical correlation analysis to explore the relationship between touchdown distance and operational variances. The findings indicate that Style 1 pilots exhibit the lowest probability of runway excursions, yet their maneuvers potentially elevate the risk of hard landing events.

1. Introduction

Ensuring safety during the landing phase has always been a top priority for the civil aviation industry. The International Air Transport Association (IATA) Safety Report for 2021 reveals that nearly 80% of all aviation accidents occur during the landing phase. Among the latent conditions that contribute to runway excursions, flight operations account for 28% of the impact, while the influence of the flight operations training system is estimated at 16%. These findings highlight the critical nature of the landing phase in ensuring aviation safety, with operational procedures and training programs playing crucial roles in safeguarding against accidents.
Runway excursions have received significant attention in the civil aviation industry. The IATA’s 2021 Safety Report [1] identified runway excursions as a high-risk category, constituting 24% of all accidents prior to the COVID-19 pandemic. Over the past decade (2012–2021), runway excursions have been the most common accident category, with 138 occurrences. This category ranks as the third leading cause of fatal accidents, resulting in 93 fatalities across nine accidents. These accidents occurred during aircraft takeoff or landing and were influenced by factors such as unstable approaches, high landing speeds, and slippery runways. According to the IATA Annual Safety Report—2022, there was one fatality attributed to runway excursions last year, with six occurrences of non-fatal incidents involving runway excursions [2]. According to A Statistical Analysis of Commercial Aviation Accidents by Airbus, the analysis of data from 2002 to 2022 highlights that runway excursions rank as the third leading cause of fatal accidents and represent the primary factor in aircraft structural damage. Runway excursions account for 17% of fatal accidents within various accident categories. Furthermore, within the distribution of accidents based on aircraft damage, runway excursions constitute 36% of cases [3].
Research on runway excursions can generally be categorized into two main types: accident report analysis and exploration of causal and influencing factors. Studies that focus on identifying causes and analyzing factors typically rely on accident investigation reports to determine the contributing factors and propose corresponding improvement measures. Another approach involves analyzing past accidents using accident analysis models to classify and analyze the risks associated with runway excursions, thus providing risk management strategies. Alternatively, researchers may establish indicator systems and weights based on event analysis and expert opinions to conduct risk analysis and prediction for runway excursions [4,5,6].
Another category of research focuses on the analysis of exceedance events and the study of distances and landing trajectories in runway excursions based on Quick Access Recorder (QAR) data [7,8,9]. In the context of runway excursion research, there has been limited utilization of QAR data for operational risk analysis. Current studies based on QAR data predominantly concentrate on the characteristics and operational risks of operations, but these studies are currently less focused on specific operational nodes. Research on operational characteristics emphasizes feature identification with limited exploration of accident risks. Studies on operational risks mostly focus on analyzing the entire flight process or specific parameters, with limited research combining and analyzing flight parameters.
The paper focuses on the risk of runway excursions during the landing phase, categorizing flight operations into styles and analyzing the risk of runway excursions from the runway threshold to the end of the rollout phase. Emphasizing the runway threshold, flare, deployment of speed brakes, touchdown, and reverse thrust activation, the study conducts a detailed analysis of the operational characteristics and associated risks for each style. Ultimately, employing curve similarity, typical correlation analysis is utilized to examine the relationship between operational characteristics during touchdown and landing distance, identifying effective operational strategies for each style in relation to landing distance.
The remaining sections of the paper are structured as follows: Section 2 provides a concise overview of the relevant literature; Section 3 introduces the methodologies employed in data processing and operational style clustering; Section 4 elucidates the characteristics of each node and the variations in operational patterns; in Section 5, we employ curve similarity to quantify deviations between operations and the standard curve; and finally, Section 6 concludes the paper.

2. Related Work

2.1. Runway Excursion

In summary, research on runway excursions covers multiple aspects and can generally be divided into two categories: studies based on accident report data and those based on flight data. In this section, we provide a brief introduction to research conducted in these two areas. Okafor et al. [4] conducted a statistical analysis of summaries, accident reports, and perspectives from stakeholders to identify the influencing factors of runway excursions. They discovered that accidents occur when there is a combination of human and engineering system failures. Analyzing accident reports has always been crucial for ensuring safety and preventing such incidents. These reports are typically presented in textual form, requiring the extraction and analysis of key information. Chang et al. [5] employed the SHELLO model to classify human-induced risk factors and formulated four prioritized risk management strategies for airline pilots. These strategies aim to reduce the occurrence of runway excursions. Zhang et al. [6] established a predictive model for runway excursions, enabling the anticipation of such incidents. They validated their model using data from aviation companies. Wang Lei, Ren Young, et al. [7] explored the impact of crucial flare operations conducted by pilots on long-distance landings and hard landing events using QAR data. Through variance analysis, they identified flight parameter characteristics during the initiation of flaring and throughout the entire flaring process that are associated with abnormal landing events. They found that flare operations have a significant impact on landing distance and vertical landing acceleration. Li et al. [8] proposed a landing trajectory correction method that integrates ground speed and runway position information. They established a dynamic off-runway risk assessment model based on QAR data, uncovering key factors related to off-runway risk during the landing phase. In the study of exceedance issues, Lv et al. [9] introduced a novel approach that utilizes QAR data on a large scale. They categorized flight cases using exceedance danger lines and ultimately employed three machine learning models to examine the relationship between exceedance risk indices and flight parameters. Distefano et al. [10] used multiple correspondence analysis to determine the correspondence between various aspects of offset runway excursions, identifying variable combinations worthy of further study and providing a method for runway risk assessment for civil aviation organizations. Wang et al. [11] constructed a safety control structure diagram for offset runway excursions, identifying unsafe control behaviors and analyzing their key causes. Odisho et al. [12] applied machine learning to establish a predictive model for perceiving unstable approach risks, thereby reducing the occurrence of offset runway excursions by predicting the risk of unstable approaches. Olive et al. [13] utilized S-mode data to analyze the contributing factors of offset runway excursions, proposing a risk assessment model for such occurrences. Mascio et al. [14] calculated risk values for over 1300 points around runways using preliminary data provided by airport management agencies, evaluating the current safety level and providing a risk map to identify the areas with the highest risk of offset runway excursions. Distefano and others [15] employed association rule methods and the Apriori algorithm to determine that the most important variables for all types of offset runway excursions are aircraft type, with events of severity classified as major and hazardous being associated with small aircraft, while events classified as catastrophic are associated with medium to large aircraft. Ketabdari et al. [16] used simulators to model the impact of various meteorological variables on aircraft operations, indicating that gusts, wind speed, and particularly crosswinds are the primary weather factors influencing offset runway excursions. Vorobyeva et al. [17] integrated data from various sources to enhance understanding of runway surface conditions in order to reduce the risk of offset runway excursions, strengthening flight safety and environmental protection. Mauro et al. [18] analyzed the functional complexity faults leading to offset runway excursions and discussed detection and handling prior to events. Their research indicates that enhancing system safety technology may only increase system complexity, inevitably leading to more frequent faults. Therefore, in-depth analysis and management of subsystems are crucial for addressing functional complexity faults. Wang and Holzafel [19] established a model to investigate offset runway excursions and abnormal runway contact, analyzing landing gear stress and validating the model using QAR data.
The existing research has the following limitations: Regarding studies based on historical accident data, they can only analyze the trends of accidents and their influencing factors, while the available information from accident data is limited. Studies based on QAR data usually have a broader focus on stages of research without considering the varying impacts of operations at each specific stage of flight.

2.2. Other Flight Safety Studies

In addition to research on mitigating runway excursions, other studies on aviation safety primarily focus on flight risks, predictive warnings, and feature extraction. In the realm of a quantitative assessment of hard landing risk, Wang Lei et al. [20] applied statistical modeling to establish a quantitative assessment model for heavy landing risk, evaluating the likelihood and severity of occurrences based on parameter distribution functions and algorithms and calculating risk levels. They constructed a landing overrun analysis model based on QAR data, utilizing Bayesian network [21] analysis and employing GTT algorithms for parameter learning to establish a landing overrun risk Bayesian network model. Wang Le et al. [22] divided 128 cases of QAR data into two groups based on the identification thresholds for normal landings and long landings, conducted inter-group comparisons of flight parameters, established logistic regression and linear regression models, and analyzed the potential flight operations that lead to performance differences in long landing events, ultimately identifying key operations that affect landing distance during flare. Wang et al. [23] also conducted a study on the correlation between age and flight safety performance, revealing a direct impact of age on the exceedance rate of pilots aged 41–45 and 56–60. Zhang et al. [24] utilized the Apriori algorithm to mine association rules within exceedance events and their correlation with environmental conditions, finding that speed exceedances during the approach process at 500–50 feet are more likely to lead to speed deviations at altitudes below 50 feet during the approach process. Li et al. [25] developed an interpretable model called IMTCN, which can accurately pinpoint key flight parameters and the corresponding moments with the greatest impact on safety incidents. Chen et al. [26] proposed a risk assessment method for deep learning using LSTM-DNN with variable fuzzy recognition of entropy weight, targeting high-altitude approach and landing risks.
In the field of trend prediction and warning, Westphal et al. [27] developed an aircraft cockpit risk sustained warning system based on fuzzy logic. Huang et al. [28,29] proposed dynamic linked list QAR decoding technology, intelligently diagnosing and predicting aircraft system faults. Zhao et al. [30] established a geometric determination method and introduced a hidden Markov model backpropagation neural network to infer and predict the status of aircraft flight. Utilizing ACARS, Lu et al. [31] established a high-precision trajectory data prediction model. Fu et al. [32] utilized long short-term memory networks to establish a flight trajectory prediction model for time series flight data. Qian et al. [33] proposed a flight trajectory prediction method based on composite gated recurrent units, achieving flight trajectory prediction. Through simulation analysis, it was discovered that compared with gated recurrent units and long short-term memory network models, it has the smallest error.
In the field of feature extraction and parameter estimation, Wang et al. [34] integrated the extended Kalman filter and improved Bryson–Frazier smoother algorithm based on QAR data. This, in turn, enhanced the precision of metric estimation. On the other hand, Korsun et al. [35] used satellite navigation systems and wind speed identification methods to estimate the measurement errors of the angle of attack and sideslip angle during flight tests. Lastly, Sun et al. [36] proposed the use of a differential testing analysis method for extracting pertinent information from exceedance events.

3. Classification of Operating Styles

3.1. Data Processing

Data processing and computation are carried out using a software programming to perform phase truncation on QAR data. These data originate from a single aviation company’s Boeing 737–800 and exclusively pertain to flight segments that involve landing at an international airport. The diverse topographical environments of different airports necessitate the use of QAR data collected from a single landing airport. The airport is a Class 4E civil international airport with a runway length of 3600 m. Some metrics require parameter-based calculation, such as landing distance and touchdown time.
The data excerpt spans from a radar altimeter height of 50 feet to the conclusion of deceleration on the runway, corresponding to a ground speed of 30 knots. During the calculation of landing distance, the Boeing 737 crew training manual indicates that the projection of the flight path crosses the runway threshold at approximately 50 feet, hence selecting the 50-foot position as being above the runway threshold. Referring to the Flight Operations Quality Assurance for monitoring projects, it is proposed to calculate the aircraft’s landing distance based on the ground speed at 50 feet and the ground speed at the point of touchdown.
Therefore, when truncating the landing phase data, the landing phase is segmented into touchdown and taxiing phases based on the radar altimeter height, air–ground parameter, and groundspeed parameters from the QAR data. The air–ground parameter corresponds to the parameter found in the QAR data, which indicates whether the aircraft has completed touchdown. This parameter switches from 1 to 0 when the aircraft is on the ground. On the other hand, the groundspeed parameter records the speed of the aircraft relative to the ground, and it is logged at a frequency of once per second. For subsequent key stages analysis, the data for key stages is truncated based on parameters such as radar altimeter height, control column position, air–ground parameter, and speed brake deployment.

3.2. K-Means ++ Cluster Analysis

The K-means ++ clustering method represents an optimization of the standard K-means clustering algorithm. The K-means ++ clustering method is an unsupervised clustering algorithm that is preferred due to the absence of labeled data. This method is considered more reasonable compared to other unsupervised clustering algorithms for its initial cluster center selection approach, which is designed to converge faster. Additionally, the K-means ++ algorithm selects initial cluster centers that are more uniformly distributed across the data space, thereby better capturing the overall characteristics of the dataset. During the selection of the (n + 1)th cluster center, points that are farther away from the current n cluster centers are assigned a higher probability of being chosen as the (n + 1)th cluster center. This approach has found application in the clustering of driving styles [37] within the transportation domain.
Based on the results of operations related to runway excursions, the flight data are clustered and labeled using landing distance, taxiing distance, and magnetic heading change rate when dividing the operational styles into three categories, as shown in Figure 1 and Table 1. The clustering center of ground distance for Style 1 is 641.86 m, making it the shortest among the styles. It is 155.35 m shorter than Style 2, indicating that Style 2 has a moderate touchdown distance. Furthermore, it is 327.03 m shorter than Style 3. Style 3 has the shortest taxiing distance, measuring 1023.89 m. Style 1 is 320.73 m longer than Style 3, indicating that its distance is moderate. Lastly, Style 2 is 847.58 m longer than Style 1. Style 1 exhibits a short touchdown distance, moderate taxiing distance, and minimal change in magnetic heading. Style 2 demonstrates a moderate landing distance, extensive rollout distance, and stable heading change. Style 3 displays a long landing distance, moderate taxiing distance, and unstable heading control. This categorization enables the classification of flights into three risk levels: low risk of longitudinal runway excursion, high risk of longitudinal runway excursion, and high risk of lateral runway excursion. Therefore, the data are categorized into three classes for subsequent comparative analysis. The increased touchdown distance and magnetic heading variation in Style 3 markedly elevate the risk of runway excursions during the touchdown phase. Examining the operational outcomes during the taxiing phase of Style 2, it is evident that the distance covered is significantly greater than the other two styles, indicating operational issues during this phase and an increased risk of runway excursions. To address the issue of excessive taxiing distance, particular attention can be given to the timing of reverse thrust activation and speed brake deployment. Regarding the problems of excessive touchdown distance and significant changes in magnetic heading, emphasis can be placed on directional control during landing, flare operations, and speed control.

4. Operational Analysis of Crucial Stages

4.1. Runway Threshold

In the QAR data, different parameters exhibit varying frequencies of change. For instance, the control column records at a rate of eight times per second, while the airspeed records at a rate of four times per second. Therefore, in this section, we calculate the maximum and minimum positions of the control and attitude parameters at each stage based on the parameter changes. Based on the monitoring indicators, we conduct an analysis of the average and standard deviation for each style of results. During the selection of monitoring points, we integrated the guidelines outlined in the Flight Crew Operations Manual. Consequently, we opted for the runway threshold, the flare phase, and touchdown as key monitoring points. Additionally, we considered the actual deceleration operations performed during landing, which led us to include “Speed brake on” and “reverse thrust on” as additional monitoring points.
This paper presents a basic statistical analysis of the recorded data from the Quick Access Recorder, including the position of the control column, aircraft attitude, speed, and other related parameters. The distribution of these parameters is displayed in this paper. Average is used to reflect the overall distribution of the data, while standard deviation is used to indicate the degree of variation within the dataset. Standard error is utilized to express the discrepancy between the sample average and the population average.
At the runway threshold, as shown in Table 2, the mean maximum position of the Style 3 control column is 14.12 deg, with a mean minimum position of −14.23 deg and a standard deviation of 14.03 deg and 12.40 deg. This indicates that the range of operation for the Style 3 control column is greater than that of the other two styles, and Style 3 exhibits a higher level of dispersion, necessitating a more in-depth analysis. Furthermore, above the aircraft at the runway threshold, the mean of the third-style wind speed is the highest at 9.28 knots, indicating significant influence from the wind. This suggests that within the third style, the variation in aircraft heading and the positional changes of the pilot operating the control column are influenced by wind. Under strong wind conditions, improper operation may pose a risk of lateral runway excursion.

4.2. Moment of Flare and Speed Brake On

In the 737 Crew Procedures Operations Manual, it is stated that when the main wheels are approximately 20 feet from the runway, the pilot should begin flare and increase the pitch attitude by 2 degrees to 3 degrees. This will reduce the rate of descent of the aircraft. The moment of flare refers to the moment when the pilot adjusts the aircraft’s attitude in preparation for touchdown. At the flare stage, the overall magnitude of control column and control wheel operations for Style 3 exceeds that of the other two styles, as indicated in Table 3. This demonstrates that Style 3 operations are influenced by the wind, necessitating significant adjustments to the aircraft’s attitude through extensive manipulation. Under the influence of wind speed, the aircraft’s roll angle is significantly affected.
When the speed brake is deployed, as shown in Table 4, the inertial vertical speed of Style 1 is the highest among the three styles, with the ground speed also being the highest and a relatively large pitch angle. This indicates that Style 1 maintains significant speed and attitude at this stage.

4.3. Touchdown Moment and Reverse Thrust On

At the moment of touchdown, Style 1 exhibits the highest pitch angle and the lowest inertial vertical speed, as indicated in Table 5. However, during the preceding phase of flight, the vertical speed of Style 1 was notably higher than the other two styles, indicating that the deployment of the speed brake significantly reduced the vertical speed of Style 1.
Style 1 initiates reverse thrust when the ground speed is relatively high, as shown in Table 6, indicating that the pilots of Style 1 initiate reverse thrust at an early stage.

4.4. Holistic Analysis

During the holistic analysis, we focused primarily on the variations in the control column, pitch angle, angle of attack, and inertial vertical speed of the aircraft. The control column is the main device that controls the aircraft to perform flare and ground operations. Pitch angle is employed to analyze the aircraft’s attitude, and through controlling the pitch angle, one can adjust both the aircraft’s angle of attack and the elevator’s deflection, thereby modifying the lift and drag forces and maintaining control during landing. The analysis of inertial vertical speed and vertical acceleration provides valuable insights into the aircraft’s vertical performance and efficiency. The analysis of vertical acceleration is closely associated with flight loads and passenger comfort.
Based on Figure 2, Style 1 operation exhibits high velocity and significant inertial vertical speed, yet results in a short ground distance and an average touchdown duration of 9.74 s. This indicates that the pilot, in order to achieve a relatively short ground contact, maintains a substantial pitch angle post-flare, with the maximum pitch angle occurring when the deceleration board is engaged. Analysis of the angle of attack at various points reveals that Style 1 consistently sustains a heightened angle post-flare, whereby increasing the angle of attack at the critical angle yields a greater lift coefficient. This serves to expedite the reduction in inertial vertical speed, resulting in effective vertical speed control. Although the vertical acceleration during landing is generally large, appropriate management of touchdown load is achieved despite a relatively high ground speed during the landing process. Therefore, Style 1 can be characterized as an aggressive deceleration type.
Style 2 operations are relatively conservative, characterized by an extended touchdown duration averaging 11.03 s. A significant pitch angle is maintained at the runway threshold and during the flare, while the angle of attack remains relatively modest throughout, possibly to mitigate the risk of hard landings. However, this approach may result in insufficient reduction in inertial vertical speed. Additionally, the average speed during reverse thrust initiation is minimal, at 129.65 knots. Consequently, Style 2 can be classified as a conservative landing type.
Style 3 represents a wind-affected type of landing. With a touchdown duration of 10.49 s, the landing process is notably influenced by wind speed, resulting in significant roll angles and extensive control wheel input.
In light of the above, Style 1 can be considered a relatively radical operational approach. It clearly possesses advantages in mitigating the risk of runway excursion, as such maneuvers effectively reduce the touchdown distance. On the other hand, Style 3, characterized by larger control inputs and higher rates of heading change, increases the risk of runway excursion. The clustering center of this style exhibits the highest risk of runway excursion. Lastly, Style 2 is associated with a prolonged touchdown phase, inadequate descent rate control, and, consequently, an increased risk of runway excursion.
Upon analysis of the vertical acceleration, as depicted in Figure 3, it is evident that the average touchdown acceleration for Style 1 stands at 1.193 g. However, the maximum acceleration during the landing process reaches 1.336 g. Moreover, 28 flights within Style 1 experienced a maximum acceleration upon landing exceeding 1.5 g, with the highest recorded at 1.76 g, indicating a risk of excessive landing accelerations. This underscores that while increasing the aircraft’s attitude can reduce touchdown distance, it may also impact vertical loading and heighten the risk of excessive landing loads.

5. Calculation and Analysis of Curve Similarity

5.1. Standard Curve Filtering

In aviation companies, the technical proficiency of pilots is categorized into first officers, captains, and instructors. Among these, flight instructors hold the highest level of technical expertise and are further classified into local instructors and type-specific instructors. Type-specific instructors are primarily responsible for imparting operational and flight technical knowledge pertaining to specific aircraft models to pilots. They possess extensive flight experience and an in-depth understanding of particular aircraft types. Hence, a study was conducted to select control column operation curves based on the technical proficiency of pilots. This involved evaluating the touchdown distance and directional control of 150 type-specific instructors from 10 different flying squadrons. Subsequently, two standard operating curves were selected for analysis based on the selection of metrics such as touchdown distance, taxiing distance, and magnetic heading change, as shown in Figure 4. The first curve represents normal operational conditions, while the second curve reflects the impact of strong winds, with wind speeds of 18 knots. The operational curves encompass the range from the runway threshold to touchdown.

5.2. Curve Similarity Calculation

In order to conduct a comprehensive study of control column operational curves, this paper adopts curve similarity as the basis, taking into account specific problems and data characteristics. It utilizes statistical indicators and measurement methods that are relevant to operational curves to effectively compare and evaluate the degree of similarity among the curves. The similarity of curves involves comparing sample curves with standard curves to analyze flight operations from multiple perspectives. This approach does not diminish the individual characteristics of operations and allows for the measurement of landing operations based on overall trends, translation changes, and scaling changes. As the lengths of the operational curves vary, interpolation is utilized to align the curve lengths. Adjusting the length of a curve using interpolation is a mathematical method used to change the length of a curve by adding or subtracting data points to a given curve. When calculating curve similarity, the code is written to set the standard curve under normal conditions as the regular curve. When wind speed exceeds 17 knots, equivalent to Beaufort scale 5, the wind-influenced curve is used as the standard curve.
Trend: Utilizing the polyfit function in MATLAB R2018a, a least squares linear fit is applied to the standard curve and the operational curve, yielding a slope defined as trend. A trend value closer to 1 indicates that the operational curve closely aligns with the standard curve. The formula is expressed as follows:
T r e n d = X i Y i X S ¯ Y S ¯ Σ X i 2 n Y S 2 ,
Vertical scaling: This formula represents the proportional relationship between the operational curve’s magnitude and the standard curve. A value greater than 1 indicates that the overall operational magnitude is less than that of the standard curve, while a value closer to 1 suggests a similarity in operational magnitude. The formula is expressed as follows:
V e r t i c a l   s c a l i n g = Y s max Y s m i n Y max Y m i n ,
Horizon scaling: This metric reflects the proportional relationship between the duration of the operational curve and the standard curve. The formula is expressed as follows:
H o r i z o n   s c a l i n g = X s max X s m i n X max X m i n ,
R squared: This metric evaluates the degree of fit between the predicted curve and the standard curve. SSR is the sum of squared residuals, and SST is the total sum of squares. The formula is expressed as follows:
S S R = i = 1 n Y P Y m 2 ,
S S T = i = 1 n Y s Y m 2 ,
R   s q u a r e d = S S Q S S T ,
Mean squared error: It calculates the average of the squared errors between the predicted curve and the actual standard curve, providing an indication of the disparity between the predicted curve and the standard curve. The formula is expressed as follows:
M S E = Y P Y S 2 n ,
Shift: Shift refers to the average absolute difference between the mean of the standard curve and the mean of the operational curve. The formula is as follows:
S h i f t = Y s Y m n ,
Curve correlation: This metric calculates the degree of match between the operational curve and the standard curve using the Pearson correlation coefficient. The formula is as follows:
C u r v e   c o r r e l a t i o n = i = 1 n X i X S ¯ Y i Y s ¯ i = 1 n X i X S ¯ 2 i = 1 n Y i Y S ¯ 2 ,
where X and Y represent the abscissa and ordinate of the operational curve, X s and Y s denote the abscissa and ordinate of the standard curve, X m and Y m stand for the mean ordinate of the standard curve, and X p and Y p correspond to the abscissa and ordinate of the predicted curve. Table 7 presents partial calculation results.

5.3. Flare Stage Prediction Curves

Upon completion of the curve similarity calculation, the predicted curve can be computed based on the trend to serve as a training reference for the control column operational curve, providing guidance for pilots’ landing flare operation training. Figure 5 compares the original control column QAR data with the predicted curve, with a time unit of 0.125 s.
Figure 5 depicts the comparison between the original and predicted operational curves for the two flights with the greatest touchdown distances in Style 3. It is evident that the predicted curve exhibits greater control column manipulation than the operational curve. Based on the control column positions indicated by the predicted curve, it is inferred that these two pilots can appropriately initiate the flare operation earlier to reduce the touchdown distance based on the actual circumstances.

5.4. Typical Correlation Analysis

Typical correlation analysis is a multivariate statistical analysis method that reflects the overall correlation between two sets of variables by utilizing the interrelationships among comprehensive variables. It is commonly employed in the fields of economics and biology. In this study, the curve similarity calculation indicators are designated as one set, while the other set comprises touchdown distances. The aim is to compute and analyze the correlation between these sets, investigating the nature of the differences with the standard curve and identifying the highest correlation with touchdown distance.
When conducting bivariate correlation analysis between the curve similarity indicators and touchdown distances, it was observed that trend, horizontal scaling, vertical scaling, and shift exhibited a significant but weak correlation with the touchdown distance, as shown in Table 8. Table 9 shows the results of the calculation of the typical correlation for Style 3, where it can be seen that the significance is obviously less than the set significance level of 0.05, then the typical correlation can be considered significant. To comprehensively investigate the collective impact of these indicators on touchdown distances, canonical correlation analysis was employed, as depicted in Table 10.
Following comprehensive computation and analysis, a notable correlation was observed between touchdown distances and curve similarity indicators. Within Style 3, the indicators demonstrated a moderate correlation with touchdown distances, as depicted in Table 10. Notably, the trend exhibited a substantial impact on the correlation, followed by curve similarity and shift. This highlights the operational trend of the pilot as a significant factor influencing touchdown distances.
After conducting a correlation analysis between all the indicators of curve similarity and touchdown distance, it was observed that the indicators of Style 3 exhibited the highest coefficient of correlation with the touchdown distance. It is noteworthy that the influence of wind speed on this correlation was found to be notable. This suggests that the operations associated with Style 3 have an effective impact on the touchdown distance, particularly in mitigating the risk of runway excursion under the influence of wind. Additionally, the typical correlation coefficient of Style 1 was found to be moderately correlated, indicating that the operations associated with Style 1 effectively affect the touchdown distance and contribute to the control of runway excursion risks.

6. Conclusions

In this study, we investigated the operational risks associated with runway excursions and conducted an analysis of pilots with different operational styles based on curve similarity to explore the factors influencing touchdown distances. The research findings indicate that Style 2 pilots exhibit conservative operational behaviors, resulting in greater touchdown and landing distances, thereby elevating the risk of runway excursions. Style 1 pilots tend to maintain a higher pitch angle prior to touchdown to dissipate energy and reduce vertical speed. However, under high attitude and vertical speed flight conditions, susceptibility to wind shear may lead to tail strikes and hard landings. Ultimately, an analysis of pilot operations based on curve similarity was conducted, comparing them with a standard curve across seven dimensions using canonical correlation analysis to explore their relationship with touchdown distances. The final discovery reveals that the trend component in curve similarity has the greatest impact on the correlation between touchdown distance and operations. Utilizing the predictive curve obtained from the trend provides valuable guidance to pilots in performing the flare operation.
These studies still have limitations, as some methods are in the exploratory stage and require more in-depth analysis for better understanding and application, with limited consideration of environmental factors. Firstly, while this paper addresses the impact of wind, it only considers wind speed and does not provide a thorough analysis of wind direction. In future research on the effects of wind on control wheel operations, we will analyze wind direction, wind speed, and the angle between wind direction and heading. Secondly, although this paper analyzes operations, operational risks have not yet been quantified. We plan to establish a model for evaluating the risk of runway excursions based on the operational process and outcomes. Thirdly, in the study of environmental impact, due to the lack of weather data and runway surface data, the influence of runway friction coefficient in rainy and snowy conditions has not been considered. The runway friction coefficient is an important factor affecting the risk of runway excursions, and this will be taken into account in future studies.
Our current research is focused on examining the risk of runway excursions for a single landing airport and a single aircraft type. However, we recognize the need to expand our study to include multiple airports and various aircraft types. In the future, we plan to develop a comprehensive analysis of runway excursion operations and a risk assessment model.

Author Contributions

Conceptualization, F.W. and J.Y.; methodology, J.Y.; software, J.Y.; validation, J.Y. and F.W.; formal analysis, J.Y.; investigation, F.W. and X.L. (Xiaochen Liu); resources, X.L. (Xiaoyu Li); data curation, J.Y.; writing—original draft preparation, F.W.; writing—review and editing, M.X.; visualization, F.W.; supervision, M.X.; project administration, P.W. and H.L.; funding acquisition, H.L. All authors have read and agreed to the published version of the manuscript.

Funding

This research was funded by the Scientific Research Program of the Tianjin Education Commission (grant number 2023KJ230).

Institutional Review Board Statement

Not applicable.

Informed Consent Statement

Not applicable.

Data Availability Statement

Restrictions apply to the availability of these data. Data was obtained from an airline and are available from the authors with the permission of the airline.

Conflicts of Interest

The authors declare no conflicts of interest.

Abbreviations

The following abbreviations are used in this manuscript:
MDPIMultidisciplinary Digital Publishing Institute
QARQuick Access Recorder
IATAInternational Air Transport Association
SHELLOSoftware; Hardware; Environment; Liveware; Other Liveware; Organization
GTTGreedy Thick Thinning algorithm
IMTCNInterpretable Multi-scale Temporal Convolutional Networks
LSTM-DNNLong Short-Term Memory and Deep Neural Networks
ACARSAircraft Addressing and Reporting System
VRTGVertical Acceleration
SSRSum of Squared Residuals
SSTTotal Sum of Squares

References

  1. IATA. IATA Safety Report 2021; IATA: Montreal, QC, Canada, 2022. [Google Scholar]
  2. IATA. IATA Annual Safety Report-2022; IATA: Montreal, QC, Canada, 2023. [Google Scholar]
  3. Airbus, S.A.S. A Statistical Analysis of Commercial Aviation Accidents 1958–2022. 2023. Available online: https://accidentstats.airbus.com (accessed on 19 November 2023).
  4. Okafor, E.G.; Jemitola, P.O.; Soladoye, M.A. Assessment of runway excursion causal factors and mitigation strategies. Niger. J. Technol. 2018, 37, 619–625. [Google Scholar] [CrossRef]
  5. Chang, Y.; Yang, H.; Hsiao, Y. Human risk factors associated with pilots in runway excursions. Accid. Anal. Prev. 2016, 94, 227–237. [Google Scholar] [CrossRef]
  6. Zhang, Y.; Sun, Y.; Chen, Y. Aircraft runway excursion prediction model based on exponential weight. In Proceedings of the 2016 11th International Conference on Reliability, Maintainability and Safety (ICRMS), Hangzhou, China, 26–28 October 2016; pp. 1–5. [Google Scholar]
  7. Wang, L.; Ren, Y.; Wu, C. Effects of flare operation on landing safety: A study based on ANOVA of real flight data. Saf. Sci. 2018, 102, 14–25. [Google Scholar] [CrossRef]
  8. Li, X.; Zhang, L.; Shang, J.; Li, X.; Qian, Y.; Zheng, L. A Runway Overrun Risk Assessment Model for Civil Aircraft Based on Quick Access Recorder Data. Appl. Sci. 2023, 13, 9828. [Google Scholar] [CrossRef]
  9. Lv, H.; Yu, J.; Zhu, T. A novel method of overrun risk measurement and assessment using large scale QAR data. In Proceedings of the 2018 IEEE Fourth International Conference on Big Data Computing Service and Applications (BigDataService), Bamberg, Germany, 26–29 March 2018; IEEE: Piscataway, NJ, USA, 2018; pp. 213–220. [Google Scholar]
  10. Distefano, N.; Leonardi, S. Aircraft runway excursion features: A multiple correspondence analysis. Aircr. Eng. Aerosp. Tec. 2019, 91, 197–203. [Google Scholar] [CrossRef]
  11. Wang, J.; Zhang, Y.; Zhang, C. Unsafe control action of runway excursion based on STPA. J. Civ. Aviat. Univ. China 2019, 37, 46–50. [Google Scholar]
  12. Odisho, E.; Truong, D.; Joslin, R.E. Applying Machine Learning to Enhance Runway Safety Through Runway Excursion Risk Mitigation. In Proceedings of the 2021 Integrated Communications Navigation and Surveillance Conference (ICNS), Dulles, VA, USA, 19–23 April 2021; pp. 1–10. [Google Scholar]
  13. Olive, X.; Bieber, P. Quantitative Assessments of Runway Excursion Precursors using Mode S data. arXiv 2019, arXiv:1903.11964. [Google Scholar]
  14. Di Mascio, P.; Cosciotti, M.; Fusco, R.; Moretti, L. Runway Veer-Off Risk Analysis: An International Airport Case Study. Sustainability 2020, 12, 9360. [Google Scholar] [CrossRef]
  15. Distefano, N.; Leonardi, S. Apriori Algorithm for Association Rules Mining in Aircraft Runway Excursions. Civ. Eng. Archit. 2020, 8, 206–217. [Google Scholar]
  16. Ketabdari, M.; Toraldo, E.; Crispino, M. Numerical Risk Analyses of the Impact of Meteorological Conditions on Probability of Airport Runway Excursion Accidents. In Computational Science and Its Applications–ICCSA 2020, Proceedings of the 20th International Conference, Cagliari, Italy, 1–4 July 2020; Springer: New York, NY, USA, 2020; Volume 12249, pp. 177–190. [Google Scholar]
  17. Vorobyeva, O.; Bartok, J.; Šišan, P.; Nechaj, P.; Gera, M.; Kelemen, M.; Polishchuk, V.; Gaál, L. Assessing the Contribution of Data Mining Methods to Avoid Aircraft Run-Off from the Runway to Increase the Safety and Reduce the Negative Environmental Impacts. Int. J. Environ. Res. Public Health 2020, 17, 796. [Google Scholar] [CrossRef]
  18. Mauro, R.; Sherry, L. Confronting Functional Complexity Failures: The Case of a Runway Excursion in Munich. In Proceedings of the Human Factors and Ergonomics Society Annual Meeting, Washington, DC, USA, 28 October–1 November 2019; Volume 63, pp. 116–120. [Google Scholar]
  19. Wang, C.; Holzapfel, F. Modeling of the aircraft landing behavior for runway excursion and abnormal runway contact analysis. In Proceedings of the 2018 AIAA Modeling and Simulation Technologies Conference, Atlanta, Georgia, 25–27 June 2018; p. 1166. [Google Scholar]
  20. Wang, L.; Sun, R.; Wu, C.; Cui, Z.; Lu, Z. A flight QAR data based model for hard landing risk quantitative evaluation. China Saf. Sci. J. 2014, 24, 88–92. [Google Scholar] [CrossRef]
  21. Wang, L.; Sun, J.; Wang, W.; Qi, X.; Wang, F. Bayesian network analysis model on landing exceedance risk based on flight OAR data. J. Saf. Environ. 2023, 23, 26–34. [Google Scholar] [CrossRef]
  22. Wang, L.; Wu, C.; Sun, R. An analysis of flight Quick Access Recorder (QAR) data and its applications in preventing landing incidents. Reliab. Eng. Syst. Saf. 2014, 127, 86–96. [Google Scholar] [CrossRef]
  23. Wang, L.; Gao, S.; Hong, R.; Jiang, Y. Effects of age and flight exposure on flight safety performance: Evidence from a large cross-sectional pilot sample. Saf. Sci. 2023, 165, 106199. [Google Scholar] [CrossRef]
  24. Zhang, N.; Zhao, D.; An, J.; Wang, L. A Method of Analyzing Flight Exceedance Events Based on Association Rule and QAR Data. In Proceedings of the 2023 7th International Conference on Transportation Information and Safety (ICTIS), Xi’an, China, 4–6 August 2023; pp. 2249–2252. [Google Scholar]
  25. Li, X.; Shang, J.; Zheng, L.; Wang, Q.; Liu, D.; Liu, X.; Li, F.; Cao, W.; Sun, H. IMTCN: An Interpretable Flight Safety Analysis and Prediction Model Based on Multi-Scale Temporal Convolutional Networks; IEEE Transactions on Intelligent Transportation Systems: New York, NY, USA, 2023. [Google Scholar] [CrossRef]
  26. Chen, N.; Man, Y.; Li, J. Risk Assessment Method of Civil Aircraft Approach and Landing at High Plateau Based on QAR Data. J. Beijing Univ. Aeronaut. Astronaut. 2022. [Google Scholar] [CrossRef]
  27. Westphal, P.; Wagner, O. Flight accident prevention with hazard priority based realtime risk reduction. In Proceedings of the 19th AIAA Applied Aerodynamics Conference, Anaheim, CA, USA, 11–14 June 2001; p. 1319. [Google Scholar]
  28. Nie, L.; Huang, S.; Shu, P.; Wang, X. Intelligent Diagnosis for Hard Landing of Aircraft Based on SVM. China Saf. Sci. J. 2009, 19, 5. [Google Scholar]
  29. Gong, S.; Huang, S. Implementation of Flight Data Quick Decoding System. Sci. Technol. Eng. 2010, 10, 5076–5081. [Google Scholar]
  30. Zhao, Y.; Sun, H. Research on hybrid model for aircraft flight state prediction. N. A. Dynam. 2016, 34, 81–85+89. [Google Scholar] [CrossRef]
  31. Lu, H.; Deng, X. Real-time Flight Trajectory Security Monitoring Technology Based-on ACARS. Aircr. Des. 2009, 29, 52–56. [Google Scholar] [CrossRef]
  32. Fu, M.; Chen, J. LSTM Model-Based Flight Trajectory Prediction for Airport Flights. Mod. Comput. 2022, 28, 55–60. [Google Scholar]
  33. Qian, L.; Wang, W. A C-GRU based flight trajectory prediction method. Electron. Meas. Technol. 2022, 45, 87–92. [Google Scholar] [CrossRef]
  34. Wang, Q.; Wu, K.; Zhang, T.; Kong, Y.; Qian, W. Aerodynamic Modeling and Parameter Estimation from QAR Data of an Airplane Approaching a High-altitude Airport. Chin. J. Aeronaut 2012, 25, 361–371. [Google Scholar] [CrossRef]
  35. Korsun, O.; Poplavskii, B.K. Estimation of systematic errors of onboard measurement of angle of attack and sliding angle based on integration of data of satellite navigation system and identification of wind velocity. J. Comput. Syst. Sci. Int. 2011, 50, 130–143. [Google Scholar] [CrossRef]
  36. Sun, R.; Han, W. Analysis on paremeters characteristics of flight exceedance events based on distinction test. J. Saf. Sci. Technol. 2011, 7, 22–27. [Google Scholar]
  37. Wang, X.; Ma, F.; Liao, X.; Jiang, P.; Zhang, W.; Wang, F. Feature Selection for Recognition of Driving Styles Based on Multi-Classification and Supervised Learning. J. Transp. Inf. Saf. 2022, 40, 162–168. [Google Scholar]
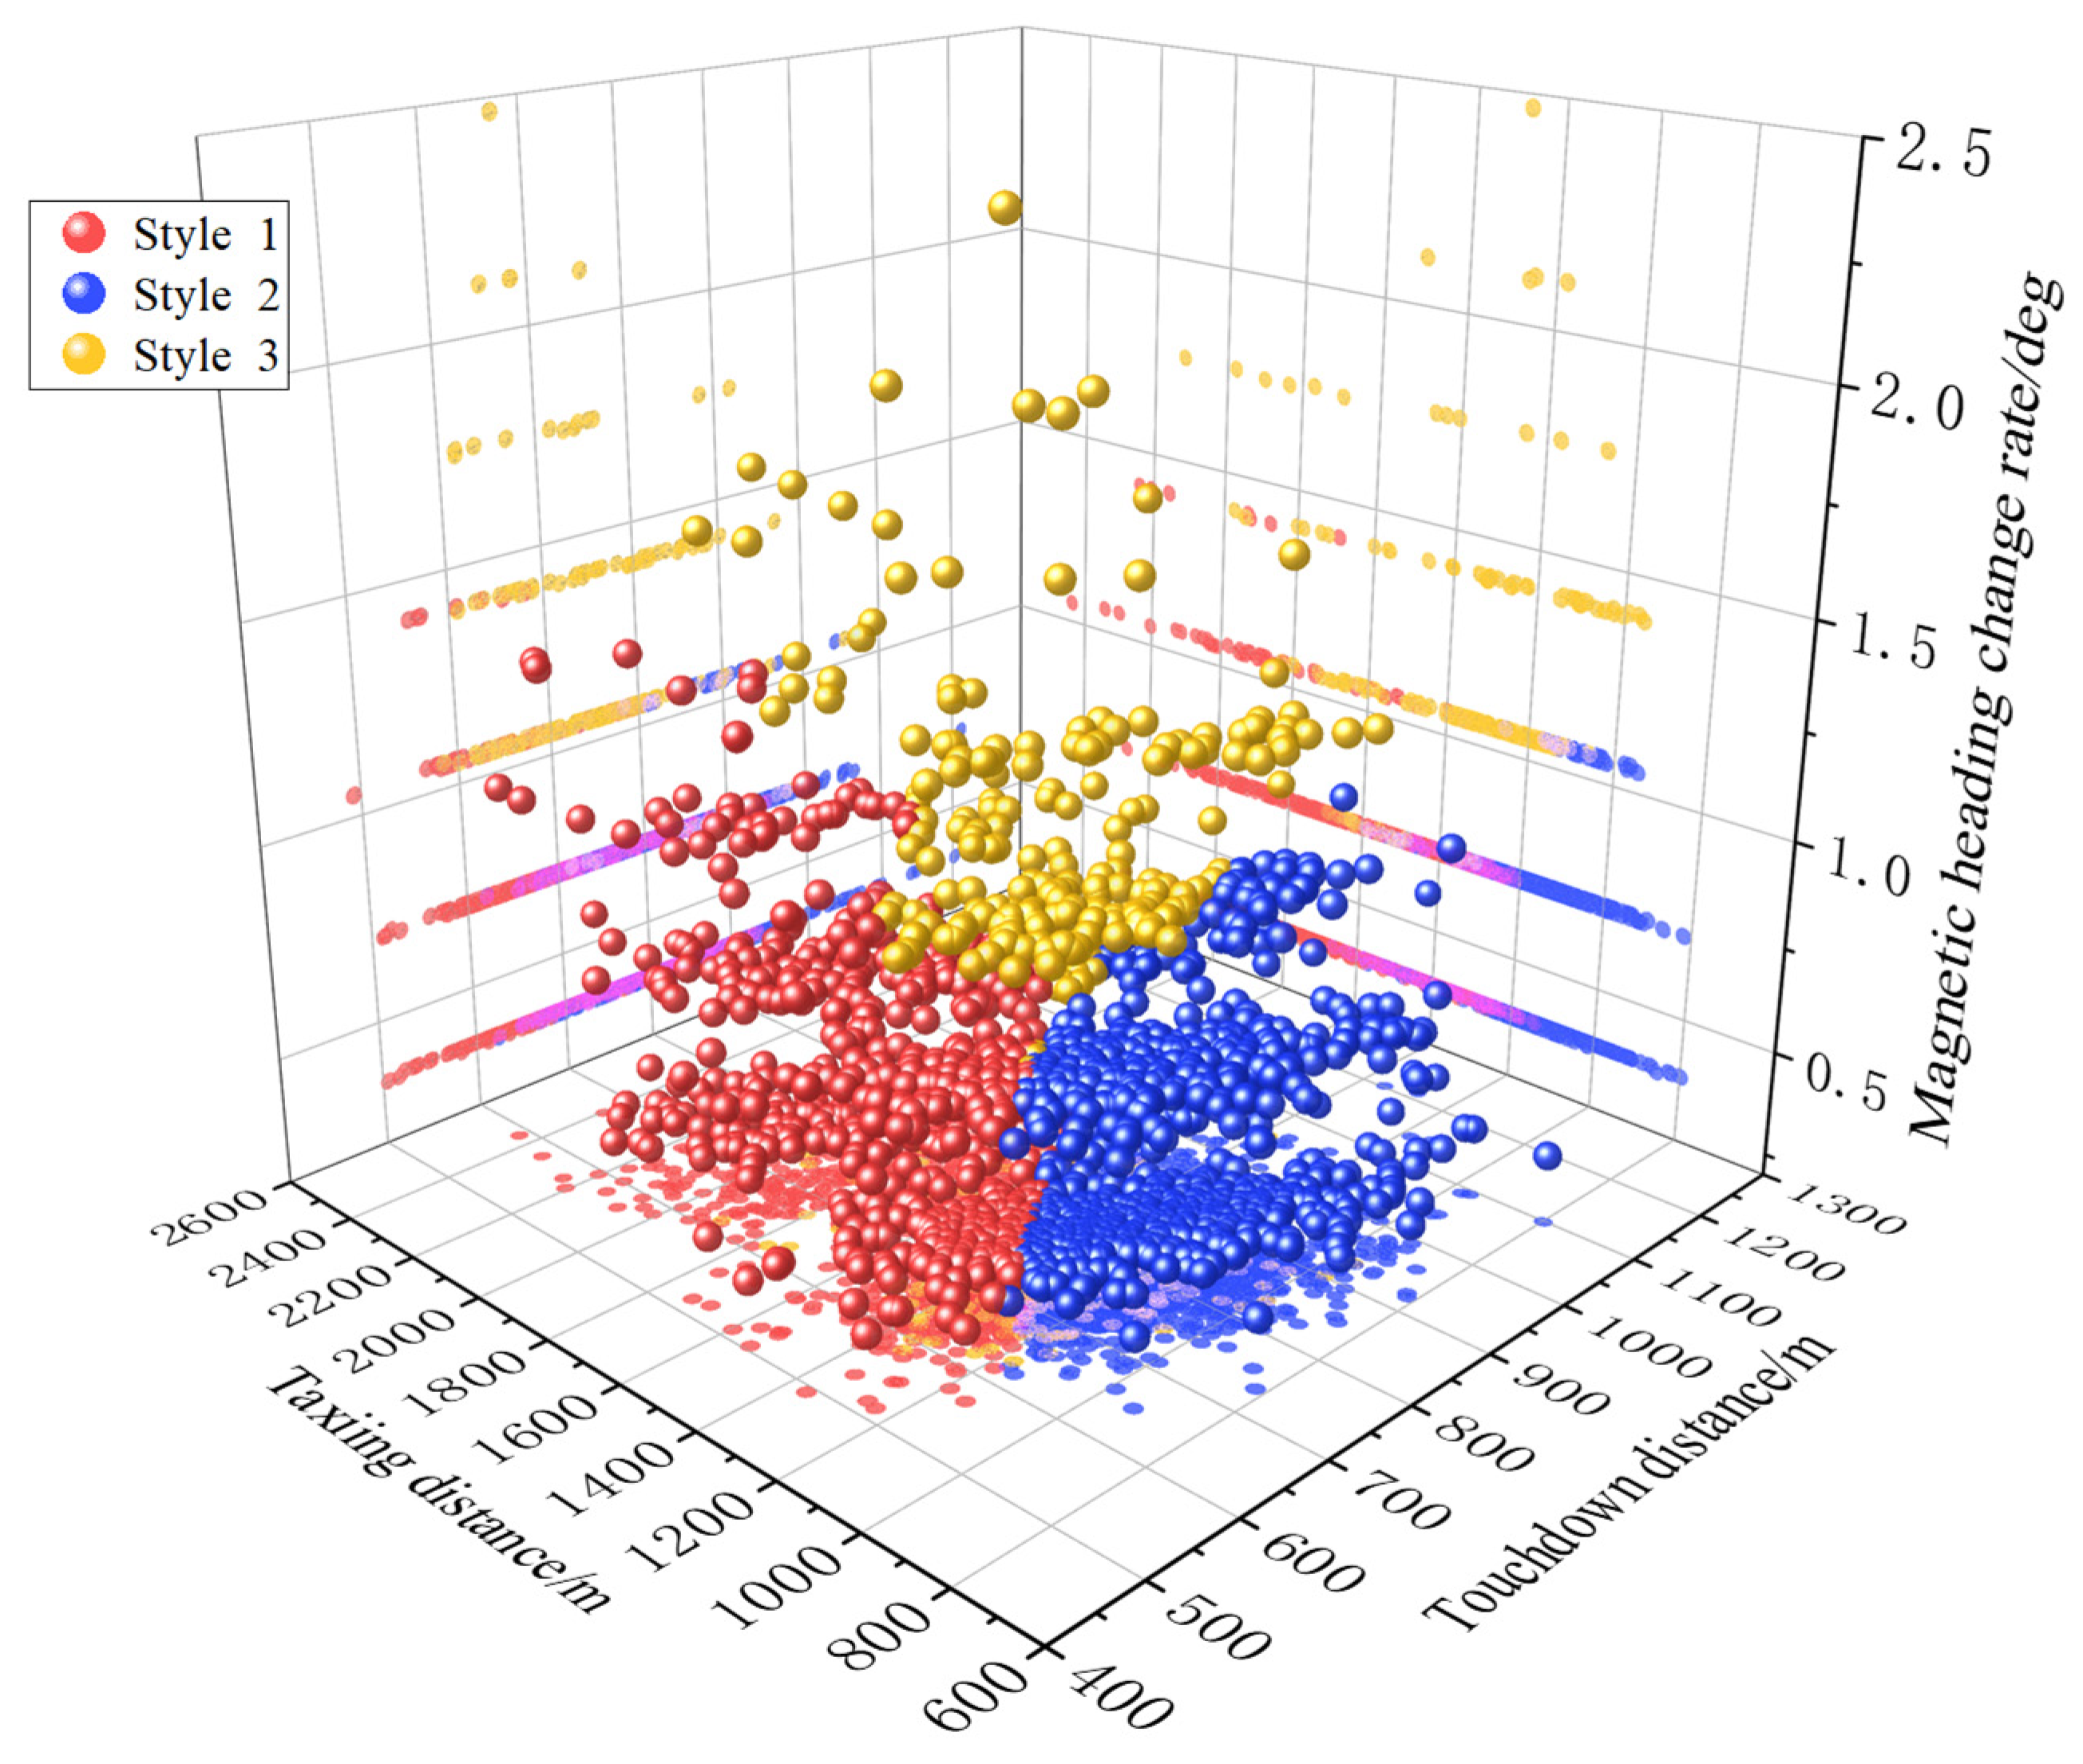
Figure 1. Three-dimensional clustering effect diagram.
Applsci 14 00975 g001
Figure 2. Comparison of aircraft attitude and control.
Applsci 14 00975 g002
Figure 3. Comparison of maximum vertical acceleration on touchdown and landing.
Applsci 14 00975 g003
Figure 4. Selection of standard curves.
Applsci 14 00975 g004
Figure 5. Comparison of projected and actual curves for control column operation.
Applsci 14 00975 g005
Table 1. Center of clustering.
CategorizationTouchdown DistanceTaxiing DistanceMagnetic Heading Change Rate
Style 1641.86 m1344.62 m0.36 deg
Style 2797.21 m1871.47 m0.36 deg
Style 3968.89 m1023.89 m1.05 deg
Table 2. The moment of runway threshold.
Monitoring IndicatorsAveragesStandard DeviationsStandard Errors
Style 1Maximum position of the control wheel13.23 deg11.290.41
Minimum position of the control wheel−11.04 deg11.860.43
Wind speed6.89 kt3.820.14
Style 2Maximum position of the control wheel12.23 deg10.780.32
Minimum position of the control wheel−9.86 deg11.390.34
Wind speed5.92 kt3.340.10
Style 3Maximum position of the control wheel14.12 deg14.030.96
Minimum position of the control wheel−14.23 deg12.400.86
Wind speed9.28 kt4.240.29
Table 3. The moment of flare.
Monitoring IndicatorsAveragesStandard DeviationsStandard Errors
Style 1Maximum position of the control wheel11.19 deg10.850.39
Minimum position of the control wheel−8.15 deg11.170.40
Maximum position of the control column3.24 deg1.100.04
Minimum position of the control column1.35 deg1.140.04
Pitch2.78 deg0.650.02
Roll0.29 deg0.860.03
Wind speed6.25 deg3.560.13
Style 2Maximum position of the control wheel10.26 deg10.480.32
Minimum position of the control wheel−6.65 deg10.960.33
Maximum position of the control column3.01 deg1.090.03
Minimum position of the control column1.40 deg1.120.03
Pitch2.84 deg0.600.02
Roll0.18 deg0.870.03
Wind speed5.47 deg3.020.09
Style 3Maximum position of the control wheel13.41 deg12.570.87
Minimum position of the control wheel11.35 deg12.490.86
Maximum position of the control column3.38 deg1.360.09
Minimum position of the control column1.06 deg1.340.09
Pitch2.78 deg0.660.05
Roll0.33 deg1.000.07
Wind speed8.81 deg4.170.29
Table 4. The moment of speed brake on.
Monitoring IndicatorsAveragesStandard DeviationsStandard Errors
Style 1Inertial vertical speed−184.23 ft/min58.392.10
Groundspeed142.81 kt6.780.24
Airspeed141.60 kt5.680.20
Pitch3.68 deg0.590.02
Style 2Inertial vertical speed−162.60 ft/min45.521.37
Groundspeed141.58 kt6.110.18
Airspeed139.91 kt5.450.16
Pitch3.63 deg0.570.02
Style 3Inertial vertical speed−173.03 ft/min52.073.59
Groundspeed142.59 kt6.900.48
Airspeed142.18 kt5.840.40
Pitch3.611 deg0.600.04
Table 5. The moment of touchdown.
Monitoring IndicatorsAveragesStandard DeviationsStandard Errors
Style 1Inertial vertical speed−110.14 ft/min61.852.22
Pitch3.02 deg0.710.03
Roll0.10 deg0.560.02
Wind speed5.18 kt2.820.10
Style 2Inertial vertical speed−123.20 ft/min58.821.77
Pitch2.92 deg0.660.02
Roll0.05 deg0.530.02
Wind speed4.69 kt2.570.08
Style 3Inertial vertical speed−124.11 ft/min58.344.03
Pitch2.91 deg0.660.05
Roll0.12 deg0.690.05
Wind speed7.48 kt3.540.24
Table 6. The moment of reverse thrust on.
Monitoring IndicatorsAveragesStandard DeviationsStandard Errors
Style 1Groundspeed130.68 kt8.040.29
Airspeed128.85 kt6.960.25
Style 2Groundspeed129.65 kt7.600.23
Airspeed127.26 kt6.730.20
Style 3Groundspeed129.78 kt8.220.57
Airspeed128.45 kt6.800.47
Table 7. Curve similarity calculation results.
No.TrendMSER SquaredHorizontal ScalingVertical ScalingShiftCurve
Correlation
Wind Speed/KnotsTouchdown Distance/m
10.752.670.341.491.881.710.5819.00577.74
20.652.280.431.211.191.950.6618.00492.93
31.001.520.520.931.181.650.729.00934.45
40.641.380.570.780.751.670.752.00704.31
50.951.440.551.241.142.000.748.00952.96
60.921.750.451.071.101.860.677.00952.19
71.031.050.670.860.981.620.8210.00584.93
80.403.260.191.101.021.870.4418.00609.60
91.041.120.650.901.101.600.812.001054.21
Table 8. Correlation coefficient with touchdown distance.
IndicatorsPearson CorrelationSignificance (Two-Tailed)
Trend0.201 **0.003
MSE0.0260.711
R squared−0.0630.363
Horizontal scaling0.202 **0.003
Vertical scaling0.223 **0.001
Shift0.236 **0.001
Correlation−0.0640.353
Wind speed−0.283 **0.000
** Indicates significant correlation.
Table 9. Typical correlations of Style 3.
StyleTypical
Correlation
EigenvalueWilks
Statistics
FMolecular
Freedom
Denominator
Freedom
Significance
30.5600.4580.68611.5068.000201.0000.000
Table 10. Standardized typical correlation coefficient.
StyleTypical CorrelationTrendMSER SquaredHorizontal ScalingVertical ScalingShiftCurve
Correlation
Wind Speed
10.4970.806−2.049−2.4570.260−0.0190.320−0.349−0.276
20.3431.109−0.6540.354−0.128−0.0050.492−2.1480.005
30.5601.404−0.181−0.594−0.357−0.0040.643−0.775−0.412
Disclaimer/Publisher’s Note: The statements, opinions and data contained in all publications are solely those of the individual author(s) and contributor(s) and not of MDPI and/or the editor(s). MDPI and/or the editor(s) disclaim responsibility for any injury to people or property resulting from any ideas, methods, instructions or products referred to in the content.

