
Behavioral Patterns of Drivers under Signalized and Unsignalized Urban Intersections


Abstract
Featured Application
Abstract
1. Introduction
- (1)
- The type of intersection affects a driver’s behavioral performance, but there are fewer studies on the differences in driving behaviors between signalized and unsignalized intersections, and the research in this paper fills the gap that exists in this area.
- (2)
- In this paper, the driver’s behavior when crossing an intersection is studied in stages, and the stages of the driving behavior pattern can reflect the different characteristics of the driving process, and this pattern is the inherent behavioral pattern of the driver. Therefore, it can help researchers to deeply understand the driving behaviors at intersections and provide theoretical behavior support for the research and design of safety systems afterwards.
- (3)
- Individual differences in driving behaviors based on intersection characteristics were assessed, i.e., the influence of personal characteristics such as gender and age on drivers’ physiological, psychological and operational performances. By addressing the interactive effects of personal characteristics as well as intersection characteristics on a driver’s intersection performance, the preferred behavioral patterns of different drivers are investigated. This case study of driving behavior patterns can inform personalized driving behavior modeling as well as vehicle system safety designs.
2. Materials and Methods
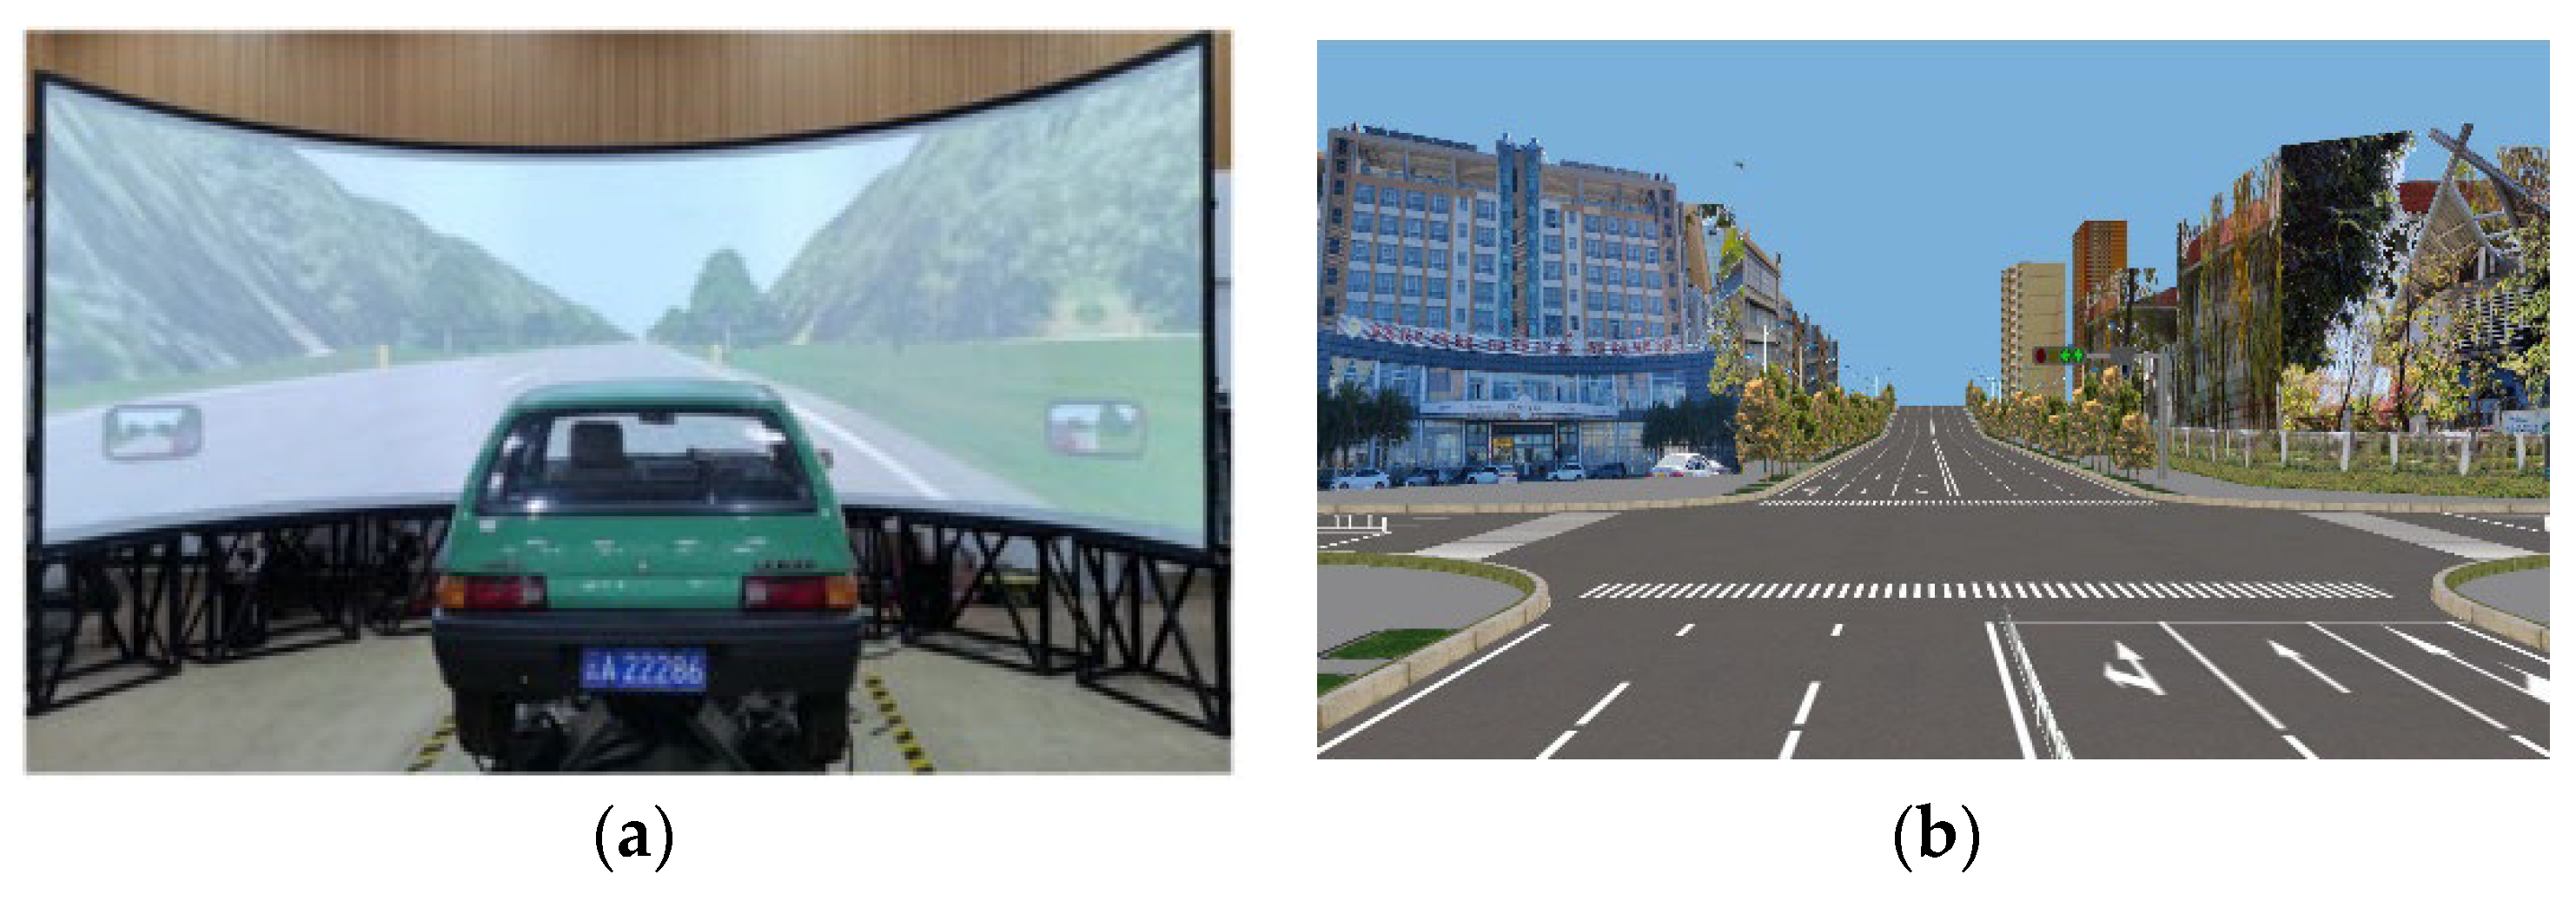
2.1. Experimental Equipment
2.2. Subjects
2.3. Experimental Steps
2.4. Experimental Scenarios
2.5. Analytical Methods
2.5.1. Generalized Linear Mixed Models (GLMM)
2.5.2. Indicator Selection
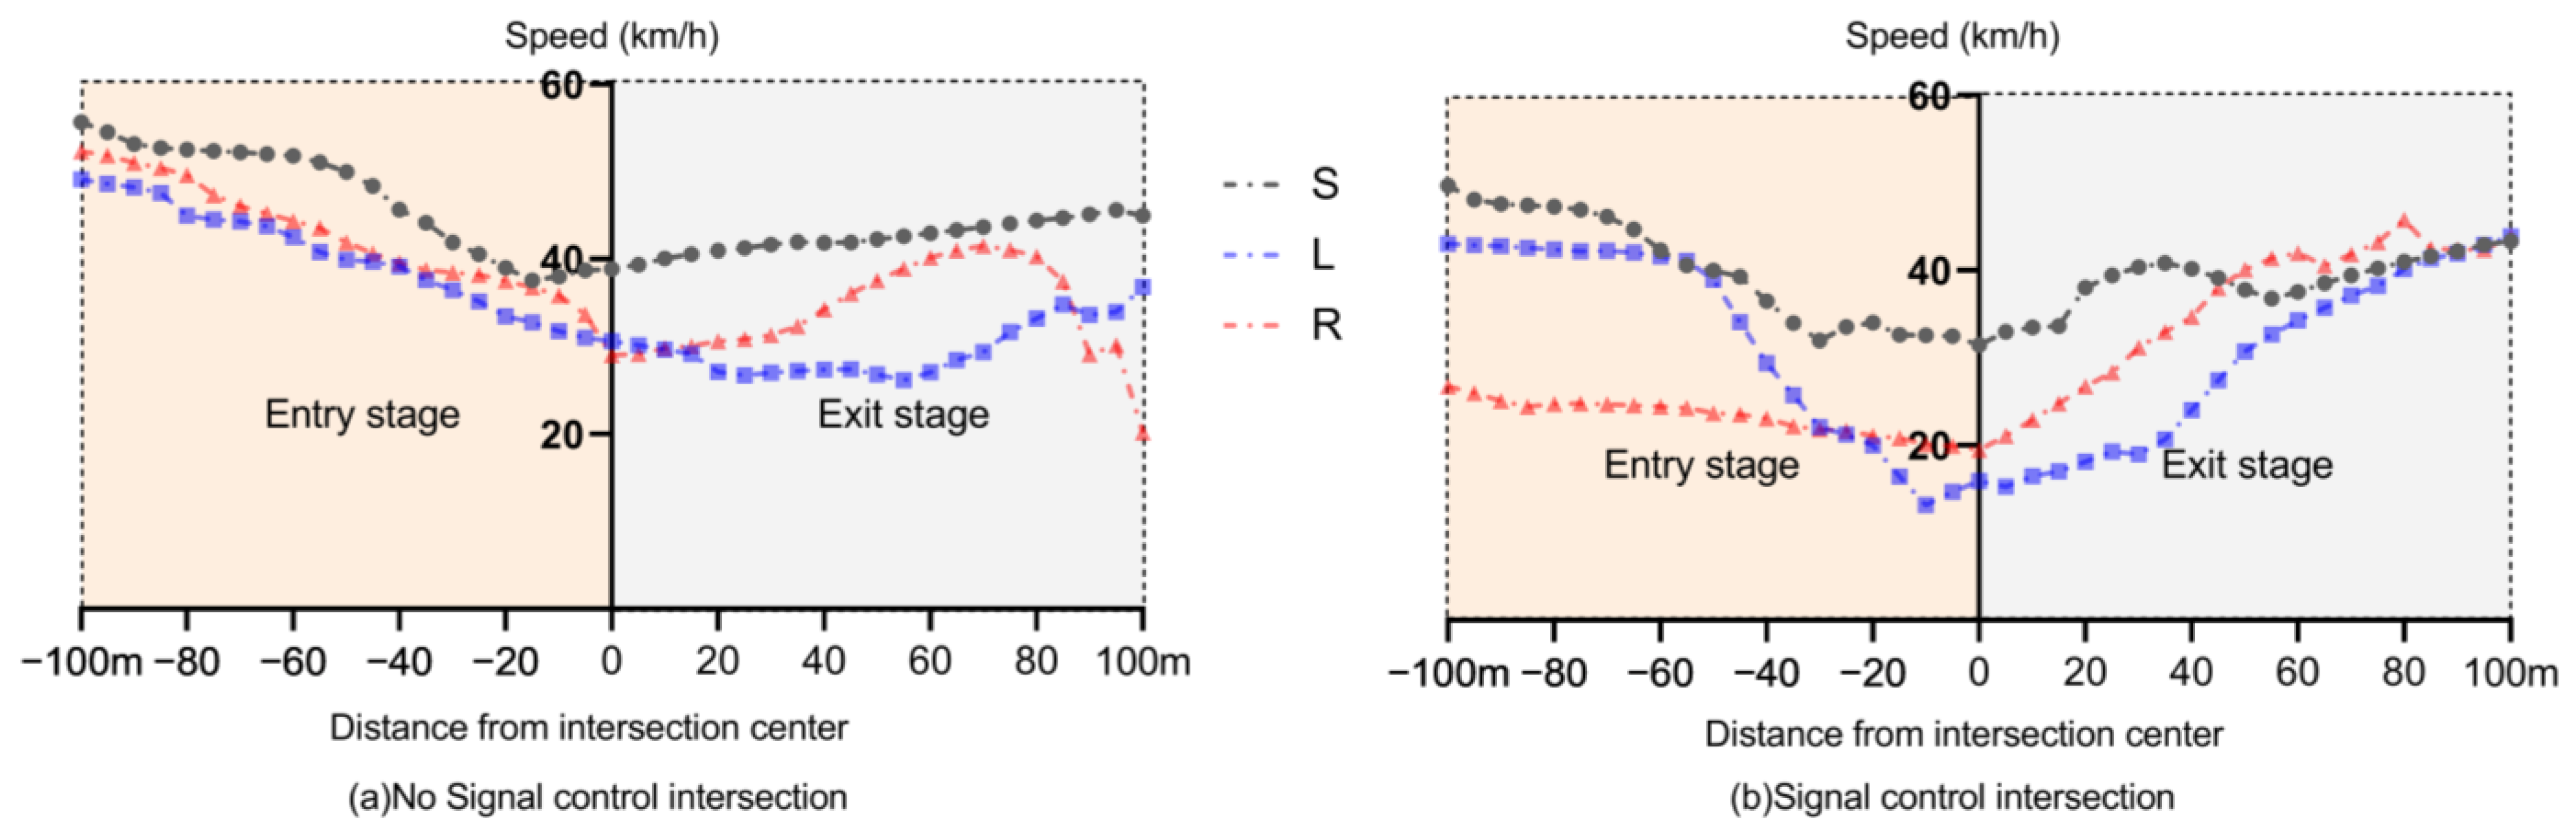
- Speed: Research [25] has shown a positive correlation between the average speed and accident occurrence within the speed limit range. Therefore, a comparison of the average speeds of drivers at different types of intersections can be conducted to evaluate their driving safety.
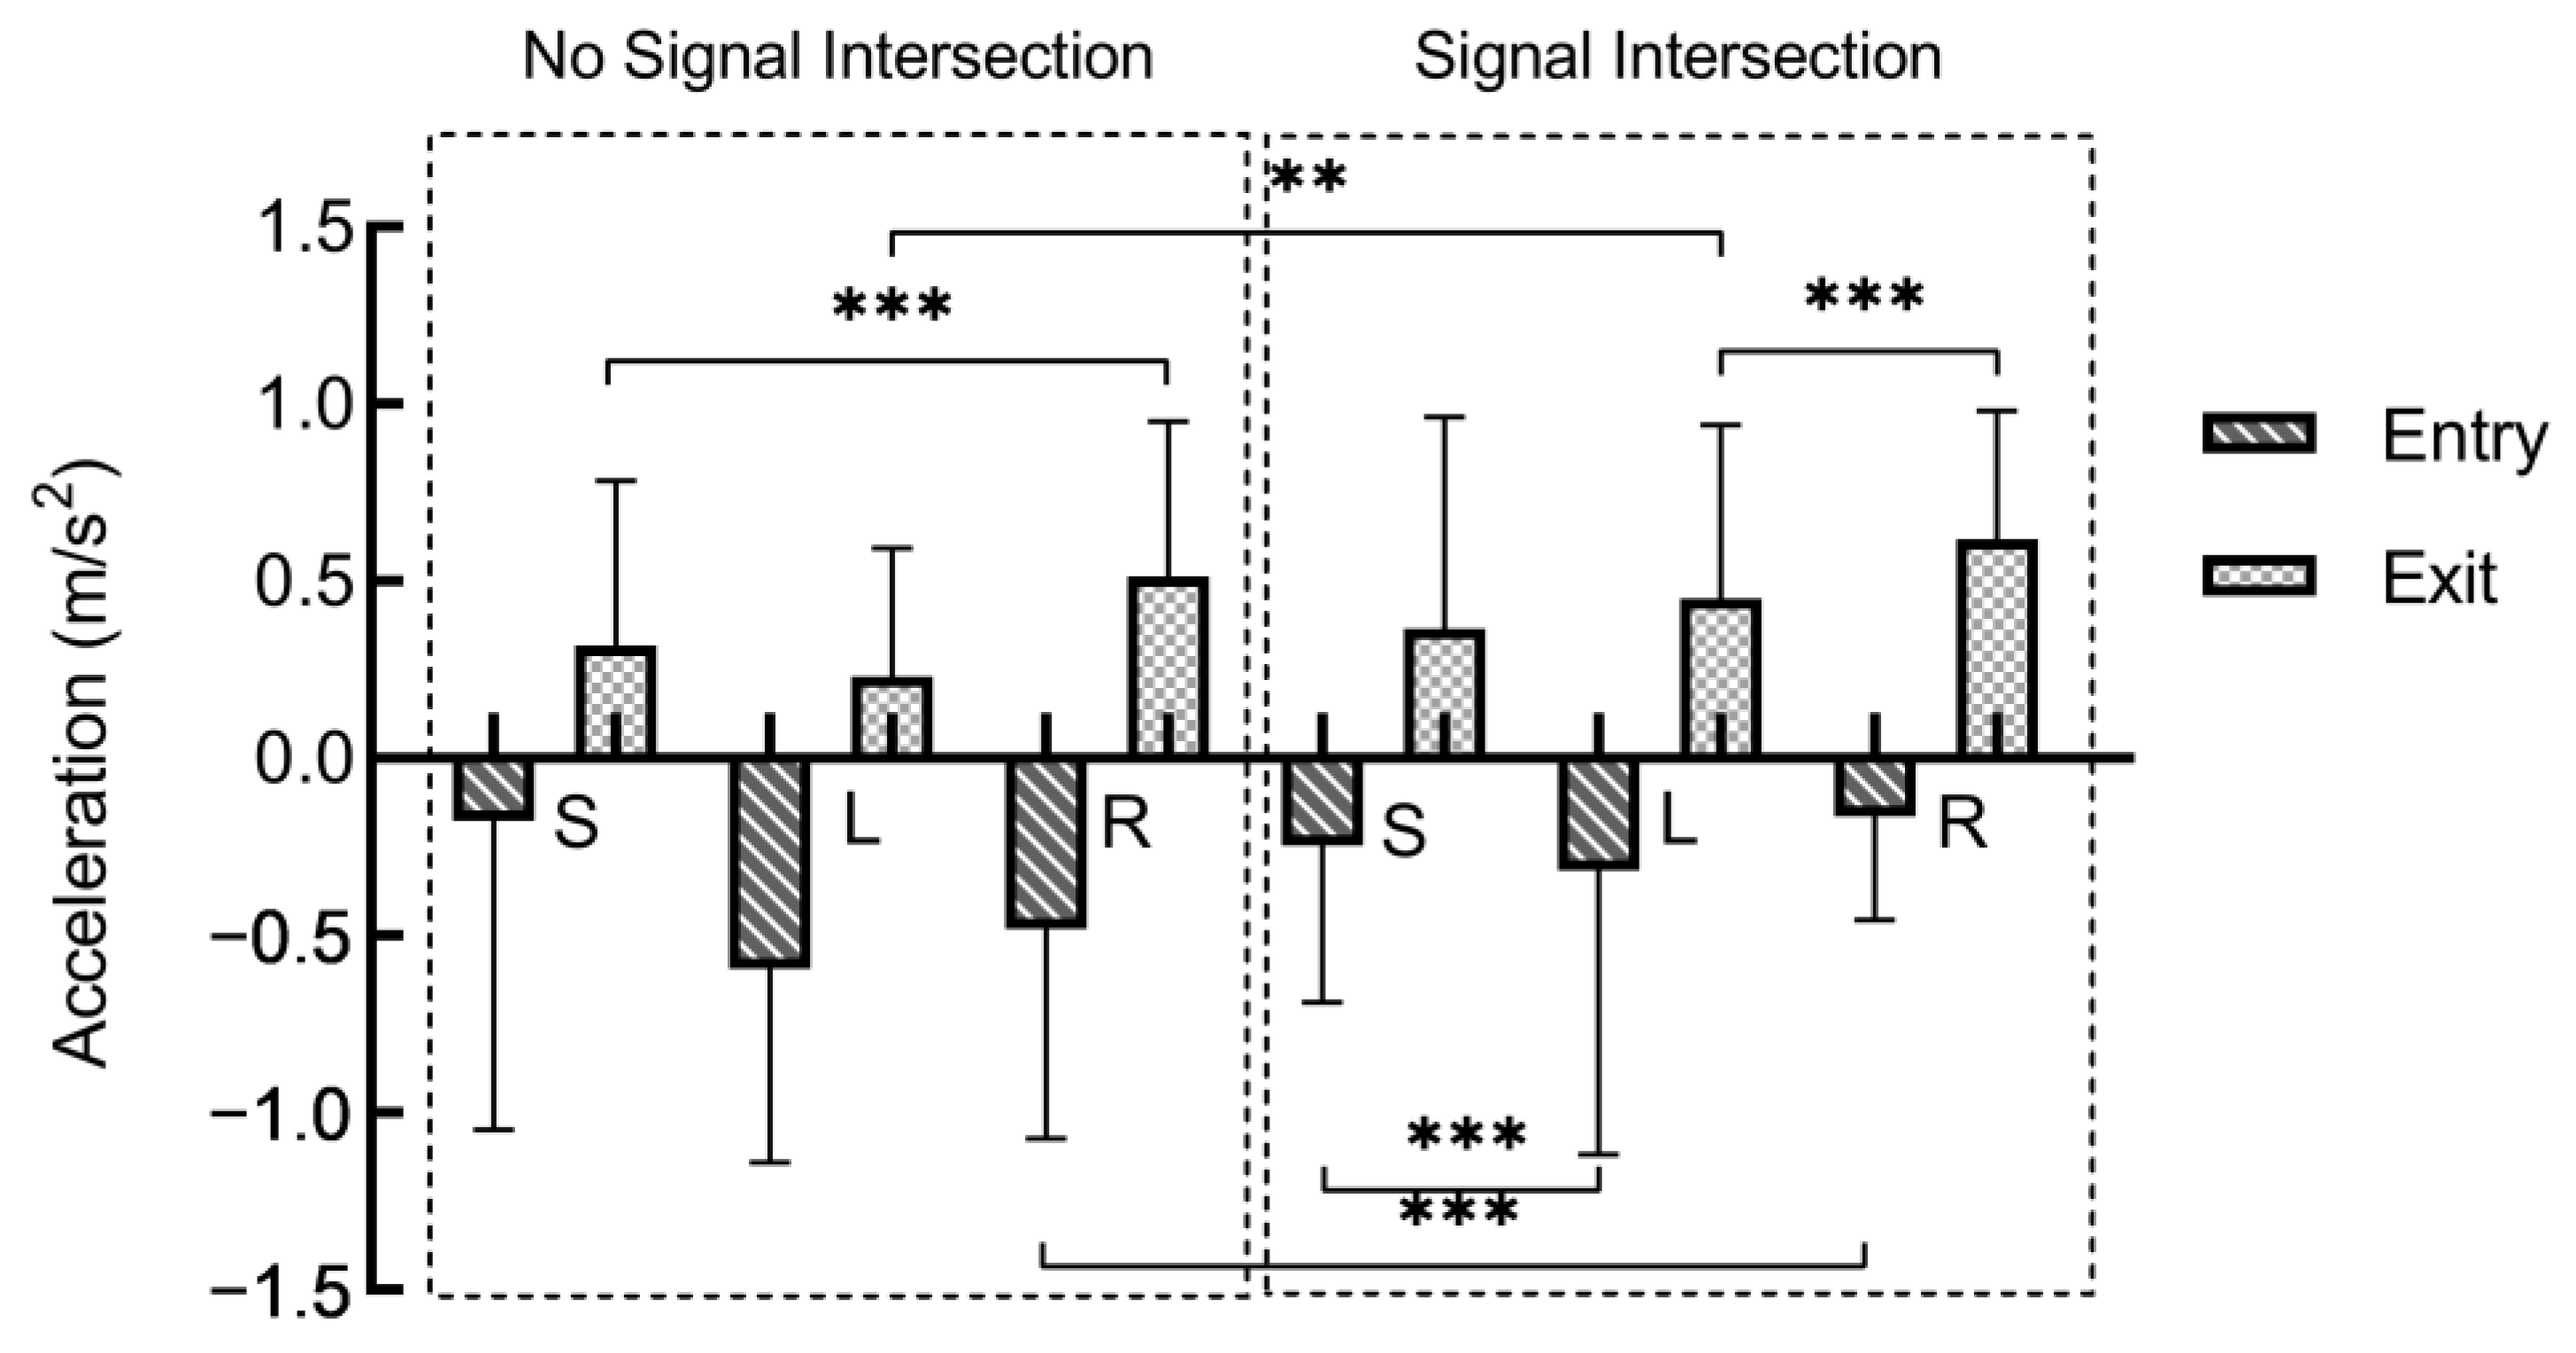
- Acceleration: Acceleration values are directly related to driving comfort. Generally, a lower acceleration indicates lower levels of driver psychological stress and increased driving comfort. A comparison of the acceleration levels can be made between drivers at signalized and unsignalized intersections to understand the differences in driving comfort and driving stability.
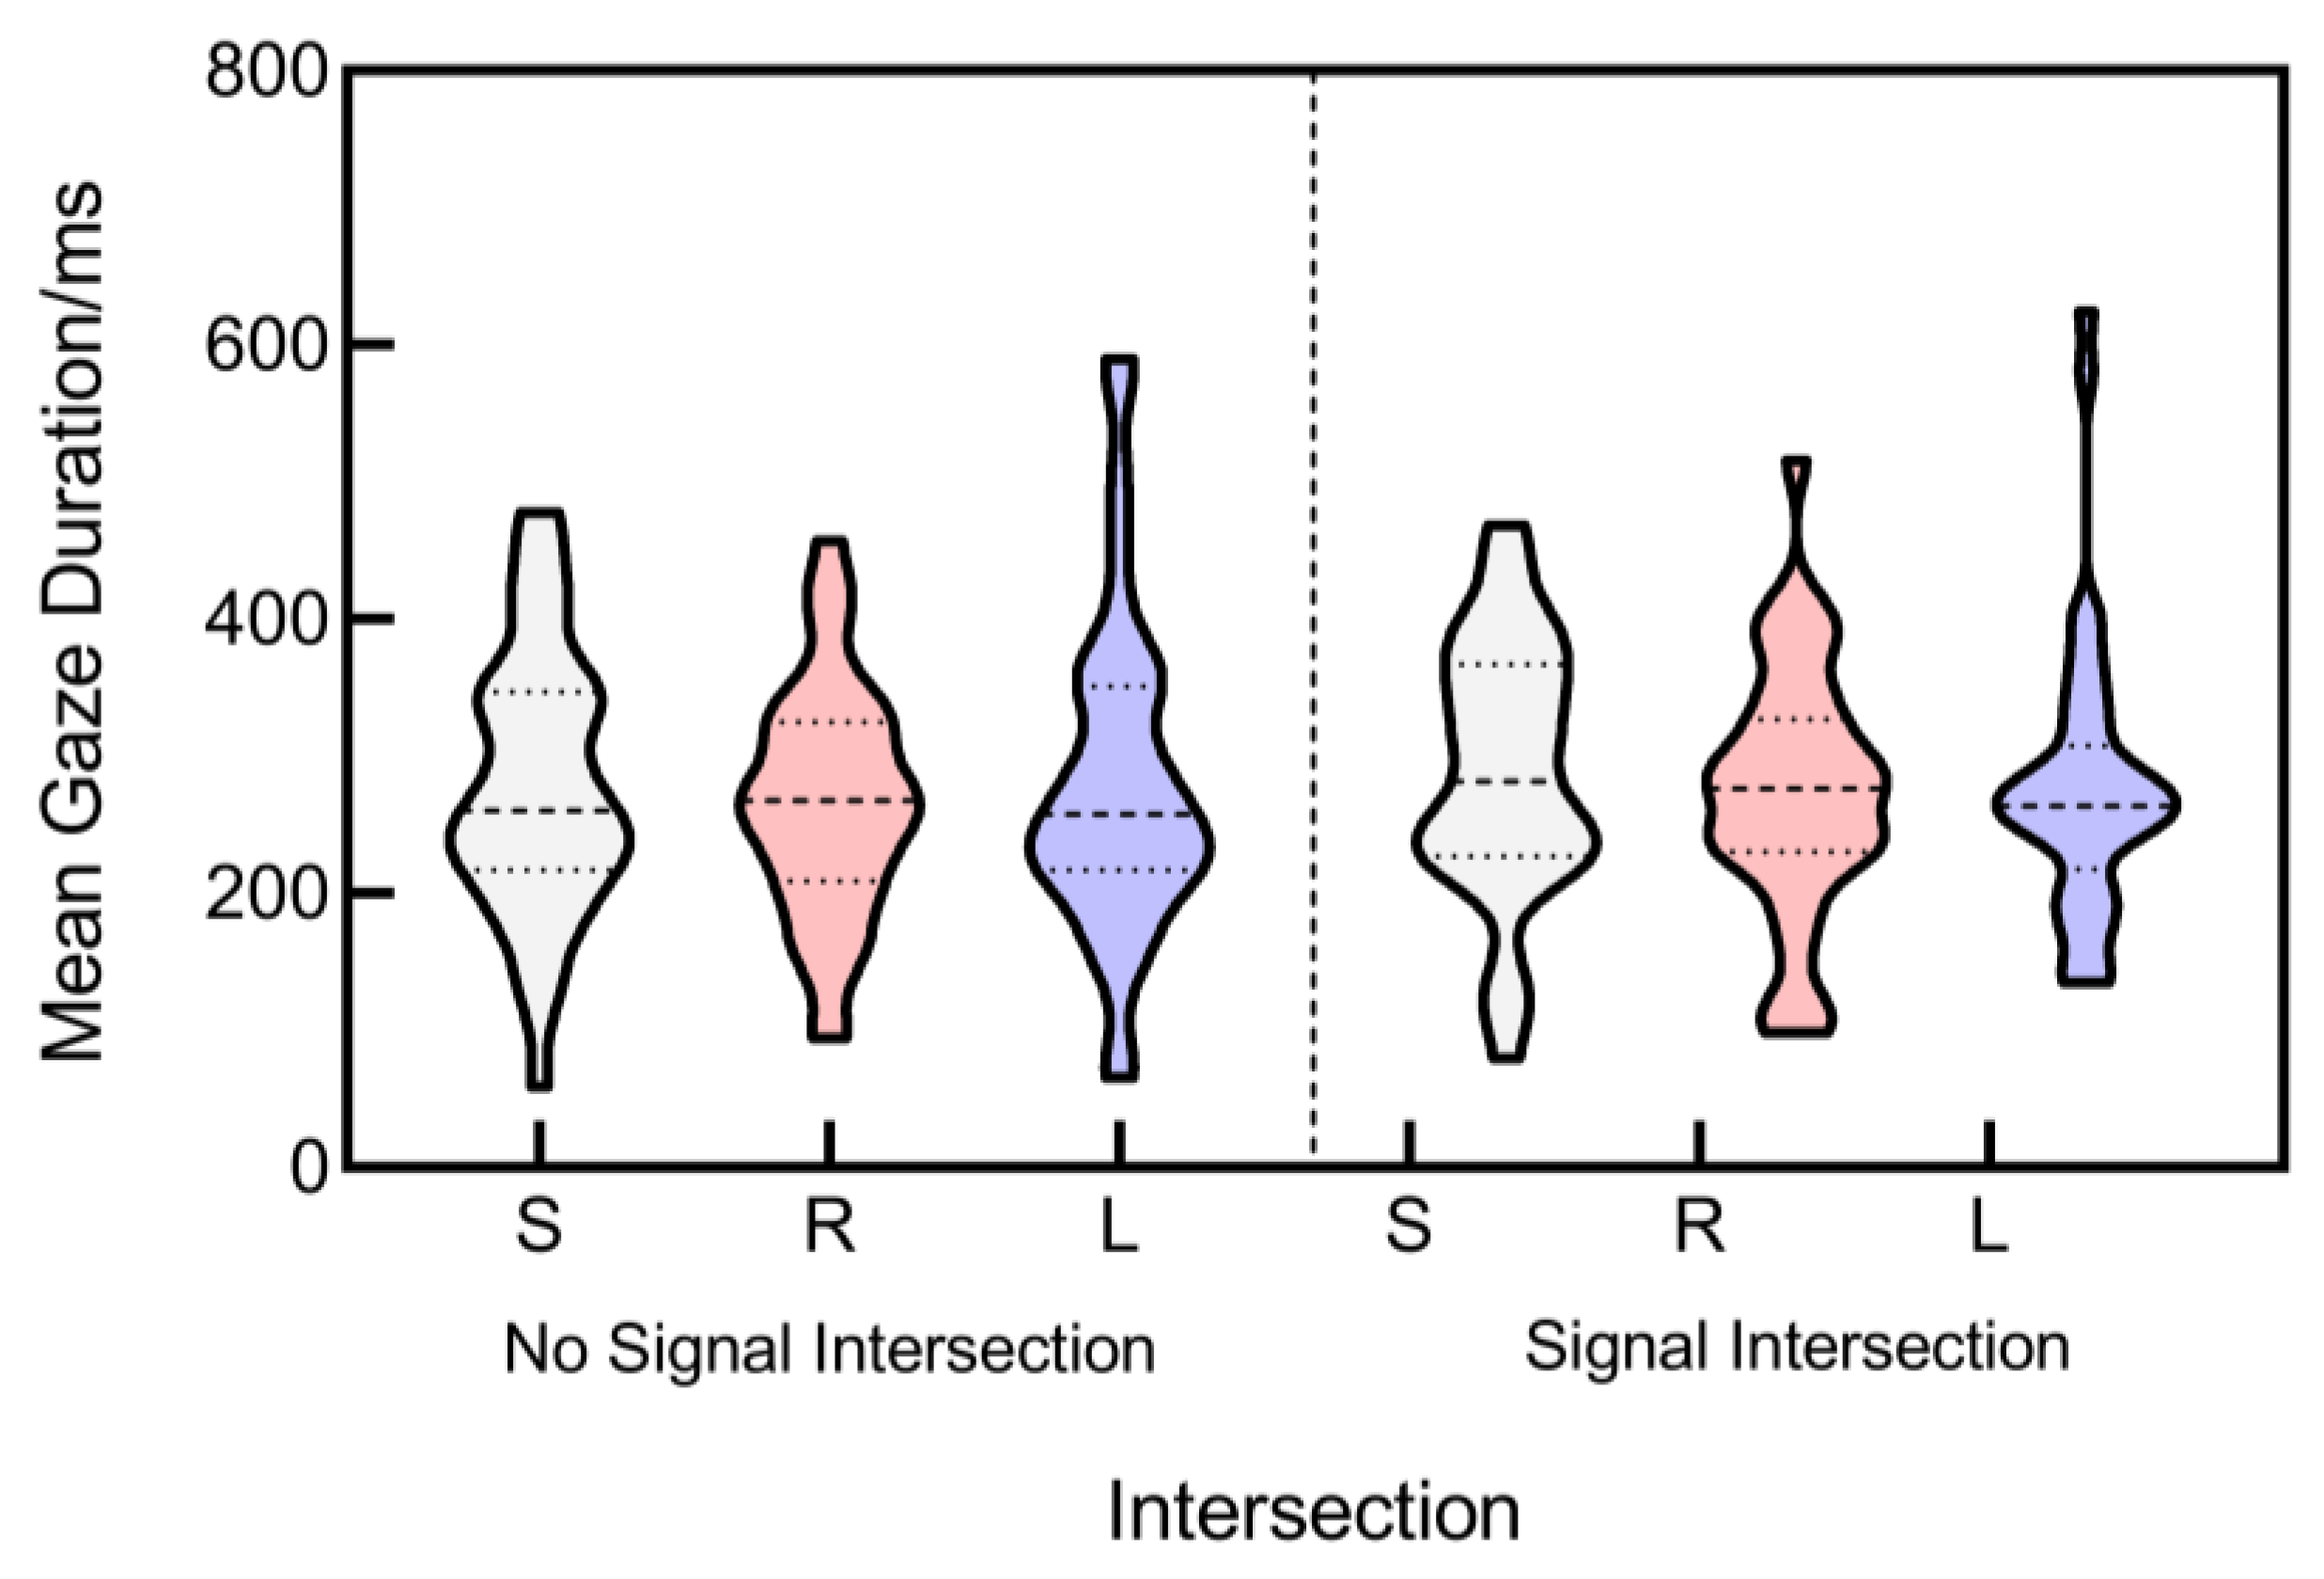
- Gaze duration: The average gaze durations of drivers are closely related to the visual load and driving task difficulty [28,29]. By comparing the gaze durations of drivers at signalized and unsignalized intersections, we can gain insights into their attention allocations at different intersection types.
3. Results
3.1. Descriptive Statistics for Variables
3.2. Speed
3.3. Acceleration
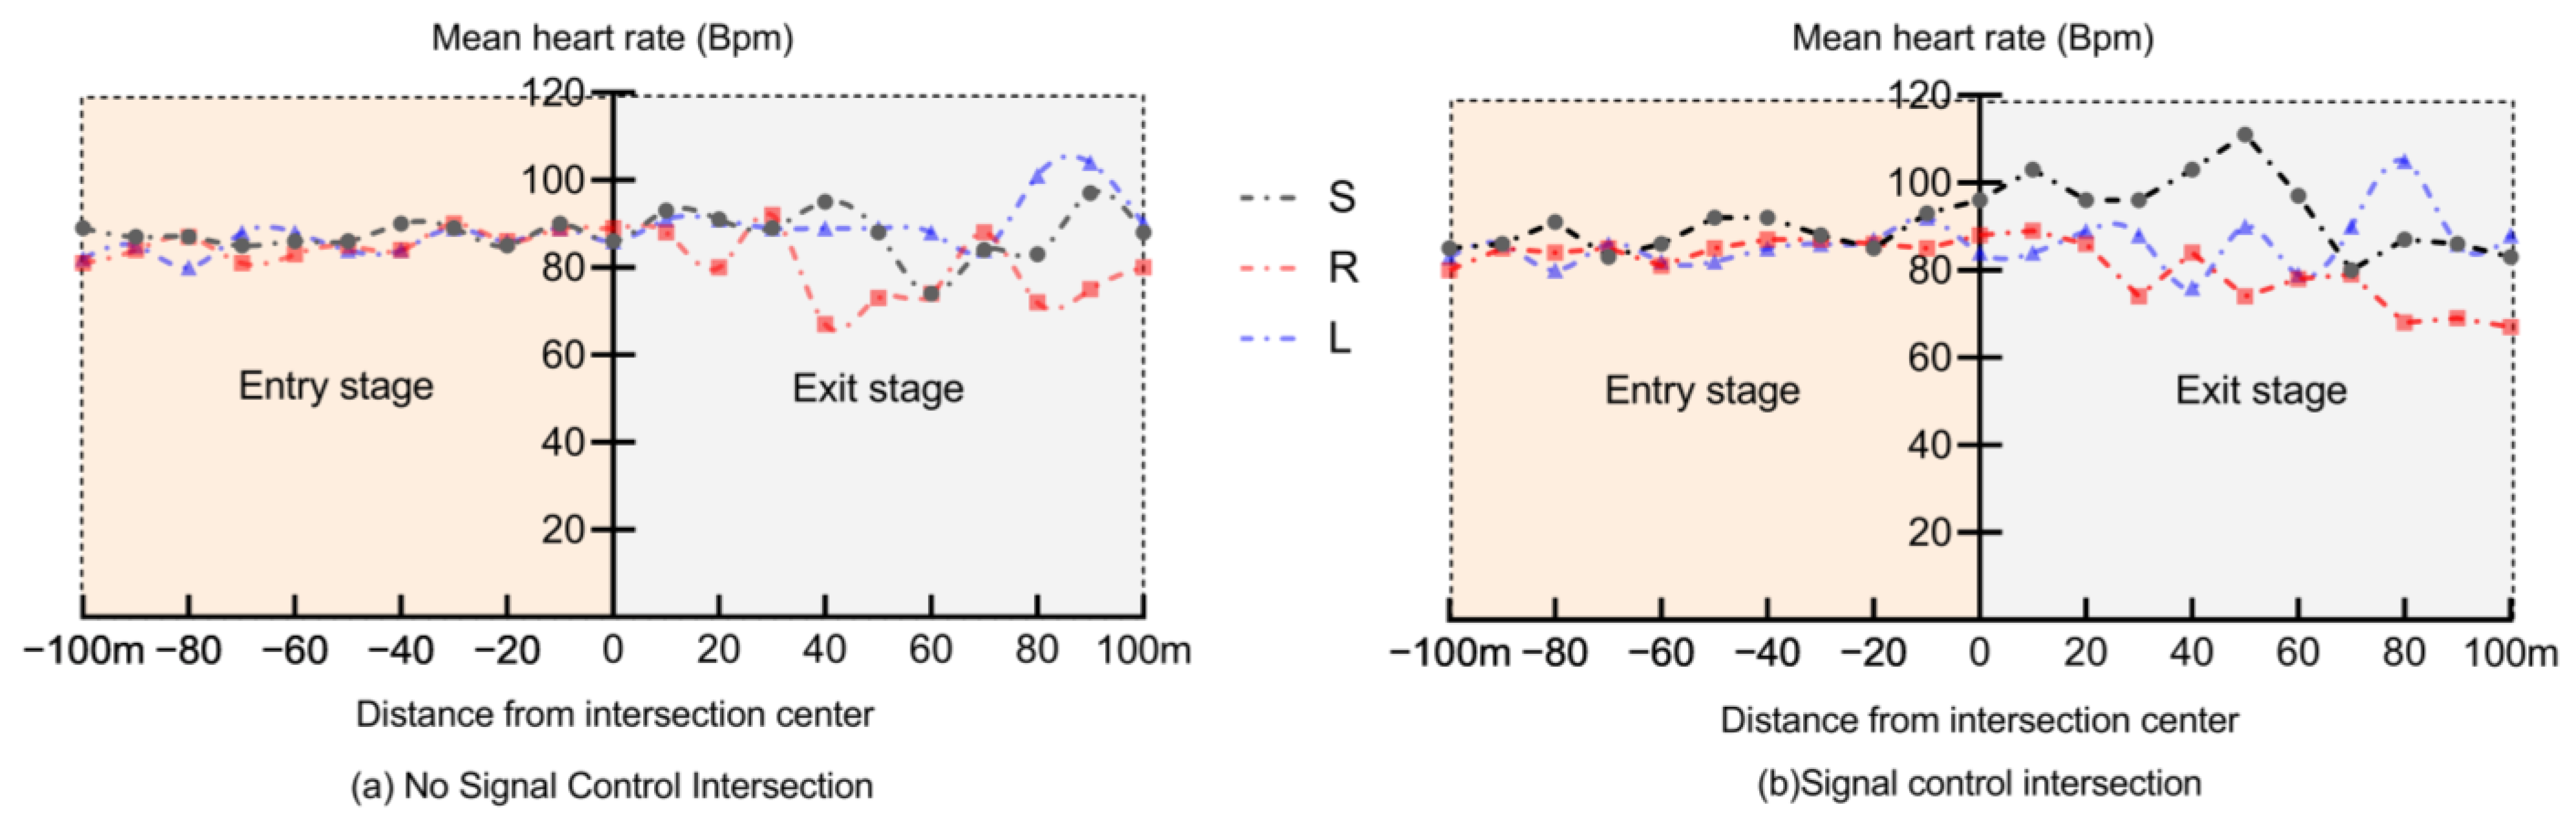
3.4. Heart Rate
3.5. Gaze Duration
4. Discussion
5. Conclusions
Author Contributions
Funding
Institutional Review Board Statement
Informed Consent Statement
Data Availability Statement
Conflicts of Interest
References
- SAE; Society of Automotive Engineers; On-Road Automated Vehicle Standards Committee. Taxonomy and Definitions for Terms Related to Driving Automation Systems for On-Road Motor Vehicles (R), J3016-202104. 2021. Available online: https://www.sae.org/standards/content/J3016_202104 (accessed on 30 April 2021).
- Kusano, K.D.; Gabler, H.C. Target population for intersection advanced driver assistance systems in the US. SAE Int. J. Transp. Saf. 2015, 3, 1–16. [Google Scholar] [CrossRef]
- NHTSA. Traffic Safety Facts 2015 Data (DOT HS 812 353, Updated March 2017); National Highway Traffic Safety Administration: Washington, DC, USA, 2017. Available online: https://crashstats.nhtsa.dot.gov/Api/Public/Publication/812384 (accessed on 30 April 2021).
- Yurtsever, E.; Lambert, J.; Carballo, A.; Takeda, K. A survey of autonomous driving: Common practices and emerging technologies. IEEE Access 2020, 8, 58443–58469. [Google Scholar] [CrossRef]
- Fleming, J.M.; Allison, C.K.; Yan, X.; Lot, R.; Stanton, N.A. Adaptive driver modelling in ADAS to improve user acceptance: A study using naturalistic data. Saf. Sci. 2019, 119, 76–83. [Google Scholar] [CrossRef]
- Ma, Z.; Zhang, Y. Drivers trust, acceptance, and takeover behaviors in fully automated vehicles: Effects of automated driving styles and driver’s driving styles. Accid. Anal. Prev. 2021, 159, 106238. [Google Scholar] [CrossRef]
- Xu, C.; Ding, Z.; Wang, C.; Li, Z. Statistical analysis of the patterns and characteristics of connected and autonomous vehicle involved crashes. J. Saf. Res. 2019, 71, 41–47. [Google Scholar] [CrossRef] [PubMed]
- Liu, Q.; Wang, X.; Wu, X.; Glaser, Y.; He, L. Crash comparison of autonomous and conventional vehicles using pre-crash scenario typology. Accid. Anal. Prev. 2021, 159, 106281. [Google Scholar] [CrossRef] [PubMed]
- Werneke, J.; Vollrath, M. How do environmental characteristics at intersections change in their relevance for drivers before entering an intersection: Analysis of drivers’ gaze and driving behavior in a driving simulator study. Cogn. Technol. Work. 2014, 16, 157–169. [Google Scholar] [CrossRef]
- Ye, X.; Pendyala, R.M.; Washington, S.P.; Konduri, K.; Oh, J. A simultaneous equations model of crash frequency by collision type for rural intersections. Saf. Sci. 2009, 47, 443–452. [Google Scholar] [CrossRef]
- Pawar, N.; Gore, N.; Arkatkar, S. Influence of driving environment on safety at un-signalized T-intersection under mixed traffic conditions. In Proceedings of the Innovative Research in Transportation Infrastructure: Proceedings of ICIIF; Springer: Berlin/Heidelberg, Germany, 2019. [Google Scholar]
- Isler, R.B.; Parsonson, B.S.; Hansson, G.J. Age related effects of restricted head movements on the useful field of view of drivers. Accid. Anal. Prev. 1997, 29, 793–801. [Google Scholar] [CrossRef]
- Perri, G.; Vaiana, R. Road Safety Management of Uncontrolled Access Points: Design Criteria and Insights into Risk Factors. Appl. Sci. 2022, 12, 12661. [Google Scholar] [CrossRef]
- Dukic, T.; Broberg, T. Older drivers’ visual search behaviour at intersections. Transp. Res. Part F Traffic Psychol. Behav. 2012, 15, 462–470. [Google Scholar] [CrossRef]
- Wu, J.; Xu, H. Driver behavior analysis for right-turn drivers at signalized intersections using SHRP 2 naturalistic driving study data. J. Saf. Res. 2017, 63, 177–185. [Google Scholar] [CrossRef] [PubMed]
- Pathivada, B.K.; Perumal, V. Analyzing dilemma driver behavior at signalized intersection under mixed traffic conditions. Transp. Res. Part F Traffic Psychol. Behav. 2019, 60, 111–120. [Google Scholar] [CrossRef]
- Li, J.; Guo, F.; Li, W.; Tian, B.; Chen, Z.; Qu, S. Research on driving behavior characteristics of older drivers based on drivers’ behavior graphs analysis. Heliyon 2023, 9, e18756. [Google Scholar] [CrossRef] [PubMed]
- Yamani, Y.; Horrey, W.J.; Liang, Y.; Fisher, D.L. Age-related differences in vehicle control and eye movement patterns at intersections: Older and middle-aged drivers. PLoS ONE 2016, 11, e0164124. [Google Scholar] [CrossRef] [PubMed]
- Romoser, M.R.; Pollatsek, A.; Fisher, D.L.; Williams, C.C. Comparing the glance patterns of older versus younger experienced drivers: Scanning for hazards while approaching and entering the intersection. Transp. Res. Part F Traffic Psychol. Behav. 2013, 16, 104–116. [Google Scholar] [CrossRef] [PubMed]
- Lemonnier, S.; Brémond, R.; Baccino, T. Gaze behavior when approaching an intersection: Dwell time distribution and comparison with a quantitative prediction. Transp. Res. Part F Traffic Psychol. Behav. 2015, 35, 60–74. [Google Scholar] [CrossRef]
- Lemonnier, S.; Désiré, L.; Brémond, R.; Baccino, T. Drivers’ visual attention: A field study at intersections. Transp. Res. Part F Traffic Psychol. Behav. 2020, 69, 206–221. [Google Scholar] [CrossRef]
- Liu, Y.; Ozguner, U. Human Driver Model and Driver Decision Making for Intersection Driving. In Proceedings of the 2007 IEEE Intelligent Vehicles Symposium, Istanbul, Turkey, 13–15 June 2007. [Google Scholar]
- Li, G.; Wang, Y.; Zhu, F.; Sui, X.; Wang, N.; Qu, X.; Green, P. Drivers’ visual scanning behavior at signalized and unsignalized intersections: A naturalistic driving study in China. J. Saf. Res. 2019, 71, 219–229. [Google Scholar] [CrossRef]
- Nelder, J.A.; Wedderburn, R.W.M. Generalized Linear Models. J. R. Stat. Soc. 1972, 135, 370–384. [Google Scholar] [CrossRef]
- Aarts, L.; Van Schagen, I. Driving speed and the risk of road crashes: A review. Accid. Anal. Prev. 2006, 38, 215–224. [Google Scholar] [CrossRef] [PubMed]
- Brookhuis, K.A.; De Waard, D. Monitoring drivers’ mental workload in driving simulators using physiological measures. Accid. Anal. Prev. 2010, 42, 898–903. [Google Scholar] [CrossRef] [PubMed]
- Charlton, S.G.; Starkey, N.J. Risk in our midst: Centrelines, perceived risk, and speed choice. Accid. Anal. Prev. 2016, 95, 192–201. [Google Scholar] [CrossRef] [PubMed]
- Martin, M.S.; Huard-Nicholls, B.; Johnson, A.P. Gaze and pupil size variability predict difficulty-level and safe intersection crosses in a driving simulator. Proc. Hum. Factors Ergon. Soc. Annu. Meet. 2021, 65, 843–847. [Google Scholar] [CrossRef]
- Wu, L.; Zhao, W.; Zhu, T.; Liu, H. Original Paper Drivers in Expressway Superlong Tunnels: The Change Patterns of Visual Features and the Discriminant Model of Driving Safety. J. Asian Res. 2019, 3, 240–250. [Google Scholar] [CrossRef]
- Yang, J.; Du, F.; Qu, W.; Gong, Z.; Sun, X. Effects of personality on risky driving behavior and accident involvement for Chinese drivers. Traf. Inj. Prev. 2013, 14, 565–571. [Google Scholar] [CrossRef] [PubMed]
- Liao, Y.; Li, S.E.; Wang, W.; Wang, Y.; Li, G.; Cheng, B. Detection of driver cognitive distraction: A comparison study of stop-controlled intersection and speed-limited highway. IEEE T. Intell. Transp. 2016, 17, 1628–1637. [Google Scholar] [CrossRef]
- Tay, R. A random parameters probit model of urban and rural intersection crashes. Accid. Anal. Prev. 2015, 84, 38–40. [Google Scholar] [CrossRef]
- De Raedt, R.; Ponjaert-Kristoffersen, I. Can strategic and tactical compensation reduce crash risk in older drivers? Age Ageing 2000, 29, 517–521. [Google Scholar] [CrossRef][Green Version]
- Chen, T.; Sze, N.N.; Newnam, S.; Bai, L. Effectiveness of the compensatory strategy adopted by older drivers: Difference between professional and non-professional drivers. Transp. Res. Part F Traffic Psychol. Behav. 2021, 77, 168–180. [Google Scholar] [CrossRef]
- Feng, J.; Choi, H.; Craik, F.I.; Levine, B.; Moreno, S.; Naglie, G.; Zhu, M. Adaptive response criteria in road hazard detection among older drivers. Traf. Inj. Prev. 2018, 19, 141–146. [Google Scholar] [CrossRef] [PubMed]
- Nabatilan, L.B.; Aghazadeh, F.; Nimbarte, A.D.; Harvey, C.C.; Chowdhury, S.K. Effect of driving experience on visual behavior and driving performance under different driving conditions. Cogn. Technol. Work 2012, 14, 355–363. [Google Scholar] [CrossRef]
- Massie, D.L.; Campbell, K.L.; Williams, A.F. Traffic Accident involvement rates by driver age and gender. Accid. Anal. Prev. 1995, 27, 73–87. [Google Scholar] [CrossRef] [PubMed]


| Scenario | Traffic Description | ||
|---|---|---|---|
| Signal Control | Driving Task | ||
| NSS | No signal control | Straight | Vehicles turned left from the opposite lane into the intersection at 50 km/h |
| SS | Signal control | ||
| NSL | No signal control | Left turn | Vehicles drove straight ahead from the opposite lane into the intersection at 50 km/h |
| SL | Signal control | ||
| NSR | No signal control | Right turn | Vehicles turned right from the opposite lane into the intersection at 50 km/h |
| SR | Signal control | ||
| Element | Level | Mean | SD | |
|---|---|---|---|---|
| Intersection | Signal control (SC) | No (N) | ||
| Yes (Y) | ||||
| Driving task (DT) | Straight (S) | |||
| Left turn (LT) | ||||
| Right turn (RT) | ||||
| Driver attribute | Gender | Male driver (M) | ||
| Female driver (F) | ||||
| Age (year) | Young (Y), 18–35 | 23.64 | 0.633 | |
| Middle (M), 35–60 | 43.22 | 8.54 | ||
| Older (O), over 60 | 65.06 | 2.86 | ||
| Driving experience level (DE, year) | Low (L), 2–5 | 3 | 0.77 | |
| Moderate (M), 5–20 | 10.93 | 4.58 | ||
| High (H), over 20 | 26.15 | 8.44 |
| Dependent Variable | Effect | Coefficient | p |
|---|---|---|---|
| Speed | Intercept | 19.164 | 0.000 *** |
| DT = S | 7.664 | 0.045 ** | |
| DT = RT | 0 | ||
| SC = N * DT = S | 10.445 | 0.049 ** | |
| SC = N * DT = RT | 0 | ||
| SC = Y * DT = S | 0 | ||
| SC = Y * DT * LT | 0 | ||
| SC = Y * DT * RT | 0 | ||
| SC = N * Age = Y | 17.296 | 0.000 *** | |
| SC = N * Age = M | 7.862 | 0.039 ** | |
| SC = N * Age = O | 0 | ||
| SC = Y * Age = Y | 11.971 | 0.020 ** | |
| SC = Y * Age = O | 0 | ||
| SC = N * DT = LT * Gender = M | −4.928 | 0.038 ** | |
| SC = N * DT = LT * Gender = F | 0 | ||
| SC = N * DT = RT * Gender = M | 0 | ||
| SC = N * DT = RT * Gender = F | 0 | ||
| SC = Y * DT = LT * Age = Y | −10.639 | 0.022 ** | |
| SC = Y * DT = LT * Age = O | 0 | ||
| SC = Y * DT = RT * Age = Y | 0 | ||
| SC = Y * DT = RT * Age = M | 0 | ||
| SC = Y * DT = RT * Age = O | 0 | ||
| SC = N * DT = S * DE = M | 8.265 | 0.047 ** | |
| SC = N * DT = S * DE = H | 0 | ||
| SC = N * DT = RT * DE = L | 0 | ||
| SC = N * DT = RT * DE = M | 0 | ||
| SC = N * DT = RT * DE = H | 0 |
| Dependent Variable | Effect | Coefficient | p |
|---|---|---|---|
| ACSD | Intercept | 1.298 | 0.000 *** |
| SC = N | 0.397 | 0.020 ** | |
| SC = Y | 0 | ||
| DT = S | 0.958 | 0.002 *** | |
| DT = RT | 0 | ||
| SC = N * DT = S | −1.388 | 0.000 *** | |
| SC = N * DT = RT | 0 | ||
| SC = Y * DT = S | 0 | ||
| SC = Y * DT = LT | 0 | ||
| SC = Y * DT = RT | 0 | ||
| SC = Y * DE = L | 0.843 | 0.041 ** | |
| SC = Y *DE = H | 0 | ||
| SC = N * DT = LT * Age = M | −0.632 | 0.019 ** | |
| SC = N * DT = LT * Age = O | 0 | ||
| SC = N * DT = RT * Age = Y | 0 | ||
| SC = N * DT = RT * Age = M | 0 | ||
| SC = N * DT = RT * Age = O | 0 | ||
| SC = Y * DT = S * Age = M | −0.983 | 0.010 ** | |
| SC = Y * DT = S * Age = O | 0 | ||
| SC = N * DT = LT * DE = M | 0.554 | 0.050 ** | |
| SC = N * DT = LT * DE = H | 0 | ||
| SC = N * DT = RT * DE = L | 0 | ||
| SC = N * DT = RT * DE = M | 0 | ||
| SC = N * DT = RT * DE = H | 0 |
| Dependent Variable | Effect | Coefficient | p |
|---|---|---|---|
| Heart rate | Intercept | 86.293 | 0.000 *** |
| DT = S | 13.594 | 0.006 *** | |
| DT = RT | 0 | ||
| SC = Y * Age = Y | −8.707 | 0.041 ** | |
| SC = Y * Age =O | 0 | ||
| SC = Y * DE = L | 12.483 | 0.017 ** | |
| SC = Y * DE = H | 0 | ||
| SC = N * DT = S * Gender = M | −11.108 | 0.004 *** | |
| SC = N * DT = S * Gender = F | 0 | ||
| SC = N *DT = LT * Age = Y | −3.715 | 0.022 ** | |
| SC = N * DT = LT * Age = M | −5.143 | 0.002 *** | |
| SC = N * DT = LT * Age = O | 0 | ||
| SC = N * DT = RT * Age = Y | 0 | ||
| SC = N * DT = RT * Age = M | 0 | ||
| SC = N * DT = RT * Age = O | 0 | ||
| SC = Y * DT = S * Age = Y | 12.780 | 0.049 ** | |
| SC = Y * DT = S * Age = M | −10.762 | 0.020 ** | |
| SC = Y * DT = S * Age = O | 0 |
| Dependent Variable | Effect | Coefficient | p |
|---|---|---|---|
| Gaze duration | Intercept | 244.077 | 0.000 *** |
| SC = N * DT = LT * Age = Y | −135.497 | 0.000 *** | |
| SC = N * DT = LT * Age = M | −48.512 | 0.043 ** | |
| SC = N * DT = LT * Age = O | 0 | ||
| SC = N * DT = RT * Age = Y | 0 | ||
| SC = N * DT = RT * Age =M | 0 | ||
| SC = N * DT = RT * Age = O | 0 | ||
| SC = N * DT = LT * DE = L | 138.521 | 0.000 *** | |
| SC = N * DT = LT * DE = M | 73.074 | 0.005 *** | |
| SC = N * DT = LT * DE = H | 0 | ||
| SC = N * DT =RT * DE = L | 0 | ||
| SC = N * DT = RT * DE = M | 0 | ||
| SC = N * DT = RT * DE = H | 0 |
Disclaimer/Publisher’s Note: The statements, opinions and data contained in all publications are solely those of the individual author(s) and contributor(s) and not of MDPI and/or the editor(s). MDPI and/or the editor(s) disclaim responsibility for any injury to people or property resulting from any ideas, methods, instructions or products referred to in the content. |
© 2024 by the authors. Licensee MDPI, Basel, Switzerland. This article is an open access article distributed under the terms and conditions of the Creative Commons Attribution (CC BY) license (https://creativecommons.org/licenses/by/4.0/).
Share and Cite
Qu, S.; Guo, F. Behavioral Patterns of Drivers under Signalized and Unsignalized Urban Intersections. Appl. Sci. 2024, 14, 1802. https://doi.org/10.3390/app14051802
Qu S, Guo F. Behavioral Patterns of Drivers under Signalized and Unsignalized Urban Intersections. Applied Sciences. 2024; 14(5):1802. https://doi.org/10.3390/app14051802
Chicago/Turabian StyleQu, Sirou, and Fengxiang Guo. 2024. "Behavioral Patterns of Drivers under Signalized and Unsignalized Urban Intersections" Applied Sciences 14, no. 5: 1802. https://doi.org/10.3390/app14051802
APA StyleQu, S., & Guo, F. (2024). Behavioral Patterns of Drivers under Signalized and Unsignalized Urban Intersections. Applied Sciences, 14(5), 1802. https://doi.org/10.3390/app14051802