1. Introduction
Knowledge, innovation and creativity are key themes to be explored in the areas related to urban and regional development. In addition to the social and economic environment of cities, the cultural milieu is increasingly becoming an installation factor. Since the 1990s and mostly after the millennium, the development of knowledge-based economic sectors has become a key topic in national, regional, and international economic strategies. The creative industry uses culture as a source material, although the result it produces is rather functional [
1]. Culture and creative industries (CCIs) play a major role in the European economy, accounting for 4.5% of total European GDP (Gross Domestic Product) in 2019 [
2]. Their contribution is higher than that of the telecommunications sector or agriculture. Their growing role is also demonstrated by the 17% growth in economic output in the last eight years and the 12% increase in household cultural expenditure (between 2010 and 2015). The role of CCIs is outstanding in terms of employment, with 7.6 million people in the European Union. The overwhelming majority of people employed in the sector are young people with tertiary education (43% under 39 years). Spatial differences in creative and knowledge-intensive sectors within the urban network show a significant pattern. The urban network of Eastern Europe is characterised by capital-centricity. Metropolitan spaces dominate the innovative workforce and concentrate on advanced economic sectors, high-quality institutions, and services [
3]. Transport options are also mostly capital-centric. There have been several attempts to introduce a polycentric development model, with successes mainly in countries with a larger territory. The development and consolidation of counterpoint cities have favoured regional centres. Different roles have been defined for regional centres, so decentralisation has led not only to the availability of public services but also to a rethinking of the economic structure. Functional urban area-based development can help to resolve the historically defined system of inequalities between the centrum and periphery [
4]. Network development, whether in terms of public services or physical infrastructure, can also improve the quality of life of the population and the availability of institutions.
Creativity is an essential factor for economic development in post-industrial societies. The share of the CCI sector in a city or FUA (Functional Urban Area) is an indicator of how fast the economy of that area can grow. It can also be seen as a measure of development [
5]. The two regional centres subject to our interest have many similarities and a number of unique features in terms of their function scope and agglomeration. Their comparative analyses, resource base, local circumstances and processes may result in interesting results. In order to meet the great global challenges that the two cities have to face, more attention needs to be paid to resource efficiency in the creative sector. Establishing a resource-efficient economy is a major environmental and development challenge today and requires political actions at all (international, national and local) levels. Improving resource efficiency by better understanding the available amount, value, structure, ownership, use, etc. of resources within a given locality is crucial to planning and implementing good resource-based spatial policies. For the adaptive and sustainable development of a territory, the decision-makers need exact information about the potential and consumption (new working places, culture-based economy, innovation ecosystem, etc.) of resources related to the development processes of a given place.
Geographic information systems (GISs), through the large analysis capacity of spatial databases, offer multiple possibilities for evaluating a territory, taking into account the main components that generate dysfunction or that impose functionality in the territory [
5,
6,
7,
8,
9,
10,
11,
12,
13,
14,
15].
An integrated analysis of the components, as spatially referenced databases, through the integrated applications and analysis models developed, produces notable results that support analysis and decision-making [
16,
17,
18,
19].
Analyses based on the point distribution of territorial infrastructures [
20,
21], here including industrial locations such as creative industries within large urban centres, lend themselves very well to the development of simple GIS spatial analysis models that are implemented mainly through spatial proximity analysis [
22,
23], spatial interpolation [
24,
25], or spatial geostatistics [
26,
27].
The development of these types of GIS spatial analysis models has a number of limitations that derive from the fact that only point location and distance are considered in the spatial analysis process.
The development of GIS spatial analysis models for identifying areas with certain degrees of functionality requires the integrated analysis of several factors that contribute to determining the type of territorial functionality. This requires the development of integrated spatial analysis models that do not rely solely on the facilities offered by geoinformation software—models that include in their structure the correlative analysis of spatial databases of different types, in terms of structure and geometry [
28].
Integrating into this modern trend of GIS spatial analysis, a series of models have been developed to assess territorial dysfunctions using network analysis as a method to study the relationships between the components of a network and the locations of industrial centres that generate different types of territorial functionality [
29,
30,
31].
The present study is outlined as a GIS model of spatial analysis that takes into account only the locations of the creative industries chosen as test elements, excluding the population component, focusing on the quantitative analysis of the impact of accessibility within territorial structures with different geometries and surfaces.
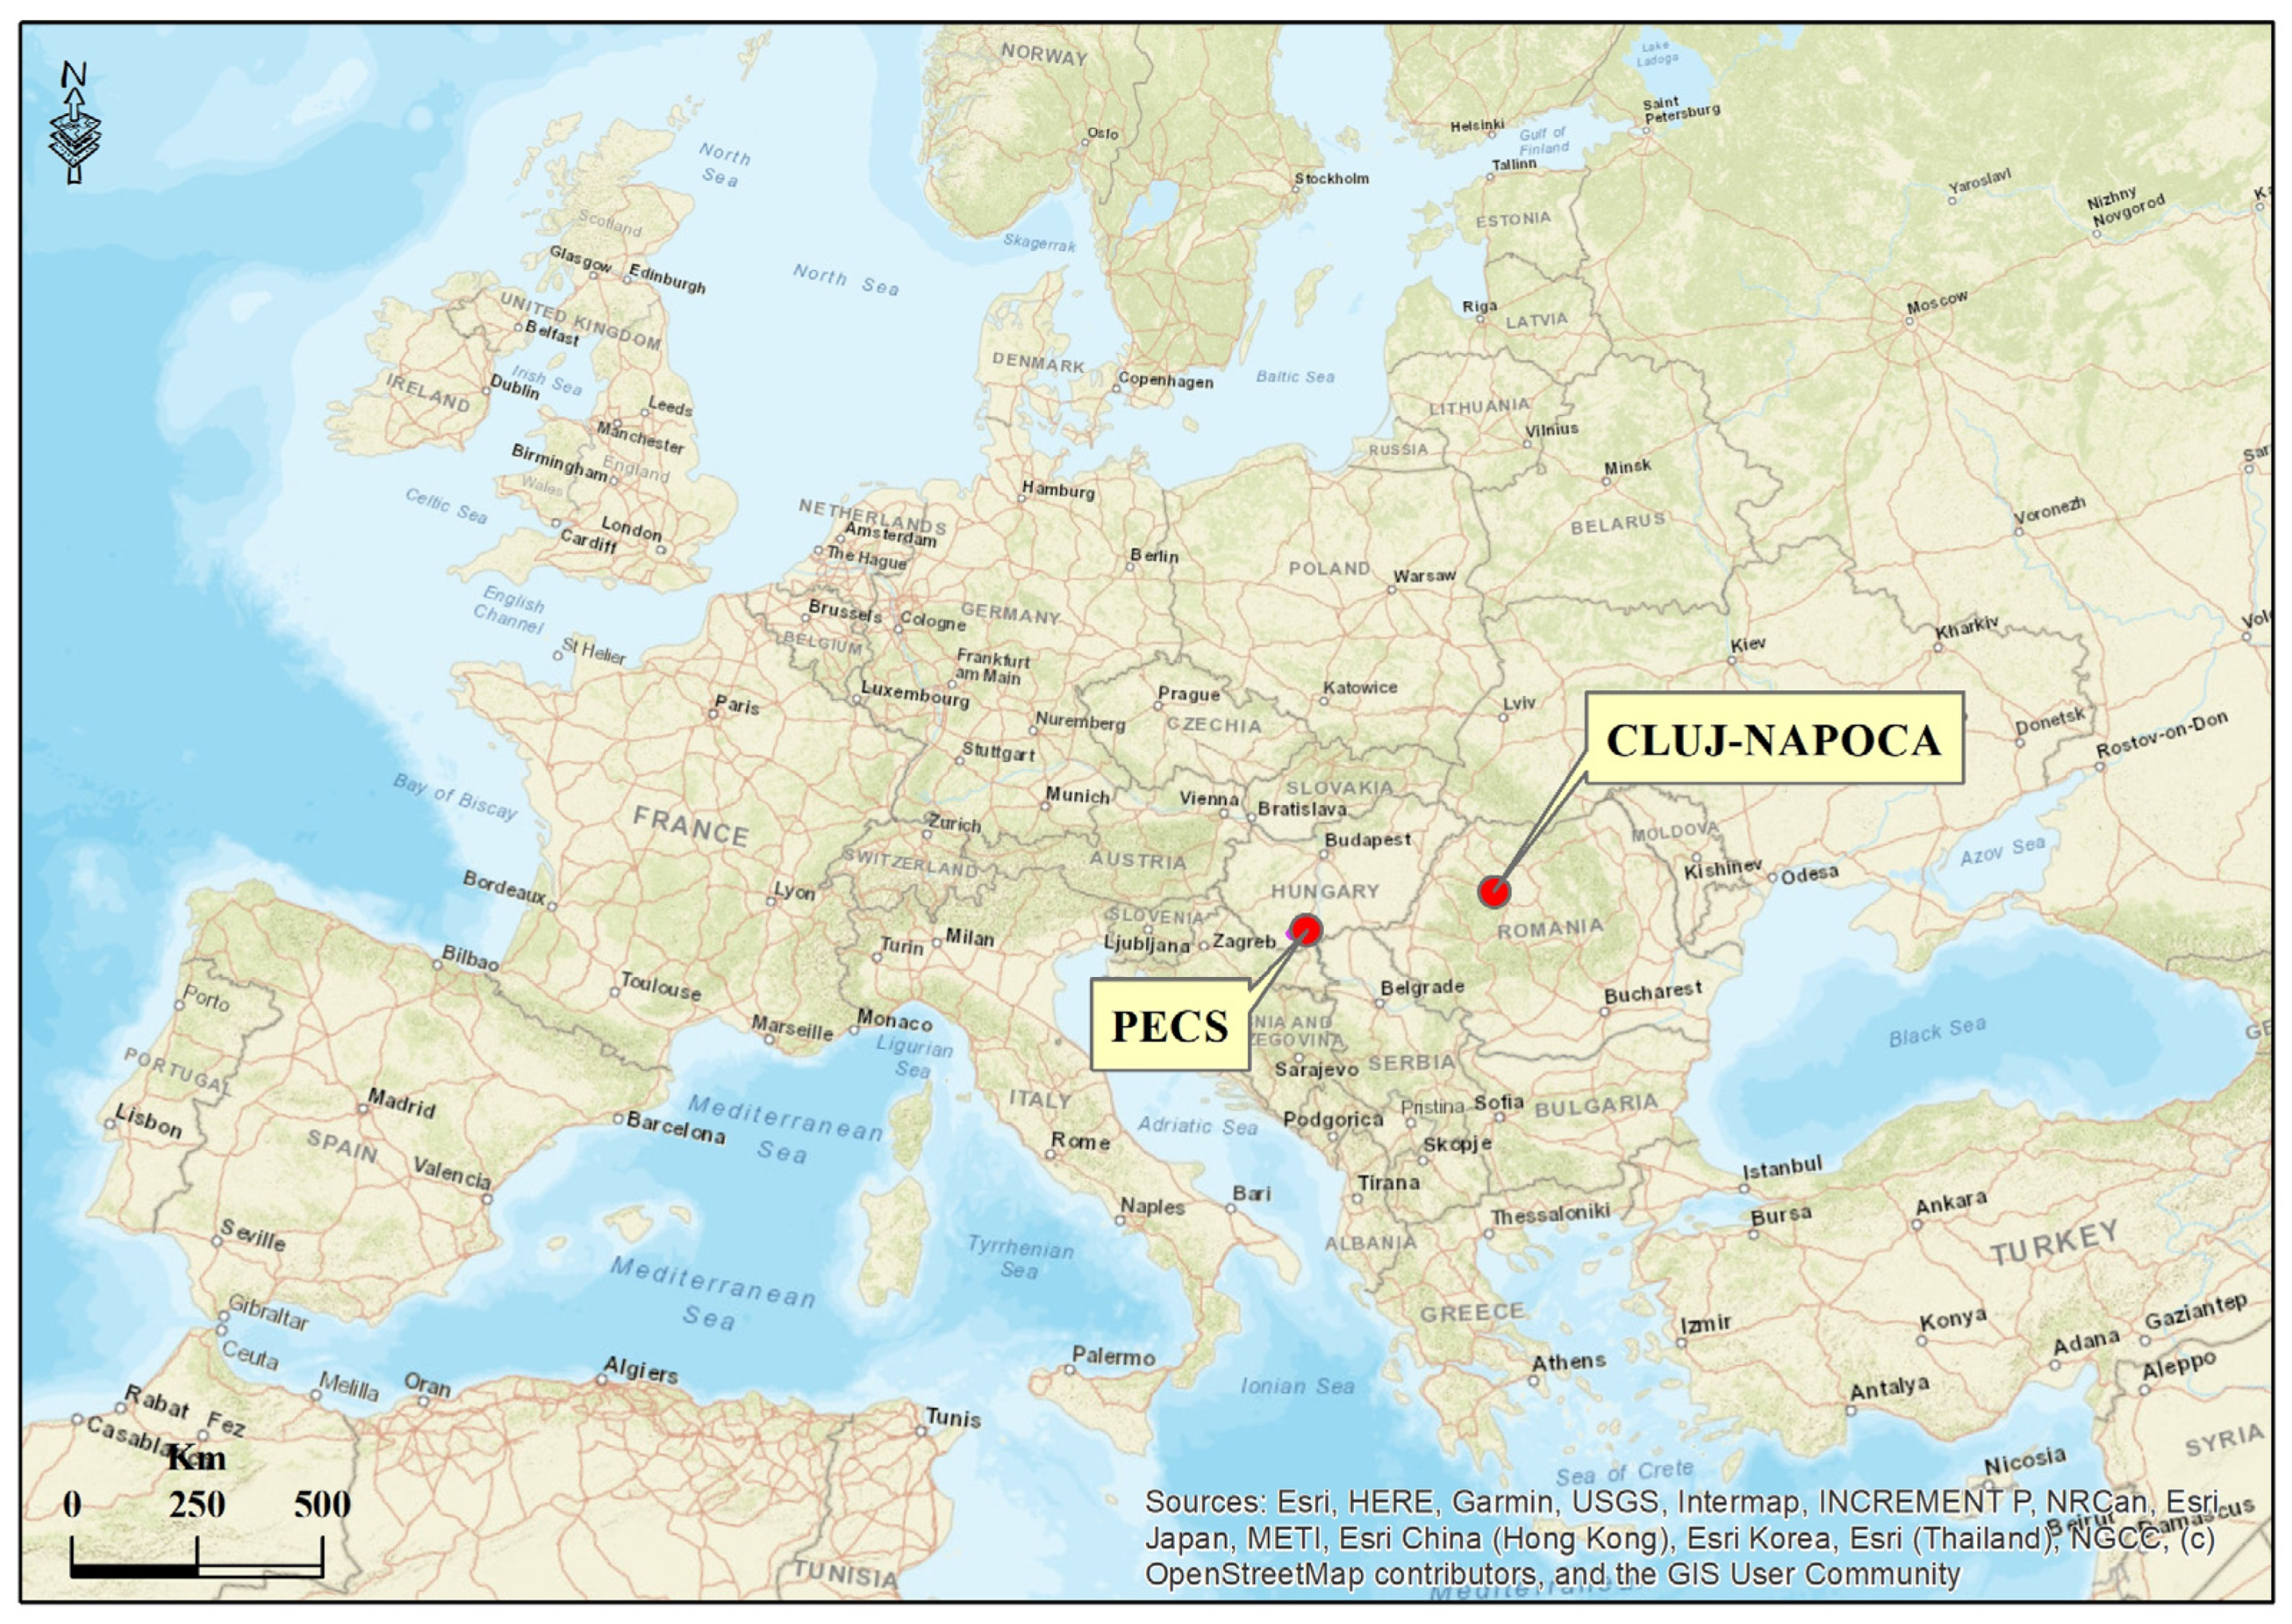
The main aim of the present investigation is to propose a GIS model for spatial analysis that allows for the comparative analysis of two urban centres that are different in terms of the spatial extension, shape, and placement of analysed infrastructures, namely Cluj-Napoca, Romania, and Pécs, Hungary. The focus of the study is the spatial distribution of creative industries (as territorially arranged test infrastructures), using network analysis as the main methodological approach to identify their cumulative impact in terms of accessibility. In order to achieve the proposed main objective, an integrated geographic information system (GIS) model for spatial analysis has been developed, focusing on pedestrian accessibility in view of the role of the recently developed and implemented 15 min cities concept in large urban centres.
The accomplishment of the primary goal entails the accomplishment of the following secondary goals: locating the creative industries; acquiring the spatial extension of intervals with varying temporal accessibility in minutes; integrating databases that represent accessibility uniformly for the analysis of the territorial impact of creative industry components; and integrating the analysis of spatial databases for the identification of cumulative accessibility. All of these integrations are based on a specific methodology that is proposed and implemented both vertically and horizontally within the main stages of the model.
3. Methodology and Database
The comparative analysis of two regional centres, with relatively identical characteristics in terms of the development of functional areas but differences in terms of geographical characteristics and the spatial extension of the research area, based on the influence of the spatial arrangement of creative industries, involves the development of a methodology of research to capture the conditional relations between the location of the industry and its impact in the territory as well as the impact they have on the human component as a direct beneficiary of the harmonious development of the urban territory.
Taking into account these defining requirements, a proprietary research methodology was developed and implemented in the GIS environment on numeric, vector, and raster database structures. This methodology, which takes shape as a GIS of complex spatial analysis, allows for the integration of the principles of development and regional planning in functional systems of response-process type for the analysis of specificity and territorial development.
The developed methodology has at its centre the evaluation of the territorial specificity based on the analysis of pedestrian accessibility to the infrastructure of the creative industry, considering that the infrastructure of the creative industries generates additional territorial value through economic growth and a small negative impact on the environment due to the specificity of economic productivity and non-polluting matters. Thus, the analysis of urban centres from the point of view of pedestrian accessibility of the population emerges as a defining factor in the establishment of functional urban areas due to the fact that easy pedestrian access will lead to the development of the spatial component, which takes into account the reduction of transport infrastructures necessary for transporting the human component to the workplace and implicitly significantly reducing the intense traffic generating territorial dysfunction.
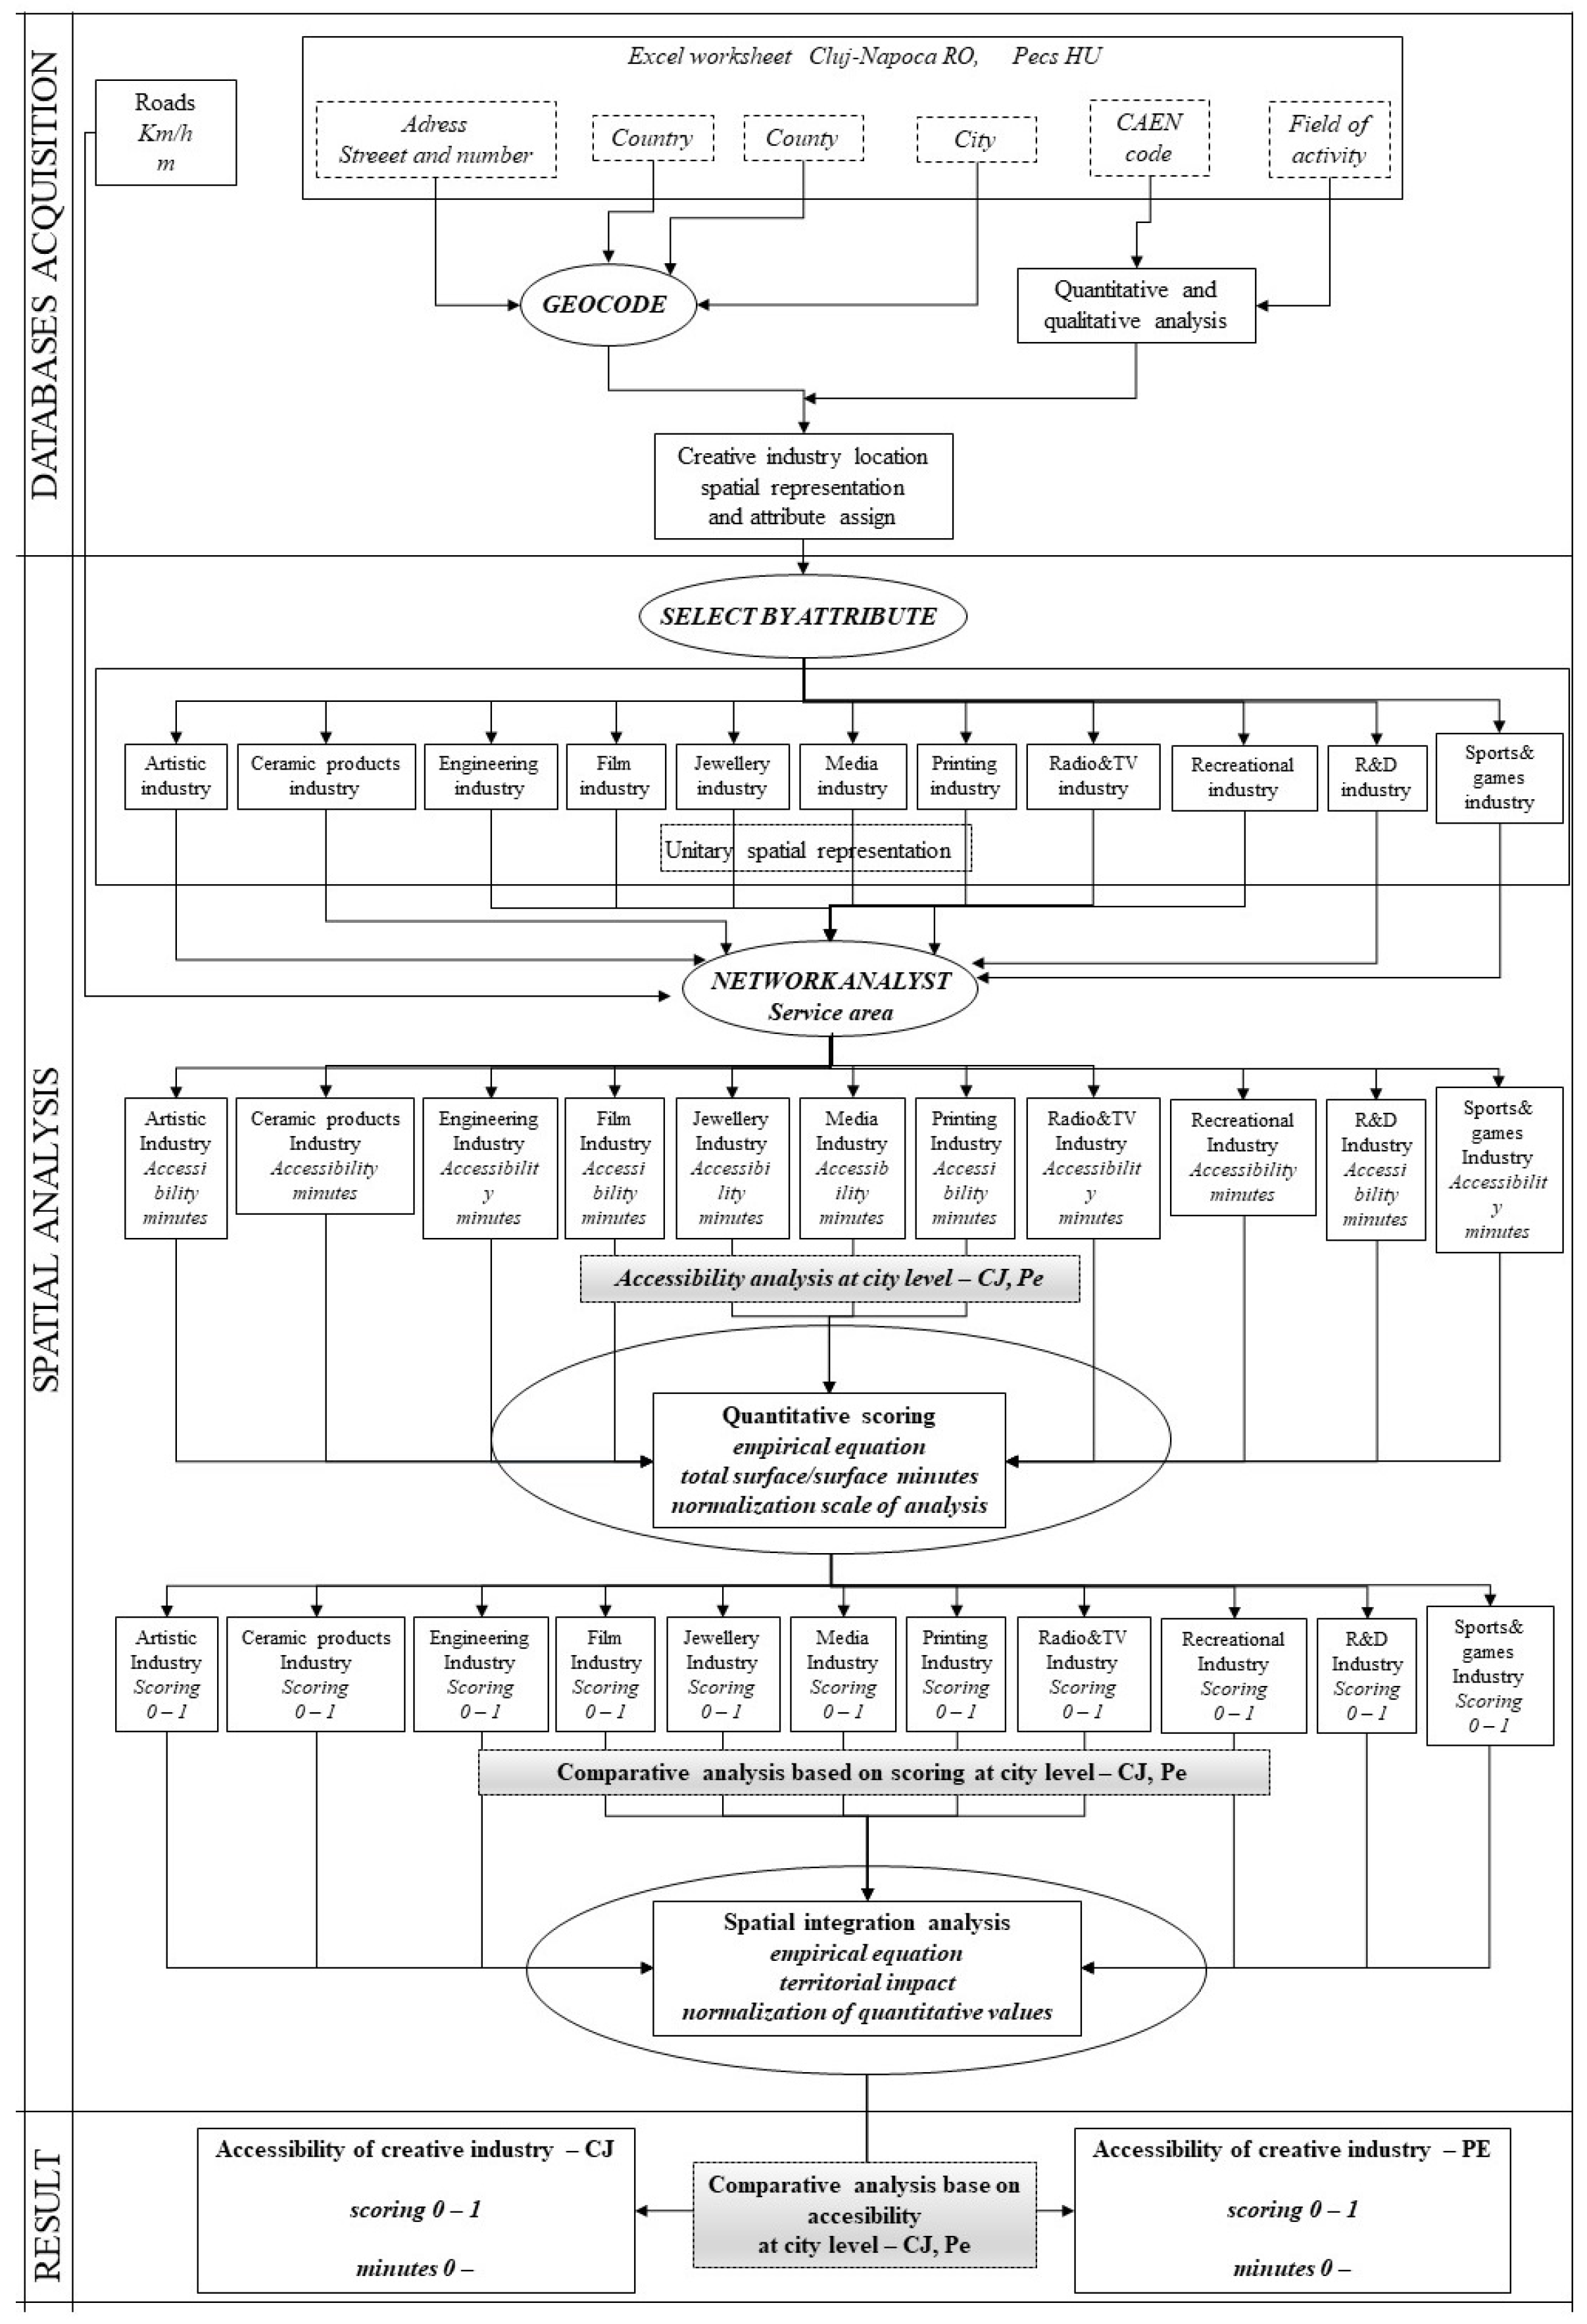
Having in its centre the assessment of pedestrian accessibility, the spatial analysis methodology is structured in three distinct stages (the acquisition of numerical database and spatial databases; the implementation of the proposed GIS spatial analysis; and the analysis of the intermediate results and presentation and analysis of the final results to identify areas with dysfunctions in order to issue their remedial solutions). These stages, when viewed as a whole, take shape as a complex system of spatial analyses that cannot function without referring to, within the research approach, the spatial databases and the results obtained in the previous stages and sub-stages (
Figure 2).
The first step within the spatial analysis process is the acquisition and creation of a GIS spatial database on which the entire research process is based. The databases used in the spatial analysis process are divided into two different structures: vector databases representing the network of communication paths obtained on the basis of direct acquisition from OSM, and alpha-numeric databases representing the spatial localisation elements of each unit entity that represent a certain type of creative industry. Considering the fact that the entire research approach is based on pedestrian accessibility, the vector databases representing the communication paths were subjected to the process of spatial analysis on the attribute table to obtain the time in minutes required for the movement of a person on road segments—times that together highlight the areal access to the locations of the creative industries. The preparation of the vector database representing the communication paths involves the use of the average travel speed of 5 km/hour, related to metric distances.
The alpha-numeric database obtained in the form of an .xls file from listafirme.ro for Cluj-Napoca, and the KRTK Databank for Pécs, provide, on the one hand, information related to the spatial location of creative industries (street and number, county, country, and city) and information used in the geolocation process, and, on the other hand, information related to the CAEN/NACE code and field of activity for each individual location. The first part of the information was used to geolocate the creative industries and obtain point vector databases using the geolocation services provided by ESRI for each individual record. The second part of the information is constituted as an attribute database used in the qualitative spatial analysis of grouping creative industries according to their specifics.
The spatial analysis stage foregrounds the management and integration of spatial databases (communication paths and spatial location of creative industries) on a logical basis, using mathematical integration formulas for the spatial representation of the main categories of creative industries and using time analysis and modelling of access related to the location of the creative industries. This is in order to highlight the areas with high and low accessibility, which can later be analysed comparatively for the two territorial administrative units taken into account. The first part of the spatial analysis is dedicated to obtaining the main categories of creative industries, starting from the grouping of unitary creative industries according to the specifics of the activity, taking into account the CAEN/NACE code and their field of activity. The study uses the NACE code delimitation for cultural and creative industries [
39]. Thus, using the geocoded vector database and the spatial analysis on the attribute table, from a total of 4839 companies for the city of Cluj-Napoca and 1308 companies for Pécs, 11 classes with unique characteristics were used in the process of spatial accessibility modelling and the comparison of the two main urban centres.
The identification of the territorial accessibility related to the locations of the classes representing creative industries for the two main urban centres is carried out on the basis of the network analysis, considering the service area module made available by the ArcGis 10.8 geoinformational software. Accessibility analysed in terms of the time needed to access the creative industries is based on the identification of standard time intervals. As part of the analysis, five temporal intervals were chosen to meet the urban planning requirements in force. Thus, the time intervals 0–5 min, 5–15 min, 15–30 min, 30–60 min and more than 60 min on foot were chosen. Considering the fact that the concept of the 15 min city (developed by Arthur Clarrence in 1920) [
40], which is still relevant today, was proposed for implementation at the Climate Change Conference (COP 21) in Paris, 2015 [
41,
42,
43], the 5–15 min interval was used in the analysis. The 0–5 min analysis is based on the 5 min city concept being implemented in Copenhagen to highlight the socially, architecturally and sustainably designed developed city, a city with ideal urban development.
The other two intervals—30–60 and more than 60 min—were implemented in the accessibility analysis due to the large spatial extension of the two cities and the concentration of the creative industries (for the most part) in the central areas, thus highlighting the areas with accessibility reduced from the periphery of the main functional areas.
The analysis of accessibility obtained for the five categories can be carried out in the current stage of unitary spatial analysis for each class of creative industry and at the level of each administrative unit analysed, but it is not possible to make a direct comparison between the two urban centres analysed due to the spatial scale of different representation. The comparative analysis is based on the standardisation of the spatial analysis scale, involving comparing the spatial extension of each accessibility interval with the entire analysis surface of the analysed urban centre, based on the qualitative scoring technique. Thus, it was decided to credit each accessibility interval with values between 0 and 1 according to
Table 1.
The qualitative assessment used to standardise the scale of spatial analysis has as its main concept the fact that a larger area occupied by a certain accessibility interval compared to the entire study area has a greater impact on the territory. It takes values between the same limits of the interval for both urban centres analysed, thus allowing us to make real comparisons between the two. The calculation of the credit rating within the range, specific to each accessibility class, is performed using the formula proposed by Petrea et al., 2017 [
44].
where
x—the value of the scoring interval;
y—the interval area of spatial extension, as percentage;
z—the value of the accessibility scoring depending on the area;
Smax, Smin—the maximal value of the scoring interval, the minimal value of the scoring interval.
The unitary comparative analysis of each class of creative industry can be conducted taking into account the variation of the results in the rating range specific to the accessibility class. The higher the rated value is in the range, the greater the influence of the range-specific accessibility class in the territory, thus having a significant spatial impact. Obtaining credit values for each accessibility interval and class of creative industry offers the possibility of integrating them to identify the general accessibility of the territory influenced by the 11 classes.
The identification of general accessibility is based on the concept of the importance of the class in terms of the creative industry it represents. Due to the fact that, together with the qualitative rating, the working scale was standardised and the characteristic rating intervals were established for each accessibility class at the same time, the integration of the obtained databases is performed on the basis of the empirical equation that provides the normalisation of the scoring values (formula 4) [
10,
44,
45,
46], so they fall within the general scoring interval (0–1) and can be comparatively analysed later using the scoring intervals employed (
Table 1).
Terms:
R&D—Research and development industry.
ENG—Engineering industry.
ART—Artistic industry.
CER—Ceramic products industry.
FLM—Film industry.
JEL—Jewellery industry.
MED—Media industry.
PRN—Printing industry.
RTV—Radio TV industry.
REC—Recreational industry.
SPT—Sports and games industry.
The final stage of the proposed model is represented by the result based on spatial integration, obtained by using the proposed equation, adapted from [
10,
44,
45,
46].
This highlights the cumulative accessibility and, thanks to the unit values obtained for each urban centre separately, it makes possible the final comparison of accessibility for the two urban centres analysed and at the same time the identification of the functional areas and those with spatial coverage problems with access to creative industries.
4. Results and Discussion
The results obtained as a consequence of the implementation of the proposed model and methodology are based on the quantitative analysis of the results obtained following the implementation of the spatial analysis stage, both for obtaining databases representing the locations of creative industries and for their management and spatial integration, in order to finally compare the two cities in terms of accessibility to creative industries.
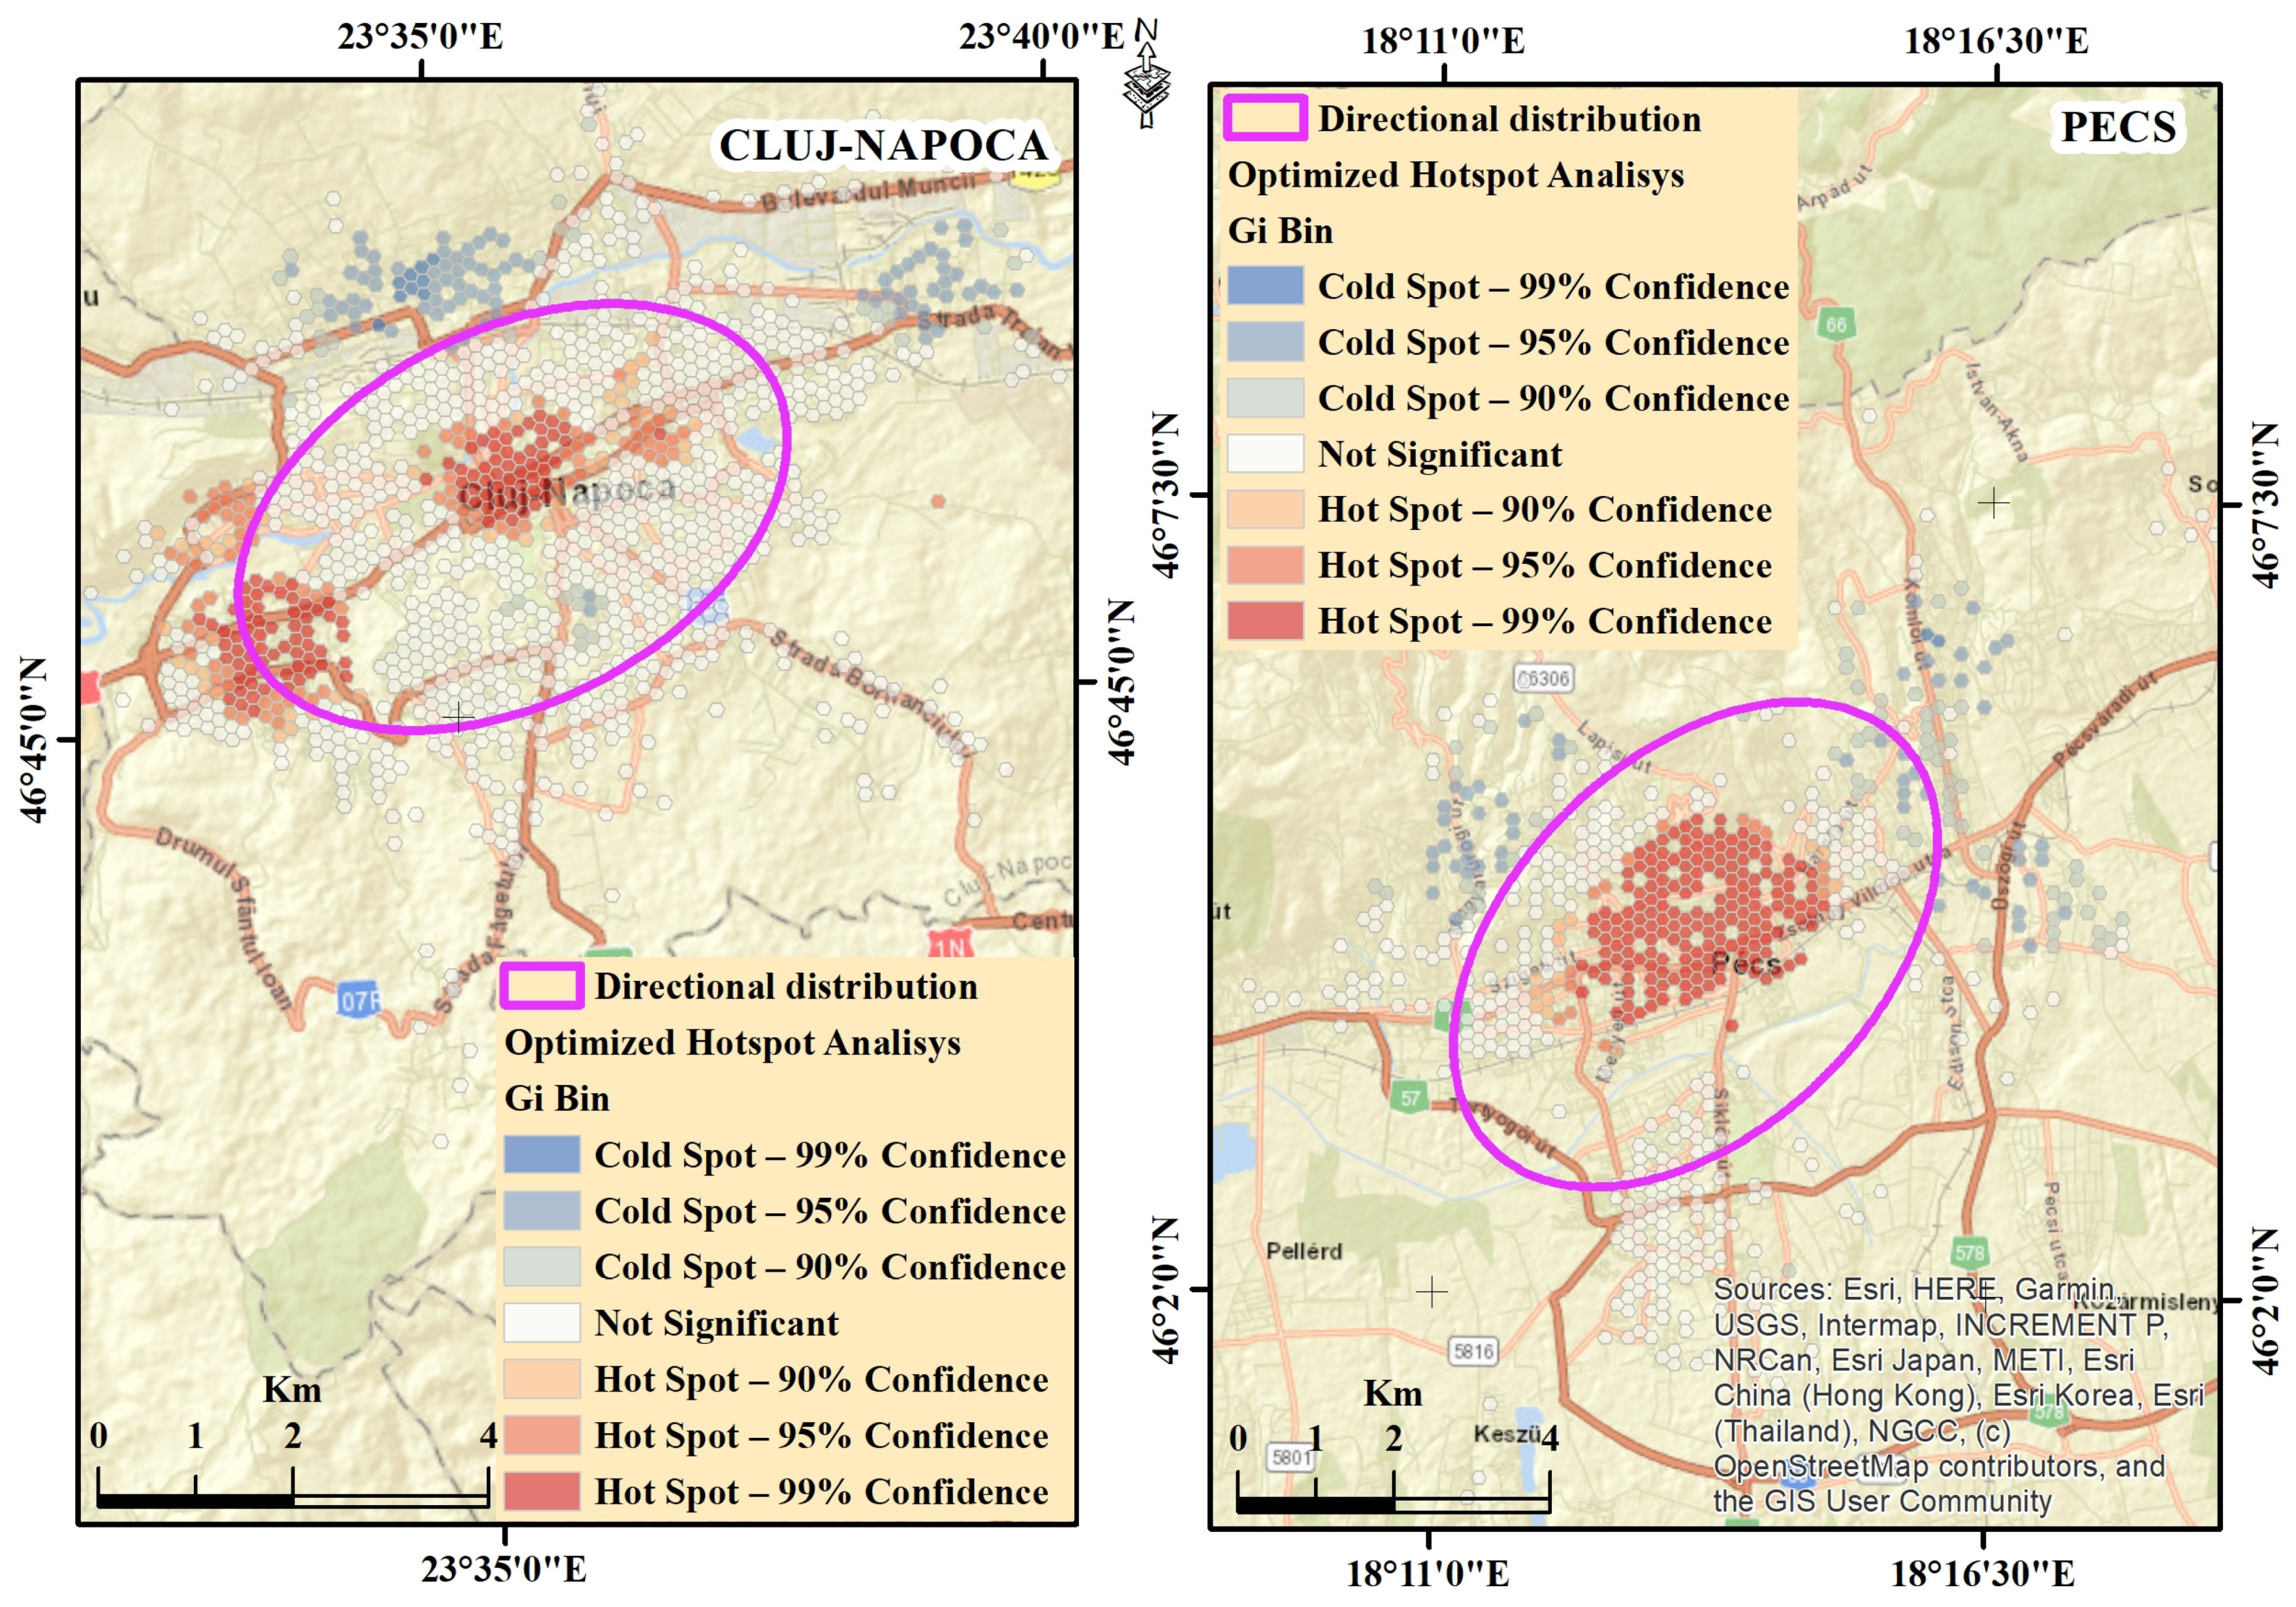
The spatial arrangement of creative industries within cities reveals two different patterns in terms of their clustering—patterns that directly influence the spatial arrangement of accessibility ranges. The analysis of hot-spot clusters brings to the fore the clustering in a single hot-spot identified near the centre of Pécs. Instead, three main hot-spots can be identified in the city of Cluj-Napoca: a very well-connected hot-spot in the centre of the city; a hot-spot in the eastern part of the city spatially identified with the largest block of flats (Mănăștur district) in Cluj-Napoca—thus, in one postal code, several creative industries are identified, but they are on different floors; and a hot-spot in the making (the Grigorescu neighbourhood)—an expanding neighbourhood where many commercial companies have their headquarters but operate in other locations (
Figure 3). From the point of view of the spatial arrangement of the cold hot-spots, the city of Cluj-Napoca stands out with such a hot-spot in the northern part; a hot-spot developed due to the expansion over large areas of neighbourhoods with individual homes; and a cold hot-spot in the immediate vicinity of the airport, where more storage spaces and less creative industries are identified. Approximately the same directional distribution is identified in the NE/SW direction imprinted by the inner-city development of the two cities, around the main transport axes that serve them.
The activities of the cultural economy are not evenly distributed [
47]. In some spaces, they are organised in clusters, especially in larger cities, where there is a complex system of specialised services and a specialised workforce. In regional centres, productive activities are co-located or linked to larger economic sectors such as high-tech and financial services, which depend on cultural and design-based industries as input sources. As we have seen in the business registers, most of the CCI sector is made up of micro and small enterprises and is therefore characterised by both fragmentation and economic networking, specialisation, and flexibility. Spatial proximity provides agglomeration benefits through cost reduction and access to knowledge [
48].
These effects can be well exploited in the CCI sector, and a conscious intervention of urban policy can help. In the case of Pécs, the preparation for the European Capital of Culture title has provided a huge opportunity for the renewal of the city’s creative industries and their locations [
49].
The hot-spots in Pécs show the extent to which economic policy can have an impact on businesses in the CCI sector. The renovation of the Zsolnay district has extended the city centre, creating a new creative quarter within the city.
Due to the large number of creative industries (36 depending on the field of activity and their CAEN code), it was decided, within the accessibility comparison analysis, to classify them into 11 classes to highlight their specificity (
Table 2).
A direct comparative analysis of the number of companies whose main activity is in the creative industry highlights the large numerical difference between the two urban centres analysed. The large number of creative industries identified in Cluj-Napoca (4839) highlights its character as a polarising centre, not only on the neighbouring localities that are part of the metropolitan area but also on the whole north-west region due to its role as a centre of influence and attractor due to the facilities and business opportunities it offers to potential investors. Compared to the area of territorial influence, the city of Pécs has the same spatial influence and investment attraction behaviour from the periphery to the centre; thus, we were able to identify 1308 companies whose main activity is in the creative industry. The small spatial influence, location and administrative division mean that the number of creative industries is low due to their dispersion within other urban centres, which act as a secondary pole of influence. Analysed comparatively, the two cities have similar behaviour in terms of their development based on the creative industries, showing a major influence in the territory and attracting investments in the creative industries due to their role as a pole of development and growth in the territory or as a result of, on the one hand, the influence and facilities offered, and on the other hand, the existence of consumers/demand for such industries.
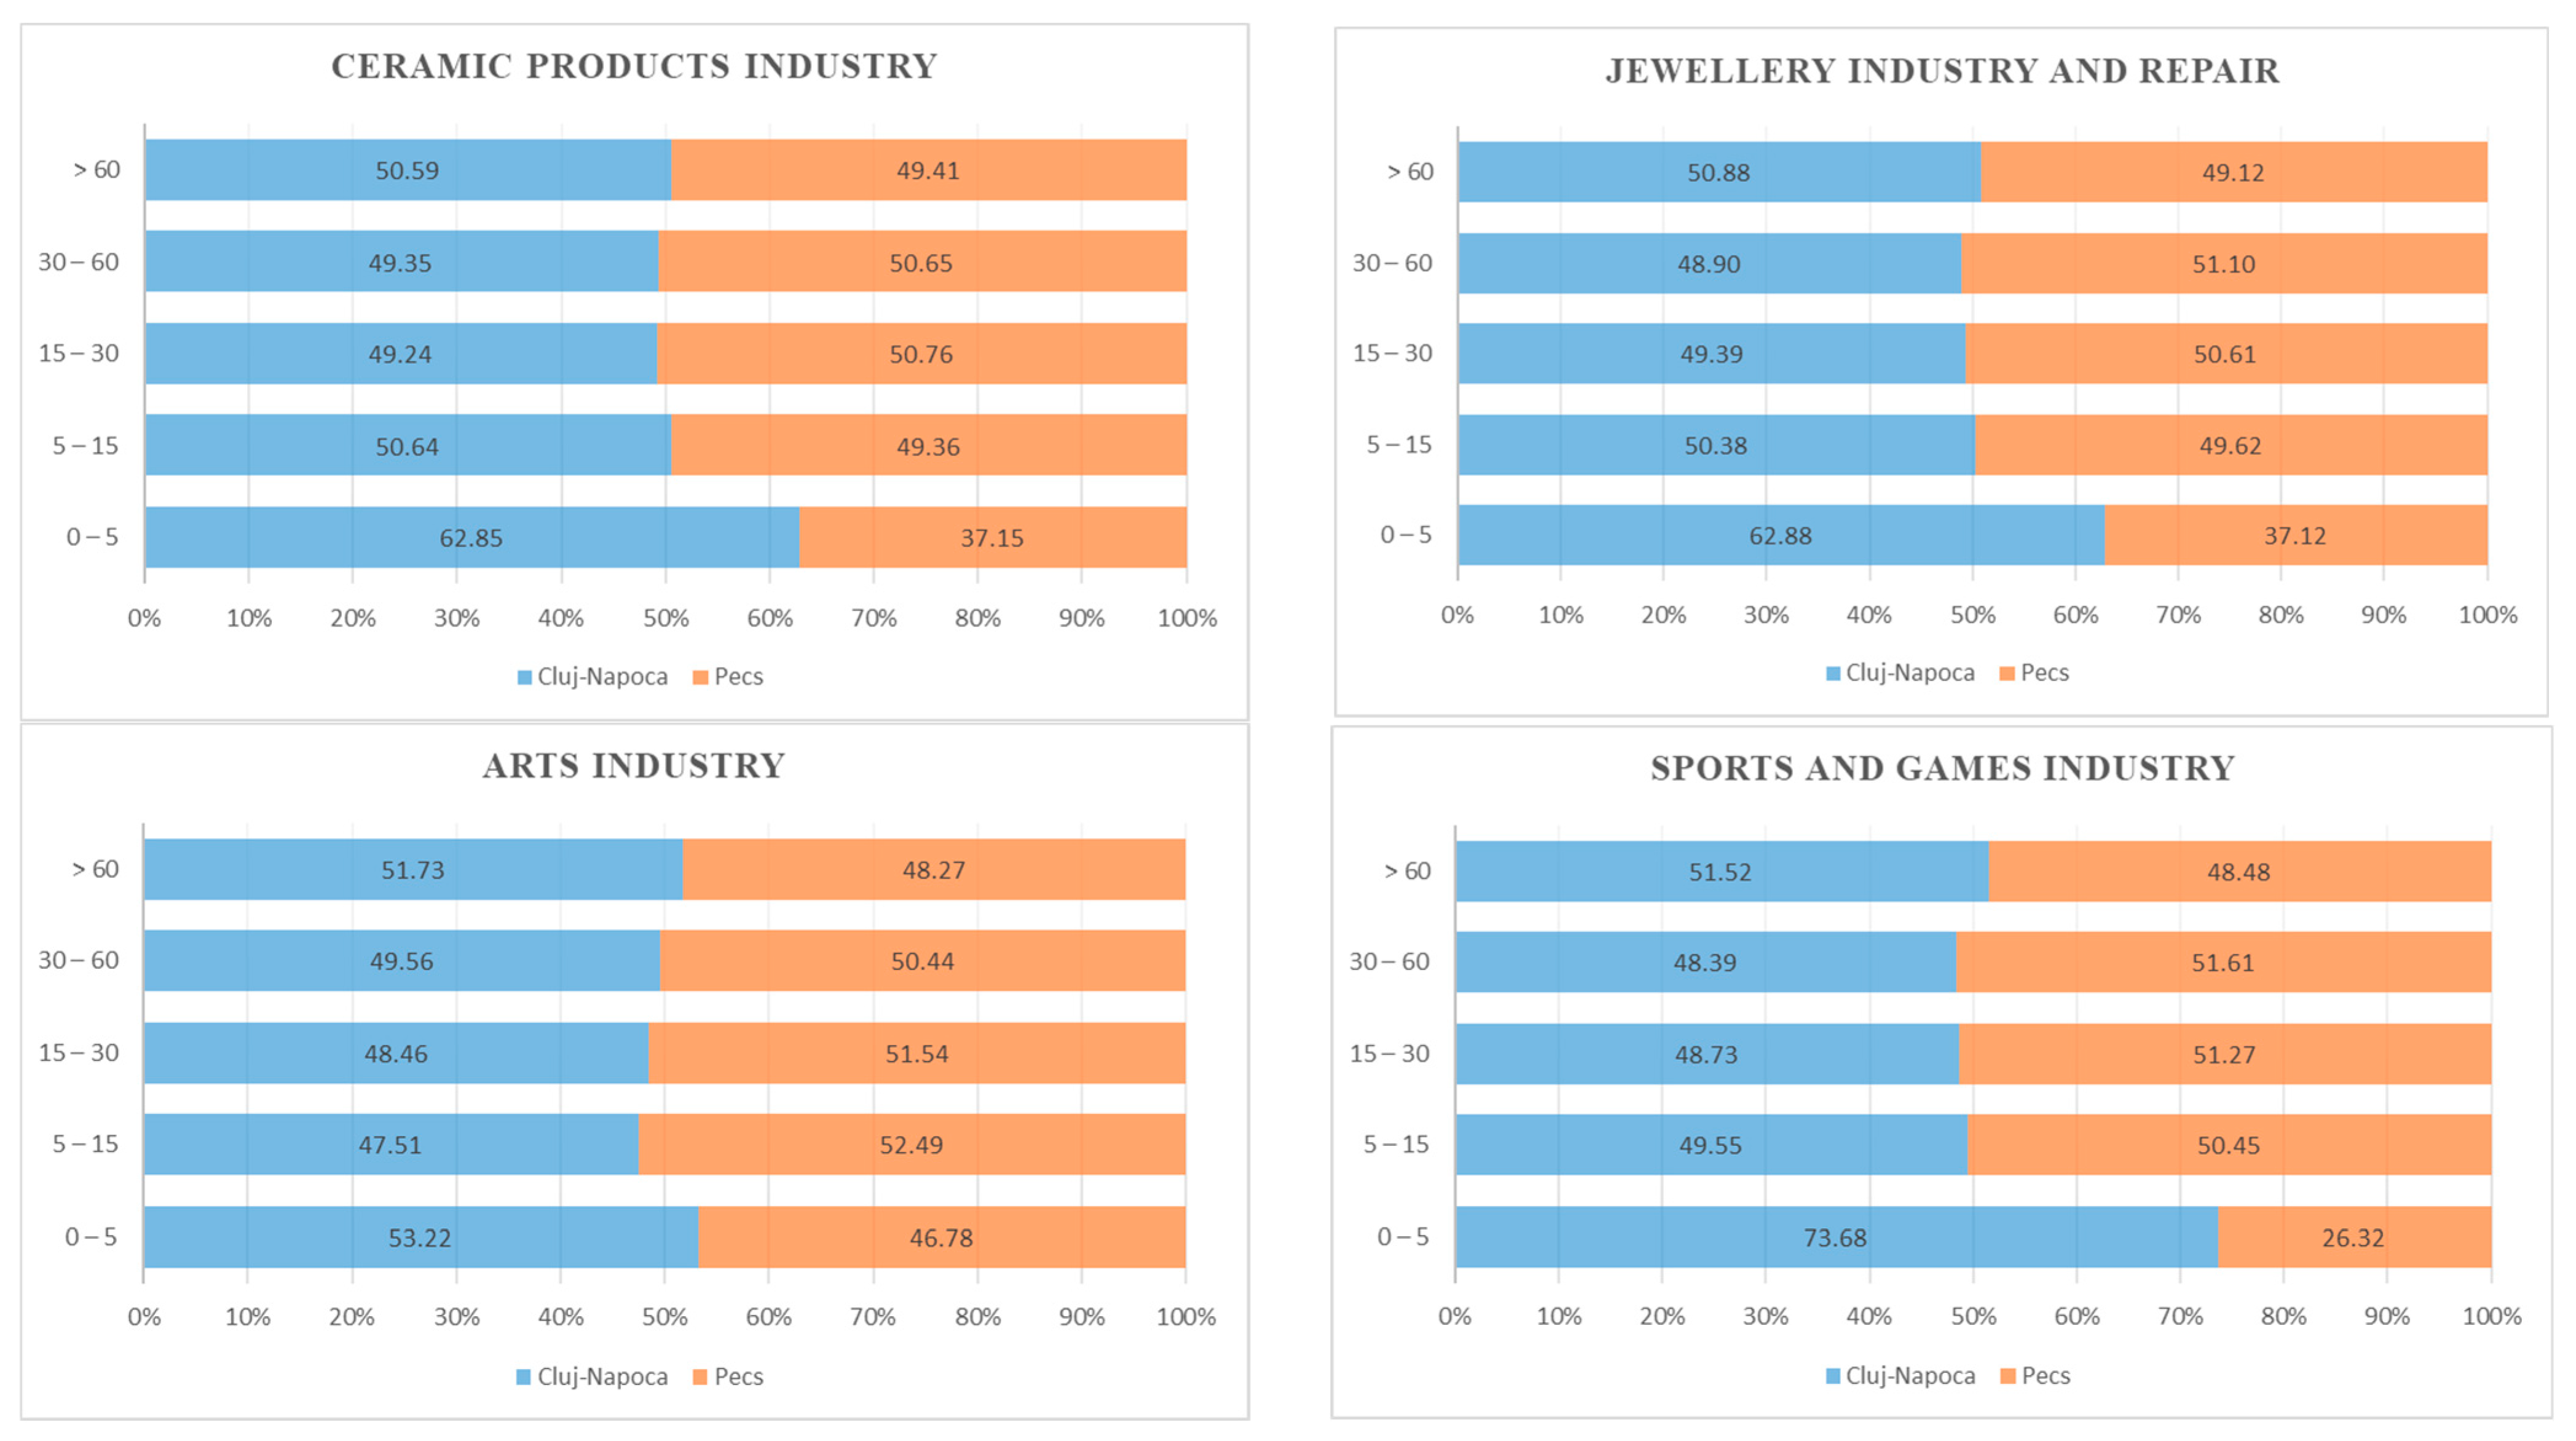
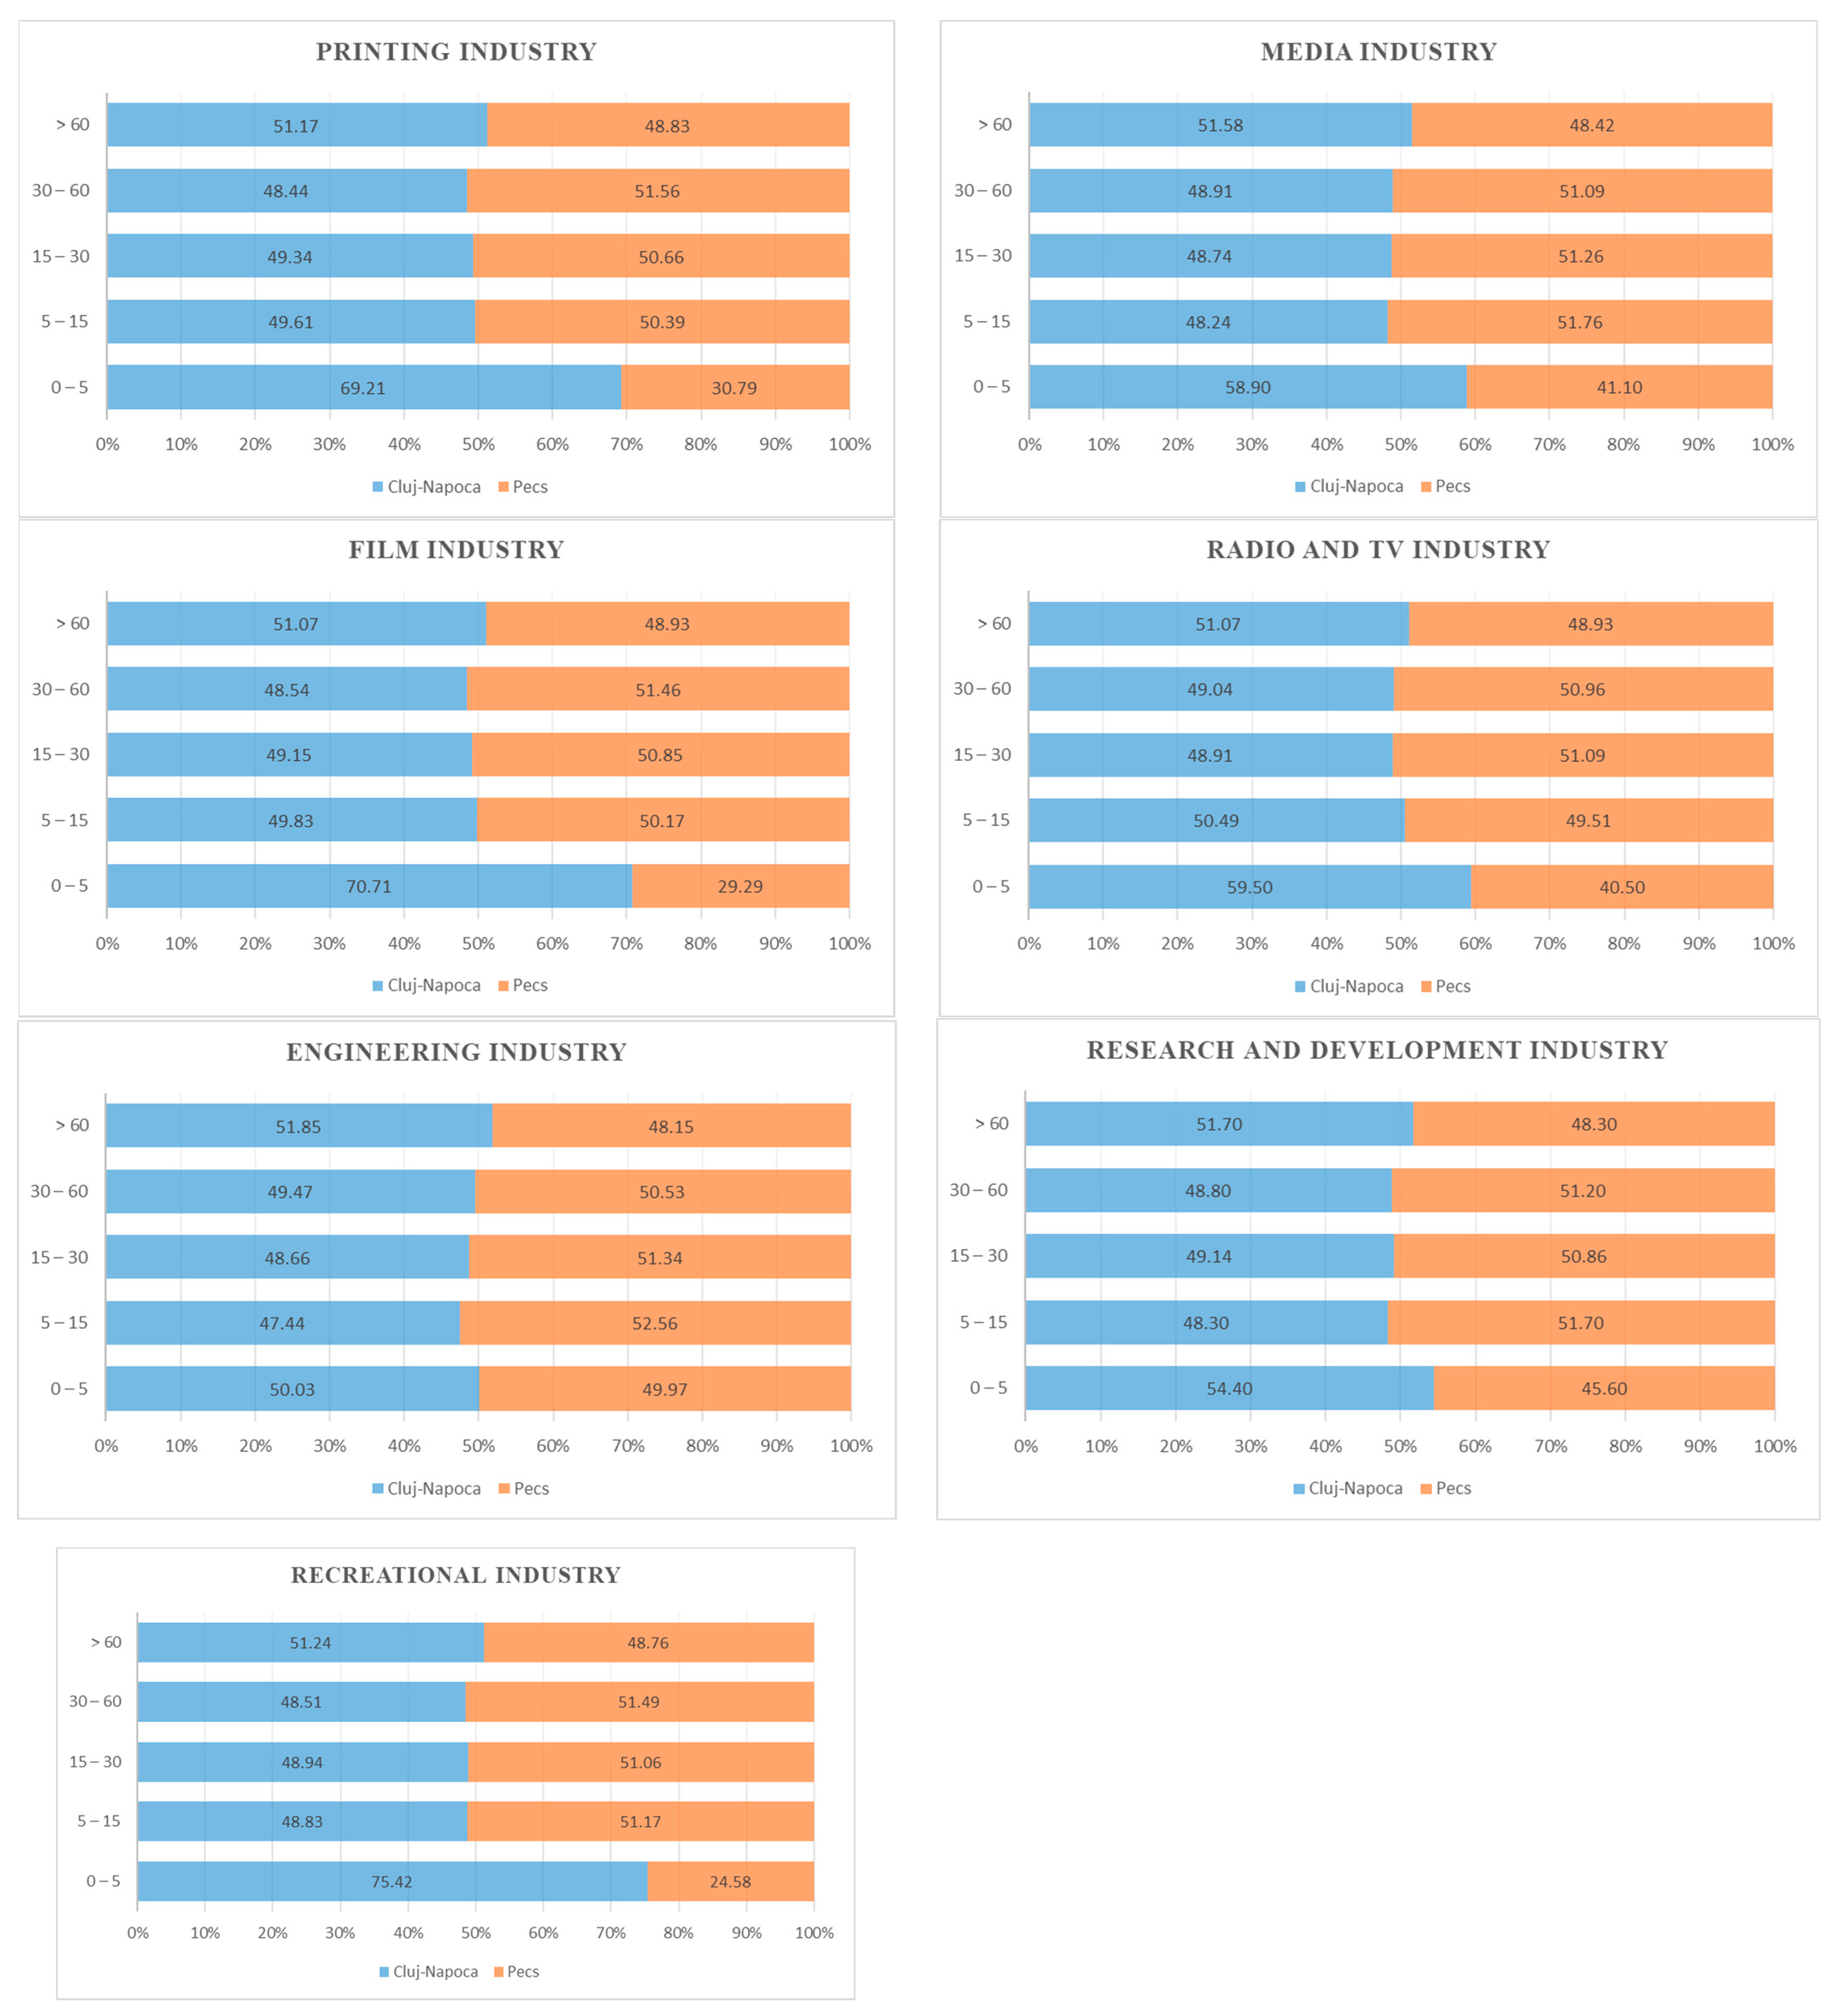
The comparative analysis at the level of the type of creative industry highlights the high weight of the engineering industry and the research and development industry, which have relatively close weights—over 50%—in both urban centres. This highlights the role of the centre of innovation and application of practical technologies in the complex process of sustainable development of the urban centres analysed. The sustainability of the polarising urban centres is also highlighted by the offer, materialised in leisure and entertainment activities addressed to residents and commuters. The two urban centres have a varied and relatively similar offer, materialised in the media industry with a plus for the city of Cluj-Napoca—a plus that emerges from the character of its information hub, the arts industry (with a higher share in the city of Pécs, mainly related to the European Capital of Culture investments projects (Zsolnay District, Kodály Centre, Knowledge Centre and Library)), and the recreational industry.
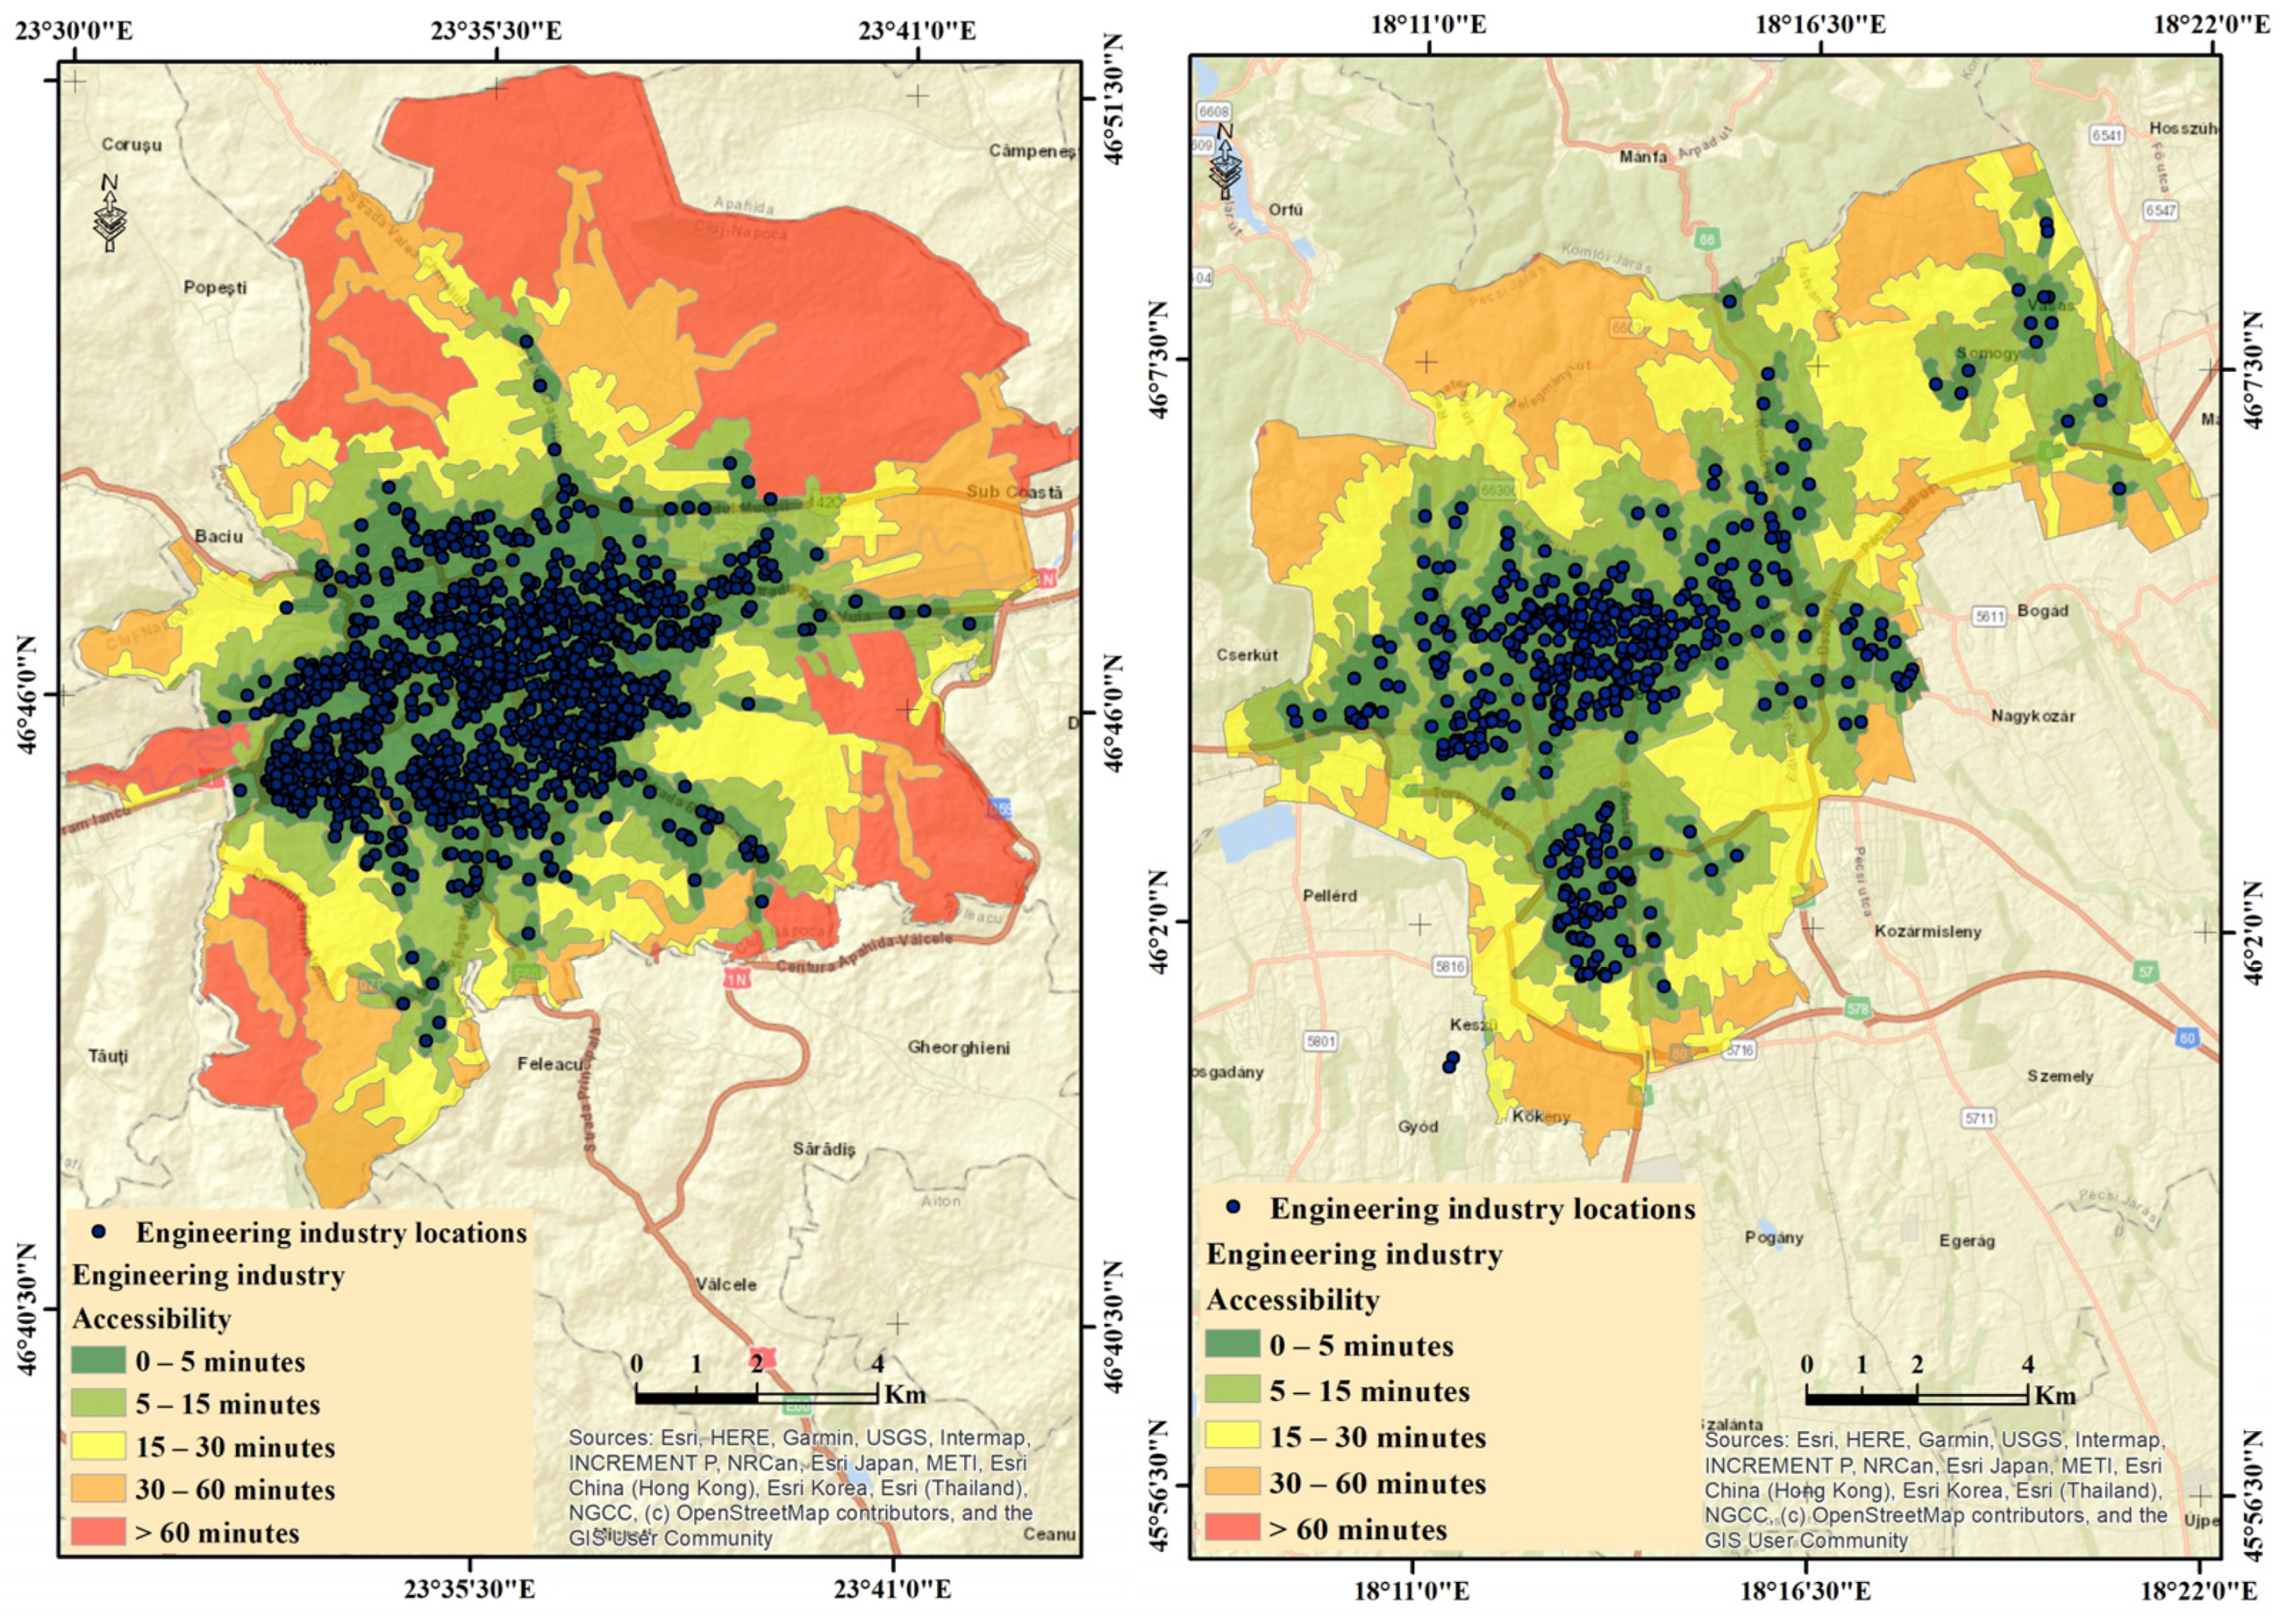
The territorial impact of the creative industry types places the accessibility of the workplace to the population at the forefront as the main factor in the analysis of mobility aimed at the 15 min city goal. The spatial distribution of the types of creative industry within the two urban centres analysed reveals similarities and differences, each of which has its own specific reasons for the type of industry it is located in. The analysis of the creative industries with the most locations in the territory reveals a different spatial distribution for the engineering industry (
Figure 4).
As far as the city of Cluj-Napoca is concerned, there is an agglomeration of locations in the central area and in the large housing districts, which is due to the configuration of the housing network (where most of the companies have their headquarters) imposed by the specific relief of the city, which imposes a compact development of the housing districts with a gravity towards the central axis (E-V axis of the Someșul Mic river) of the city’s development. In the case of Pécs, a more fragmented picture can be seen, indicating the growth of the city, with villages administratively annexed from 1950 (in the north and north-east) and built-up residential areas (in the south) [
33].
These spatial differences have a direct impact on the accessibility of the territory. It can be noticed that the territorially extended areas, with accessibility in the range 0–15 min, are compact in the centre and close to the city centre. Within the city of Pécs some areas of discontinuity are identified, generated by administrative annexes and the construction of districts linked to coal and uranium mines. Discontinuity and location of industry types throughout the administrative territory adds value to territorial accessibility, which was identified in the city of Pécs where the maximum accessibility is in the range of up to 30 min, while for the city of Cluj-Napoca access times of more than 60 min were calculated for large areas, thus inducing territorial dysfunction in terms of engineering industry.
The other types of creative industries have a similar spatial distribution within the cities, being mainly located near the centres, giving them good accessibility, within the range 0–15 min. For the city of Pécs, the distribution of creative industries is divided into three main clusters: a cluster in the central area of the city, a cluster in the eastern area and a cluster in the south of the city, which does not affect accessibility in terms of time, whereas for the city of Cluj-Napoca, there is a general clustering of industries with development from the peripheral neighbourhoods towards the centre.
Due to the different spatial extension, both in terms of geometry and in terms of the surface areas of the administrative territories of the two urban centres, a comparative analysis of territorial accessibility cannot be carried out directly. Thus, for the analysis by components (types of creative industries), at city level, it was decided to analyse the surface areas occupied by each accessibility class in relation to the total surface area of the city. Following this methodology, a quantitative analysis was carried out based on values between 0 and 1.
Obtaining the bonus values for each accessibility range based on the proposed equation and methodology involves first calculating the occupied areas of each accessibility range individually, followed by calculating the percentage of land occupancy reported to the total area of the city and integrating them based on the equation system proposed in the analysis methodology. Thus, for the artistic industry, the areas for the accessibility intervals, specific to the city of Pécs, were calculated: 0–5 min (28.12 Km2/17.28%), 5–15 min (41.17 Km2/25.29%), 15–30 min (50.28 Km2/30.89%), 30–60 min (38.41 Km2/23.60%), and >60 min (4.75 Km2/2.91%) and the total area of the city was 162.3 Km2. Obtaining the bond value is performed by implementing the equation system of the kind:
where 0.20—the value of the scoring interval; 0.034, 0.050, 0.061, 0.047, and 0.005—the value of the accessibility scoring depending on the area; 0, 0.20, 0.40, 0.60, and 0.80—the basic value of the scoring interval; and 0.034, 0.250, 0.461, 0.647, and 0.805—the value of the accessibility scoring depending on the area.
Implementing the presented equation system, we obtained scoring values for each type of creative industry and each accessibility interval (
Table 3). These values were used in the process of spatial comparative analysis, based on the accessibility of the creative industries of the two administrative-territorial units.
Our comparative quantitative analysis of accessibility based on the type of creative industry, intended to highlight functional areas, underscores the impact they have on the territory while also pointing to their functionality or dysfunctionality, which was analysed from the perspective of the characteristics of the respective industry.
Obtaining the bonus values makes it possible to directly compare the access times for the two urban centres for each type of creative industry, without this comparison being influenced by subjectivity. The territorial accessibility component assimilated to the new 5 min city concept, which could be implemented territorially within the territorial development strategies of large urban centres [
50,
51], is mostly specific to Cluj-Napoca (
Figure 4). The sports and games industry, film industry, and recreational industry stand out as creative industries that suggest functionality in Cluj-Napoca for this category of accessibility. The largest territorial impact in comparative terms is the recreational industry due to the large number of creative industries identified in Cluj-Napoca in relation to the total area of the city. The small surface areas with 0–5 min accessibility compared to the whole administrative territory show, for each creative industry analysed, that interventions in the territorial planning process are necessary so that the mentioned concept can be implemented territorially.
As regards the direct comparison of the two urban centres with the 0–15 min interval (the 15 min interval is specific to the concept city of Pécs), better accessibility specific to the city of Pécs is noticed, as evidenced by the engineering industry and the research and development industry (
Figure 4). The large number of creative industries in these areas is responsible for the high functionality of the territory. The city’s polycentricity is also reflected in its easy accessibility, with creative industries in every part of the city, marked by the Garden City hub in the south and the Uranium City nodes in the west. In 2010, the European Capital of Culture project was an initiative to integrate the city’s creative and cultural industries more fully into the life of the city, with renovations and new buildings being located close to the university’s central faculties. The new cultural centres have reinforced the existing CCI, extending the historic city centre east and west.
The comparison for the accessibility intervals with times greater than 15 min (
Figure 5), for the rating interval 0.40–1, highlights the similarity in terms of accessibility for the two urban centres. The comparative analysis for each type of creative industry for this range highlights the fact that the city of Cluj-Napoca has a low functionality: the bonus areas in the range 0.8–1 with over 60 min access are significantly higher than for the city of Pécs. The comparative analysis of accessibility for each creative industry highlights a functional pattern that can be analysed in three main categories. The first category is represented by the accessibility interval of 0–5 min, rated with values between 0 and 0.20, which shows an increase in functionality for the city of Cluj-Napoca; the second category is represented by the accessibility interval of 5–60 min, rated with values between 0.20 and 0, 80 which shows the same pattern of territorial functionality for both Pécs and Cluj-Napoca; and the third category is represented by the accessibility interval of over 60 min, rated between 0.8 and 1, which shows the less functional character of Cluj-Napoca.
The component analysis does not highlight the general character of territorial accessibility given by the creative industries due to their different importance in terms of impact on territorial development projects. In order to assess the cumulative accessibility and capture the importance of the access generated by each industry in the territory, a spatial analysis of integration through equations, spatial analysis, and spatial database boning was undertaken so that the result obtained—the cumulative accessibility—could be analysed both from the point of view of spatial impact (based on cartographic materials) and the point of view of the direct comparison of the two urban centres (based on the statistics of the boning values related to the final result).
The implementation of the spatial analysis equation proposed in the research methodology addressed implies that the two types of creative industry considered the most important in terms of territorial impact have the highest impact in the process of the accumulation of accessibility. In order to finalise the spatial analysis and implement the spatial analysis equation, we decided that the research and development industry and the engineering industry were the representative industries of the two cities. This is because they are the industries that give the cities general specificity, and they are the most important in the process of territorial development both in terms of the quality of the workforce employed and the possibilities of carrying out specific activities.
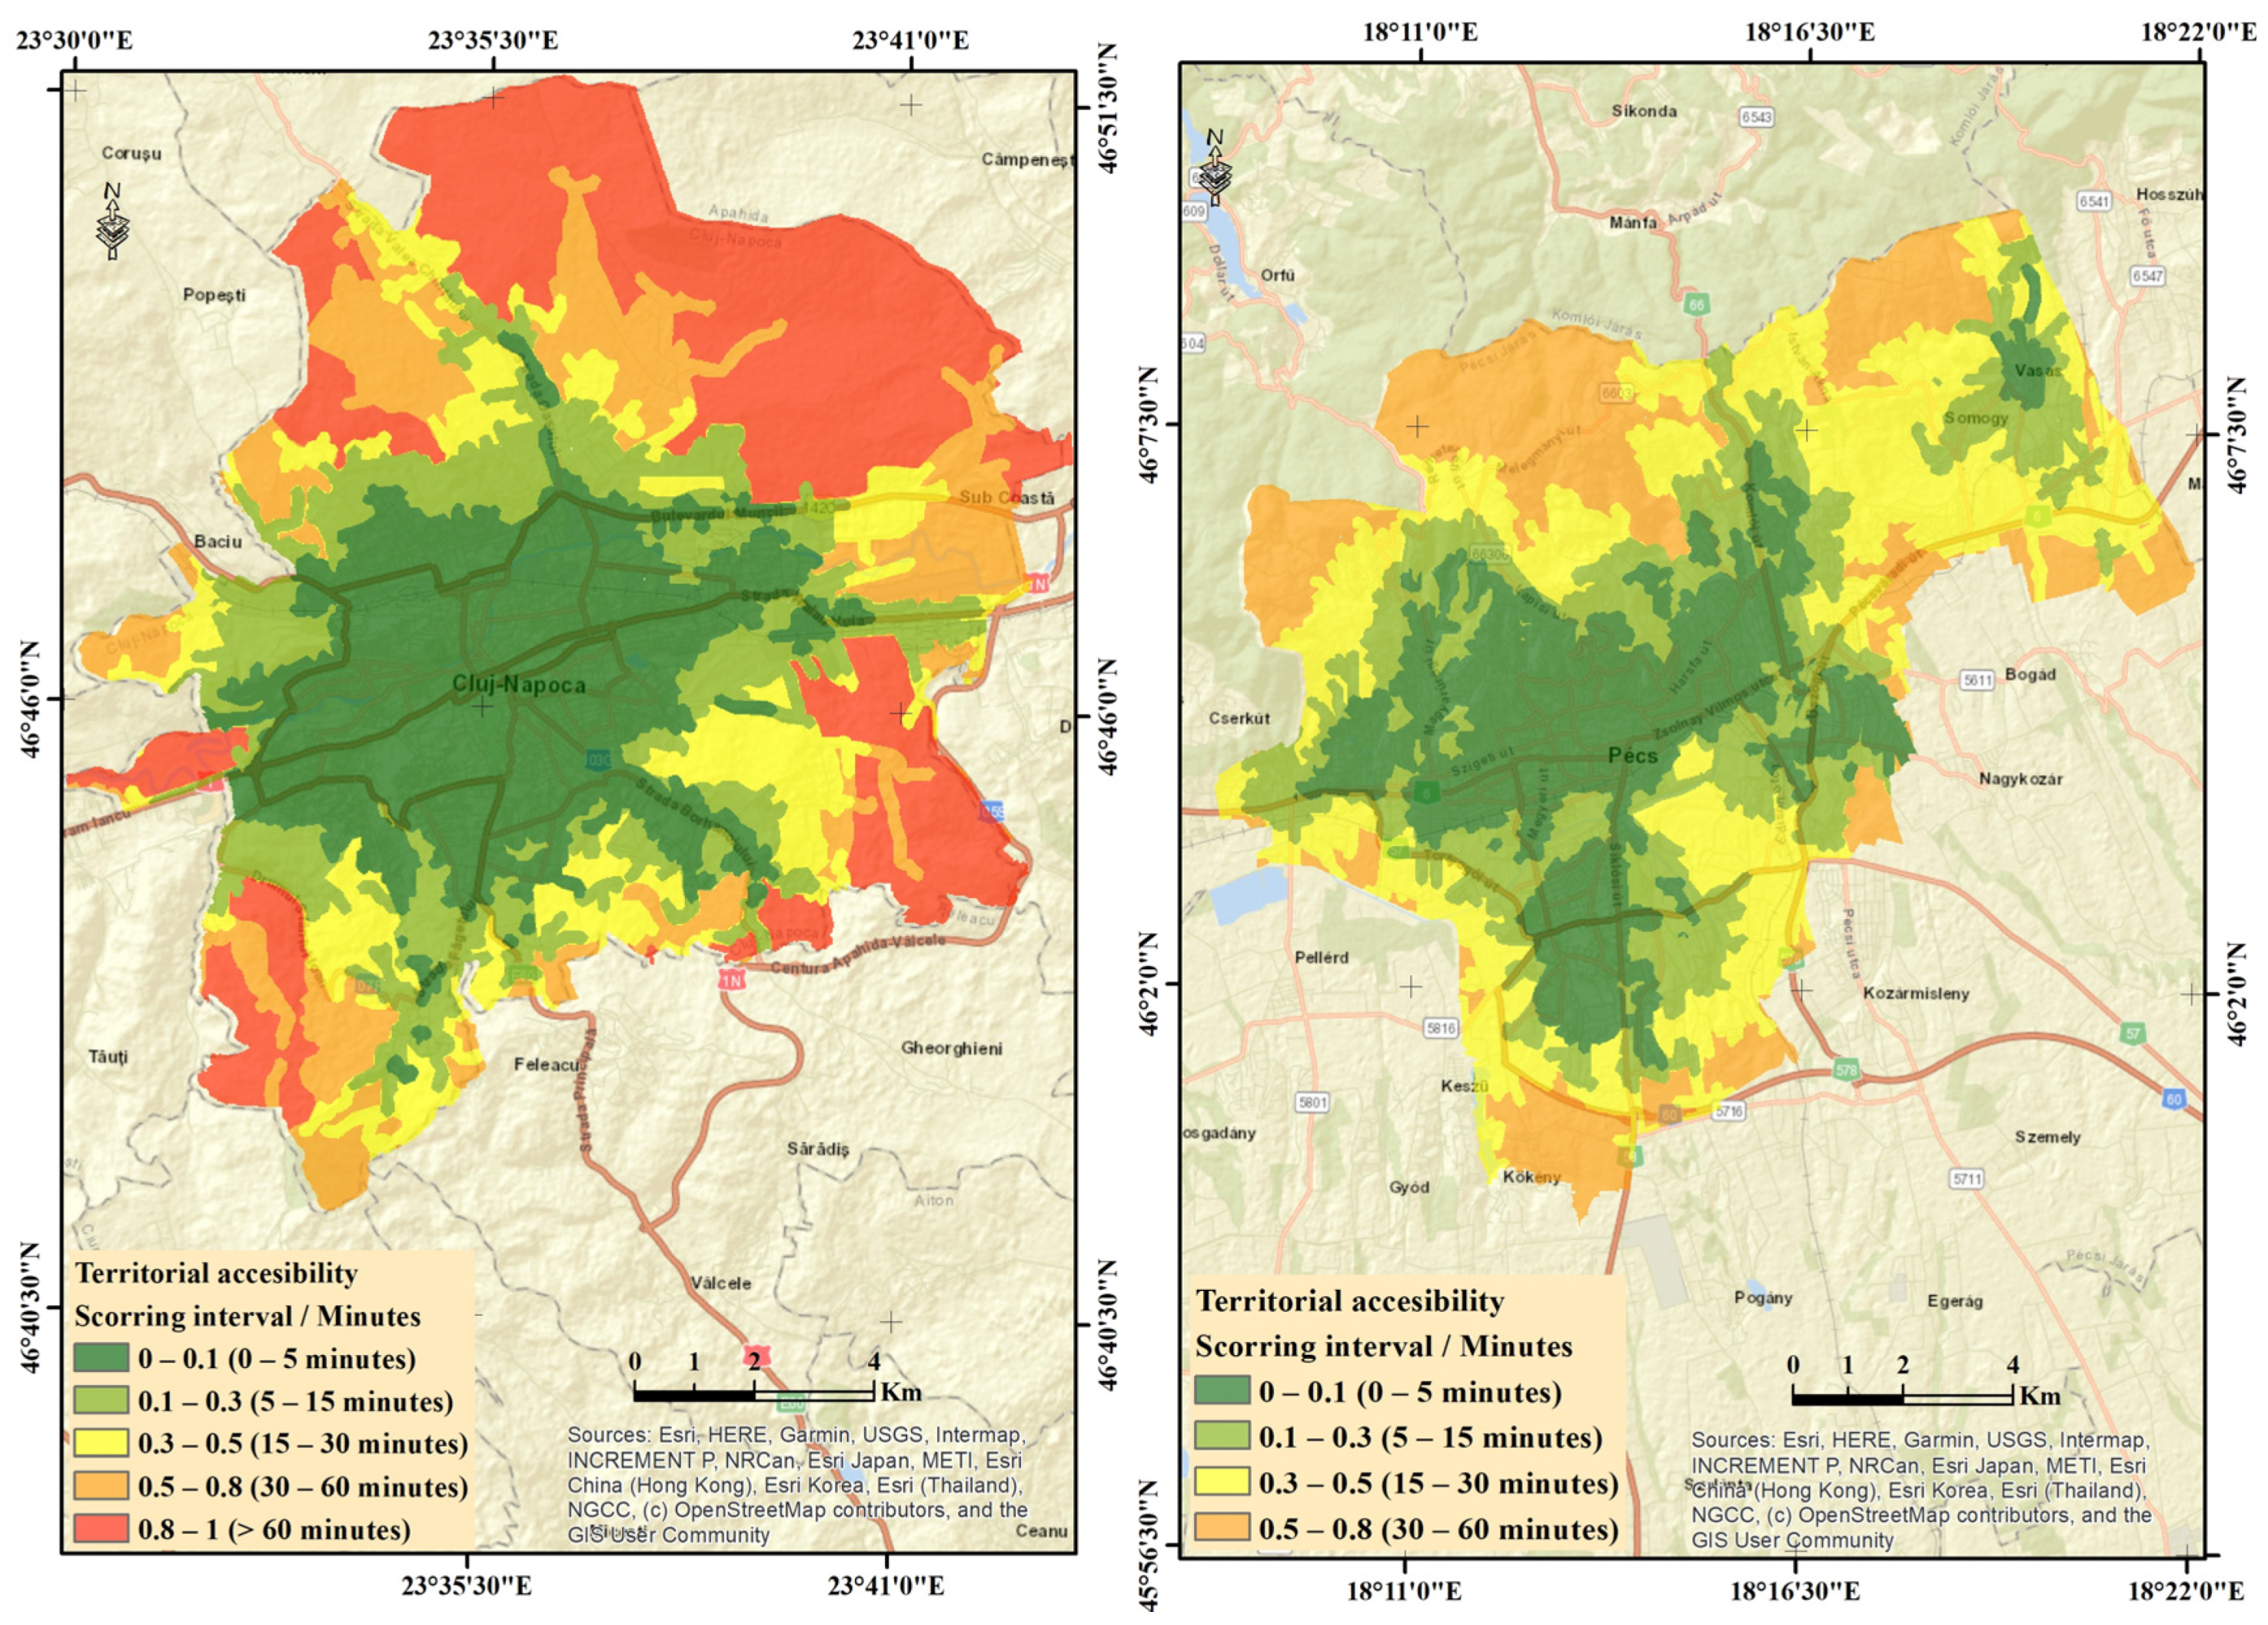
The comparative analysis of the spatial extension of the cumulative accessibility (
Figure 6) highlights the unitary character of the territorial areas with 0–5 min accessibility related to Cluj-Napoca. This is primarily due to the co-location of creative industries in the central area and along the main axes (E-V axis and the city centre—S axis), which ensures the functional flows of the city and induces constraints in terms of real estate development or industrial parks and implicitly the location of industries within the administrative-territorial unit. The same constraints are also responsible for the uneven territorial distribution of accessibility ranges in the city of Cluj-Napoca. The development of real estate and related infrastructure in the central-southern and western parts of the city gives a higher functionality in terms of accessibility to creative industries, with most of the territorial areas being located in the 0–15 min intervals, while the northern and south-eastern parts are characterised by a lower functionality, with most of the territorial areas being located in the 15–60 min intervals, with a large extension of the intervals being above 60 min.
The CCI companies located in Pécs are mainly focused on road accessibility, with the main road (Route 6) to the west-east and the southern border being the main access points. In this way, the elongated downtown and the fragmented residential areas, with their smaller hubs, showcase the diversity of the city. The accessibility of the industrial parks in the southern and eastern hubs is historically rooted in the administrative annexation of smaller villages close to Pécs, which has led to a gradual increase in the city’s territory but has also had an impact on the industrial structure and its accessibility. The industrial park in the south is one of the city’s newest investments; it is still in the initial, under-construction phase (with several companies settled, but roads and basic infrastructure have not yet been built throughout the entire area). This is why we find this area in the over 15 min category. The northern part of the city is connected to the Mecsek mountain range, which makes access to these areas difficult due to the natural geography.
The 15–30 min accessibility range is spatially underdeveloped in the case of Cluj-Napoca due to the compact nature of the creative industries’ locations, with the city’s specific constraints also having an impact here. This is due to the spatial arrangement of industry types and spatial development policies. The city of Pécs is developing creative industrial hubs in the form of islands in different parts of the territorial administrative unit (western and southern parts) due to the low restrictiveness imposed by morphometry and access infrastructure, resulting in territorially extended areas without locations of creative industries.
The spatial extension towards the periphery of Pécs of the 30–60 min accessibility range mostly fits the previous accessibility range, re-establishing the fact that the population’s access to creative industries decreases from the centre to the periphery primarily due to the clustering of industries in the central area, as well as due to decisions to develop industrial hubs that stand out as islands of local accessibility.
From the point of view of comparing the spatial extension of the accessibility intervals, the interval of more than 60 min stands out very clearly, which, in the case of Cluj-Napoca, characterises the northern and eastern territorial areas, while in the case of Pécs, it is missing. The lack of an accessibility interval of more than 60 min highlights the good management of spatial resources in terms of access infrastructure but also in terms of the territorial distribution of housing and related infrastructures, which are located near the industrial hubs developed in recent years.
The elimination of the territorial dysfunctionality, caused by the large territorial areas occupied by an accessibility interval of more than 60 min in the case of Cluj-Napoca, is a matter for its future development policies. Thus, short- and medium-term development strategies focus on the development of industrial parks in the northern and north-eastern areas of the city—parks that include creativity-based industries, primarily research and development and engineering industries. This policy of developing industrial hubs (mainly green and creative industries) is in line with the spatial development of housing estates in recent years, which tends to exploit the land areas in the north and north-east of the city, resulting in integrated land management that will make the area functional in general but above all functional in terms of access, bringing the human component closer to the workplace and reducing access times.
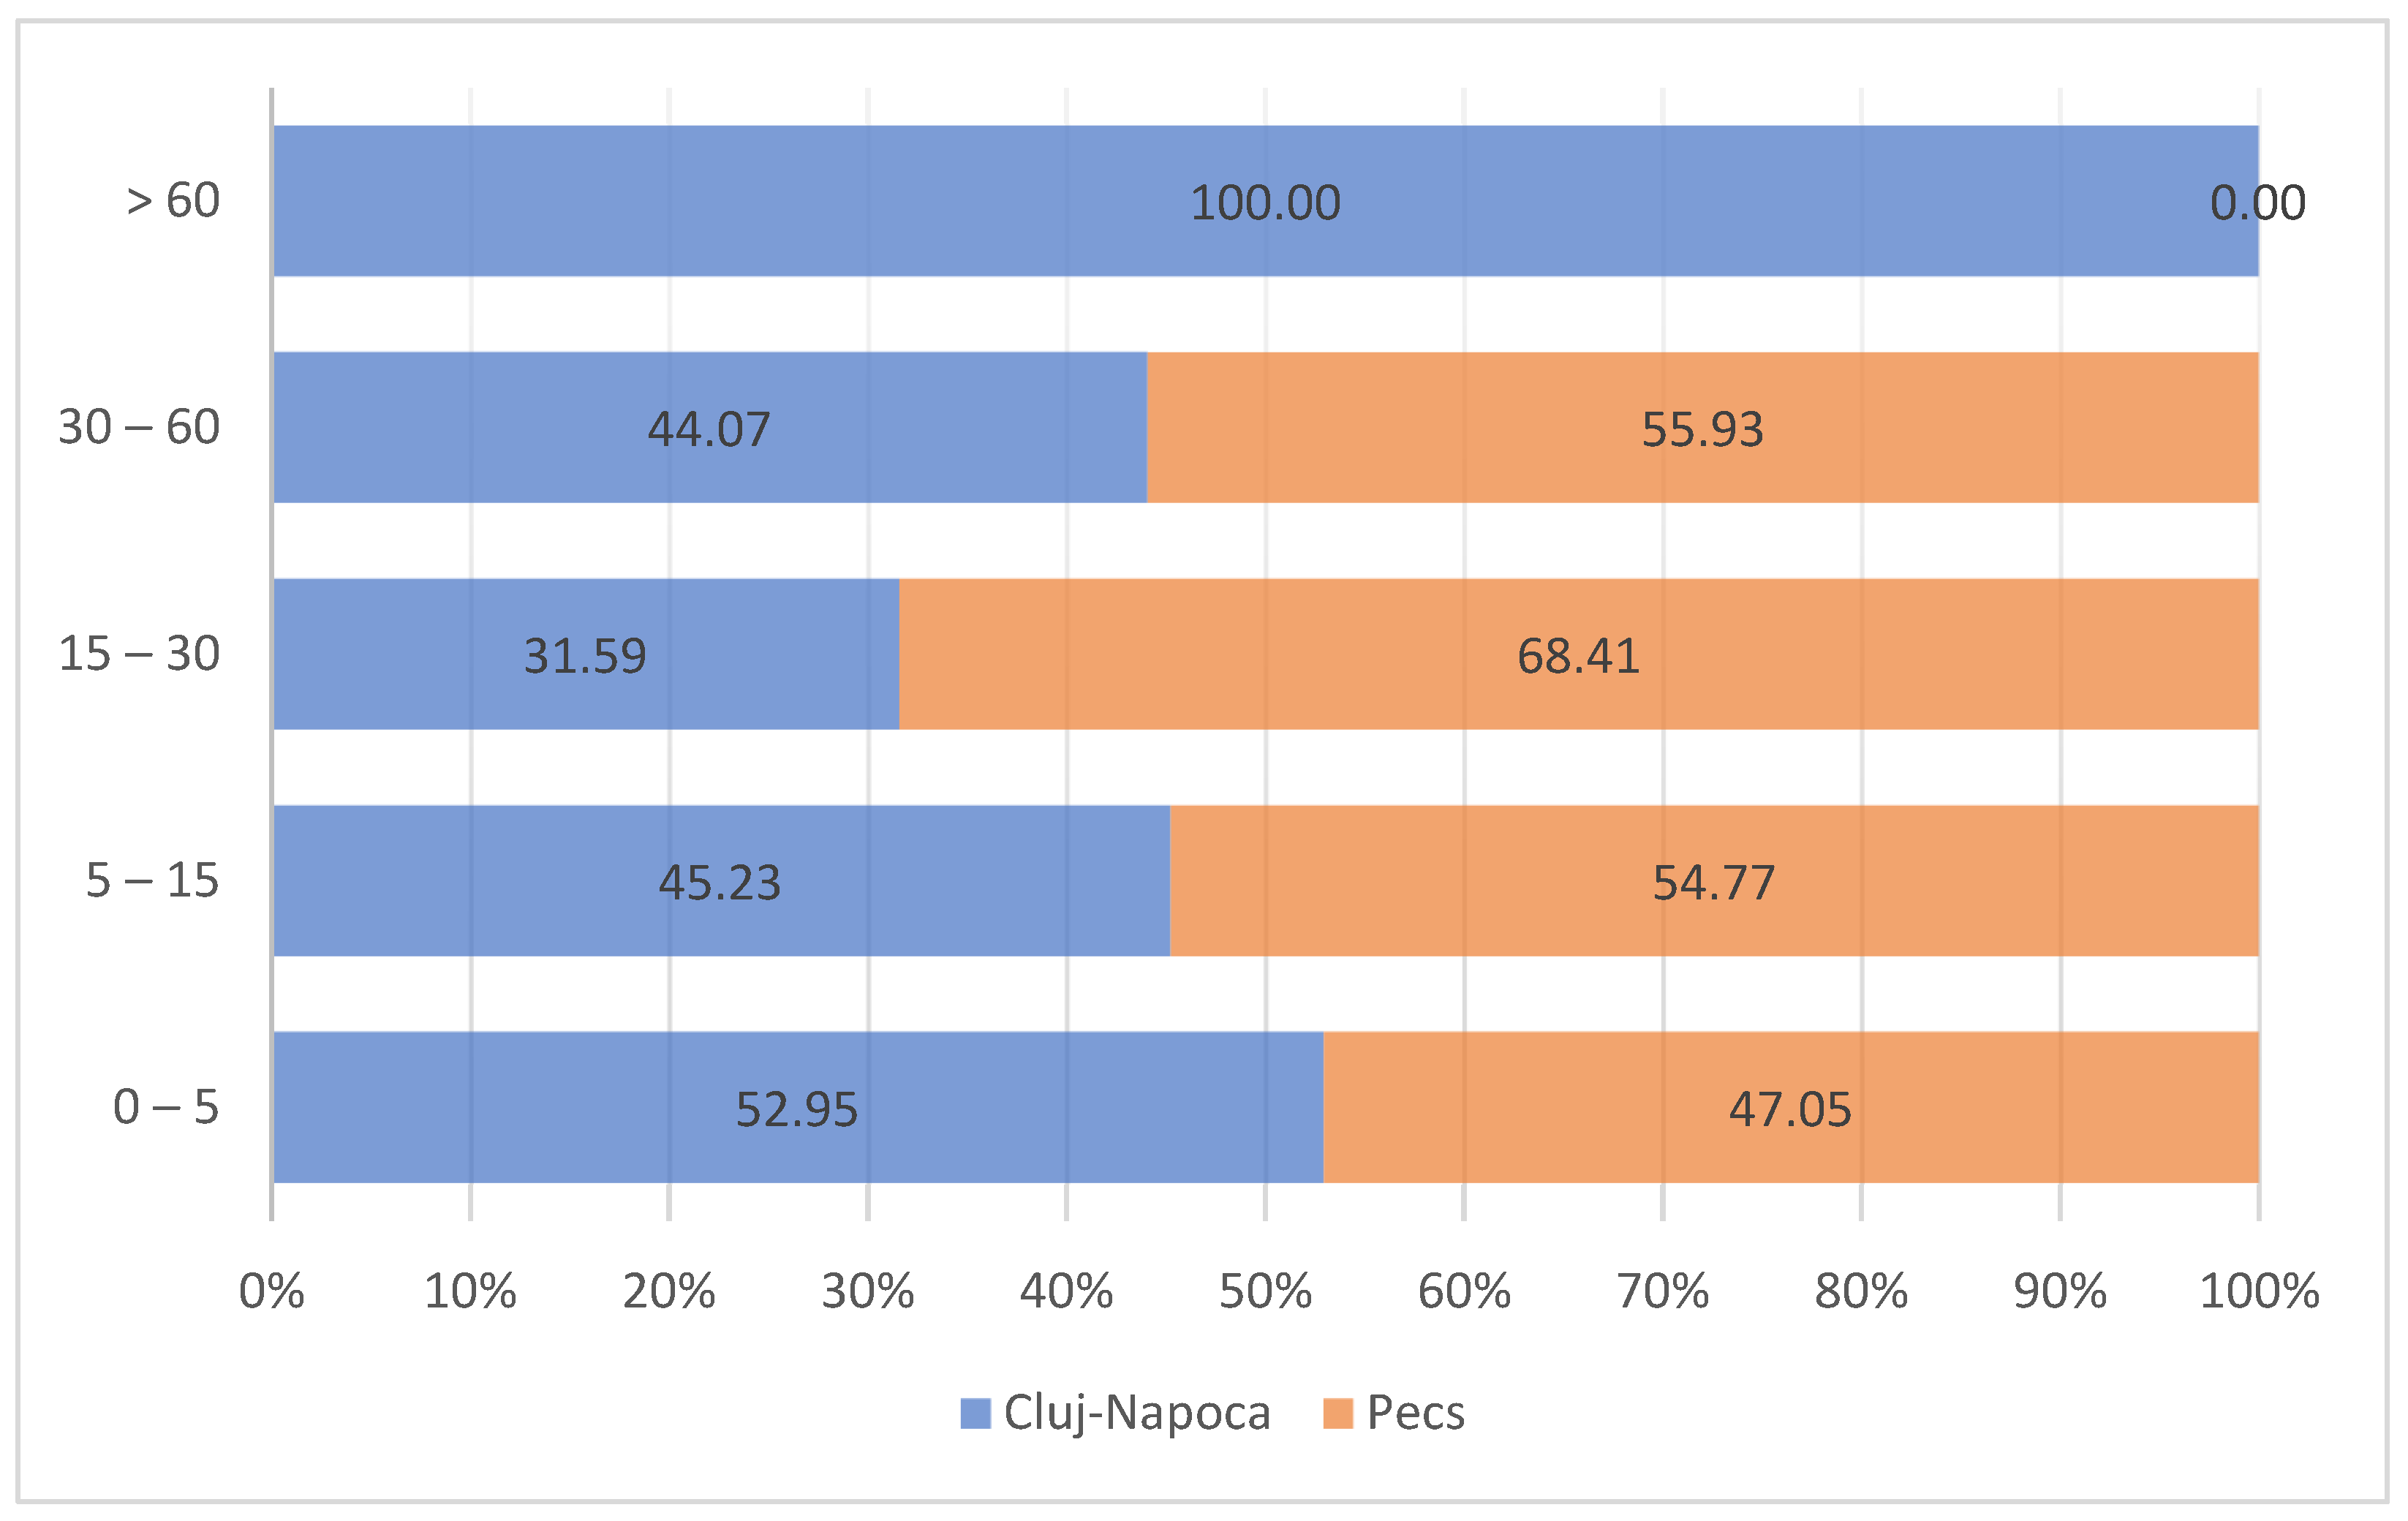
The quantitative comparative analysis of access times based on the concept of the surface area occupied by the time interval in relation to the total surface area of the administrative-territorial unit reveals the general functionality of the units analysed. Comparing the two urban centres (
Figure 7), a relatively similar functionality emerges for the 0–5 min interval, which clearly highlights the compact, sometimes crowded, nature of the layout of the creative industries’ locations in the two cities. The difference is in the territorial layout of the industries.
As regards the analysis of the time intervals that define the concepts of functional city, 15 min city, the city of Pécs stands out with high functionality due to the territorial arrangement of industrial centres in the form of hubs throughout the administrative-territorial unit, which eliminates dysfunctions related to access to the territory due to its spatially efficient use. At the same time, the access intervals of 16–60 min have a more regular spatial presence in the city of Pécs but are blurred as a direct territorial effect by the lack of accessibility intervals of more than 60 min, which in the city of Cluj-Napoca is identified over large territorial areas and imposes major territorial dysfunctionality in terms of access to the creative industries.
The comparative analysis of the functionality of the urban centres in terms of accessibility, both on the basis of the components of the creative industries and the integration of these components to achieve overall accessibility, reveals similar behaviour for the cities of Pécs and Cluj-Napoca. Eliminating discrepancies can be achieved by issuing and implementing sustainable spatial development policies and strategies that put at their core the judicious use of land so that the human component is the main beneficiary of the increase in quality of life by achieving the goals set by highly developed urban centres—goals that are in line with the trend of the 5 or 15 min city.
The identifiable spatial databases, both for the city of Pécs and the city of Cluj-Napoca, under free-source and proprietary formats, make spatial analysis in a GIS environment suitable for the evaluation and comparative analysis of the two cities in terms of territorial functionality, with the analysis being conducted using final database structures with very high accuracy.
In terms of the limitations of this type of spatial analysis, the high processing time of the databases, the high complexity of the integrated analysis of databases representing industries with the same specificity, etc., stand out. The low availability of the databases used in the spatial analysis process (very fast dynamics of the locations of the creative industry and the types of industries identifiable within the TAUs) is another limitation that requires the implementation of the proposed model for analysis times based on characteristic years.
Modelling temporal changes in industrial character can be performed based on probability analysis, which can be implemented in the GIS spatial analysis model using statistical analysis. In this phase of our research, we did not focus on performing a probabilistic analysis, but we analysed the current state of play in terms of the impact of the creative industries and the cumulative impact of all industries identifiable at the time of the analysis within the two urban centres. Future research directions will aim to develop a spatial analysis model that can be the subject of more detailed research—research that can be aggregated, for example, with the trend of population growth or decline, thus removing some of the limitations of the proposed model and at the same time developing it from a methodological and practical application point of view.


 ,
, 


