Article

From Route Structure to Human Factors: A Comprehensive Study of Safe Separation on Intersecting Air Routes

College of Air Traffic Management, Civil Aviation University of China, Tianjin 300300, China
*
Author to whom correspondence should be addressed.
Appl. Sci. 2024, 14(3), 1089; https://doi.org/10.3390/app14031089
Submission received: 6 January 2024 / Revised: 24 January 2024 / Accepted: 25 January 2024 / Published: 27 January 2024

Abstract

:
The assessment of collision risk at intersecting air routes is a crucial method for determining safe separation during aircraft route flights. This paper employs the Monte Carlo method to analyze the operational characteristics of aircraft on intersecting air routes in two stages, integrating the influence of the human-operated adjustment process on the distance between the two aircrafts, so as to propose a collision risk assessment model more aligned with the actual operational process. The initial stage considers the positional errors to establish a distance distribution function between trailing and leading aircraft when the latter reaches the intersection. The subsequent stage calculates the minimum distance between the aircraft by combining the kinematic equations with the controller’s thinking and reactions, communications, the pilot’s reactivity, and time required for aircraft maneuvering. Ultimately, based on the intersection course configuration, Monte Carlo simulations were employed to assess the impact of variables, such as magnetic course and aircraft speed distribution, on collision risk. The study’s findings highlight the significance of aircraft positioning capabilities and speed maintenance performance. It also reveals that the collision risk results, simulated from various perspectives, offer a theoretical foundation for the development of intersecting air routes.

1. Introduction

1.1. Background

On 6 June 1971, near Duarte, CA, USA, at an altitude of about 15,150 feet, a DC-9 Western Air Lines airliner collided with a United States Marine Corps F-4B fighter jet. All 49 passengers of the former and the pilot of the latter suffered fatal injuries, with only one Radar Intercept Officer on the F-4B safely ejecting after the collision [1]. In 2002, a similar accident occurred when a Russian BTC2937 passenger plane collided with a DHX611 cargo plane over Überlingen, Germany, resulting in the deaths of 71 people, including crew members from both aircraft. Summarizing reports from the NTSB website, it can be determined that such mid-air collision incidents are rare, but their consequences are often disastrous, leading to significant loss of life and property damage. To effectively prevent such aviation accidents, especially at intersections where multiple air routes converge, it is crucial to identify the collision risk of aircraft operating in these airspaces and to establish reasonable safe separation to maintain air traffic safety.

1.2. Literature Review

In the face of the significant challenges posed by a substantial increase in air traffic demand and the complexity of airspace structures, aviation authorities worldwide have implemented a series of measures. These measures include changes to control procedures/methods, facility upgrades, and the introduction of new technologies, such as 4D trajectories, to reduce safe separation for aircraft, ensuring high-density operations. For example, the United States has implemented the Next Generation Air Transportation System (NextGen), and Europe has advanced the Single European Sky ATM Research (SESAR) program. These initiatives must undergo airspace planning assessments according to the requirements of the International Civil Aviation Organization (ICAO) before implementation. This section focuses on collision risk assessment, providing a systematic analysis of relevant research models and methods both domestically and internationally. Evaluating the risk of collision between aircraft in different scenarios and determining a safe separation in conjunction with the target level of safety (TLS) determined by ICAO will help to provide a theoretical reference for practical air traffic management plans and maintain the safety of aircraft operations.
For the purpose of providing a clearer description, the following definitions are given in this paper:
(1)
Collision: during flight, when the real distance between aircraft in the longitudinal, lateral, and vertical direction is smaller than the size of the aircraft, resulting in an overlap of occupied space.
(2)
Safe Separation: the minimum distance corresponding to a given distance between the leading aircraft and the intersection, which the trailing aircraft maintains to reduce the likelihood of mutual collision so that the risk of collision is below the acceptable TLS.
The assessment of collision risk for aircraft began in the 1960s with the Reich model proposed by Reich [2]. This model was primarily designed to solve the safety assessment issue of flight separation on parallel routes over the north Atlantic and has been widely used to evaluate the collision risk of aircraft in lateral, longitudinal, and vertical directions [3,4,5].
Subsequently, Siddiqee [6,7] shifted the focus of research to intersecting air routes. Given the intersection angle of two flight paths, as well as the average flow and speed of aircraft, he developed mathematical models to predict the expected number and duration of potential conflicts at air route intersections, thereby expanding the configuration of routes assessed. Anderson [8] further defined the conflict zone, using probability distributions and parameters derived from actual operational data to assess the collision risk at intersecting air routes. In 2013, Songchen [9] proposed a method for assessing the collision risk at air route intersections where the nominal distance at the intersection changes over time. In 2019, Novak [10] assessed the operational safety of aircraft at intersections by comparing the average number of potential conflicts, conflict intensity index, and capacity of different air route intersection configurations.
In 1993, Bakker [11] proposed a transient boundary method for the numerical assessment of collision risks in three-dimensional air route networks. He then introduced stochastic differential equations (SDEs) that consider switch coefficients to develop models for assessing the risk of mid-air collisions [12]. This method better simulates the real operational environment, but due to the complexity of the model, its application rate is not high.
In 1996, Cassell [13] assessed the impact of different technologies on the safety of free flight operations based on the framework provided by RASRAM. Then, Swaminathan [14] modeled dynamic scenarios using event sequence diagrams (ESD) in Markov processes. By this time, systems analysis methods, like fault trees and dynamic event trees [15] provided a comprehensive perspective for assessing the collision risks of aircraft. The combined use of these methods [16] allowed for the maximization of their individual strengths, offering a more complete logical approach for understanding the interdependencies within complex systems and for comprehensive modeling. This has further advanced the development of collision risk assessment.
In 2003, Brooker [17] approached from the perspective of events, focusing on flight times outside of planned flight paths, and proposed the EVENT model to describe the collision risk of aircraft. Following the introduction of this model, scholars’ research focused on two main areas: one was the improvement of the collision model itself [18]; the other was the integration with algorithms, such as TSRRT (Task Space Rapidly-exploring Random Trees) [19], to explore the feasibility of reducing the minimum horizontal separation in procedural airspace and its impact on traffic collision risk.
In 2007, Blom [20] used a stochastic and dynamic colored Petri net (SDCPN) to create a Monte Carlo simulation model for specifying the concept of free flight operations. He employed sequential Monte Carlo simulation methods to assess collision risks. On the one hand, Monte Carlo simulations can simulate collision risks of different aircraft combinations by altering the shape of the aircraft [21]; on the other hand, the simulations can also be accelerated in combination with mathematical methods [22] to assess collision risks in complex airspace environments.
In 2009, Zhang [23] using the Reich model and probabilistic theory, established a lateral collision rate calculation model for parallel air routes under VHF omni-directional range (VOR) navigation in continental areas, and then proposed the positional error probability theory method. This method, based on communication, navigation, and surveillance performance, takes into account the positioning errors in radar control environments, and assesses the collision risks in all three directions of parallel air routes. This model is not only theoretically easy to understand but also has strong practical application capabilities when combined with data, and is widely used in assessing the collision risks of aircraft in various operational scenarios, including air routes [24] and terminal areas [25]. Based on the aforementioned model, a summary of the research on aircraft collision risk can be obtained, as presented in Table 1.

1.3. Contribution of This Work

Specifically for the research subject of intersecting air routes, current studies mainly focus on analyzing the route configuration of intersecting airways. They assess collision risks by examining the impact of aircraft position errors on the distance between aircraft. This method is widely recognized, but it usually emphasizes the derivation of theoretical models and formulas, neglecting the influence of controllers and pilot operations in actual flight on safe separation.
Therefore, this article adopts a comprehensive approach, starting from the configuration of air routes. By analyzing the interaction process between pilots and air traffic controllers during human-operated adjustment, we introduce the distance loss caused by human operations, and then assess the collision risk for aircraft on intersecting air routes:
(1)
First, we integrate real-time data from the flight process and use the positional error method to analyze the operational characteristics of the aircraft, incorporating these characteristics as key parameters into subsequent simulations;
(2)
Next, we analyze the characteristics of controller thinking and reaction, communication, pilot response, and aircraft maneuvering behavior during human-operated adjustment scenarios in air route operations, to understand the time required for the entire human-operated adjustment process;
(3)
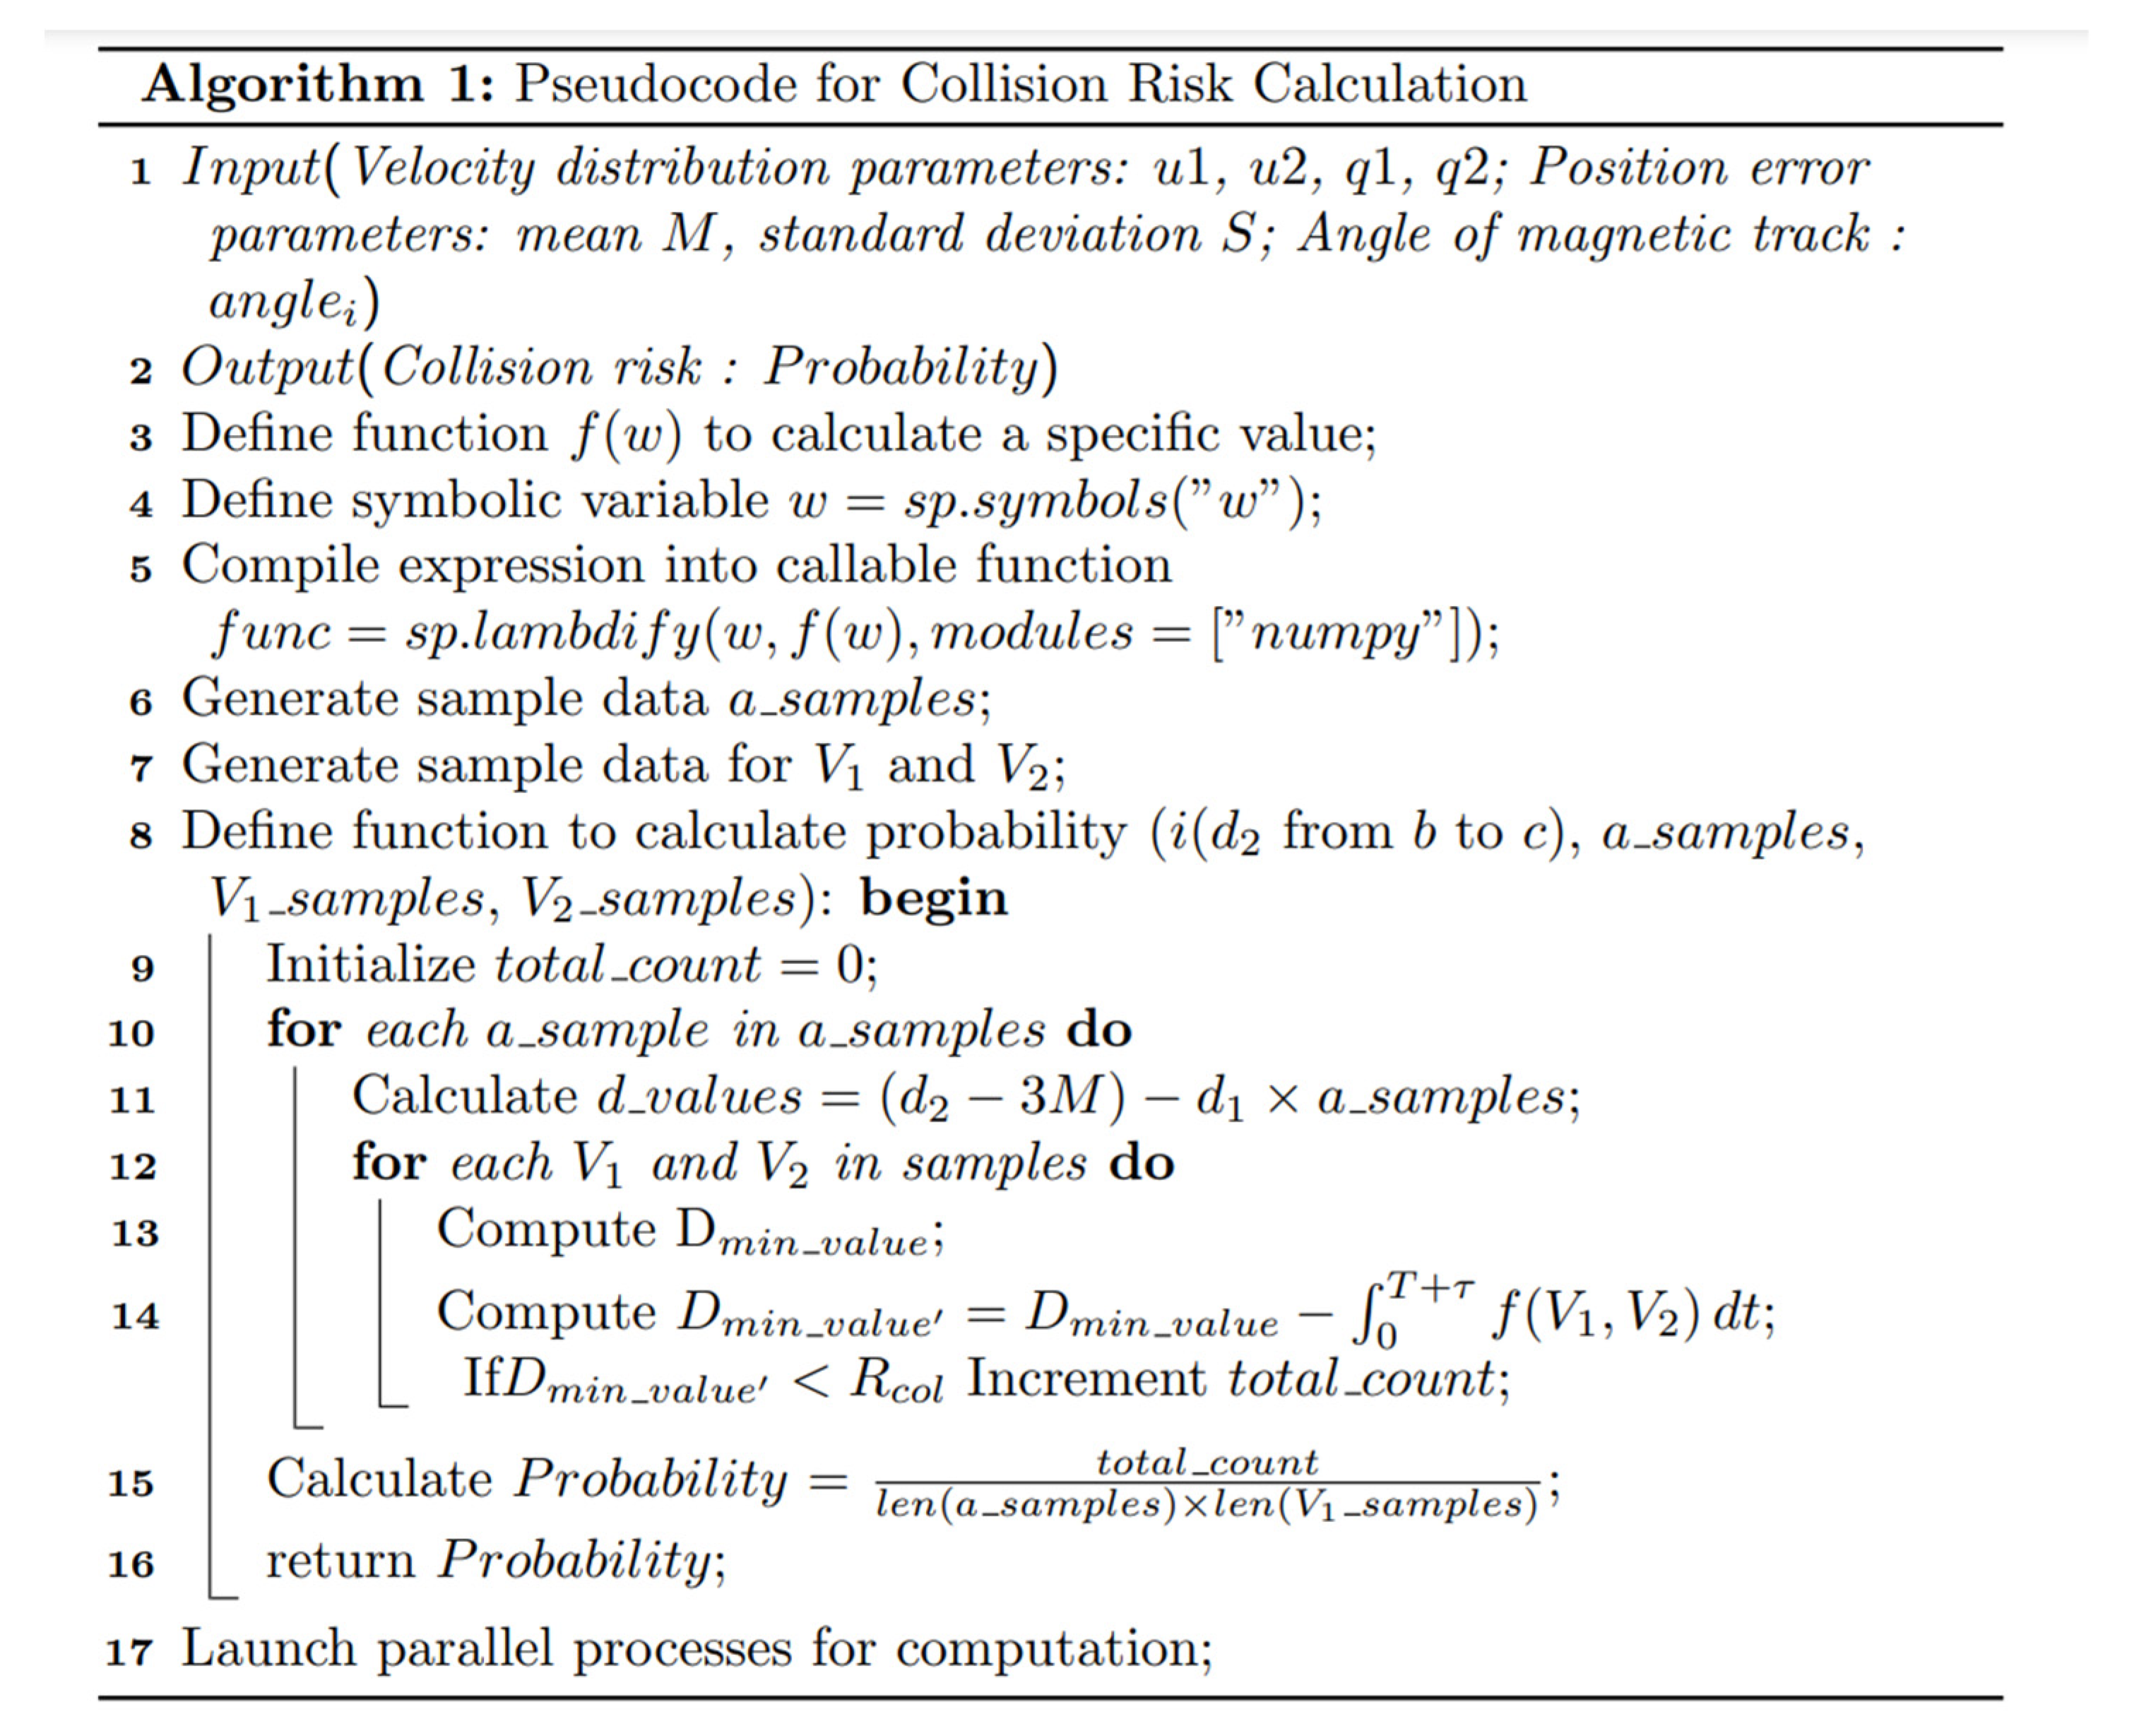
Finally, we use the Monte Carlo method to simulate collision risks under different parameters for real air route configurations and provide corresponding safe separation.
The rest of this paper is organized as follows. Section 2 introduces the definition and calculation process for the distance distribution between the trailing aircraft and the leading aircraft when the latter is at the intersection and fits the position and speed distributions of the aircraft separately. In Section 3, by studying the operations of controllers and pilots during the human-operated adjustment process, we summarize their operational characteristics and the time required for these operations. These data are then used to calculate their impact on the distance between aircraft, in order to establish a collision risk assessment model for aircraft on intersecting air routes. In Section 4, Monte Carlo simulations are utilized to calculate collision risks for different positions of the trailing aircraft in relation to the intersection, assuming a fixed distance of 10 km from the leading aircraft to the intersection point. The findings are numerically compared to the TLS, leading to the determination of different safe separations for the trailing aircraft at the intersection based on various magnetic courses, speed distributions, and other factors. In Section 5, a synthesis of results, suggestions and potential future works is outlined.

2. Distribution of the Distance between the Trailing Aircraft and the Leading Aircraft When the Latter Is Positioned at the Intersection

Through derivation, we determined the initial relative positions of the two aircraft in actual operational scenarios, with their motion process illustrated in Figure 1. Where θ i represents the magnetic course for route i , Nm indicates the direction pointing to magnetic north, and d 1 , d 2 denote the distances of aircraft 1 and aircraft 2 from the intersection at the start moment, respectively. The objective of this simulation is to assess the collision risk of Aircraft 1 from the intersection at position d 1 when Aircraft 2 is at a different position d 2 from the intersection, thereby determining a safe separation between Aircraft 2 and the intersection under these conditions. In this analysis, we consider a scenario where Aircraft 1 arrives first at the intersection via Route 3, with a parallel methodology employed for Aircraft 2. For situations where positional error is not factored in, the distance of the trailing aircraft from the intersection, concurrent with the leading aircraft’s presence at the intersection, is calculated using the formula d 0 = d 2 V 2 d 1 V 1 .
Upon conducting a detailed analysis of the aircraft positional errors both along and perpendicular to the flight path, we derived Equation (1), which is instrumental in calculating the distance between the two aircraft in these respective directions:
{ d 0 = d 2 V 2 d 1 V 1 + ε x ε y = ε y 2 ε x 1 sin θ ε y 1 cos θ
In the formula, θ = | θ 3 θ 2 | indicates that the angle of the two aircraft’s routes when they are heading to the intersection, d 0 is the distance along the trajectory of the trailing aircraft from the intersection when the front aircraft is at the intersection considering the position error; ε x , ε y is the total position error along the direction of d 0 and across the direction of d0 when the leading aircraft is at the intersection, of which ε x = ε x 2 ε x 1 cos θ + ε y 1 sin θ ; V 1 , V 2 is the speed of the two aircraft, ε x 1 , ε x 2 is the along-trajectory error of the two aircraft, and ε y 1 , ε y 2 is the across-trajectory error of the two aircraft.
Consequently, the distance between the trailing aircraft and the leading aircraft, when the latter is positioned at the intersection, is calculated as follows:
d 2 = d 0 2 + ε y 2 = ( d 2 d 1 V 2 V 1 + ε x ) 2 + ε y 2

2.1. Distribution of Positional Errors

Position error primarily signifies the degree of deviation of an aircraft from its intended flight path. It can be categorized into errors along the trajectory and errors across the trajectory in the horizontal plane. To streamline the analysis, we assume these errors are uniform and focus on calculating errors across the trajectory. In this study, we examine flight data of aircraft at an altitude of 8900 m in the LLC intersection airspace near Changsha. To facilitate analysis, latitude and longitude data are converted into plane coordinates using the Lambert projection method, as illustrated in Figure 2. Subsequently, the coordinate points are sorted based on their density values. To focus on the most relevant trajectory data, the top 95% of points by density value are selected. This step eliminates data points that significantly deviate from the intended routes, ensuring that our analysis is concentrated on high-density trajectory data. The density maps resulting from this screening process are shown in Figure 3.
The filtered data undergo further processing to determine the deviation distance of each waypoint from the intended route. In analyzing the route configuration, it can be observed that multiple routes converge at the intersecting points. For the purpose of this paper, we focus on analyzing the characteristics of eastward-bound flights at an altitude of 8900 m to delineate these routes. Routes leading up to the intersection are collectively termed as ‘inflow routes’, while the singular route beyond the intersection point is referred to as the ‘converging route’.
First, each reporting point on the converging route is fitted as shown in Figure 4, and the distance from each waypoint to the fitted route can be calculated directly. The inflow routes involve multiple classes of flight trajectories; in order to better distinguish them, the azimuth of the data points into the intersection is selected as the criterion for clustering. K-means clustering is employed to organize the data points into distinct groups, subsequently named Cluster1 and Cluster2, as depicted in Figure 5. Notably, Cluster2 comprises two inflow routes that are grouped into a single category. This classification is due to both routes converging at the PUKAD reporting point, which is located just before the LLC intersection, and following the same path towards the intersection. By categorizing the data points in this manner, we can precisely calculate the deviation distance for each track point along the respective inflow routes.
Given the direct acquisition of ADS-B data, aircraft operations can be influenced by various factors, like weather changes or conflicts at air intersections, potentially leading to bypassing or skipping of designated reporting points. To more accurately estimate trajectory errors arising from such scenarios, we employed an enumeration method. This approach involves estimating the traversing trajectory error by considering the proportion of various special cases (denoted as α ). The detailed findings of this analysis are presented in Table 2.
After obtaining the probability density function of the traversing trajectory fit, and further analyzing the effect of the errors of the two aircraft along the trajectory as well as the errors of crossing the trajectory on the distance, we can obtain the total position error along the direction of d 0 and across the direction of d 0 when the leading aircraft is at the intersection, { ε x = ε x 2 ε x 1 cos θ + ε y 1 sin θ ~ N ( μ x ( 1 cos θ ) + sin θ μ y , σ x 2 ( 1 + cos 2 θ ) + sin 2 θ σ y 2 ) ε y = ε y 2 ε x 1 sin θ ε y 1 cos θ ~ N ( μ y ( 1 cos θ ) sin θ μ x , σ y 2 ( 1 + cos 2 θ ) + sin 2 θ σ x 2 ) . Then, from μ x = μ y = μ , σ x = σ y = σ , through further derivation, we can obtain the probability density function of the total positional error, both along the trajectory direction and perpendicular to the trajectory. The detailed derivation process is as follows:
{ f ( ε x ) = 1 2 σ 2 2 π exp ( ε x 2 4 σ x 2 ) f ( ε y ) = 1 2 σ 2 2 π exp ( ε y 2 4 σ y 2 )
Among others, ε x ~ N ( ( 1 cos θ + sin θ ) μ , 2 σ 2 ) , ε y ~ N ( ( 1 cos θ sin θ ) μ , 2 σ 2 ) .

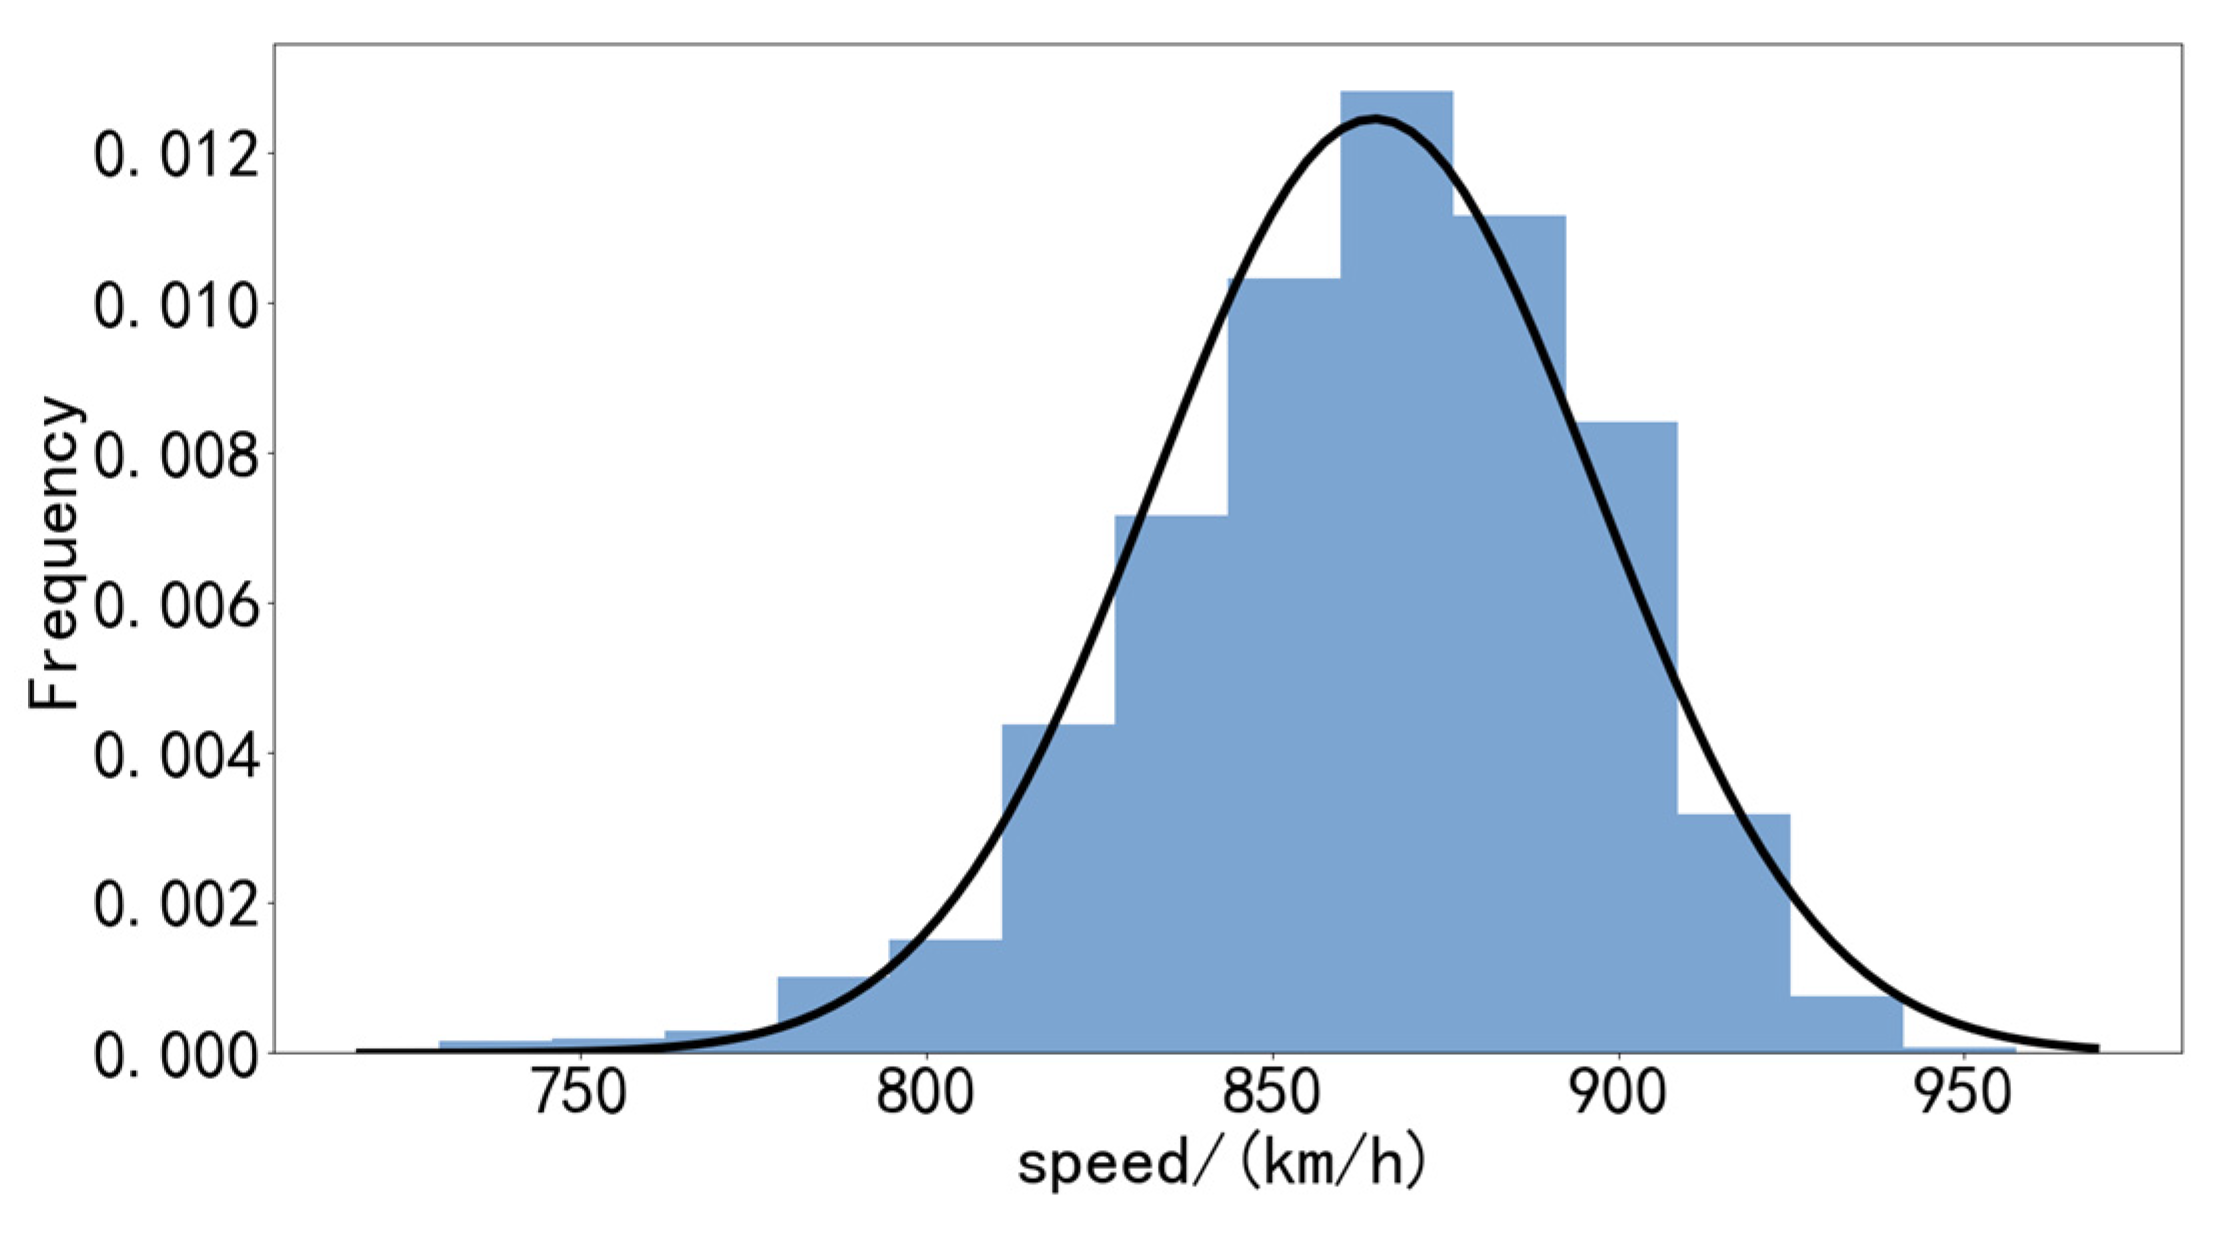
2.2. Distribution of Speeds

To establish the distribution function of d , it is necessary to simplify the existing parameters in Equation (2) by deriving their position errors along the trajectory as well as across the trajectory, respectively, ( d 2 ) ε x = 2 ( d 2 d 1 V 2 V 1 ) + 2 ε x ; ( d 2 ) ε y = 2 ε y . Consider the worst case for simplification, i.e., the case where d takes the smallest value, by the 3σ criterion, at which ε x = ( 1 cos θ + sin θ ) μ 3 2 σ , ε y = 0 . Then, the probability density function, representing the distance of the trailing aircraft from the intersection at the moment the leading aircraft is positioned at the intersection, is expressed as follows:
f ( d ) = ( d 2 + ( 1 cos θ + sin θ ) μ 3 2 σ ) d 1 f ( V 2 V 1 )
Equation (4) reveals that the primary variable parameters of the function are the initial distances of each aircraft from the intersection ( d 1 , d 2 ) and the distribution function followed by f ( V 2 V 1 ) , with a subsequent discussion on speed. This paper includes an analysis of aircraft speeds at the 8900 m altitude level at the LLC intersection, the results of which are shown in Figure 6:
The outcomes of the parameter fitting indicate that the aircraft speeds conform to a normal distribution, denoted as N ( 864.78 , 32.02 2 ) . During operations at the intersection, the speeds of the two aircraft are uncorrelated; each aircraft’s speed is determined by its individual operational parameters, flight plan, and prevailing environmental conditions. Consequently, the velocities of the aircraft at the intersection are independent. While air traffic controllers may instruct aircraft at the intersection to adjust their speed or heading to maintain safe separation, such interventions do not alter this fundamental independence.
Subsequently, when the speed distribution obeys the normal distribution, i.e., V 1 ~ N ( μ 1 , σ 1 2 ) , V 2 ~ N ( μ 2 , σ 2 2 ) , we reference the derivation by scholar Hinkley, D.V. [30]:
f ( w ) = f ( V 2 V 1 ) = ( μ 1 w σ 1 2 + μ 2 σ 2 2 ) exp { ( μ 1 w σ 1 2 + μ 2 σ 2 2 ) 2 ( μ 1 2 σ 1 2 + μ 2 2 σ 2 2 ) ( w 2 σ 1 2 + 1 σ 2 2 ) 2 ( w 2 σ 1 2 + 1 σ 2 2 ) } 2 π σ 1 σ 2 ( w 2 σ 1 2 + 1 σ 2 2 ) 3 / 2 [ ϕ ( ( μ 1 w σ 1 2 + μ 2 σ 2 2 ) ( w 2 σ 1 2 + 1 σ 2 2 ) 1 / 2 ) ϕ ( ( μ 1 w σ 1 2 + μ 2 σ 2 2 ) ( w 2 σ 1 2 + 1 σ 2 2 ) 1 / 2 ) ] + 1 π σ 1 σ 2 ( w 2 σ 1 2 + 1 σ 2 2 ) exp [ μ 1 2 σ 1 2 + μ 2 2 σ 2 2 2 ]
Incorporating this into Equation (4) results in the distribution of the distance between the trailing aircraft and the leading aircraft when the latter is positioned at the intersection. This parameter serves as a predefined scenario for Monte Carlo simulation, representing the distance of the trailing aircraft from the intersection at the moment the leading aircraft reaches it. The forthcoming simulation analyses will be conducted under this specific scenario.

3. Collision Risk Model

Ensuring flight safety remains a top priority for contemporary air transportation. To meet this urgent need, we developed a collision risk assessment model for evaluating aircraft in intersecting air routes. The model improves on the traditional position error model by taking into account the potential position and velocity errors during aircraft operation, while introducing the influence of the human-operated adjustment process during actual flight. The human-operated adjustment process refers to the whole process of artificially maneuvering an aircraft out of danger when two aircraft are at a minimum distance, including: controller thinking and reaction, communication, pilot reaction, and aircraft maneuvering. By statistically analyzing the time required for each behavior and quantifying it as a distance loss, we integrated this information into the intersecting air routes collision risk assessment model. This makes the assessment model more consistent with what happens to aircraft in real operational scenarios. The core objective of this collision risk model was to accurately calculate the minimum separation necessary to meet ICAO safety standards, which is safe separation. By determining the required safe separation for aircraft in different scenarios, authorities are able to more effectively ensure the safety of air flights and implement effective traffic allocation. Strong support is provided to air traffic management to ensure that the air transportation system maintains a high level of safety and reliability in all situations.

3.1. Human-Operated Adjustment

Air traffic controllers will intervene when two aircraft are too close to each other and communicate with the pilots to issue instructions to avoid collisions. This intervention, while necessary, can lead to a temporary reduction in distance between the aircraft, thereby elevating the risk of collision. Consequently, analyzing the duration of the human-operated adjustment process is crucial for operational safety. This process hinges on the controller issuing directives and the pilot maneuvering the aircraft to safely navigate away from potential danger. To dissect this process more thoroughly, this paper categorizes the process into four key phases: controller thinking and reaction time ( τ 1 ), communication time ( τ 2 ), pilot reaction time ( τ 3 ), and aircraft maneuvering time ( τ 4 ). Therefore, the whole process of human-operated adjustment can be expressed in the following equation:
τ = τ 1 + τ 2 + τ 3 + τ 4
where τ encompasses the entire sequence from the controller’s initial detection of the minimum distance to the pilot’s final maneuver to resolve it.
(1) Controller thinking reaction time is when the controller notices insufficient separation between two aircraft from the radar screen and needs to assess the situation that the aircraft is in to formulate a solution and give instructions. This phase requires the controller to have the ability to make quick decisions and respond to emergencies; (2) Communication time is the duration needed for the controller to transmit the formulated solution to the pilot. It encapsulates the entire process of conveying instructions clearly and promptly; (3) Pilot reaction time covers the time it takes for pilots to promptly respond upon receiving instructions. It includes comprehending the instruction’s content and undertaking the necessary maneuvers to ensure the aircraft follows the directive and avoids collision; and (4) Aircraft maneuvering time is the time taken by the aircraft to execute the instruction and alter its flight path following the pilot’s action. This phase is contingent upon the aircraft’s performance capabilities and the extent of the required maneuver.
By aggregating the durations of these four phases, we can accurately determine the total time involved in the human-operated adjustment process. This temporal assessment is vital for enhancing flight safety, as it aids in pinpointing potential risk elements. Additionally, it serves as a key tool in refining the training of controllers and pilots, and in streamlining communication and coordination procedures, among other benefits.

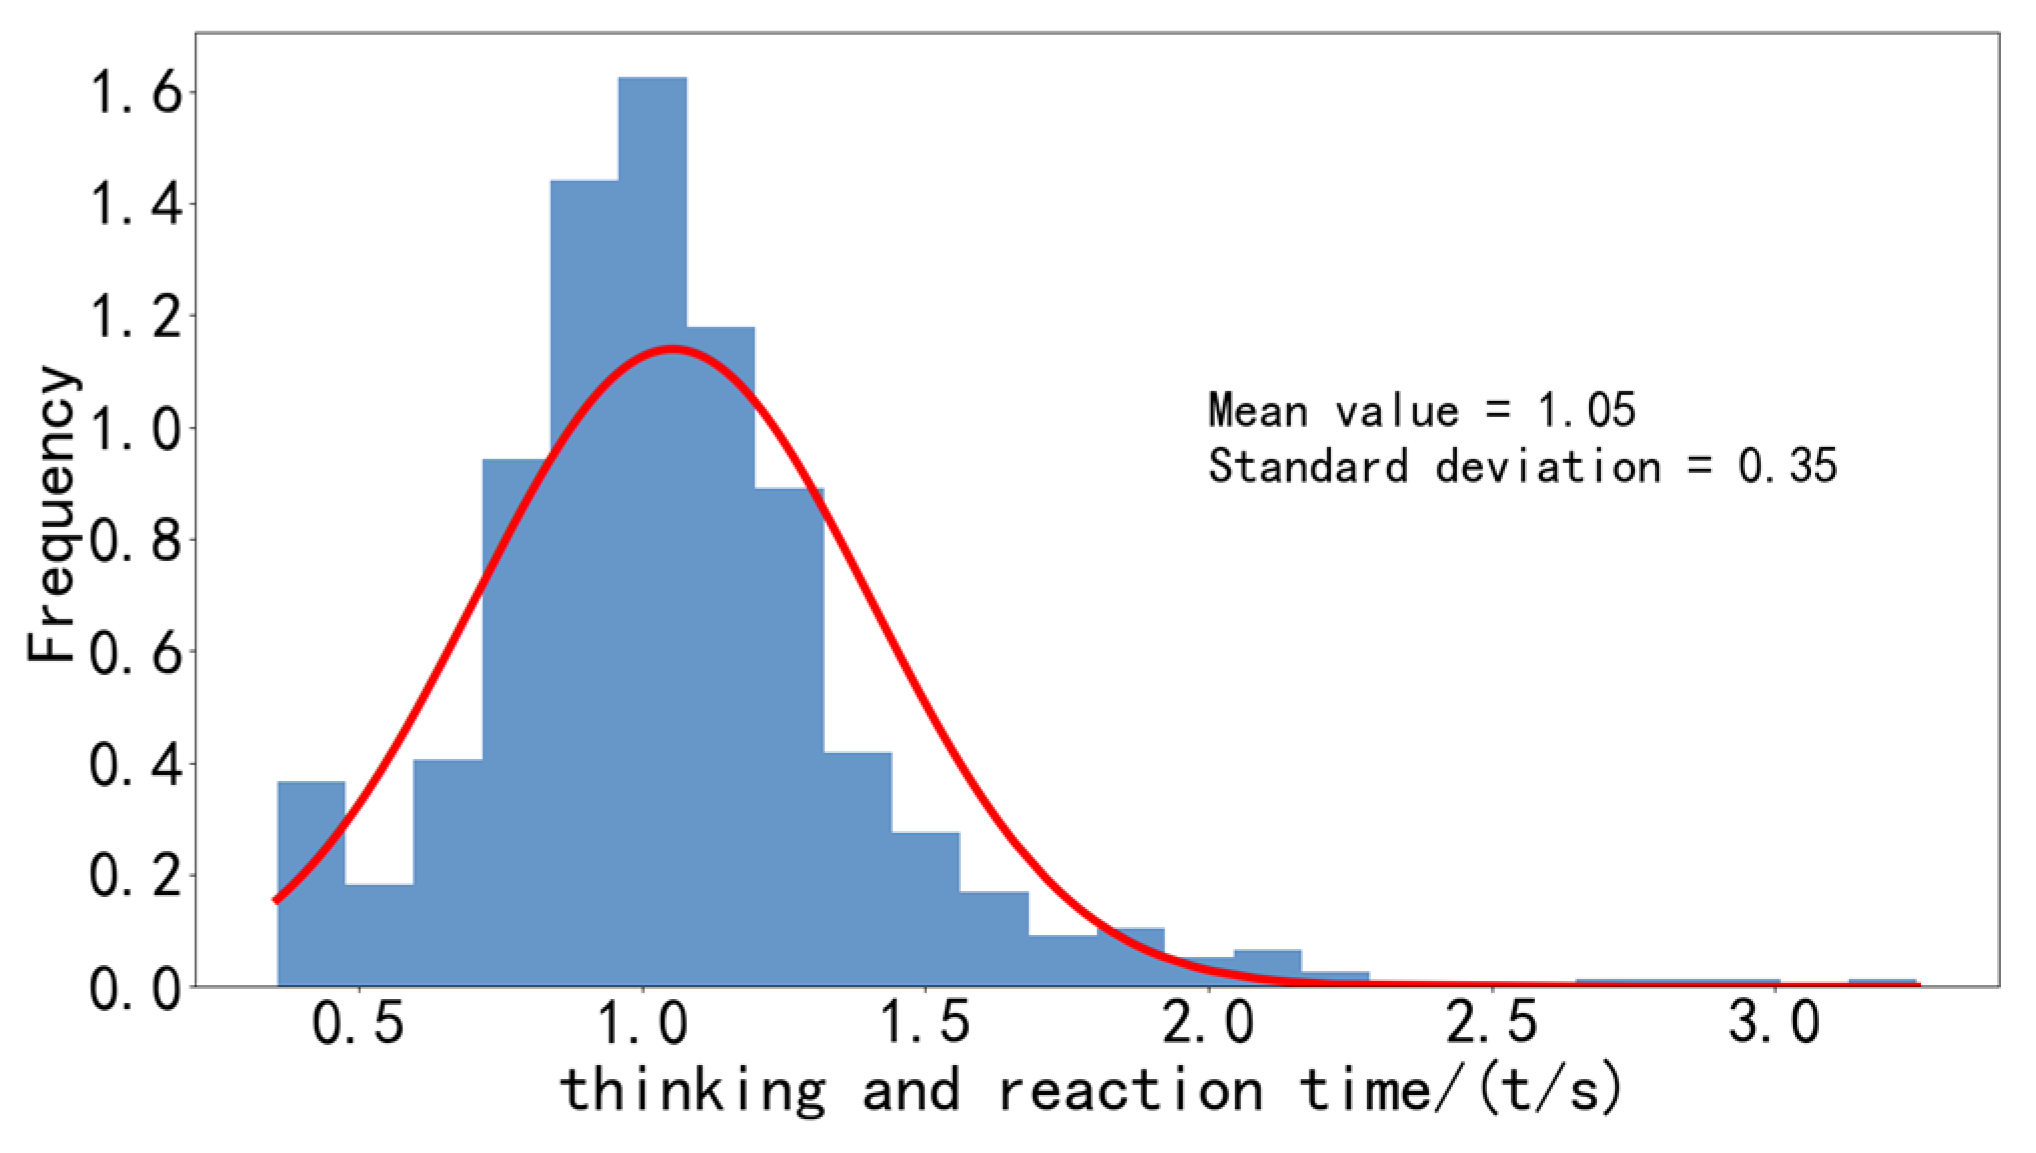
3.1.1. Controller Thinking and Reaction Time

Field research was conducted at the air traffic control unit, utilizing real-time voice data files from its professional voice recording system for analysis. The data, consisting of fragmented conversations in ground-air communication, were amalgamated with vocal characteristics to examine the thinking and reaction times using a waveform graph. During these thinking and reaction processes, the audio amplitude on this waveform graph typically hovers around the 0 mark, which falls within the range delineated by the two dotted lines, as shown in Figure 7.
After determining the thinking time, the speech data was subjected to a deeper analysis, focusing primarily on its dialogue structure. This involved converting the speech data into text, revealing two predominant conversation modes: (1) The crew initiates dialogue, typically pre-takeoff, seeking controller instructions for takeoff, inquiring about airport weather conditions, or confirming controller directives, with the conversation concluding after the controller’s response; and (2) The controller directly issues instructions, which the crew receives and acknowledges. Given the distinct features of the speech data, we chose to focus our research specifically on the first conversation method. The controller’s thinking and reaction time (τ1) was deduced by isolating the duration from when the crew ends the conversation using the aircraft call sign to the moment the controller begins their response. The time data were then plotted and analyzed using histograms, as depicted in Figure 8. The results indicate that most controllers’ thinking and reaction times cluster between 0.8–1.5 s, with instances exceeding 2.5 s being rare. These longer durations typically occur during English conversations, highlighting a comparative weakness in controllers’ responses to English and suggesting a need for enhanced language training. Adhering to the 3σ criterion of normal distribution, this study considers 2.1 s as the average value for the controllers’ thinking and reaction times.

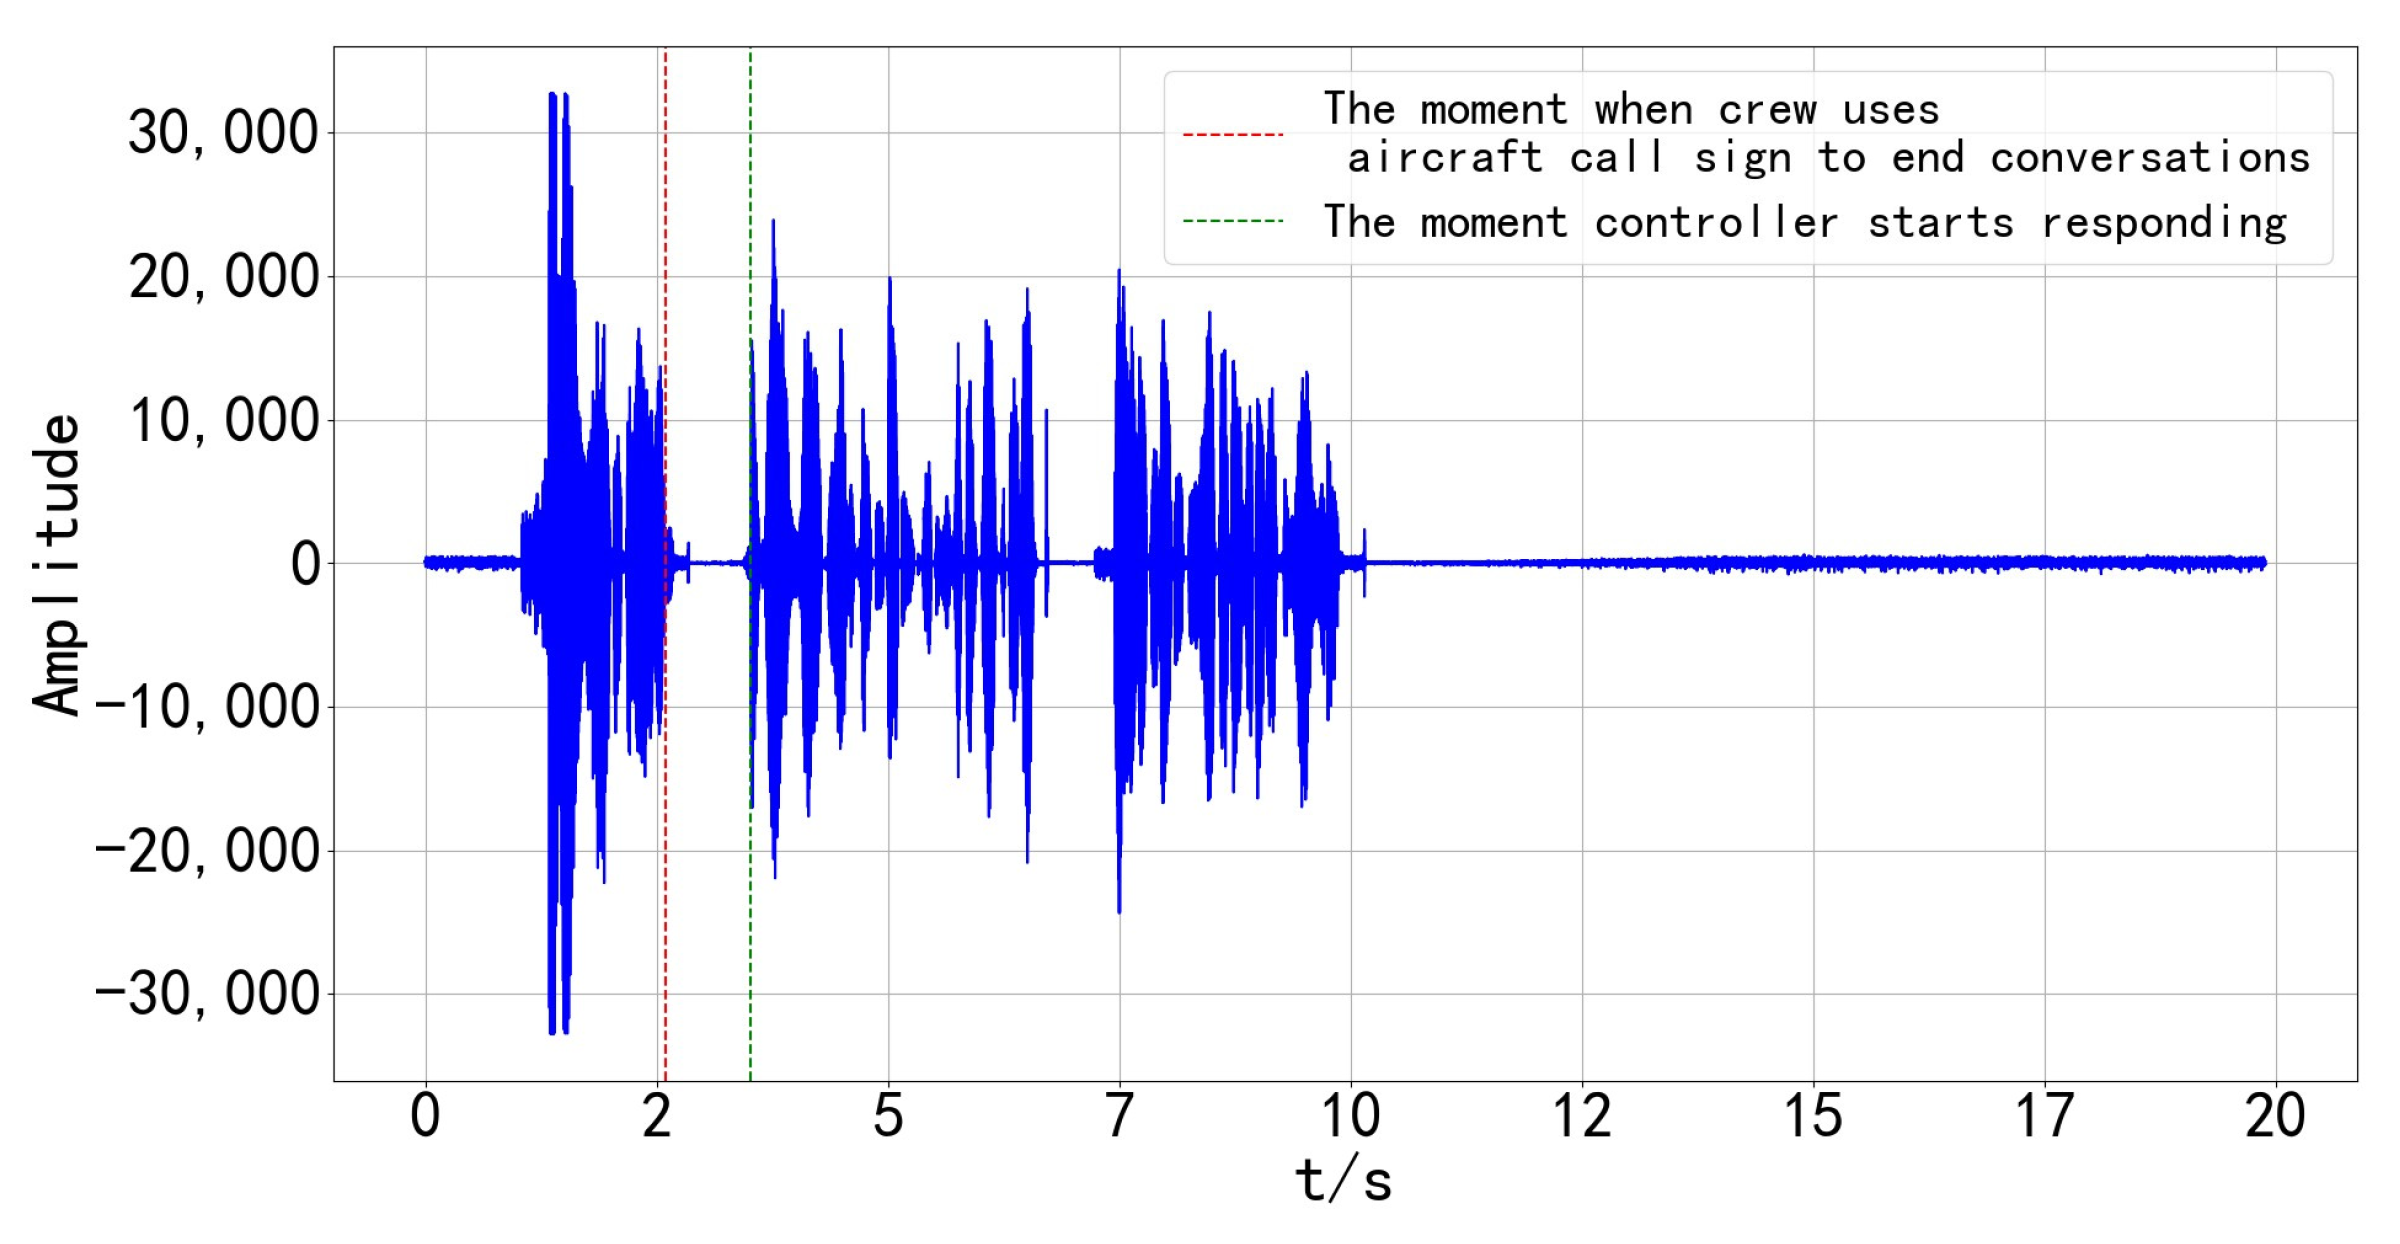
3.1.2. Communication Time

Due to the lack of specific voice data regarding the process of human-operated adjustment in flight, this study analyzed ground-to-air communications in accordance with standard procedures implemented during conflict resolution events. There are two primary strategies for resolving conflicts along flight paths: (1) establishing vertical separation, where the controller instructs the conflicting aircraft to rapidly adjust its altitude; and (2) establishing horizontal separation, which involves two approaches depending on the aircraft’s proximity to the intersection point. If both aircraft are still distant from the intersection, they are directed to turn outward from their current headings for avoidance. However, if one aircraft is near the projected intersection point, the latter turns to the forward aft side of the aircraft to turn to a larger heading for avoidance, which is the scenario described in this paper.
Effective conflict resolution instructions should be both succinct and potent, typically comprising four key elements: the aircraft’s call sign, a clear reason, specific heading, and altitude instructions, often augmented with the control term ‘immediately’ to emphasize urgency. Following these guidelines, we crafted 100 distinct conflict resolution directives and distributed them randomly among five controller subjects. Each controller was tasked with handling 40 instructions, presented one at a time during the simulation. We meticulously recorded the duration of simulated voice calls for each instruction executed by the test controllers. A statistical analysis of the data from these five subjects revealed that the average call duration for a single instruction amounted to 4.542 s. Therefore, this duration is deemed to be indicative of the typical communication time ( τ 2 ) that controllers spend in human-operated adjustment scenarios.

3.1.3. Pilot Reaction Time and Aircraft Maneuvering Time

After a controller issues a decision, it is important to factor in the time required for the pilot to act on that decision. Firstly, a pilot’s reaction time is approximately 12.6 s [31], encompassing the duration to receive the controller’s instructions, process the information, and decide on a course of action. Additionally, the time needed for the aircraft to actually modify its flight path is around 2 s [32]. This interval includes the maneuvering time from when the aircraft starts to execute the command to change its flight path.
Hence, the total time required to complete the human-operated adjustment process is represented by Equation (6).

3.2. Collision Risk Model Considering Human Factors

After knowing the probability density distribution of the distance between the leading aircraft and the trailing aircraft when it is located at the intersection function f ( d ) , combined with the movement process of the two aircraft at the intersection, the kinematic equation describing the distance between the two aircraft over time can be established as follows:
D 2 = [ V 1 t + ( d V 2 t ) cos φ ] 2 + [ ( d V 2 t ) sin φ ] 2
In the formula, φ the angle of projection of the trailing aircraft on its trajectory when the front aircraft departs from the intersection angle, take the structure of the LLC intersection route as an example, φ = | ( π + θ 1 ) - θ 2 | , D denotes the distance between the two aircraft under the change of time, and the minimum distance between the two aircraft D min is calculated by the formula as follows:
D min = | d V 1 sin φ | Δ V
where Δ V = V 1 2 + V 2 2 2 V 1 V 2 cos φ denotes the relative velocity between the two aircraft. Throughout the human-operated adjustment phase, the ongoing convergence of the aircraft results in a progressively decreasing distance between them:
D min = D min 0 T + τ f ( V 1 , V 2 ) d t
where f ( V 1 , V 2 ) = V 1 2 + V 2 2 2 V 1 V 2 cos φ , T , denotes the frequency of the acquired ADS-B position information update, which takes the value of 1 s.
Then, the horizontal collision probability of two aircraft is calculated by H O P = P ( D min < R c o l ) . Where, R c o l = 2 ( R x 2 ) 2 + ( R y 2 ) 2 , denoting the collision boundary; and R x and R y denote the fuselage length and wingspan width of the aircraft dimensions, respectively. These values are determined by calculating a weighted average that takes into account the proportion of each aircraft type present over the intersection, specific parameter values are shown in Table 3.

4. Monte Carlo Simulation

4.1. Introduction to Monte Carlo

The Monte Carlo method, grounded in probabilistic statistics, is a numerical computation technique that addresses uncertainty by generating a series of random numbers. These numbers are then employed to approximate solutions to complex problems. This method, effectively substituting for real scenarios, is extensively used in characterizing and verifying collision risks due to its ability to simulate complex issues. The subsequent section outlines the simulation approach employed in this study:
(1)
Scenario modeling: Initially, the collision issue is transformed into a mathematical model, with the definition of key parameters and variables such as aircraft position, speed, and flight path;
(2)
Random sampling: Reflecting the operational characteristics of aircraft on intersecting routes, numerous random samples representing various operational scenarios are generated. These primarily include variables like the initial aircraft distance and speed alterations;
(3)
Collision simulation: The random samples are then applied to the mathematical model to simulate potential collisions. For each sample, the model calculates the distance between aircraft, determining collision likelihood based on the minimum distance D min and the collision boundary R c o l ;
(4)
Statistical analysis: Results from these simulations are statistically analyzed to ascertain the collision probability. This analysis is further integrated with the TLS, evaluating the risk of collisions on intersecting routes and assessing compliance with required safety standards.
In the simulation process of this paper, once given a starting leading aircraft distance from the intersection position d 1 , the collision probability between two aircraft in a given scenario can be calculated by simulating the trailing aircraft at different distances from the intersection ( d 2 ). First, this paper takes the initial state at d 1 = 10 km to simulate the risk of collision for different positional errors through the pseudo-code shown in Figure 9. Second, for the special scenario of α   =   0.3 , varying values are taken for each magnetic course θ i to investigate the influence of the route angle θ before crossing the intersection point and the projection angle φ after crossing the intersection point on the collision risk, highlighting the significance of route configuration in airspace operation safety. Then, after briefly discussing the parameters of the normal distribution that the speed obeys, the distribution function of the speed is expanded, and its influence on the collision risk is discussed in the light of the function’s characteristics. Finally, the simulation results of collision risk under different human-operated adjustment times are used to discuss the effects of controllers’ and pilots’ reactions as well as aircraft maneuvers on the safe separation of the trailing aircraft from the intersection.

4.2. Monte Carlo: Results and Discussion

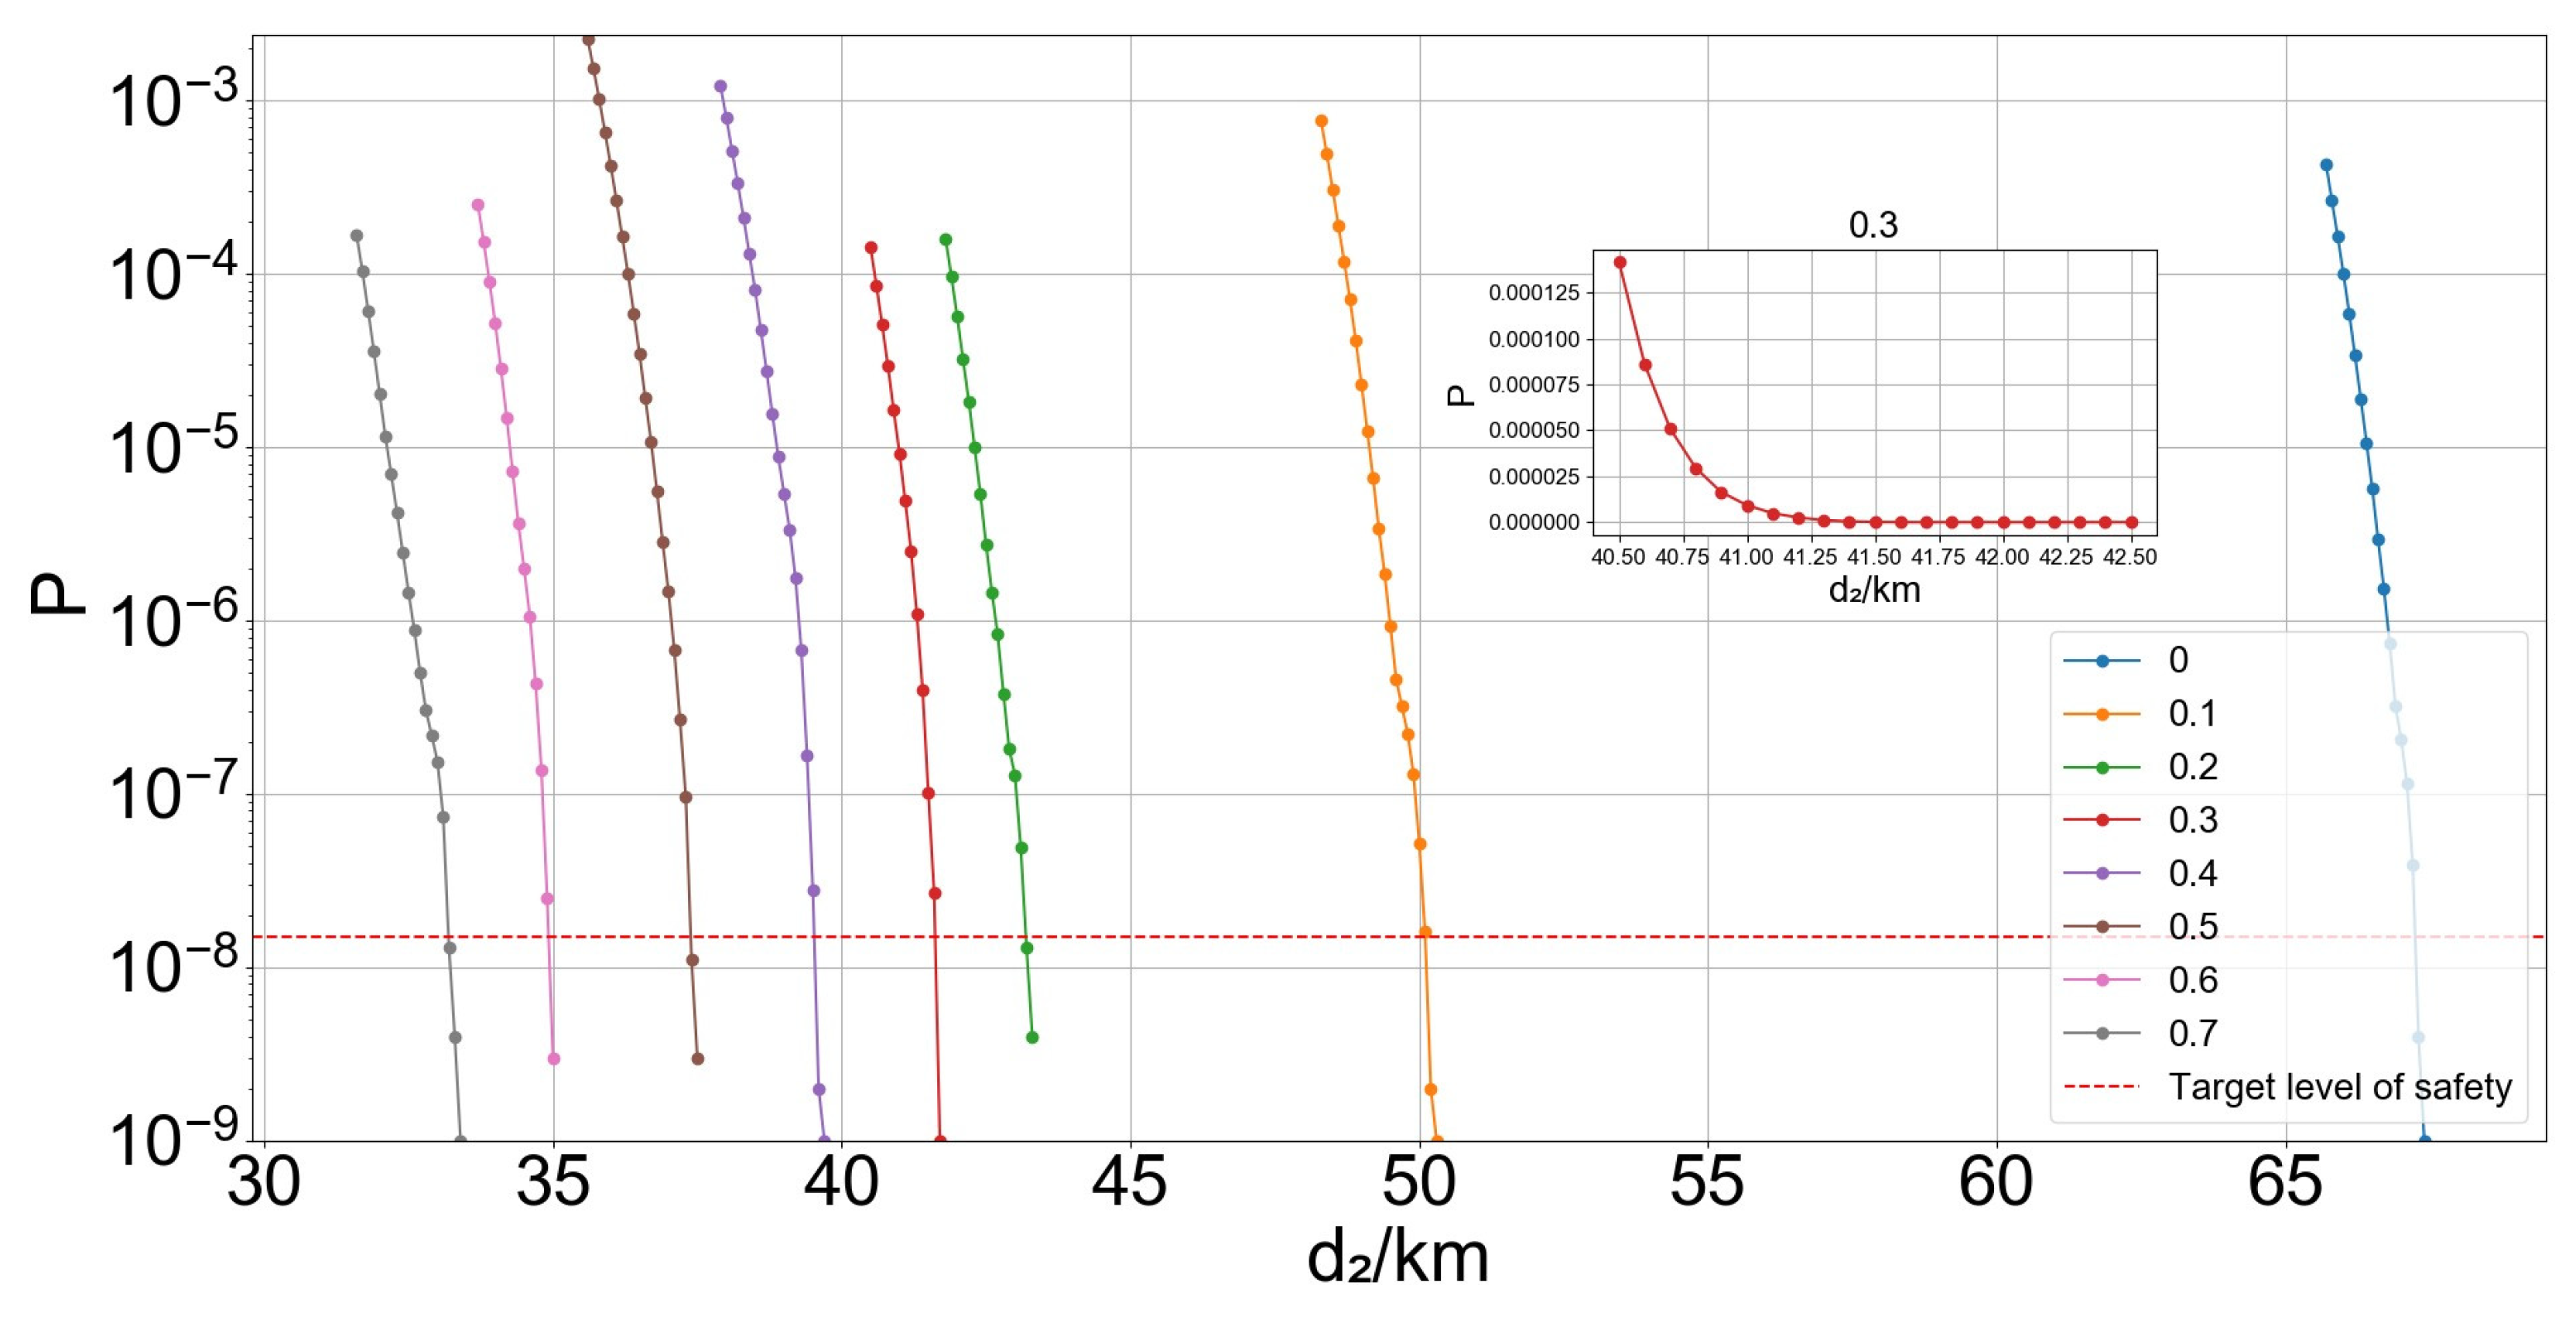
4.2.1. Analysis of Position Error Parameters

When the proportion of special cases α is different, the probability of collision is simulated according to the corresponding normal distribution function obeyed by the position error of the aircraft on the flight path respectively, which can be obtained in Figure 10 The inset graph in the figure initially shows that as the distance d 2 increases, the distance between the two aircraft also increases, leading to a reduced collision risk. Moreover, Monte Carlo simulation results indicate that with a smaller proportion of special case ( α ), the normal distribution parameter value for position error increases. This implies a diminished ability of the aircraft to adhere to the flight path. Based on the TLS established by ICAO in 1995 for mid-air collisions—1.5 × 10⁻⁸ accidents per flight hour [33], the safe separation (D2) between the trailing aircraft and the intersection is greater when the leading aircraft is 10 km away from the intersection for a given TLS, and specific findings are detailed in Table 4. Therefore, the position error of the aircraft is a crucial factor impacting flight safety during operation.

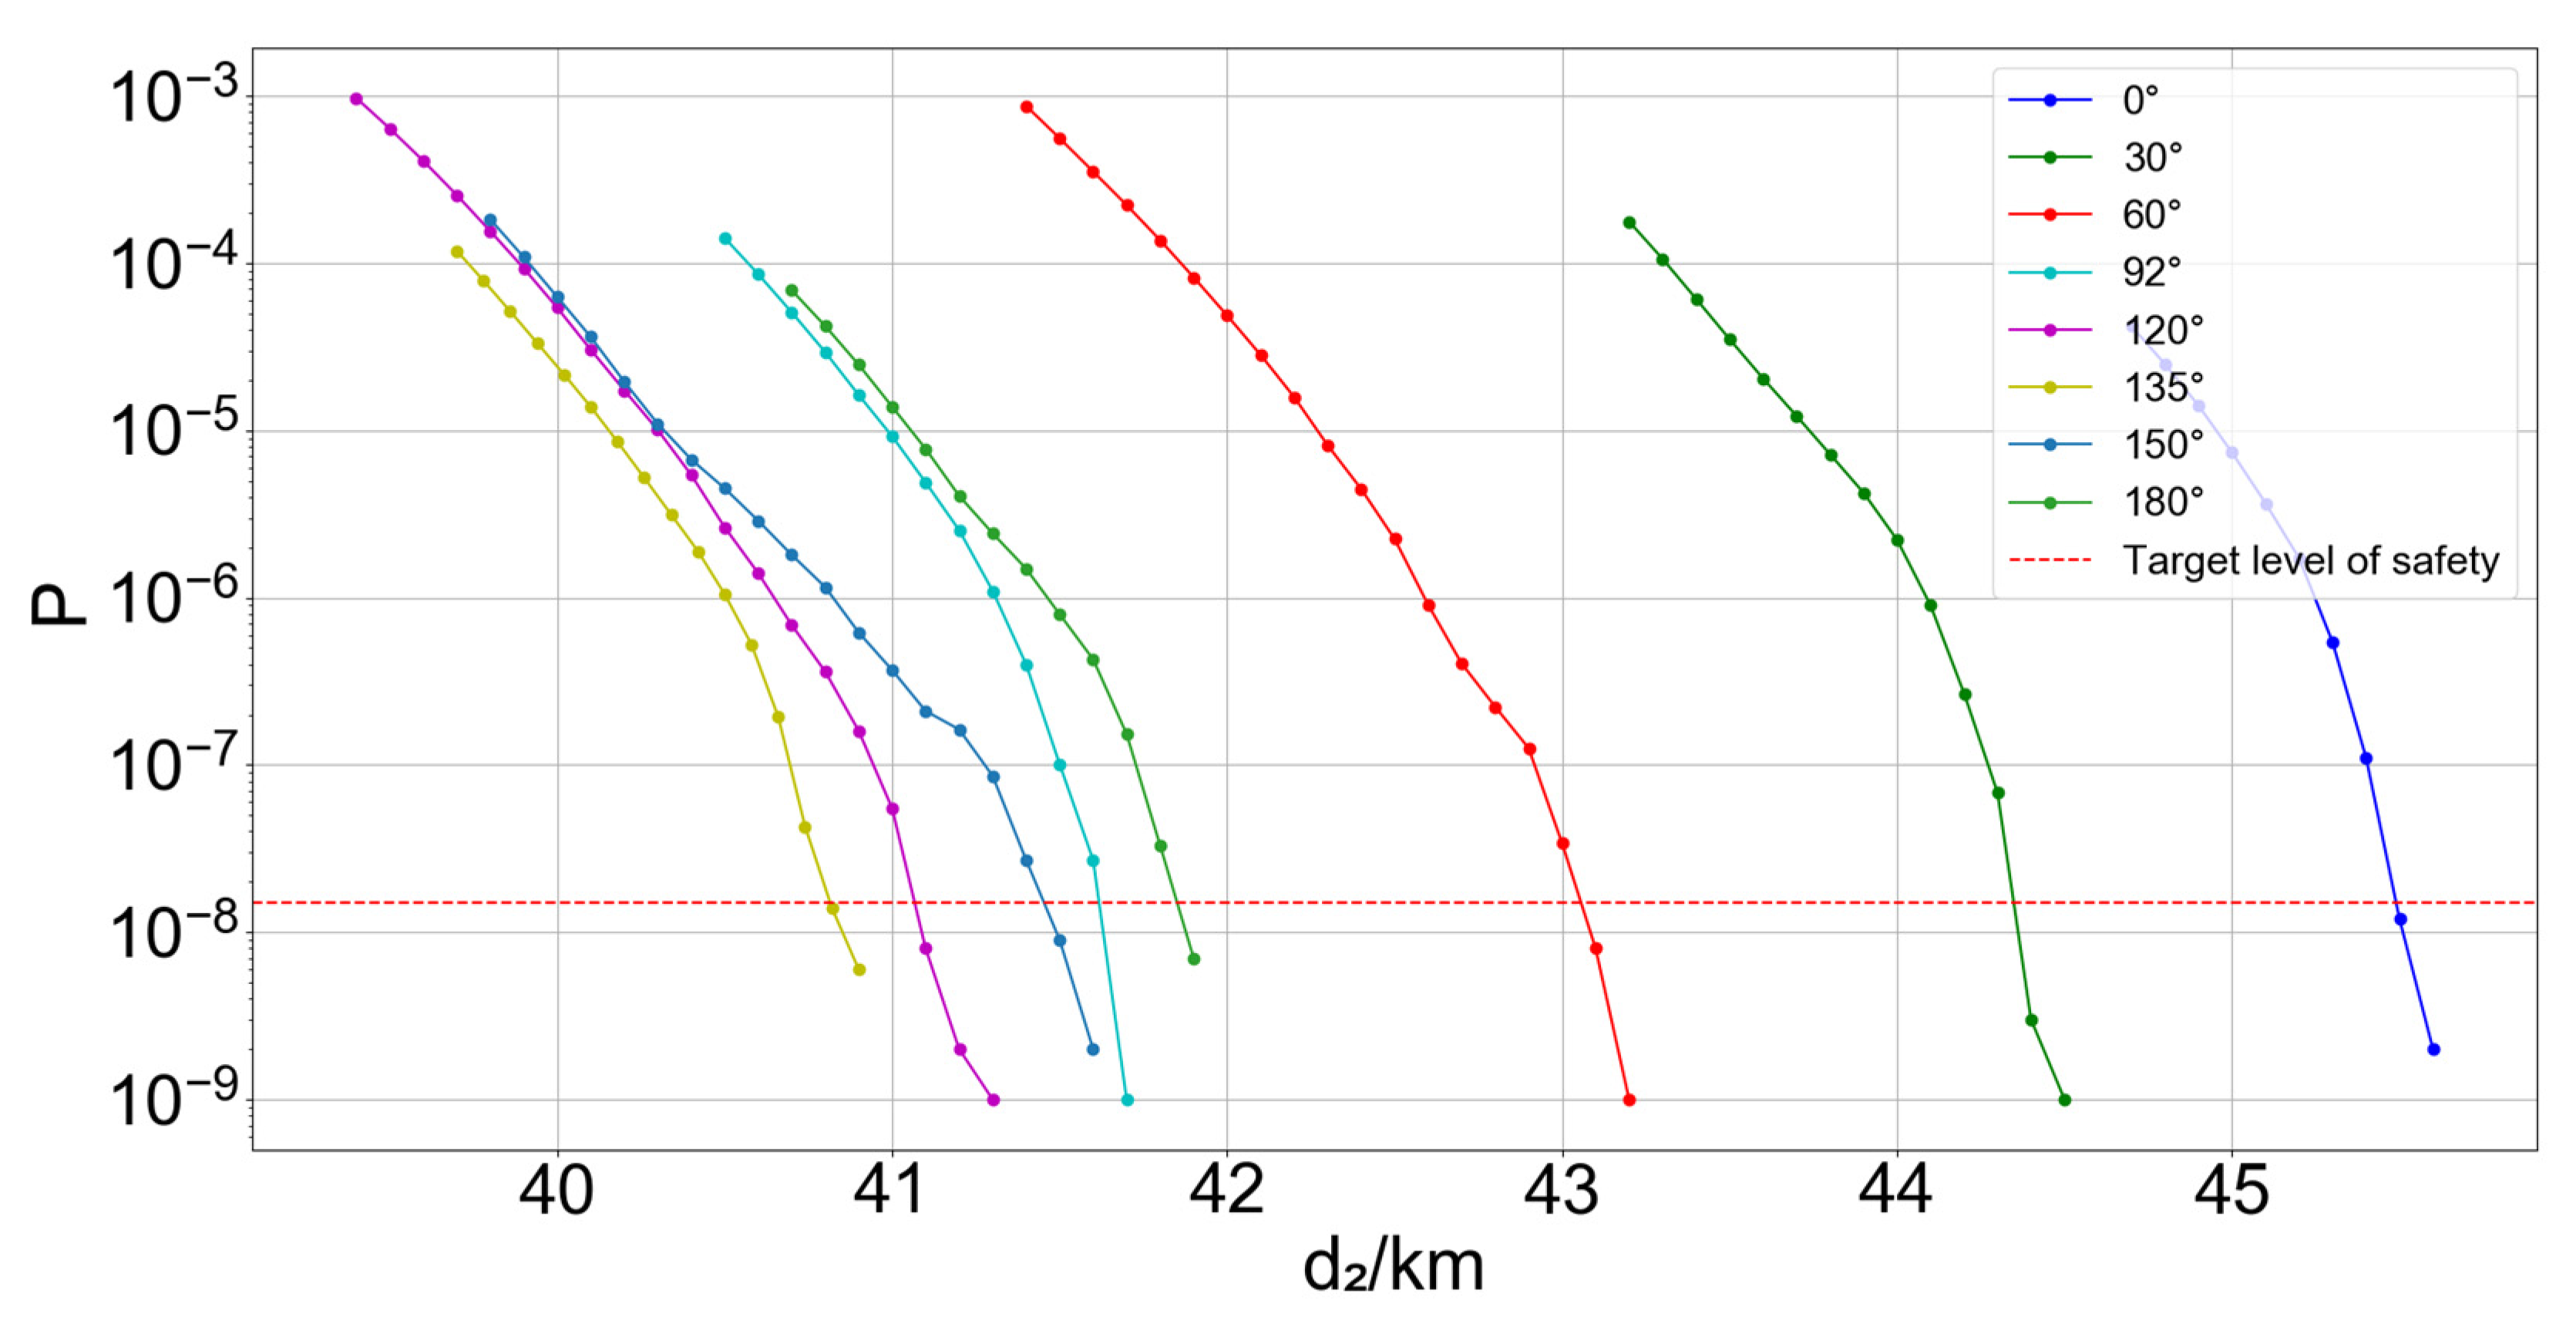
4.2.2. Analysis of Magnetic Courses

In addition to the aircraft’s inherent capability to maintain its route, the configuration of the route itself significantly influences collision risk. This section delves into the impact of two critical angles on operational safety within intersecting routes: (1) the angle between the two aircraft approaching the intersection ( θ ); and (2) the angle of the projection of the trailing aircraft on the trajectory when the leading aircraft departs the intersection ( φ ).
Initially, the aforementioned angle ( θ ) influences the distance ( d ) of the trailing aircraft from the leading aircraft at the moment the leading aircraft reaches the intersection. A derivation of this yields d θ = 2 μ sin ( θ + 45 ) , θ [ 0 , 180 ] , and it is clear that when θ [ 0 , 135 ) , the value of d increases with the increase of the intersection angle θ , for which the risk of collision becomes smaller and smaller, while θ ( 135 , 180 ] the risk of collision increases with an increase in the intersection angle θ .
The latter angle ( φ ) primarily pertains to the minimum distance between the two aircraft as the leading aircraft departs the intersection while the trailing aircraft approaches it. ( D min ) φ = d V 1 [ cos φ ( V 1 2 + V 2 2 ) 2 V 1 V 2 ( cos ( 2 φ ) ) ] ( V 1 2 + V 2 2 2 V 1 V 2 cos φ ) 3 2 + 0 T + τ 2 V 1 V 2 sin φ d t , numerical simulation of the derived results shows that D min gradually increases with an increase in the projection angle, which leads to a gradual decrease in collision risk.
However, the intersection angle θ , projection angle φ and the routes operated by the aircraft in the intersecting flight paths are closely related and are not completely independent and cannot be analyzed separately in a simple way. In the following, we will simulate the impact on the intersection angle θ and projection angle φ by changing any of the magnetic courses θ i , and subsequently assess the associated collision risk.
(1) According to φ = | ( π + θ 1 ) - θ 2 | , θ 1 is mainly related to the projection angle φ , consider θ 1 [ 0 180 ] . When θ 1 = | θ 2 π | = 37 , the projection angle of takes the value of 0, then the leading aircraft moves in the same direction as the trailing aircraft, similar to flying along the trajectory. When θ 1 < 37° or θ 1 > 37°, with the trajectory angle θ 1 far away from 37°, the projection angle gradually increases, and the corresponding collision risk is getting smaller and smaller when the trailing aircraft is at the same distance from the intersection, as shown in Figure 11 below. That is, when the leading aircraft is 10 km away from the intersection, the safe separation of the trailing aircraft from the intersection also decreases gradually, and the specific results are shown in Table 5.
(2) θ 3 is only related to the angle between the two aircraft approaching the intersection θ , θ = | θ 3 θ 2 | , the value of θ 3 will be simulated from the beginning of the simulation equal to θ 2 , that is, θ is gradually increased from 0, which can be obtained in the following Figure 12. The clip angle θ is gradually increased along with the magnetic course θ 3 , and the risk of collision is firstly reduced and then increased, which is in line with the analysis in the previous section, and the safe separation is changed accordingly, and the specific results can be seen in Table 6.
(3) θ 2 is related to both angles, the simulation of θ 2 [ 180 , 360 ] is performed, and the specific results of the corresponding safe separation of the trailing aircraft are shown in Table 7.
The findings in Table 7 reveal that on intersecting routes, the risk of collision increases when both the angle between the two flight paths and the projection angle are smaller. Specifically, when the leading aircraft is 10 km from the intersection, the trailing aircraft requires the largest safe separation from the intersection point. This indicates a higher collision risk under certain flight path configurations. Consequently, it is crucial to rigorously monitor the real-time trajectories of aircraft, both prior to and after crossing the intersection, to enhance the safety margin during the operation of these routes.

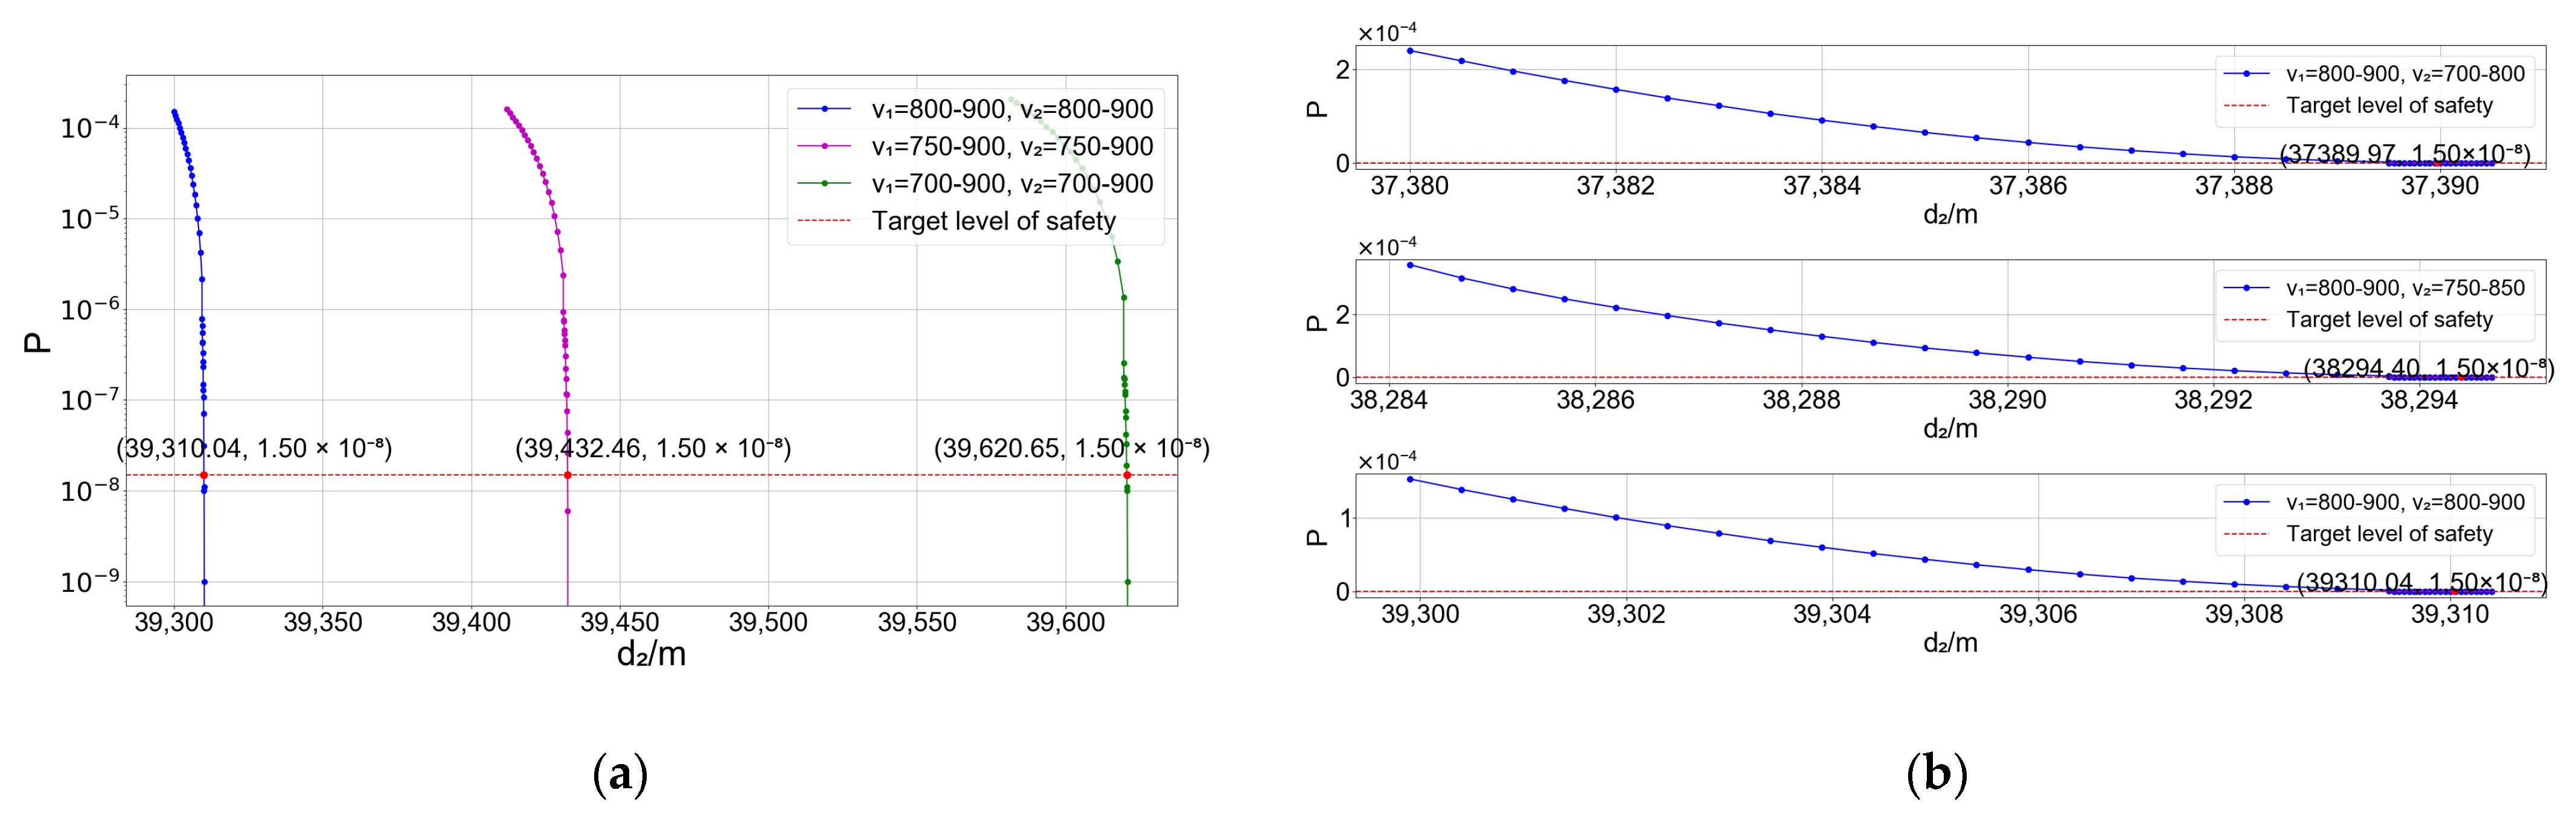
4.2.3. Analysis of Velocity Parameters

  • Normal distribution
Under current regulations, the leading aircraft’s speed at the intersection should not be less than that of the trailing aircraft, and cruising speeds at the same altitude are generally considered uniform. To further investigate the impact of speed variability on collision risk, scenario simulations are conducted with the assumption that both aircraft’s speeds have the same mean value and variable standard deviation. Figure 13 illustrates the relationship between the collision risk, the distance of the trailing aircraft from the intersection at the beginning, and the standard deviation. On the one hand, it can be clearly seen that the larger the standard deviation is, the larger the corresponding collision risk will be when the trailing aircraft is at the same distance from the intersection. The larger standard deviation indicates that the speed values are taken with a better discretization, which means that they will be mapped to different hash values and have a greater impact on the safety of the operation. On the other hand, it can be found that the smaller the standard deviation, the greater the rate of change of collision risk with distance, and given the TLS, it can be found that its corresponding distance from the trailing aircraft to the intersection will be smaller, which means that the more stable the cruising speed on the airway is, the higher the safety will be, and the safe separation that needs to be maintained will be reduced.
  • Uniform distribution
While the histogram of cruising speeds seems to align more closely with a normal distribution, it is important to consider that speeds less than 0 are not feasible. Therefore, the speed should vary within a specific range. When compared with actual operational data, these characteristics suggest that a uniform distribution might be a more accurate representation of cruising speed variations. When the speed obeys the uniform distribution, that is, V 1 ~ U ( a , b ) , V 2 ~ U ( c , d ) , so that V = 1 / V 1 , f V ( v ) = f V 1 ( 1 v ) | d v d v 1 | = 1 ( b a ) v 2 . After a simple transformation, Z = V 2 / V 1 = V 2 * V can be obtained; by the convolution formula, the following can be obtained:
f Z ( z ) = c d f V 2 ( v 2 ) f V ( z v 2 ) d v 2 = c 2 + d 2 + c d 3 ( b a ) z 2 , c b < z < d a
Building on Equation (4), we can derive the probability density function of the distance of the trailing aircraft from the intersection when the leading aircraft is at the intersection. The key aspect of the uniform distribution is the determination of its endpoint values. Our approach involves two steps: We first examine the impact of speed variability on collision risk. This is done by simulating the movement safety of the aircraft at the intersection, assuming both aircraft follow the same uniform distribution. The results of this simulation are illustrated in Figure 14a. Next, we keep the speed distribution of the leading aircraft constant and simulate the collision risk by varying the speed distributions of the trailing aircraft. This step is aimed at understanding the effects of speed differences between the two aircraft. The findings from this analysis are depicted in Figure 14b.
Based on the simulation outcomes, we observe that: (1) When both aircraft adhere to the same speed distribution parameters, an increase in the speed parameter compliance range leads to higher operational uncertainty and, consequently, a heightened risk of collision. In such cases, the larger the speed parameter compliance range, the greater the safe separation that the trailing aircraft must maintain from the intersection, given the leading aircraft’s proximity to it; and (2) a difference in speed between the two aircraft can effectively enhance the safety of the operation along the airway. In essence, a larger speed differential results in a smaller requisite safe separation for the trailing aircraft.
Lastly, the simulation of collision risk revealed that the rate of change in collision risk with respect to the distance between the two aircraft was more pronounced when speeds followed a uniform distribution. This means that when speeds were simulated using both normal and uniform distributions, the latter exhibited a greater variation in collision risk for the same distance. This observation may be due to the increased probability of encountering higher speed values at the tail end of a uniform distribution, which can result in a faster reduction of the distance between aircraft in a shorter period. This scenario, in turn, raises the likelihood of a collision. Therefore, a detailed analysis of speed is vital in evaluating collision risks. It requires careful consideration within the framework of actual operational circumstances and the intrinsic properties of the speed values.

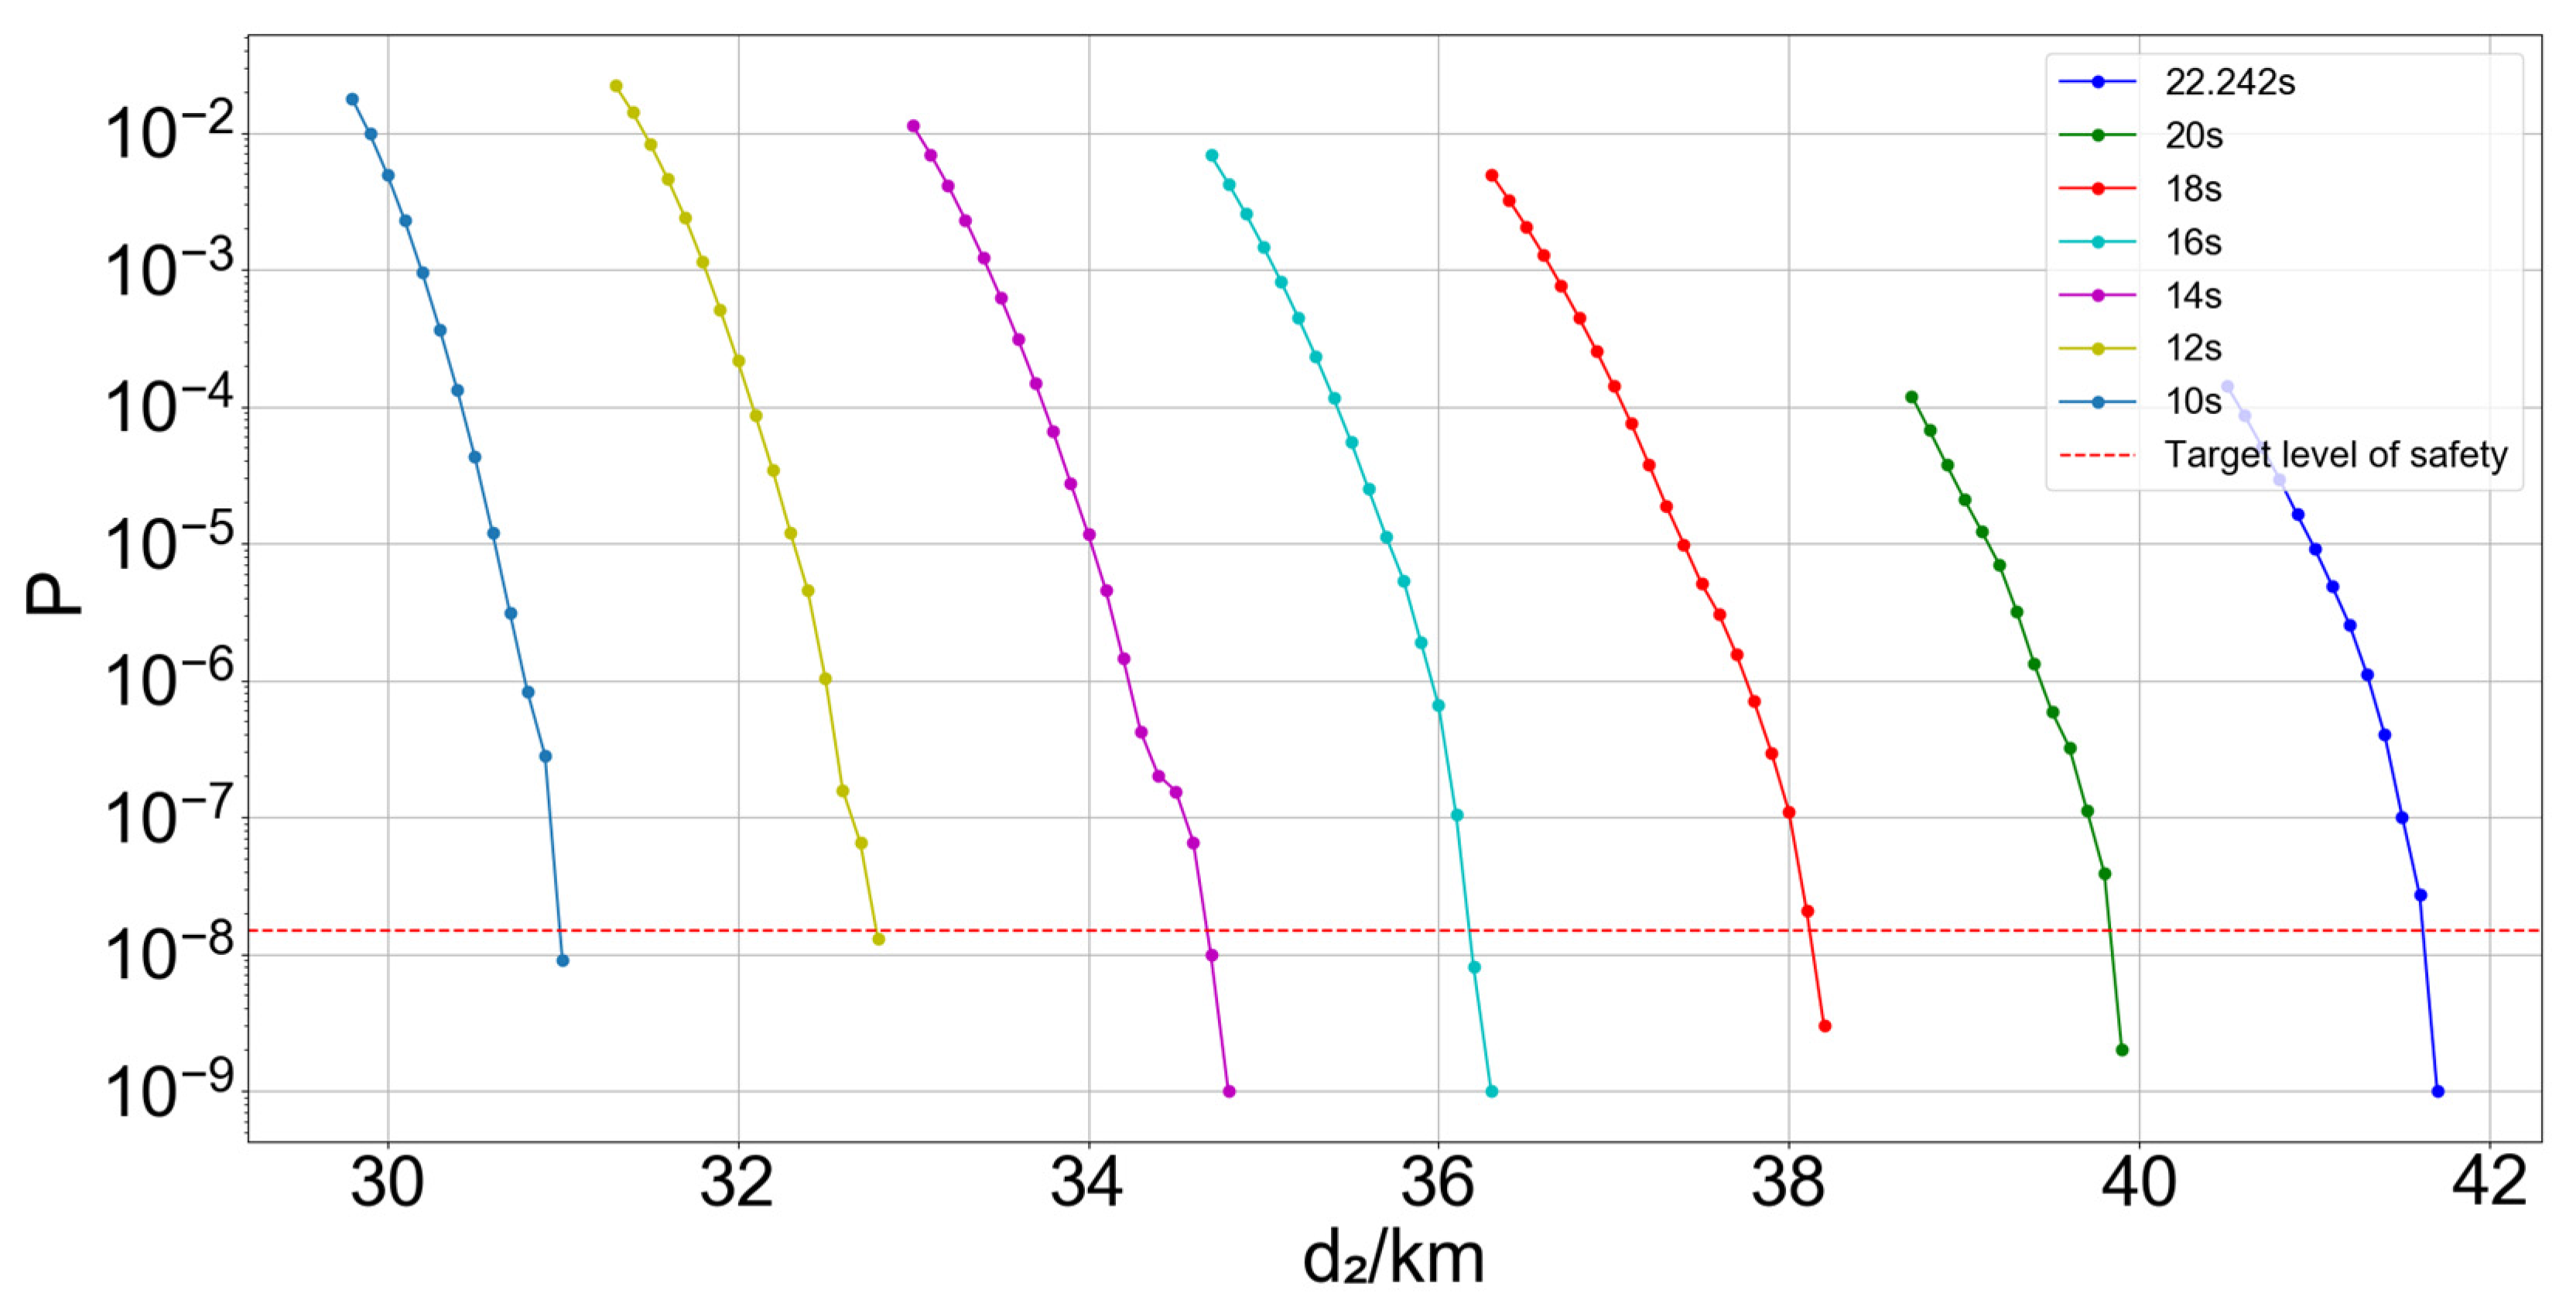
4.2.4. Analysis of Overall Time Spent on Human-Operated Adjustment

The safe separation discussed above is predicated on a conservative estimate of human-operated adjustment time. However, in real-world operations, the combined duration of the controller’s monitoring, decision-making, and communication; the pilot’s response and execution of instructions; and the aircraft’s maneuvering is likely to be quicker. To illustrate this, Figure 15 presents simulations of collision risk under various scenarios with differing overall human-operated adjustment times. It is evident that, as the total time for human-operated adjustment decreases, both the risk of collision between the two aircraft and the required safe separation distance of the trailing aircraft from the intersection also diminish, as detailed in Table 8. These findings underscore the importance of the controller’s and pilot’s proficiency in emergency situations, as well as the aircraft’s maneuverability in ensuring the safety of airway operations.

5. Conclusions

In this paper, we combined the analysis of the time required for controllers and pilots to cooperate to complete the process of human-operated adjustment to calculate the minimum distance between two aircraft. We then assessed the collision risk of intersecting routes using the Monte Carlo method, ensuring that our simulation scenarios closely resembled actual aircraft operations. Unlike most previous research that focused predominantly on positioning errors, our study emphasizes the crucial role of human factors in operational processes. Based on our simulation results, we provide a graph depicting the relationship between collision risk and the distance of the trailing aircraft from the intersection, specifically when the leading aircraft is 10 km from the intersection. Also, the safe separation (D2) that the trailing aircraft should maintain from the intersection in different simulation scenarios for a given TLS was calculated:
(1)
By simulating variations in the angles of each magnetic course, it was found that: as the angle θ of the two aircraft heading towards the intersection keeps increasing, the collision risk decreases and then increases, and is minimized at about 135°. When the leading aircraft is heading away from the intersection, the smaller the projected angle φ of the trailing aircraft on its route is, the higher the collision risk. Taken together, when the two take larger values, the corresponding collision risk is relatively smaller, i.e., the trailing aircraft needs to maintain a smaller safe separation from the intersection to meet the existing TLS;
(2)
Minimizing both position and speed errors in aircraft is crucial, as this not only reduces the need for safe separation but also leads to a more controllable operational process;
(3)
The simulation results for safe separation are influenced by the characteristics of the speed distribution. This study used real operational data to simulate both normal and uniform distributions, finding that the rate of change in collision risk was greater with the uniform distribution, largely due to its higher proportion of tail data. The inverse transformation method can be used to generate random numbers for simulating collision risk under different speed distributions on intersecting routes, which can contribute to enhancing air traffic management and flight safety;
(4)
In response to different human-operated adjustment times, as the time shortens, the required safe separation correspondingly decreases. This situation places higher demands on the qualities of both air traffic controllers and pilots. They need to not only possess solid professional knowledge but also exceptional emergency handling capabilities. To ensure flight safety by quickly and accurately assessing situations and taking appropriate measures in emergencies, the following measures can be implemented:
  • Enhance Professional Training: conduct regular and comprehensive training for air traffic controllers and pilots, such as updating them on the latest aviation regulations, the use of advanced technologies, and the development of emergency handling skills. This ensures that they can make quick and accurate decisions in emergency situations;
  • Emphasize Language Training: especially in the international aviation sector, where English is the universal language of aviation, it is crucial to focus on the English communication skills of controllers and pilots to ensure effective communication on international routes. Additionally, considering the importance of native languages, it is advisable to encourage and support the use of native languages for communication wherever possible. This can further improve the accuracy and efficiency of information transmission;
  • Upgrade Technical Support: continually update aviation management systems and tools, such as automated conflict detection and resolution systems. These enhancements can significantly improve the efficiency of controllers and pilots in managing safety. These systems are capable of real-time monitoring of flight paths, predicting potential conflicts and risks, thereby allowing controllers and pilots to take preventive actions to avoid accidents.
In summary, assessing collision risks for intersecting flight routes in different scenarios and determining a safe separation at a given TLS can effectively enhance the safety of aircraft operations. This has several benefits:
(1)
Optimizing airspace traffic allocation: Utilizing the results of safe separation calculations helps to manage air traffic flow more efficiently. This reduces congestion on air routes, enhances overall efficiency in airspace operations, and optimizes the allocation of traffic within the airspace;
(2)
Supporting the implementation of new air traffic management technologies: In the realm of new air traffic management technologies, such as automation, advanced navigation systems, and communication technologies, determining safe separation is crucial. It provides a theoretical foundation for the application of these new technologies, ensuring their safety and feasibility;
(3)
Enhancing airspace utilization efficiency: Through precise assessment of collision risks, there is an opportunity to more effectively utilize airspace, increase traffic flow, expand network capacity, and align it with the capabilities of air transportation.
These measures contribute to ensuring that aircraft operations in the airspace are not only safer and more efficient but also provide essential support for the future development of air traffic management.
Finally, when analyzing the impact of controllers and pilots’ operational time on collision risk, the direct use of enumeration methods to simulate different human-operated adjustment times failed to match with operator types corresponding to different behavioral characteristics. Future research should delve deeper and offer more targeted suggestions to further enhance the safety levels of aircraft operations in air spaces.

Author Contributions

Conceptualization, F.L. and T.W.; methodology, F.L. and T.W.; validation, F.L. and Z.Z.; data curation, T.W.; writing—original draft preparation, T.W.; writing—review and editing, F.L. and Z.Z.; visualization, F.L.; supervision, Z.Z.; project administration, Z.Z.; funding acquisition, F.L. All authors have read and agreed to the published version of the manuscript.

Funding

This research was funded by National Natural Science Foundation of China (Grant 52272356) and Fundamental Research Funds for the Central Universities (Grant 3122022101).

Institutional Review Board Statement

Not applicable.

Informed Consent Statement

Informed consent was obtained from all subjects involved in the study.

Data Availability Statement

The data presented in this study are available on request from the corresponding author. The data are not publicly available due to privacy.

Conflicts of Interest

The authors declare no conflicts of interest.

References

  1. National Transportation Safety Board. Aircraft Accident Report: Hughes Air West DC-9, N9345 and U.S. Marine Corps F-4B, 151458 near Duarte, California, 6 June 1971. Available online: https://www.ntsb.gov/investigations/AccidentReports/Reports/AAR7226.pdf (accessed on 5 January 2024).
  2. Reich, P.G. Analysis of long-range air traffic systems: Separation standards—I. J. Navig. 1966, 19, 88–98. [Google Scholar] [CrossRef]
  3. Brooker, P. Aircraft collision risk in the North Atlantic region. J. Oper. Res. Soc. 1984, 35, 695–703. [Google Scholar] [CrossRef]
  4. Shin, D.W.; Kim, S.K. The Study on RVSM Safety Assessment of Incheon FIR. J. Korean Soc. Aviat. Aeronaut. 2006, 14, 49–54. [Google Scholar]
  5. Zhang, Z.N.; Zhang, X.Y.; Li, D.B. Computation model of lateral collision rate on parallel routes based on VOR navigation. J. Traffic Transp. Eng. 2007, 7, 21–24. [Google Scholar]
  6. Siddiqee, W. A mathematical model for predicting the number of potential conflict situations at intersecting air routes. Transp. Sci. 1973, 7, 158–167. [Google Scholar] [CrossRef]
  7. Siddiqee, W. A mathematical model for predicting the duration of potential conflict situations at intersecting air routes. Transp. Sci. 1974, 8, 58–64. [Google Scholar] [CrossRef]
  8. Anderson, D.; Lin, X.G. A collision risk model for a crossin track separation methodology. J. Navig. 1996, 49, 337–349. [Google Scholar] [CrossRef]
  9. Han, S.C.; Qu, Y.L.; Sun, F.R.; Zhu, X.P. Collision risk model around intersection of airways. J. Southwest Jiaotong Univ. 2013, 26, 383–389. [Google Scholar]
  10. Novak, A.; Havel, K.; Adamko, P. Number of conflicts at the route intersection--minimum distance model. Aviation 2019, 23, 1–6. [Google Scholar] [CrossRef]
  11. Bakker, G.J.; Blom, H.A.P. Air traffic collision risk modelling. In Proceedings of the 32nd IEEE Conference on Decision and Control, San Antonio, TX, USA, 15–17 December 1993; IEEE: San Antonio, TX, USA, 1993; pp. 1464–1469. [Google Scholar]
  12. Blom, H.A.P.; Bakker, G.J.; Everdij, M.; van der Park, M. Collision risk modeling of air traffic. In Proceedings of the 2003 European Control Conference (ECC), Cambridge, UK, 1–4 September 2003; IEEE: Cambridge, UK, 2003; pp. 2236–2241. [Google Scholar]
  13. Cassell, R.; Smith, A.; Shepherd, R. A risk assessment model for free flight-terminal area reduced separation. In Proceedings of the 15th DASC. AIAA/IEEE Digital Avionics Systems Conference, Atlanta, GA, USA, 31–31 October 1996; IEEE: Atlanta, GA, USA, 1996; pp. 73–80. [Google Scholar]
  14. Swaminathan, S.; Smidts, C. The event sequence diagram framework for dynamic probabilistic risk assessment. Reliab. Eng. Syst. Saf. 1999, 63, 73–90. [Google Scholar] [CrossRef]
  15. Noh, S.; Shortle, J. Dynamic Event Tree Framework to Assess Collision Risk between Various Aircraft Types. In Proceedings of the 2020 Integrated Communications Navigation and Surveillance Conference (ICNS), Herndon, VA, USA, 8–10 September 2020; IEEE: Herndon, VA, USA, 2020; pp. 2F1-1–2F1-13. [Google Scholar]
  16. Ale, B.J.M.; Bellamy, L.J.; Cooke, R.M.; Goossens, L.H.J.; Hale, A.R.; Roelen, A.L.C.; Smith, E. Towards a causal model for air transport safety—An ongoing research project. Saf. Sci. 2006, 44, 657–673. [Google Scholar] [CrossRef]
  17. Brooker, P. Lateral collision risk in air traffic track systems: A ‘post-Reich’event model. J. Navig. 2003, 56, 399–409. [Google Scholar] [CrossRef]
  18. Cai, Q.; Ang, H.J.; Alam, S. Collision risk assessment of reduced aircraft separation minima in procedural airspace using advanced communication and navigation. Chin. J. Aeronaut. 2023, 36, 315–337. [Google Scholar] [CrossRef]
  19. Liu, H.; Zhu, D.W.; Xie, X.F.; Chen, J.H.; Liu, X.K. Optimization of Lateral Collision Risk of Aircraft Based on the Skid-Slip Event Model. Int. J. Aerosp. Eng. 2022, 2022, 1–11. [Google Scholar] [CrossRef]
  20. Blom, H.A.P.; Krystul, J.; Bakker, G.J. Free flight collision risk estimation by sequential MC simulation. In Stochastic Hybrid Systems, Cassandras, C.G., Lygeros, J., Eds.; CRC Press (Taylor & Francis): Boca Raton, FL, USA, 2006; pp. 247–279. [Google Scholar]
  21. Kochenderfer, M.J.; Griffith, J.D.; Holland, J.E. On estimating mid-air collision risk. In Proceedings of the 10th AIAA Aviation Technology, Integration, and Operations (ATIO) Conference, Fort Worth, Texas, USA, 13–15 September 2010; AIAA: Fort Worth, TX, USA, 2010. [Google Scholar]
  22. Thipphavong, D. Accelerated Monte Carlo simulation for safety analysis of the advanced airspace concept. In Proceedings of the 10th AIAA Aviation Technology, Integration, and Operations (ATIO) Conference, Fort Worth, Texas, USA, 13–15 September 2010; AIAA: Fort Worth, TX, USA, 2010. [Google Scholar]
  23. Zhang, Z.N.; Liu, J.M.; Wang, L.L. Assessment of Longitudinal Collision Risk on Parallel Routes Based on Communication, Navigation and Surveillance Performances. J. Southwest Jiaotong Univ. 2009, 44, 918–925. [Google Scholar]
  24. Lu, F.; Chen, Z.C.; Chen, H.Y. Lateral collision risk assessment of parallel routes in ocean area based on space-based ADS-B. Transp. Res. Part C Emerg. Technol. 2021, 124, 102970. [Google Scholar] [CrossRef]
  25. Lu, F.; Zhang, Z.N.; Wei, Z.Q.; Liu, B.L. Longitudinal collision risk safety assessment of paired approach to closed spaced parallel runways. China Saf. Sci. J. 2013, 23, 108–113. [Google Scholar]
  26. Hsu, D.A. The evaluation of aircraft collision probabilities at intersecting air routes. J. Navig. 1981, 34, 78–102. [Google Scholar] [CrossRef]
  27. Stroeve, S.H.; Blom, H.A.P.; Bakker, G.J. Systemic accident risk assessment in air traffic by Monte Carlo simulation. Saf. Sci. 2009, 47, 238–249. [Google Scholar] [CrossRef]
  28. Zhang, Y.M.; Shortle, J.; Sherry, L. Methodology for collision risk assessment of an airspace flow corridor concept. Reliab. Eng. Syst. Saf. 2015, 142, 444–455. [Google Scholar] [CrossRef]
  29. Wang, C.; Li, Y.K.; Li, H.Y. Collision risk analysis of parallel runway approach based on Monte Carlo. J. Saf. Environ. 2023, 23, 659–666. [Google Scholar]
  30. Hinkley, D.V. On the ratio of two correlated normal random variables. Biometrika 1969, 56, 635–639. [Google Scholar] [CrossRef]
  31. Mosquera-Benitez, D.; Groskreutz, A.R.; Fucke, L. Separation minima model: How changes in contributing factors could affect current standards. In Proceedings of the 8th USA/Europe Air Traffic Management Research and Development Seminar 2009, Napa, CA, USA, 29 June–2 July 2009; Curran Associates, Inc.: Napa, CA, USA, 2009; pp. 334–342. [Google Scholar]
  32. Sun, R.S.; Chen, Y.F.; Liu, X.Y.; Peng, T.C.; Liu, L. A method of analysis integrating HCR and ETA modeling for determining risks associated with inadequate flight separation events. J. Aviat. Technol. Eng. 2011, 1, 19–27. [Google Scholar] [CrossRef]
  33. Li, D.B.; Xu, X.H.; Li, X. Target level of safety for Chinese airspace. Saf. Sci. 2009, 47, 421–424. [Google Scholar] [CrossRef]
Figure 1. Schematic diagram of two-aircraft operation on intersecting air route.
Applsci 14 01089 g001
Figure 2. Initial flight path diagram.
Applsci 14 01089 g002
Figure 3. Chart illustrating trajectory filtering based on the top 95% density of coordinate points.
Applsci 14 01089 g003
Figure 4. Convergence route scheduled reporting point fitting chart.
Applsci 14 01089 g004
Figure 5. Cluster chart of waypoints in the inflow segment.
Applsci 14 01089 g005
Figure 6. Speed fitting at the LLC intersection altitude level of 8900 m.
Applsci 14 01089 g006
Figure 7. Voice data waveform.
Applsci 14 01089 g007
Figure 8. Fitted graph of controller thinking and reaction time.
Applsci 14 01089 g008
Figure 9. Monte Carlo simulation pseudo-code.
Applsci 14 01089 g009
Figure 10. Graph of collision risk variation with trailing aircraft distance to intersection and α values.
Applsci 14 01089 g010
Figure 11. Graph of collision risk variation with trailing aircraft distance to intersection and magnetic course θ 1 .
Applsci 14 01089 g011
Figure 12. Graph of collision risk variation with trailing aircraft distance to intersection and crossing angles θ .
Applsci 14 01089 g012
Figure 13. Graph of collision risk variation with trailing aircraft distance to intersection and two-aircraft standard deviation.
Applsci 14 01089 g013
Figure 14. Graph of collision risk variation with trailing aircraft distance to intersection under uniform distribution: (a) graph of conforming to the same speed distribution; and (b) graph of modifying speed distribution parameters for the trailing aircraft.
Applsci 14 01089 g014
Figure 15. Graph of collision risk variation with trailing aircraft distance to intersection for different overall human-operated adjustment times.
Applsci 14 01089 g015
Table 1. Review of relevant studies on collision risk assessment.
ModelAuthorYearApplication ScenarioMain Contribution
Reich
model
Reich [2]1996Parallel air routes over the North AtlanticFor lateral, longitudinal, and vertical collision risk assessment, addressing the safety evaluation of flight separation.
Hsu [26]1981Intersecting air routesCalculating the collision probability for intersecting air routes using a cylindrical template.
Brooker [3]1984Parallel air routes over the North AtlanticReducing the lateral separation from 120 nautical miles to 60 nautical miles.
Shin [4]2006Incheon FIRAssessing collision risk.
Zhang [5]2007Parallel air routes under VOR navigation in continental areasUsing the Reich model and probability theory to establish a lateral collision calculation model.
Conflict
area
model
Siddiqee [6,7]1973,1974Intersecting air routesDeveloping a mathematical model of intersection capacity.
Anderson [8]1996Intersecting air routesProviding an assessment of collision risk for intersecting air routes using the conflict area model.
Songchen [9]2013Intersecting air routesProposing a method for assessing collision risk at intersecting air routes, where the nominal distance varies over time.
Novak [10]2019Intersecting air routesComparing multiple parameters under different air route intersection configurations to assess the operational safety of aircraft at intersections.
Stochastic
Process
method
Bakker [11]1993Arbitrary 3D air route networkUsing the method of transient boundaries to solve partial differential equations, providing a numerical assessment model for collision risk.
Blom [12]2003Mid-air collision between aircraftIntroducing stochastic differential equations (SDE) with switch coefficients.
System
analysis
method
Cassell [13]1996Terminal areaRASRAM provides a framework for evaluating different technologies and their impact on the safety.
Swaminathan [14]1999Aircraft icingThe ESD (Event Sequence Diagram) of Markov processes can handle scenarios ranging from purely static to fully dynamic.
Ale [16]2006Sub-selections of the aviation worldDeveloping a full operational causal model using fault tree and BBN methods.
Noh [15]2020AirspaceEvaluating collision risk in airspace with different aircraft types and collision avoidance capabilities using dynamic event trees.
EVENT
model
Brooker [17]2003Parallel air routesFocusing on flights that deviate significantly from their planned flight paths, from an event perspective.
Liu [19]2022Cruising level flightUpgrading the collision template to an ellipsoid, proposing an aircraft lateral conflict resolution model based on the TSRRT algorithm.
Qing [18]2023Singapore’s airspaceEstablish longitudinal risk based on a new intervention model.
Monte Carlo simulation
method
Blom [20]2007Free flightCreating a Monte Carlo simulation model using stochastic and dynamic colored Petri nets.
Stroeve [27]2009Runway incursionBased on dynamic multi-agent models, representing the distributed and dynamic interactions of various human operators and technical systems in a safety relevant scenario.
Thipphavong [22]2010Advanced airspace conceptDeveloping an accelerated Monte Carlo method that combines features of fault trees and standard Monte Carlo methods.
Zhang [28]2015Flight corridorsIntroducing the concept of flow corridors, combined with Monte Carlo simulation and dynamic event trees to assess related collision risks.
Wang [29]2023Parallel runway approachConstructing an approach collision risk simulation model oriented towards multiple object sets.
Position
error
method
Zhang [23]2009Parallel air routesTaking into account positioning errors in a radar-controlled environment.
Lu [25]2013Closed spaced parallel runways paired approachEstablishing a longitudinal collision risk assessment model based on positional error distribution and wake turbulence avoidance requirements.
Lu [24]2021Parallel routes in ocean areaProcessing positional errors categorically, and using Bayesian networks to assess collision risk on maritime parallel air routes.
Table 2. Table of parameters for normal distribution fitting across various special cases ( α values).
α 0.70.60.50.40.30.20.10
Mean value/m211.3505.38851.31323.841958.032674.343068.273694.65
Standard deviation/m853.911499.542231.512968.043774.144429.866224.3010,598.61
Table 3. Various aircraft parameters.
Aircraft ModelsA359A320A333B738A321A332737B735
Proportions0.0880.4080.080.1020.1570.080.0110.074
Fuselage length/m66.835.5763.6639.544.5158.8233.631.1
Wingspan width/m64.7535.860.335.835.860.334.328.9
Table 4. Safe separation (D2) corresponding to α value at the TLS.
α 00.10.20.30.40.50.60.7
D2 (km)67.26950.10743.19441.64639.54837.39534.94533.197
Table 5. D2 corresponding to different projection angles φ at TLS.
φ ( ) 61426346386116146
θ 1 ( ) 402060097120150180
D2 (km)181.889156.85771.27068.60841.64635.38229.96326.355
Table 6. D2 corresponding to different crossing angles θ at TLS.
θ ( ) 0306092120135150180
D2 (km)45.49744.38243.07341.64641.08540.91741.46741.869
Table 7. D2 corresponding to different magnetic course θ 2 at TLS.
θ 2 ( ) 120150180210240270300330360
φ ( ) 1571279767377235383
θ ( ) 18615612696663662454
D2 (km)25.88827.88132.28540.38958.28169.04899.07354.22542.537
Table 8. D2 corresponding to different overall time spent on human-operated adjustment τ at TLS.
Overall Time Spent on Human-Operated Adjustment (s)10121416182022.242
D2 (km)30.99832.79634.69136.19338.13339.86541.646
Disclaimer/Publisher’s Note: The statements, opinions and data contained in all publications are solely those of the individual author(s) and contributor(s) and not of MDPI and/or the editor(s). MDPI and/or the editor(s) disclaim responsibility for any injury to people or property resulting from any ideas, methods, instructions or products referred to in the content.

