1. Introduction
Aircraft electrification is challenging the behavior of insulation materials because of the severe ambient conditions and high electrical stresses they must endure. This electrification trend is being driven by several factors, including the need to meet decarbonization targets, reduce emissions, and increase the efficiency of air transport [
1]. Increased electrical power has resulted in significant increases in distribution voltages, with operating voltages increasing from 28 V-DC to 230 V-AC and up to 1000 V-DC [
2]. Aircraft power systems rely on insulated cables that are widely distributed throughout the aircraft [
1]. Aircraft cables must withstand significant temperature and pressure variations that promote condensation, high levels of vibration, and exposure to contamination and the elements [
3]. The decreased air density characteristic of flight altitude significantly reduces the dielectric strength of the air surrounding the insulation [
4,
5], as well as the thermal exchange [
2]. Due to the harsh environment and the higher operating voltages, insulation systems in more electric aircraft (MEA) are exposed to partial discharge, arcing, and electrical breakdown hazards under typical operating conditions, which can result in serious insulation failures. Thicker insulation helps reduce the risk of failure [
6,
7]. However, it increases cable weight and makes thermal management more difficult [
2]. Therefore, because insulation plays an important role in the stable operation of electrical systems [
8], it is essential to develop lines of research focused on improving and optimizing insulation performance and developing detection methods to identify possible insulation failures such as partial discharges.
Partial discharges (PDs) occur in insulation systems subjected to high electrical stress [
9,
10]. Although PDs are localized and of relatively low intensity, they tend to degrade the insulation and cause premature aging [
11]. Polymeric insulation materials are generally susceptible to chemical degradation, so prolonged surface PD activity will eventually create partially conductive paths of degraded insulation material that can lead to surface tracking and/or erosion [
12,
13,
14]. Surface contamination combined with high electrical stress can lead to arcing along the partially conductive tracks, causing them to grow and penetrate into the insulation, facilitating the occurrence of major electrical failures [
15]. Due to the low energy levels involved in the early stages of surface discharge activity, it is very difficult to detect. Surface discharge activity emits visible and ultraviolet (UV) light [
16,
17,
18,
19]. Therefore, it is possible to detect surface discharge activity using appropriate optoelectronic sensors [
20], which are readily available and inexpensive today [
21].
Standard tests are used to test the dielectric performance and aging behavior of polymeric cable insulation. However, due to the nature of the specimens and the test itself, they tend to exhibit significant variability between specimens, challenging test laboratories, manufacturers, and end users [
22]. The inherent variability in accelerated arc tracking tests is due to several factors, including changes in the composition and the quality of the insulation, surface contamination, changes in environmental conditions, changes in electrode geometry, electrode wear, measurement uncertainties, and the inherent stochastic nature of the arc tracking phenomenon [
1,
23]. Therefore, to deal with the inherent variability, international standards for quantifying the resistance of insulating polymer materials to dry and wet arc tracking, and for qualifying such materials, often require that at least five samples of each wire be tested [
24,
25,
26,
27].
Current standards for qualifying the insulation materials for aircraft use are based on tests conducted at normal pressure and therefore do not account for the lower air density found in aircraft systems. The ionization efficiency of the electrons released from the surface discharges increases at lower air densities [
28] because of the longer mean free path of the electrons, which also increases the potential for damage to the insulation. Therefore, it is important to have data on insulation failure at low pressures [
29], so this paper focuses on this aspect. The results presented in this paper are based on a modification of the EN 3475-603:2018 European standard [
30], which is used together with the EN 3475-100:2010 European standard [
31]. The EN 3475-603:2018 standard relates to the resistance of electrical cables intended for aircraft applications to wet arc tracking. It uses purposely notched wires and an electrolytic solution to speed up the degradation process, which is introduced into the notches of the tested insulated wires by means of a dropping system. During the test, a 400 Hz alternating voltage was applied to the notched wires. In this paper, the degradation of the wire insulation was quantified using a low-pressure chamber operating at varying pressure conditions, in the range of 100 kPa–16 kPa. This pressure interval covers pressures from the ground level to the flight altitude of commercial aircraft [
32]. The experimental degradation results presented in this paper are based on eight samples of XL-ETFE insulated wires. The degree of insulation degradation was quantified as a function of ambient pressure using three optical methods that detected the visible and UV light emitted by the surface discharges generated during the degradation process. Because of their readiness, reduced cost, and suitability for this purpose, back-illuminated CMOS and solar blind UV sensors were used for this specific purpose [
33].
This paper contributes to the state of the art in several ways. Since there is a lack of data and experience in evaluating the performance of insulation materials under low-pressure conditions, this paper contributes to this area. This work dealt with the light emission from surface discharges, contributing to a deeper insight into how light emitted from discharges enables the quantification of insulation conditions and how commercial optoelectronic sensors can be used for this purpose. The results presented in this paper indicate that although aircraft wires must withstand low-pressure environments, measurements made at standard pressures provide better sensitivity for determining the condition of the insulation than those conducted at low pressure, despite the inherent variability in arc tracking tests. In addition, it is easier, faster, and less complex to perform degradation tests under standard pressure conditions. The results presented in this work show that optoelectronic sensors can potentially be used for insulation inspection, the detection and quantification of early insulation degradation, and predictive maintenance. They have potential applications for the testing and predictive maintenance of insulation systems at a competitive cost in the aerospace industry and other technology sectors where insulation integrity is critical.
2. The Proposed Experimental Method to Degrade the Wire Samples
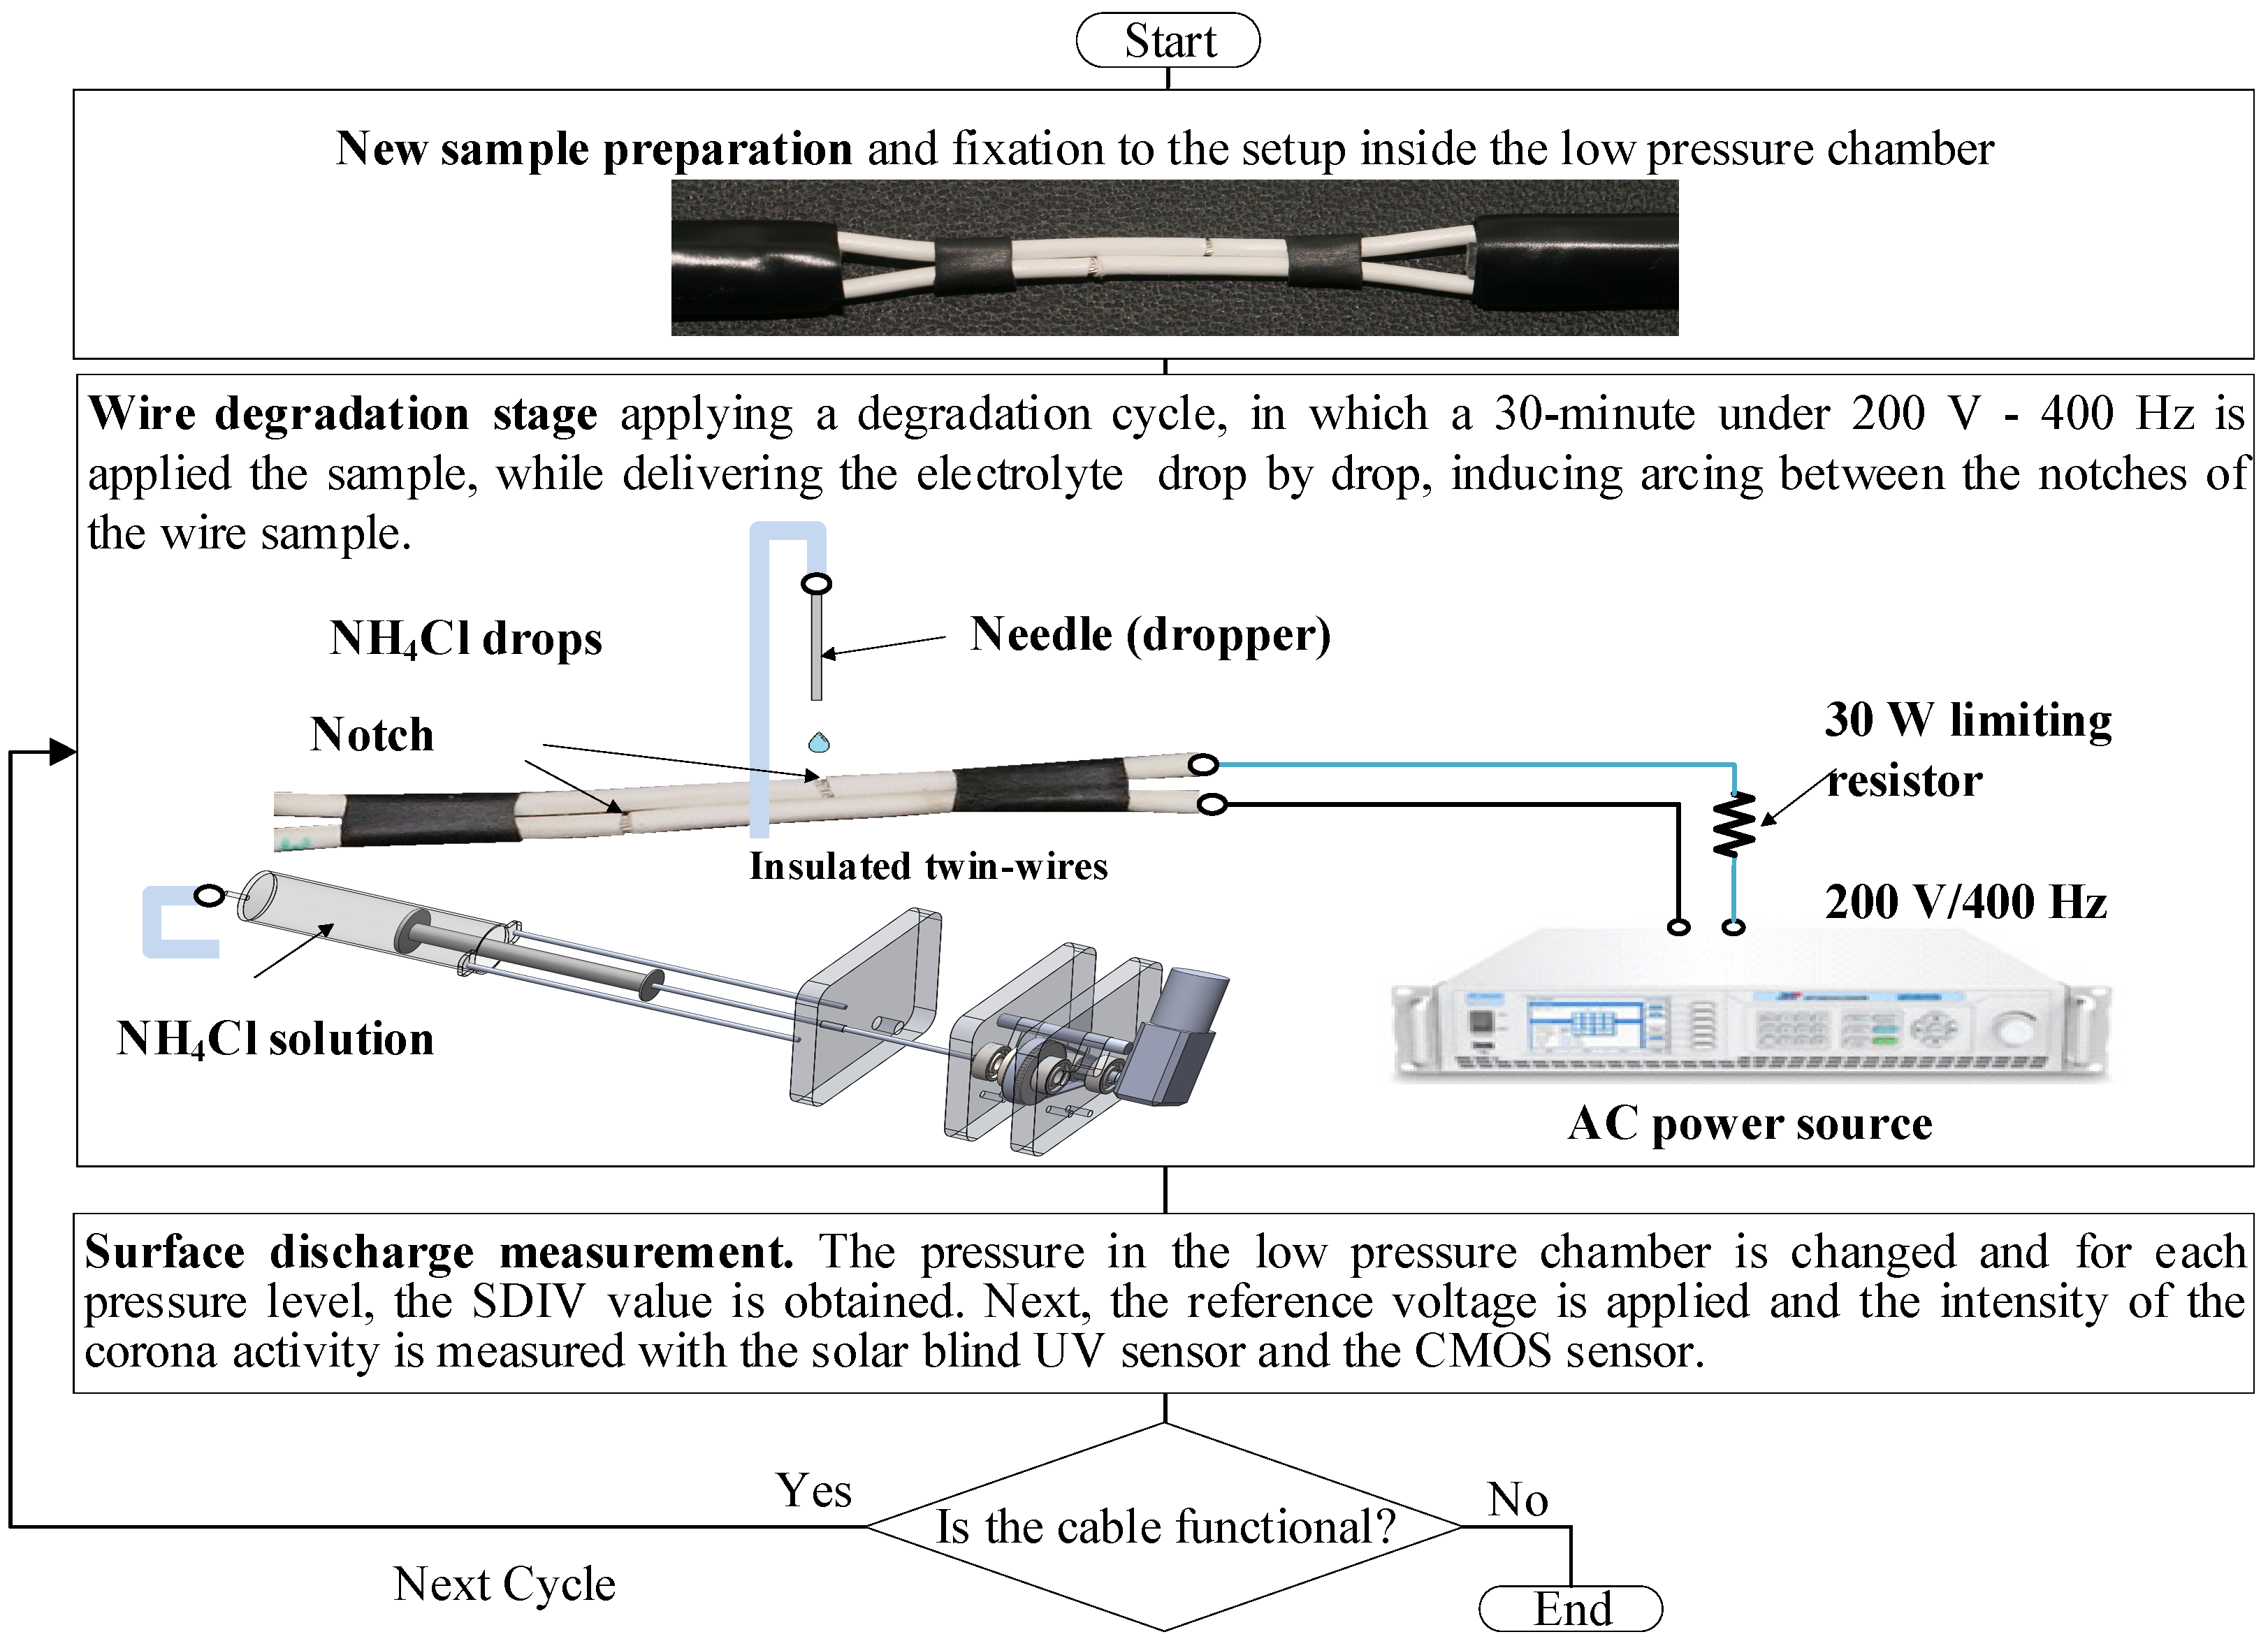
The samples analyzed consisted of two artificially notched insulated twin wires (see
Figure 1). The wire degradation process was based on a modified version of the degradation process described in the European Standard EN 3475-603 relating to test methods for determining the resistance to wet arc tracking of aircraft wires [
30]. The main difference is that instead of running the entire degradation test for 8 h or to failure, whichever comes first, the degradation process used in this paper consisted of successive cycles of 30 min for each sample. This difference allowed the condition of the insulation to be measured after each 30 min degradation cycle. During each cycle, the two-wire specimens were supplied with 200 V
RMS and 400 Hz from an AC power source according to EN 3475-603.
Simultaneously, a NH4Cl solution was applied by the delivery system drop-by-drop to the sample test area, producing instantaneous surface discharges followed by arcing activity that progressively damaged the insulation. After each 30 min degradation cycle, the samples were rinsed with distilled water to ensure that the salt crystals formed on the surface of the samples were dissolved and washed away. The rapid evaporation of the electrolyte solution as a result of the surface discharge activity caused salt crystals to form. The small salt crystals tended to increase the electric field strength, causing surface discharge activity to occur at random locations. This affected the experimental results. After washing with distilled water, the samples were air-dried with forced air until there were no drops of water or moisture left on the wires.
Figure 1 summarizes the steps of the experimental method proposed in this paper to establish a relationship between insulated wire degradation and surface discharge intensity using a CMOS sensor and a solar blind UV sensor as described in
Section 4.
3. The Proposed Experimental Method to Measure the Surface Discharges Activity
3.1. Surface Discharge Detection and Quantification Methods
This section describes the three methods used to measure the surface discharge activity for each sample at each degradation cycle and pressure level.
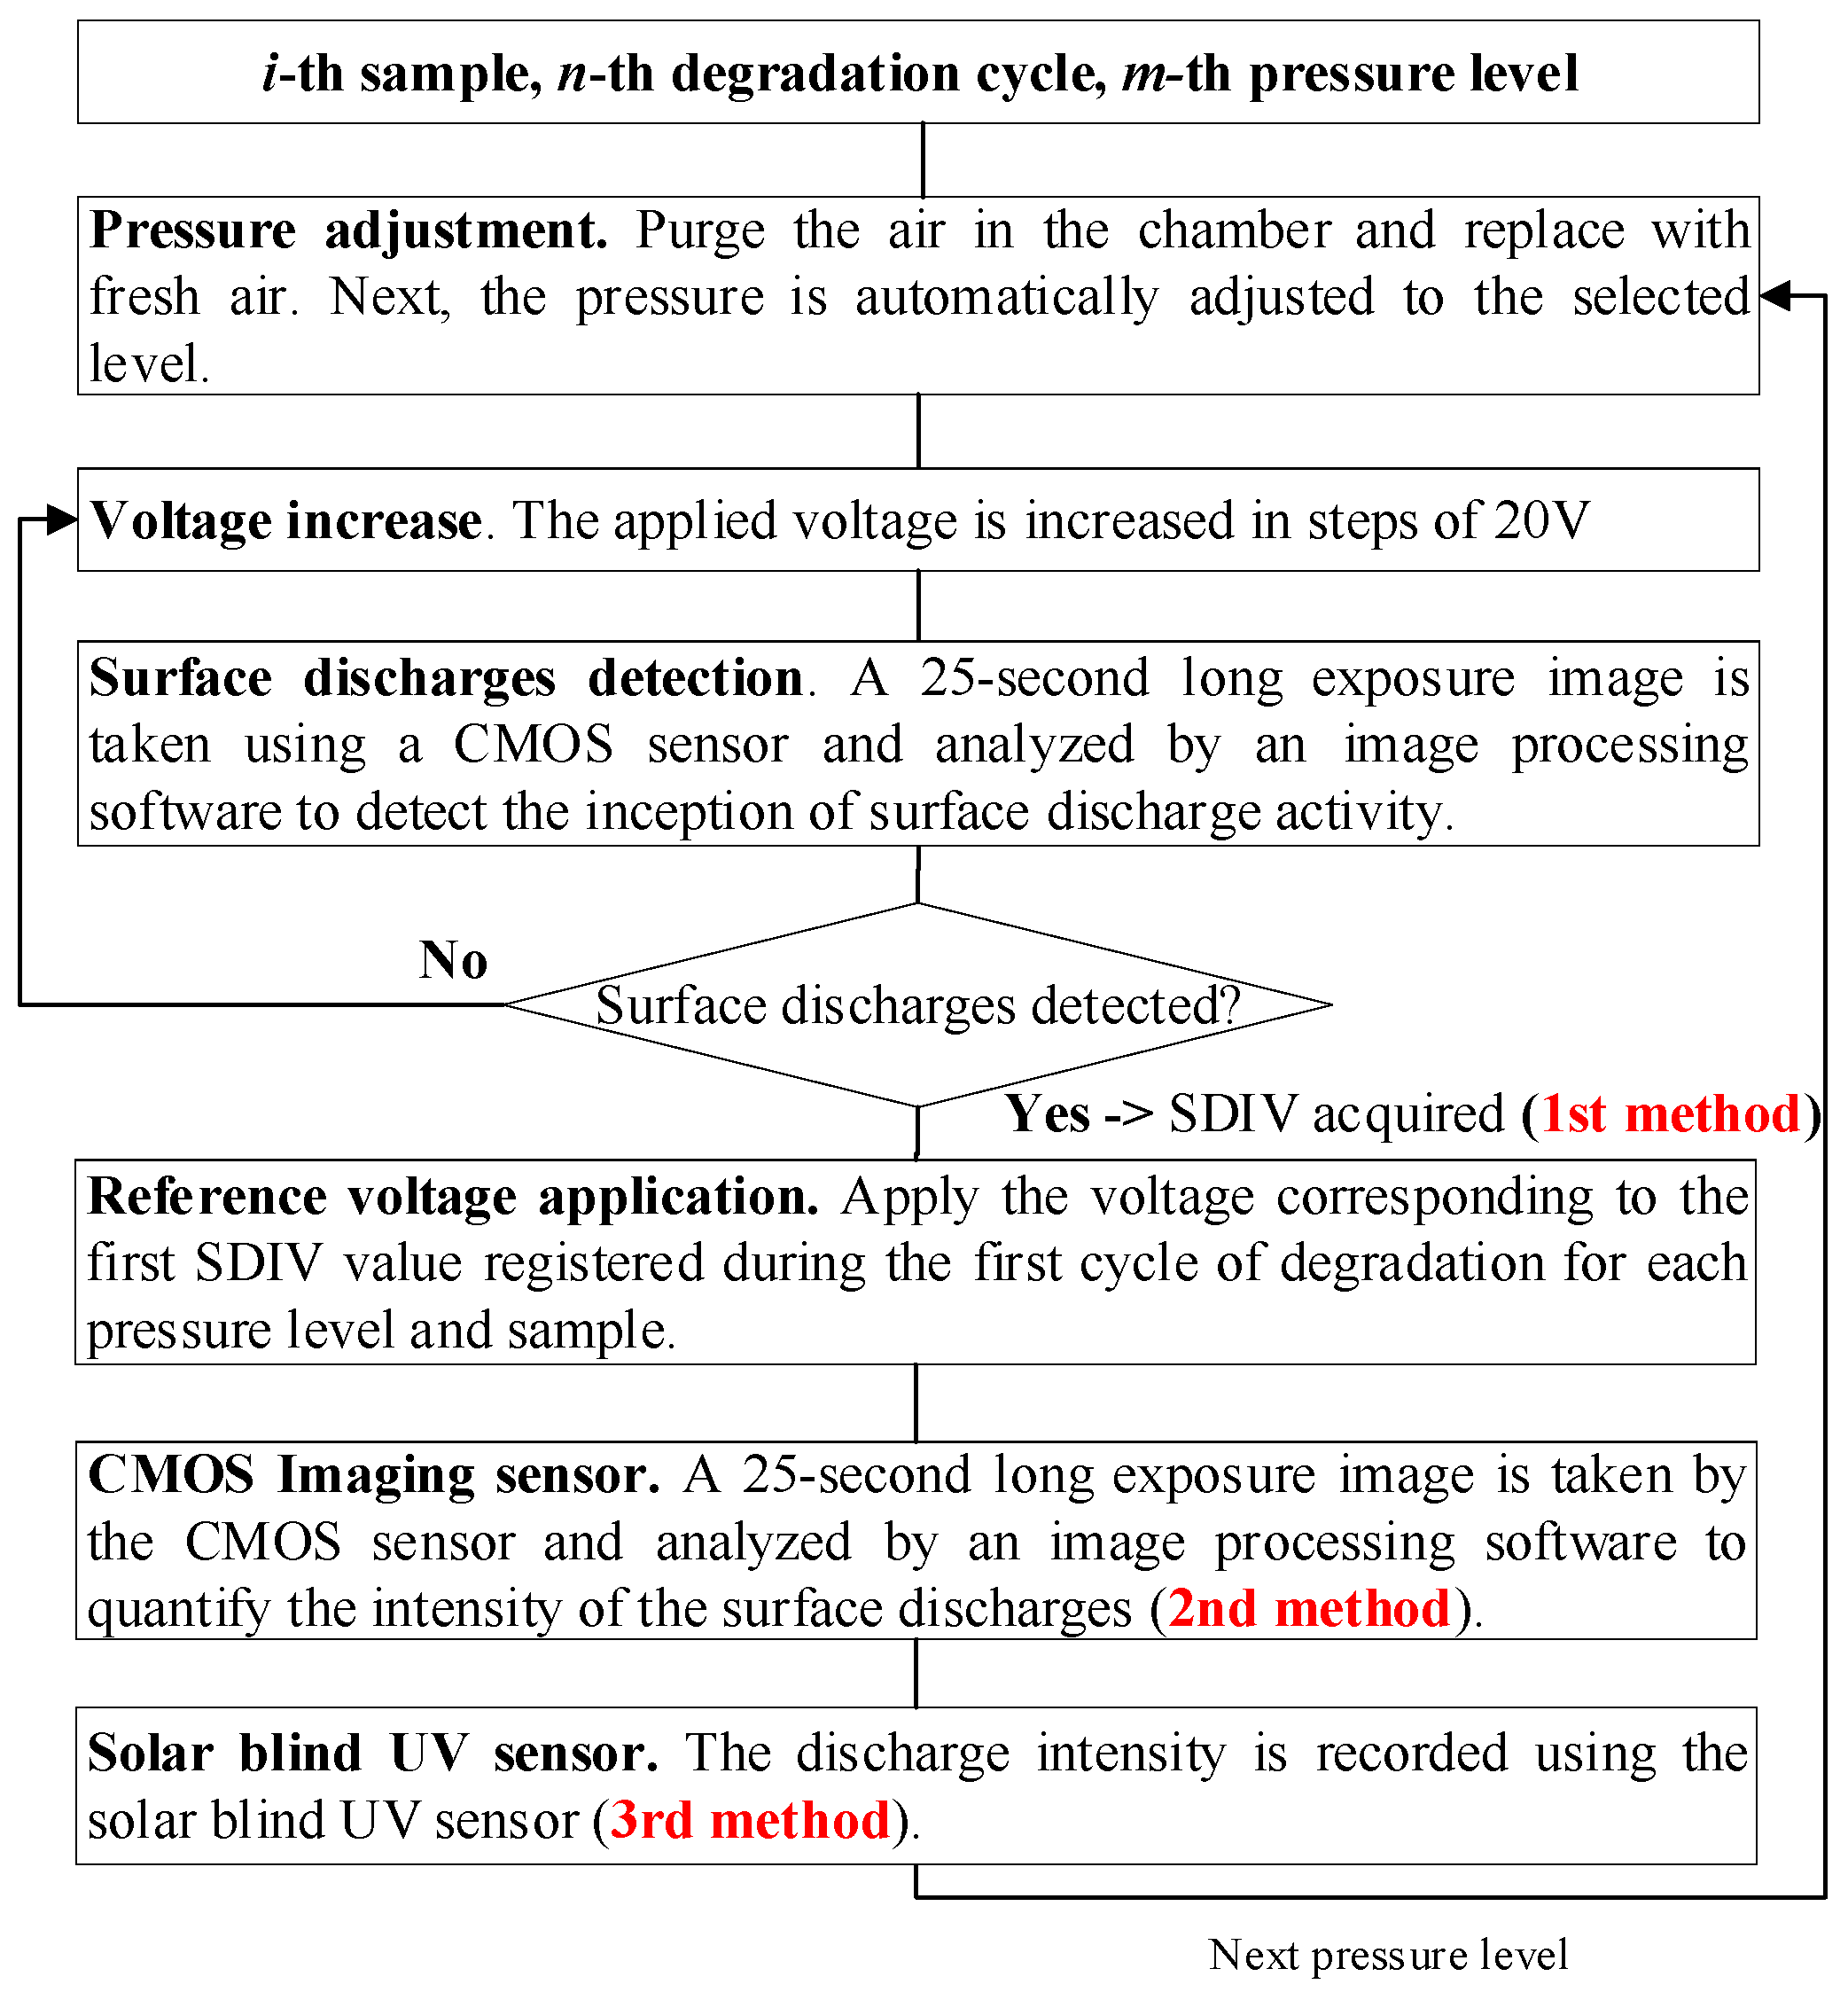
The process begins by purging air from the low-pressure chamber and replacing it with fresh air to prevent ozone contamination. Then, an automatic control system adjusts and maintains the chamber pressure at the appropriate level (16 kPa, 44 kPa, 72 kPa, and 100 kPa in this work) to simulate typical low-pressure aircraft conditions. Next, the power source is configured to apply a 400 Hz AC voltage to the wires. This frequency is based on the European standard EN 3475-603 for aeronautical applications. The AC 400 Hz voltage applied to the samples is increased in increments of 20 V
RMS. At each voltage step, an RGB image is captured with the CMOS sensor described in
Section 4 and analyzed with image processing software (Matlab ® R2022b) to determine if surface discharge activity has been detected. This process is repeated until surface discharge activity is detected so that the surface discharges inception voltage (SDIV) is obtained for each sample at each degradation cycle. The SDIV is the minimum voltage at which surface discharge activity is detected with the CMOS sensor. Once the SDIV is registered, the voltage of the source is set to the reference voltage, corresponding to the SDIV value measured during the first degradation cycle for each pressure level and sample analyzed. The response of the solar blind UV sensor is then measured, and a 25 s long exposure photograph is taken with the CMOS imaging sensor. The image is processed by special software (Matlab ® R2022b) that detects the surface discharge activity and measures the intensity of the image.
Figure 2 summarizes the various steps needed to detect the SDIV and quantify the intensity of the discharges with the CMOS and the solar blind UV sensors.
3.2. Three Proposed Methods to Quantify the Degradation Process of the Twin Wire Samples
The first method of quantifying the degradation of the wire samples is based on the SDIV measured by the CMOS sensor. It is expected that as the samples degrade over time, the SDIV value will decrease.
The second method is based on determining the intensity of the discharge images. Image processing software was programmed in the Matlab
® R2022b environment to detect the SDIV and quantify the surface discharge intensity from the RGB images captured by the CMOS sensor. This process is summarized in
Figure 3.
First, a 25 s long exposure image is captured with the CMOS imaging sensor. The image is then imported into the Matlab
® environment and converted into an RGB array. Each pixel of the array is represented by an RGB triplet whose coordinates are in the range of 0–255, 0–255, 0–255. Next, the area of surface discharge activity is identified and located by applying the color threshold filtering method, which consists of selecting certain pixels from the image that correspond to a specific color or range of colors corresponding to the characteristic wavelengths of the light emitted by the surface discharges (see
Table 1).
After applying the color threshold filter, the resulting array is a single-channel 2D array with 0–1 binary values. Pixels within the selected color range are represented by a value of 1, while pixels outside the range are represented by a value of 0. It is worth noting that image processing, such as color threshold filtering, operates at the single pixel level. Consequently, the resulting image may contain some degree of noise or random pixels that fall within the corona color range but are not actually indicative of surface discharge activity. To address this issue, pixel region analysis was applied to the filter pixel aggregates of a size smaller than 100 pixels. To quantify the intensity of the discharges, bounding boxes were applied to the image to detect and locate the specific regions of surface discharge activity. These bounding boxes allowed for the isolation of the areas identified by the color threshold filtering process, providing a clear visual representation of the corona affected areas within the image. Next, the pixels within the bounding boxes are converted to grayscale using the following transformation [
33],
where
I (
i,j) ∈ (0, 255) is the intensity of each pixel in the
i-th row and
j-th column of the image matrix (
i,j), while 0.299, 0.587, and 0.114 are the weights of the red, green, and blue channels, respectively, taking into account the luminous efficiency function of the average human eye.
After each region is transformed into a separate grayscale image, the intensity of the surface discharges can be calculated as follows [
34],
where
m and
n are the number of rows and columns in the image matrix.
Finally, the third method of quantifying the insulation degradation of the wire samples is to directly measure the output signal provided by the solar blind UV sensor. It provides a binary on/off output signal with a frequency that rises with the intensity of the light falling in the solar blind region emitted by the discharges.
4. Experimental Setup
The analyzed samples consisted of two AWG18 stranded tinned copper wires insulated with XL-ETFE (19 AWG30 strands, 1.52 mm outer diameter, M22759/32-18-9, Raychem-TE Connectivity, Menlo Park, CA, USA). The samples were deliberately damaged by removing 1 mm of insulation as shown in
Figure 4a, according to the specifications of the EN 3475-603:2018 standard. The notches around the entire circumference of the insulation layer of the samples were made with a wire stripping tool (Knipex ErgoStrip, Wuppertal, Germany). Next, the wire samples were cleaned with isopropyl alcohol and secured with lacing tape. Rubber separators were inserted between the wires to prevent partial discharges from occurring outside the test area. During the electrical testing, one wire of the twin wire sample was connected to the high-voltage side of the source while the other was grounded.
The wire degradation setup consisted of an adaptation of the aging process described in the European standard EN 3475-603:2018 for resistance to wet arc tracking. A programmable power supply SP300VAC (0–300 V, ±0.1 V, 15–1000 Hz, 600 W, APM Technologies, Dongguan, China) connected in series with a current limiting resistor (30 Ω, 2 kW) energized the sample wires. An electrolyte delivery system was connected to a needle (G18 gauge, stainless steel), which dropped an aqueous solution of 3% ± 0.5% NH4Cl at a rate of 100 ± 10 mg/min. The application of this aqueous solution to the sample assisted in the generation of arcing activity and accelerated the degradation process of the insulation.
The wire degradation experiments were conducted in a cylindrical low-pressure stainless-steel chamber with the following dimensions: height 375 mm; diameter 260 mm. This chamber had a sealed methacrylate lid, that allowed wireless transmission of the digital surface discharge images from the CMOS imaging sensor to an external computer. Pressure was regulated using a vacuum pump (1/4 HP, 0.085 m3/min, BA-1, Bacoeng, Suzhou, China), while the pressure was measured with a pressure sensor (digital, −1 to 0 bar, ±0.5%, PSD-4, Wika, Sabadell, Catalonia).
The high voltage was generated by connecting the SP300VAC600W programmable AC source to a high-voltage transformer (50 Hz, 1:100 voltage ratio, 36 kV output, VKPE-36, manufactured by Laboratorio Electrotécnico, Cornellà de Llobregat, Catalonia). High-voltage measurements were performed with a high-voltage probe (0–39 kV peak, with a ratio of 0–1000:1, accuracy ≤ 3%, 0 Hz–220 MHz, CT4028, manufactured by Cal Test Electronics, Yorba Linda, CA, USA).
A back-illuminated CMOS image sensor (ISOCELL HP2, 400–700 nm, 1/1.3” sensor size, 0.6 µm cell size, 200 Mpixel, Samsung, Korea) was used to acquire the digital images. The sensor supports raw images and includes a color filter (Tetra2pixel, RGB Bayer Pattern). It is sensitive to visible light and partially sensitive to near ultraviolet light.
Surface discharges were also evaluated using a UV sensor (solar blind, 185–260 nm, UVtron R9533, Hamamatsu Photonics, Hamamatsu City, Japan). The solar blind region was centered in the 240–280 nm UV band [
35]. The UV sensor was driven by a quenching circuit (C10807, Hamamatsu Photonics, Hamamatsu City, Japan), which allowed the sensor to operate safely while minimizing the possibility of false detections due to the built-in signal processing circuit. The sensor was positioned facing the analyzed wires and was connected to a DAQ device (1 kS/s, ± 26 mV, 12 bits, USB-6000, National Instruments, Austin, TX, USA).
Note that both CMOS and UVtron optical sensors have been successfully used in previous research for the early detection of corona and surface discharges at standard and low-pressure conditions [
32,
36].
The experimental tests inside and outside the low-pressure chamber were conducted at 20˚C and 45% relative humidity.
5. Experimental Results
This section describes the experimental results obtained on eight twin wire specimens using the three methods for measuring surface discharges.
5.1. Visible Erosion and Degradation
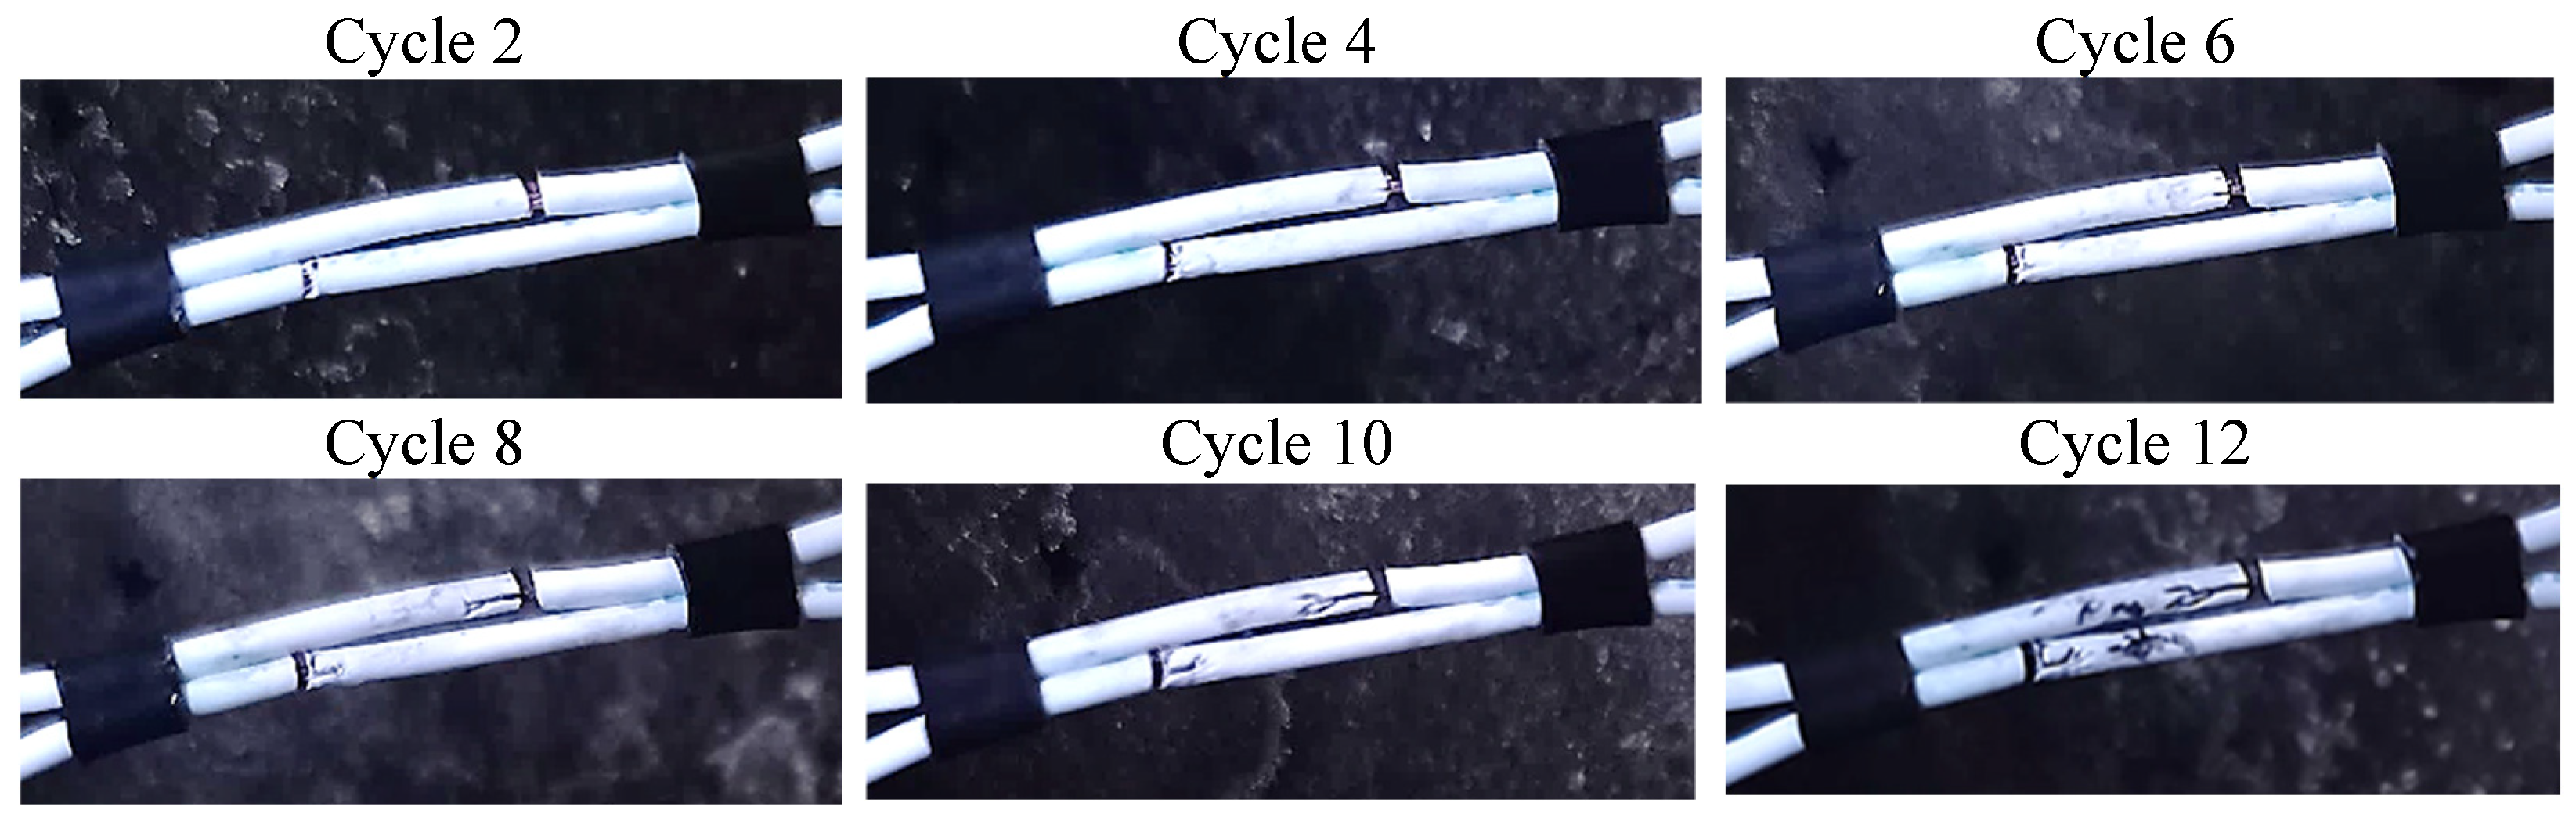
In this work, the degradation behavior of XL-ETFE insulated wires under wet arc tracking conditions was investigated. During the experiment, the samples were subjected to consecutive aging cycles. The electrical stress applied to the wire samples resulted in a progressive degradation in the insulation material. This effect is clearly seen in the images taken after each degradation cycle shown in
Figure 5. In some cases, the degradation manifested as material erosion, which was then followed by the emergence of a tree path. In other samples, the degradation manifested as radial tracks that penetrated directly through the insulation.
5.2. Comparative Analysis of the Three Proposed Methods
After each degradation cycle, surface discharges were generated on the samples. Three indicators were measured, the surface discharge inception voltage (SDIV), the intensity of the images captured by the CMOS sensor, and the intensity captured by the solar blind UV sensor when the reference voltage, i.e., the voltage in the first degradation cycle, was applied. This process was repeated at four different pressure levels, namely 100, 72, 44, and 16 kPa. The reference voltage corresponded to the first CIV value recorded during cycle zero for each pressure level and sample.
To study the degradation of the insulated wires over time,
Figure 6 shows the evolution of the three indicators during the degradation process of eight independent samples.
Figure 6 shows the averages of the four pressure levels, allowing the overall trend of insulation degradation to be seen.
The results presented in
Figure 6 show that each of the eight twin wire samples analyzed underwent a unique degradation process, and thus some samples underwent more degradation cycles to complete failure than the others. Although the results are highly scattered due to the nature of the samples and the degradation process itself, it can be observed that the method based on SDIV gave the most consistent results for all the samples analyzed.
Among the three indicators, the slope of the SDIV showed a consistent negative evolution with the degradation cycle. This trend indicated a decrease in the material’s resistance to surface discharges over time. Conversely, the solar blind UV sensor showed a consistently positive slope, indicating an increase in UV light emission as the degradation process progressed when the same voltage level was applied after each cycle. However, the behavior of the intensity of the images captured by the CMOS sensor did not follow a clear trend as the samples aged. Depending on the sample, the slope of the image intensity may have been positive or negative (see
Figure 6b).
Figure 7 attempts to explain the origin of this variability. The images in
Figure 7 show that in some cases, the discharge area decreased, so the number of pixels with discharge activity also decreased. This could be due to the erosion of the insulation by the tree activity, which reduced the effective area of the insulation. As a result, for a given voltage, although the electric field was enhanced at some points of the insulation, resulting in brighter light being captured by the CMOS sensor, the total area of discharge activity was reduced, thus reducing the number of bright image pixels. In addition, the inherent randomness in the extent of the discharge area introduced further uncertainty into the image intensity measurements. Other factors that could explain the variability of the image intensity with sample degradation are the inherent stochasticity in the discharge phenomenon due to various factors such as the presence of electrolyte droplets and traces, the accumulation of decomposition products, defects in the samples, or temperature variations and random surface changes caused by the arcing effect during the previous degradation cycles.
While the CMOS sensor focuses on the near UV and visible regions, the solar blind UV sensor is sensitive to the more energetic solar blind region of the UV spectrum. Thus, it is possible that only the brighter regions were able to emit photons falling in the solar blind region, making the solar blind UV sensor less affected by the randomness of the extent of the discharge area.
The results presented in
Table 1 show, for the three methods analyzed, the mean slopes
µ (they describe the rate of change in the indicators with the number of degradation cycles) and their standard deviations
σ averaged over the eight samples.
Table 1.
Mean slopes of the linear regressions over the 8 samples shown in
Figure 6.
Table 1.
Mean slopes of the linear regressions over the 8 samples shown in
Figure 6.
| | SDIV | Image Intensity | UV Sensor |
|---|
| | μ | σ | μ | σ | μ | σ |
|---|
| 16 kPa | −0.013 | 0.013 | −1.67·105 | 6.16·105 | 0.304 | 0.575 |
| 44 kPa | −0.028 | 0.016 | −1.06·105 | 8.46·106 | 0.430 | 0.461 |
| 72 kPa | −0.043 | 0.023 | −2.15·105 | 6.51·106 | 0.463 | 0.373 |
| 100 kPa | −0.047 | 0.029 | −2.32·105 | 6.90·106 | 0.457 | 0.372 |
The results in
Table 1 show that the slopes of the SDIV, image intensity, and UV sensor outputs became steeper with increasing air pressure. This trend suggests that these indicators were more sensitive to the degradation effects when the tests were conducted at atmospheric pressure than at low pressure. The results presented in
Table 1 also show that the mean slopes of the solar blind UV sensor output and the image intensity had more dispersion and thus higher
σ/
μ values than did the SDIV, while the
σ/
μ values of the SDIV indicator tended to decrease with increasing pressure. Therefore, it can be concluded that the most reliable method to quantify the degradation of the wires is the SDIV, which has a higher sensitivity at standard pressure.
It is noted that despite the significant scatter in the data, the degradation trend over the degradation cycles can be observed using the evolution of the SDIV, indicating that all samples underwent a progressive degradation process that permanently damaged the insulation. This can be seen by the decrease in the SDIV value as the sample aged.
5.3. Detailed Results of the SDIV-Based Method
In the previous section, it was shown that the SDIV method performed better than the others. Therefore, this section presents all the SDIV data on the eight samples analyzed at the different analyzed pressures, i.e., 16–44–72–100 kPa, over the degradation cycles until the samples failed. These data are summarized in
Figure 8.
To better visualize the degradation effect,
Table 2 summarizes the parameters of the linear regressions of the SDIV values shown in
Figure 8.
As explained earlier, the slope describes the rate of change of the SDIV. The negative slopes of the SDIV vs. cycle curves indicate a tendency for the discharges to occur at lower voltages as the wire specimen aged. From
Table 2, it can be seen that its value increased with increasing pressure, so that at the standard pressure of 100 kPa, the degradation of the samples became more apparent than at the low-pressure operation of 16 kPa. The intercept coefficient, e, corresponds to the SDIV value predicted by the linear model at cycle zero, before the sample was degraded. As expected, the intercept also decreased with decreasing pressure because, as predicted by Peek’s law, the density of air and its dielectric strength decrease at low-pressure operations.
6. Conclusions
In this paper, the degradation behavior of insulated wires was studied using accelerated wet arc tracking tests. It was found that the degradation of the insulation material is progressive and visibly evidenced by material erosion and the formation of tree paths or tracks through the insulation. Insulated wires for low-pressure aircraft applications are currently tested at standard pressure, so this paper analyzed the feasibility of studying the behavior of the samples in low-pressure environments. To this end, three degradation indicators were proposed and analyzed based on the use of optoelectronic sensors. These indicators are based on the surface discharge inception voltage (SDIV), the intensity of the images acquired with a CMOS sensor, and the intensity of the solar blind UV light.
Although the system is fully automated and the environmental conditions are controlled, the reproducibility of wet tests presents several challenges due to several causes. These include issues related to the notches made in the wire specimens, which, although carefully prepared, are always difficult to reproduce. Variability in the material properties of the test specimens, such as the surface finish, thickness, or composition, can lead to inconsistencies in tracking performance, as these properties directly affect the dielectric strength and tracking resistance. In addition, the uneven deposition of the electrolyte solution, whether due to the application process or environmental factors such as humidity and airflow, can result in localized areas of higher conductivity. All of these factors can contribute to premature or unpredictable arcing.
The experimental results showed that, despite the inherent dispersion between samples and degradation cycles, the SDIV performed best, showing an overall decrease along with the degradation process, followed by the intensity measured with the solar blind UV sensor.
A novel aspect of this research was to vary the atmospheric pressures from 100 kPa to 16 kPa (the pressure associated with the cruising altitude of commercial aircraft) to observe changes in the sensitivity of degradation perception. The experimental results presented in this paper show that the sensitivity of the proposed methods is affected by atmospheric pressure, such that higher pressures accentuate the visibility of degradation effects in the form of a greater increase in the intensity captured by the solar blind UV sensor and a greater reduction in the slope of the SDIV value versus the number of degradation cycles (the slope is −0.013 at 16 kPa, while it is −0.047 at 100 kPa). This can be attributed to the fact that at higher pressures, there are more gas molecules, and thus the mean free path of the charge carriers is shorter, resulting in lower energy collisions. This results in less intense excitation and the ionization of the gas molecules, so that when the excited molecules and ions return to lower energy states, they produce less intense light. Therefore, compared to low-pressure operation, more electrical energy is required to produce the same amount of light at standard pressure (100 kPa) than at low pressure (16 kPa). This higher electrical energy input, when applied to the same volume in the insulation sample, could produce more intense effects in the degraded samples, making the slope of the SDIV versus the number of degradation cycles more pronounced.
These results are important because they indicate that although wires must withstand low-pressure environments, tests conducted at standard pressure provide a better assessment of insulation degradation than those conducted at low pressure. In addition, standard pressure tests are easier to perform and require a less complex setup. This approach could also potentially be used to detect and quantify electrical failures by identifying early signs of wire insulation degradation.


