Article

Experimental Investigation on the Critical Dynamic Stress of Frozen Silty Clay Under Different Temperature and Moisture Conditions

1
College of Civil Engineering, Nanjing Forestry University, Nanjing 210037, China
2
School of Civil Engineering, Qingdao University of Technology, Qingdao 266033, China
*
Author to whom correspondence should be addressed.
Appl. Sci. 2024, 14(23), 11419; https://doi.org/10.3390/app142311419
Submission received: 12 September 2024 / Revised: 25 November 2024 / Accepted: 6 December 2024 / Published: 8 December 2024
(This article belongs to the Special Issue Geotechnical Engineering and Infrastructure Construction)

Abstract

:
In this paper, a comprehensive series of dynamic triaxial tests were conducted to delve into the influence of temperature and moisture content on the behavior of frozen silty clay. Upon scrutinizing the experimental outcomes under prolonged reciprocal cyclic loading, insights were gained into how varying temperatures and moisture contents impact the cumulative permanent strain (CPS) and critical dynamic stress (CDS) of frozen clay. The results show that the variation curves of CPS with the number of cyclic loadings show significant changes at different temperatures and moisture contents. Additionally, based on the assessment of vertical CPS recorded at the 100th and 1000th loading iterations, criteria for assessing the plastic stability and plastic creep threshold of frozen silty clay were devised. Consequently, an analysis was conducted to delineate the correlation between the variation in vertical cumulative strains and the dynamic stresses applied within the frozen clay, resulting in the formulation of a series of correlation curves. The relationship between the changes in CDS affected by different temperatures and water contents were analyzed. The CDS under the plastic stability and plastic creep limits showed a slowly increasing trend with decreasing temperatures and a slowly decreasing trend with increasing water contents.

1. Introduction

With global warming, the deterioration of long-lasting permafrost within the Qinghai–Tibet Plateau region has an impact on the stability of transportation roadbeds [1]. Since the construction of the Qinghai–Tibet Railway, the problem of settlement and deformation of the roadbed has become increasingly serious due to the effects of cyclic loading and climate [2,3]. Scholars have studied the annual average ground temperature of permafrost along the Qinghai–Tibet Railway, such as the average ground temperature range at different depths and based on that, divided the permafrost regions [4,5]. Permafrost exhibits a pronounced sensitivity to temperature fluctuations, and as a result, variations in temperature and water content can significantly alter its engineering behavior and performance characteristics [6]. Some scholars studied temperature and moisture content influence on mechanical behavior of permafrost along the Qinghai–Tibet Railway [7,8]. The construction of transportation projects in permafrost areas inevitably changes the water-heat exchange conditions in the soil, which is also one of the key factors affecting the stability of permafrost, so it is necessary to carry out a research on the influence of temperature and water content on the dynamic characteristics of permafrost roadbeds of Qinghai–Tibet Railway.
The problems of frozen soil roadbed stability, mechanical properties, and permanent deformation have always been the hotspots concerned by engineering construction in cold regions [9,10,11,12,13,14,15]. Zhao et al. [16] conducted a comprehensive study on the frozen chalk soil of roadbeds in the Qinghai–Tibetan Plateau, utilizing low-temperature cyclic dynamic triaxial testing to unravel the intricate variations in dynamic shear modulus and damping ratio of the frozen soil under various conditions of temperature, water content, compaction, and confining pressure during graded cyclic loading. Wu et al. [17] embarked on a thorough examination of the dynamics of remolded permafrost in the Qinghai–Tibet Engineering Corridor, utilizing dynamic triaxial testing to elucidate the intricate interplay between the damping ratio and dynamic shear modulus ratio of the permafrost under cyclic loading, as modulated by factors such as confining pressure, temperature, water content, and loading frequency. Wu et al. [18] performed triaxial tests on high-salt content frozen powdery clay sourced from the Xinjiang region, delving into its deformation behavior and strength properties across varying confining pressures and temperatures, they assessed the suitability of the refined Duncan–Chang model and the parabolic strength criterion in the context of high-salt permafrost, offering valuable insights into the material’s mechanical response. Numerous scholars from both domestic and international realms have embarked on numerical simulation endeavors, aiming to elucidate the intricate mechanical and deformation characteristics exhibited by frozen clay, these studies have provided valuable insights into the material’s behavior under various conditions [19,20,21]. Tang et al. [22] developed a numerical model to simulate the settlement of the Qinghai-Tibet Railway's permafrost roadbed caused by train vibrations. This model enabled an in-depth analysis of how varying factors, including roadbed height, thickness of ice-rich permafrost, and the site’s initial annual average ground temperature, influence the settlement and accumulation of permanent deformation in the multi-year permafrost roadbed. Shastri et al. [23] conducted isotropic and shear tests on natural permafrost samples from Alaska to investigate the strength properties of permafrost at different temperatures and perimeter pressures and developed an elasto-plastic model to analyze the mechanical tests of permafrost, which was applied to describe the compressive collapse behavior of permafrost foundations. Freezing and thawing cycles of permafrost roadbeds in cold regions also affect the stability of roadbeds [24,25,26,27,28]. Zhou et al. [29] selected seasonal permafrost in Northwest China as the research object and investigated the strength, stiffness, viscous properties, and damage evolution of specimens under freeze–thaw cycle conditions based on low-temperature triaxial test. Li et al. [30] conducted experiments on permafrost subjected to varying numbers of freeze–thaw cycles, along with impact loading tests performed at different strain rates, with the objective of investigating the mechanical behavior of permafrost under impact forces subsequent to freeze–thaw cycling. The serviceability of roadbed soil is significantly influenced by its mechanical properties, with the dynamic stability of the soil primarily governed by the CDS it can withstand [31]. Zhao et al. [32] proposed a critical stress ratio formula considering the effects of salt content and perimeter pressure based on triaxial tests on frozen salt-flour clay and introduced the critical stress ratio and boundary surface shape parameters to characterize the pressure melting and crushing properties of frozen soils under high perimeter pressure. Zhou et al. [33] conducted comprehensive triaxial dynamic experiments on frozen soil, meticulously examining the cumulative and elastic deformation characteristics exhibited under diverse cyclic loading conditions. Their analysis delved into the intricate influences of consolidation pressure, dynamic stress amplitude, dynamic loading waveform, initial stress path, and initial stress ratio on the cumulative and elastic deformation of the frozen soil specimens. While extensive domestic and international research has been undertaken to investigate the CDS and cumulative permanent deformation of non-permafrost materials [34,35], the corresponding studies on permafrost remain relatively scarce. Notably, most of the existing permafrost-focused studies are confined to numerical simulation approaches [36,37,38], so there is a pressing need to embark on research endeavors specifically targeting the CDS of permafrost.
In essence, the scientific community has undertaken a substantial body of research on the deformation behavior and mechanical properties of permafrost under mechanical testing. However, the majority of these studies have primarily centered their attention on the dynamic shear modulus and damping ratio of permafrost subjected to dynamic loading conditions. Comparatively, there is a scarcity of research examining the CDS and CPS of permafrost under dynamic loading in diverse environmental contexts. Drawing upon the frozen clay specimens sourced from the Qinghai–Tibet Railway’s frozen soil subgrade, this paper investigates the influence of varying temperatures and water contents on the CPS and CDS of frozen soil under prolonged cyclic loading conditions, utilizing a low-temperature dynamic triaxial test. The findings of this study hold significant implications and could contribute valuable insights to the construction and experimental endeavors of subsequent projects in cold region environments.

2. Test Material and Methods

The experiments were performed at the National Key Laboratory of Soil Engineering, located in Lanzhou, Gansu Province, China. The experimentation adhered to the guidelines outlined in the Chinese Standard for Soil Test Method (GB/T 50123-2019) [39].

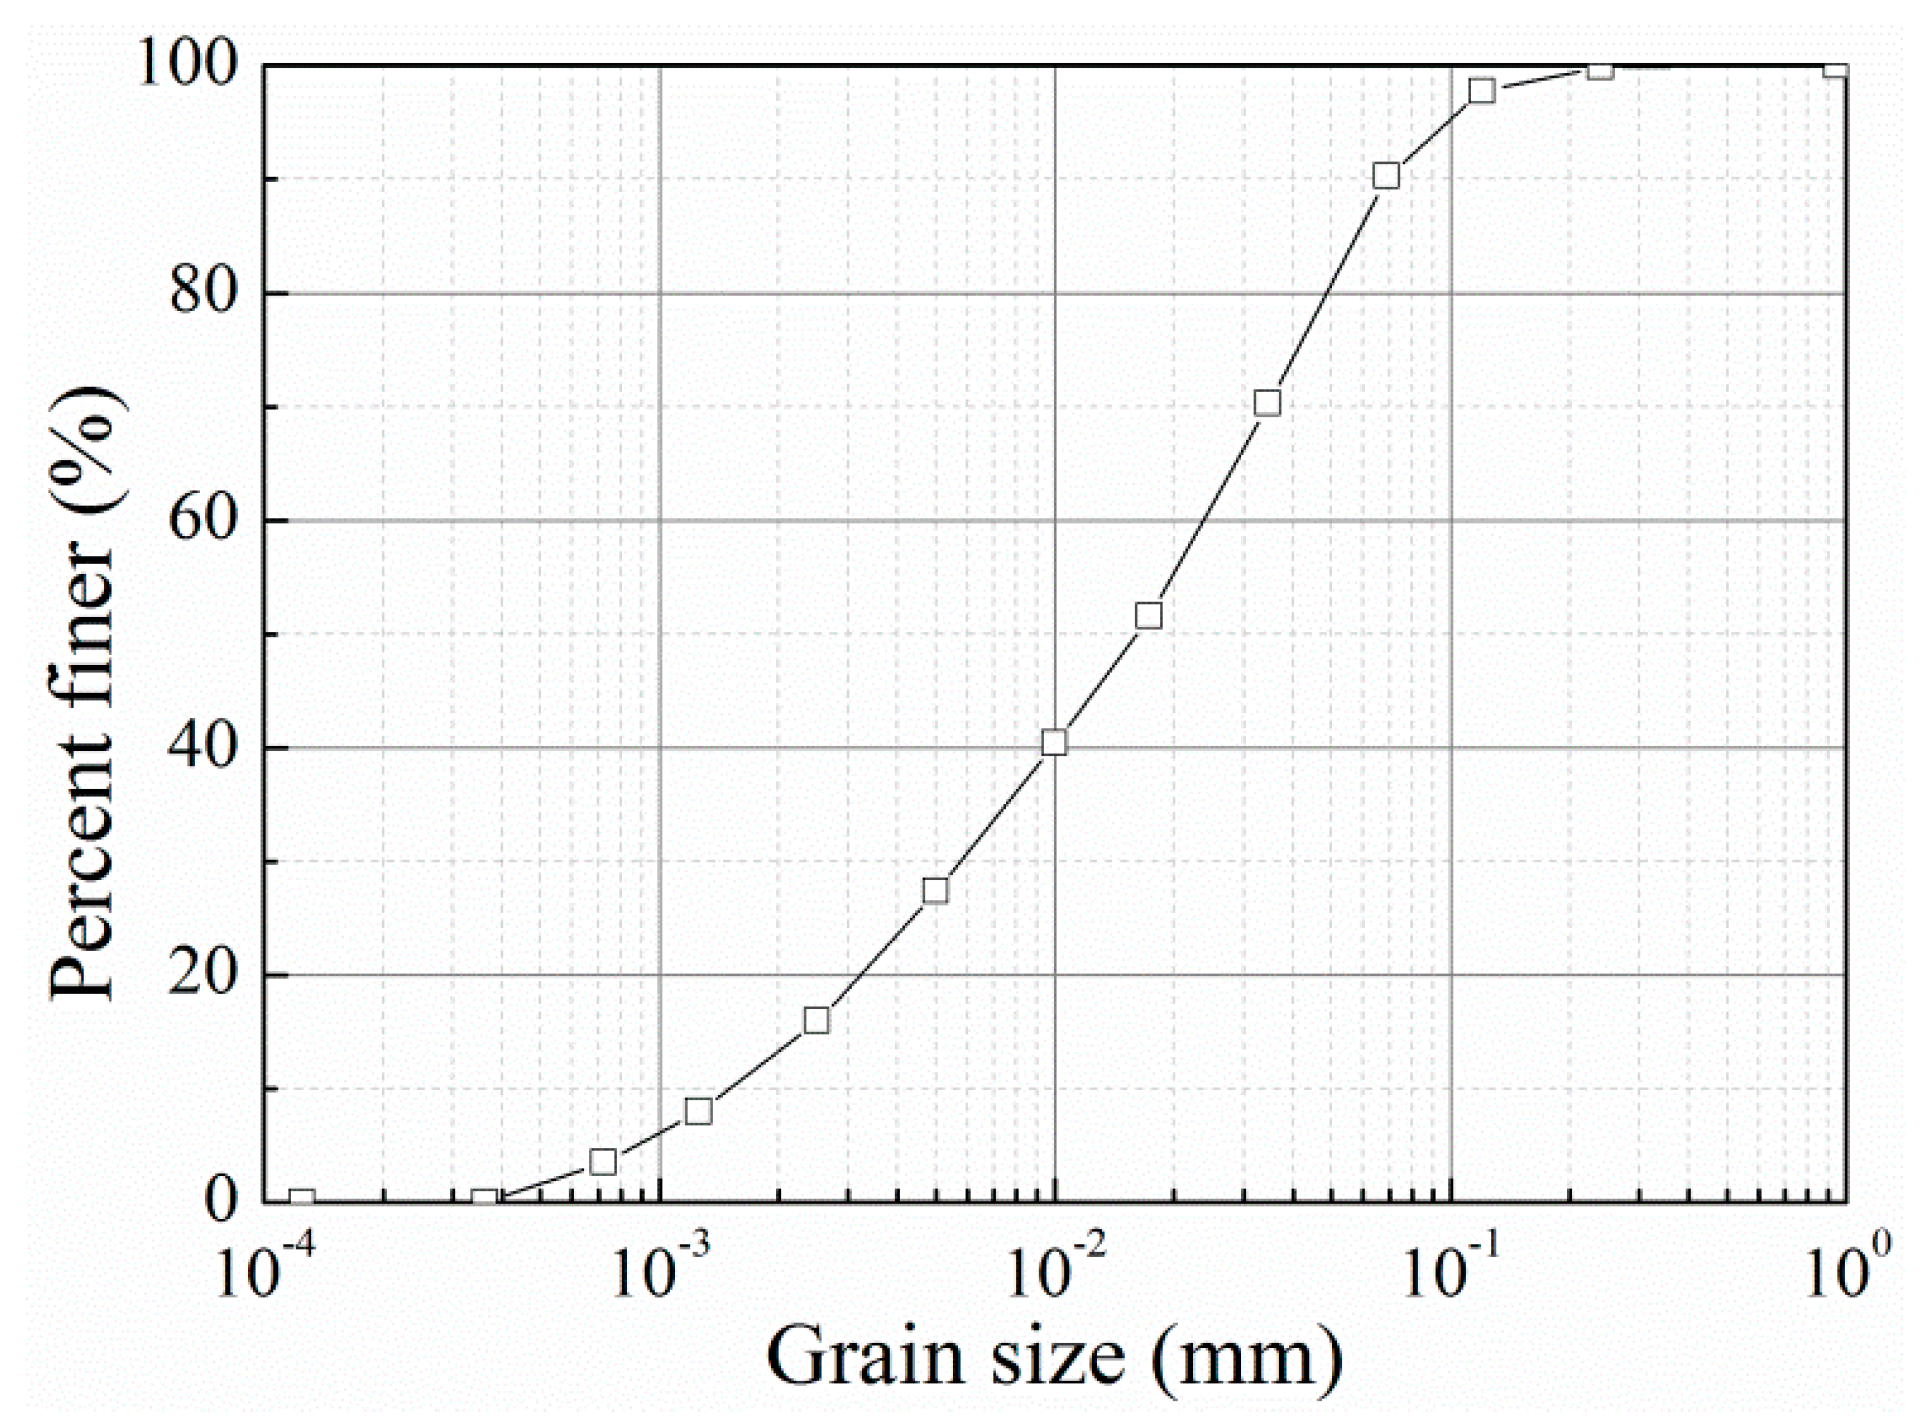
2.1. Soil and Specimen Preparation

The distribution of grain sizes pertaining to the test material, sourced entirely from the Qinghai–Tibet Railway of China, is depicted in Figure 1, The test material comprises representative silty clay, characterized by a maximum dry density of 1.85 g/cm3, an optimal moisture content of 14%, a liquid limit of 19.5%, and a plastic index of 8%. Standard compaction tests were conducted to determine the maximum dry density and optimum moisture content, in accordance with the Chinese Code for Soil Test of Railway Engineering (TB10102-2010) [40]. The specimen preparation protocol entails the following steps: with a targeted moisture content and weight, the silty clay was initially prepared, and subsequently compacted into cylindrical soil specimens measuring 61.5 mm in diameter and 125 mm in height, utilizing a displacement-controlled apparatus. The specimens, which were confined within a three-piece steel mold, underwent rapid freezing at a temperature of −30 °C for a duration of 12 h. Following demolding and encapsulation within a rubber membrane, each specimen underwent immersion in a thermotank, maintained at varying test temperatures, for a minimum period of 24 h.

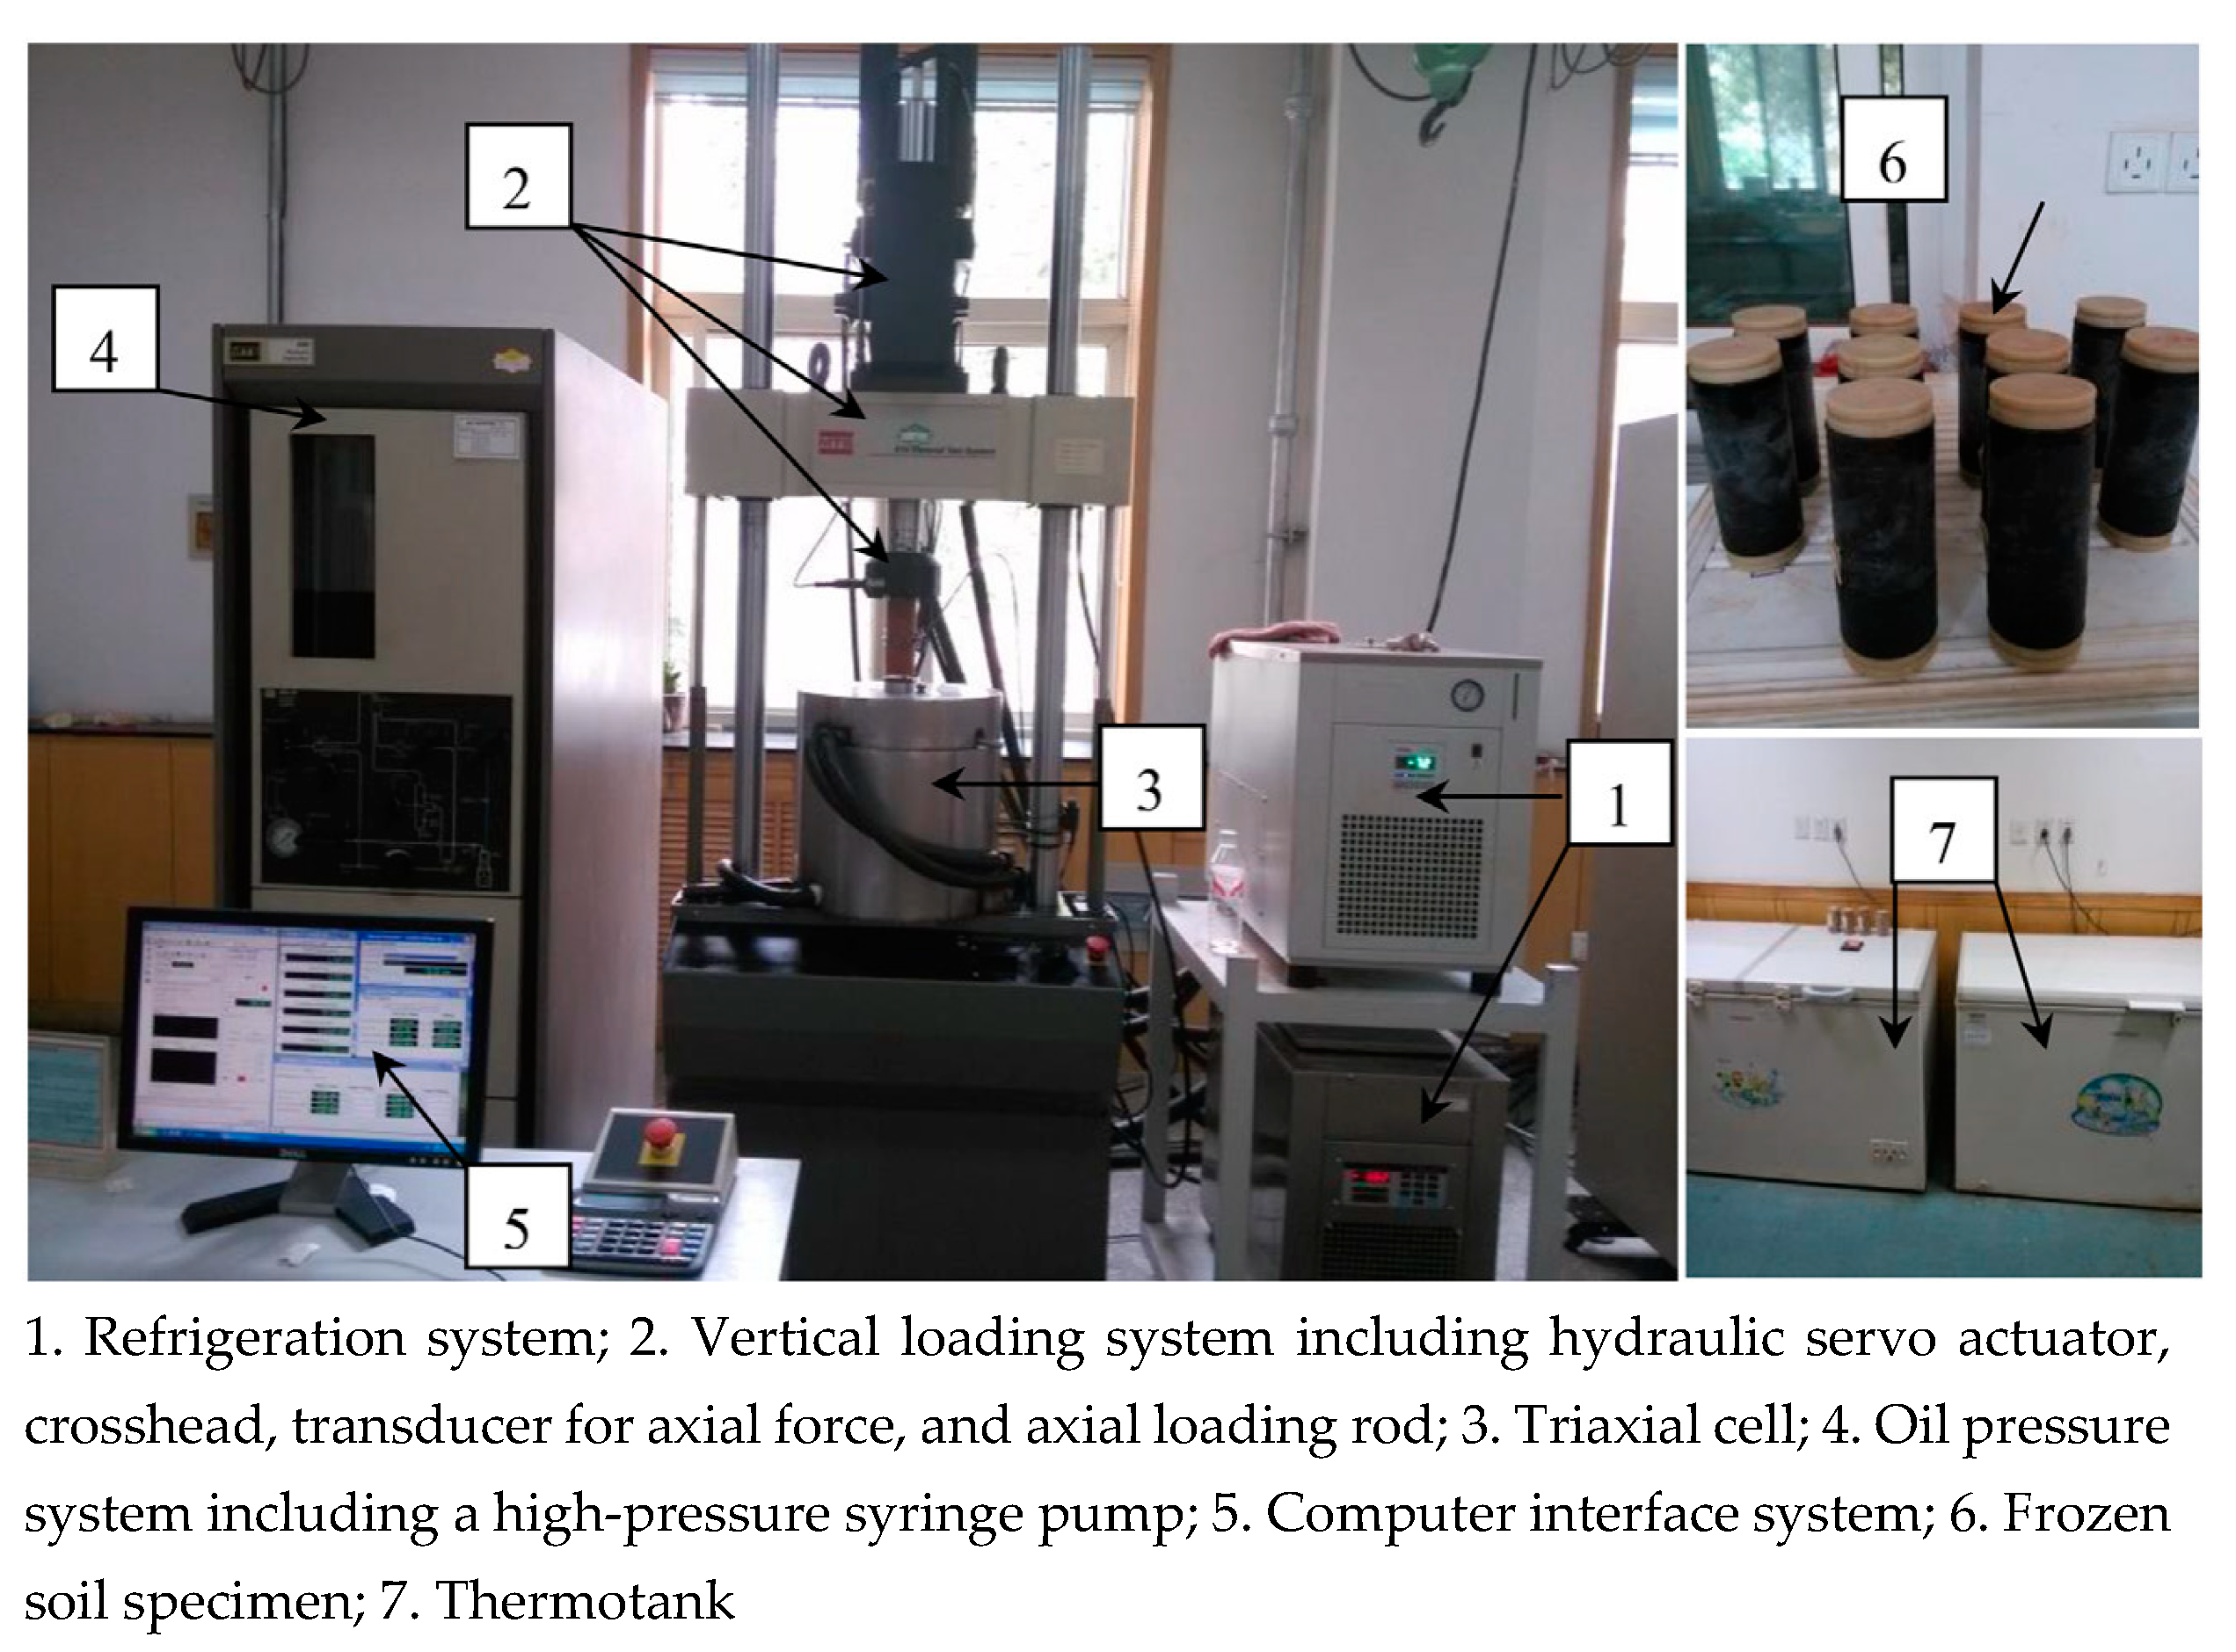
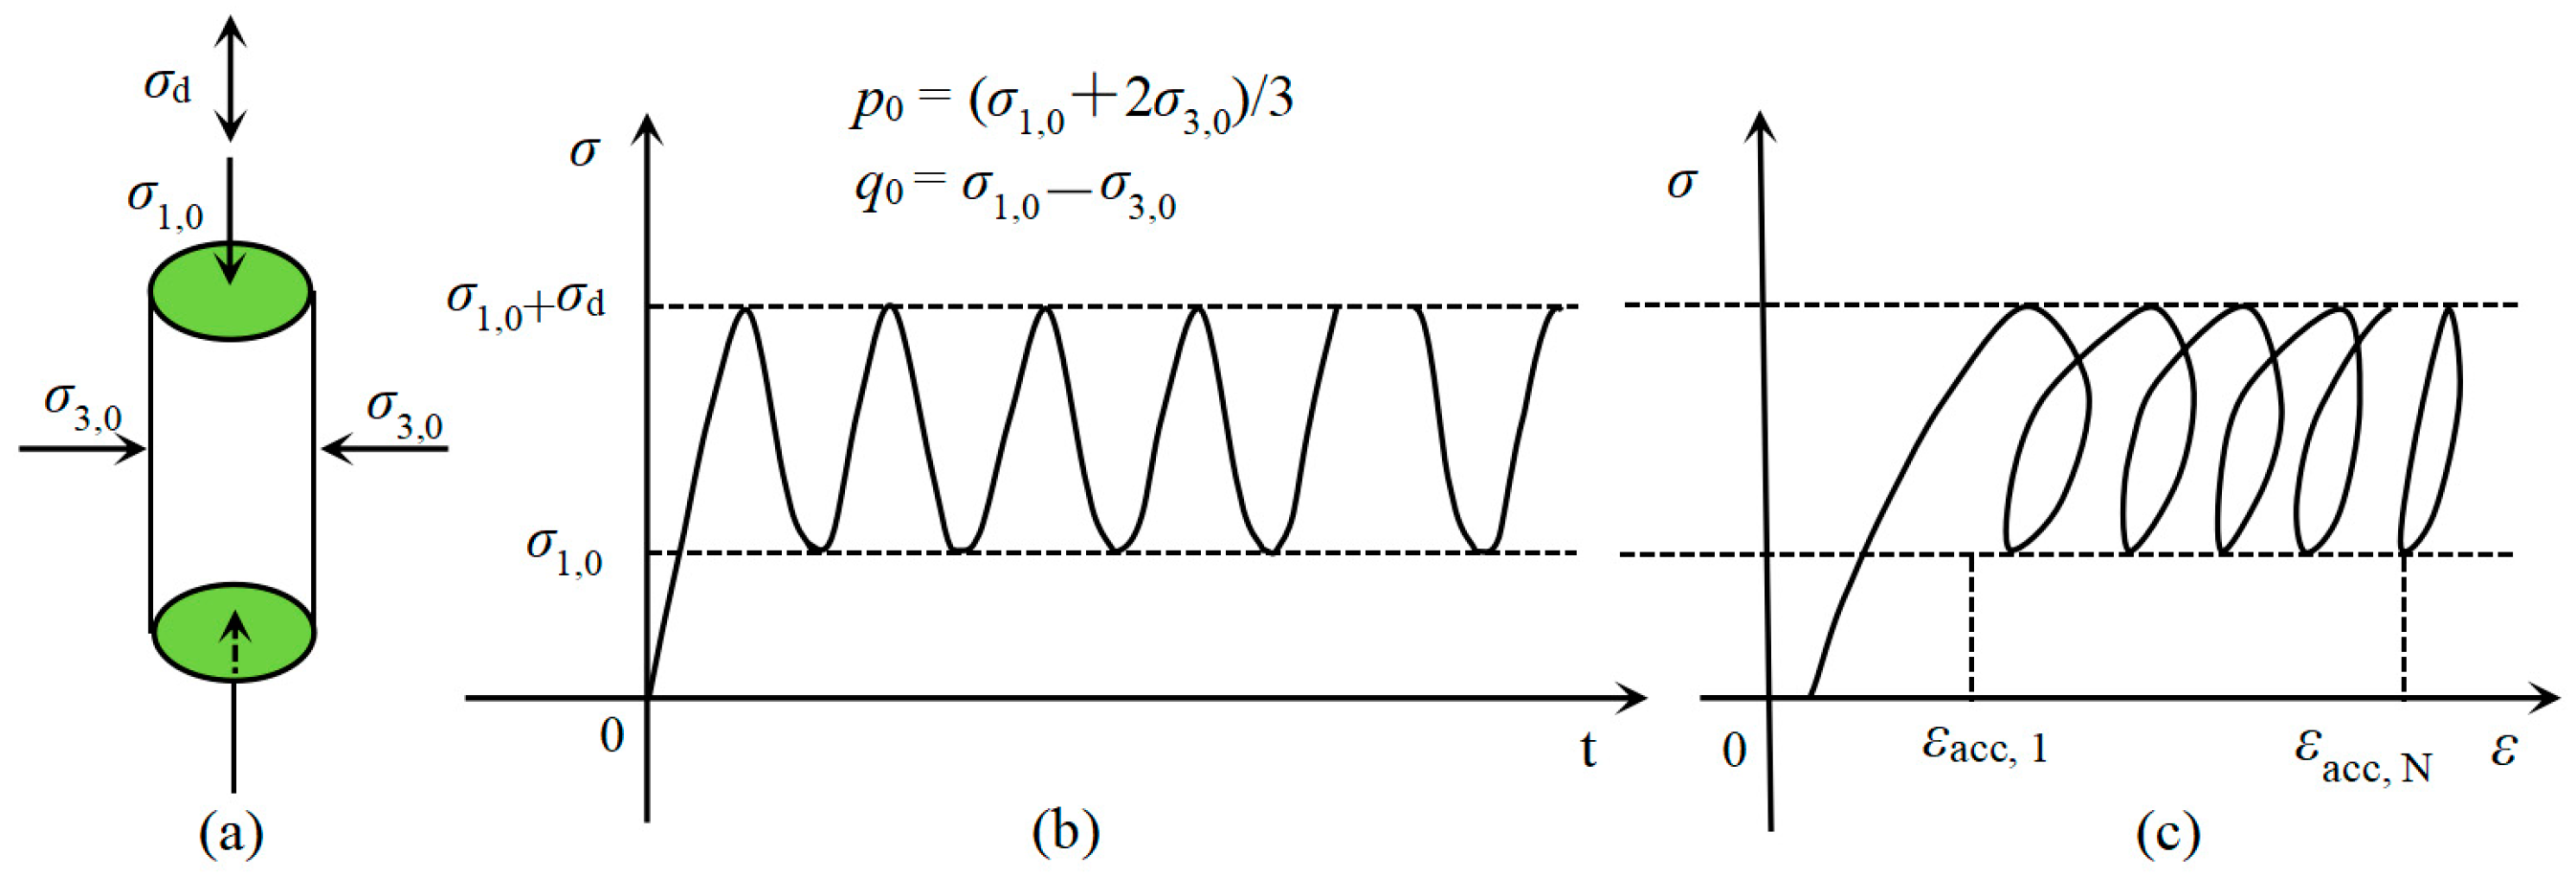
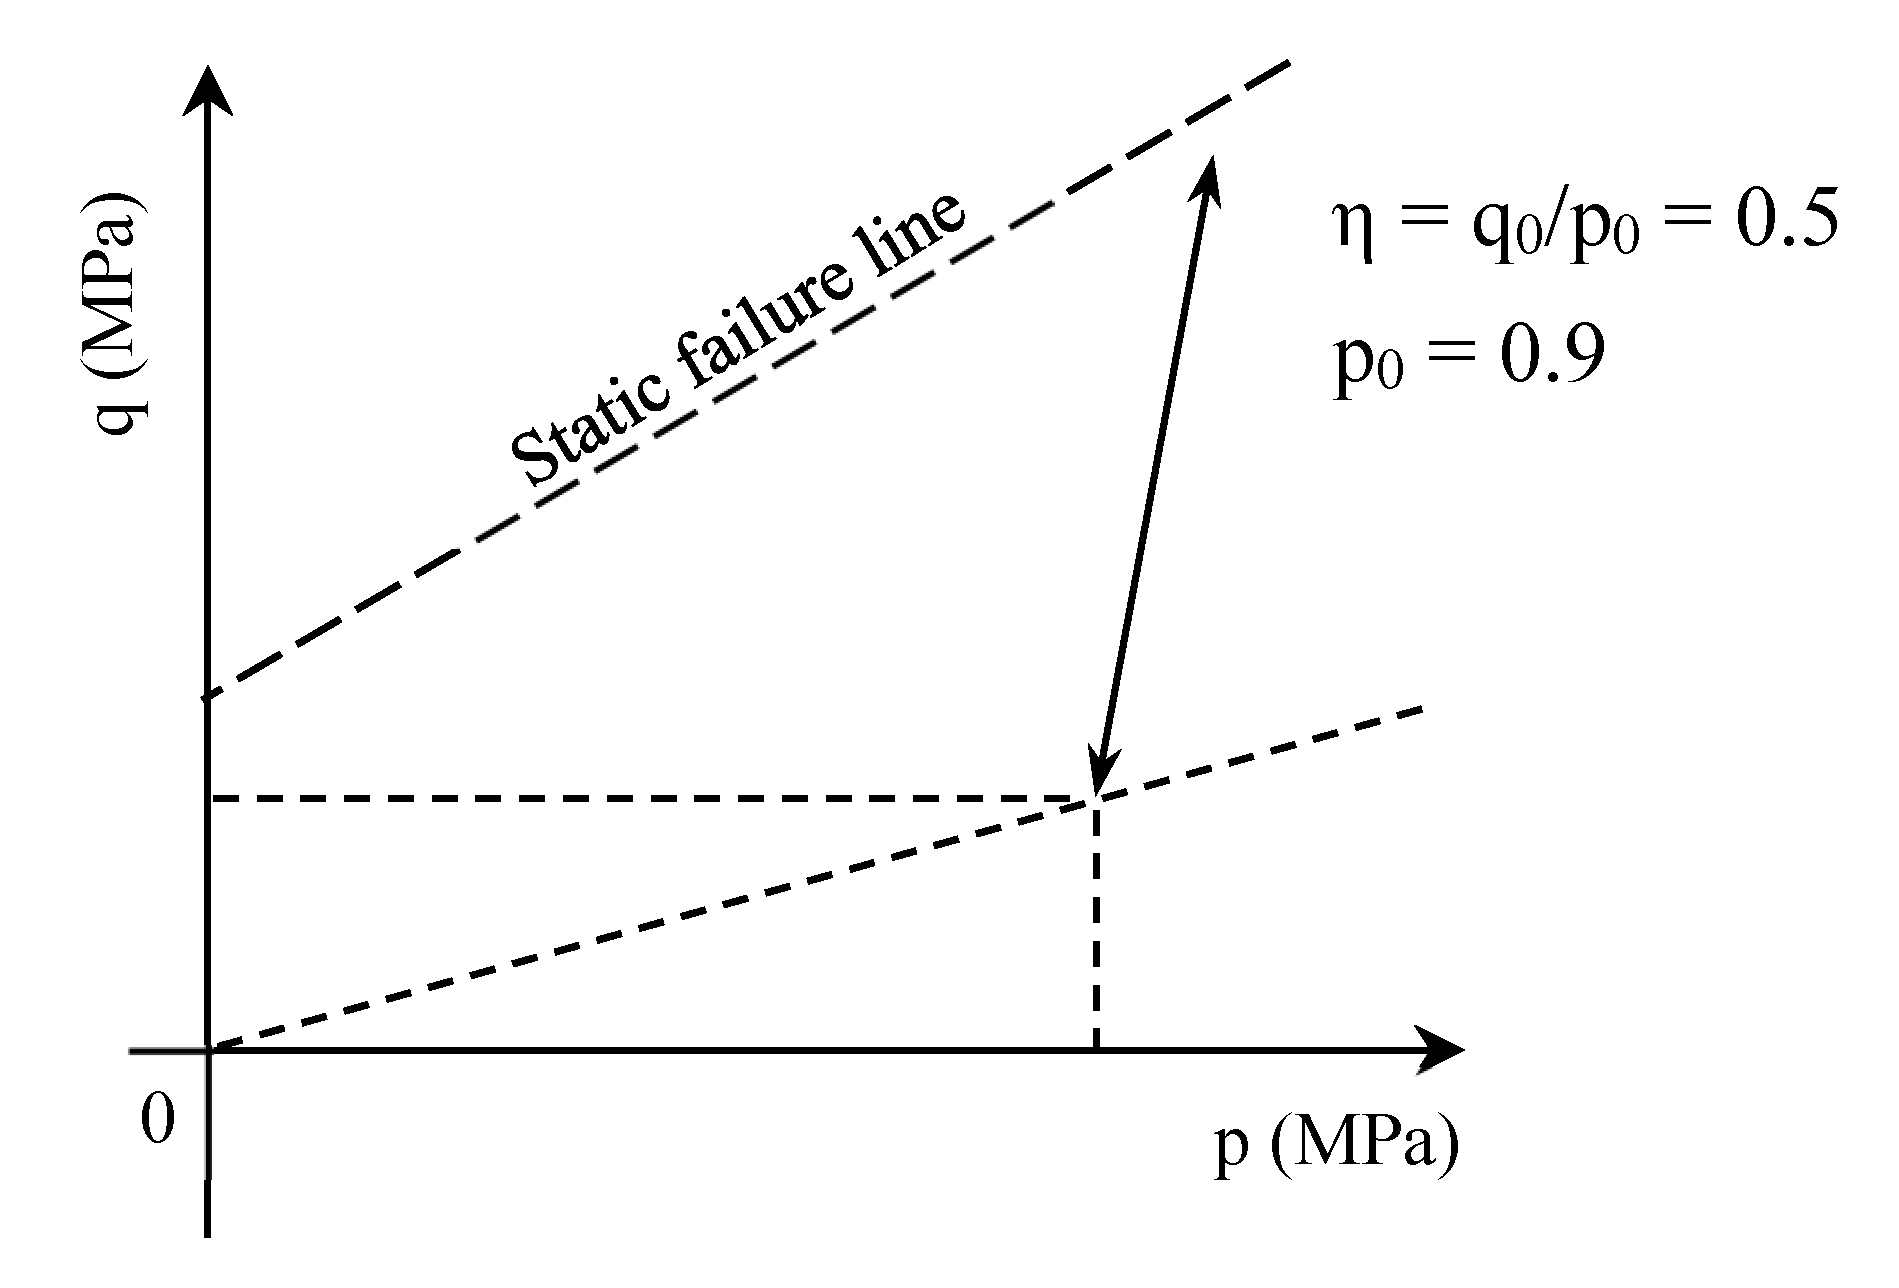
2.2. Experimental Procedure and Operational Conditions

The experiment utilized the MTS-810 dynamic triaxial system manufactured by MTS Systems Corporation, located in Minneapolis, Minnesota, USA, to study the dynamic properties of frozen soil. The dynamic triaxial apparatus is shown in Figure 2. The testing system mainly consists of five parts: a refrigeration system, a vertical loading system, a triaxial chamber, an oil pressure system, and a computer interaction system. Initially, the prepared specimen was introduced into the triaxial cell and subjected to a preload under initial stress for a duration of 10 min prior to the commencement of the experiment. Figure 3 illustrates the repetitive loading pattern applied to frozen soil in the form of a sine wave, alongside the corresponding deformation calculations, σ1,0, σ3,0, and σd represent the initial axial stress, initial confining pressure, and the amplitude of the repetitive stress, respectively. As a result of residual strain, the graph depicting the axial stress–strain relationship under repeated cyclic loading, is presented in Figure 3c. It is recognized that the hysteresis curve incorporates both the unloading and reloading curves. Therefore, the initial loop is formed by the conjunction of the unloading curve from the first loading cycle and the loading curve of the subsequent second loading cycle. Similarly, the Nth loop is constructed by combining the unloading curve from the Nth loading cycle with the loading curve of the (N + 1)th loading cycle. As a result, the accumulated axial strains εacc,1 for the first loop and εacc,N for the Nth loop are depicted in Figure 3c. Scenarios involving cycles exceeding 1000 are classified as long-term loading conditions. The test termination criteria are either reaching 20,000 cycles or achieving a maximum vertical strain of 20%.
The specific loading conditions are outlined in Table 1, η0 is the initial stress ratio, p0 is the initial mean stress, q0 is the initial bias stress and ω is moisture content. As depicted in Figure 4, p0 and η0 remain constant, with the primary focus being on the key factors of sample moisture content and testing temperature. For each test series, the soil samples are subjected to varying amplitudes of repeated stress under stress-controlled conditions, while maintaining a constant loading frequency of 2 Hz, an initial mean stress of 0.9 MPa, and an initial stress ratio of 0.5. The loading frequency of 2 Hz falls within the range of long-term vibrations caused by railways and highways, and it is a commonly adopted frequency in research [14,41,42]. In the previous article, the mechanical properties of low-temperature stabilized remolded frozen soil from the Qinghai–Tibet Railway using a reference temperature of −5 °C and an optimal moisture content of 14% are studied. To investigate the impact of different temperatures and moisture contents on the mechanical properties of frozen soil samples, we selected temperatures of −3 °C, −7 °C, −9 °C, −11 °C, and −13 °C near the reference temperature to study the effects of varying temperatures. The liquid limit and plastic limit of the soil samples are 19.5% and 11.5%, respectively. Therefore, we selected several representative moisture contents within this liquid–plastic limit range for our research.
The notion of rocking has been employed to scrutinize the enduring deformation characteristics of granular materials subjected to cyclic loading. Notably, Werkmeister’s modification criterion categorizes the material’s response into three distinct groups [43], as depicted in Figure 5, namely, Plastic Shakedown (line 1), Plastic Creep (line 2), and Incremental Collapse (line 3).

3. Results and Discussions

As we have already explored the mechanical properties of frozen soil samples with a moisture content of 14% and a temperature of −5 °C under initial stress conditions in our previous articles, this chapter will further investigate the impact of varying temperatures and moisture contents on the mechanical properties of frozen soil samples, without considering this specific moisture content (14%) and temperature (−5 °C). A thorough analysis of the test data revealed the pattern of cumulative permanent deformation as it varied with the number of loading cycles and stress levels, under varying conditions of temperature and moisture content. Based on the stability theory and combined with the classification criterion of permanent deformation behavior under cyclic loading, the cumulative strain behavior of frozen silty clay was systematically classified, and the deformation characteristics of different kinds were deeply discussed. Utilizing the provided calculation guidelines pertaining to the plastic behavior, stability, and creep limits under various initial stress states, the CDS were ascertained for soil samples exhibiting different physical properties under the experimental conditions. Subsequently, an analysis was conducted to assess the effects of temperature and moisture content on the emergence of these CDS.

3.1. Permanent Deformation

Pursuant to the testing protocol detailed in Table 1, the characteristics of permanent deformation exhibited by permafrost are illustrated in Figure 6 and Figure 7. As evident from Figure 6, under a fixed initial stress state and varying temperatures of −7 °C, −9 °C, −11 °C, −13 °C, and −3 °C, the cumulative axial strain evolution of permafrost subjected to cyclic reciprocating loads is illustrated. Figure 7 illustrates the pattern of cumulative axial strain evolution in frozen soil subjected to cyclic loading, with a constant initial stress state and different moisture content percentages of 11%, 12.5%, 18.5%, and 15.5%, respectively.

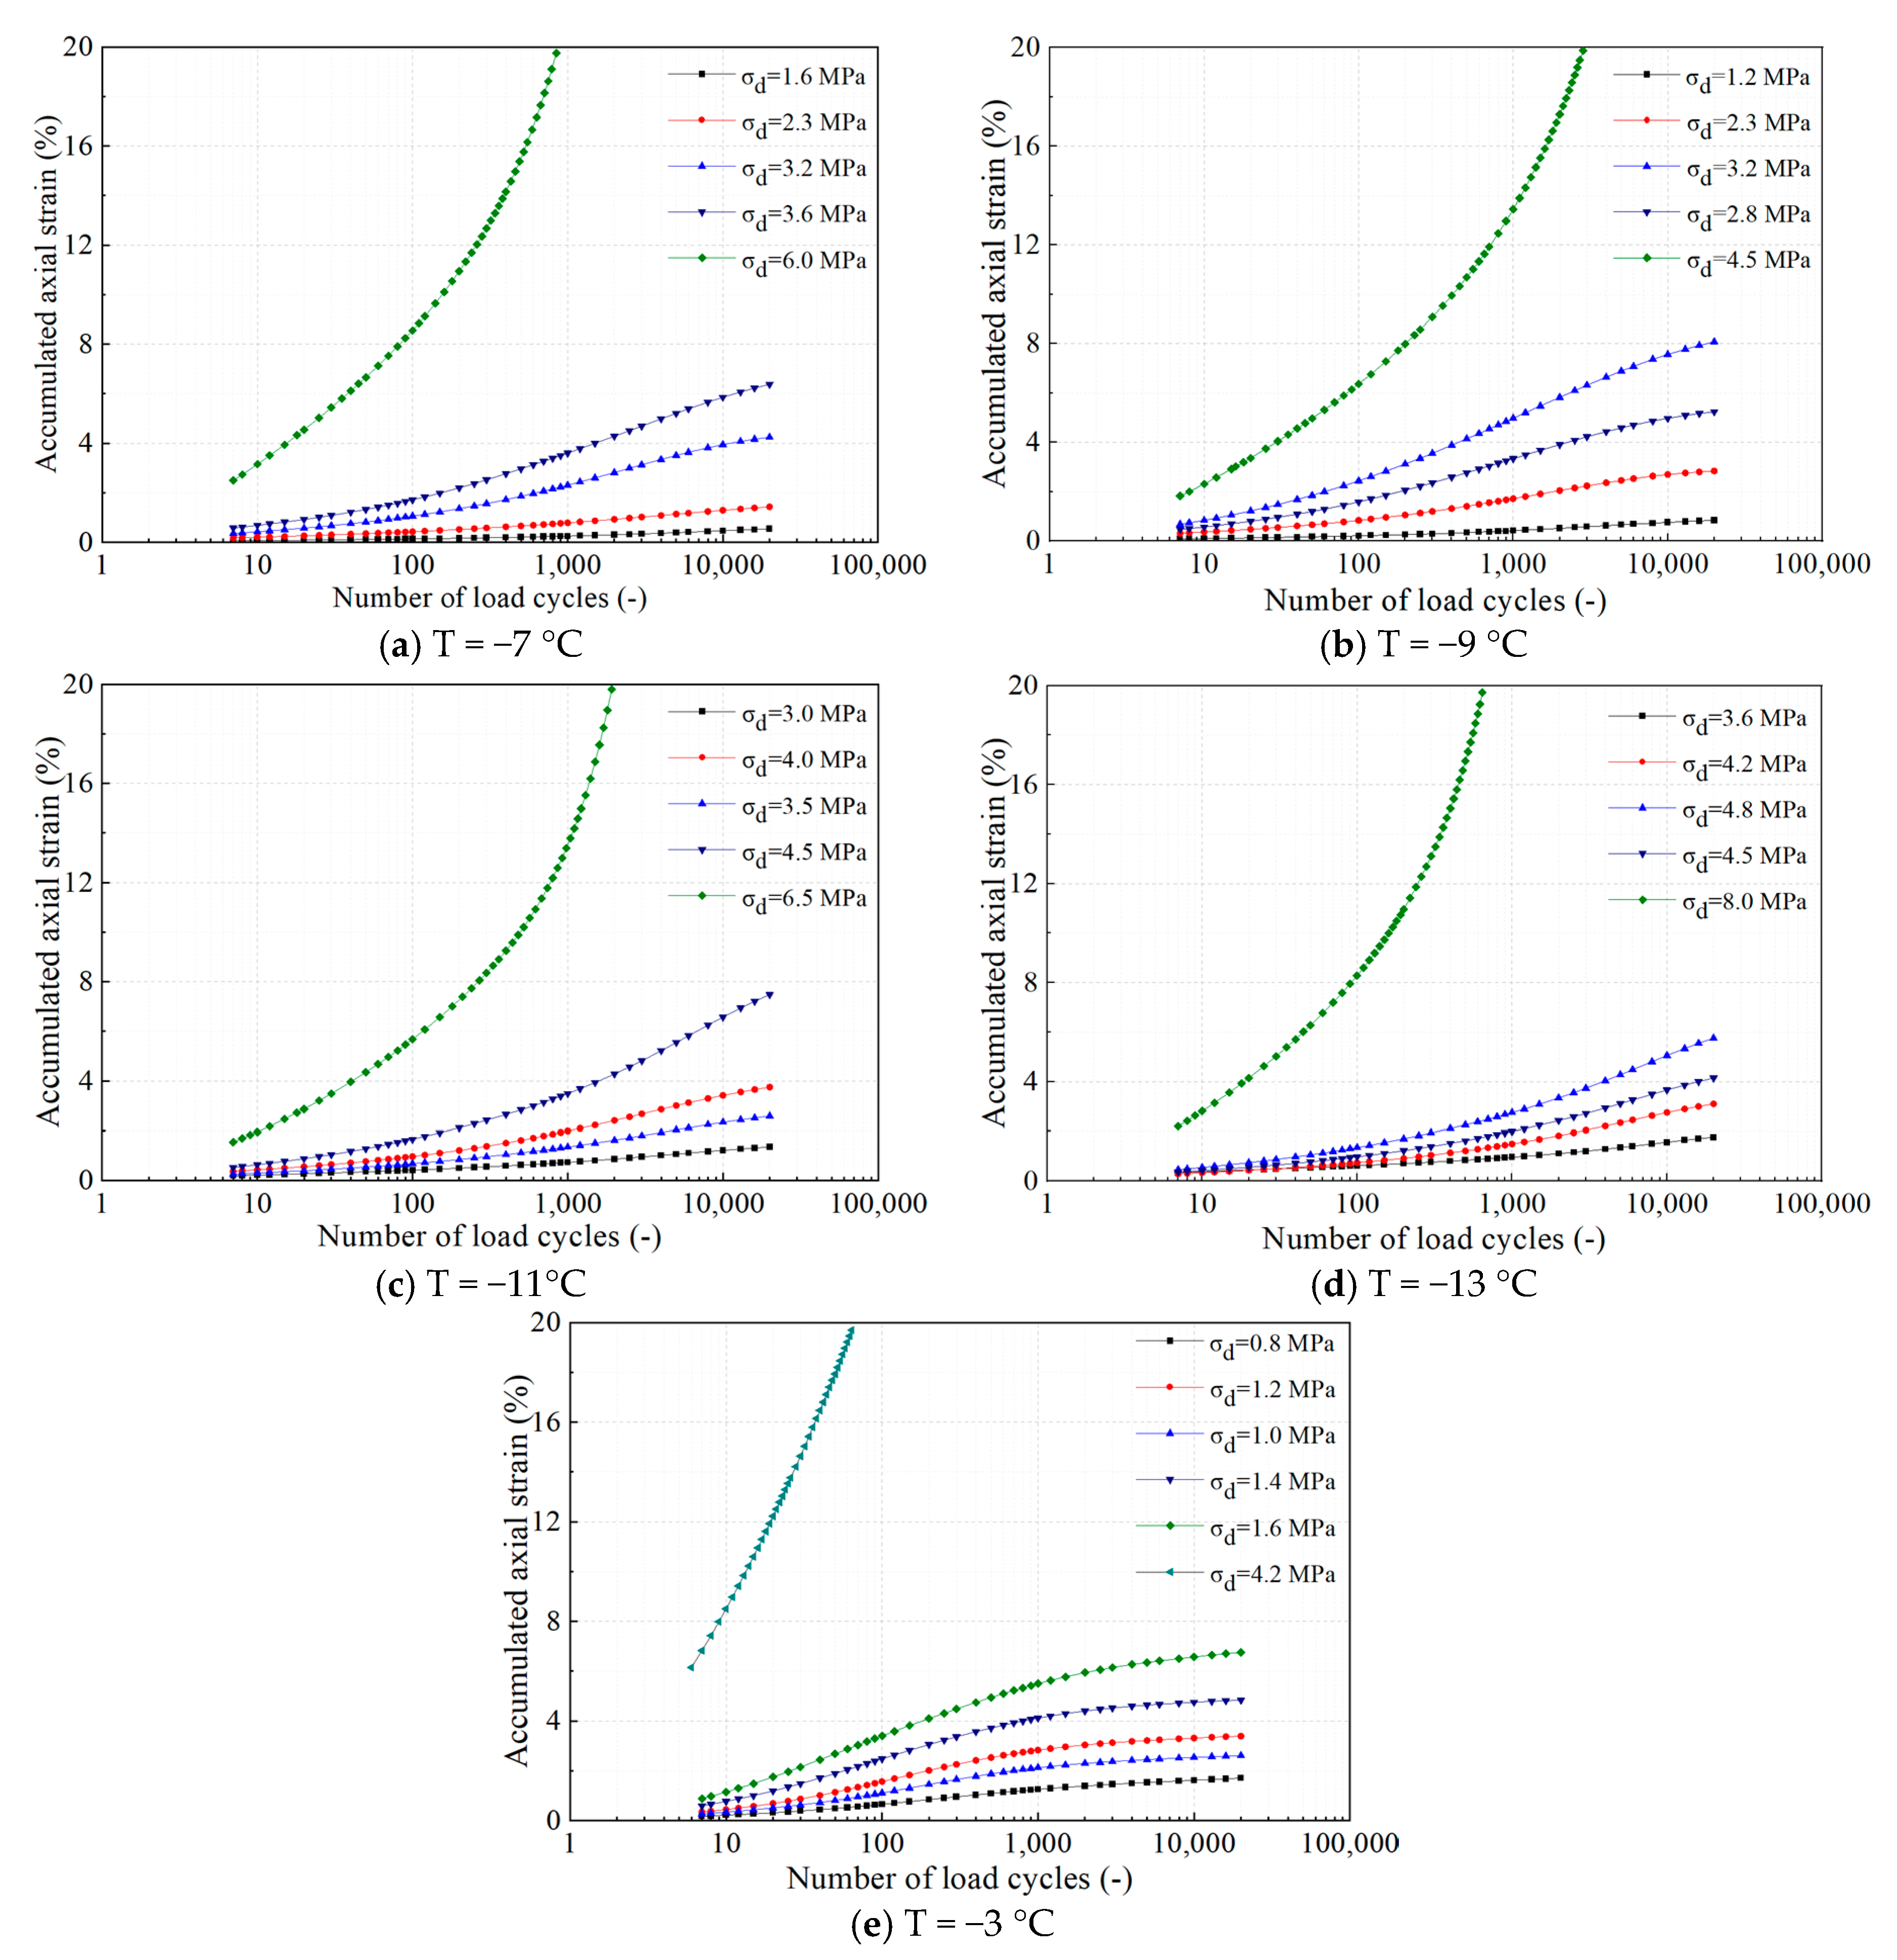
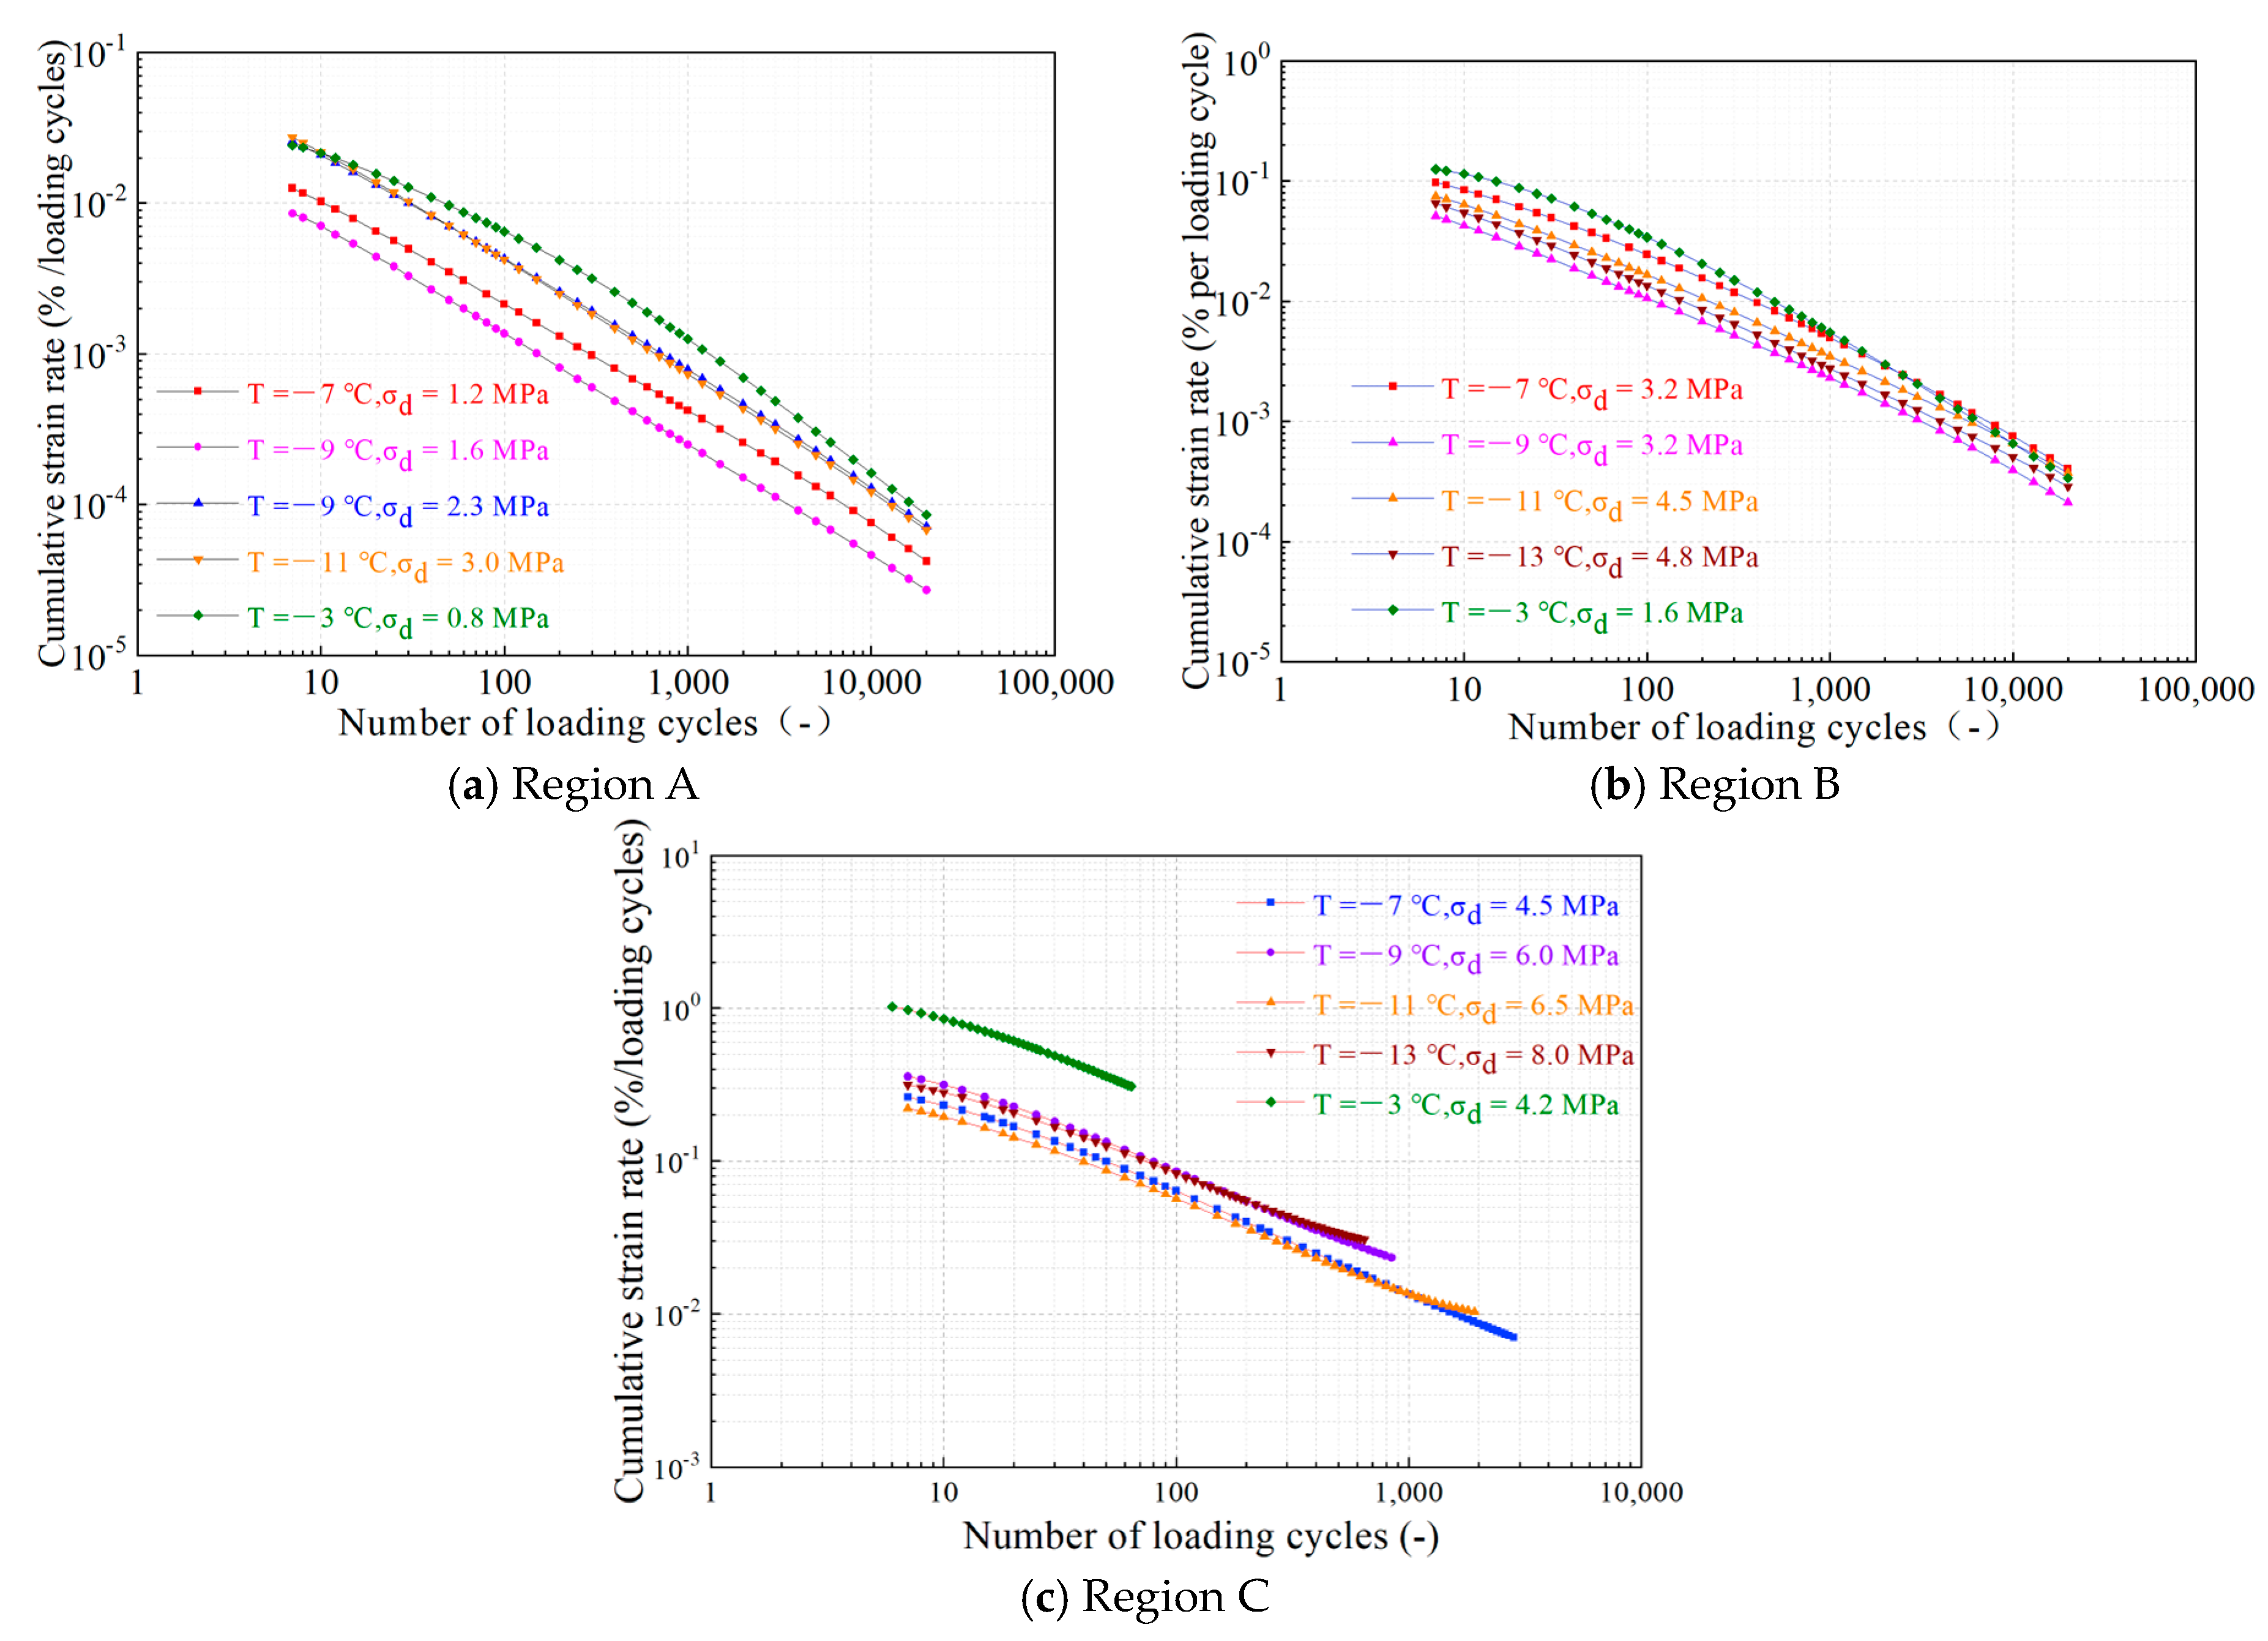
3.1.1. Temperature Impact

Figure 6 depicts the dependence of cumulative axial strain on the number of loading cycles, as influenced by various temperature conditions. Under conditions of an initial stress ratio η0 of 0.5, p0 set at 0.9 MPa, a moisture content of 14%, and a temperature of −7 °C, Figure 6a represents the diverse profiles of cumulative axial strain plotted against the increasing number of loading cycles, for distinct dynamic stress amplitude levels. Under dynamic stress amplitudes of 1.2 MPa and 2.3 MPa, the cumulative axial strain progressively intensifies with an increase in loading cycles, ultimately reaching a discernible plateau in its growth rate. The respective εacc,20000 values, corresponding to these conditions, are 0.84% and 2.84%. The curves could be categorized as the first type, which is similar to line 1 [43]. When σd reaches 2.8 MPa and 3.2 MPa, the cumulative axial strain escalates at a faster pace, achieving εacc,20000 values of 5.23% and 8.07%, respectively. The subsequent trend of the cumulative axial strain curve, as the number of loading cycles increases, may indicate creep damage, aligning these curves with the second type, akin to line 2 [43]. At a dynamic stress amplitude of 4.5 MPa, the cumulative axial strain undergoes a rapid increase with each loading cycle. The 2835th loading iteration marked the conclusion of the test, as it met the termination threshold of 20% of the peak vertical strain. The recorded curves align with the third category, displaying similarities to the behavior patterns of line 3 [43]. Similar classification of the curves could be performed in Figure 6b–e, etc. corresponding to the temperature conditions of −9 °C, −11 °C, −13 °C vs. −3 °C, etc., and would not elaborate further here.

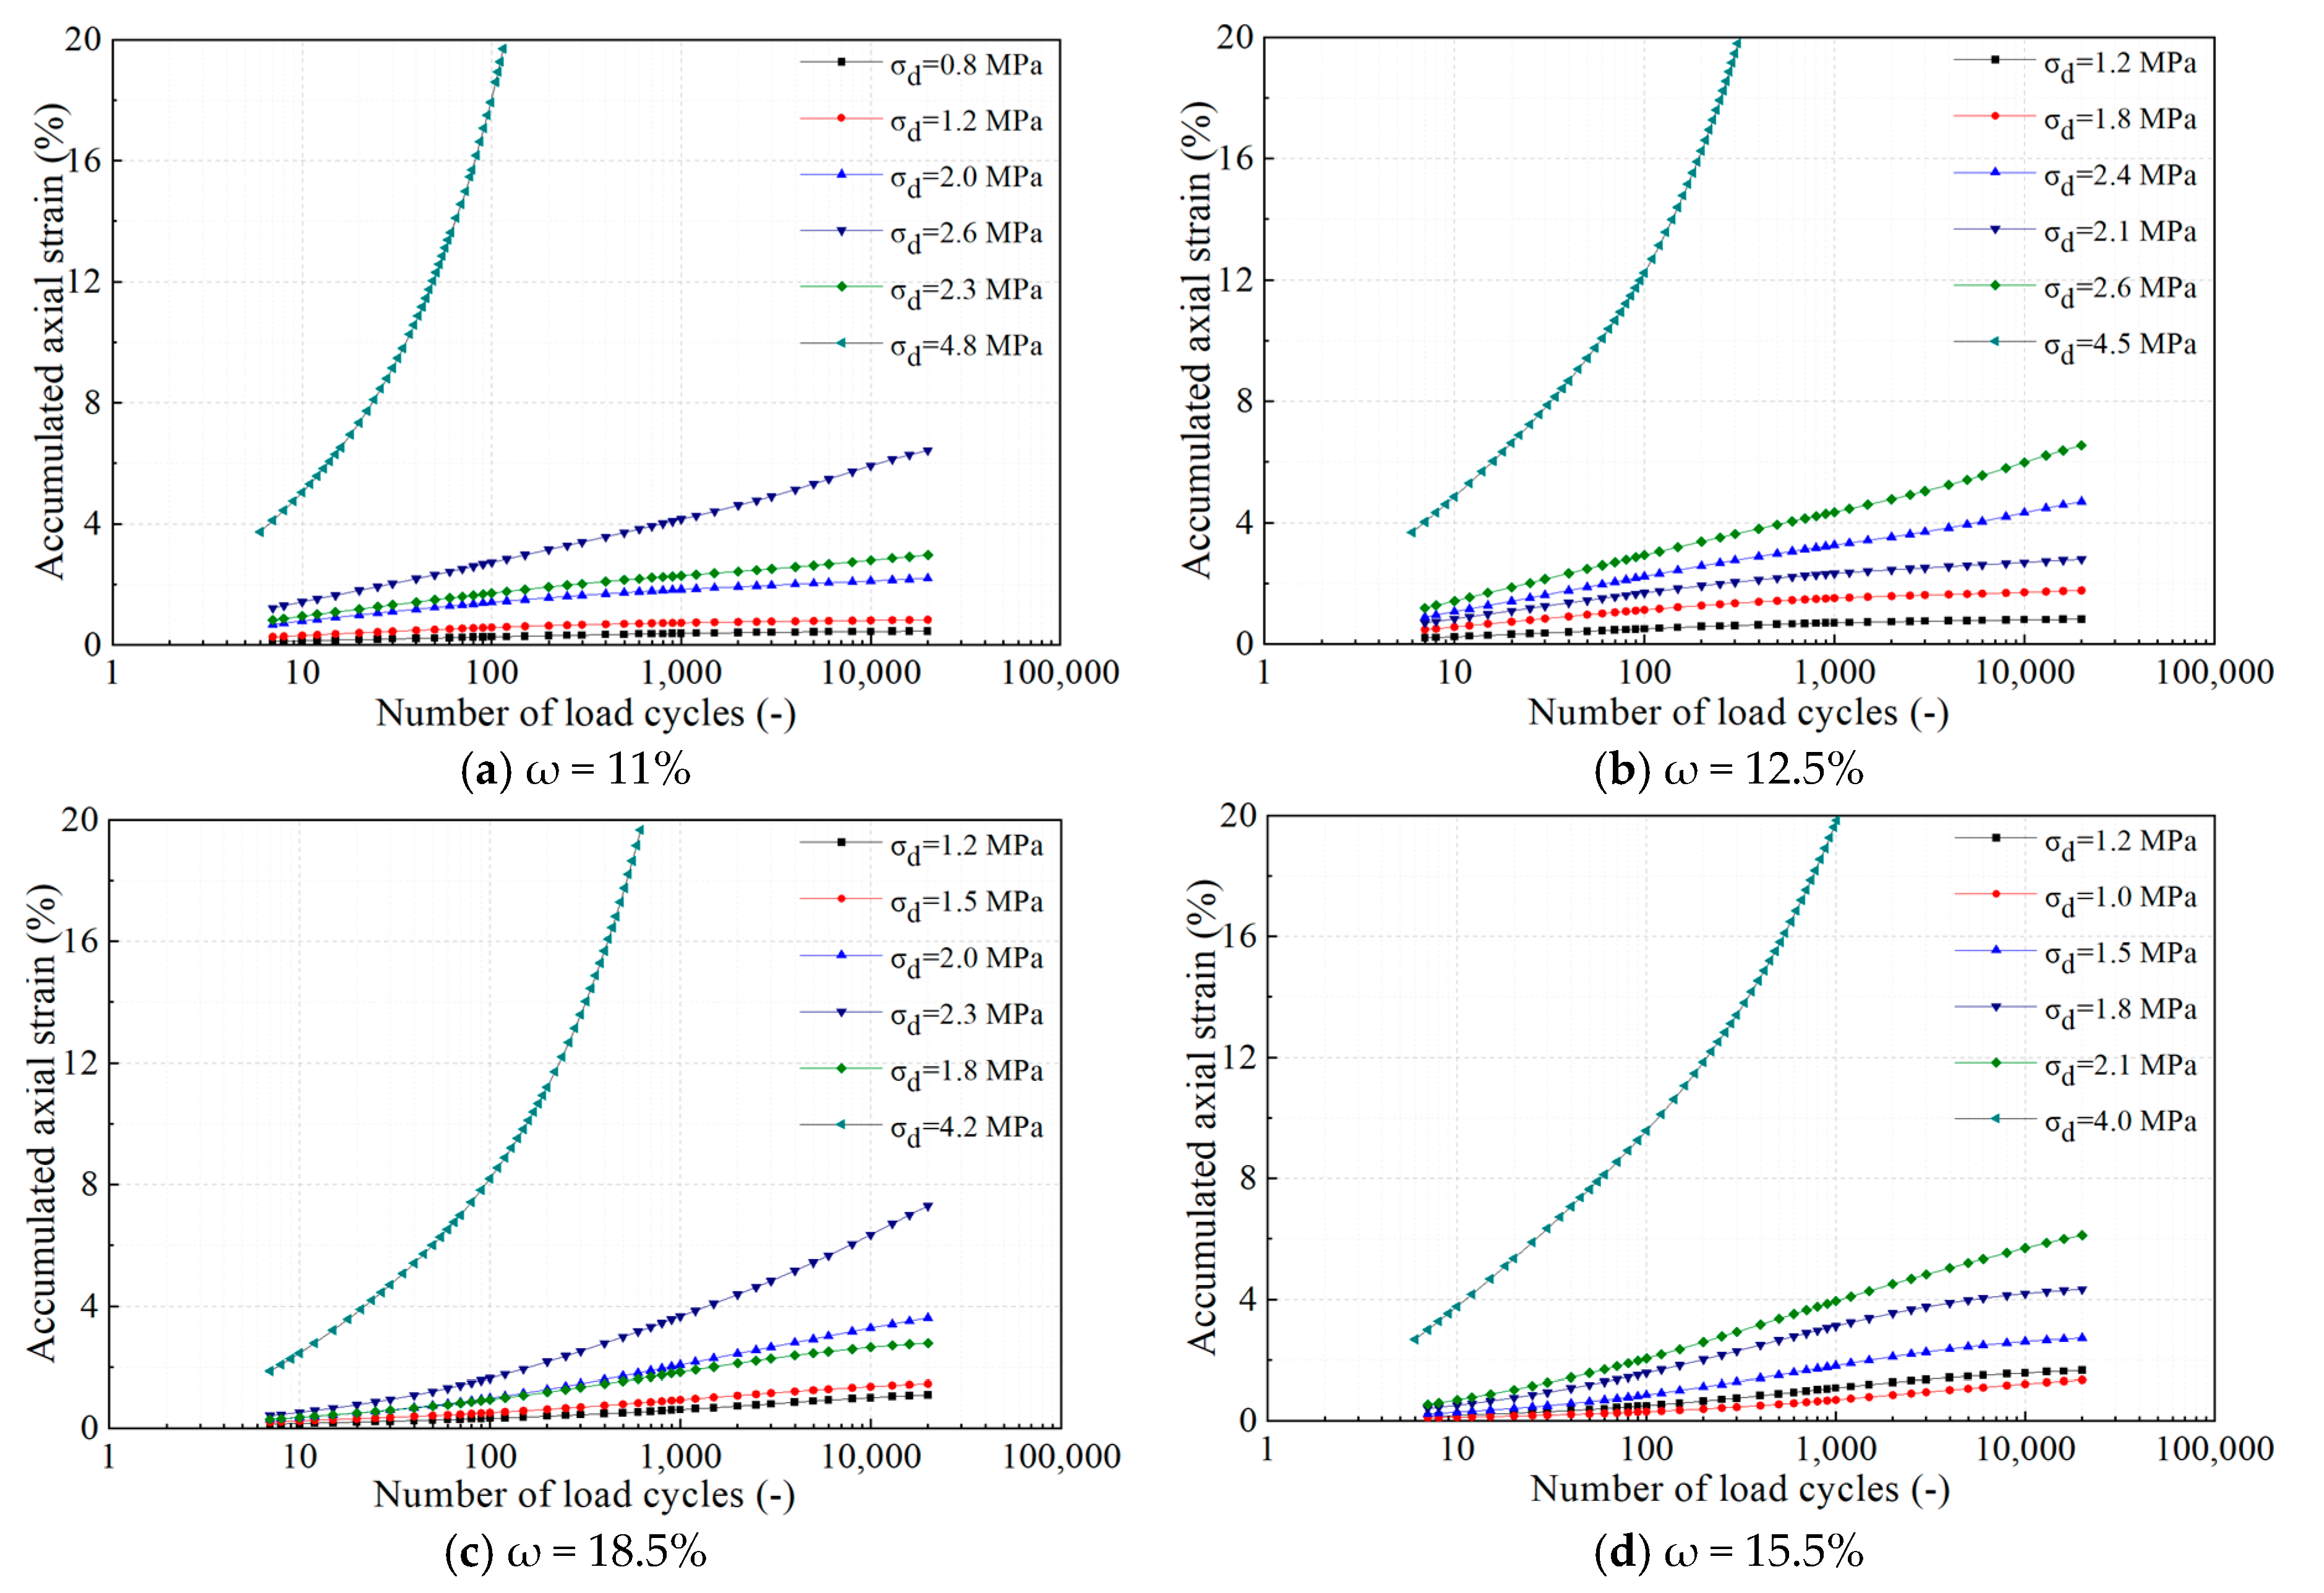
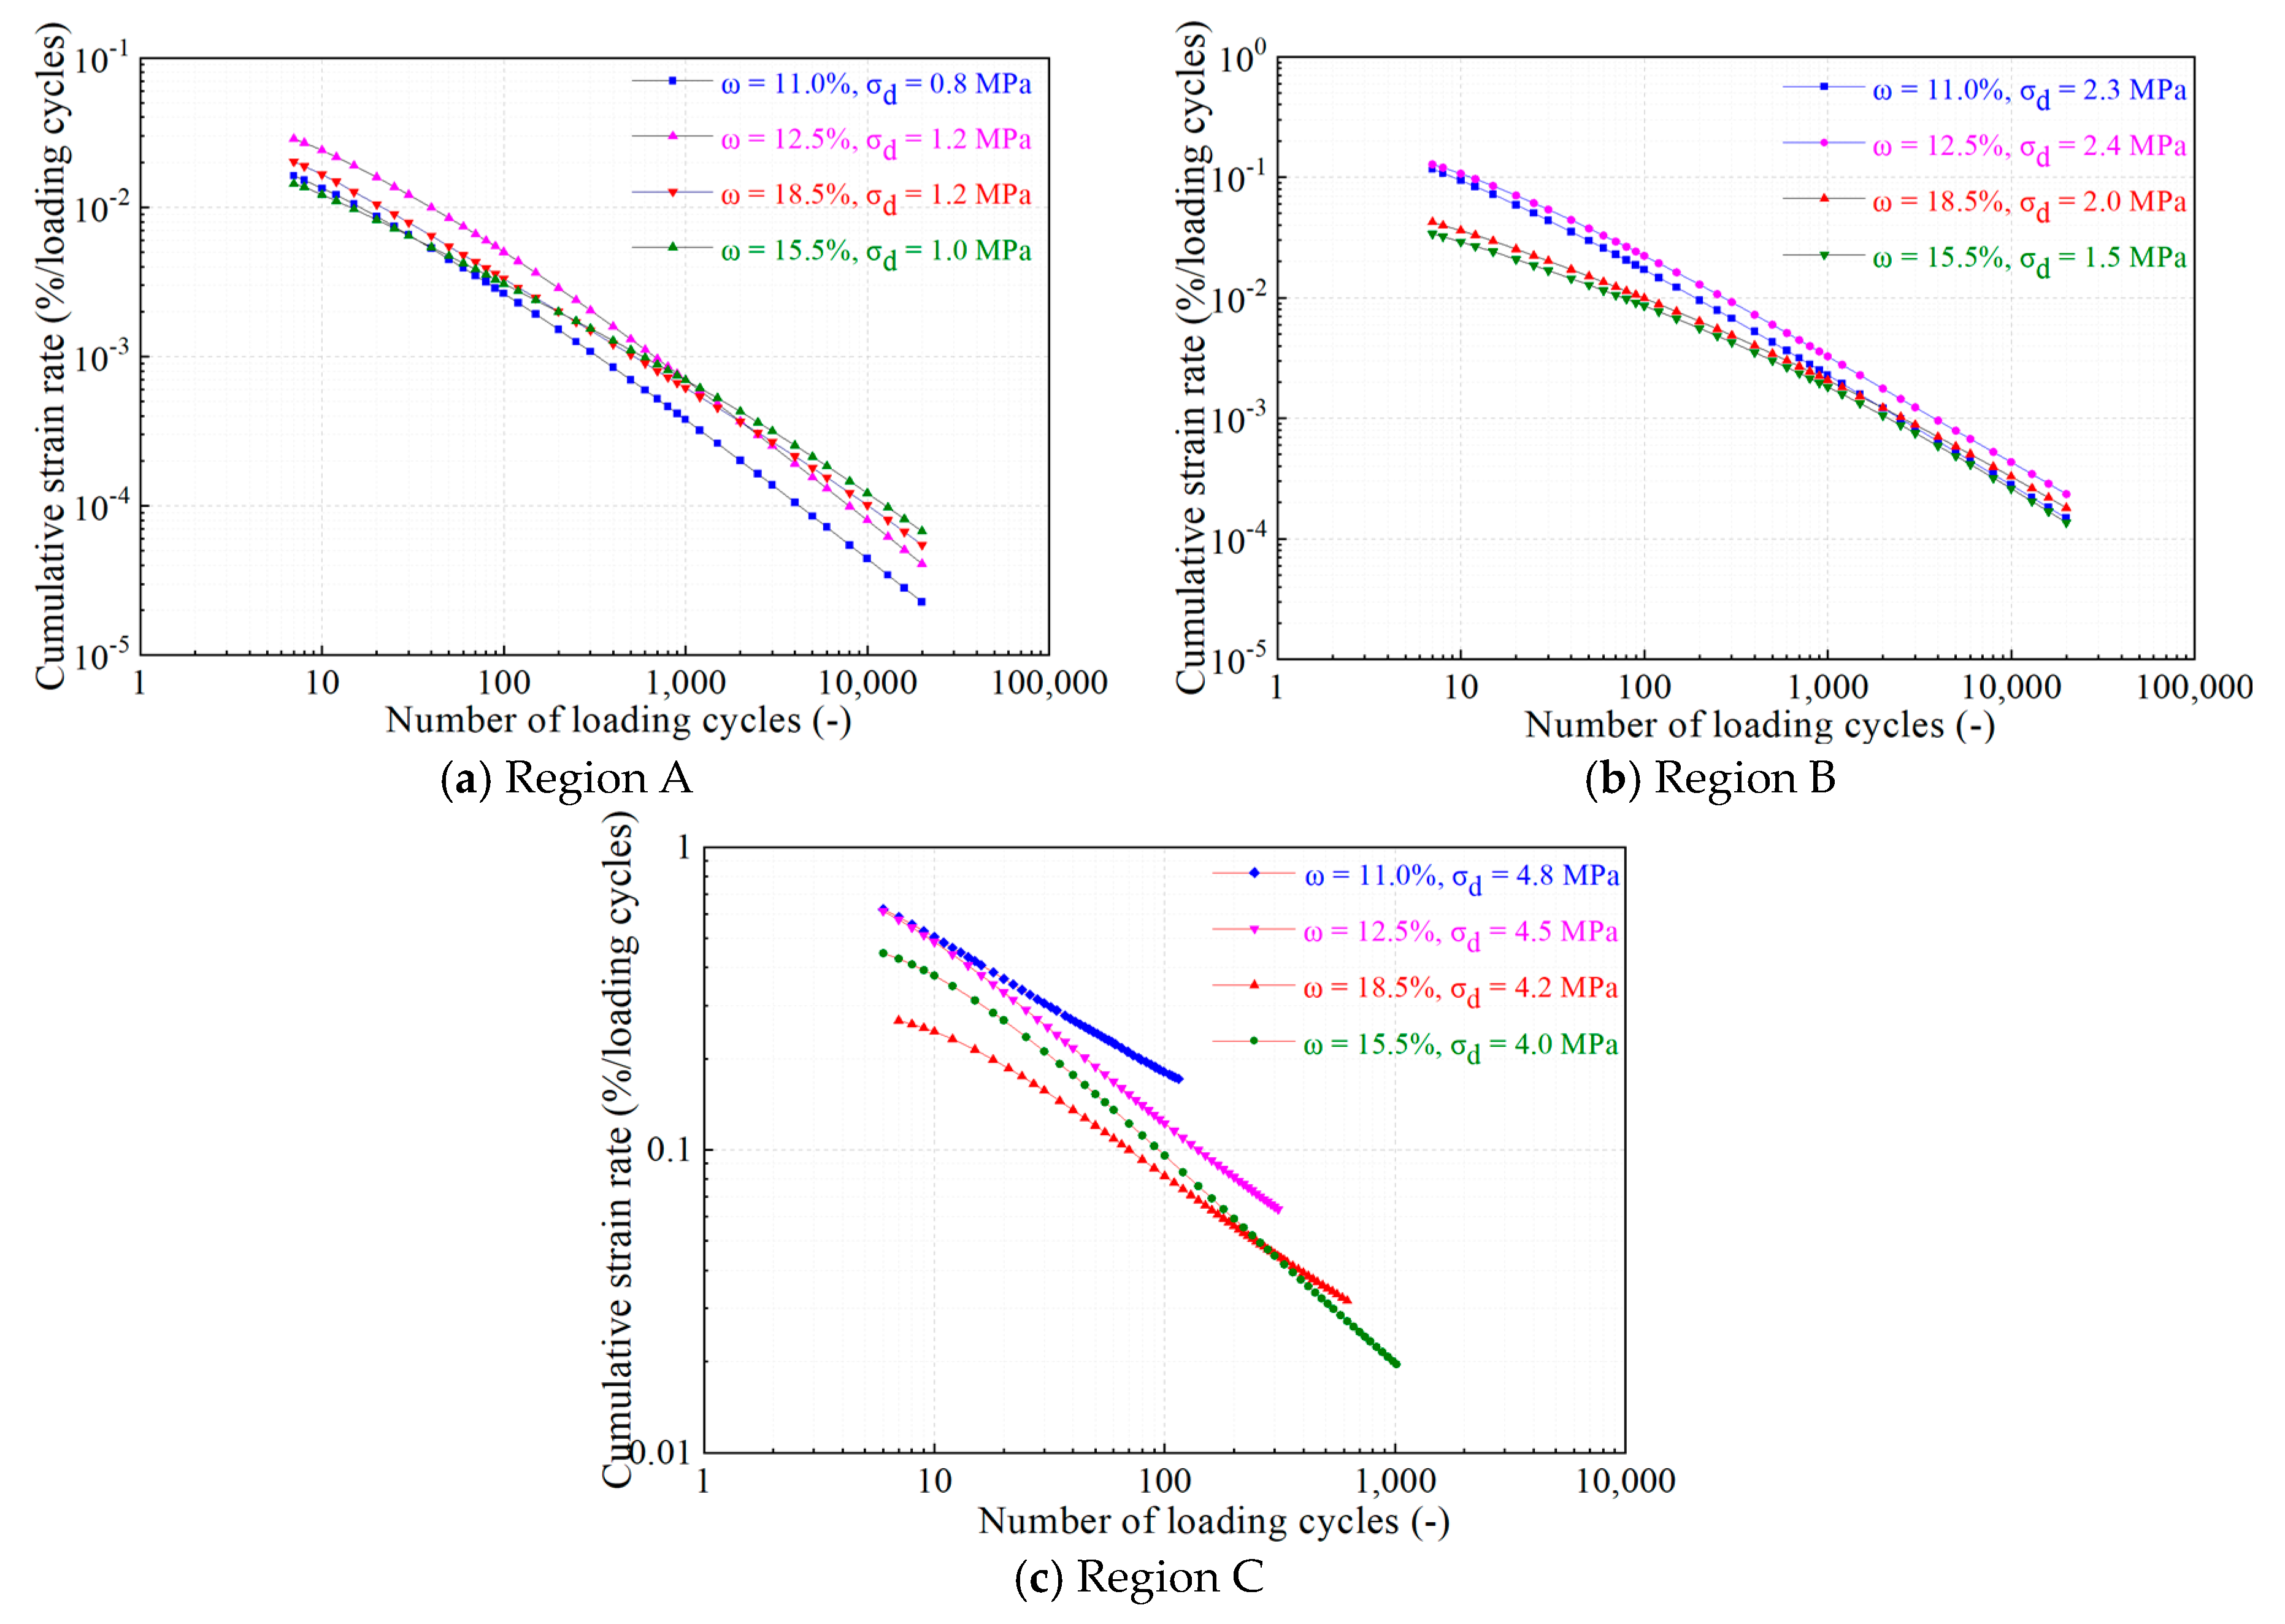
3.1.2. Impact of Moisture Content

The illustration in Figure 7 presents an analysis of how cumulative axial strain correlates with the number of loading cycles, with consideration given to various moisture content levels. With an initial stress ratio η0 of 0.5, an initial pressure p0 set at 0.9 MPa, a temperature maintained at −5 °C, and a moisture content of 11%, Figure 7a presents a visual representation of how cumulative axial strain varies with the increasing number of loading cycles, each pattern reflecting a unique dynamic stress amplitude. Under dynamic stress amplitudes of 0.8 MPa and 1.2 MPa, respectively, the cumulative axial strain exhibits a gradual and progressive increase as the number of loading cycles advances, ultimately exhibiting a stabilizing trend, the respective εacc,20000 values, corresponding to these conditions, are 0.45% and 0.83%. These curves are classified as the first type, resembling line 1. Under dynamic stress amplitudes of 2.0 MPa, 2.3 MPa, and 2.6 MPa, the cumulative axial strain accelerates its growth, attaining εacc,20000 values of 2.19%, 2.97%, and 6.43%, respectively. The pattern of these curves, which indicate an inclination towards creep damage as the number of loading cycles increases, places them in the second category, akin to line 2. Upon attaining a dynamic stress amplitude σd of 4.8 MPa, the cumulative axial strain escalates rapidly with each subsequent loading. The termination of the test occurred at the 115th loading iteration, marking the fulfillment of the criterion for reaching 20% of the maximum vertical strain. The observed curve’s behavior aligns it with the third type, displaying characteristics comparable to those of line 3. Similar curve classifications can be made in Figure 7b–d, etc. corresponding to moisture contents of 12.5%, 18.5%, and 15.5%, respectively.
Based on the previously mentioned method for characterizing the results of accumulated strain deformation, Figure 8 illustrates the correlation between the vertical cumulative strain rate and the vertical cumulative strain, considering varying temperature and moisture content conditions. The figure classifies the prototypical patterns of permanent strain accumulation into three distinct types, designated as regions A, B, and C, mirroring the previously mentioned first, second, and third types of variation curves. To ensure comprehensiveness, curves positioned between the first and second types are cautiously grouped within the ambit of region B. Each of these regions possesses unique characteristics, delineated by boundaries that will be delved into more thoroughly in conjunction with Figure 9 and Figure 10.

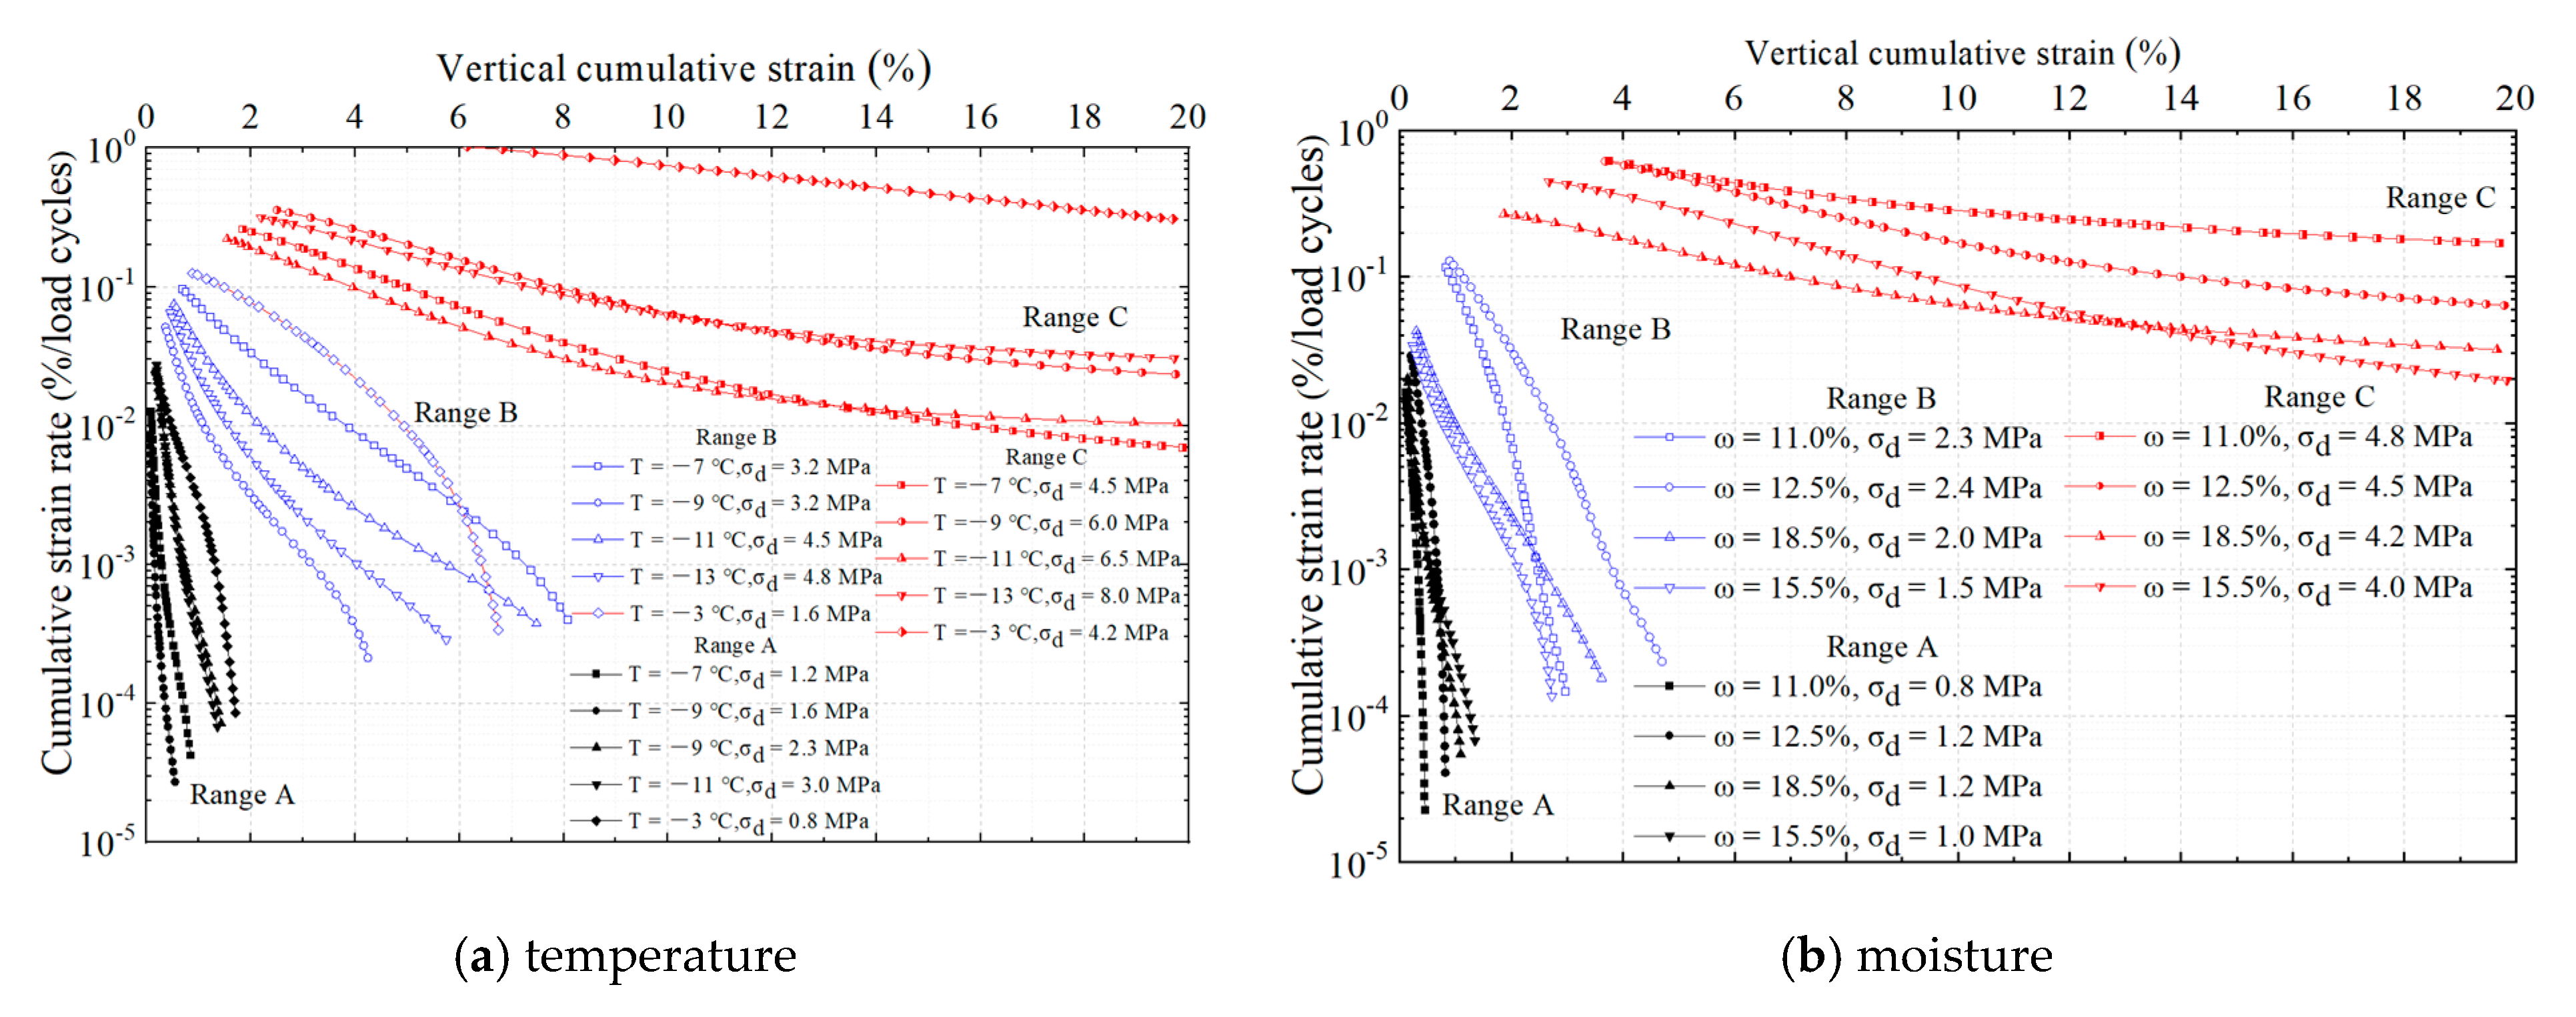
3.1.3. Different Temperature and Moisture Content Corresponding Regions

Figure 9 demonstrates the interrelationship between the vertical cumulative strain rates in regions A, B, and C, and the varying number of loading cycles, subject to different temperature conditions. Figure 9a depicts the initial cumulative strain rate as falling within a span from 0.0086 to 0.084. As the cyclic loading cycles accumulate, the cumulative strain rate undergoes a swift decrease, reaching a range of approximately 2.5 × 10⁻⁴ to 4.11 × 10⁻³ at 1000 cycles. Further incrementing the number of cycles to 10,000 results in a further decrease in the cumulative strain rate, now falling within a range of roughly 4.63 × 10⁻⁵ to 4.75 × 10⁻⁴, before gradually converging towards zero. Figure 9b illustrates the initial cumulative strain rate fluctuating within a range of 0.037 to 0.125. As the loading cycles proliferate, the cumulative strain rate diminishes swiftly. Specifically, when the loading cycles reach 1000, the cumulative strain rate falls within the range of approximately 9.56 × 10⁻⁴ to 5.5 × 10⁻³. Furthermore, upon completing 10,000 cycles, the cumulative strain rate diminishes to approximately 1.56 × 10⁻⁴ to 7.55 × 10⁻⁴. Figure 9c portrays a general decline in the vertical cumulative strain rate as the number of loading cycles increases. However, certain curves demonstrate a rebound tendency, with the cumulative strain rate at approximately 100 loading cycles ranging from 0.03 to 0.085.
As shown in Figure 10a, the initial cumulative strain rate falls within a range of 0.014 to 0.03. Thereafter, the cumulative strain rate diminishes rapidly with the augmentation of loading cycles. At 1000 cycles, the cumulative strain rate is approximately 3.78 × 10⁻⁴ to 1.1 × 10⁻³, and at 10,000 cycles, it further decreases to around 4.42 × 10⁻⁵ to 1.57 × 10⁻⁴, gradually approaching zero thereafter. As illustrated in Figure 10b, the initial cumulative strain rate ranges from 0.033 to 0.128. Afterward, the cumulative strain rate experiences a pronounced drop as the count of cyclic loading cycles rises. At 1000 cycles, the cumulative strain rate is approximately 1.8 × 10⁻³ to 3.2 × 10⁻³, and at 10,000 cycles, it further diminishes to about 2.61 × 10⁻⁴ to 4.3 × 10⁻⁴. As shown in Figure 10c, the vertical cumulative strain rate predominantly demonstrates a declining pattern as the number of cyclic loading cycles increases, yet some curves exhibit a tendency to rebound, with the cumulative strain rate settling within the range of 0.08 to 0.182 when the loading cycle count attains 100.

3.2. Calculation of Plastic Shakedown and Creep Limit

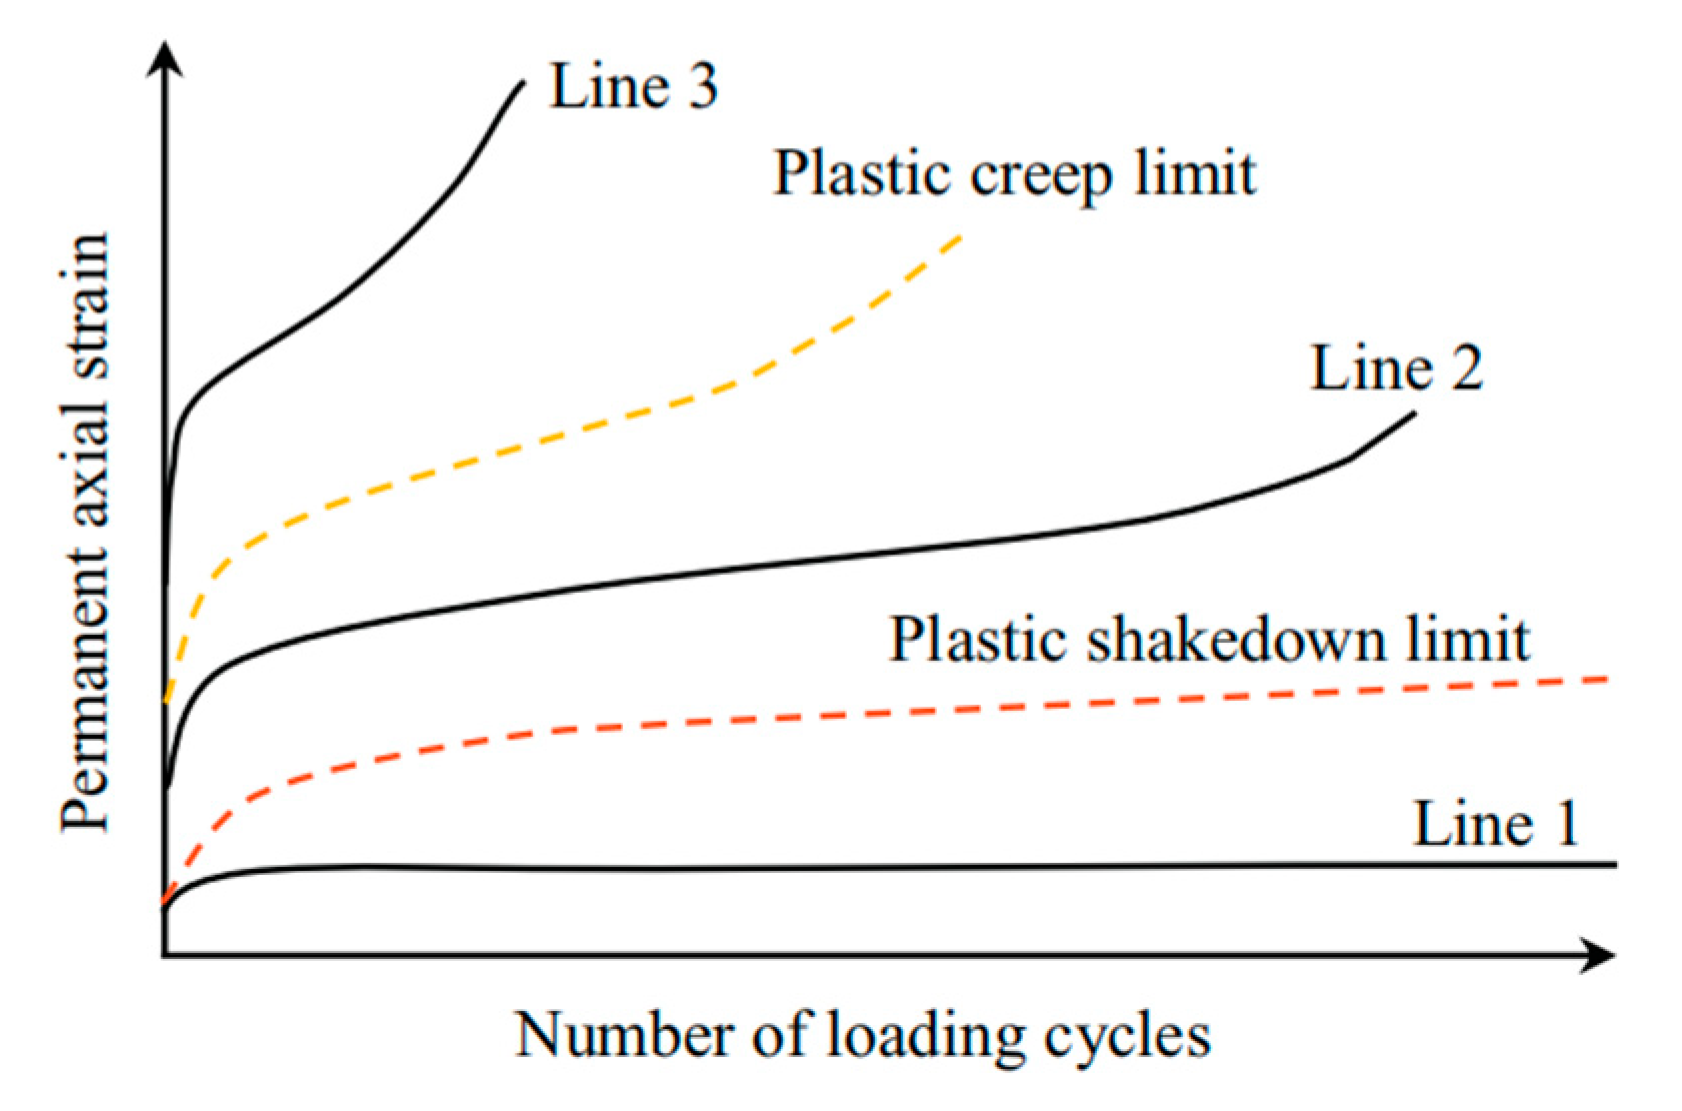
3.2.1. Threshold Intervals for the Permanent Deformation Attributes of Frozen Soil

As illustrated in Figure 11a and Figure 12a, The threshold for plastic shakedown limit acts as a dividing line between the dynamic response patterns of frozen silty clay in regions A and B. The lower limit of the range is determined by the maximum experimental outcome threshold within region A, whereas the upper boundary is determined by the lowermost limit of the test results observed in region B. As depicted in Figure 11b and Figure 12b, the plastic creep limit range signifies the boundaries that differentiate region B from region C. The threshold at the bottom of the limit range is determined by the highest point of the test outcomes within region B, while the ceiling of the limit range is set by the lowest point of the test results observed in region C. Referring to the plastic limit method for the initial stress condition proposed by Wang et al. [14], as illustrated in Figure 11 and Figure 12, the midpoint between the upper and lower limits of the range is chosen as the proposed plastic yield and plastic creep thresholds.

3.2.2. Criteria for Plastic Shakedown and Creep Limits

The examination of test outcomes disclosed distinct rates of cumulative strain variation across regions A, B, and C, particularly during the initial 1000 cycles of the reciprocal loading test. Referring to the criterion for the boundary between regions A-B and B-C at the initial stress state proposed by Wang et al. [14]. Illustrated in Figure 13a and Figure 14a, the plastic stability limit acts as the dividing line between regions A and B, which is determined by a 0.8% discrepancy in the vertical CPS values between the 100th and 1000th cycles of loading. As depicted in Figure 13b and Figure 14b, the boundary separating areas B and C, which represents the plastic creep limit, is established when the difference in vertical accumulated permanent strain between the 100th and 1000th loading cycles reaches 5.2%.

3.3. Critical Dynamic Stress

Utilizing the previously established criteria for plastic shakedown and plastic creep limits, an analysis of the test outcomes reveals the cumulative strain disparity in response to varying dynamic stress levels, as well as the influence of temperature and moisture content on the CDS thresholds and their corresponding variation patterns.

3.3.1. Calculation of CDS

For each test series outlined in Table 1, the vertical cumulative strain differences ε1000–ε100 were individually computed. Subsequently, the correlation between these strain differences and dynamic stresses, under varying temperature and moisture content conditions, was examined. The resulting fitted exponential curves for each test series are presented in Figure 15 and Figure 16, respectively. Since the fitting exponential curves for the samples under the five conditions of T = −7 °C, ω = 14%; T = −9 °C, ω = 12.5%; T = −11 °C, ω = 14%; T = −13 °C, ω = 12.5%; and T = −3 °C, ω = 14% exhibit similar patterns, Figure 15 only presents the representative fitting exponential curves for the conditions of T = −7 °C, ω = 14% and T = −9 °C, ω = 12.5%. Similarly, Figure 16 only displays the fitting exponential curves for the conditions of T = −5 °C, ω = 11% and T = −5 °C, ω = 12.5%. The patterns for T = −5 °C, ω = 18.5%, and T = −5 °C, ω = 15.5% are similar to those previously shown and are therefore not presented again. Table 2 provides a concise summary of the fitted relationships derived from all the test series.
As illustrated in Figure 15 and Figure 16, the vertical cumulative strain disparity exhibits an exponential augmentation in response to the escalation of dynamic stress. A summary of the vertical cumulative strain difference, as it varies with dynamic stress changes, along with the fitting parameters and correlation coefficients for all test sequences, is presented in Table 2. An analysis reveals that the variations observed under different loading conditions display a similar trend, and the goodness of fit, as measured by the correlation coefficients, is satisfactory. Combined with the plastic limit criterion formula proposed by Wang et al. [14], The CDS σd can be determined for the plastic stability limit and plastic creep limit under varying stress levels, by employing the functions provided in Table 2 and performing calculations for specific εsub values of 0.8% and 5.2%, respectively. Therefore, the effects of different temperatures and moisture contents on the CDS can be analyzed.

3.3.2. Impact of Temperature and Moisture Content

Figure 17 illustrates the variation in CDS for different temperature and moisture content conditions determined based on the plastic limit criterion.
As illustrated in Figure 17a, with an initial stress ratio η0 of 0.5, an initial pressure p0 of 0.9 MPa, and a constant moisture content of 14%, the CDS σd,s under the plastic stability limit demonstrates a gradual increase as the temperature decreases, varying from 0.49 MPa to 4.17 MPa. In contrast, the CDS σd,c pertaining to the plastic creep limit undergoes a gradual escalation from 3.12 MPa to 6.86 MPa within the span of temperatures considered in the experimentation. The reason should be that with the gradual decrease in temperature, the frozen soil body, the unfrozen moisture content in the void gradually decreased, the ice particle content gradually increased, the proportion of enhancement, the cementing effect of ice makes the soil particles increase the adhesion between the particles, at the same time the cementing effect between the ice particles is also enhanced, so when the other conditions are certain, the lower the temperature, the strength of the frozen powdery clay increases, the resistance to deformation ability increased, the CDS would also increase.
Figure 17b shows that when the initial stress ratio η0 is 0.5, the initial pressure p0 is 0.9 MPa, and the temperature is held at −5 °C, the CDS σd,s under the plastic stability limit generally decreases with increasing moisture content, experiencing a slight reversal at a moisture content of 18.5%. Specifically, it gradually decreases from 2.82 MPa to 1.24 MPa before marginally increasing to 1.62 MPa. Similarly, the CDS σd,c for plastic creep diminishes as the moisture content rises, initially decreasing from 7.52 MPa to 3.27 MPa, followed by a slight augmentation to 3.43 MPa. In general, the higher the moisture content, the higher the proportion of ice particles in the frozen soil, and the stronger the ice cementation, the higher the corresponding triaxial strength, the CDS of frozen powdery clay under long-term reciprocal loading is different from the CDS here, there exists an extreme value under the specific condition of a particular moisture content. It shows that under the long-term reciprocating cyclic loading, when the moisture content is low, the proportion of ice particles increases and the ice cementation increases insignificantly, which does not play a controlling role in resisting deformation, and the CDS decreases slowly, but when the moisture content is high, the proportion of ice particles increases greatly and the cementation between ice particles is enhanced, which increases the ability of resisting deformation significantly, and thus the CDS is increasing.

3.4. Discussions

This paper undertakes an analysis of the CDS and CPS observed in frozen silty clay across a range of temperatures and moisture contents, utilizing a series of dynamic triaxial tests as the foundation for our investigation. The findings indicate that as temperature decreases, the CDS under both plastic stability and plastic creep limits experiences a gradual increase. This temperature reduction prompts soil freezing, resulting in a gradual decline in unfrozen water content within pores and a corresponding rise in ice particle content. The heightened proportion of ice particles enhances the cementing effect, strengthening the bonds between soil particles. Consequently, under constant other conditions, lower temperatures lead to a more robust frozen silty clay, increasing its resistance to deformation. Hence, with all other factors remaining constant, a reduction in temperature leads to an augmentation in the strength of frozen silty clay, which in turn elevates its resistance to deformation and consequently increases the CDS; As the water content increases, the CDS within the bounds of plastic stability and plastic creep undergoes a gradual decrease. Moreover, under the influence of long-term reciprocal loading, this critical stress experiences a slow decline. When the water content is low, the proportion of ice particles rises, but the augmentation in ice cementation is not substantial, failing to effectively contribute to deformation resistance. Consequently, the CDS diminishes at a slow pace. Under prolonged cyclic loading conditions, a low water content leads to a marked increase in the proportion of ice particles, accompanied by an enhancement in the cementation among these particles. This reinforcement of the structural integrity significantly boosts the deformation resistance, resulting in an upward trend for the CDS.
CDS is an important mechanical index to measure the stability of permafrost roadbed, comparing the existing research on CDS of permafrost, Wang et al. [44] collected multi-year permafrost samples from the Qinghai-Tibet region and conducted investigation of the soil samples’ CDS and permanent deformation behavior under repeated freezing and thawing cycles, utilizing dynamic triaxial testing. Their findings indicated that the CDS of the embankment soil underwent a rapid decline during the initial two cycles of freezing and thawing, followed by a tendency towards stabilization in subsequent cycles. Wang et al. focused on the study of dynamic properties under the action of freeze–thaw cycles, while this paper mainly focuses on the effects of temperature and moisture content changes on the dynamic properties of permafrost. Comparing the existing studies on the CDS of unfrozen soil, Liu et al. [45] undertook a thorough examination of the CDS and deformation characteristics of volcanic ash under both monotonic and dynamic loading scenarios, employing a comprehensive set of monotonic and dynamic triaxial tests. Their investigation revealed that these characteristics were significantly influenced by various factors, including stress level, water content, and the magnitude of the dynamic stress. Notably, when the volcanic ash in an unsaturated state exhibited plastic stability, they observed a positive correlation between the dynamic stress and water content, wherein an increase in water content led to an elevation in the dynamic stress. In the case of volcanic ash being in a plastic stabilized state within an unsaturated condition, an increase in water content results in a decrease in dynamic stress, a finding that echoes the trend observed for the CDS of permafrost studied in this paper.
Most of the existing studies on the CDS in frozen clay focus on the constitutive modeling, while this paper focuses on the empirical studies on the changes in CDS under different environments. Compared with similar studies in the past, this paper analyzes the effects of temperature and moisture content on the CPS of frozen powdery clay under long-term reciprocating cyclic loading, establishes a plastic stability and creep threshold criterion for frozen powdery clay, drawing upon the vertical CPS recorded at the 100th and 1000th loading cycles as the fundamental parameters; and investigates the influence of different temperatures and moisture contents on the CDS of frozen soil, which can provide strong conclusions for the construction of transportation in cold regions and the field research. It can provide strong conclusions for the transportation construction in the cold area and the actual measurement research.

4. Conclusions

This paper delves into the variations in CPS and CDS in permafrost under long-term cyclic loading, with respect to temperature and moisture content, through a series of dynamic triaxial tests. Cumulative permanent deformation under the influence of different temperatures and water contents, the calculation criterion of plasticity-stabilized creep limit as well as the calculation and influence analysis of CDS are presented in this paper. The following conclusions can be drawn from the results of this paper:
(1)
The cumulative axial strain of frozen soil under cyclic loading is notably influenced by alterations in temperature and moisture content. Notably, under varying temperatures and water contents, the cumulative strain rate in Region A undergoes a swift decline with an increasing number of loading cycles, ultimately stabilizing at zero. Similarly, Region B experiences a rapid decrease in cumulative strain rate with more cycles. In Region C, while a general decrease is observed, certain curves exhibit a rebound trend, highlighting the complex interplay of temperature, moisture, and cyclic loading on the strain behavior of frozen soil.
(2)
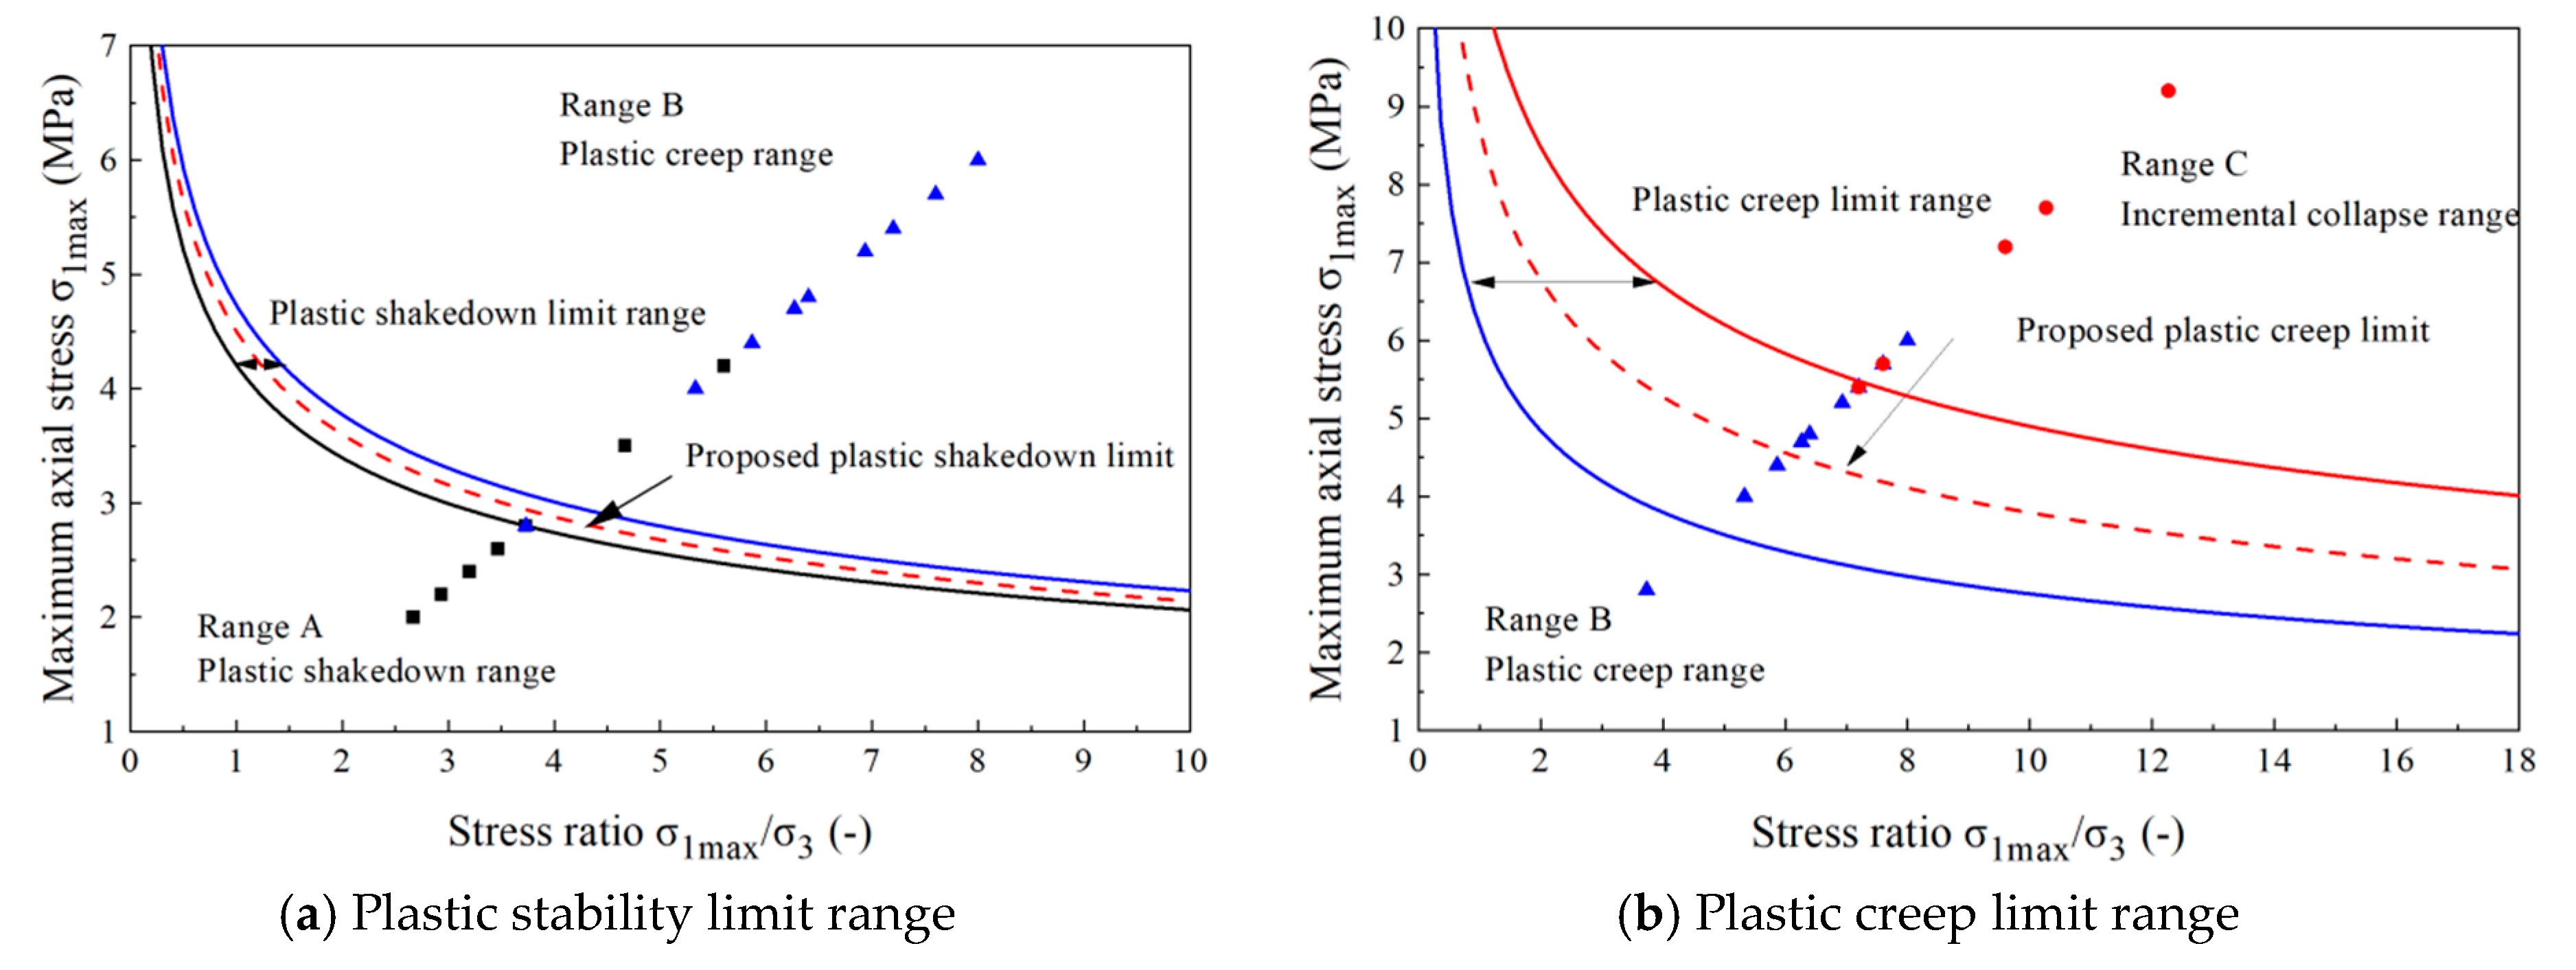
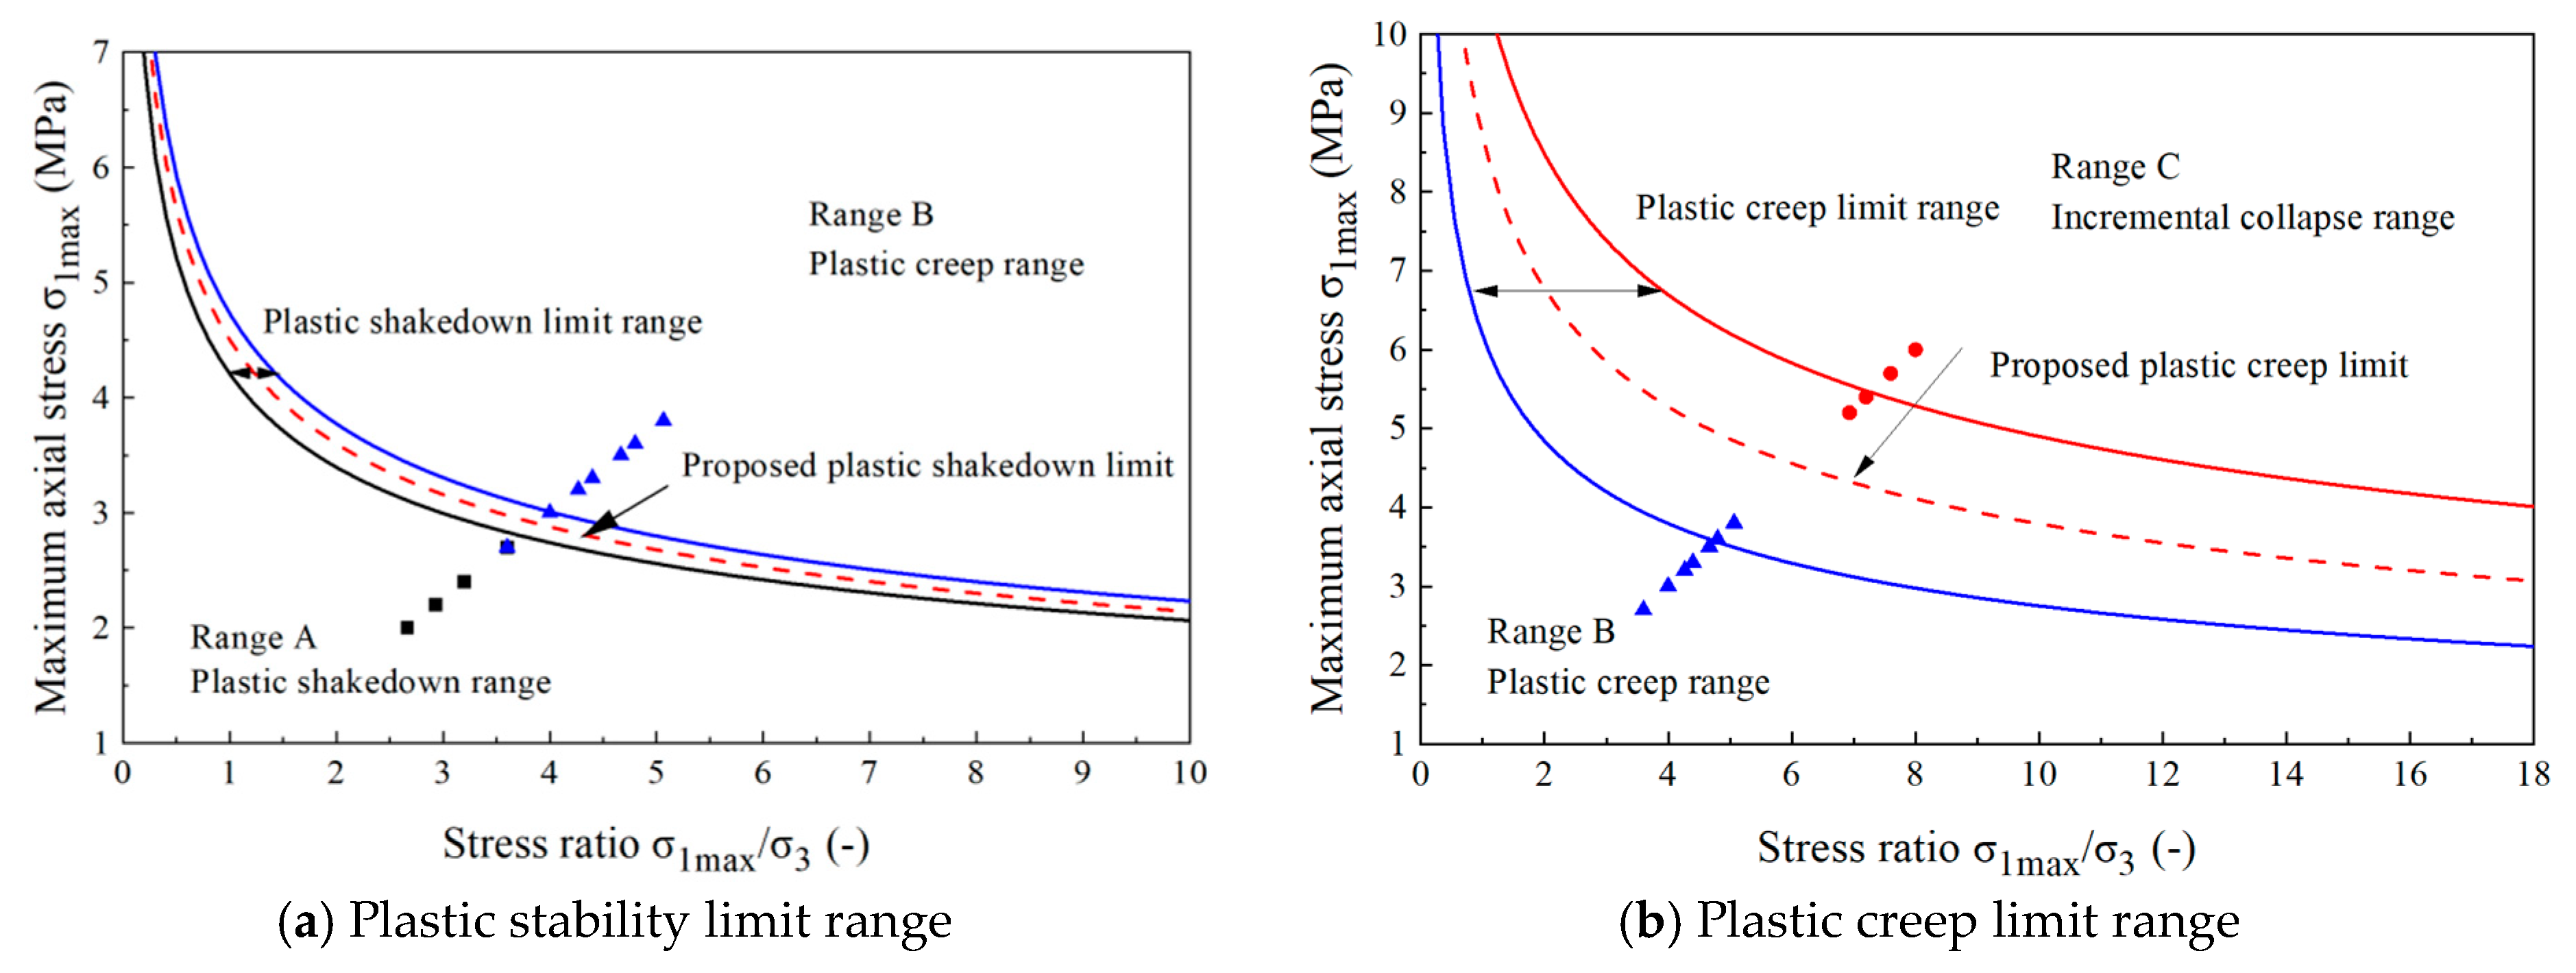
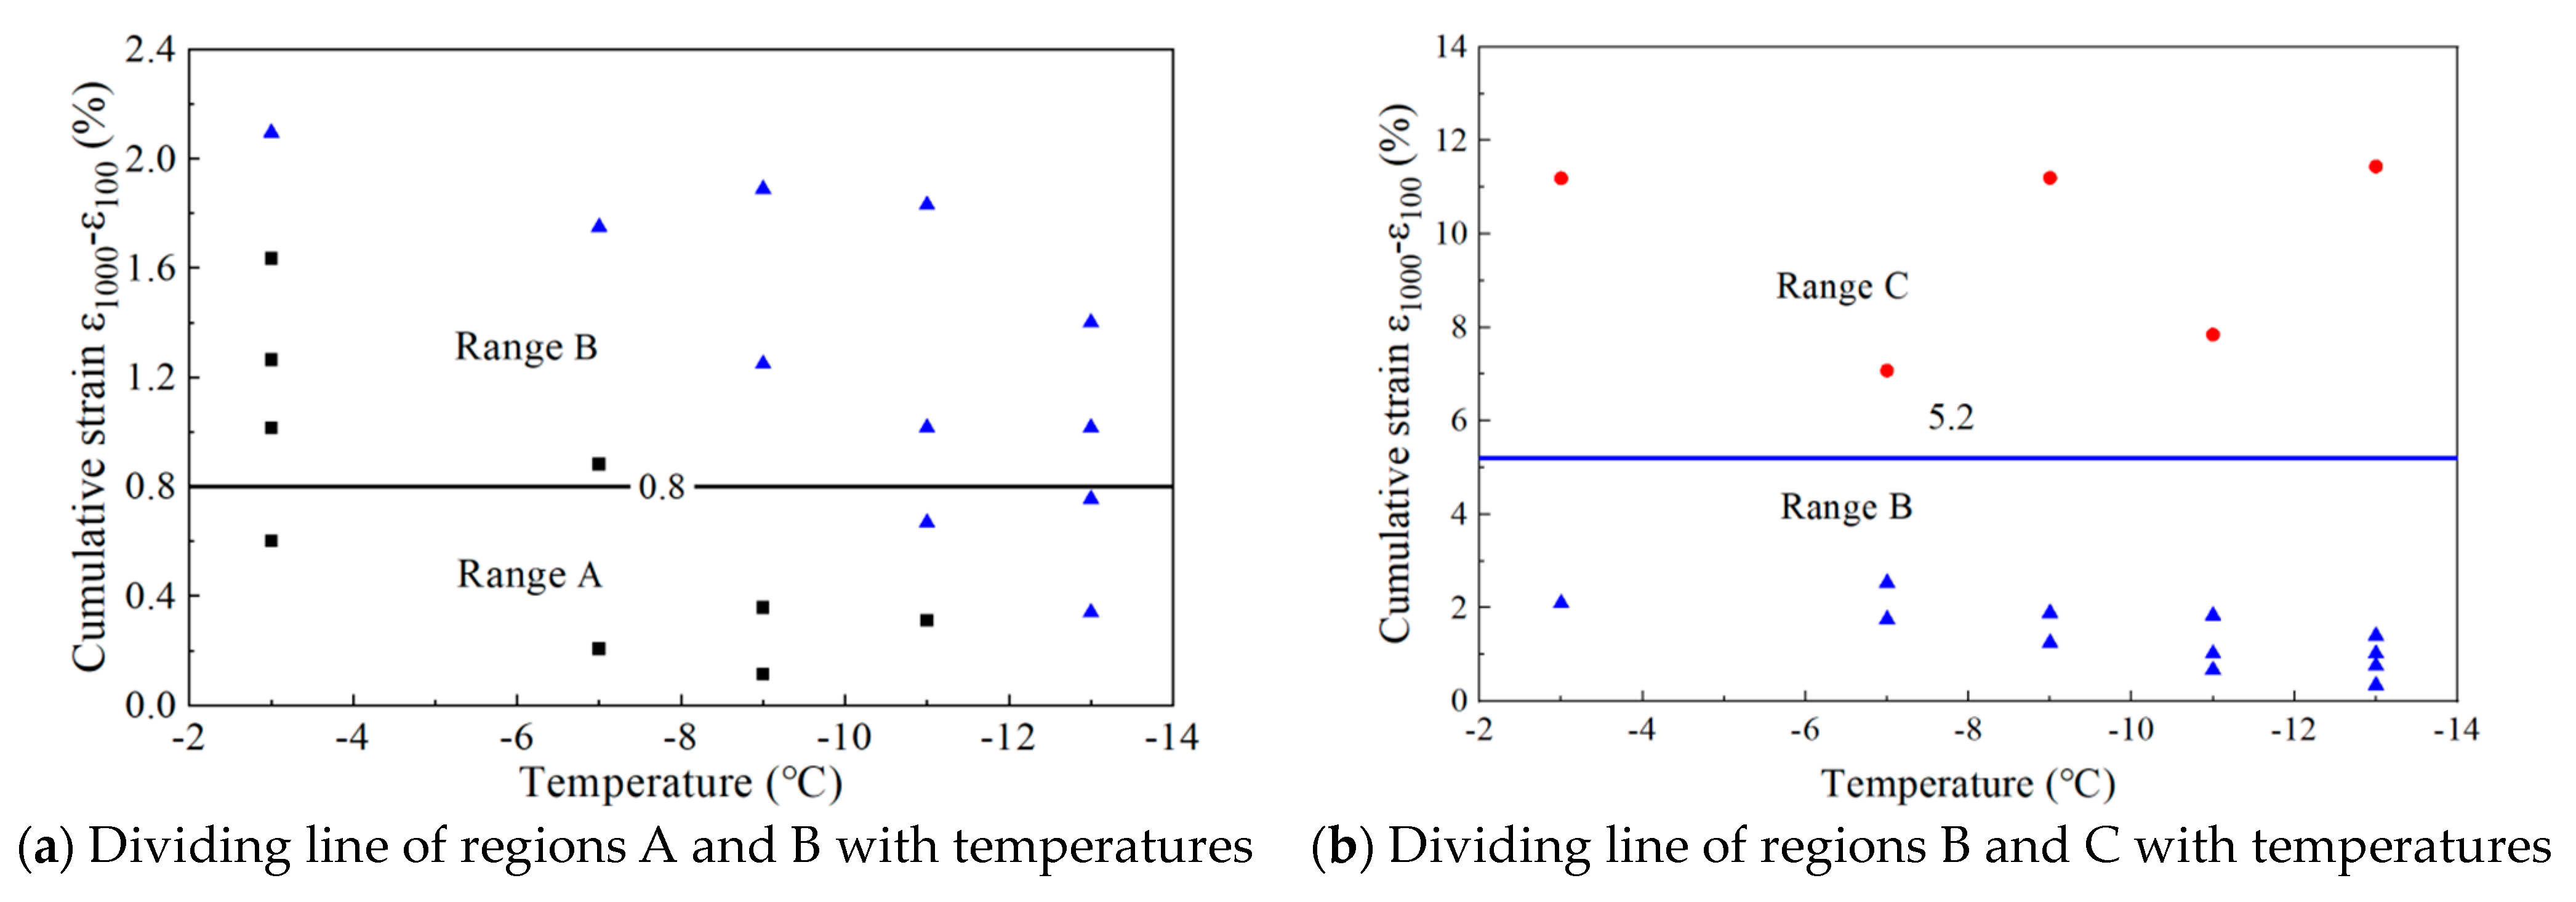
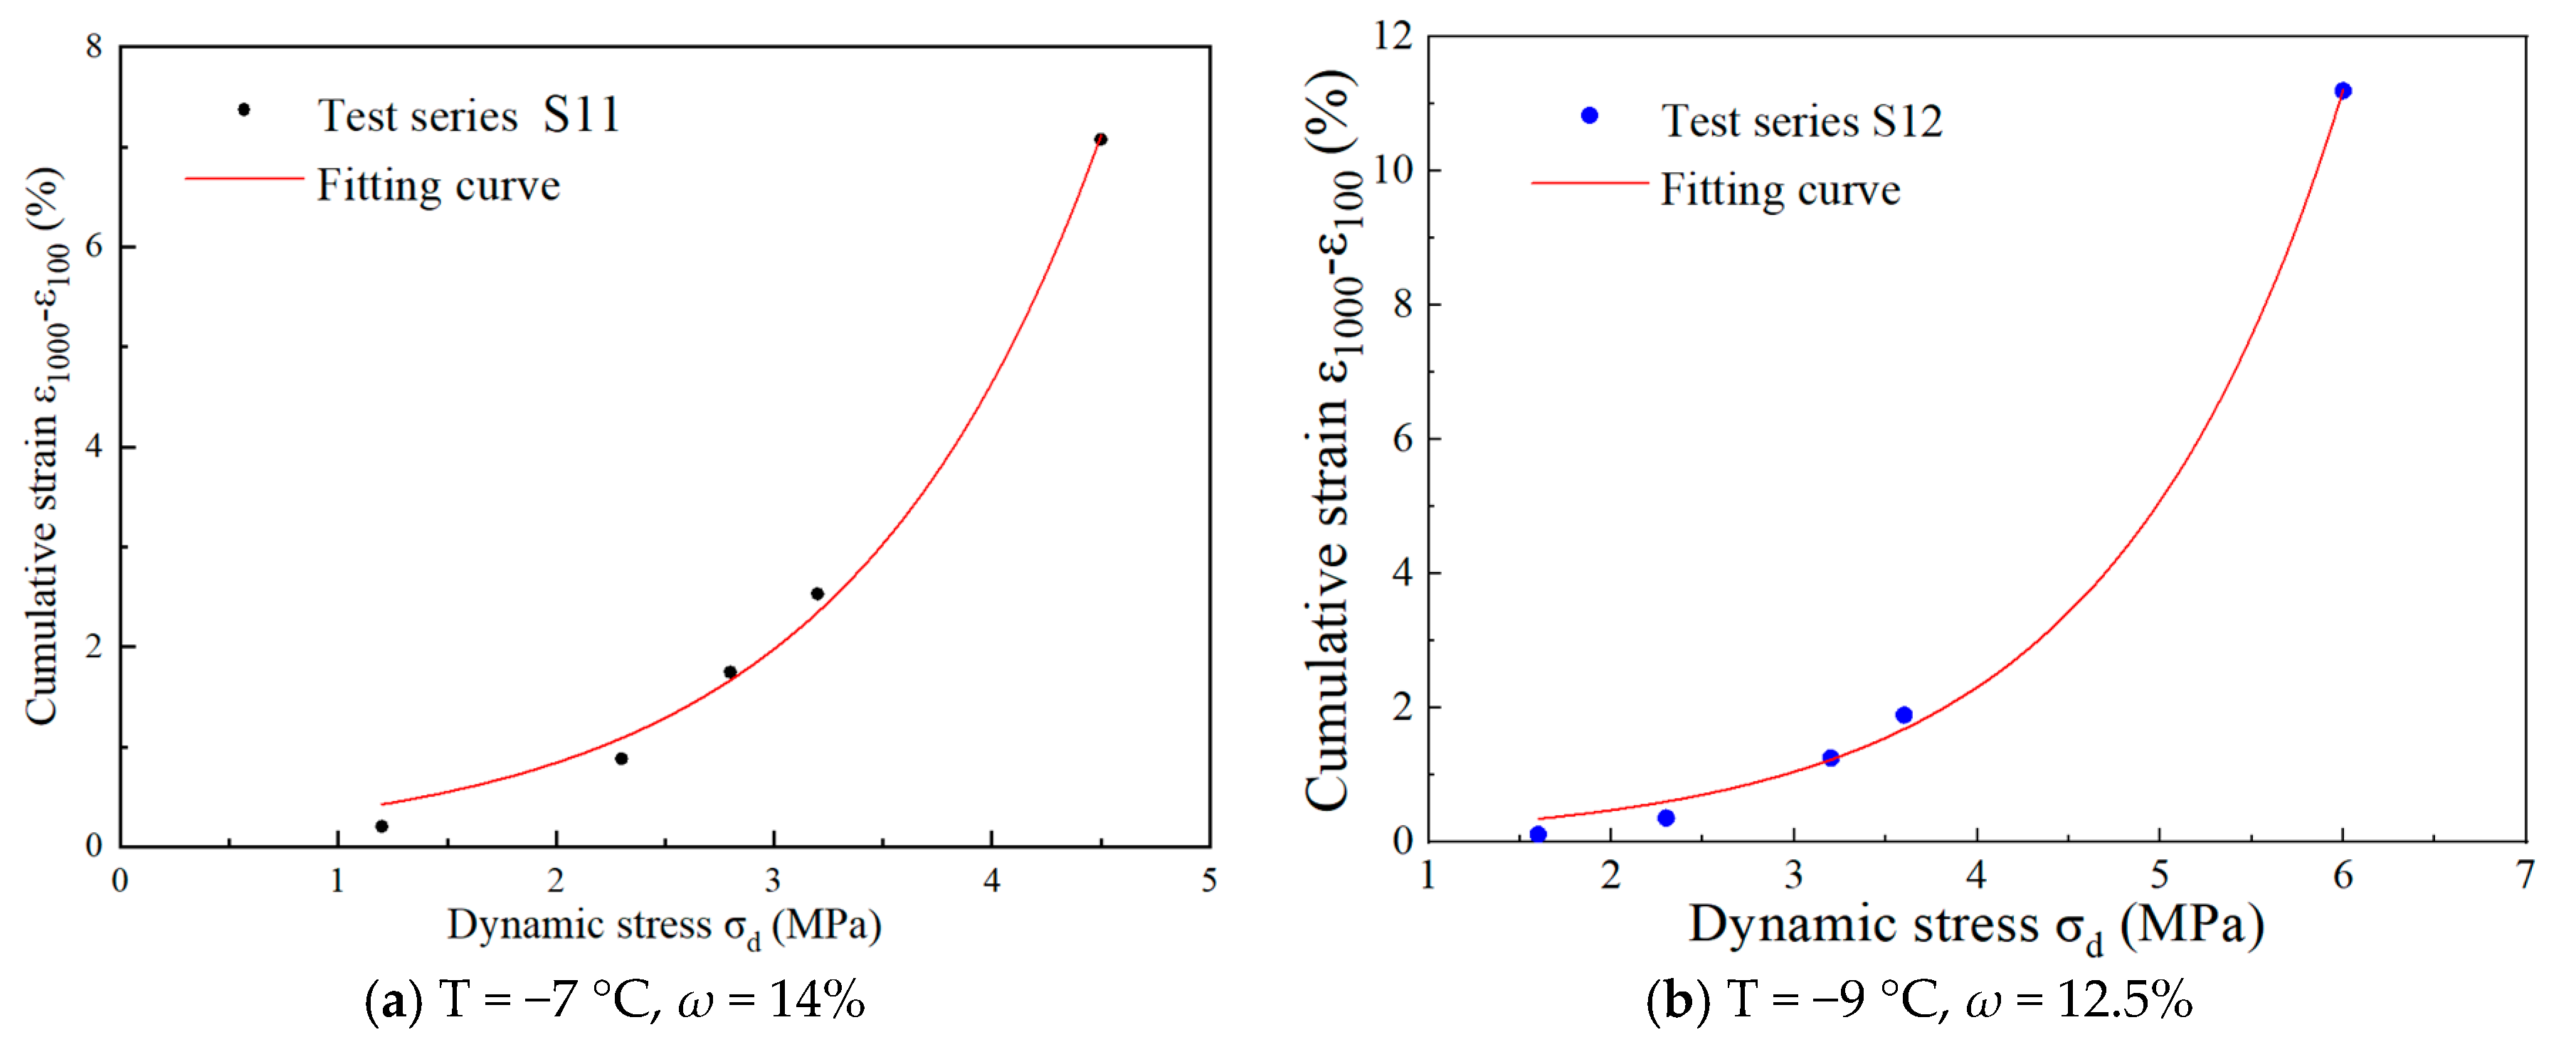
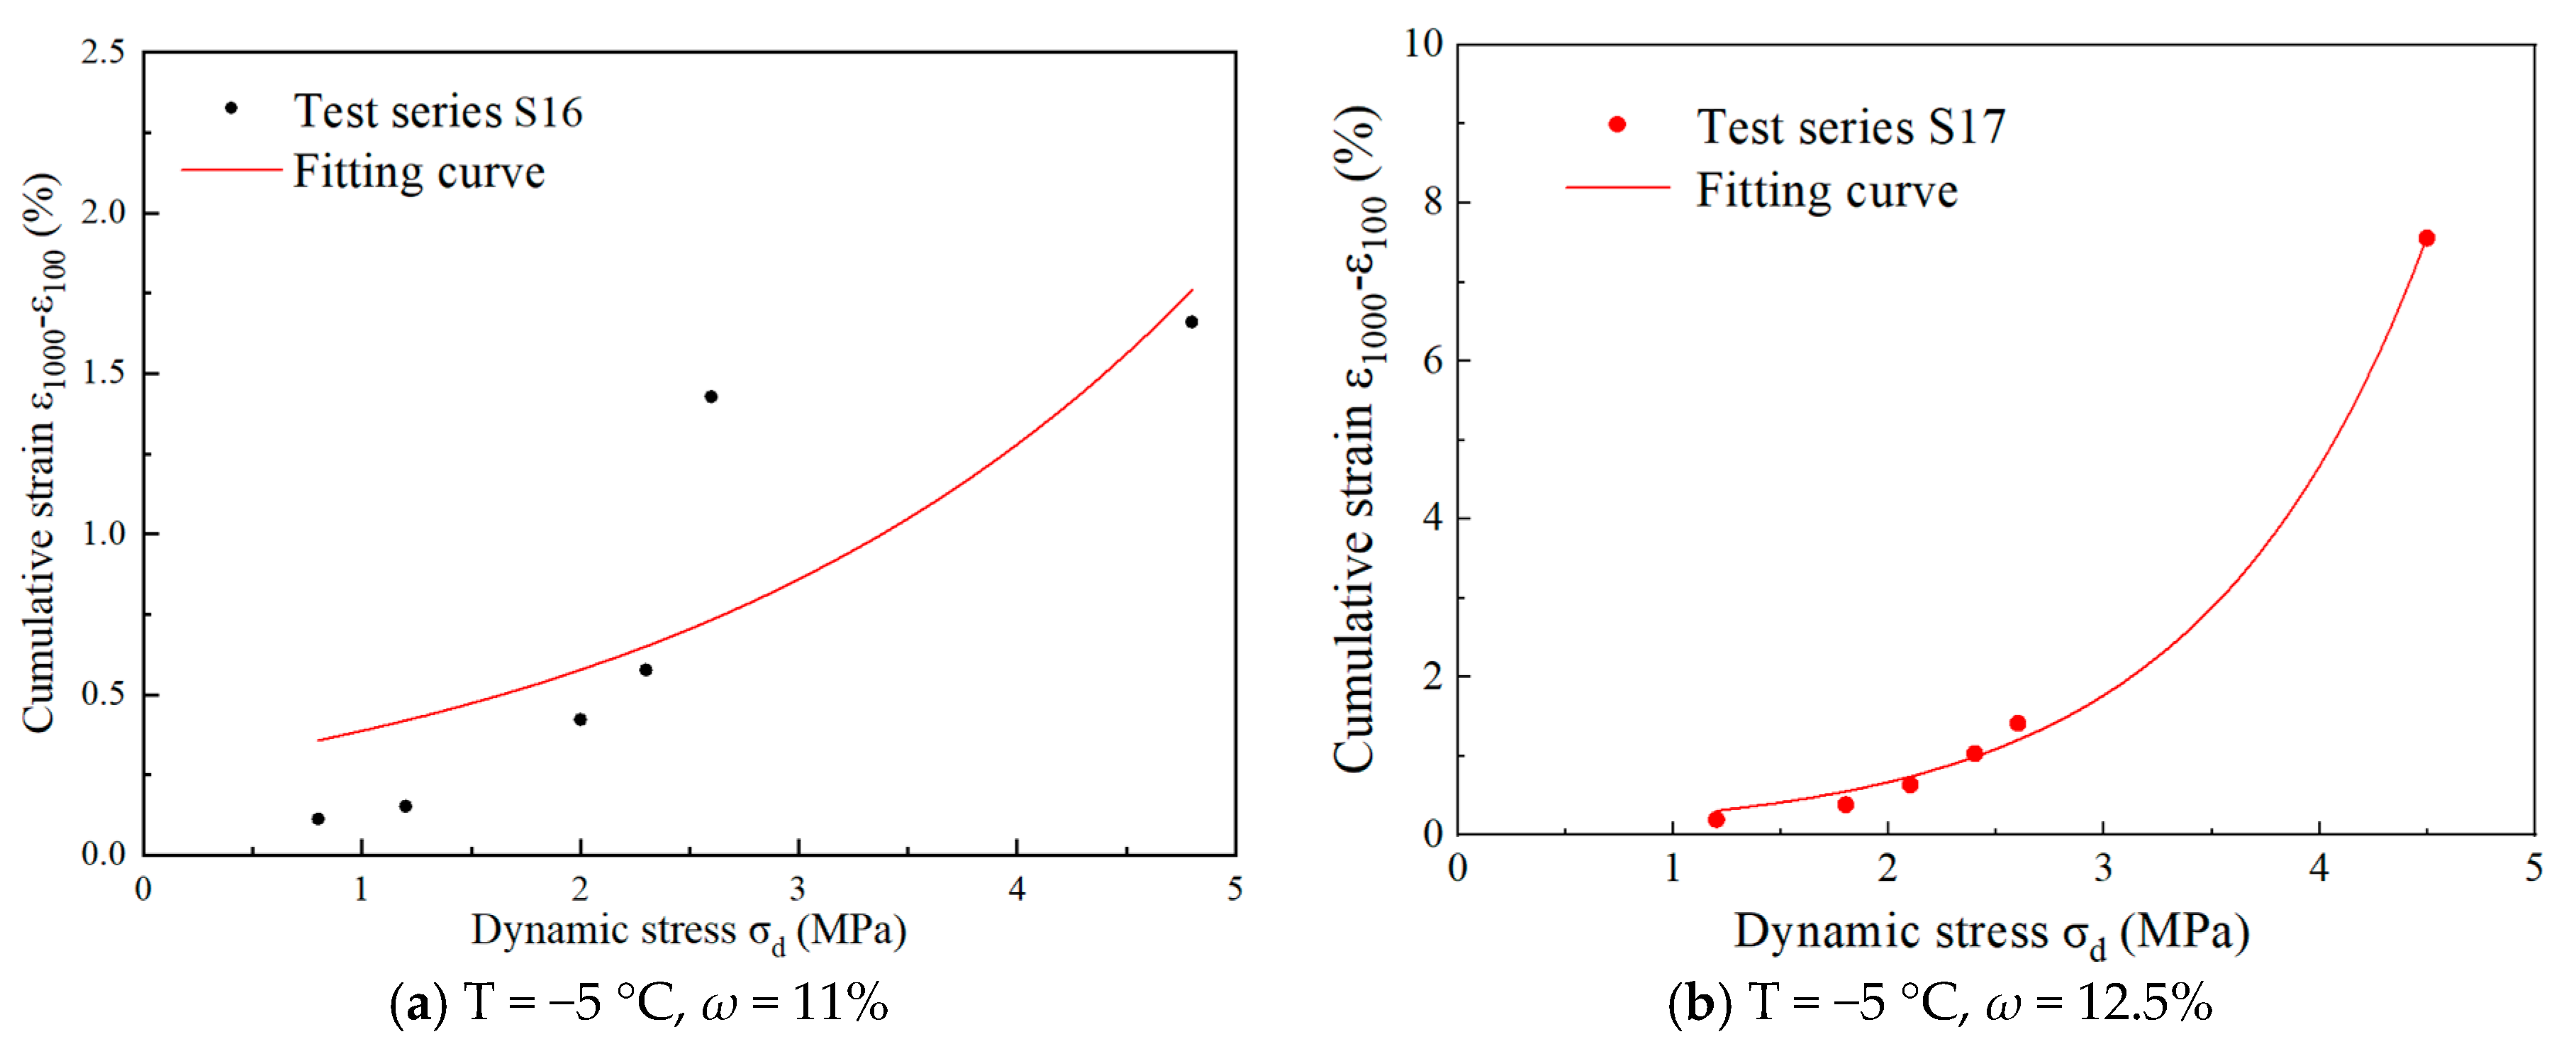
Drawing upon the vertical CPS associated with the 100th and 1000th loading cycles, a definitive plastic stability and creep limit criterion is introduced for frozen silty clay. This criterion clearly establishes the plastic stability limit as the boundary between areas A and B, marked by a 0.8% difference, and the plastic creep limit as the threshold separating areas B and C, characterized by a 5.2% discrepancy. Employing the plastic limit criterion formula, we conclusively determine the CDS σd at both limits under varying stress levels, enabling a thorough analysis of how different temperatures and moisture contents impact this critical stress.
(3)
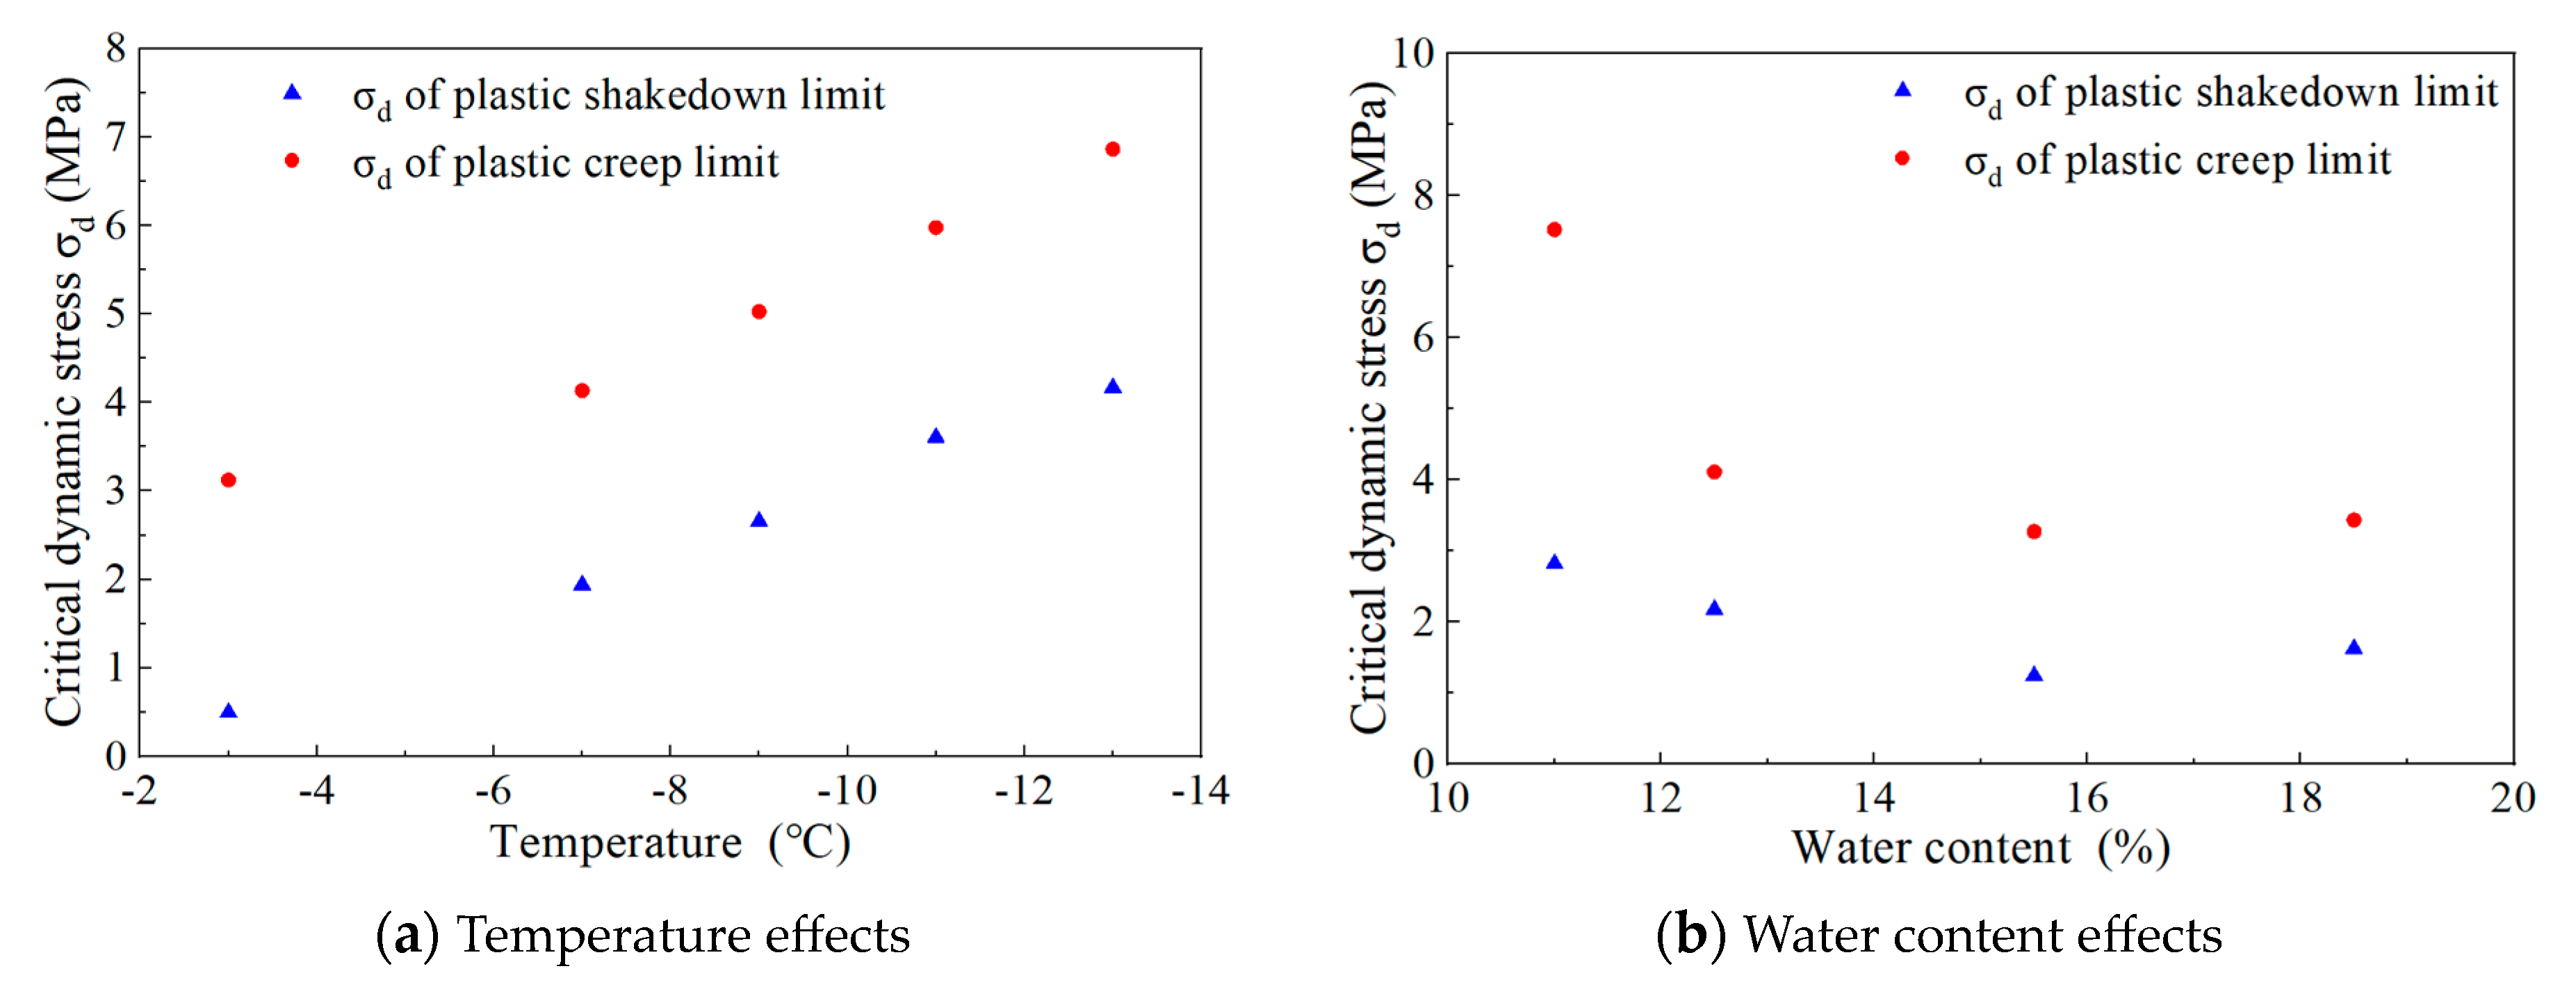
As temperature decreases, the CDS σd,s under the plasticity-stabilized creep limit exhibits a gradual upward trend in general. Assuming all other factors remain constant, lower temperatures lead to an enhancement in the strength and deformation resistance of frozen powdery clay, subsequently elevating the CDS.
(4)
As water content rises, the CDS σd,s under the plasticity-stabilized creep limit experiences an overall slow decline, with a slight recovery observed at a water content of 18.5%. At lower water contents, the decrease in CDS is gradual. Conversely, at higher water contents, the significant increase in the proportion of ice particles and the enhancement of their cementation result in markedly improved deformation resistance, thereby leading to an increase in the CDS.
In the future, further research would consider the influence of soil type, particle size, loading frequency, and reinforced materials on the critical dynamic stress and plasticity calculation criteria.

Author Contributions

Conceptualization, J.W.; Methodology, J.D.; Project administration, J.W.; Validation, J.W. and J.D.; Investigation, J.D.; Writing—original draft preparation, J.D. and J.W.; Writing—review and editing, J.W. and J.D.; Funding acquisition, J.W. and Y.Z.; Supervision, Y.Z.; Data curation, Y.Z.; Formal analysis, Y.Z. and J.D. All authors have read and agreed to the published version of the manuscript.

Funding

The research was partly supported by the National Natural Science Foundation of China (42101127) and the China Postdoctoral Science Foundation (2020M681621), the Fund Project for Central Government Guided Local Science and Technology Development of China (2022ZY0052).

Institutional Review Board Statement

Not applicable.

Informed Consent Statement

Not applicable.

Data Availability Statement

The data used to support the findings of this study are available from the corresponding author upon request.

Conflicts of Interest

The authors declare that there are no conflicts of interest regarding the publication of this paper.

References

  1. Mei, Q.H.; Chen, J.; Liu, Y.Q.; Zhang, S.H.; Zhao, J.Y.; Dong, T.C.; Wang, J.C.; Zhao, Y.J. Degradation of warm permafrost and talik formation on the Qinghai–Tibet Plateau in 2006–2021. Adv. Clim. Chang. Res. 2024, 15, 275–284. [Google Scholar] [CrossRef]
  2. Zhao, H.; Hou, Y.; Jiang, G.; Wu, Q. Risk assessment of the crushed rock structure embankments of the Qinghai-Tibet Railway under a warming climate. Cold Reg. Sci. Technol. 2022, 196, 103509. [Google Scholar] [CrossRef]
  3. Zhu, Z.; Tang, C.; Ma, Y.; Luo, F.; Luo, B.; Zou, Z.; Guo, Z.; Jang, X. Train-induced vibration and subsidence prediction of the permafrost subgrade along the Qinghai-Tibet Railway. Soil Dyn. Earthq. Eng. 2022, 162, 107433. [Google Scholar] [CrossRef]
  4. Pan, W. Research on Thermal Stability of Railway Roadbed in the Permafrost Area of the Qinghai-Tibet Plateau. Ph.D. Thesis, Lanzhou University, Lanzhou, China, 2002. [Google Scholar]
  5. Ma, W.; Feng, G.; Wu, Q.; Wu, J. Analyses of temperature fields under the embankment with crushed-rock structures along the Qinghai-Tibet railway. Cold Reg. Sci. Technol. 2008, 53, 259–270. [Google Scholar] [CrossRef]
  6. Sha, A.; Ma, B.; Wang, H.; Hu, L.; Mao, X.; Zhi, X.; Chen, H.; Liu, Y.; Ma, F.; Liu, Z.; et al. Highway constructions on the Qinghai-Tibet Plateau: Challenge, research and practice. J. Road Eng. 2022, 2, 1–60. [Google Scholar] [CrossRef]
  7. Zhu, Z.Y.; Ling, X.Z.; Chen, S.J.; Zhang, F.; Wang, L.; Wang, Z.; Zou, Z. Experimental investigation on the train induced subsidence prediction model of Beiluhe permafrost subgrade along the Qinghai-Tibet Railway in China. Cold Reg. Sci. Technol. 2010, 62, 67–75. [Google Scholar] [CrossRef]
  8. Li, Q.L.; Ling, X.Z.; Sheng, D.C. Elasto-plastic behaviour of frozen soil subjected to long-term low-level repeated loading, part I: Experimental investigation. Cold Reg. Sci. Technol. 2016, 125, 138–151. [Google Scholar] [CrossRef]
  9. Lin, B.; Zhang, F.; Feng, D.; Tang, K.; Feng, X. Dynamic shear modulus and damping ratio of thawed saturated clay under long-term cyclic loading. Cold Reg. Sci. Technol. 2018, 145, 93–105. [Google Scholar] [CrossRef]
  10. Huang, K.; Ma, Q.; Ma, D.; Yao, Z. Strength and deformation properties of frozen sand under a true triaxial stress condition. Soils Found. 2021, 62, 101089. [Google Scholar] [CrossRef]
  11. Ngoma, M.C.; Kolawole, O. Porosity and bedding controls on bio-induced carbonate precipitation and mechanical properties of shale and dolomitic rocks: EICP vs MICP. Biogeotechnics 2024, 2, 100102. [Google Scholar] [CrossRef]
  12. Zhang, J.; Xiao, Y.; Cui, H.; He, X.; Liu, H. Dancing with crystals: Bacterial functions and interactions in biomineralization. Biogeotechnics 2024, 2, 100084. [Google Scholar] [CrossRef]
  13. Huang, K.; Ma, Q.; Cai, G.; Ma, D.; Yao, Z.; Zhang, H. Influence of intermediate principal stress ratio on strength and deformation characteristics of frozen sandy soil under different moisture contents. Cold Reg. Sci. Technol. 2023, 213, 103909. [Google Scholar] [CrossRef]
  14. Wang, J.; Li, X.; Li, Q.; Zhang, F.; Li, Y. Accumulated permanent strain and critical dynamic stress of frozen silty clay under cyclic loading. Cold Reg. Sci. Technol. 2018, 153, 130–143. [Google Scholar] [CrossRef]
  15. Xu, X.; Li, Q.; Lai, Y.; Pang, W.; Zhang, R. Effect of moisture content on mechanical and damage behavior of frozen loess under triaxial condition along with different confining pressures. Cold Reg. Sci. Technol. 2019, 157, 110–118. [Google Scholar] [CrossRef]
  16. Zhao, F.; Chang, L.; Zhang, W. Experimental investigation of dynamic shear modulus and damping ratio of Qinghai-Tibet frozen silt under multi-stage cyclic loading. Cold Reg. Sci. Technol. 2019, 170, 102938. [Google Scholar] [CrossRef]
  17. Wu, Z.; Zhang, D.; Zhao, T.; Ma, J.; Zhao, D. An experimental research on damping ratio and dynamic shear modulus ratio of frozen silty clay of the Qinghai-Tibet engineering corridor. Transp. Geotech. 2019, 21, 100269. [Google Scholar] [CrossRef]
  18. Wu, G.; Li, G.; Bing, H.; Chen, D.; Tang, L.; Jia, H. Effects of confining pressure and temperature on strength and deformation behavior of frozen saline silty clay. Sci. Cold Arid Reg. 2023, 15, 1–10. [Google Scholar] [CrossRef]
  19. Zhu, Z.; Jia, J.; Zhang, F. A damage and elastic-viscoplastic constitutive model of frozen soil under uniaxial impact loading and its numerical implementation. Cold Reg. Sci. Technol. 2020, 175, 103081. [Google Scholar] [CrossRef]
  20. Zhu, Z.; Fu, T.; Ning, J.; Li, B. Mechanical behavior and constitutive model of frozen soil subjected to cyclic impact loading. Int. J. Impact Eng. 2023, 177, 104531. [Google Scholar] [CrossRef]
  21. Wang, D.; Liu, E.; Zhang, D.; Yue, P.; Wang, P.; Kang, J.; Yu, Q. An elasto-plastic constitutive model for frozen soil subjected to cyclic loading. Cold Reg. Sci. Technol. 2021, 189, 103341. [Google Scholar] [CrossRef]
  22. Tang, C.; Zhu, Z.; Ma, Y.; Yao, Z.; Tan, Q.; Liu, Z.; Xu, J.; Zheng, S. Numerical simulation for vibration-induced settlement and permanent deformation accumulation in permafrost subgrades of the Qinghai-Tibet Railway. Comput. Geotech. 2024, 167, 106047. [Google Scholar] [CrossRef]
  23. Shastri, A.; Sánchez, M.; Gai, X.; Lee, M.; Dewers, T. Mechanical behavior of frozen soils: Experimental investigation and numerical modeling. Comput. Geotech. 2021, 138, 104361. [Google Scholar] [CrossRef]
  24. Zhou, Z.; Li, G.; Shen, M.; Wang, Q. Dynamic responses of frozen subgrade soil exposed to freeze-thaw cycles. Soil Dyn. Earthq. Eng. 2022, 152, 107010. [Google Scholar] [CrossRef]
  25. Li, Z.; Wang, W.; Xu, L.; Peng, B. Long-term freeze–thaw cycle behavior of high-speed railway embankment in frozen soil regions and its effects on train-track dynamic interaction system. Transp. Geotech. 2024, 46, 101237. [Google Scholar] [CrossRef]
  26. Li, T.; Kong, L.; Guo, A. The deformation and microstructure characteristics of expansive soil under freeze–thaw cycles with loads. Cold Reg. Sci. Technol. 2021, 192, 103393. [Google Scholar] [CrossRef]
  27. Cui, G.; Liu, Z.; Ma, S.; Zhou, C. Dynamic characteristics of carbonate saline soil under freeze–thaw cycles in the seasonal frozen soil region. Alex. Eng. J. 2023, 81, 384–394. [Google Scholar] [CrossRef]
  28. Chen, Q.; Ghimire, B.; Su, L.; Liu, Y. Micro-scale investigations on the mechanical properties of expansive soil subjected to freeze-thaw cycles. Cold Reg. Sci. Technol. 2024, 219, 104128. [Google Scholar] [CrossRef]
  29. Zhou, Z.; Ma, W.; Zhang, S.; Mu, Y.; Li, G. Effect of freeze-thaw cycles in mechanical behaviors of frozen loess. Cold Reg. Sci. Technol. 2018, 146, 9–18. [Google Scholar] [CrossRef]
  30. Li, B.; Zhu, Z.; Zhang, F.; Chunyu, Z.; Li, T. Impact mechanical properties of frozen soil after experiencing freeze–thaw cycles: Experimental and numerical study. Cold Reg. Sci. Technol. 2023, 213, 103914. [Google Scholar] [CrossRef]
  31. Zhai, B.; Leng, W.; Xu, F.; Zhang, S.; Ye, X.; Leng, H. Critical dynamic stress and shakedown limit criterion of coarse-grained subgrade soil. Transp. Geotech. 2020, 23, 100354. [Google Scholar] [CrossRef]
  32. Zhao, Y.; Lai, Y.; Pei, W.; Fan, Y. An anisotropic bounding surface elastoplastic constitutive model for frozen sulfate saline silty clay under cyclic loading. Int. J. Plast. 2020, 129, 102668. [Google Scholar] [CrossRef]
  33. Zhou, Z.; Shen, M.; Wang, Q. Critical dynamic stress for the frozen subgrade soil. Road Mater. Pavement Des. 2023, 24, 935–959. [Google Scholar] [CrossRef]
  34. Peellage, W.H.; Fatahi, B.; Rasekh, H. Assessment of cyclic deformation and critical stress amplitude of jointed rocks via cyclic triaxial testing. J. Rock Mech. Geotech. Eng. 2023, 15, 1370–1390. [Google Scholar] [CrossRef]
  35. Li, Y.; Nie, R.; Yue, Z.; Leng, W.; Guo, Y. Dynamic behaviors of fine-grained subgrade soil under single-stage and multi-stage intermittent cyclic loading: Permanent deformation and its prediction model. Soil Dyn. Earthq. Eng. 2021, 142, 106548. [Google Scholar] [CrossRef]
  36. Wang, J.; Li, Y.; Yang, P.; Ling, X.; Zhao, Y.; Su, L. Experimental investigation on dynamic characteristics of fiber-binder modified subgrade filler after freezing-thawing under cyclic loading. Transp. Geotech. 2023, 39, 100936. [Google Scholar] [CrossRef]
  37. Cui, G.; Zhu, C.; Xi, C.; Ma, S.; Liu, Z.; Zhang, D. Experimental study of the dynamic characteristics of Songhua River silt with fine grains under freeze-thaw cycles using asymmetric hysteresis. Cold Reg. Sci. Technol. 2022, 196, 103511. [Google Scholar] [CrossRef]
  38. Zhou, Z.; Ma, W.; Li, G.; Shen, M. A novel evaluation method for accumulative plastic deformation of granular materials subjected to cyclic loading: Taking frozen subgrade soil as an example. Cold Reg. Sci. Technol. 2020, 179, 103152. [Google Scholar] [CrossRef]
  39. GB/T 50123-2019; Chinese Standard for Soil Test Method. The Ministry of Housing and Urban-Rural Development of the People’s Republic of China: Beijing China, 2019.
  40. TB10102-2010; Railway Engineering Geotechnical Test Specification. People’s Republic of China Ministry of Railways/Railway Press: Beijing China, 2011.
  41. Wichtmann, T.; Niemunis, A.; Triantafyllidis, T. Strain accumulation in sand due to cyclic loading: Drained triaxial tests. Soil Dyn. Earthq. Eng. 2005, 25, 967–979. [Google Scholar] [CrossRef]
  42. Karg, C.; Haegeman, W. Elasto-plastic long-term behavior of granular soils: Experimental investigation. Soil Dyn. Earthq. Eng. 2009, 29, 155–172. [Google Scholar] [CrossRef]
  43. Cerni, G.; Cardone, F.; Virgili, A.; Camilli, S. Characterisation of permanent deformation behaviour of unbound granular materials under repeated triaxial loading. Constr. Build. Mater. 2012, 28, 79–87. [Google Scholar] [CrossRef]
  44. Wang, L.; Weng, Z.; Wang, T.; Liu, Q.; Li, G.; Zhao, Y. Critical dynamic stress and accumulative deformation evolution of embankment silty clay subjected to cyclic freeze-thaw. Shock Vib. 2021, 2021, 9068254. [Google Scholar] [CrossRef]
  45. Liu, H.; Wang, C.; Wu, D.; Liu, X.; Zhang, Z. Deformation and critical dynamic stress for compacted volcanic ash subjected to monotonic and dynamic loads. Constr. Build. Mater. 2022, 358, 129454. [Google Scholar] [CrossRef]
Figure 1. Distribution pattern of particle sizes within frozen soil [14].
Applsci 14 11419 g001
Figure 2. Experimental equipment of the dynamic triaxial test.
Applsci 14 11419 g002
Figure 3. Cyclic loading pattern applied to frozen soil and axial stress–strain relationship. (a) Sample under cyclic loading; (b) Repeated cyclic loading variation to frozen soil; (c) axial stress–strain relationship [14].
Applsci 14 11419 g003
Figure 4. Loading program.
Applsci 14 11419 g004
Figure 5. Permanent deformation behavior under cyclic loading [14,43].
Applsci 14 11419 g005
Figure 6. The correlation between cumulative axial strain and the number of loading cycles, across different temperature conditions.
Applsci 14 11419 g006
Figure 7. The correlation between cumulative axial strain and the number of loading cycles, at varying moisture.
Applsci 14 11419 g007
Figure 8. The interplay between the vertical cumulative strain rate and the vertical cumulative strain, influenced by varying temperatures or moisture contents.
Applsci 14 11419 g008
Figure 9. The vertical cumulative strain rates for regions A, B, and C, corresponding to varying numbers of loading cycles, are depicted at different temperatures.
Applsci 14 11419 g009
Figure 10. Correlation between the respective vertical cumulative strain rates and the loading cycle count for regions A, B, and C, influenced by varying water content levels.
Applsci 14 11419 g010
Figure 11. Threshold interval for the permanent deformation characteristics of frozen soil at varying temperatures.
Applsci 14 11419 g011
Figure 12. Limit range of permafrost permanent deformation behavior for different water contents.
Applsci 14 11419 g012
Figure 13. Accumulated strain differentials at different temperatures.
Applsci 14 11419 g013
Figure 14. Accumulated strain differentials at different moisture.
Applsci 14 11419 g014
Figure 15. Alteration in cumulative strain difference as a function of dynamic stress across varying temperatures.
Applsci 14 11419 g015
Figure 16. Alteration in cumulative strain difference as a function of dynamic stress across varying moisture.
Applsci 14 11419 g016
Figure 17. CDS under the influence of temperature and moisture content.
Applsci 14 11419 g017
Table 1. Summary of testing conditions.
Test Seriesσ3,0 (MPa)σ1,0 (MPa)η0 = q0/p0p0 (MPa)T (°C)Ω (%)σd (MPa)
S1: D51-D550.751.20.50.9−7141.2, 2.3, 3.2, 2.8, 4.5
S2: D56-D600.751.20.50.9−9141.6, 2.3, 3.2, 3.6, 6.0
S3: D61-D650.751.20.50.9−11143.0, 4.0, 3.5, 4.5, 6.5
S4: D66-D700.751.20.50.9−13143.6, 4.2, 4.8, 4.5, 8.0
S5: D71-D760.751.20.50.9−3140.8, 1.2, 1.0, 1.4, 1.6, 4.2
S6: D77-D820.751.20.50.9−5110.8, 1.2, 2.0, 2.6, 2.3, 4.8
S7: D83-D880.751.20.50.9−512.51.2, 1.8, 2.4, 2.1, 2.6, 4.5
S8: D89-D940.751.20.50.9−518.51.2, 1.5, 2.0, 2.3, 1.8, 4.2
S9: D95-D1000.751.20.50.9−515.51.2, 1.0, 1.5, 1.8, 2.1, 4.0
Table 2. Fitting curves and parameters for the relationship between cumulative strain difference and dynamic stress.
Test SequenceFormulas εsub = a*eb*xabR2
S1:D51–D55εsub = 0.15e0.85x0.150.850.994
S2:D56–D60εsub = 0.10e0.79x0.100.790.998
S3:D61–D65εsub = 0.05e0.79x0.050.790.997
S4:D66–D70εsub = 0.04e0.69x0.040.690.999
S5:D71–D76εsub = 0.56e0.71x0.560.710.995
S6:D77–D82εsub = 0.26e0.40x0.260.400.626
S7:D83–D88εsub = 0.10e0.97x0.100.970.997
S8: D89–D94εsub = 0.28e0.88x0.151.030.996
S9:D95–D100εsub = 0.25e0.92x0.250.920.997
Disclaimer/Publisher’s Note: The statements, opinions and data contained in all publications are solely those of the individual author(s) and contributor(s) and not of MDPI and/or the editor(s). MDPI and/or the editor(s) disclaim responsibility for any injury to people or property resulting from any ideas, methods, instructions or products referred to in the content.

