
Load Testing and Analysis of a Large Span Through Simply-Supported Steel Box Arch Bridge

Abstract
1. Introduction
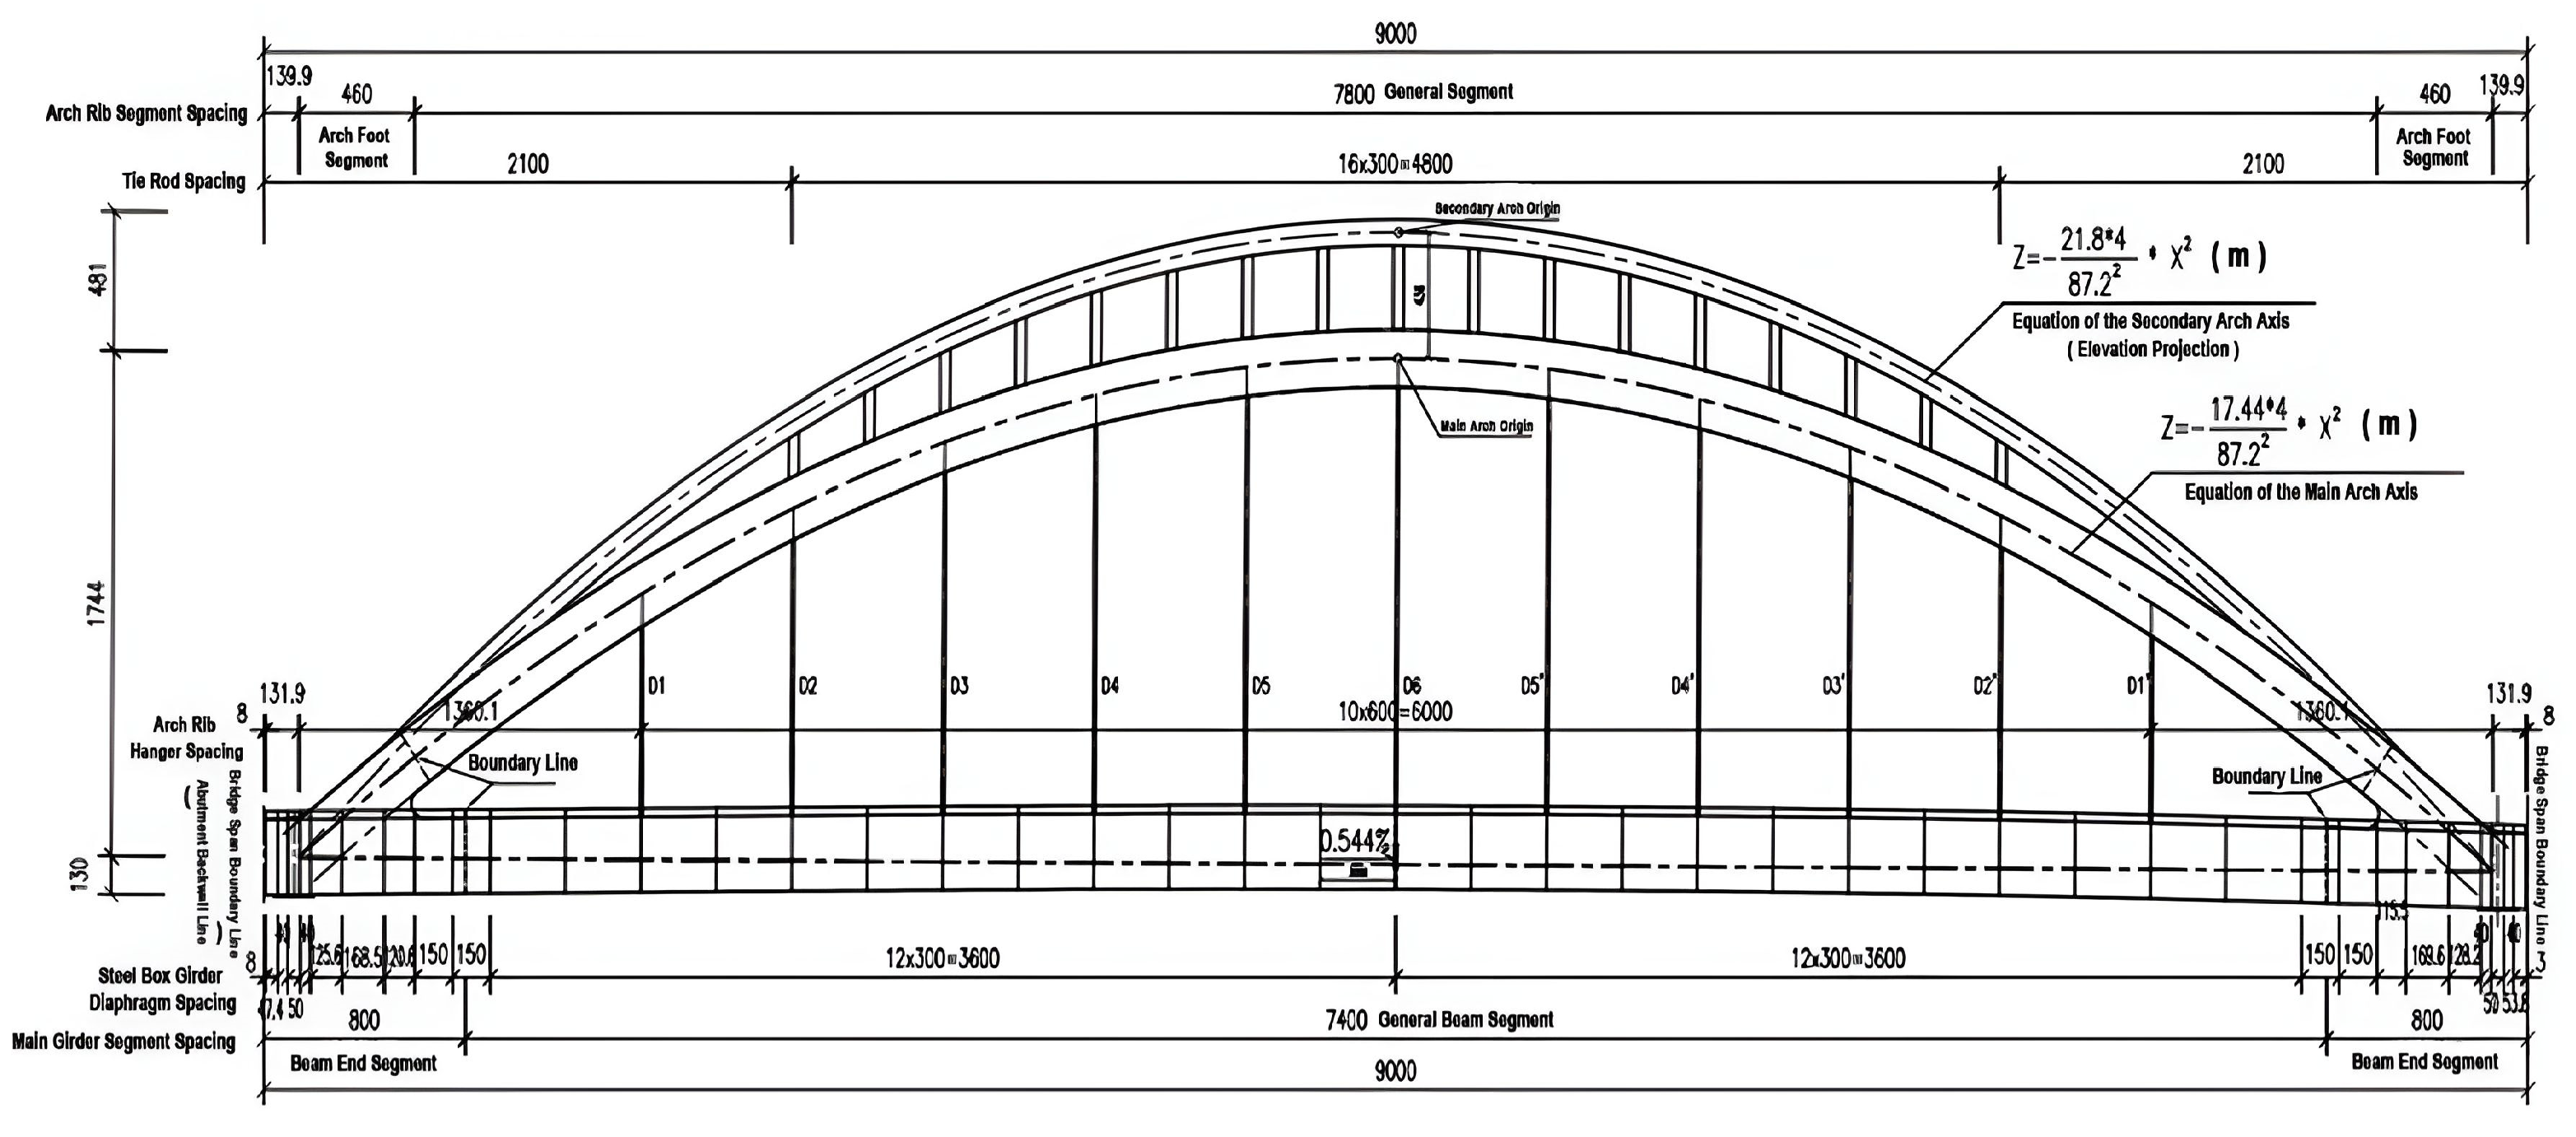
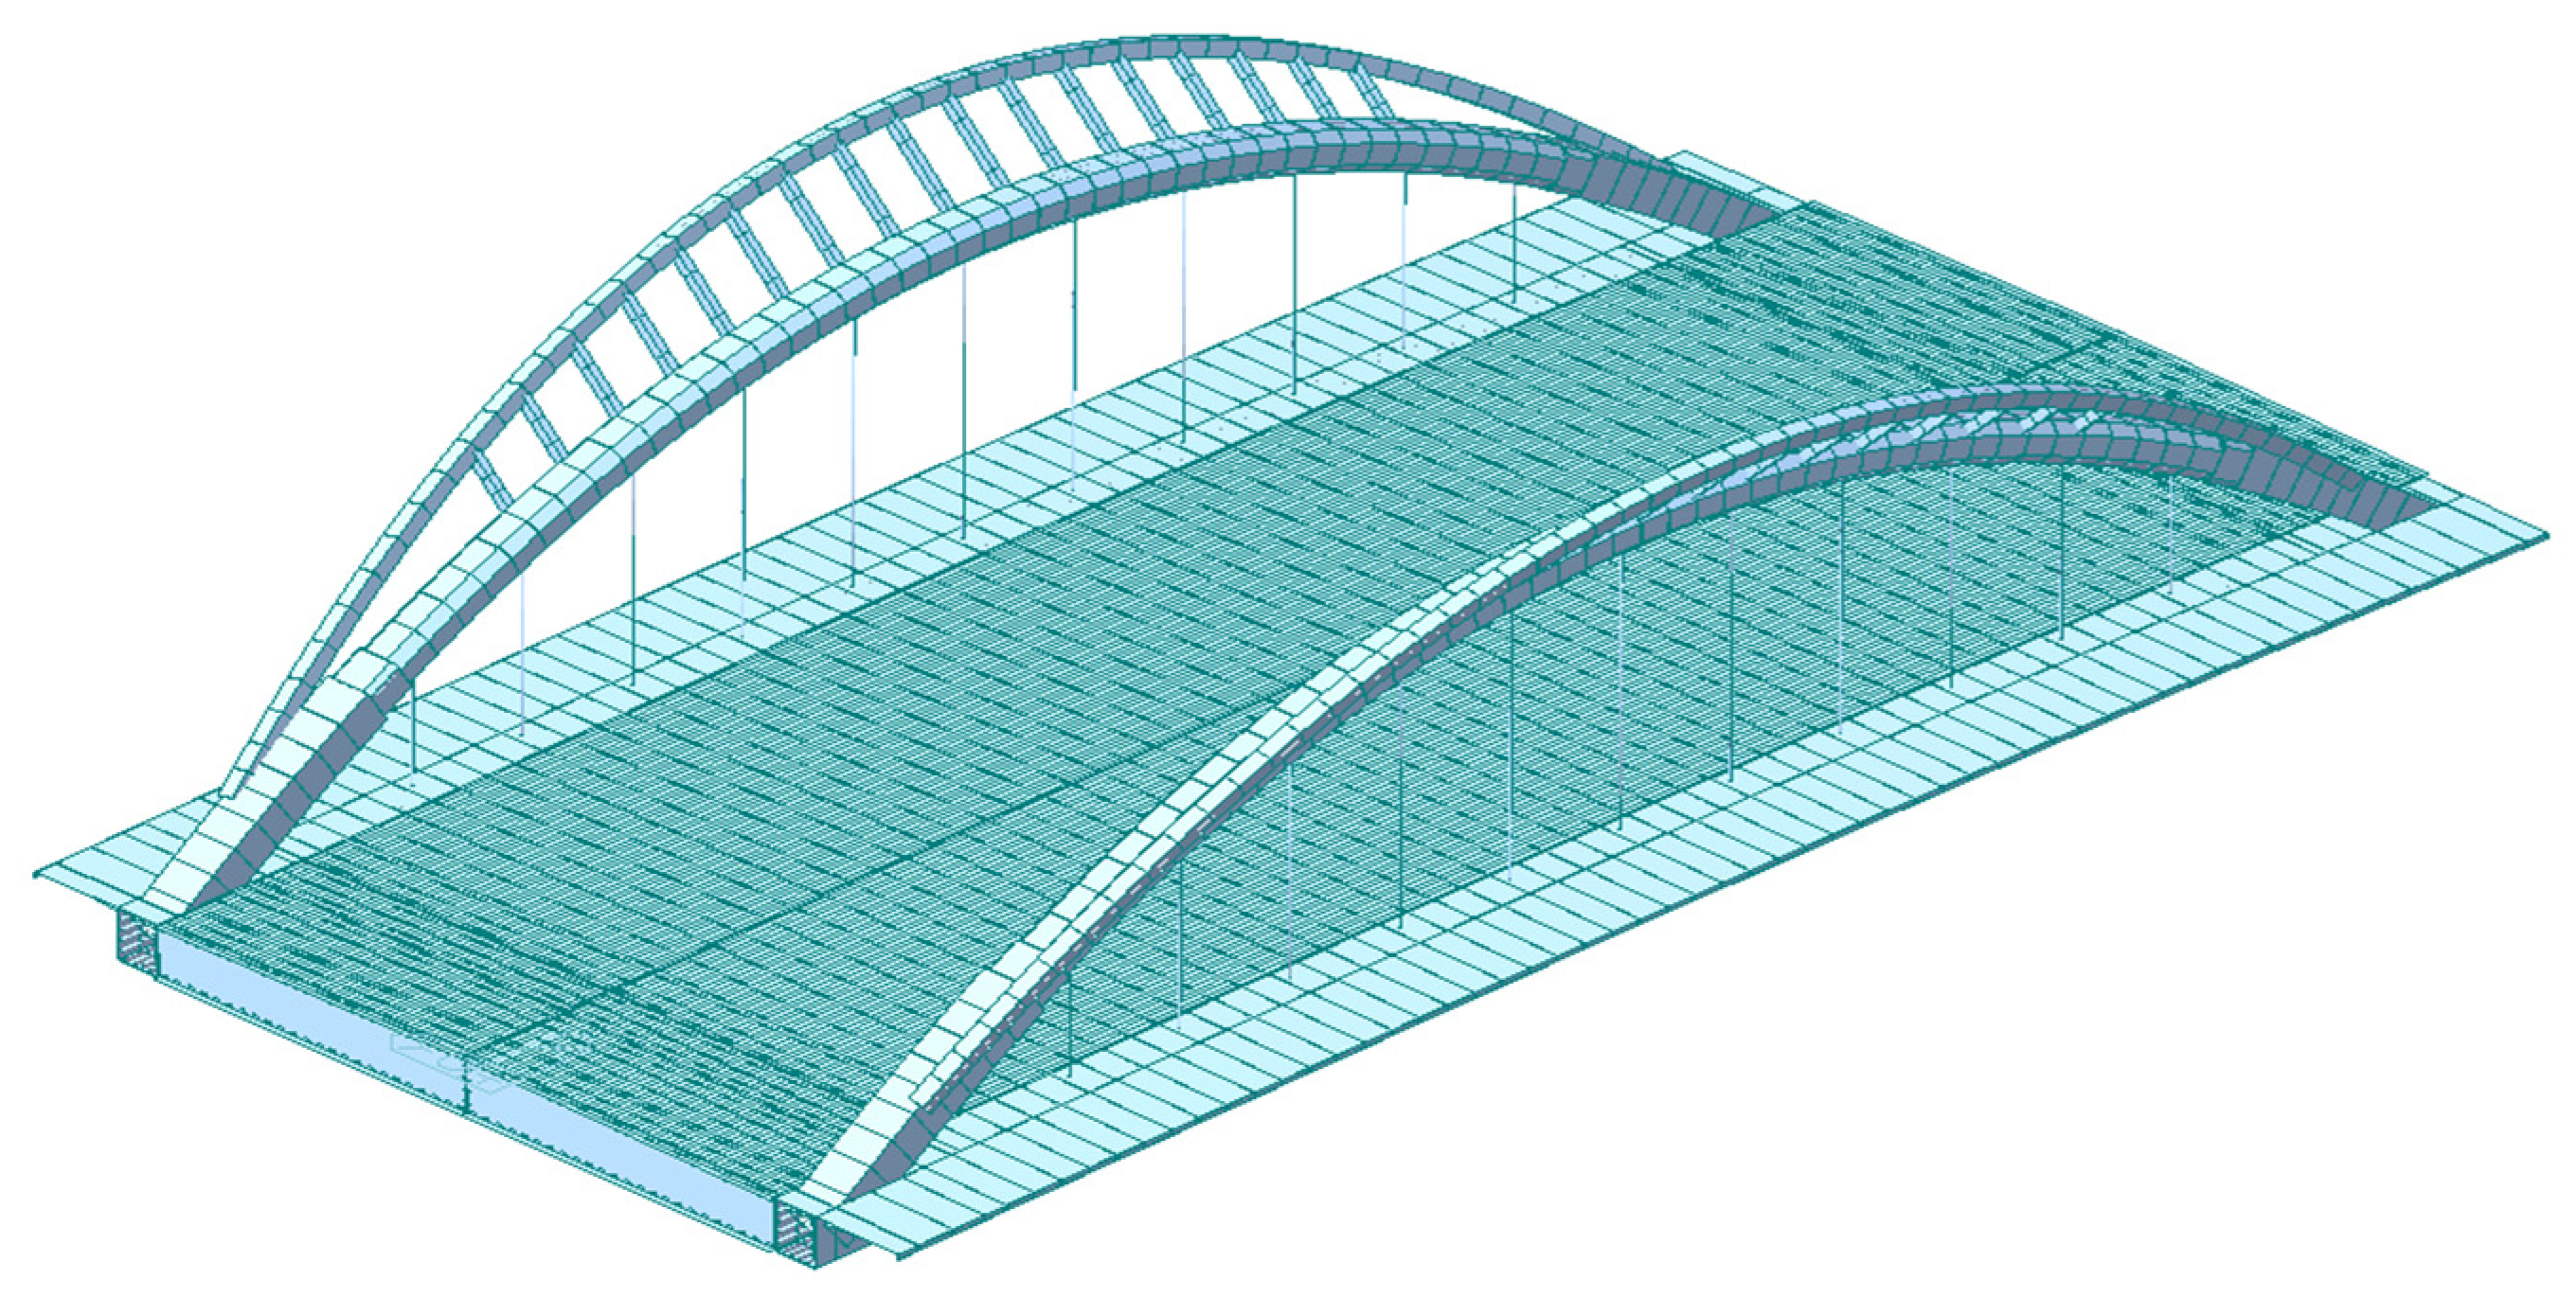
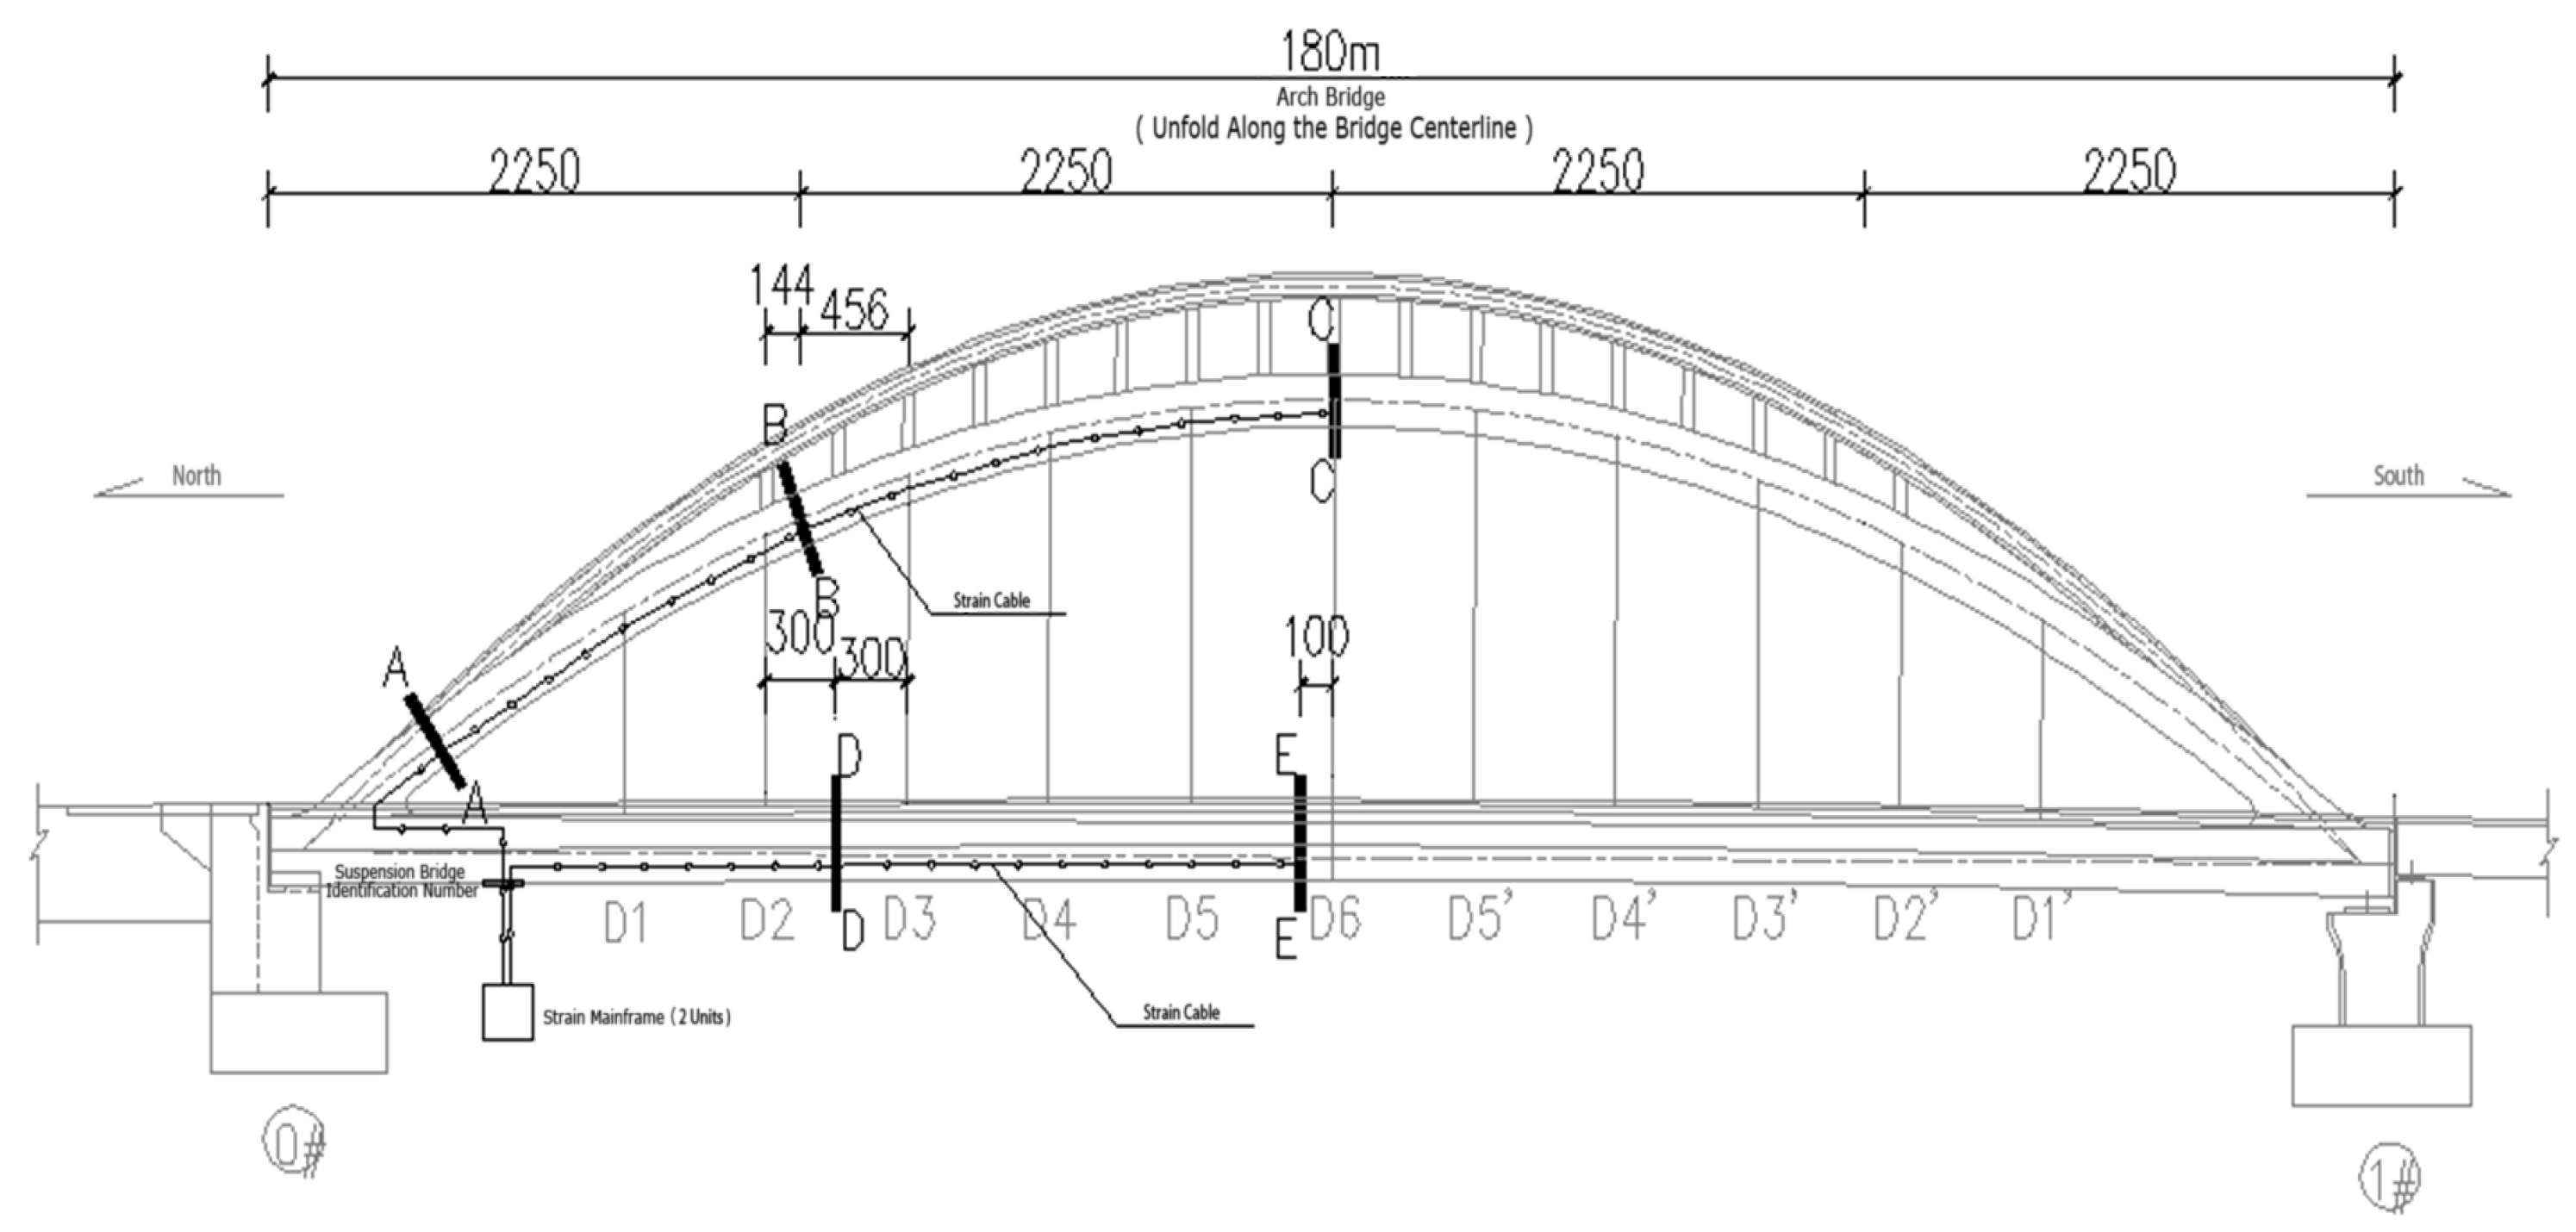
2. Project Overview
3. Experimental Content
3.1. Static Load Test
3.2. Dynamic Load Test
4. Static Load Test
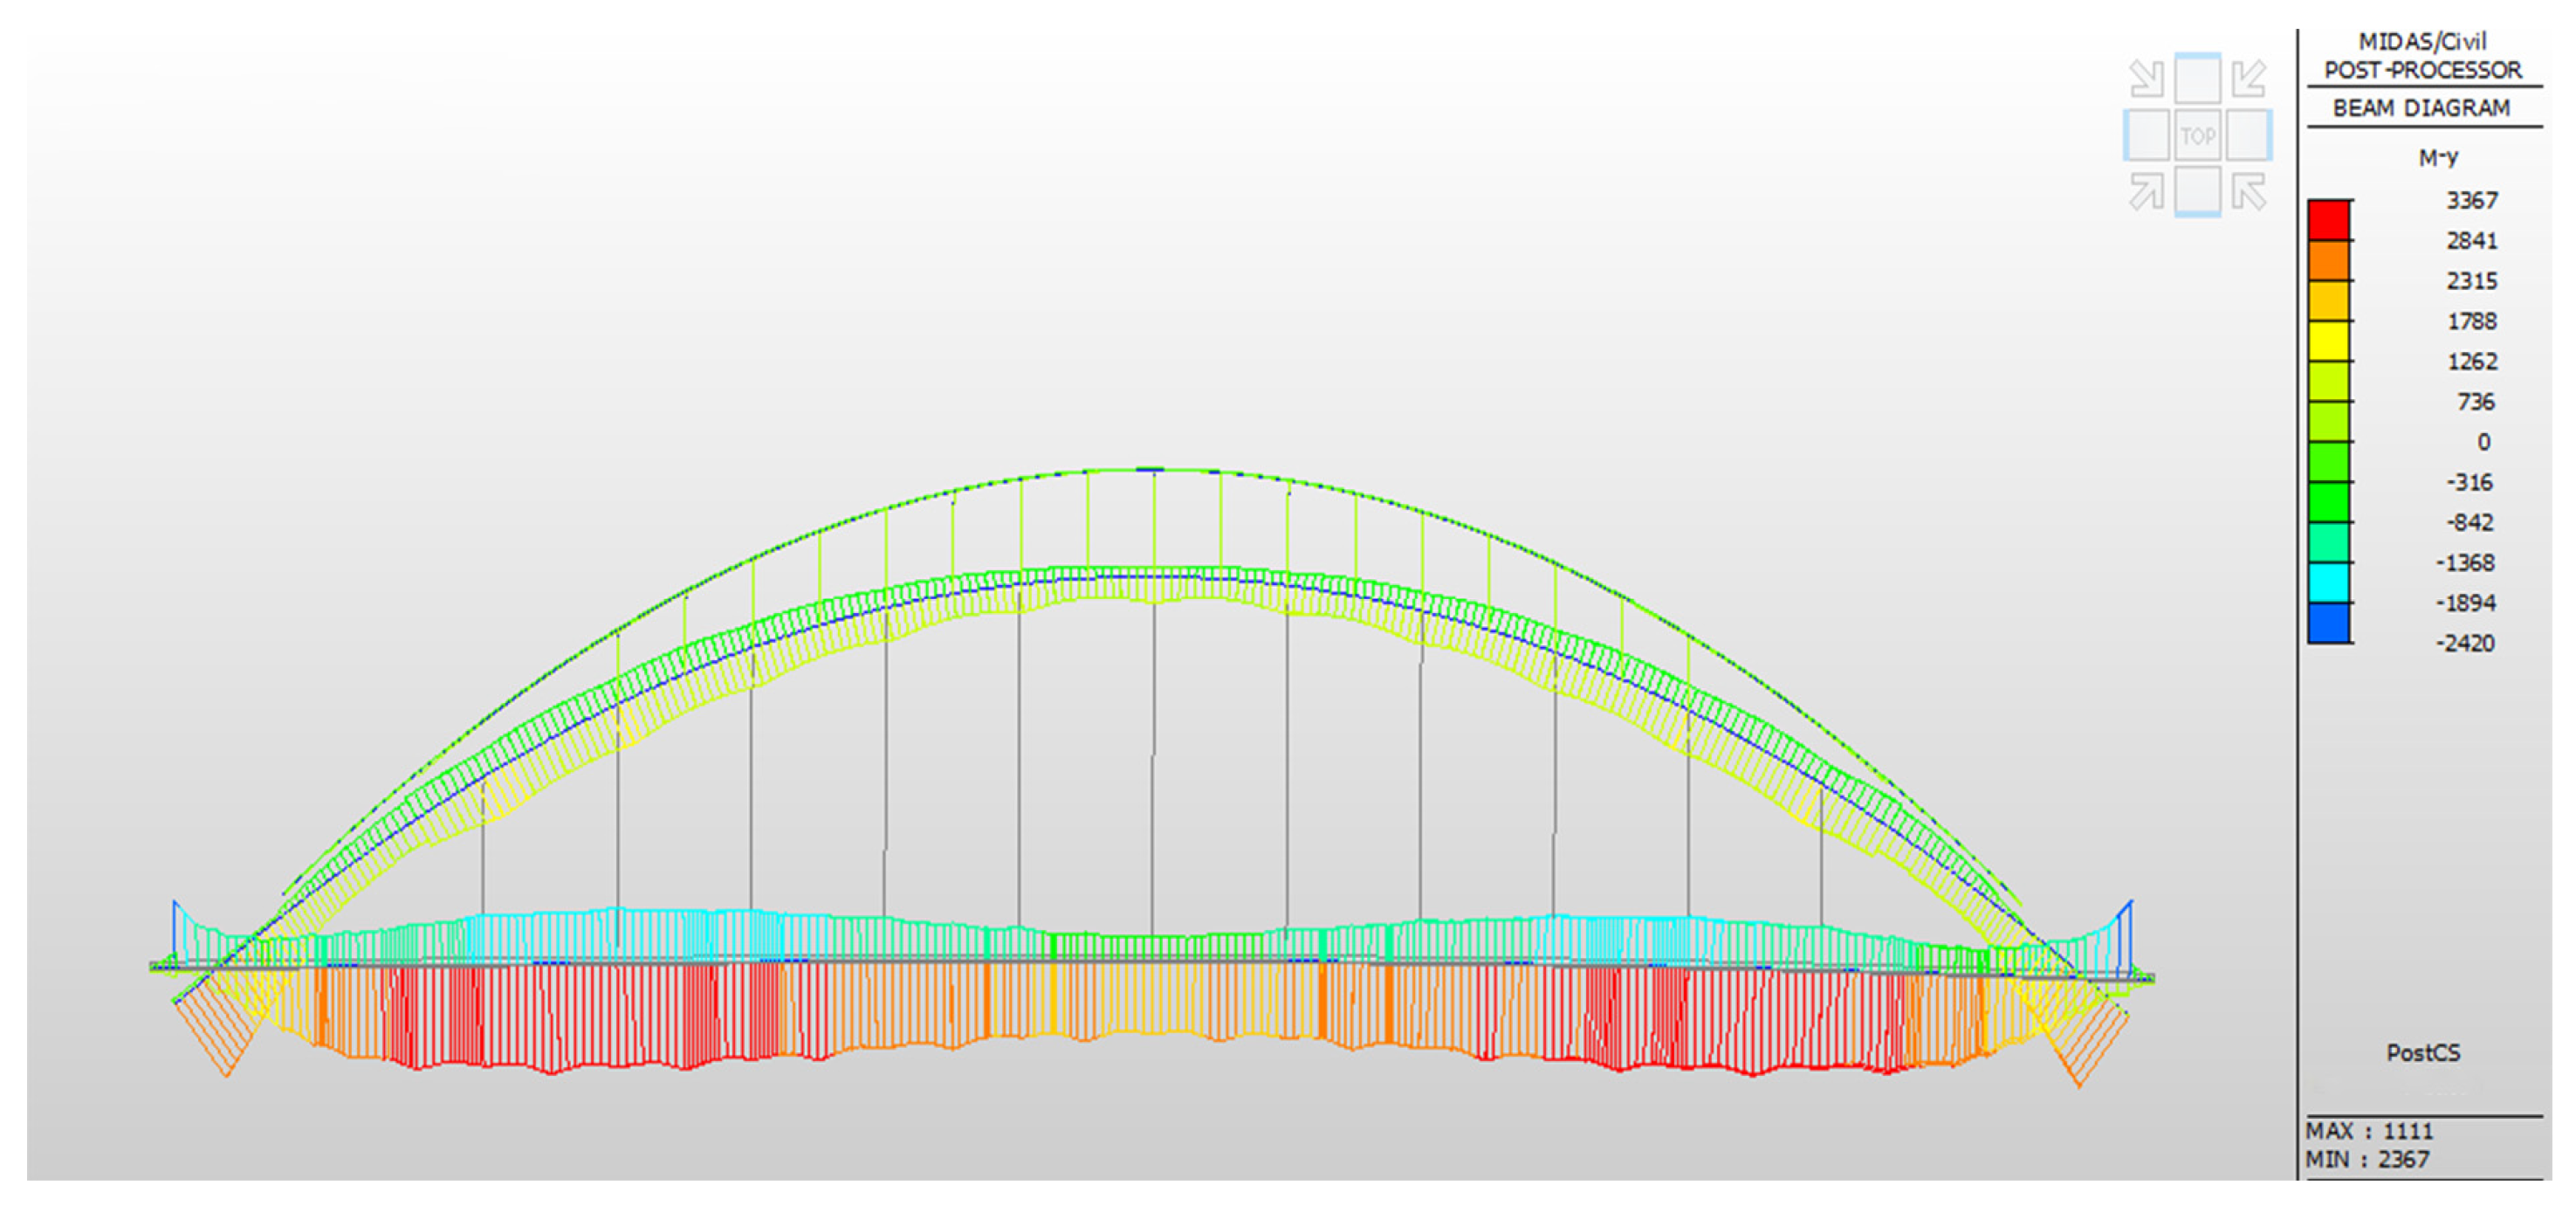
4.1. Theoretical Calculation of Static Load Test
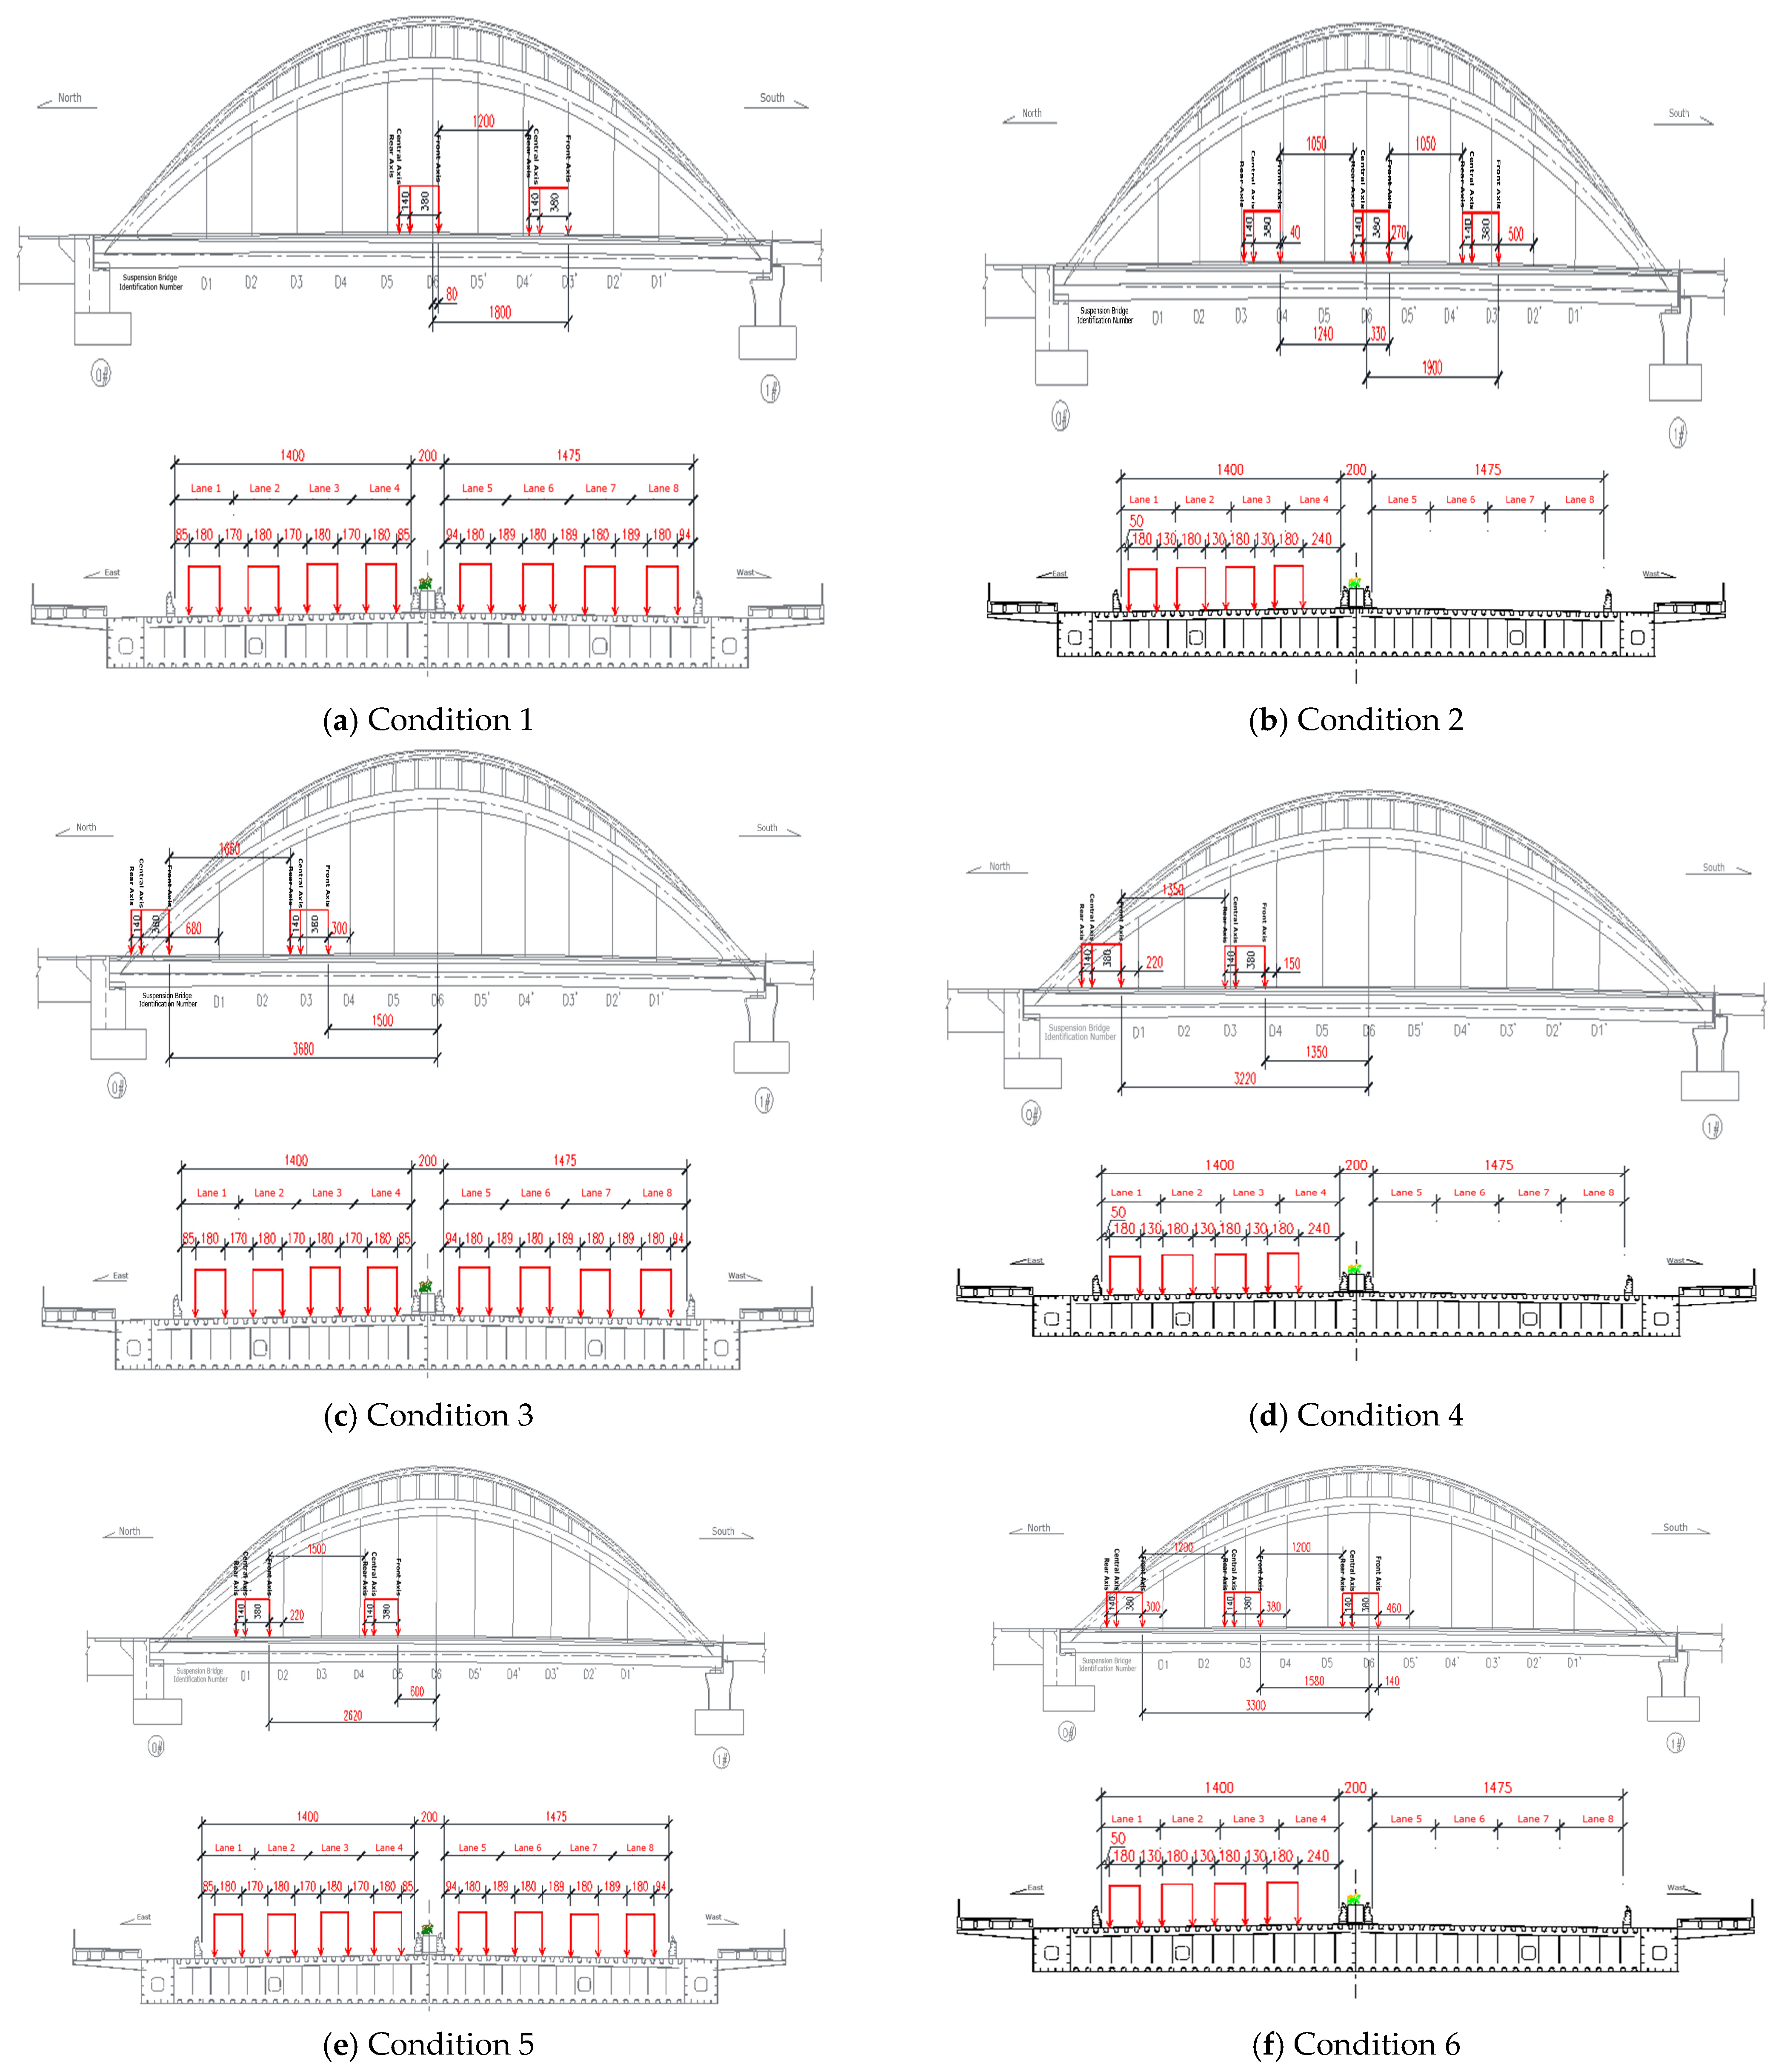
4.2. Static Load Test Conditions
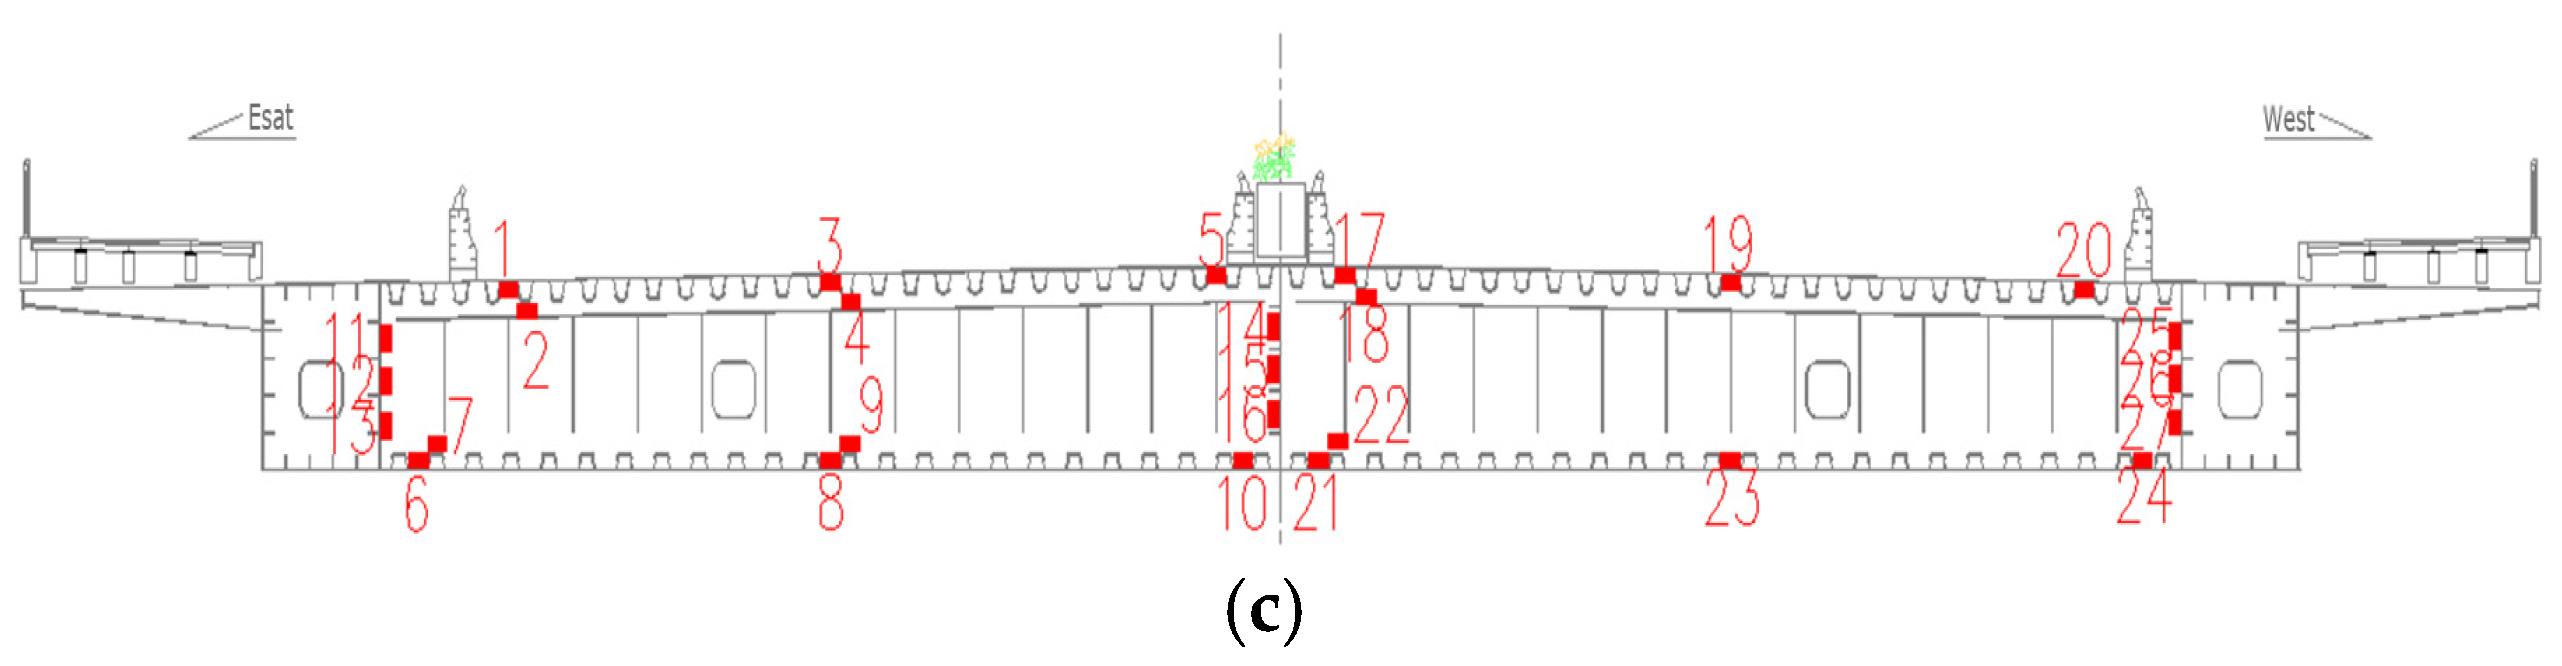
4.3. Strain Measurement Point Locations and Measurement Method
4.3.1. Static Load Test Measurement Point Layout and Load Design
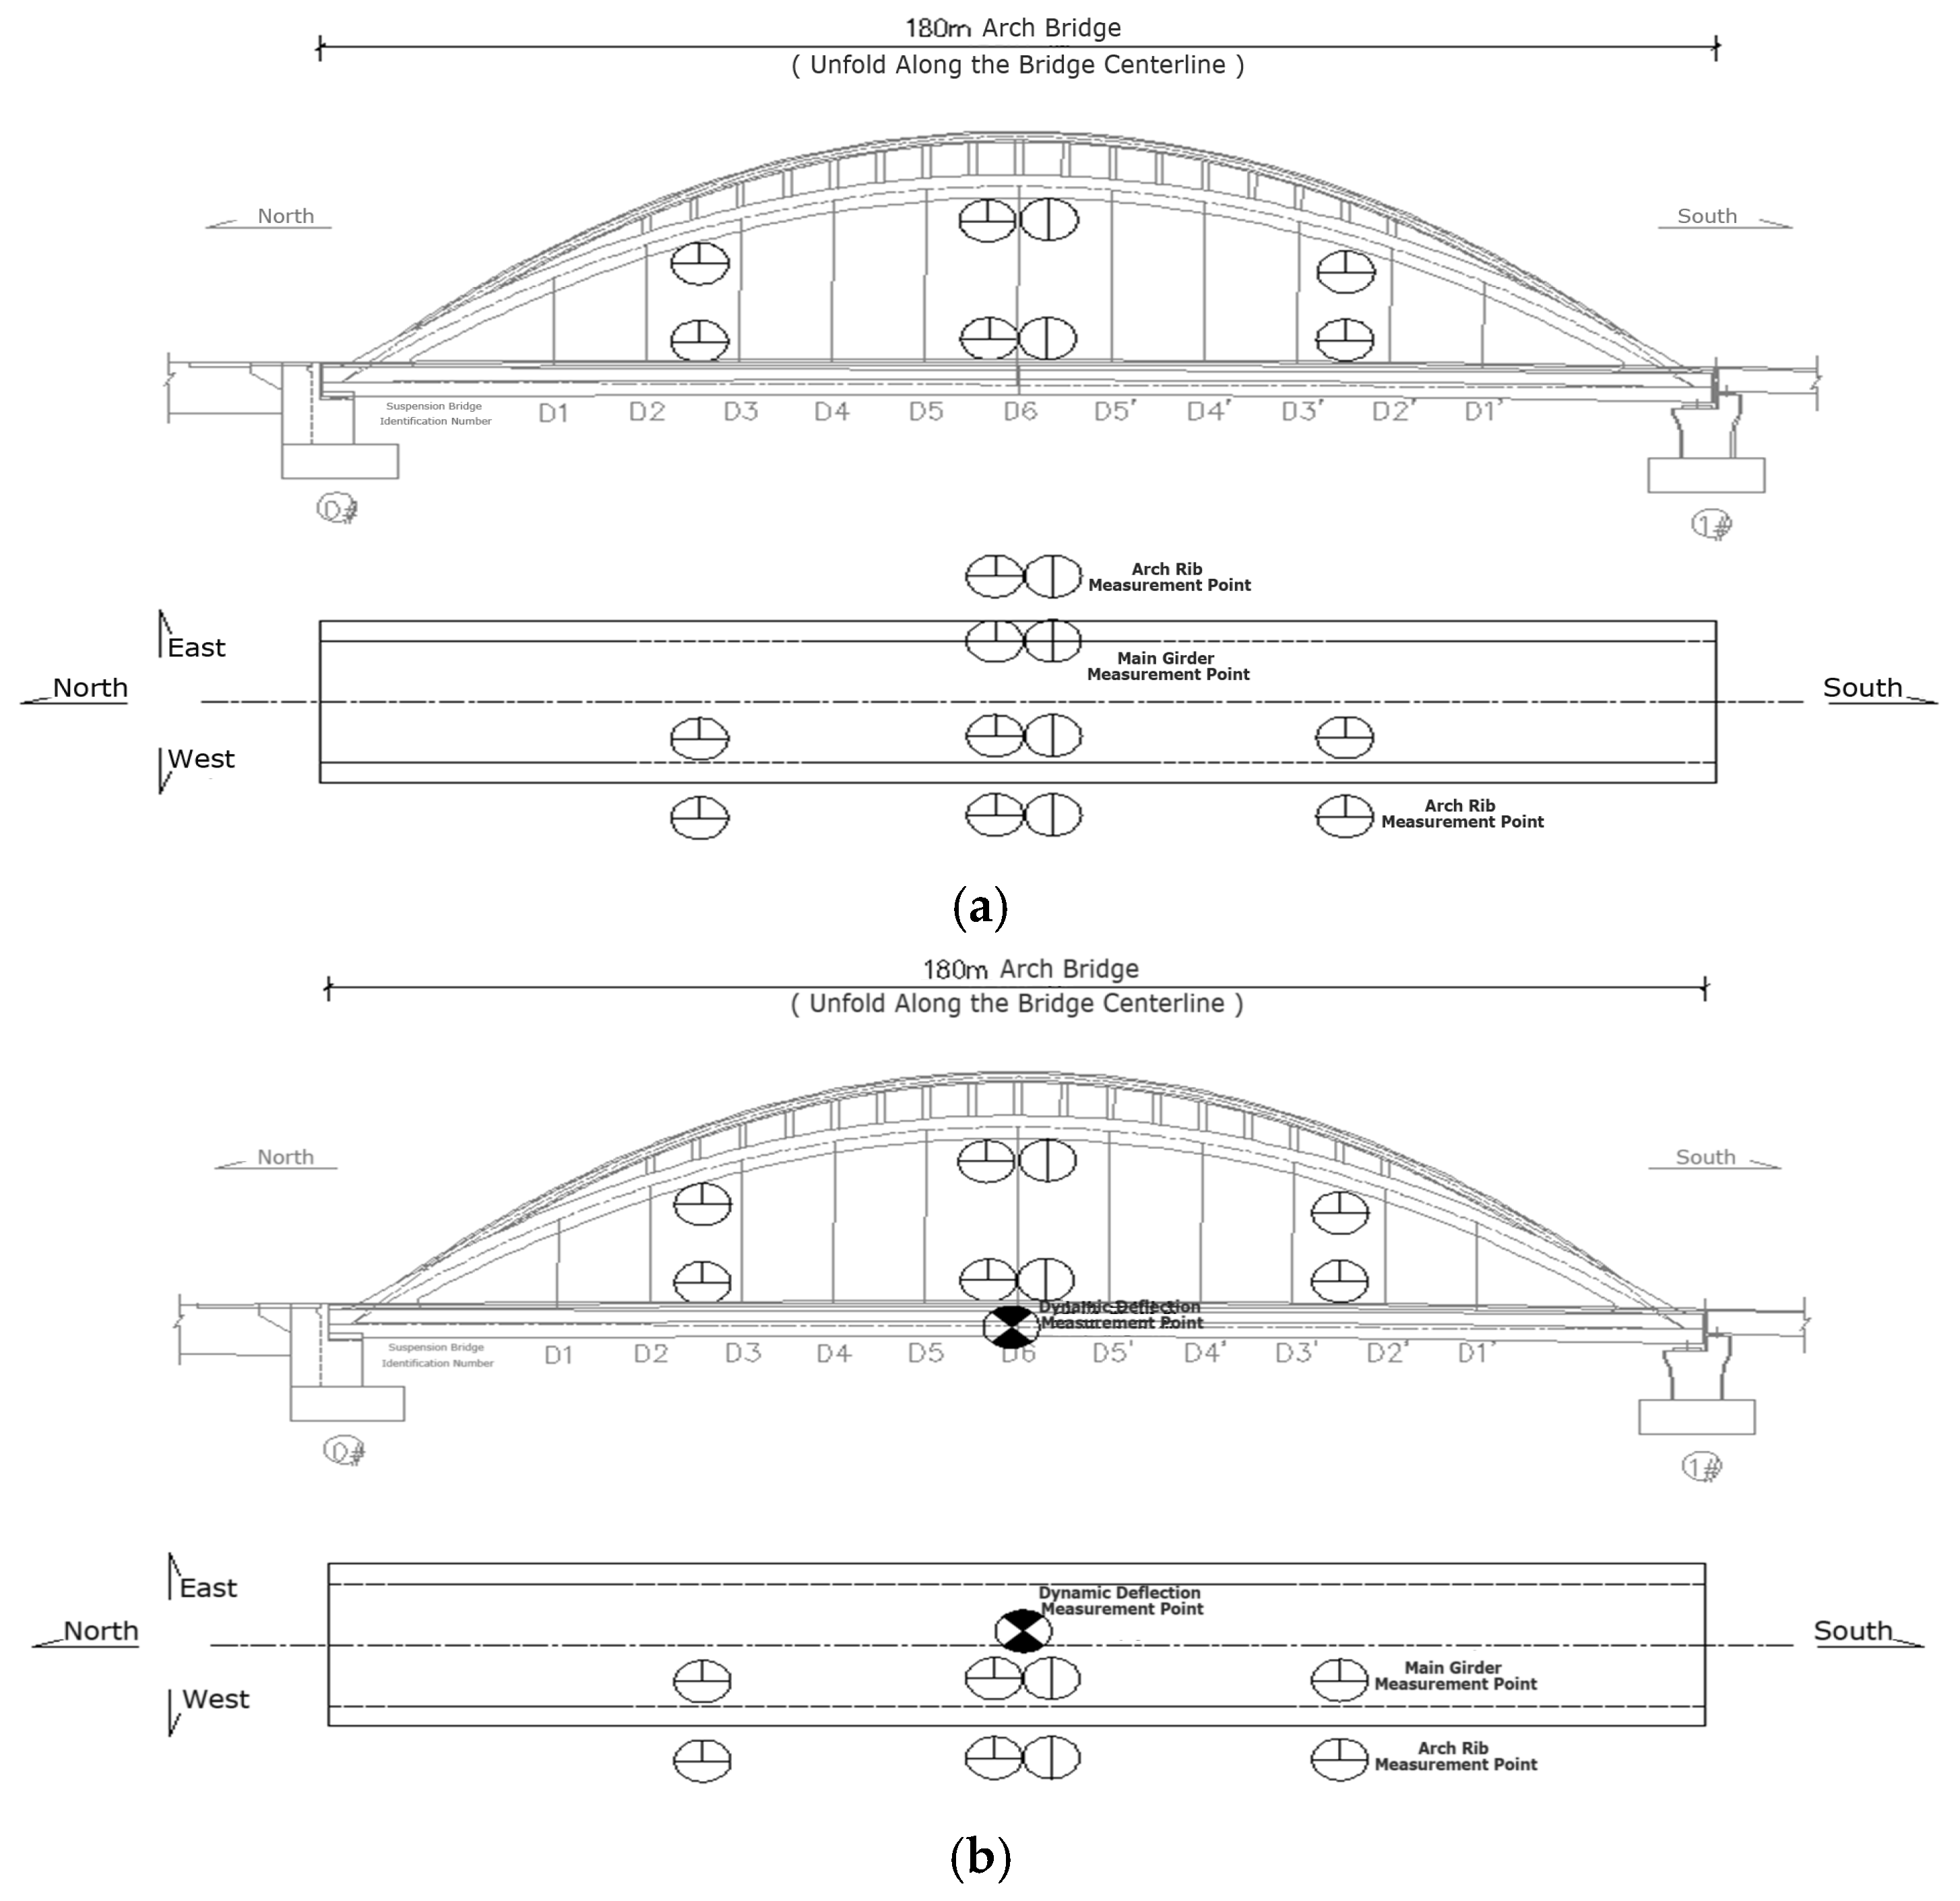
4.3.2. Deflection Measurement Point Locations
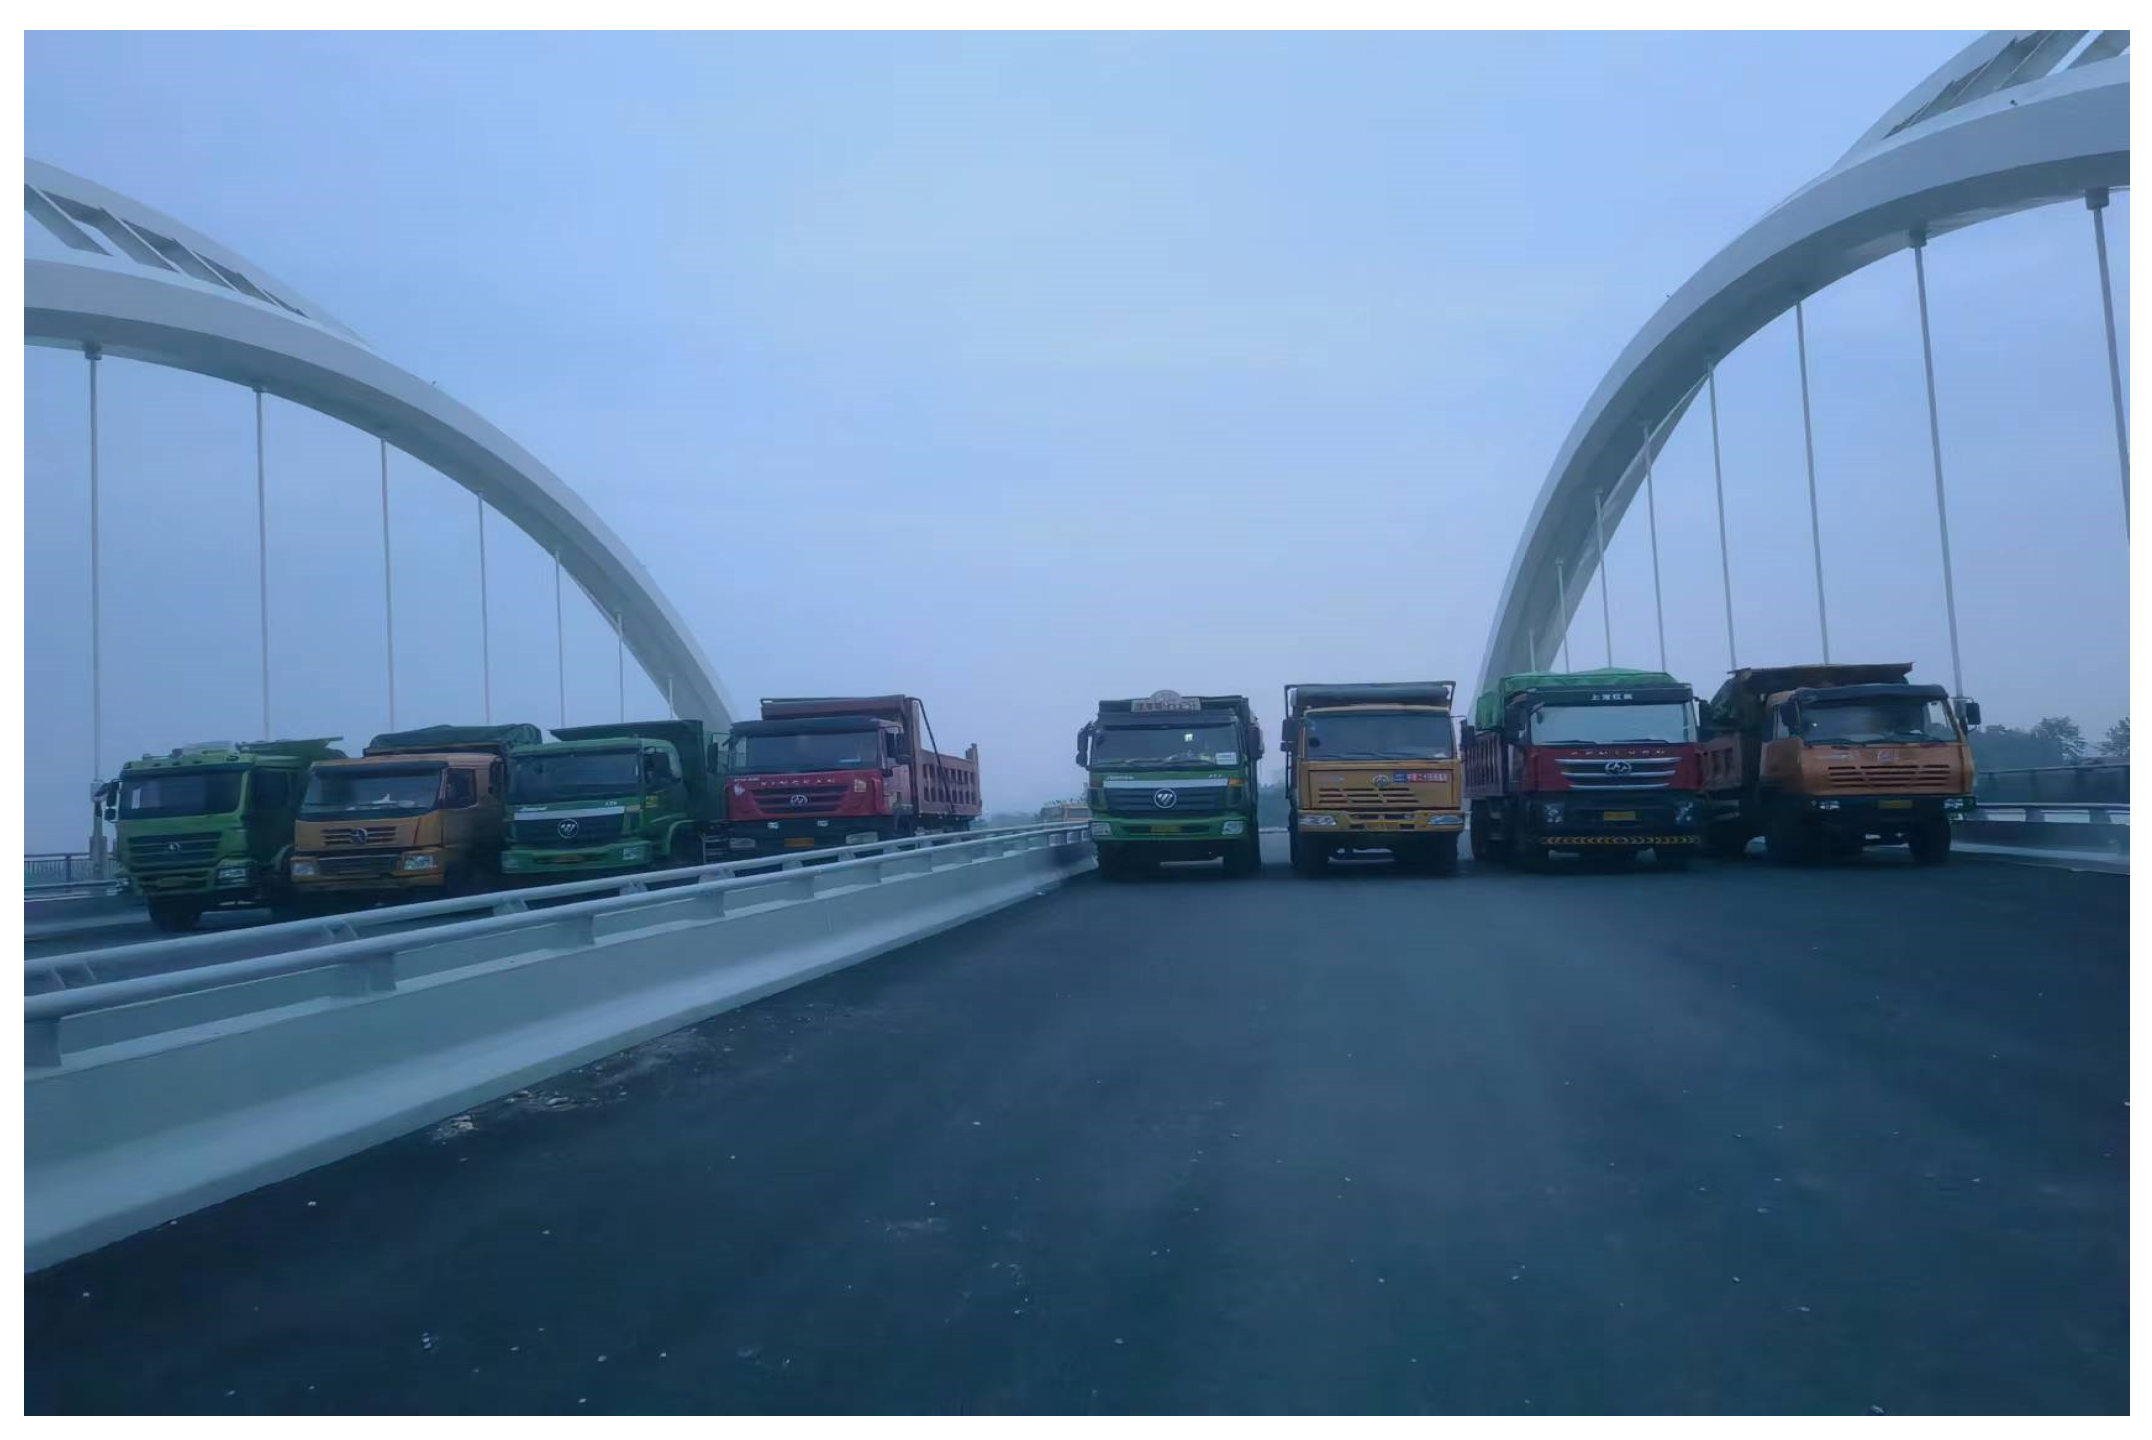
4.3.3. Loading Conditions and Wheel Position Arrangement
4.4. Static Load Test Results Data Analysis
4.4.1. Strain Analysis
4.4.2. Suspension Rod Tension Test
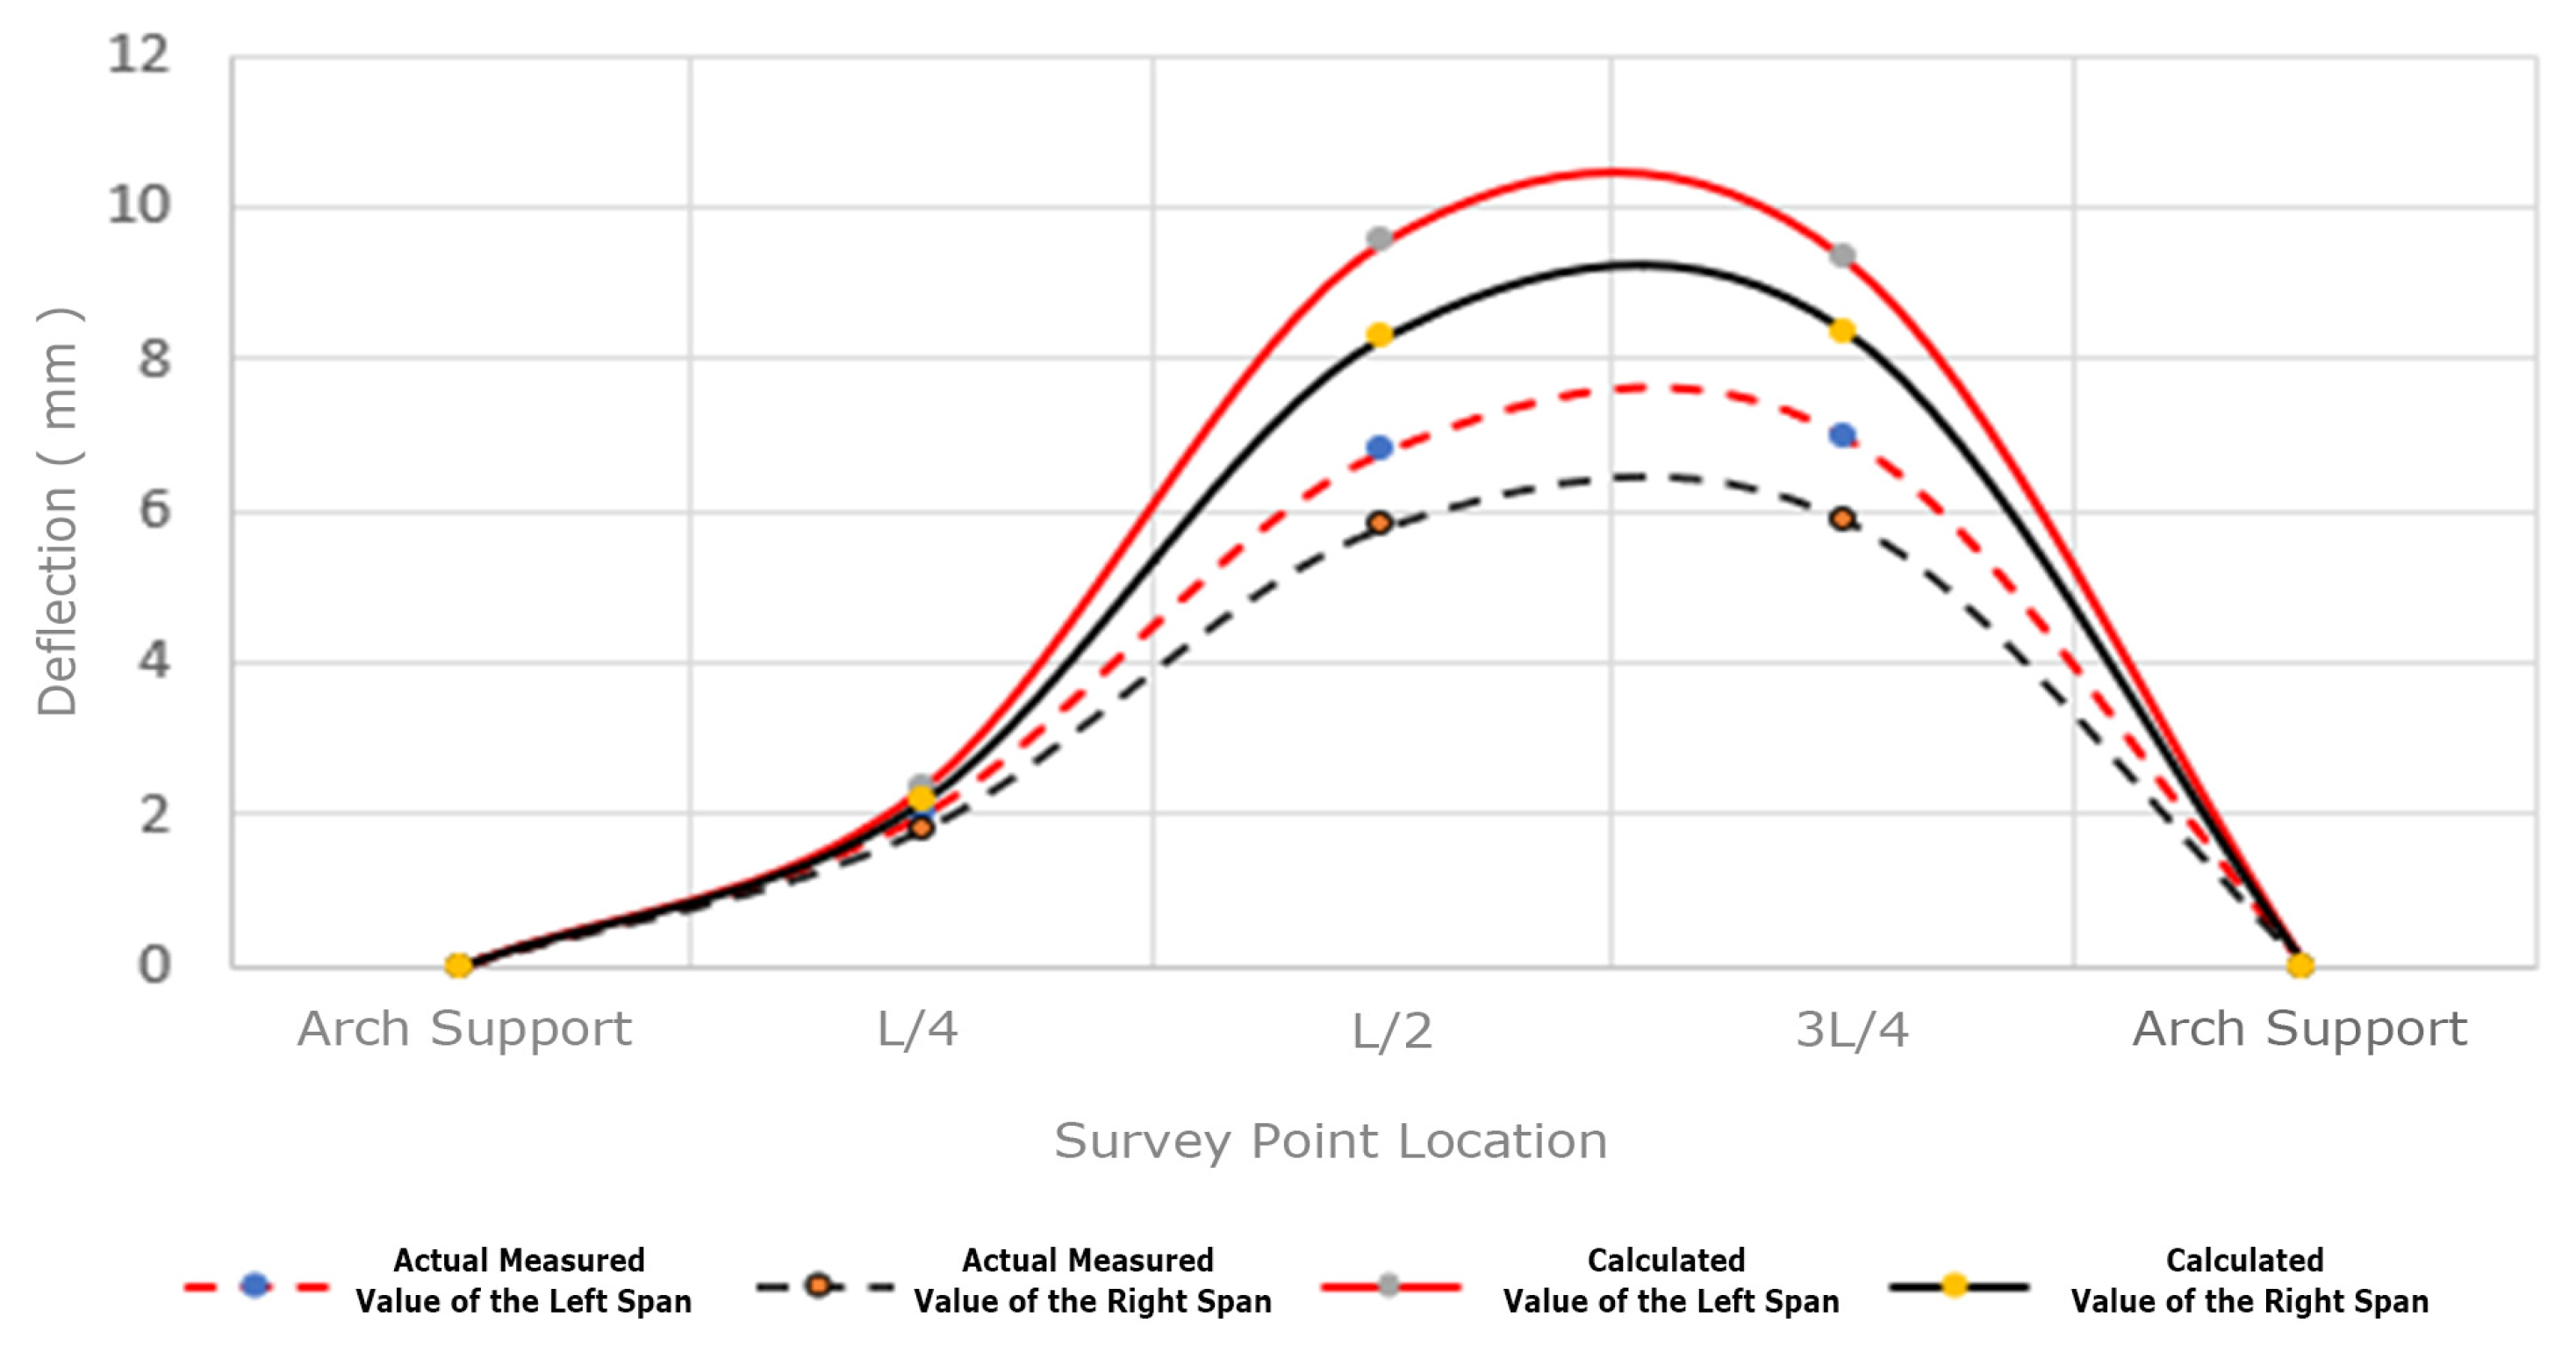
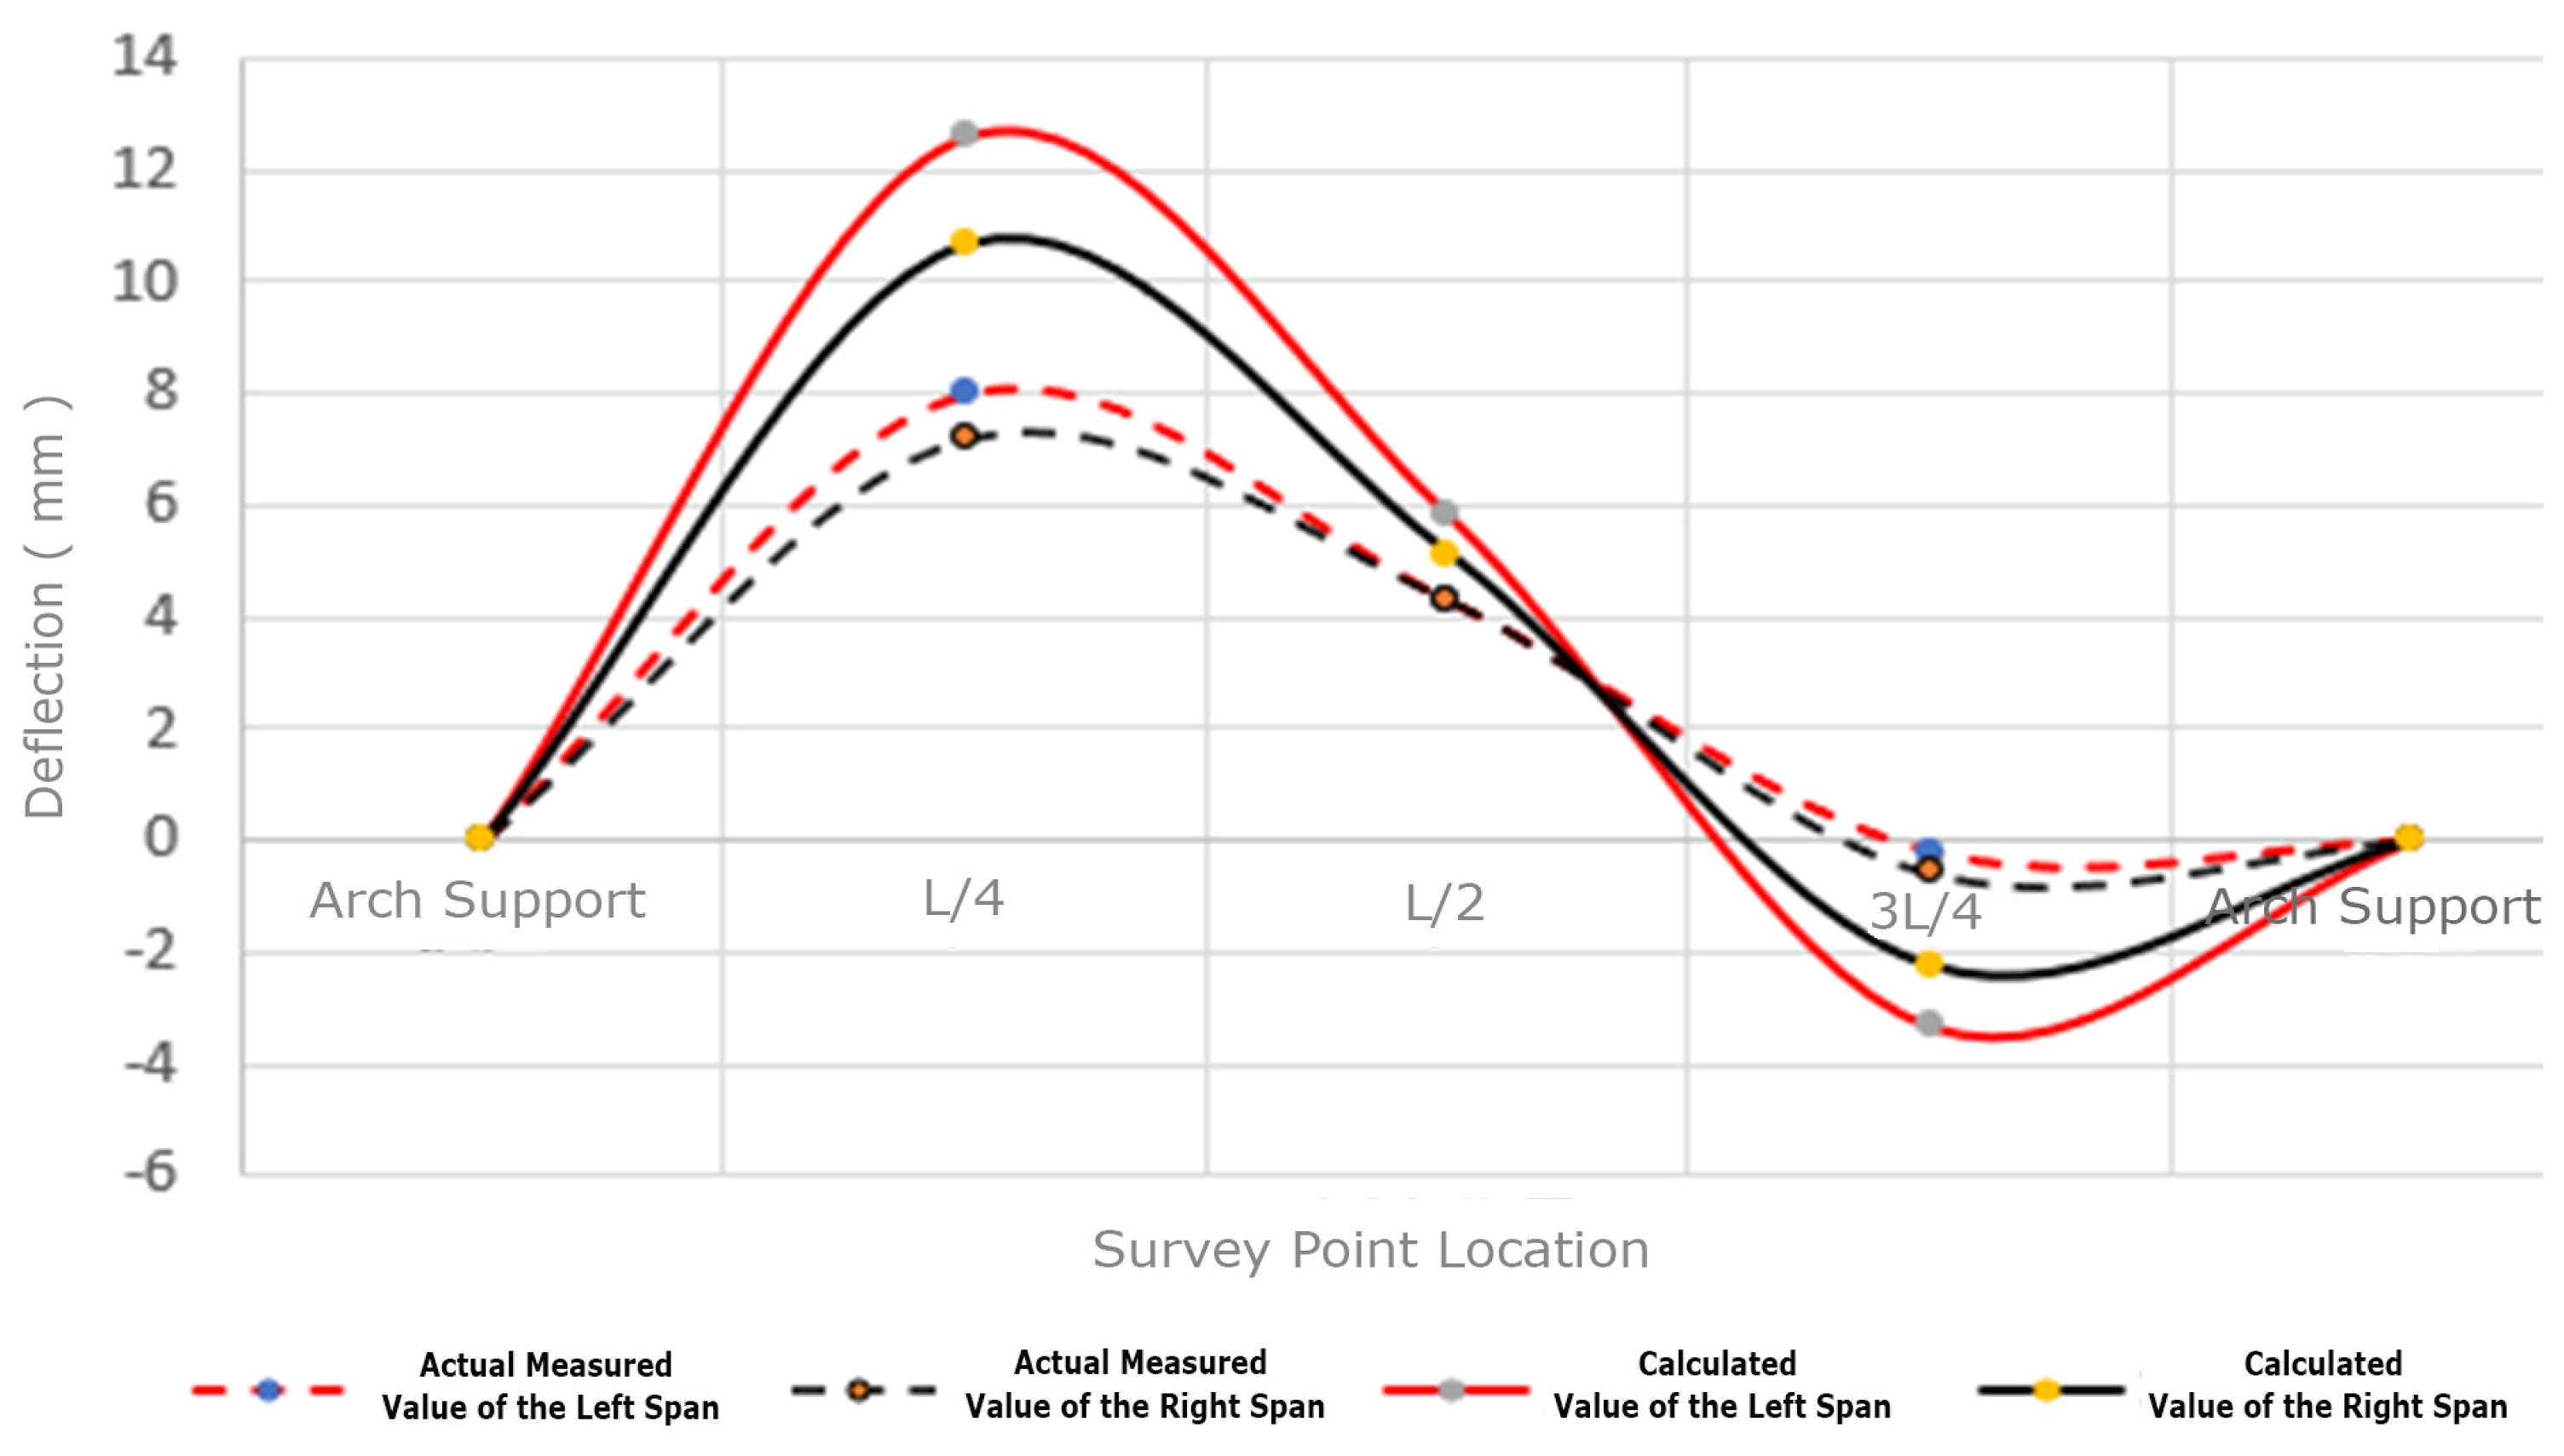
4.4.3. Deflection Analysis
5. Dynamic Load Test
5.1. Test Content
5.1.1. Dynamic Load Test Loading Conditions
5.1.2. Analysis of Test Parameters
5.2. Dynamic Load Test Measurement Point Layout
5.3. Dynamic Load Test Results and Analysis
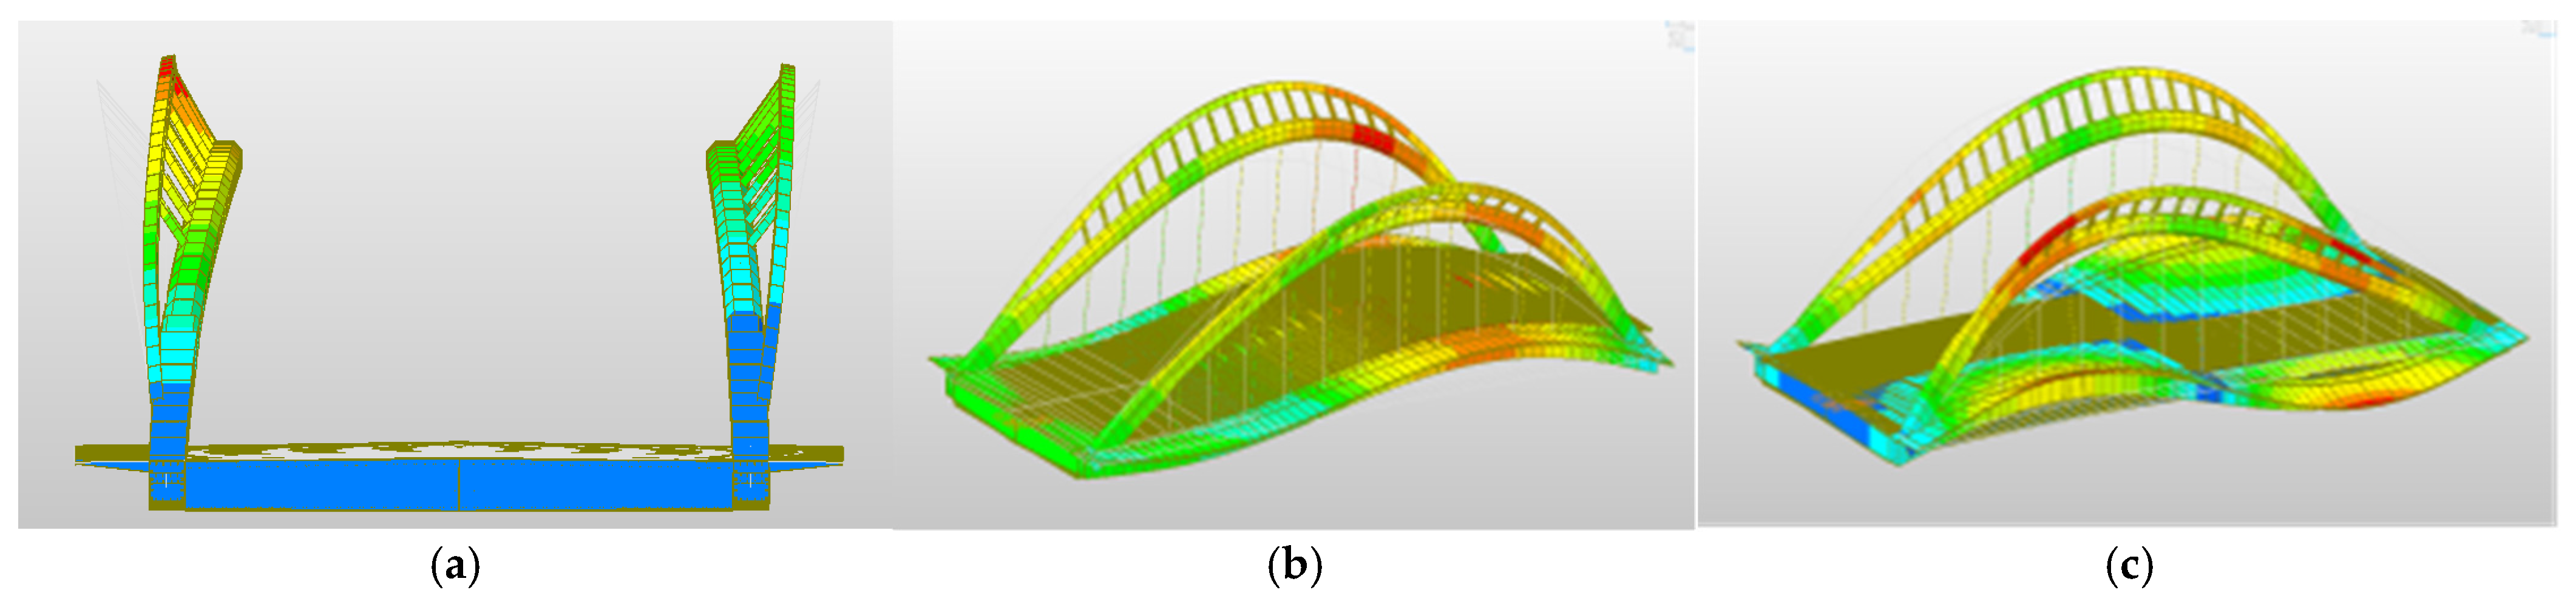
5.3.1. Results and Analysis of the Bridge’s Natural Vibration Characteristics Test
5.3.2. Forced Vibration Test Results and Analysis
- (1)
- Amplitude
- (2)
- Impact Coefficient
6. Conclusions
6.1. Results
6.2. Discussion
Author Contributions
Funding
Institutional Review Board Statement
Informed Consent Statement
Data Availability Statement
Acknowledgments
Conflicts of Interest
References
- Tian, Z. Study on Key Construction Control Technologies and Dynamic Characteristics of Long-Span Steel Box Arch Bridges. Ph.D. Thesis, Central South University, Changsha, China, 2007. [Google Scholar]
- Chen, B.; Liu, J. Overview of World Arch Bridge Construction and Technological Development. J. Traffic Transp. Eng. 2020, 20, 27–41. [Google Scholar]
- Wang, F. Key Construction Technologies for Push-Launching of Long-Span Six-Lane Simply Supported Steel Box Arch Bridges. World Bridges 2021, 49, 43–49. [Google Scholar]
- Wang, W. Design Study on Single-Line Long-Span Simply Supported Steel Box Girder Tie Arch Bridges. Railw. Constr. 2020, 60, 13–16. [Google Scholar]
- Yang, F. Study on Arch Rib Schemes of Long-Span Under-Support Type Simply Supported Tie Steel Arch Bridges. Guangdong Civ. Archit. Eng. 2020, 27, 56–58. [Google Scholar]
- Jia, Y.; Liu, Q.; Huang, Z.; Wei, Z.; Li, Q. Load Testing Research of a Large-Span Steel Box Composite Girder Bridge. Ind. Saf. Environ. Prot. 2023, 49, 24–28. [Google Scholar]
- Yu, L.; Xu, W.; Wei, D.; Zou, D.; Wu, Y. Load Testing Research on Prestressed Concrete Continuous Small Box Girder Bridges. Ind. Saf. Environ. Prot. 2022, 48, 69–73. [Google Scholar]
- Schacht, G.; Bolle, G.; Marx, S. Belastungsversuche—Internationaler Stand des Wissens. Bautechnik 2016, 93, 85–97. [Google Scholar] [CrossRef]
- Steffens, K. Experimental Structural Safety Assessment of Buildings—Fundamentals and Application Examples. Bautechnik 2002, 79, 281–283. [Google Scholar] [CrossRef]
- Domenico, D.; Messina, D.; Recupero, A. Quality control and safety assessment of prestressed concrete bridge decks through combined field tests and numerical simulation. Structures 2022, 39, 1135–1157. [Google Scholar] [CrossRef]
- Angelis, A.; Pecce, M. Model Assessment of a Bridge by Load and Dynamic Tests. Eng. Struct. 2023, 275, 115282. [Google Scholar] [CrossRef]
- Fryba, L.; Pirner, M. Load Tests and Model Analysis of Bridges. Eng. Struct. 2001, 23, 102–109. [Google Scholar] [CrossRef]
- Chen, R.; Liu, Q. A Study on the Role and Basic Principles of Load Testing for Highway Bridges. Highw. Transp. Sci. Technol. 2006, 5, 5–8. [Google Scholar]
- Deng, M.; Ren, W. Finite Element Model Correction of Continuous Box Girder Bridges Based on Static Load Test. J. Fuzhou Univ. (Nat. Sci. Ed.) 2009, 37, 261–266. [Google Scholar]
- Wang, Z.; Sun, Q.; Wang, D. Analysis of Loading Test Research on a Steel-Concrete Composite Box Girder Bridge. Appl. Mech. Mater. 2013, 438–439, 908–912. [Google Scholar] [CrossRef]
- Zeng, Y.; Zeng, Y. Bridge Structure Detection Based on Load Test. Appl. Mech. Mater. 2013, 438–439, 891–893. [Google Scholar] [CrossRef]
- Huseynov, F.; Brownjohn, J.; O’Brien, E.; Hester, D. Analysis of Load Test on Composite I-Girder Bridge. J. Civ. Struct. Health Monit. 2017, 7, 163–173. [Google Scholar] [CrossRef]
- Jia, Y.; Zhang, L.; Wu, D.; Liao, P.; Wang, Y.; Li, F. Load Testing Research of a Simply Supported Composite Beam Bridge. J. Comput. Mech. 2018, 35, 182–187. [Google Scholar]
- Li, W.; Shen, H. Static and Dynamic Load Testing of Xitang Bridge Main Span. Highw. Transp. Sci. Technol. 2004, 9, 60–63. [Google Scholar]
- Liao, P.; Zhao, R.; Jia, Y.; Lv, L.; Bai, L. Load Testing Research on a Rigid Frame Arch Bridge. J. Disaster Reduct. Eng. 2017, 37, 958–964. [Google Scholar]
- Fang, H.; Li, O. Load Testing Research of Chongqing Chaotianmen Yangtze River Bridge. Railw. Constr. 2015, 2, 12–15. [Google Scholar]
- Stathis, S.C.; Panos, P.A. Response of a historical short-span railway bridge to passing trains: 3-D deflections and dominant frequencies derived from Robotic Total Station (RTS) measurements. Eng. Struct. 2012, 45, 362–371. [Google Scholar]
- Moschas, F.; Stiros, S.C. Three-dimensional dynamic deflections and natural frequencies of a stiff footbridge based on measurements of collocated sensors. Struct. Control. Health Monit. 2014, 21, 23–42. [Google Scholar] [CrossRef]
- Xiao, Z.; Wang, J.; Li, X. Study on Eliminating Camera Jitter Errors in Visual Deflection Measurement Systems. Digit. Manuf. Sci. 2020, 18, 272–276+282. [Google Scholar]
- Lisztwan, D.; Nápravník, P.; Žítt, P.; Láník, J.; Daněk, P. Evaluation of the bowstring concrete bridge behavior using full-scale load testing. In Proceedings of the 14TH Conference of Civil and Environmental Engineering for PhD Students and Young Scientists: Young Scientist 2022 (YS22), Slovak Paradise, Slovakia, 27–29 June 2023; Volume 2887, p. 020052. [Google Scholar] [CrossRef]
- Matos, J.C.; Nicoletti, V.; Kralovanec, J.; Sousa, H.S.; Gara, F.; Moravcik, M.; Morais, M.J. Comparison of Condition Rating Systems for Bridges in Three European Countries. Appl. Sci. 2023, 13, 12343. [Google Scholar] [CrossRef]
- Wang, S.; Zhang, R.; Qi, X.; Zhao, Q. Research on the Bridge Load-Bearing Capacity Assessment Method Based on Influence Line Light Load Test. Constr. Technol. 2022, 51, 13–18. [Google Scholar]
- Wan, S.; Guan, S.; Tang, Y. Advancing Bridge Structural Health Monitoring: Insights into Knowledge-Driven and Data-Driven Approaches. J. Data Sci. Intell. Syst. 2023, 2, 129–140. [Google Scholar] [CrossRef]
- Qin, S.; Han, S.; Li, S. In-situ testing and finite element model updating of a long-span cable-stayed bridge with ballastless track. Structures 2022, 45, 1412–1423. [Google Scholar] [CrossRef]
- Wang, J.; Yue, K.; Duan, L. Models and Techniques for Domain Relation Extraction: A Survey. J. Data Sci. Intell. Syst. 2023, 1, 65–82. [Google Scholar] [CrossRef]
- CJJ/T 233-2015; Technical Code for the Inspection and Evaluation of Urban Bridges. Ministry of Housing and Urban-Rural Development: Beijing, China, 2015.
- JTG/T J21-2011; Specifications for the Inspection and Assessment of the Load-Bearing Capacity of Highway Bridges. Ministry of Transport of the People’s Republic of China: Beijing, China, 2011.
- JTG/T J21-01-2015; Load Testing Specification for Highway Bridges. Ministry of Transport of the People’s Republic of China: Beijing, China, 2015.
- JTG D60-2015; General Specification for Highway Bridges and Culverts Design. Ministry of Transport of the People’s Republic of China: Beijing, China, 2015.
- CJJ 99-2017; Urban Bridge Maintenance Technical Standard. Ministry of Housing and Urban-Rural Development: Beijing, China, 2017.


| Condition | Test Item | Design Effect | Loading Effect | Loading Efficiency |
|---|---|---|---|---|
| 1 | A-A Section (Arch Rib L/2 Section) Maximum Positive Bending Moment Effect (Medium Load) | 806.58 | 778.61 | 0.97 |
| A-A Section (Arch Rib L/2 Section) Maximum Deflection Effect (Medium Load) | −9.58 | −9.01 | 0.94 | |
| D6 Hanger Maximum Cable Force Increment (Medium Load) | 351.85 | 310.12 | 0.88 | |
| D-D Section (Tie Beam L/2 Section) Maximum Positive Bending Moment Effect (Medium Load) | 2241.31 | 2141.13 | 0.96 | |
| D-D Section (Tie Beam L/2 Section) Maximum Axial Force Effect (Medium Load) | 2269.72 | 2061.14 | 0.91 | |
| D-D Section (Tie Beam L/2 Section) Maximum Deflection Effect (Medium Load) | −15.20 | −13.65 | 0.90 | |
| 2 | A-A Section (Arch Rib L/2 Section) Maximum Positive Bending Moment Effect (Eccentric Load) | 897.41 | 827.99 | 0.92 |
| A-A Section (Arch Rib L/2 Section) Maximum Deflection Effect (Eccentric Load) | −10.83 | −9.91 | 0.92 | |
| D6 Hanger Maximum Cable Force Increment (Eccentric Load) | 395.47 | 374.37 | 0.95 | |
| D-D Section (Tie Beam L/2 Section) Maximum Positive Bending Moment Effect (Eccentric Load) | 2502.73 | 2215.12 | 0.89 | |
| D-D Section (Tie Beam L/2 Section) Maximum Axial Force Effect (Eccentric Load) | 2557.25 | 2317.88 | 0.91 | |
| D-D Section (Tie Beam L/2 Section) Maximum Deflection Effect (Eccentric Load) | −17.14 | −15.07 | 0.88 | |
| 3 | B-B Section (Arch Rib L/4 Section) Maximum Positive Bending Moment Effect (Medium Load) | 1242.50 | 1200.94 | 0.97 |
| B-B Section (Arch Rib L/4 Section) Maximum Deflection Effect (Medium Load) | −11.39 | −10.27 | 0.90 | |
| C-C Section (Tie Beam L/4 Section) Maximum Positive Bending Moment Effect (Medium Load) | 3272.06 | 2953.29 | 0.90 | |
| 4 | B-B Section (Arch Rib L/4 Section) Maximum Positive Bending Moment Effect (Eccentric Load) | 1388.99 | 1320.09 | 0.95 |
| B-B Section (Arch Rib L/4 Section) Maximum Deflection Effect (Eccentric Load) | −12.71 | −10.87 | 0.86 | |
| C-C Section (Tie Beam L/4 Section) Maximum Positive Bending Moment Effect (Eccentric Load) | 3654.82 | 3136.33 | 0.86 | |
| 5 | C-C Section (Tie Beam L/4 Section) Maximum Axial Force Effect (Medium Load) | 2412.40 | 2123.86 | 0.88 |
| C-C Section (Tie Beam L/4 Section) Maximum Deflection Effect (Medium Load) | −15.10 | −14.41 | 0.95 | |
| 6 | C-C Section (Tie Beam L/4 Section) Maximum Axial Force Effect (Eccentric Load) | 2723.41 | 2339.84 | 0.86 |
| C-C Section (Tie Beam L/4 Section) Maximum Deflection Effect (Eccentric Load) | −16.82 | −16.23 | 0.96 |
| Measurement Point Location | Measurement Point ID | Strain Test Result (με) | Calculated Value (με) | Residual Strain (με) | Residual Strain Rate (%) | Verification Factor | |
|---|---|---|---|---|---|---|---|
| East Side Arch Ring (L/4) | Top Plate | B01 | −11 | −18 | 0 | 0.0 | / |
| B02 | −21 | −26 | −1 | 4.7 | 0.81 | ||
| Web Plate | B03 | −38 | −39 | −1 | 2.6 | 0.97 | |
| B04 | −42 | −46 | 0 | 0.0 | 0.91 | ||
| Bottom Plate | B05 | −38 | −59 | −1 | 2.6 | 0.64 | |
| B06 | −53 | −66 | 0 | 0.0 | 0.80 | ||
| West Side Arch Ring (L/4) | Top Plate | B07 | −23 | −26 | 0 | 0.0 | 0.88 |
| B08 | −6 | −18 | −1 | / | / | ||
| Web Plate | B09 | −44 | −46 | 0 | 0.0 | 0.96 | |
| B10 | −33 | −39 | 0 | 0.0 | 0.85 | ||
| Bottom Plate | B11 | −57 | −66 | 0 | 0.0 | 0.86 | |
| B12 | −58 | −59 | 0 | 0.0 | 0.98 | ||
| East Side Arch Ring (L/2) | Top Plate | C01 | −45 | −57 | −1 | 2.2 | 0.79 |
| C02 | −59 | −70 | 0 | 0.0 | 0.84 | ||
| Web Plate | C03 | −23 | −32 | 0 | 0.0 | 0.72 | |
| C04 | −44 | −45 | 0 | 0.0 | 0.98 | ||
| Bottom Plate | C05 | −5 | −7 | −1 | / | 0.71 | |
| C06 | −14 | −20 | 0 | 0.0 | 0.70 | ||
| West Side Arch Ring (L/2) | Top Plate | C07 | −55 | −70 | 1 | / | 0.79 |
| C08 | −43 | −57 | 0 | 0.0 | 0.75 | ||
| Web Plate | C09 | −40 | −45 | 1 | / | 0.89 | |
| C10 | −30 | −32 | 1 | / | 0.94 | ||
| Bottom Plate | C11 | −19 | −20 | 1 | / | 0.95 | |
| C12 | −2 | −7 | 0 | 0.0 | / | ||
| Measurement Point Location | Measurement Point ID | Strain Test Result (με) | Calculated Value (με) | Residual Strain (με) | Residual Strain Rate (%) | Verification Factor | |
|---|---|---|---|---|---|---|---|
| East Side Arch Ring (Arch Foot) | Top Plate | A01 | −52 | −59 | 0 | 0.0 | 0.88 |
| A02 | −30 | −32 | −2 | 6.6 | 0.94 | ||
| Web Plate | A03 | −30 | −47 | 0 | 0.0 | 0.64 | |
| A04 | −17 | −27 | 0 | 0.0 | 0.63 | ||
| Bottom Plate | A05 | −22 | −35 | −2 | 9.0 | 0.63 | |
| A06 | −13 | −22 | 0 | 0.0 | 0.59 | ||
| West Side Arch Ring (Arch Foot) | Top Plate | A07 | −30 | −32 | −1 | 3.3 | 0.94 |
| A08 | −51 | −59 | −2 | 3.9 | 0.86 | ||
| Web Plate | A09 | −19 | −27 | −1 | 5.2 | 0.70 | |
| A10 | −33 | −47 | −1 | 3.0 | 0.70 | ||
| Bottom Plate | A11 | −15 | −22 | 0 | 0.0 | 0.68 | |
| A12 | −21 | −35 | 0 | 0.0 | 0.60 | ||
| Measurement Point Location | Measurement Point ID | Strain Test Result (με) | Calculated Value (με) | Residual Strain (με) | Residual Strain Rate (%) | Verification Factor | |
|---|---|---|---|---|---|---|---|
| East Side Tie Beam (L/2) | Top Plate | E1 | −5 | 2 | 0 | 0.0 | / |
| E2 | −12 | −1 | 0 | 0.0 | / | ||
| Bottom Plate | E3 | 51 | 72 | −1 | −2.0 | 0.71 | |
| E4 | 49 | 70 | 0 | 0.0 | 0.70 | ||
| West Side Tie Beam (L/2) | Top Plate | E5 | −11 | −1 | 1 | −9.1 | / |
| E6 | −8 | 2 | 0 | 0.0 | / | ||
| Bottom Plate | E7 | 46 | 70 | −1 | −2.2 | 0.66 | |
| E8 | 51 | 72 | −1 | −2.0 | 0.71 | ||
| Measurement Point Location | Measurement Point ID | Strain Test Result (με) | Calculated Value (με) | Residual Strain (με) | Residual Strain Rate (%) | Verification Factor | |
|---|---|---|---|---|---|---|---|
| East Side Tie Beam (L/4) | Top Plate | D01 | −20 | −24 | 0 | 0.0 | 0.83 |
| D02 | −21 | −29 | 0 | 0.0 | 0.72 | ||
| Bottom Plate | D03 | 67 | 94 | 0 | 0.0 | 0.71 | |
| D04 | 66 | 91 | 1 | 1.5 | 0.73 | ||
| West Side Tie Beam (L/4) | Top Plate | D05 | −21 | −29 | 1 | / | 0.72 |
| D06 | −16 | −24 | 1 | / | 0.67 | ||
| Bottom Plate | D07 | 62 | 91 | 0 | 0.0 | 0.68 | |
| D08 | 64 | 94 | 0 | 0.0 | 0.68 | ||
| Condition No. | Test Content | Test Parameters | |
|---|---|---|---|
| 1 | Pulsation Test | Frequency, Vibration Mode, Damping Ratio | |
| 2 | Obstruction-Free Driving Test | 10 km/h | Structural Dynamic Deflection, Impact Coefficient |
| 3 | 20 km/h | ||
| 4 | 30 km/h | ||
| 5 | 40 km/h | ||
| 6 | 50 km/h | ||
| 7 | 60 km/h | ||
| 8 | 20 km/h Jump Vehicle Test | ||
| Mode Description | Calculated Frequency (Hz) | Measured Frequency (Hz) | Damping Ratio (%) |
|---|---|---|---|
| Main Arch 1st Order Symmetrical Lateral Bending Mode | 1.140 | 1.425 | 0.41 |
| Main Beam 1st Order Antisymmetrical Vertical Bending Mode | 1.710 | 2.95 | 0.63 |
| Main Beam 1st Order Torsional Mode | 1.948 | 3.60 | 0.77 |
| Approach Bridge 1st Order Vertical Bending Mode | / | 6.375 | 1.55 |
| Condition | Impact Coefficient | Maximum Value | |
|---|---|---|---|
| 1st Measurement | 2st Measurement | ||
| 10 km/h Running Vehicle Test | 0.01 | 0.02 | 0.03 |
| 20 km/h Running Vehicle Test | 0.01 | 0.02 | |
| 30 km/h Running Vehicle Test | 0.03 | 0.02 | |
| 40 km/h Running Vehicle Test | 0.02 | 0.03 | |
| 50 km/h Running Vehicle Test | 0.03 | 0.03 | |
| 60 km/h Running Vehicle Test | 0.03 | 0.03 | |
Disclaimer/Publisher’s Note: The statements, opinions and data contained in all publications are solely those of the individual author(s) and contributor(s) and not of MDPI and/or the editor(s). MDPI and/or the editor(s) disclaim responsibility for any injury to people or property resulting from any ideas, methods, instructions or products referred to in the content. |
© 2024 by the authors. Licensee MDPI, Basel, Switzerland. This article is an open access article distributed under the terms and conditions of the Creative Commons Attribution (CC BY) license (https://creativecommons.org/licenses/by/4.0/).
Share and Cite
Liu, Z.; Xu, W.; Xu, Q.; Shi, M.; Luo, Y. Load Testing and Analysis of a Large Span Through Simply-Supported Steel Box Arch Bridge. Appl. Sci. 2024, 14, 11418. https://doi.org/10.3390/app142311418
Liu Z, Xu W, Xu Q, Shi M, Luo Y. Load Testing and Analysis of a Large Span Through Simply-Supported Steel Box Arch Bridge. Applied Sciences. 2024; 14(23):11418. https://doi.org/10.3390/app142311418
Chicago/Turabian StyleLiu, Zhenwei, Weisheng Xu, Qing Xu, Menglin Shi, and Yujie Luo. 2024. "Load Testing and Analysis of a Large Span Through Simply-Supported Steel Box Arch Bridge" Applied Sciences 14, no. 23: 11418. https://doi.org/10.3390/app142311418
APA StyleLiu, Z., Xu, W., Xu, Q., Shi, M., & Luo, Y. (2024). Load Testing and Analysis of a Large Span Through Simply-Supported Steel Box Arch Bridge. Applied Sciences, 14(23), 11418. https://doi.org/10.3390/app142311418