
Comparative Analysis of Marine Alternative Fuels for Offshore Supply Vessels

 , ,
, ,  ,
,  , and
, and
Abstract
1. Introduction
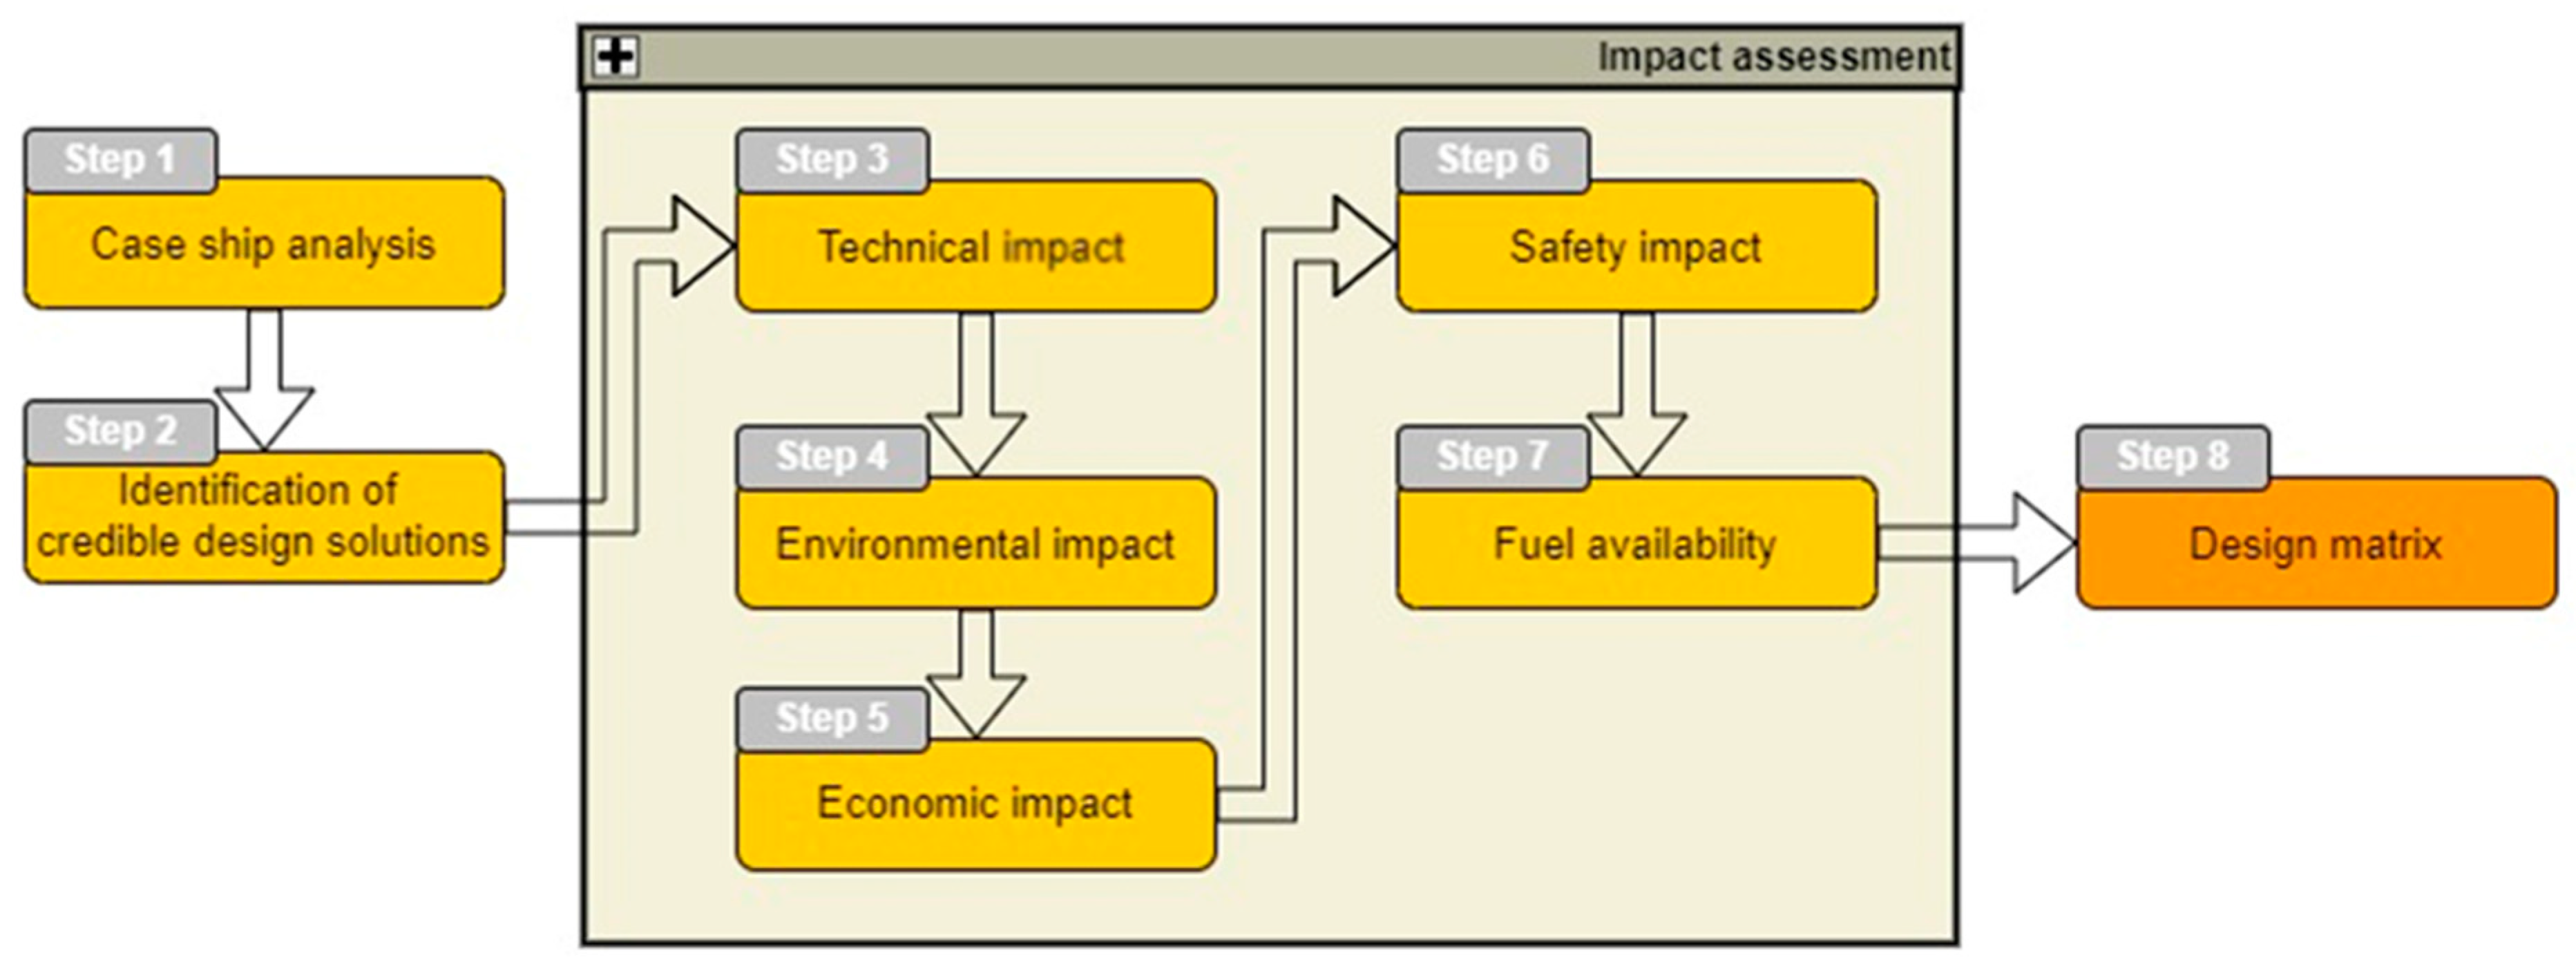
2. Methodology
2.1. Case Ship Analysis (Step 1)
2.1.1. Ship Specifications
2.1.2. Service Route Analysis (Operating Profile)
2.1.3. Electric Load Analysis
2.2. Credible Design Solutions (Step 2)
2.2.1. Market Availability for Fuels and Propulsion Systems by 2026
- Methanol: Methanol is expected to reach high regulatory maturity for onboard use before 2026. Both 2-stroke and 4-stroke engines for methanol are projected to be available around 2024, while other applications, such as in boilers and fuel cells, are anticipated to become available by approximately 2028.
- Ammonia: The 2-stroke engine technology is anticipated to be available around 2025, with regulatory maturity still in progress. Full maturity for regulations is expected by 2030. Other applications for ammonia, such as in fuel cells and boilers, are projected to reach availability in later years, with some potentially extending into the early 2030s.
- Hydrogen: The 4-stroke engine and fuel cell technologies are anticipated to become available around 2026–2028. Regulatory maturity for hydrogen technologies is forecasted for around 2030.
- CCS (Carbon Capture and Storage): CCS technology is in the early stages of regulatory maturity. Full maturity is expected to be achieved around 2030, with onboard technology potentially available around the same timeframe.
2.2.2. Identification of Credible Solutions: 15 Design Scenarios
2.3. Technical Impact (Step 3)
2.4. Environmental Impacts (Step 4)
2.4.1. Environmental Data Collection
- (a)
- Ammonia
- (b)
- Hydrogen
- (c)
- Biodiesel
- (d)
- Methanol
- (e)
- LNG
- (f)
- Electricity
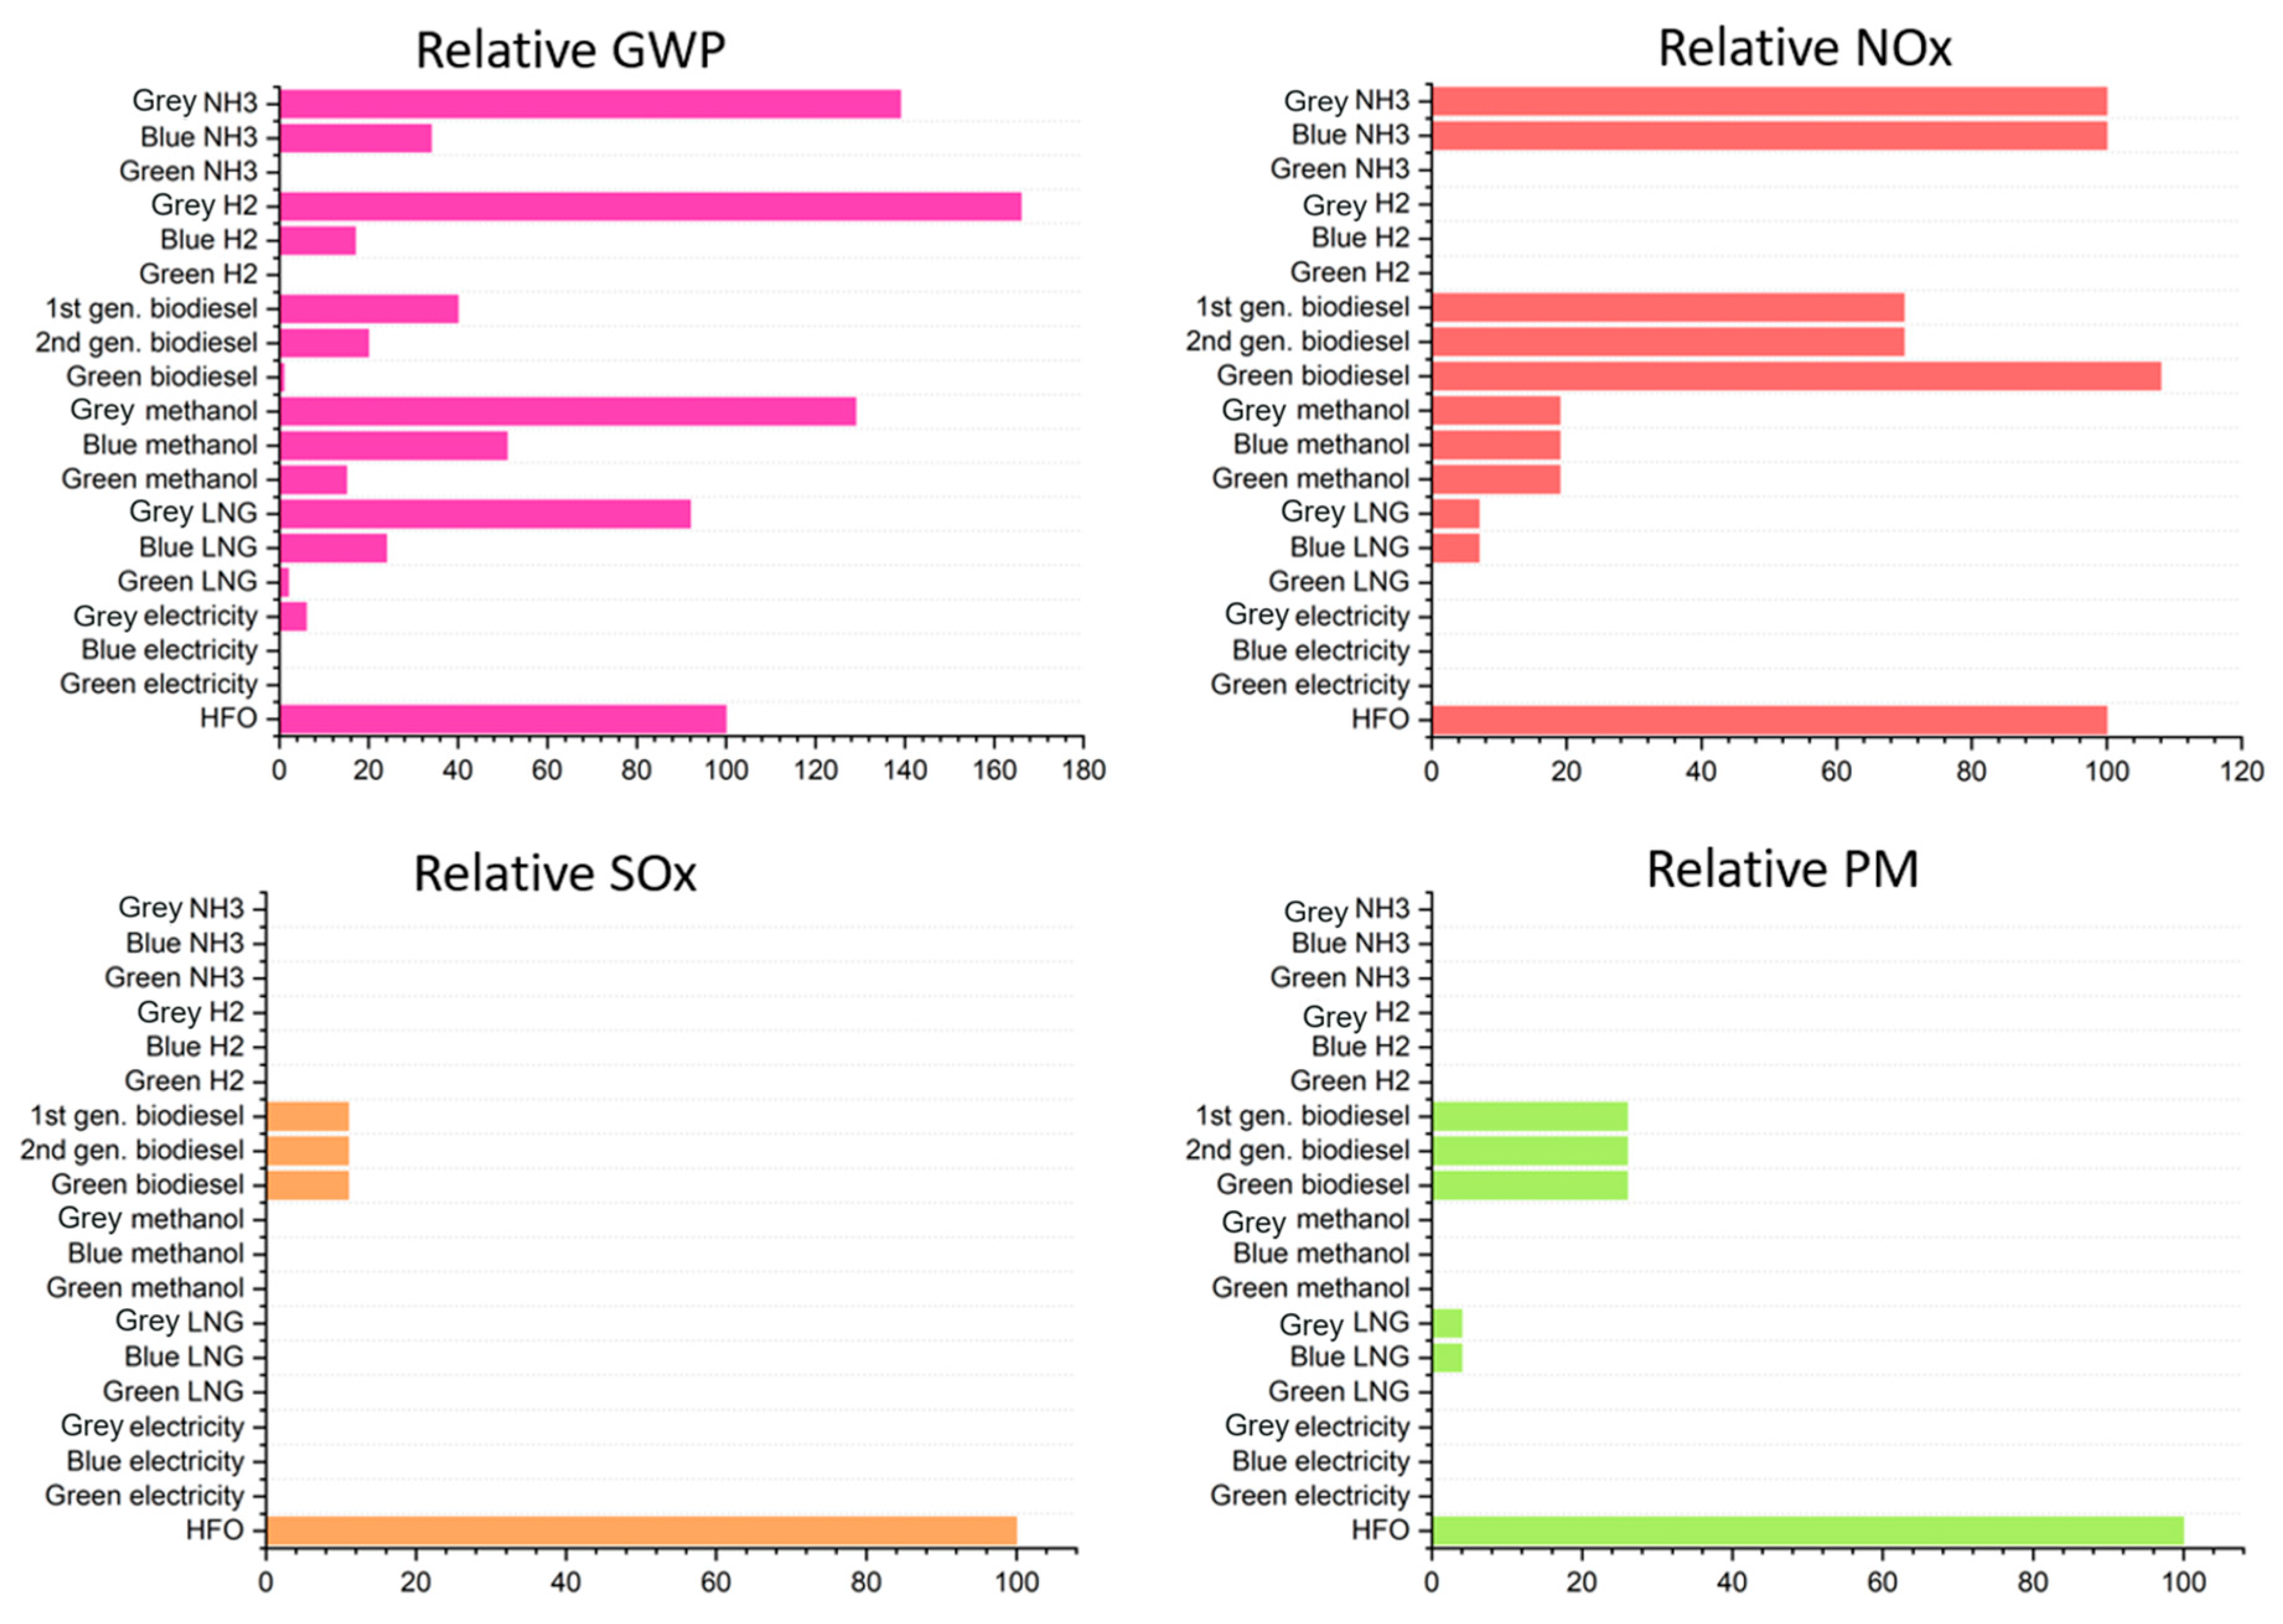
2.4.2. Environmental Impact Analysis
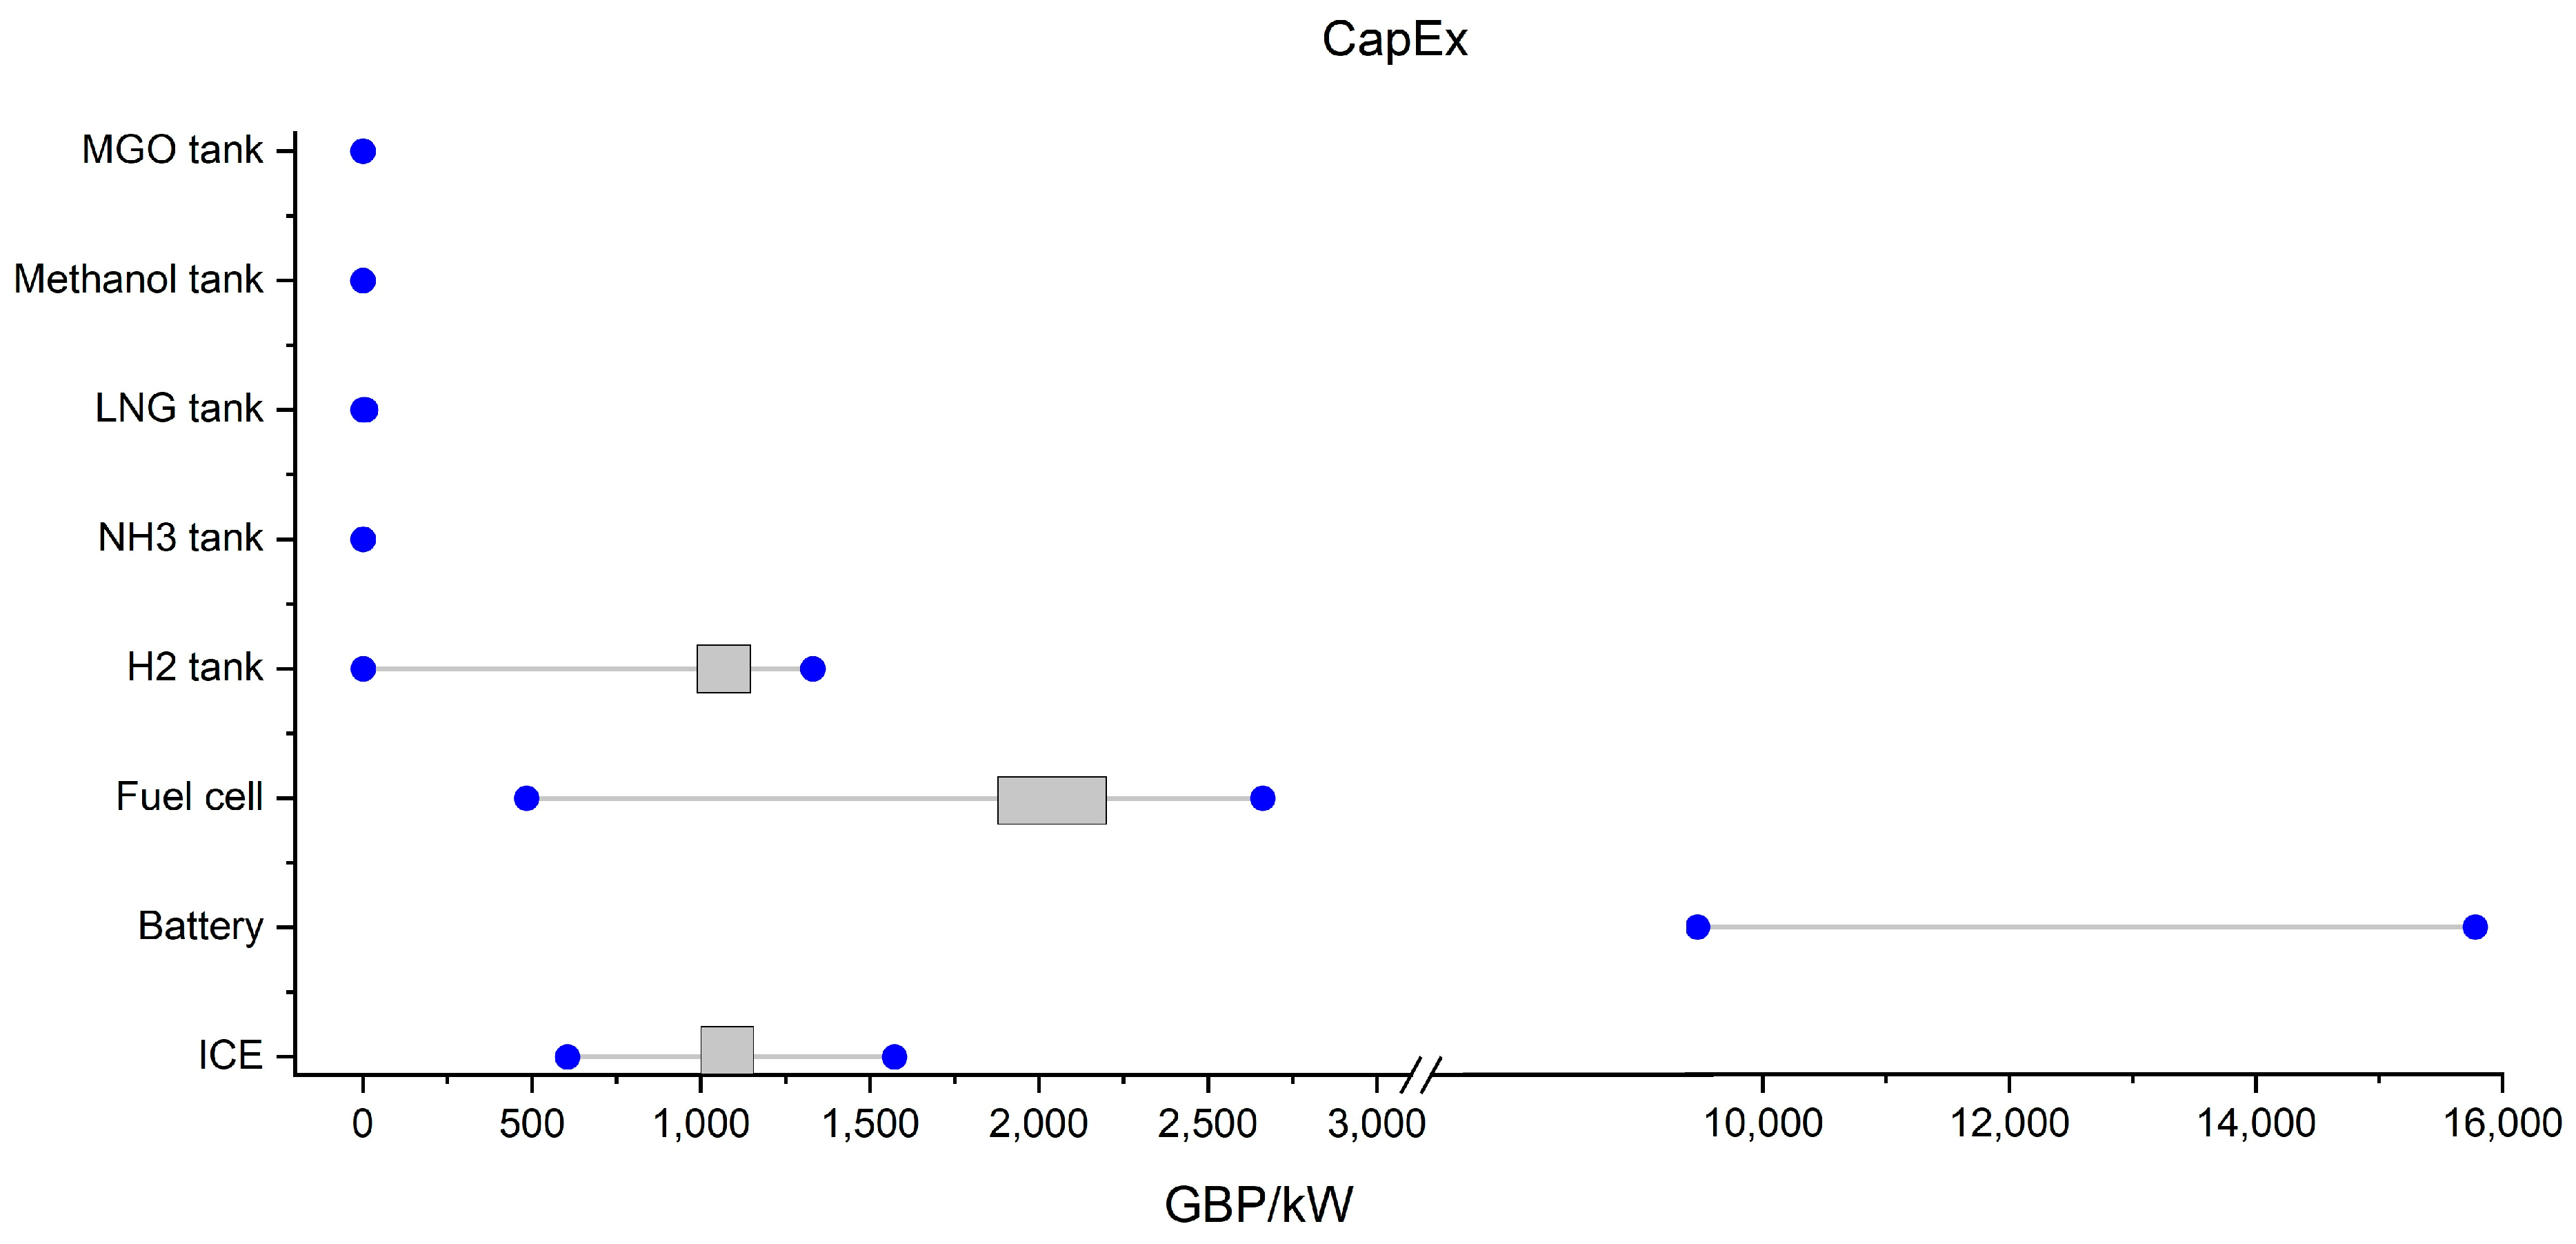
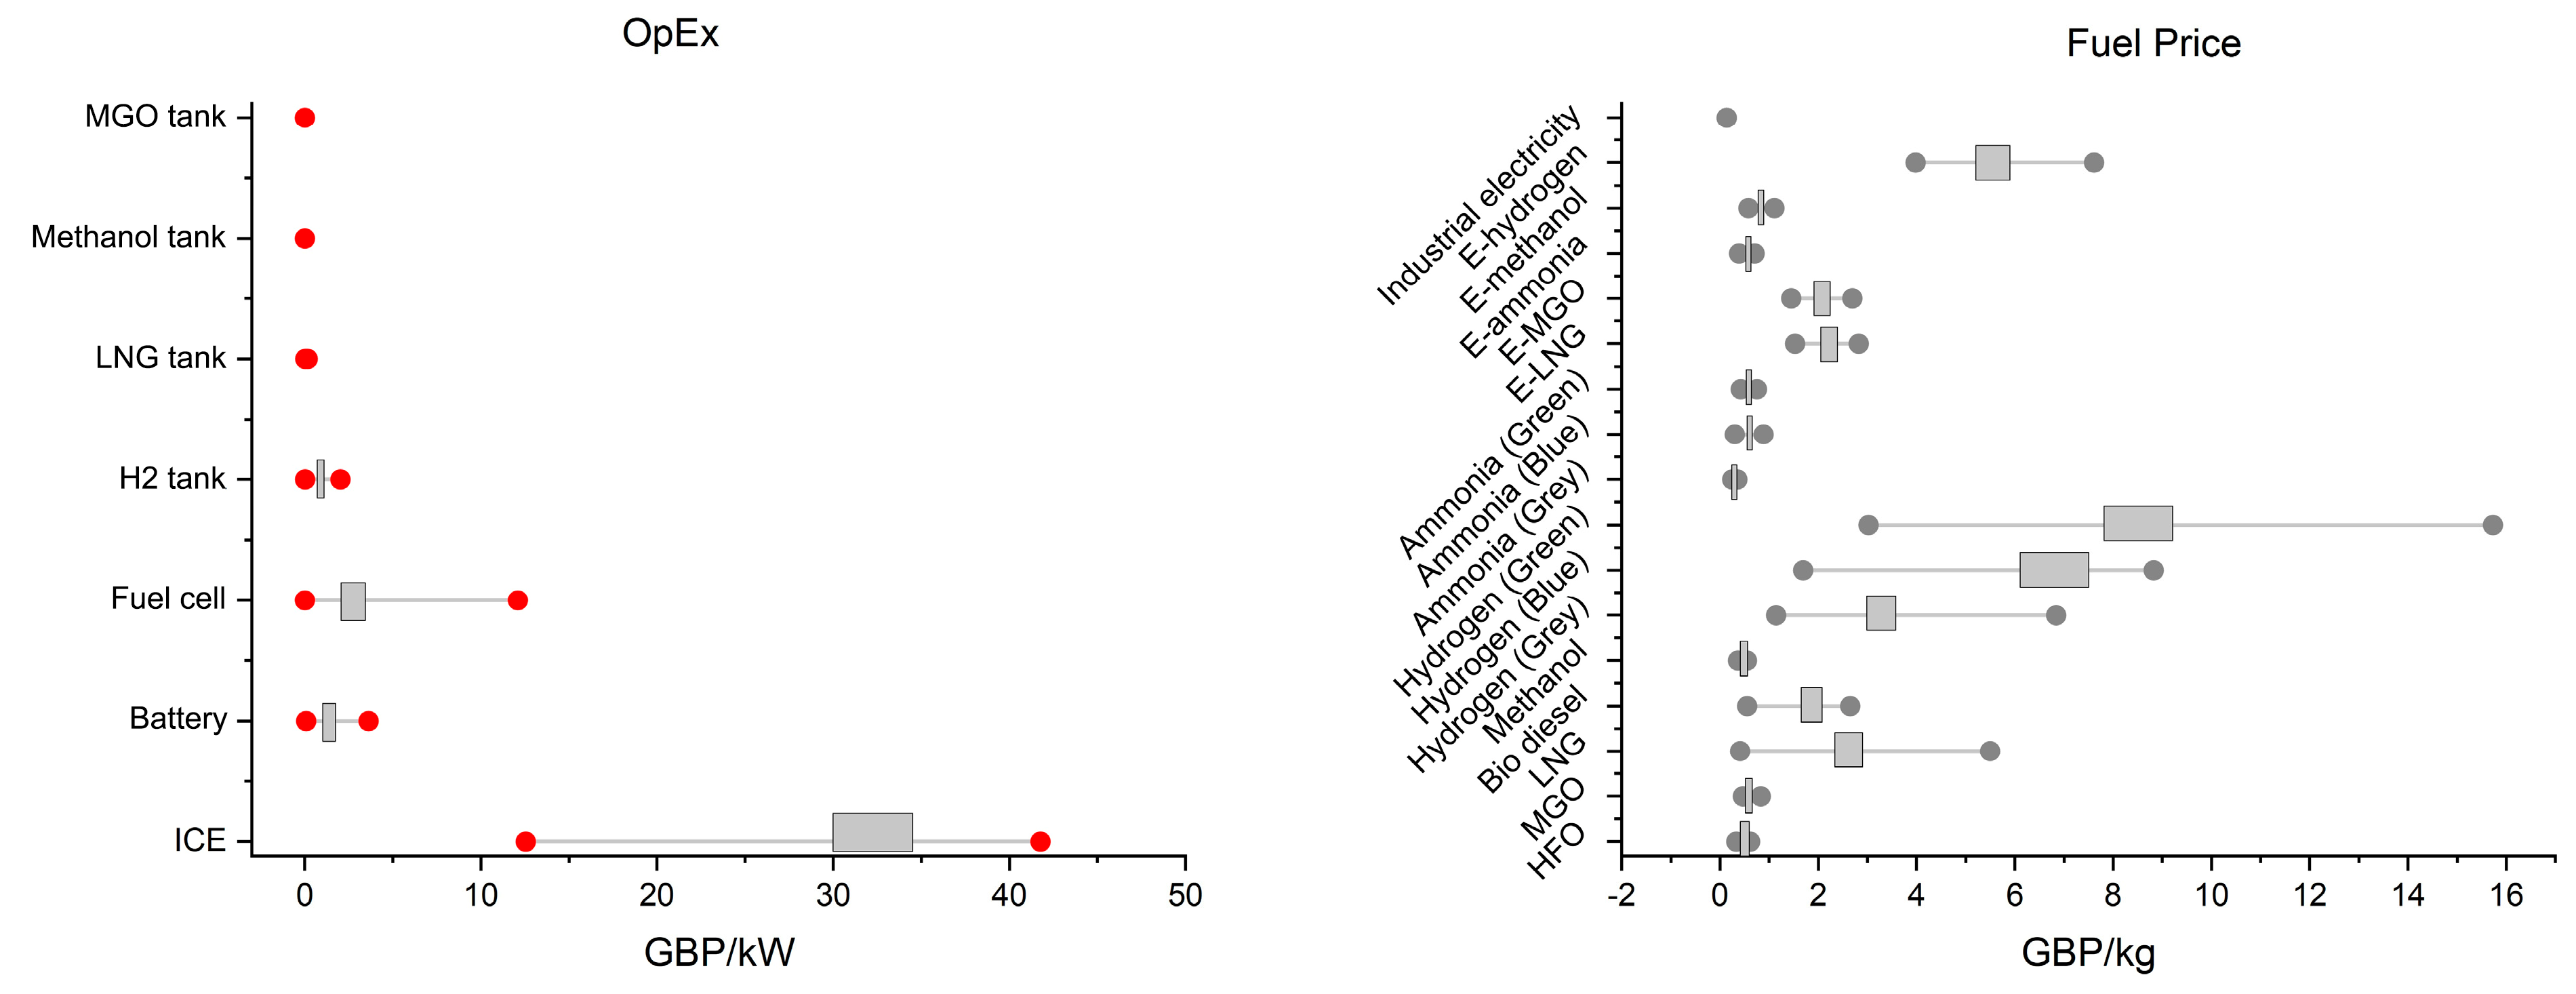
2.5. Economic Impact
2.6. Safety Impact
2.7. Fuel Availability
2.8. Matrix Analysis (Step 8)
2.8.1. Matrix Scoring
2.8.2. Weighting Factor
2.8.3. Results of Scoring
3. Discussion
4. Conclusions
- (1)
- LNG as a Transitional Fuel: The analysis reveals that LNG provides the most feasible short- to medium-term solution for SOVs, with the potential to reduce greenhouse gas (GHG) emissions by approximately 20–25% compared to marine diesel oil (MDO) and heavy fuel oil (HFO). In addition to its lower carbon footprint, LNG infrastructure is relatively well developed, making it a viable near-term option for decarbonisation in the SOV sector.
- (2)
- Hydrogen and Ammonia for Long-term Decarbonisation: Hydrogen and ammonia have been identified as promising long-term alternatives, with the potential for zero-carbon emissions when produced using renewable energy. However, their widespread adoption faces significant challenges, particularly in terms of storage, handling safety, and the need for new infrastructure. For SOVs, hydrogen and ammonia could reduce CO2 emissions by up to 100%, but only if these challenges are addressed.
- (3)
- Hybrid Propulsion Systems: The integration of hybrid propulsion systems, combining alternative fuels with electric or battery-based propulsion, was found to offer enhanced operational flexibility and fuel efficiency. In particular, hybrid systems could reduce fuel consumption by up to 15%, depending on operational profiles. Battery technology improvements also make full-electric operation increasingly viable for short-distance and low-power applications.
- (4)
- Infrastructure and Regulatory Needs: The adoption of hydrogen and ammonia for SOVs will require substantial investment in bunkering infrastructure and safety regulations. As such, these fuels are recommended as long-term solutions, while LNG and hybrid systems serve as more immediate alternatives for reducing emissions in the near future.
Author Contributions
Funding
Institutional Review Board Statement
Informed Consent Statement
Data Availability Statement
Conflicts of Interest
References
- Usiagu, G.S.; Adekoya, O.O.; Okoli, C.E.; Daudu, C.D.; Ekemezie, I.O.; Ayorinde, O.B. LNG as a Bridge Fuel in the Transition to Renewable Energy: A Global Perspective. World J. Adv. Res. Rev. 2024, 21, 742–749. [Google Scholar] [CrossRef]
- Zarrinkolah, M.T.; Hosseini, V.J.F. Methane Slip Reduction of Conventional Dual-Fuel Natural Gas Diesel Engine Using Direct Fuel Injection Management and Alternative Combustion Modes. Fuel 2023, 331, 125775. [Google Scholar] [CrossRef]
- Xing, H.; Stuart, C.; Spence, S.; Chen, H.J.J. Alternative Fuel Options for Low Carbon Maritime Transportation: Pathways to 2050. J. Clean. Prod. 2021, 297, 126651. [Google Scholar] [CrossRef]
- Fu, Z.; Lu, L.; Zhang, C.; Xu, Q.; Zhang, X.; Gao, Z.; Li, J.J.S.E.T. Fuel Cell and Hydrogen in Maritime Application: A Review on Aspects of Technology, Cost, and Regulations. Sustain. Energy Technol. Assess. 2023, 57, 103181. [Google Scholar] [CrossRef]
- Van Hoecke, L.; Laffineur, L.; Campe, R.; Perreault, P.; Verbruggen, S.W.; Lenaerts, S.J.E. Challenges in the Use of Hydrogen for Maritime Applications. Energy Sci. 2021, 14, 815–843. [Google Scholar] [CrossRef]
- Ishaq, H.; Crawford, C.J.E.C. Review and Evaluation of Sustainable Ammonia Production, Storage, and Utilization. Energy Convers. Manag. 2024, 300, 117869. [Google Scholar] [CrossRef]
- Al-Enazi, A.; Okonkwo, E.C.; Bicer, Y.; Al-Ansari, T.J.E.R. A Review of Cleaner Alternative Fuels for Maritime Transportation. Energies 2021, 7, 1962–1985. [Google Scholar] [CrossRef]
- Mondal, P.; Basu, M.; Balasubramanian, N.J.B. Direct Use of Vegetable Oil and Animal Fat as Alternative Fuel in Internal Combustion Engine. Bioprod. Bioprocess. 2008, 2, 155–174. [Google Scholar] [CrossRef]
- Santos, N.D.S.A.; Roso, V.R.; Malaquias, A.C.T.; Baeta, J.G.C. Internal Combustion Engines and Biofuels: Examining Why This Robust Combination Should Not Be Ignored for Future Sustainable Transportation. Renew. Sustain. Energy Rev. 2021, 148, 111292. [Google Scholar]
- Foretich, A.; Zaimes, G.G.; Hawkins, T.R.; Newes, E.J. Challenges and Opportunities for Alternative Fuels in the Maritime Sector. Marit. Transp. Res. 2021, 2, 100033. [Google Scholar] [CrossRef]
- Lagouvardou, S.; Psaraftis, H.N.; Zis, T.J.S. A Literature Survey on Market-Based Measures for the Decarbonization of Shipping. Sustainability 2020, 12, 3953. [Google Scholar] [CrossRef]
- Strantzali, E.; Livanos, G.A.; Aravossis, K.J.E. A Comprehensive Multicriteria Evaluation Approach for Alternative Marine Fuels. Energies 2023, 16, 7498. [Google Scholar] [CrossRef]
- Hansson, J.; Månsson, S.; Brynolf, S.; Grahn, M.J.B. Alternative Marine Fuels: Prospects Based on Multi-Criteria Decision Analysis Involving Swedish Stakeholders. Biomass Bioenergy 2019, 126, 159–173. [Google Scholar] [CrossRef]
- Mandić, N.; Ukić Boljat, H.; Kekez, T.; Luttenberger, L.R.J.A.S. Multicriteria Analysis of Alternative Marine Fuels in Sustainable Coastal Marine Traffic. Appl. Sci. 2021, 11, 2600. [Google Scholar] [CrossRef]
- Andersson, K.; Brynolf, S.; Hansson, J.; Grahn, M.J.S. Criteria and Decision Support for a Sustainable Choice of Alternative Marine Fuels. Sustainability 2020, 12, 3623. [Google Scholar] [CrossRef]
- DNV. Maritime Forecast to 2050. 2022. [Google Scholar]
- Hsieh, C.-W.C.; Fang, C. Biofuels for the Marine Shipping Sector, IEA Bioenergy, 2017.
- Law, L.C.; Foscoli, B.; Mastorakos, E.; Evans, S. A Comparison of Alternative Fuels for Shipping in Terms of Lifecycle Energy and Cost. Energies 2021, 14, 8502. [Google Scholar] [CrossRef]
- Bureau Veritas (BV). Alternative Fuels Outlook for Shipping. 2022. [Google Scholar]
- Goldmeer, J.; Buck, C.; Suleiman, B.; Selim, H.; Tayebi, K.; Agostinelli, G.-L.; Dawood, A. Techno-Economic Analysis of Hydrogen and Ammonia as Low Carbon Fuels for Power Generation. In Turbo Expo: Power for Land, Sea, and Air; American Society of Mechanical Engineers: New York, NY, USA, 2023. [Google Scholar]
- Lee, S.; Kim, J.; Kim, K.; Hwang, H. Electrochemical Performance of Direct Ammonia Solid Oxide Fuel Cell. Electrochem. Soc. Meet. Abstr. 2023, 243, 215. [Google Scholar] [CrossRef]
- Chalaris, I.; Jeong, B.; Jang, H. Application of Parametric Trend Life Cycle Assessment for Investigating the Carbon Footprint of Ammonia as Marine Fuel. Int. J. Life Cycle Assess. 2022, 27, 1145–1163. [Google Scholar] [CrossRef]
- Van Rheenen, E.; Padding, J.; Slootweg, J.; Visser, K. Hydrogen Carriers for Zero-Emission Ship Propulsion Using PEM Fuel Cells: An Evaluation. J. Mar. Eng. Technol. 2024, 23, 166–183. [Google Scholar] [CrossRef]
- Wang, H.; Aung, M.Z.; Xu, X.; Boulougouris, E. Life Cycle Analysis of Hydrogen Powered Marine Vessels—Case Ship Comparison Study with Conventional Power System. Sustainability 2023, 15, 12946. [Google Scholar] [CrossRef]
- Maniscalco, M.P.; Longo, S.; Cellura, M.; Miccichè, G.; Ferraro, M. Critical Review of Life Cycle Assessment of Hydrogen Production Pathways. Environments 2024, 11, 108. [Google Scholar] [CrossRef]
- Wu, D.; Gao, Z.; Wu, S.; Xiao, R. Negative Net Global Warming Potential Hydrogen Production Through Biomass Gasification Combined with Chemical Looping: Environmental and Economic Assessments. Int. J. Hydrogen Energy 2024, 66, 24–32. [Google Scholar] [CrossRef]
- Garcia-Vallejo, M.C.; Alzate, C.A.C. Sustainability of Hydrogen Production Considering Alternative Technologies Towards a Neutral Carbon Society. Int. J. Hydrogen Energy 2024, 64, 853–863. [Google Scholar] [CrossRef]
- Pande, S.; Gahane, S. Waste Cooking Oil to Biodiesel—A Review. In The Production of Biodiesel and Related Fuel Additives; Springer: Berlin/Heidelberg, Germany, 2024; pp. 308–339. [Google Scholar]
- Pramanik, A.; Sinha, A.; Chaubey, K.K.; Hariharan, S.; Dayal, D.; Bachheti, R.K.; Bachheti, A.; Chandel, A.K. Second-Generation Bio-Fuels: Strategies for Employing Degraded Land for Climate Change Mitigation Meeting United Nations-Sustainable Development Goals. Sustainability 2023, 15, 7578. [Google Scholar] [CrossRef]
- Lin, C.-Y. The Influences of Promising Feedstock Variability on Advanced Biofuel Production: A Review. J. Mar. Sci. Technol. 2022, 29, 714–730. [Google Scholar] [CrossRef]
- Wang, W. Agricultural and Forestry Biomass for Meeting the Renewable Fuel Standard: Implications for Land Use and GHG Emissions. Energies 2022, 15, 8796. [Google Scholar] [CrossRef]
- Datta, D.; Ghosal, R.K.; Biswas, S.; Mandal, E.; Das, B. Biofuel Production: An Ecofriendly Way to Produce Sustainable Energy. Emerging Sustainable Technologies for Biofuel Production; Springer: Berlin/Heidelberg, Germany, 2024; pp. 67–99. [Google Scholar]
- Parris, D.; Spinthiropoulos, K.; Panitsidis, K.; Tsanaktsidis, C. Transition to the New Green Maritime Era—Developing Hybrid Ecological Fuels Using Methanol and Biodiesel—An Experimental Procedure. Eng 2024, 5, 1863–1884. [Google Scholar] [CrossRef]
- Prakash, G.S.G. Long-Term Sustainability Through Carbon Dioxide Capture and Conversion: The Methanol Economy. In Electrochemical Society Meeting Abstracts; The Electrochemical Society, Inc.: Pennington, NJ, USA, 2024; Volume 245. [Google Scholar]
- Chianese, L.; Meloni, E.; Vaiano, V.; Iervolino, G.; Palma, V. Environmental Challenges and Economical Assessment of Methanol’s Production Feedstock. Heliyon 2024, in press. [Google Scholar]
- Jiang, P.; Li, L.; Zhao, G.; Zhang, H.; Ji, T.; Mu, L.; Lu, X.; Zhu, J. Seeking the Low-Carbon Route of Methanol Production with Sustainable Resources by Tracking Energy and Environment Indicators. Ind. Eng. Chem. Res. 2024, 63, 8261–8272. [Google Scholar] [CrossRef]
- Pavlenko, N.; Comer, B.; Zhou, Y.; Clark, N.; Rutherford, D. The Climate Implications of Using LNG as a Marine Fuel; Swedish Environmental Protection Agency: Stockholm, Sweden, 2020. [Google Scholar]
- Balcombe, P.; Brierley, J.; Lewis, C.; Skatvedt, L.; Speirs, J.; Hawkes, A.; Staffell, I. How to Decarbonise International Shipping: Options for Fuels, Technologies and Policies. Energy Convers. Manag. 2019, 182, 72–88. [Google Scholar] [CrossRef]
- Jang, H.; Jeong, B.; Zhou, P.; Ha, S.; Nam, D. Demystifying the Lifecycle Environmental Benefits and Harms of LNG as Marine Fuel. Appl. Energy 2021, 292, 116869. [Google Scholar] [CrossRef]
- Pachauri, R.K.; Allen, M.R.; Barros, V.R.; Broome, J.; Cramer, W.; Christ, R.; Church, J.A.; Clarke, L.; Dahe, Q.; Dasgupta, P. Climate Change 2014: Synthesis Report; IPCC: Geneva, Switzerland, 2014. [Google Scholar]
- IMO. Comprehensive Impact Assessment of Short-Term Measure Approved by MEPC 75—Full Report on the Impacts on the Fleet and on States (MEPC 76/INF.68/Add.1). 2021. [Google Scholar]
- Bei, Z.; Wang, J.; Li, Y.; Wang, H.; Li, M.; Qian, F.; Xu, W. Challenges and Solutions of Ship Power System Electrification. Energies 2024, 17, 3311. [Google Scholar] [CrossRef]
- Zamboni, G.; Scamardella, F.; Gualeni, P.; Canepa, E. Comparative Analysis Among Different Alternative Fuels for Ship Propulsion in a Well-to-Wake Perspective. Heliyon 2024, 10, e26016. [Google Scholar] [CrossRef] [PubMed]
- Taljegard, M.; Brynolf, S.; Grahn, M.; Andersson, K.; Johnson, H. Cost-Effective Choices of Marine Fuels in a Carbon-Constrained World: Results from a Global Energy Model. Environ. Sci. Technol. 2014, 48, 12986–12993. [Google Scholar] [CrossRef] [PubMed]
- MWH. Sustainable Energy Handbook; MWH: Broomfield, CO, USA, 2016. [Google Scholar]
- DNV GL—Maritime. Assessment of Selected Alternative Fuels and Technologies; DNV GL: Oslo, Norway, 2018. [Google Scholar]
- Horvath, S.; Fasihi, M.; Breyer, C. Techno-Economic Analysis of a Decarbonized Shipping Sector: Technology Suggestions for a Fleet in 2030 and 2040. Energy Convers. Manag. 2018, 164, 230–241. [Google Scholar] [CrossRef]
- Abma, D.; Atli-Veltin, B.; Verbeek, R. Feasibility Study for a Zero Emission, Battery-Electric Powertrain for the Gouwenaar II; TNO: Den Haag, The Netherlands, 2019. [Google Scholar]
- Abma, D.; Atli-Veltin, B.; Verbeek, R.; van der Groep, R. Feasibility Study for a Zero Emission, Hydrogen Fuel Cell Powertrain for the Gouwenaar II; TNO: Den Haag, The Netherlands, 2019. [Google Scholar]
- De Vries, N. Safe and Effective Application of Ammonia as a Marine Fuel; TNO: Den Haag, The Netherlands, 2019. [Google Scholar]
- Ghenai, C.; Bettayeb, M.; Brdjanin, B.; Hamid, A.K. Hybrid Solar PV/PEM Fuel Cell/Diesel Generator Power System for Cruise Ship: A Case Study in Stockholm, Sweden. Case Stud. Therm. Eng. 2019, 14, 100497. [Google Scholar] [CrossRef]
- Kim, K.; An, J.; Park, K.; Roh, G.; Chun, K. Analysis of a Supercapacitor/Battery Hybrid Power System for a Bulk Carrier. Appl. Sci. 2019, 9, 1547. [Google Scholar] [CrossRef]
- Jahangir, M.H.; Shahsavari, A.; Rad, M.A.V. Feasibility Study of a Zero Emission PV/Wind Turbine/Wave Energy Converter Hybrid System for Stand-Alone Power Supply: A Case Study. J. Clean. Prod. 2020, 262, 121250. [Google Scholar] [CrossRef]
- Kim, K.; Roh, G.; Kim, W.; Chun, K. A Preliminary Study on an Alternative Ship Propulsion System Fueled by Ammonia: Environmental and Economic Assessments. J. Mar. Sci. Eng. 2020, 8, 183. [Google Scholar] [CrossRef]
- Lloyd’s Register. Techno-Economic Assessment of Zero-Carbon Fuels; Lloyd’s Register: London, UK, 2020. [Google Scholar]
- Hassan, I.A.; Ramadan, H.S.; Saleh, M.A.; Hissel, D. Hydrogen storage technologies for stationary and mobile applications: Review, analysis and perspectives. Renew. Sustain. Energy Rev. 2021, 149, 111311. [Google Scholar] [CrossRef]
- IEA. The Future of Hydrogen; International Energy Agency: Paris, France, 2019. [Google Scholar]
- Collins, L. A Wake-Up Call on Green Hydrogen: The Amount of Wind and Solar Needed Is Immense. Available online: https://www.rechargenews.com/transition/a-wake-up-call-on-green-hydrogen-the-amount-of-wind-and-solar-needed-is-immense/2-1-776481 (accessed on 20 July 2023).
- Shiozawa, B. The Cost of CO2-Free Ammonia. Available online: https://www.ammoniaenergy.org/articles/the-cost-of-co2-free-ammonia/ (accessed on 20 May 2023).
- IEF. Ammonia: The Missing Link in the Energy Transition? IEF: Riyadh, Saudi Arabia, 2021. [Google Scholar]
- Energy SGH2. Cost Comparison. Available online: https://www.sgh2energy.com/economics (accessed on 20 July 2023).
- Hedreen, S. Blue Hydrogen Runs ‘Significant Risk’ of Becoming Stranded Asset—Advisory Firm. Available online: https://www.spglobal.com/marketintelligence/en/news-insights/latest-news-headlines/blue-hydrogen-runs-significant-risk-of-becoming-stranded-asset-8211-advisory-firm-71222790 (accessed on 20 May 2023).
- Perčić, M.; Vladimir, N.; Jovanović, I.; Koričan, M. Application of Fuel Cells with Zero-Carbon Fuels in Short-Sea Shipping. Appl. Energy 2022, 309, 118463. [Google Scholar] [CrossRef]
- Bunker, S. Rotterdam Bunker Prices. Available online: https://shipandbunker.com/prices/emea/nwe/nl-rtm-rotterdam#LNG (accessed on 18 November 2024).
- Methanol, M. Fuel Price Comparison. Available online: http://marinemethanol.com/?nav=meohp (accessed on 15 July 2023).
- Oil Monster. Bunker Fuel Prices in West & Northern Europe. Available online: https://www.oilmonster.com/bunker-fuel-prices/west-northern-europe/44 (accessed on 20 July 2023).
- NESTE. Biodiesel Prices (SME & FAME). Available online: https://www.neste.com/investors/market-data/biodiesel-prices-sme-fame#ccc969da (accessed on 10 July 2023).
- Department for Business, Energy, and Industrial Strategy. Energy Prices International Comparisons. GOV.UK. 2022. [Google Scholar]
- DNV. Comparison of Alternative Marine Fuels. 2019. [Google Scholar]
- Directorate for Energy and Climate Change. Reducing Greenhouse Gas Emissions; Scottish Government: Edinburgh, Scotland, 2023.


| Items | Specifications |
|---|---|
| Flag | British |
| Class | IACS |
| Notations (DNV used as example) | A1A, Offshore Service Vessel (Windfarm Maint), WALK2WORK, CRANE, DYNPOS (AUTR), NAUT (AW), E0, BIS, CLEAN (DESIGN), BWM(T), Strengthened (DK), COMF-V(2)C(2), SPS, RECYCLABLE. |
| POB | 90 persons maximum |
| Length overall (LOA) | 85.0 m |
| Length (LBP) | 84.0 m |
| Breadth moulded | 19 m |
| Depth moulded | 7.5 m |
| Summer draught | 5.0 m |
| Displacement @ Ts | 5525 t |
| Power source | Diesel–electric |
| Baseline fuel | MGO |
| 4 Qty main generators | 2000 kW |
| Emergency generator | 200 kW |
| Transit Performance | |
| Max speed at a design draught of 5.0 m, not exceeding Beaufort scale 2, 100% power (2 × 1850 kw) | 14 knots |
| Service speed (Same environmental conditions) | 10–11 knots |
| Projected 14-Day SOV Operational Profile | |||||||||||||||
|---|---|---|---|---|---|---|---|---|---|---|---|---|---|---|---|
| Total | Day 1 | Day 2 | Day 3 | Day 4 | Day 5 | Day 6 | Day 7 | Day 8 | Day 9 | Day 10 | Day 11 | Day 12 | Day 13 | Day 14 | |
| Port call | 15 | 12 | - | - | - | - | - | - | - | - | - | - | - | - | 3 |
| Transit (10 kts) | 12 | 6 | - | - | - | - | - | - | - | - | - | - | - | - | 6 |
| W2W DP operations | 51.5 | - | 4.0 | 4.0 | 4.0 | 4.0 | 4.0 | 4.0 | 4.0 | 4.0 | 4.0 | 4.0 | 4.0 | 4.0 | 3.5 |
| Interfield transits | 51.5 | - | 4.0 | 4.0 | 4.0 | 4.0 | 4.0 | 4.0 | 4.0 | 4.0 | 4.0 | 4.0 | 4.0 | 4.0 | 3.5 |
| Standby (non-DP) | 76 | - | 6.0 | 6.0 | 6.0 | 6.0 | 6.0 | 6.0 | 6.0 | 6.0 | 6.0 | 6.0 | 6.0 | 6.0 | 4.0 |
| At anchor or moored | 130 | 6 | 10.0 | 10.0 | 10.0 | 10.0 | 10.0 | 10.0 | 10.0 | 10.0 | 10.0 | 10.0 | 10.0 | 10.0 | 4.0 |
| Total hours | 336 | 24 | 24 | 24 | 24 | 24 | 24 | 24 | 24 | 24 | 24 | 24 | 24 | 24 | 24 |
| Unit | Sailing at Eco Speed (10~11 Knots) | Sailing at Max Speed (14 Knots) | Manoeuvring | DPS Operation (Sea State 3, Tide 1 Knot) | DPS Operation (Sea State 4, Tide 2 Knot) | At Harbour (with Eco Sailing) | At Harbour (with Max Sailing) | |
|---|---|---|---|---|---|---|---|---|
| Propulsion | kW | 1665 | 3515 | 925 | 0 | 0 | 0 | 0 |
| Auxiliary system | kW | 280 | 280 | 1180.0 | 1480 | 2892.5 | 50 | 50 |
| Hotel load | kW | 150 | 150 | 150 | 200 | 200 | 200 | 200 |
| Margin (10~20%) | kW | 209.5 | 394.5 | 338.3 | 336 | 618.5 | 25 | 25 |
| Total load (/h) | kW | 2304.5 | 4339.5 | 2593.3 | 2016.0 | 3711.0 | 275.0 | 275.0 |
| Total power consumption (daily) | kWh | 14,220.9 | 20,084.1 | 1556.0 | 12,096.0 | 22,266.0 | 3088.0 | 3512.2 |
| Case of ME + GE/mechanical propulsion (GE capacity 1480 kW) | ||||||||
| Number of working generators | Set | 1 | 1 | 2 | 2 | 3 | 1 | 1 |
| Generator load factor | % | 43% | 56% | 56% | 68% | 84% | 19% | 19% |
| Case of GE/electrical propulsion (GE capacity 1960 kW) | ||||||||
| Number of working generators | Set | 2 | 3 | 2 | 2 | 3 | 1 | 1 |
| Generator load factor | % | 59% | 74% | 66% | 51% | 63% | 14% | 14% |
| 4 Different Operating Scenarios | |||
|---|---|---|---|
| 1 | 2 | 3 | 4 |
| Eco speed sailing + DPS at sea state 3 | Max speed sailing + DPS at sea state 3 | Eco speed sailing + DPS at sea state 4 | Max speed sailing + DPS at sea state 4 |
| Design Scenario | Technology | Fuel Types |
|---|---|---|
| 1 | ICE with mechanical propulsion | LNG + HFO/MGO |
| 2 | Biodiesel | |
| 3 | Methanol | |
| 4 | Ammonia | |
| 5 | Generator with electric propulsion | LNG |
| 6 | Biodiesel | |
| 7 | Methanol | |
| 8 | Ammonia | |
| 9 | Generator with electric propulsion and battery | LNG + electricity |
| 10 | Biodiesel + electricity | |
| 11 | Methanol + electricity | |
| 12 | Ammonia + electricity | |
| 13 | Full battery | Electricity |
| 14 | Fuel cell with battery | Hydrogen |
| 15 | Fuel cell with cracking system and battery | Ammonia |
| Fuel | Energy Density (MJ/L) | Tank Size Ratio to HFO/MGO Tank (Times) | Weight Unit (kg/m3) | Tank Type |
|---|---|---|---|---|
| Ammonia | 12.7 | 3–4 | 683 | Type C |
| Hydrogen (LH2) | 8.5 | 7 | 71 | Type C |
| Hydrogen (CGH2) | 8.5 | 13–15 | 42 | Type C |
| Biodiesel | 35.7 | 1 | 880 | Integral tank |
| Methanol | 15.7 | 2.5 | 791 | Integral tank |
| LNG | 21.2 | 2–3 | 450 | Type C |
| Electricity (battery) | 2.1 | - | - | Battery |
| Fuel | Propulsion System | Maturity |
|---|---|---|
| Ammonia | ICE | 4 |
| Fuel cell | 2 | |
| Hydrogen | Fuel cell | 4 |
| Biodiesel | ICE | 4 |
| Methanol | ICE | 4 |
| Fuel cell | 3 | |
| LNG | ICE | 5 |
| Fuel cell | 3 | |
| Electricity | Battery | 5 |
| Fuel | Case | Fuel Type | Technical Impact | ||
|---|---|---|---|---|---|
| Fuel Storage Capacity | Technological Maturity | Total | |||
| Ammonia | Mechanical propulsion | Grey | 3 | 4 | 7 |
| Blue | 3 | 4 | 7 | ||
| Green | 3 | 4 | 7 | ||
| Electric propulsion | Grey | 3 | 4 | 7 | |
| Blue | 3 | 4 | 7 | ||
| Green | 3 | 4 | 7 | ||
| Electric propulsion + battery | Grey | 3 | 4 | 7 | |
| Blue | 3 | 4 | 7 | ||
| Green | 3 | 4 | 7 | ||
| Fuel cell (PEMFC) + battery | Grey | 3 | 2 | 5 | |
| Blue | 3 | 2 | 5 | ||
| Green | 3 | 2 | 5 | ||
| Hydrogen | Fuel cell (PEMFC) + battery | Grey | 2 | 4 | 6 |
| Blue | 2 | 4 | 6 | ||
| Green | 2 | 4 | 6 | ||
| Biodiesel | Mechanical propulsion | 1st gen. | 5 | 4 | 9 |
| 2nd gen. | 5 | 4 | 9 | ||
| Green | 5 | 4 | 9 | ||
| Electric propulsion | 1st gen. | 5 | 4 | 9 | |
| 2nd gen. | 5 | 4 | 9 | ||
| Green | 5 | 4 | 9 | ||
| Electric propulsion + battery | 1st gen. | 4 | 4 | 8 | |
| 2nd gen. | 4 | 4 | 8 | ||
| Green | 4 | 4 | 8 | ||
| Methanol | Mechanical propulsion | Grey | 4 | 4 | 8 |
| Bio | 4 | 4 | 8 | ||
| E | 4 | 4 | 8 | ||
| Electric propulsion | Grey | 4 | 4 | 8 | |
| Bio | 4 | 4 | 8 | ||
| E | 4 | 4 | 8 | ||
| Electric propulsion + battery | Grey | 3 | 4 | 7 | |
| Bio | 3 | 4 | 7 | ||
| E | 3 | 4 | 7 | ||
| LNG | Mechanical propulsion | Grey | 4 | 5 | 9 |
| Bio | 4 | 5 | 9 | ||
| E | 4 | 5 | 9 | ||
| Electric propulsion | Grey | 4 | 5 | 9 | |
| Bio | 4 | 5 | 9 | ||
| E | 4 | 5 | 9 | ||
| Electric propulsion + battery | Grey | 4 | 5 | 9 | |
| Bio | 4 | 5 | 9 | ||
| E | 4 | 5 | 9 | ||
| Electricity | Battery | Grey | 1 | 5 | 6 |
| Blue | 1 | 5 | 6 | ||
| Green | 1 | 5 | 6 | ||
| (%/Emissions of HFO) | |||||
|---|---|---|---|---|---|
| Relative GHG | Relative SOx | Relative NOx | Relative PM | ||
| Ammonia | Grey [19] | 139 | 0 | 100 | 0 |
| Blue | 34 | 0 | 100 | 0 | |
| Green | 0 | 0 | 0 | 0 | |
| Hydrogen | Grey [19] | 166 | 0 | 0 | 0 |
| Blue | 14 | 0 | 0 | 0 | |
| Green | 0 | 0 | 0 | 0 | |
| Biodiesel | 1st gen. [17] | 90 | 11 | 70 | 26 |
| 2nd gen. [17] | 50 | 11 | 70 | 26 | |
| Green | 1 | 11 | 108 | 26 | |
| Methanol | Grey | 129 | 0 | 19 | 0 |
| Blue | 51 | 0 | 19 | 0 | |
| Green | 15 | 0 | 19 | 0 | |
| LNG | Grey | 92 | 0 | 7 | 4 |
| Blue | 24 | 0 | 7 | 4 | |
| Green | 2 | 0 | 0 | 0 | |
| Electricity | Grey | 6 | 0 | 0 | 0 |
| Blue | 0 | 0 | 0 | 0 | |
| Green | 0 | 0 | 0 | 0 | |
| HFO | Grey | 100 | 100 | 100 | 100 |
| Rating Number | Relative Life-Cycle GHG | Relative Life-Cycle SOx | Relative Life-Cycle NOx | Relative Life-Cycle PM2.5 |
|---|---|---|---|---|
| 5 | 0 | 0 | 0 | 0 |
| 4 | 1–20 | 1–20 | 1–20 | 1–20 |
| 3 | 21–59 | 21–59 | 21–59 | 21–59 |
| 2 | 60–89 | 60–89 | 60–89 | 60–89 |
| 1 | 90– | 90– | 90– | 90– |
| Fuel | Case | Fuel Type | Environment Impact | ||||
|---|---|---|---|---|---|---|---|
| Relative Life-Cycle GHG | Relative Life-Cycle SOx | Relative Life-Cycle NOx | Relative Life-Cycle PM2.5 | Total | |||
| Ammonia | Mechanical propulsion | Grey | 1 | 5 | 1 | 5 | 12 |
| Blue | 3 | 5 | 1 | 5 | 14 | ||
| Green | 5 | 5 | 5 | 5 | 20 | ||
| Electric propulsion | Grey | 1 | 5 | 5 | 5 | 16 | |
| Blue | 3 | 5 | 5 | 5 | 18 | ||
| Green | 5 | 5 | 5 | 5 | 20 | ||
| Electric propulsion + battery | Grey | 1 | 5 | 5 | 5 | 16 | |
| Blue | 3 | 5 | 5 | 5 | 18 | ||
| Green | 5 | 5 | 5 | 5 | 20 | ||
| Fuel cell (PEMFC) + battery | Grey | 1 | 5 | 5 | 5 | 16 | |
| Blue | 4 | 5 | 5 | 5 | 19 | ||
| Green | 5 | 5 | 5 | 5 | 20 | ||
| Hydrogen | Fuel cell (PEMFC) + battery | Grey | 1 | 5 | 5 | 5 | 16 |
| Blue | 4 | 5 | 5 | 5 | 19 | ||
| Green | 5 | 5 | 5 | 5 | 20 | ||
| Biodiesel | Mechanical propulsion | 1st gen. | 1 | 4 | 2 | 3 | 10 |
| 2nd gen. | 3 | 4 | 2 | 3 | 12 | ||
| Green | 4 | 4 | 1 | 3 | 12 | ||
| Electric propulsion | 1st gen. | 1 | 4 | 2 | 3 | 10 | |
| 2nd gen. | 3 | 4 | 2 | 3 | 12 | ||
| Green | 4 | 4 | 1 | 3 | 12 | ||
| Electric propulsion + battery | 1st gen. | 1 | 4 | 2 | 3 | 10 | |
| 2nd gen. | 3 | 4 | 2 | 3 | 12 | ||
| Green | 4 | 4 | 1 | 3 | 12 | ||
| Methanol | Mechanical propulsion | Grey | 1 | 5 | 4 | 5 | 15 |
| Bio | 3 | 5 | 4 | 5 | 17 | ||
| E | 4 | 5 | 4 | 5 | 18 | ||
| Electric propulsion | Grey | 1 | 5 | 4 | 5 | 15 | |
| Bio | 3 | 5 | 4 | 5 | 17 | ||
| E | 4 | 5 | 4 | 5 | 18 | ||
| Electric propulsion + battery | Grey | 1 | 5 | 4 | 5 | 15 | |
| Bio | 3 | 5 | 4 | 5 | 17 | ||
| E | 4 | 5 | 4 | 5 | 18 | ||
| LNG | Mechanical propulsion | Grey | 1 | 5 | 4 | 4 | 14 |
| Bio | 3 | 5 | 4 | 4 | 16 | ||
| E | 4 | 5 | 5 | 5 | 19 | ||
| Electric propulsion | Grey | 1 | 5 | 4 | 4 | 14 | |
| Bio | 3 | 5 | 4 | 4 | 16 | ||
| E | 4 | 5 | 5 | 5 | 19 | ||
| Electric propulsion + battery | Grey | 1 | 5 | 4 | 4 | 14 | |
| Bio | 3 | 5 | 4 | 4 | 16 | ||
| E | 4 | 5 | 5 | 5 | 19 | ||
| Electricity | Battery | Grey | 4 | 5 | 5 | 5 | 19 |
| Blue | 5 | 5 | 5 | 5 | 20 | ||
| Green | 5 | 5 | 5 | 5 | 20 | ||
| Rating Number | CapEx Capacity (k£) | OpEx Capacity (k£) | Fuel Cost Capacity (k£) |
|---|---|---|---|
| 5 | ~15,000 | ~3000 | ~20,000 |
| 4 | 15,000~30,000 | 3000~4000 | 20,000~30,000 |
| 3 | 30,000~60,000 | 4000~5000 | 30,000~40,000 |
| 2 | 60,000~120,000 | 5000~6000 | 40,000~50,000 |
| 1 | 120,000~ | 6000~ | 50,000~ |
| Fuel | Case | Fuel Type | Cost Rating | |||
|---|---|---|---|---|---|---|
| CapEx | OpEx | Fuel Cost | Sum | |||
| Ammonia | Mechanical propulsion | Grey | 5 | 5 | 5 | 15 |
| Blue | 5 | 5 | 3 | 13 | ||
| Green | 5 | 5 | 2 | 12 | ||
| Electric propulsion | Grey | 5 | 4 | 5 | 14 | |
| Blue | 5 | 4 | 3 | 12 | ||
| Green | 5 | 4 | 2 | 11 | ||
| Electric propulsion + battery | Grey | 3 | 2 | 5 | 10 | |
| Blue | 3 | 2 | 3 | 8 | ||
| Green | 3 | 2 | 3 | 8 | ||
| Fuel cell (PEMFC) + battery | Grey | 2 | 1 | 5 | 8 | |
| Blue | 2 | 1 | 3 | 6 | ||
| Green | 2 | 1 | 4 | 7 | ||
| Hydrogen | Fuel cell (PEMFC) + battery | Grey | 2 | 1 | 5 | 8 |
| Blue | 2 | 1 | 2 | 5 | ||
| Green | 2 | 1 | 2 | 5 | ||
| Biodiesel | Mechanical propulsion | 1st gen. | 5 | 5 | 2 | 12 |
| 2nd gen. | 5 | 5 | 1 | 11 | ||
| Green | 5 | 5 | 1 | 11 | ||
| Electric propulsion | 1st gen. | 5 | 5 | 2 | 12 | |
| 2nd gen. | 5 | 5 | 1 | 11 | ||
| Green | 5 | 5 | 1 | 11 | ||
| Electric propulsion + battery | 1st gen. | 4 | 3 | 3 | 10 | |
| 2nd gen. | 4 | 3 | 2 | 9 | ||
| Green | 4 | 3 | 2 | 9 | ||
| Methanol | Mechanical propulsion | Grey | 5 | 5 | 4 | 14 |
| Blue 1) | 5 | 5 | 2 | 12 | ||
| Green 2) | 5 | 5 | 2 | 12 | ||
| Electric propulsion | Grey | 5 | 5 | 4 | 14 | |
| Blue | 5 | 5 | 2 | 12 | ||
| Green | 5 | 5 | 2 | 12 | ||
| Electric propulsion + battery | Grey | 4 | 3 | 4 | 11 | |
| Blue | 4 | 3 | 3 | 10 | ||
| Green | 4 | 3 | 3 | 10 | ||
| LNG | Mechanical propulsion | Grey | 5 | 4 | 1 | 10 |
| Blue 3) | 5 | 4 | 3 | 12 | ||
| Green 4) | 5 | 4 | 2 | 11 | ||
| Electric propulsion | Grey | 5 | 3 | 1 | 9 | |
| Blue | 5 | 3 | 3 | 11 | ||
| Green | 5 | 3 | 2 | 10 | ||
| Electric propulsion + battery | Grey | 3 | 1 | 1 | 5 | |
| Blue | 3 | 1 | 4 | 8 | ||
| Green | 3 | 1 | 3 | 7 | ||
| Electricity | Battery | Grey | 1 | 5 | 5 | 11 |
| Blue | 1 | 5 | 5 | 11 | ||
| Green | 1 | 5 | 5 | 11 | ||
| Property | Ammonia | Hydrogen | Biodiesel | Methanol | LNG (Methane) |
|---|---|---|---|---|---|
| Chemical formula | NH3 | H2 | RCOOCH3 | CH3OH | CH4 |
| Toxicity | Highly toxic | Not toxic | Not toxic | Low acute toxicity | Not toxic |
| TWA [ppm] | 25 | - | - | 200 | - |
| STEL [ppm] | 35 | - | - | 250 | - |
| Flammability limits (% by volume) | 15–28 | 4.1–74 | 0.6–7.5 | 7.3–36 | 5.3–15 |
| Flashpoint (°C) | 132 | Not defined | >61 | 12 | −188 |
| Autoignition temperature (°C) | 630 | 500 | 204 | 470 | 537 |
| Physical properties for storage | Liquid at −33 °C | Compressed gas at >250 bar or liquid at −253 °C | Liquid | Liquid (up to 65 °C) | Liquid at −162 °C |
| Lower heating value (MJ/kg) | 18.6 | 119.93 | 42.7 | 19.93 | 50.02 |
| Rating Number | Toxicity (TWA ppm) | Corrosiveness | Flammability (Range of Flammability, ULF-LFL) |
|---|---|---|---|
| 5 | 0–200 | Too low | 0–4 |
| 4 | 201–400 | Low | 5–8 |
| 3 | 400–600 | Moderate | 9–20 |
| 2 | 600–800 | High | 21–30 |
| 1 | 800–1000 | Too high | 30- |
| Fuel | Case | Fuel Type | Safety Impact | ||||
|---|---|---|---|---|---|---|---|
| Toxicity | Corrosiveness | Flammability | Rules and Regulations | Total | |||
| Ammonia | Mechanical propulsion | Grey | 1 | 1 | 3 | 1 | 6 |
| Blue | 1 | 1 | 3 | 1 | 6 | ||
| Green | 1 | 1 | 3 | 1 | 6 | ||
| Electric propulsion | Grey | 1 | 1 | 3 | 1 | 6 | |
| Blue | 1 | 1 | 3 | 1 | 6 | ||
| Green | 1 | 1 | 3 | 1 | 6 | ||
| Electric propulsion + battery | Grey | 1 | 1 | 3 | 1 | 6 | |
| Blue | 1 | 1 | 3 | 1 | 6 | ||
| Green | 1 | 1 | 3 | 1 | 6 | ||
| Fuel cell (PEMFC) + battery | Grey | 1 | 1 | 3 | 2 | 7 | |
| Blue | 1 | 1 | 3 | 2 | 7 | ||
| Green | 1 | 1 | 3 | 2 | 7 | ||
| Hydrogen | Fuel cell (PEMFC) + battery | Grey | 5 | 4 | 1 | 2 | 12 |
| Blue | 5 | 4 | 1 | 2 | 12 | ||
| Green | 5 | 4 | 1 | 2 | 12 | ||
| Biodiesel | Mechanical propulsion | 1st gen. | 5 | 1 | 4 | 4 | 14 |
| 2nd gen. | 5 | 1 | 4 | 4 | 14 | ||
| Green | 5 | 1 | 4 | 4 | 14 | ||
| Electric propulsion | 1st gen. | 5 | 1 | 4 | 4 | 14 | |
| 2nd gen. | 5 | 1 | 4 | 4 | 14 | ||
| Green | 5 | 1 | 4 | 4 | 14 | ||
| Electric propulsion + battery | 1st gen. | 5 | 1 | 4 | 3 | 13 | |
| 2nd gen. | 5 | 1 | 4 | 3 | 13 | ||
| Green | 5 | 1 | 4 | 3 | 13 | ||
| Methanol | Mechanical propulsion | Grey | 1 | 1 | 2 | 4 | 8 |
| Bio | 1 | 1 | 2 | 4 | 8 | ||
| E | 1 | 1 | 2 | 4 | 8 | ||
| Electric propulsion | Grey | 1 | 1 | 2 | 4 | 8 | |
| Bio | 1 | 1 | 2 | 4 | 8 | ||
| E | 1 | 1 | 2 | 4 | 8 | ||
| Electric propulsion + battery | Grey | 1 | 1 | 2 | 4 | 8 | |
| Bio | 1 | 1 | 2 | 4 | 8 | ||
| E | 1 | 1 | 2 | 4 | 8 | ||
| LNG | Mechanical propulsion | Grey | 5 | 5 | 3 | 5 | 18 |
| Bio | 5 | 5 | 3 | 5 | 18 | ||
| E | 5 | 5 | 3 | 5 | 18 | ||
| Electric propulsion | Grey | 5 | 5 | 3 | 5 | 18 | |
| Bio | 5 | 5 | 3 | 5 | 18 | ||
| E | 5 | 5 | 3 | 5 | 18 | ||
| Electric propulsion + battery | Grey | 5 | 5 | 3 | 4 | 17 | |
| Bio | 5 | 5 | 3 | 4 | 17 | ||
| E | 5 | 5 | 3 | 4 | 17 | ||
| Electricity | Battery | Grey | 5 | 5 | 3 | 4 | 17 |
| Blue | 5 | 5 | 3 | 4 | 17 | ||
| Green | 5 | 5 | 3 | 4 | 17 | ||
| Fuel | Case | Fuel Type | Fuel Availability | ||
|---|---|---|---|---|---|
| Infrastructure (Bunkering) | Production Capacity | Total | |||
| Ammonia | Mechanical propulsion | Grey | 2 | 4 | 6 |
| Blue | 2 | 4 | 6 | ||
| Green | 2 | 4 | 6 | ||
| Electric propulsion | Grey | 2 | 4 | 6 | |
| Blue | 2 | 4 | 6 | ||
| Green | 2 | 4 | 6 | ||
| Electric propulsion + battery | Grey | 2 | 4 | 6 | |
| Blue | 2 | 4 | 6 | ||
| Green | 2 | 4 | 6 | ||
| Fuel cell (PEMFC) + battery | Grey | 2 | 4 | 6 | |
| Blue | 2 | 4 | 6 | ||
| Green | 2 | 4 | 6 | ||
| Hydrogen | Fuel cell (PEMFC) + battery | Grey | 1 | 4 | 5 |
| Blue | 1 | 4 | 5 | ||
| Green | 1 | 4 | 5 | ||
| Biodiesel | Mechanical propulsion | 1st gen. | 4 | 3 | 7 |
| 2nd gen. | 4 | 2 | 6 | ||
| Green | 4 | 1 | 5 | ||
| Electric propulsion | 1st gen. | 4 | 3 | 7 | |
| 2nd gen. | 4 | 2 | 6 | ||
| Green | 4 | 1 | 5 | ||
| Electric propulsion + battery | 1st gen. | 4 | 3 | 7 | |
| 2nd gen. | 4 | 2 | 6 | ||
| Green | 4 | 1 | 5 | ||
| Methanol | Mechanical propulsion | Grey | 3 | 3 | 6 |
| Bio | 3 | 3 | 6 | ||
| E | 3 | 2 | 5 | ||
| Electric propulsion | Grey | 3 | 3 | 6 | |
| Bio | 3 | 3 | 6 | ||
| E | 3 | 2 | 5 | ||
| Electric propulsion + battery | Grey | 3 | 3 | 6 | |
| Bio | 3 | 3 | 6 | ||
| E | 3 | 2 | 5 | ||
| LNG | Mechanical propulsion | Grey | 3 | 3 | 6 |
| Bio | 3 | 2 | 5 | ||
| E | 3 | 1 | 4 | ||
| Electric propulsion | Grey | 3 | 3 | 6 | |
| Bio | 3 | 2 | 5 | ||
| E | 3 | 1 | 4 | ||
| Electric propulsion + battery | Grey | 3 | 3 | 6 | |
| Bio | 3 | 2 | 5 | ||
| E | 3 | 1 | 4 | ||
| Electricity | Battery | Grey | 2 | 4 | 6 |
| Blue | 2 | 4 | 6 | ||
| Green | 2 | 4 | 6 | ||
| No. of Attributes | Top Level | Second Level | Description | Scoring Justification |
|---|---|---|---|---|
| 1.1 | Technical impact | Fuel storage capacity | Size of fuel tank storage required onboard | Section 2.3 |
| 1.2 | Technical maturity | Availability of the technology for the case ship in 2026 | Section 2.3 | |
| 2.1 | Environmental impact | Life-cycle GHG | Well-to-wake greenhouse gas emission from fuels | Section 2.4 |
| 2.2 | Life-cycle SOx | Well-to-wake SOx emission from fuels | ||
| 2.3 | Life-cycle NOx | Well-to-wake NOx emission from fuels | ||
| 2.4 | Life-cycle PM | Well-to-wake PM emission from fuels | ||
| 3.1 | Economic impact | CAPEX | Capital cost of and initial investment in the technologies | Section 2.5 |
| 3.2 | Maintenance cost | Lifetime operating/maintenance costs for the technologies | ||
| 3.3 | Fuel cost | Lifetime fuel costs | ||
| 4.1 | Safety impact | Toxicity | Risk to humans | Section 2.6 |
| 4.2 | Corrosiveness | Risk to ship/structures | ||
| 4.3 | Flammability | Risk of fire/explosion to humans/ship | ||
| 4.4 | Rules and regulations | Availability of safety requirements from International Maritime Organization (IMO) | ||
| 5.1 | Fuel availability | Infrastructure | Bunkering infrastructure/supply chain | Section 2.7 |
| 5.2 | Production capability | Infrastructure of fuel production plant and its capacity for marine usage |
| Linguistic Scale | Weighting Score |
|---|---|
| Not important | 20 |
| Less important | 40 |
| Normal | 60 |
| Highly important | 80 |
| Extremely important | 100 |
| Top Attributes | Weighting | Sub-Attributes | Weighting | Overall Factor |
|---|---|---|---|---|
| Technical impact | 0.70 | Fuel storage capacity | 0.83 | 0.58 |
| Technological maturity (availability) | 0.68 | 0.47 | ||
| Environmental impact | 1.00 | Life-cycle GHG | 1.00 | 1.00 |
| Life-cycle SOx | 0.60 | 0.60 | ||
| Life-cycle NOx | 0.60 | 0.60 | ||
| Life-cycle PM2.5 | 0.55 | 0.55 | ||
| Economic impact | 0.70 | CAPEX | 0.73 | 0.51 |
| OPEX | 0.73 | 0.51 | ||
| Fuel cost | 0.80 | 0.56 | ||
| Safety impact | 0.88 | Toxicity | 0.88 | 0.77 |
| Corrosiveness | 0.65 | 0.57 | ||
| Flammability | 0.75 | 0.66 | ||
| Rules and regulations | 0.70 | 0.61 | ||
| Fuel availability | 0.68 | Infrastructure (bunkering) | 0.78 | 0.52 |
| Production capacity | 0.75 | 0.51 |
Disclaimer/Publisher’s Note: The statements, opinions and data contained in all publications are solely those of the individual author(s) and contributor(s) and not of MDPI and/or the editor(s). MDPI and/or the editor(s) disclaim responsibility for any injury to people or property resulting from any ideas, methods, instructions or products referred to in the content. |
© 2024 by the authors. Licensee MDPI, Basel, Switzerland. This article is an open access article distributed under the terms and conditions of the Creative Commons Attribution (CC BY) license (https://creativecommons.org/licenses/by/4.0/).
Share and Cite
Park, C.; Hwang, I.; Jang, H.; Jeong, B.; Ha, S.; Kim, J.; Jee, J. Comparative Analysis of Marine Alternative Fuels for Offshore Supply Vessels. Appl. Sci. 2024, 14, 11196. https://doi.org/10.3390/app142311196
Park C, Hwang I, Jang H, Jeong B, Ha S, Kim J, Jee J. Comparative Analysis of Marine Alternative Fuels for Offshore Supply Vessels. Applied Sciences. 2024; 14(23):11196. https://doi.org/10.3390/app142311196
Chicago/Turabian StylePark, Chybyung, Insik Hwang, Hayoung Jang, Byongug Jeong, Seungman Ha, Joongwon Kim, and Jaehoon Jee. 2024. "Comparative Analysis of Marine Alternative Fuels for Offshore Supply Vessels" Applied Sciences 14, no. 23: 11196. https://doi.org/10.3390/app142311196
APA StylePark, C., Hwang, I., Jang, H., Jeong, B., Ha, S., Kim, J., & Jee, J. (2024). Comparative Analysis of Marine Alternative Fuels for Offshore Supply Vessels. Applied Sciences, 14(23), 11196. https://doi.org/10.3390/app142311196