Article

An Analysis of Vertical Infiltration Responses in Unsaturated Soil Columns from Permafrost Regions

1
Shaanxi Geological Environment Monitoring Station, Xi’an 710054, China
2
Key Laboratory of Mine Geological Disaster Mechanism and Control, Ministry of Natural Resources, Xi’an 710054, China
3
College of Geology Engineering & Geomatics, Changan University, Xi’an 710054, China
4
Open Research Laboratory of Geotechnical Engineering, Ministry of Land and Resources, Xi’an 710054, China
5
College of Architecture and Civil Engineering, Xi’an University of Science and Technology, Xi’an 710054, China
*
Author to whom correspondence should be addressed.
Appl. Sci. 2024, 14(22), 10195; https://doi.org/10.3390/app142210195
Submission received: 9 October 2024 / Revised: 3 November 2024 / Accepted: 4 November 2024 / Published: 6 November 2024
(This article belongs to the Special Issue Advances in Permafrost)

Abstract

:
Rainfall infiltration affects permafrost-related slope stability by changing the pore water pressure in soil. In this study, the infiltration responses under rainfall conditions were elucidated. The instantaneous profile method and filter paper method were used to obtain the soil–water characteristic curve (SWCC) and hydraulic conductivity function (HCF). During the rainfall infiltration test, the vertical patters of volumetric moisture contents, total hydraulic head or suction and wetting front were recorded. Advancing displacement and rate of the wetting front, the cumulative infiltration, the instantaneous infiltration rate, and the average infiltration rate were determined to comprehensively assess the rainfall infiltration process, along with SWCC and HCF. Additionally, the effects of dry density and runoff on the one-dimensional vertical infiltration process of soil columns were evaluated. The results showed that the variation curve of wetting front displacement versus time obeys a power function relationship. In addition, the infiltration rate–time relationship curve and the unsaturated permeability curve could be roughly divided into three stages, and the SWCC and HCF calculated by volumetric moisture content are more sensitive to changes in dry density than to changes in runoff or hydraulic head height.

1. Introduction

Climate warming has led to an increase in the frequency and severity of rainfall events, altering the soil structure and mechanical properties in the permafrost region, which in turn affects slope stability [1,2,3]. In the warm season, the active layer gradually melts, causing water to migrate slowly downwards and resulting in an increase in pore water pressure, which weakens the soil strength and consequently induces slope instability [4]. Thus, the infiltration process in soil has always been a popular research topic in pedology, hydrology, and geotechnical engineering because moisture migration is believed to be the main reason for most slope failures and landslides in China [5,6,7]. Especially for areas that experience seasonal, frequent heavy rainfall events, permafrost slope stability has become a major issue. Some scientific groups have analyzed slope stability by using field observations [8,9]. However, this is often difficult on-site. Numerical methods were applied to study the transport processes occurring in slopes during water infiltration [10,11] and in permafrost regions [12,13]. However, the variation in soil physical–mechanical parameters was not considered. Indoor experiments can be used to describe the hydrological process of the active layer during rainfall infiltration. Researchers proposed a coupled hydro-mechanical framework for assessing rainfall-induced instability in unsaturated slopes [14,15]. Their solution can easily be integrated into analyses of natural and man-made slopes and earthen structures subject to infiltration at a regional scale. Yang et al., Ibrahim et al. and Zhang evaluated soil water redistribution and hysteresis via experiments [16,17,18,19]. Studies have shown that due to highly nonlinear soil–water characteristics and soil permeability, the infiltration boundary is complex, the initial conditions vary, and the transient process of infiltration is complicated; in addition, the hysteresis of soil–water interactions further adds to the complexity of conducting experiments on the response of soil during the infiltration process [20,21]. Their tests showed that moisture migration plays an important controlling role in the shear strength of soil, thus affecting slope stability. In the warm season, the active layer slowly melts, the water starts to infiltrate into the slope or soil, the soil moisture content slowly increases and approaches a saturation state, the matric suction gradually decreases to zero, especially for matric suction near the surface, and the pore pressure decreases. This significant change could lead to a decrease in bond strength between the soil particles and a change in structure, thus reducing the shear strength and generating landslides.
There are many factors involved in slope stability, such as melt, rainfall duration and intensity, spatial and temporal changes of vegetation, saturation, slope, infiltration rate, soil moisture content, groundwater level, and the soil–water characteristic curve (SWCC) [16,17,22]. However, these parameters have strong spatial variability. Due to the high cost of field infiltration tests, the complexity of the process, and the complex correlation between rainfall and runoff, these parameters are usually difficult to accurately obtain directly from field infiltration experiments, and they often rely on the establishment of a fuzzy association relationship between rainfall and runoff. Therefore, the soil column vertical infiltration test is an important method for reproducing the rainfall infiltration process on a slope surface. The rainfall infiltration process and mechanism are affected by the initial moisture content, soil water retention, porosity, and evaporation rate [16]. To understand soil infiltration behavior under different rainfall intensities and durations, the initial state, infiltration rate, matric suction and moisture content of soil are extremely important variables when studying the infiltration responses of unsaturated soil slopes [22,23].
Vertical infiltration tests were conducted indoors on three silt columns. Rainfall simulations were performed on soils with different densities and surface hydraulic heads. Real-time continuous measurements of wetting front displacement, volumetric moisture content, infiltration rate, and infiltration were performed, and the impact of rainfall on the infiltration process was assessed by analyzing moisture profiles, total hydraulic head profiles, the SWCC, and the hydraulic conductivity function (HCF).

2. Materials and Methods

2.1. Physical Properties of the Materials

The test materials were collected from four different permafrost regions, including soils from Chanhe, Xi’an city, Shaanxi Province (34°27′ N, 108°99′ E), Yan’an city, Shaanxi Province (36°21′N, 108°41′ E), Qingyang city, Gansu Province (36°15′ N, 107°20′ E), and Lvliang city, Shanxi Province (37°31′ N, 111°19′ E), which were labelled as CH, YA, QY, and LL, respectively. The physical properties of the soils are shown in Table 1. Chanhe is located in central China, and its soil type is brown, a clay loam with a fine texture, a relatively small particle size (Figure 1a), and a high capacity to store water and retain moisture. The particle size distribution curve shows an obvious bimodal structure, a large heterogeneity coefficient and good grading. The remaining three soils are all loess, whose particle size distribution curves show an unclear bimodal or unimodal structure, indicating that the sorting was relatively good. Statistical analysis was conducted on soil strength, soil moisture, dry density, and percentage saturation for soils categorized using both the Unified Soil Classification System (USCS) and the U.S. Department of Agriculture (USDA) classification system [24]. As Table 1 presents, the CH, QY, LL, and YA soils were classified as silty according to the United States Department of Agriculture (USDA) classification standard [22,23]. Based on the clay (d < 0.075 mm) content, liquid limit and organic matter content, the soil was classified as a nonorganic silt with intermediate plasticity according to the USCS [22,23]. The plasticity indices all range between 10 and 17, indicating that the soils are all silt clays. The plasticity indices of the CH, QY, LL and YA soils decrease sequentially, indicating that the plasticity and compressibility decrease, and differences are caused by the different clay contents.

2.2. Chemical and Mineral Analysis

As shown in Table 2, the results of X-ray fluorescence (XRF, X-Supreme8000c, Hitachi High-Tech, Shanghai, China) revealed that there are no significant differences in the contents of oxides and elements in the soil, and the Si, Ca, Al, Fe, K, Mg, Ti, Mn, and Zr contents decrease sequentially. The main oxides are SiO2, A12O3, CaO, Fe2O3, MgO, K2O, Na2O, TiO2, P2O5, and MnO. The percentages of trace elements and oxides do not exceed 0.10%. Based on the X-ray diffraction (XRD, D8 Advance, Bruker, Karlsruhe, German). results in Figure 1b, the minerals used in the soils mainly include quartz, plagioclase, calcite, dolomite, illite, orthoclase, chlorite, amphibole, and muscovite.

2.3. Test Procedure

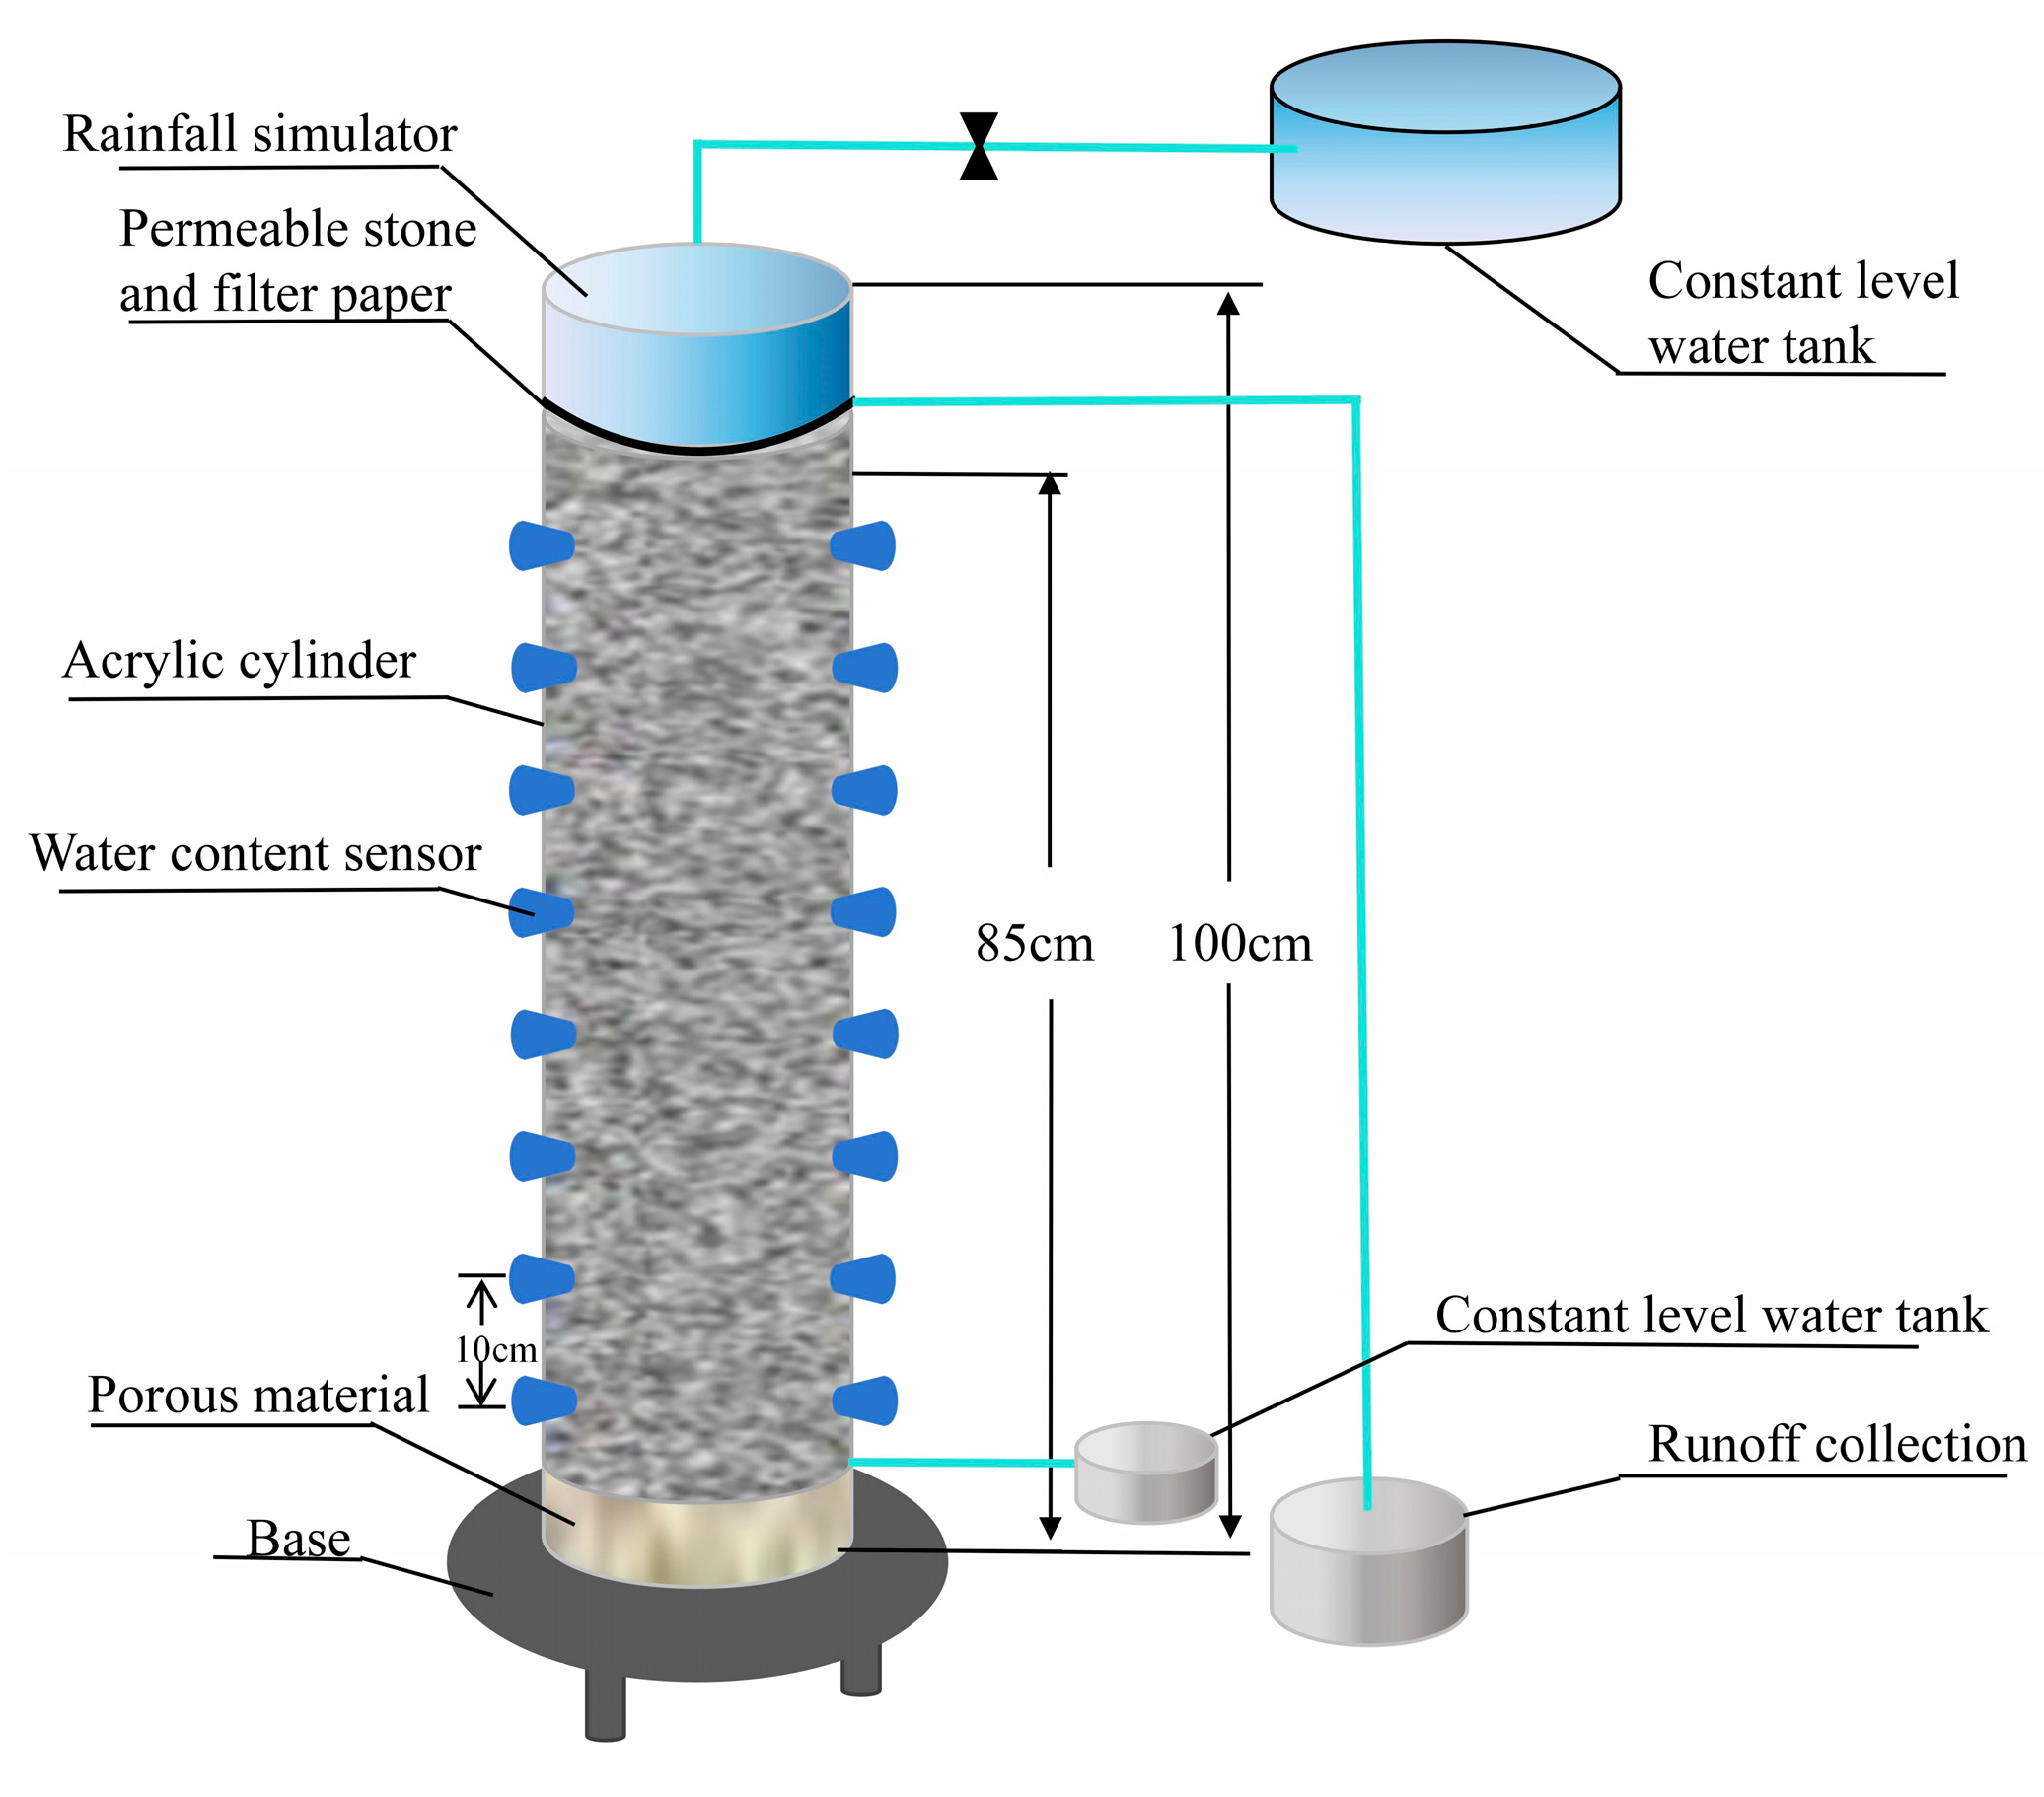
2.3.1. Saturated and Unsaturated Infiltration Procedures

In this study, the variable hydraulic head method was used to carry out saturated infiltration tests on remolded soil samples with different dry densities using a TST-55 (Nanjing Soil Instrument Factory Co., Nanjing, China) permeameter (Table 3).
Figure 2 shows a diagram illustrating the silt column and the positioning of the sensors employed to monitor the moisture content and progression of the wetting front. The key elements of the setup include an acrylic cylinder, ceramic cups, moisture content sensors, and a rainfall system. The cylindrical infiltration device has an inner diameter of 13 cm and a height of 100 cm, is made of transparent acrylic with a thickness of 3 mm, and has a graduated label paper to facilitate the measurement of the advancing displacement of the wetting peak. A flanged air-permeable bottom plate is fixed at the bottom to drain the rainwater that passes through the infiltration layer and prevent the occurrence of water accumulation in the saturated bottom soil layer, thus preventing abnormal moisture content in the lower soil layer. In his book Unsaturated Soil Mechanics, Lu Ning mentioned that the spacing between probes for moisture content and suction should be 10% of the entire soil column length [25]. Therefore, the acrylic columns were equipped with moisture content (MC) sensors at 5 cm intervals, starting from the base of the silt column. Initially, a 10 cm thick layer of gravel was positioned at the bottom of the acrylic cylinder and covered with a nonwoven geotextile. The large pores between gravel stones are conducive to the drainage of soil pore gases and prevent the soil particles from being washed out from the bottom by water. In the experiment, the soil column was prepared by layered compaction and was then covered with fine sand, a stack of filter paper and permeable stones. The permeable stones and filter paper could evenly distribute the infiltration water across a cross-section of the soil column. Fine sand acts as a transition medium for surface infiltration water flow to ensure the uniformity of water flow distribution in the infiltration cross-section and to prevent the infiltration water flow from scouring or destroying the surface soil layer, so as to ensure normal infiltration. After the soil column was formed, the pore pressure dissipated after standing for 24 h, which effectively reduced the experimental error. Ultimately, a compact acrylic tank was attached to the lower part of the silt column to collect the runoff water. A sprinkler, connected to the water source and positioned above the surface of the sand column, was employed as the rainfall simulation system. The intensity of the rainfall was regulated by adjusting a water pressure regulator positioned between the water supply and the sprinkler. Before engaging the water supply, the tightness of the connection of each part was checked. The vertical infiltration device of a one-dimensional (1D) soil column can simulate the infiltration patterns of unsaturated soil under different rainfall intensities, infiltration hydraulic heads, initial soil moisture contents, and rainfall durations and can accurately determine change in soil moisture profile at a given point in time during rainfall infiltration.
The experiment was divided into three groups (Table 4). The purpose of C1 and C2 was to test the effect of initial dry densities on rainfall infiltration process. Column 2 and column 3 were used to evaluate infiltration processes with or without runoff. The infiltration process was examined by inducing artificial rainfall on the silt columns. The silt columns were prepared with varying initial density and subsequently subjected to designed rainfall intensities. Cumulative rainfall was recorded at different time intervals throughout the testing procedure, and the rainfall intensity was determined by calculating the slope of the cumulative rainfall versus time. Any excess water on the surface was collected in a tank. During the entire test, the moisture content in the soil column cross-section and the advancing displacement of the wetting front were recorded.

2.3.2. Filter Paper Test

The contact filter paper method, initially introduced by Kim et al. and Likos and Lu [26,27], has undergone improvements by Li et al., Xie et al., and Hou et al. [28,29,30,31], who compared their proposed suction estimation procedures with the method outlined in American Society for Testing and Materials (ASTM) D5298-10. The enhanced test procedure had several advantages, including minimizing the exposure of soil samples and filter papers to the prelaboratory soil solvent, thereby changing the content caused by moisture loss or absorption from the air. As a result, their findings were considered to be reliable to determine soil–water characteristic curve (SWCC).
According to Birle et al., the compaction property of the material exhibited a significant dependence on the manner in which it was prepared [32]. Therefore, the scholars developed a specific procedure in which samples were prepared from a basic material with a specific water content instead of wetting the dry soil powder directly to reach the desired value. It was assumed that by completing this process, the homogeneity of the aggregated soil particles could be preserved [32]. This procedure was applied to the material used in this study (Figure 3). First, a specific weight of water was added to the soil powder, and the resulting combination was mixed continuously and thoroughly and stored in an airtight container. The water content was determined to be 6.13% after homogenization over two days. Then, the basic material was wetted to the target water content, and the rehomogenized phase was observed after two days. Each soil sample was prepared in a standard mold by using sample preparation equipment, and they all had smooth surfaces. A secure contact surface between the filter paper and the bottom surface of the soil sample was guaranteed. The nominal height and diameter of the mold were 20 mm and 61.8 mm, respectively. At each density level, a total of approximately 50 samples were prepared from the basic material and divided into 25 groups. Samples compacted during drying and at the optimal water content were saturated (water-cured) prior to performing filter paper suction measurements. Each sample took different durations to reach various estimated water contents, and the drying curve was obtained from these data. Whatman ashless Grade 42 quantitative filter papers (Cytiva, Shanghai, China) were placed in direct contact between two soil samples for each group to prevent contamination (Figure 3a,b) [33,34]. Waterproof tape was used to adhere the two soil specimens in each group together to prevent the evaporation of water (Figure 3c) [26,31,34]. Specifically, to prevent evaporation during and after equilibration, the samples were wrapped in cling film and tinfoil sequentially, covered with wax, and placed in a sealed container (Figure 3d–f). After all of the above steps were completed, the samples were stored at 20 °C in a humidity-controlled dark room (Figure 3g). Following the recommendations of Chandler and Gutierrez, a 2-week period was allocated to allow equalization [35]. Subsequently, the filter paper was meticulously extracted from the soil samples (Figure 3g) and weighted using a scale with an accuracy of 0.0001 g. The wet and dry soil samples were also weighed with a scale with an accuracy of 0.01 g to calculate the GWC. Estimations of matric suction were derived utilizing correlations that relied on the water content of the filter paper, as established by Crilly and Chandler [36].

3. Results and Discussion

3.1. Deterioration of Loess Due to Saturated Infiltration

Figure 4 shows the variation in the saturated permeability of the soil during the test, which can be used to investigate the deterioration of loess due to infiltration. The initial measured saturated permeability of the CH soil sample with a dry density of 1.45 g/cm3 is 5.63 × 10⁻⁶ cm/s, and after 8856 s, the saturated permeability is 5.37 × 10⁻⁶ cm/s, a decrease of 0.26 × 10⁻⁶ cm/s. When the dry density of the soil sample is 1.60 g/cm3, ks decreases from 7.83 × 10⁻⁷ cm/s to 7.79 × 10⁻⁷ cm/s after 16,475.5 s, a decrease of 0.04 cm/s. The variation curves of the saturated permeability versus time of the soil samples in the other areas exhibited the same pattern. For the same soil sample with the same dry density, the soil saturated permeability decreased over time, but the changes were within the same order of magnitude. Moreover, during the same time period, the decrease in the saturated permeability of soil with lower dry density was more significant, and the decrease rate was larger. These results suggest that the deterioration of loess permeability is evident in the long-term infiltration of low-density soils, while the development of deterioration is relatively slow in high-density soils. Under saturated infiltration conditions, the long-term interaction between water and loess particles could cause irreversible changes in loess structure, which is the main cause of infiltration degradation in loess. An et al. observed the appearance of samples before and after the saturated infiltration test and found that the structure of the compacted loess sample was uniform before the saturated infiltration test, while after the 20 h saturated infiltration test, pockmarks appeared on the lower surface of the sample due to particle transport [37]. The loss of soluble substances in the soil during long-term infiltration causes the cohesion of the particles to continuously decrease, and the upper fine particles displace under the action of the water infiltration and block the pores; therefore, the inhomogeneity of the pores along the infiltration direction gradually increases [37], and irreversible effects are induced in the pore structure, which reduces the proportion of effective infiltration channels. According to the principle that the minimum pore size determines the permeability, the saturated permeability gradually decreases during the infiltration process, causing the deterioration of the saturated infiltration flow.

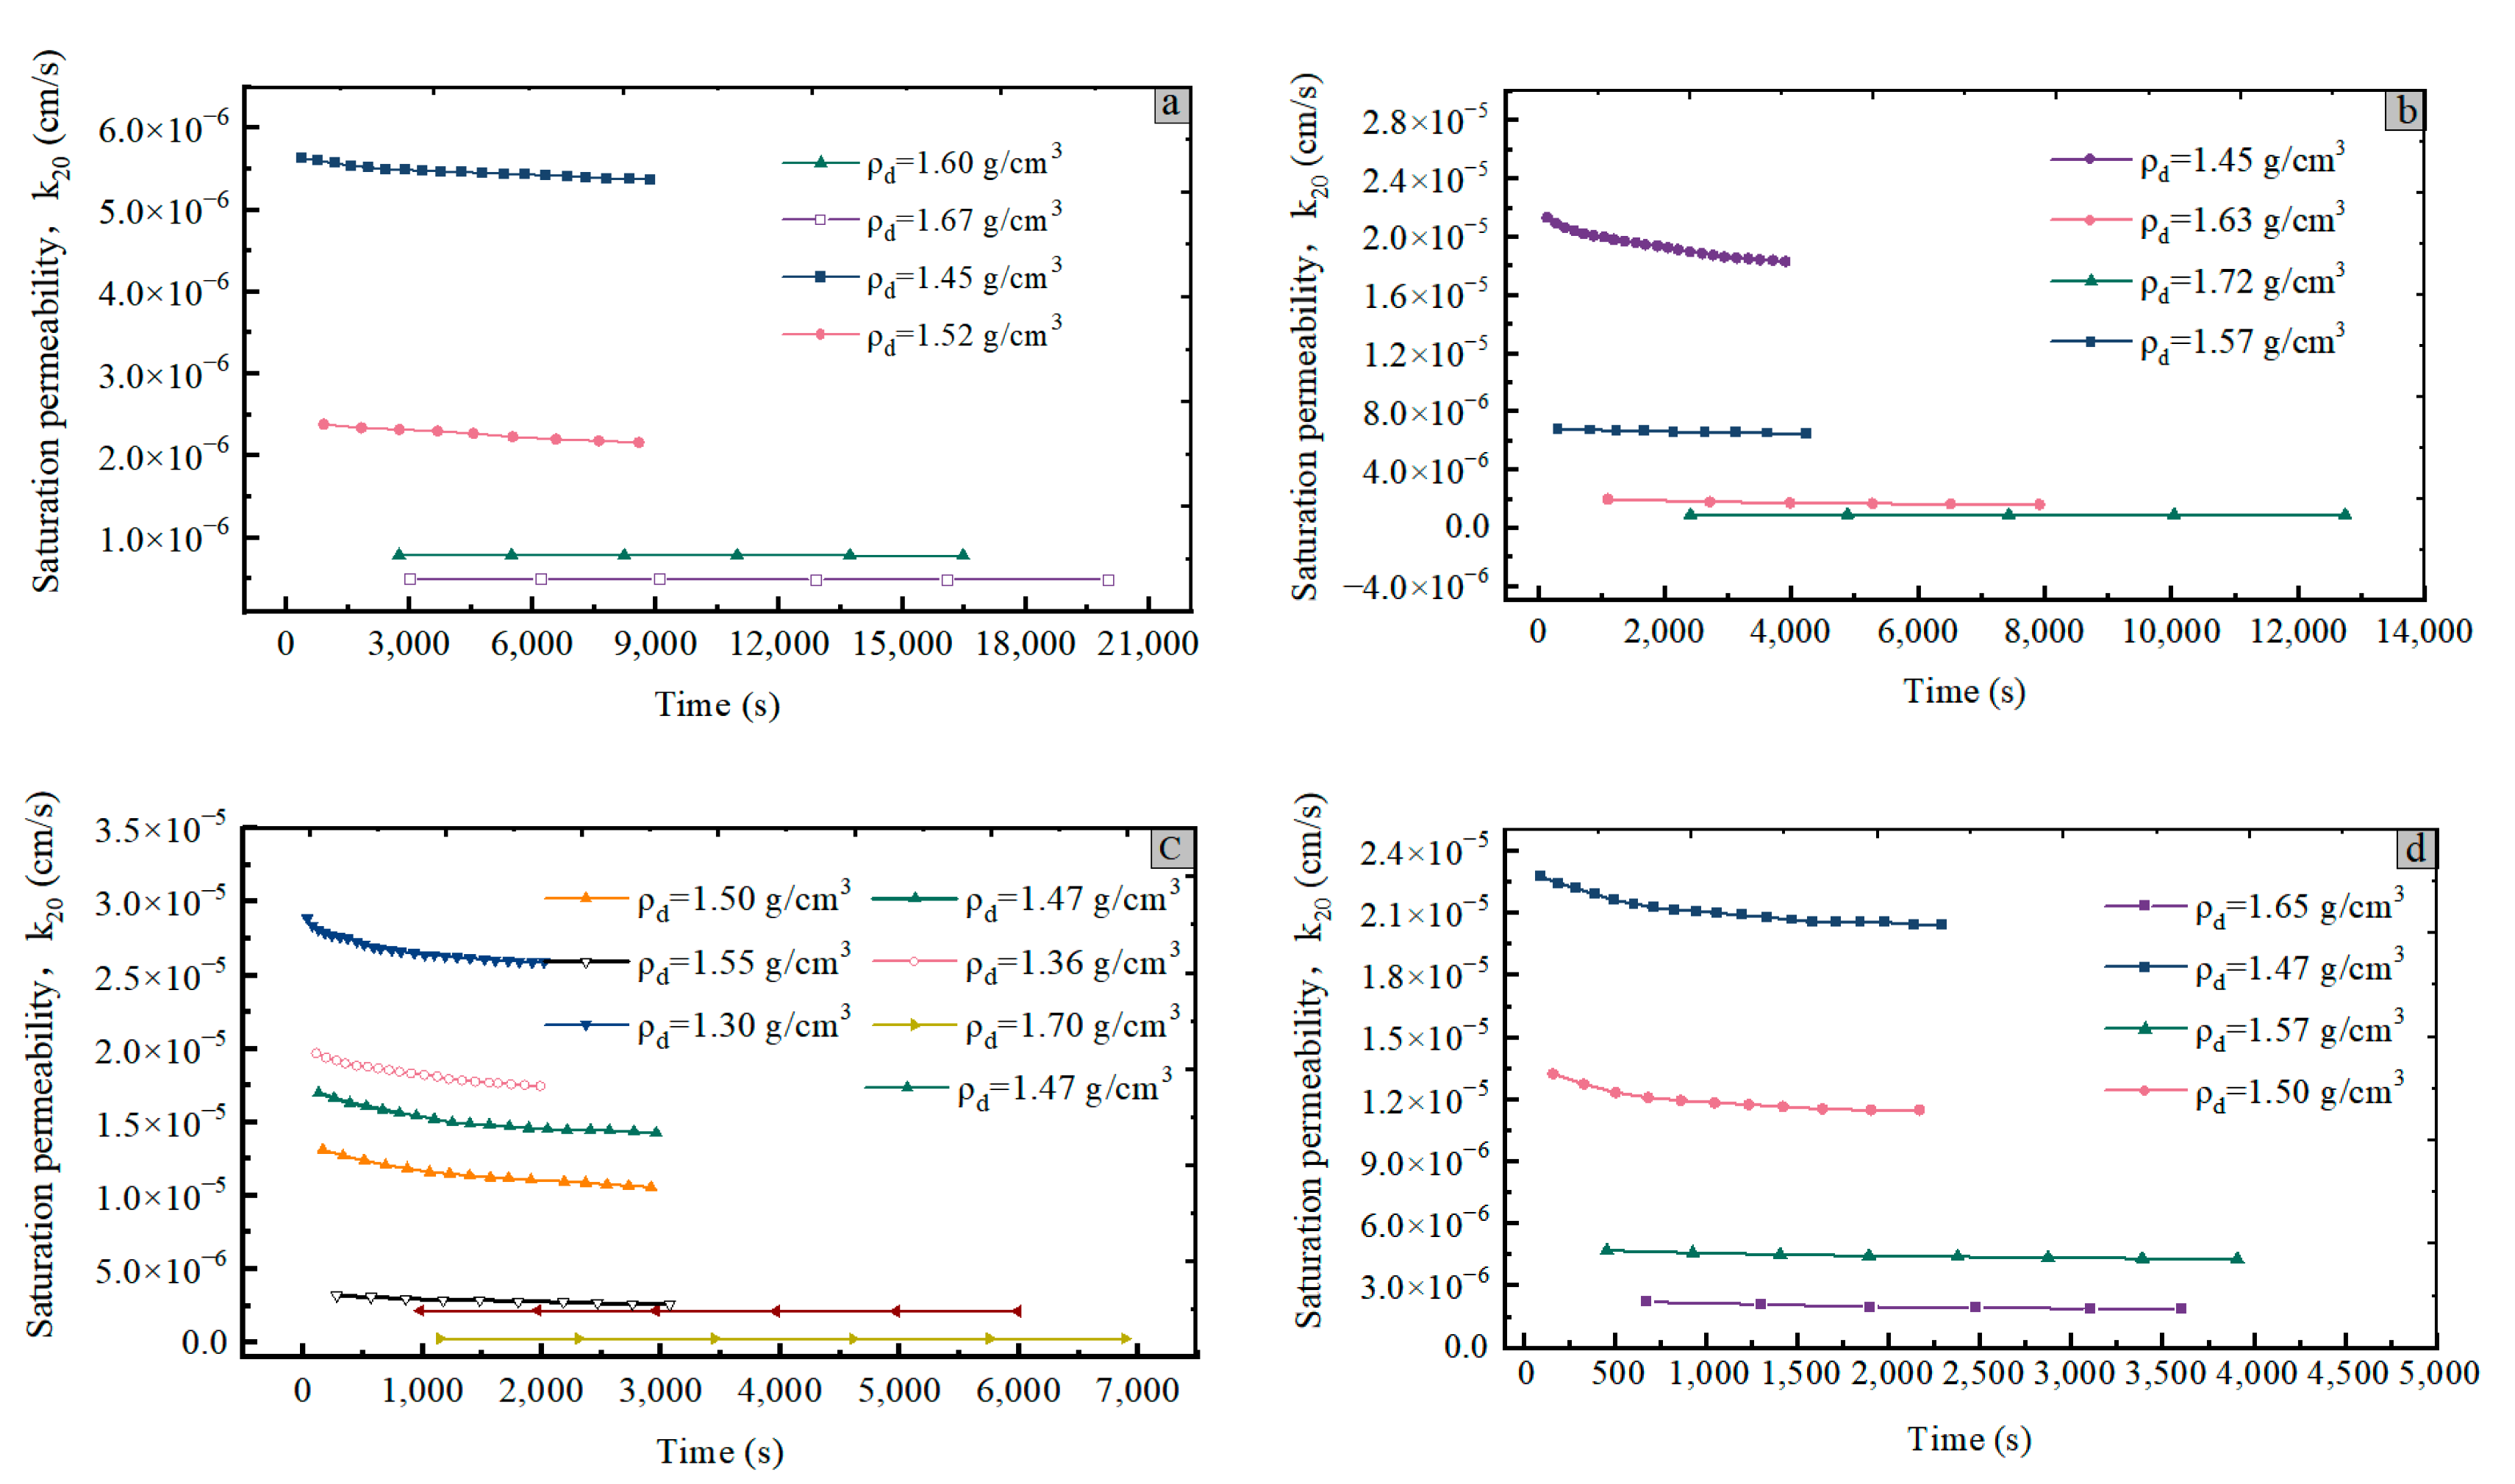
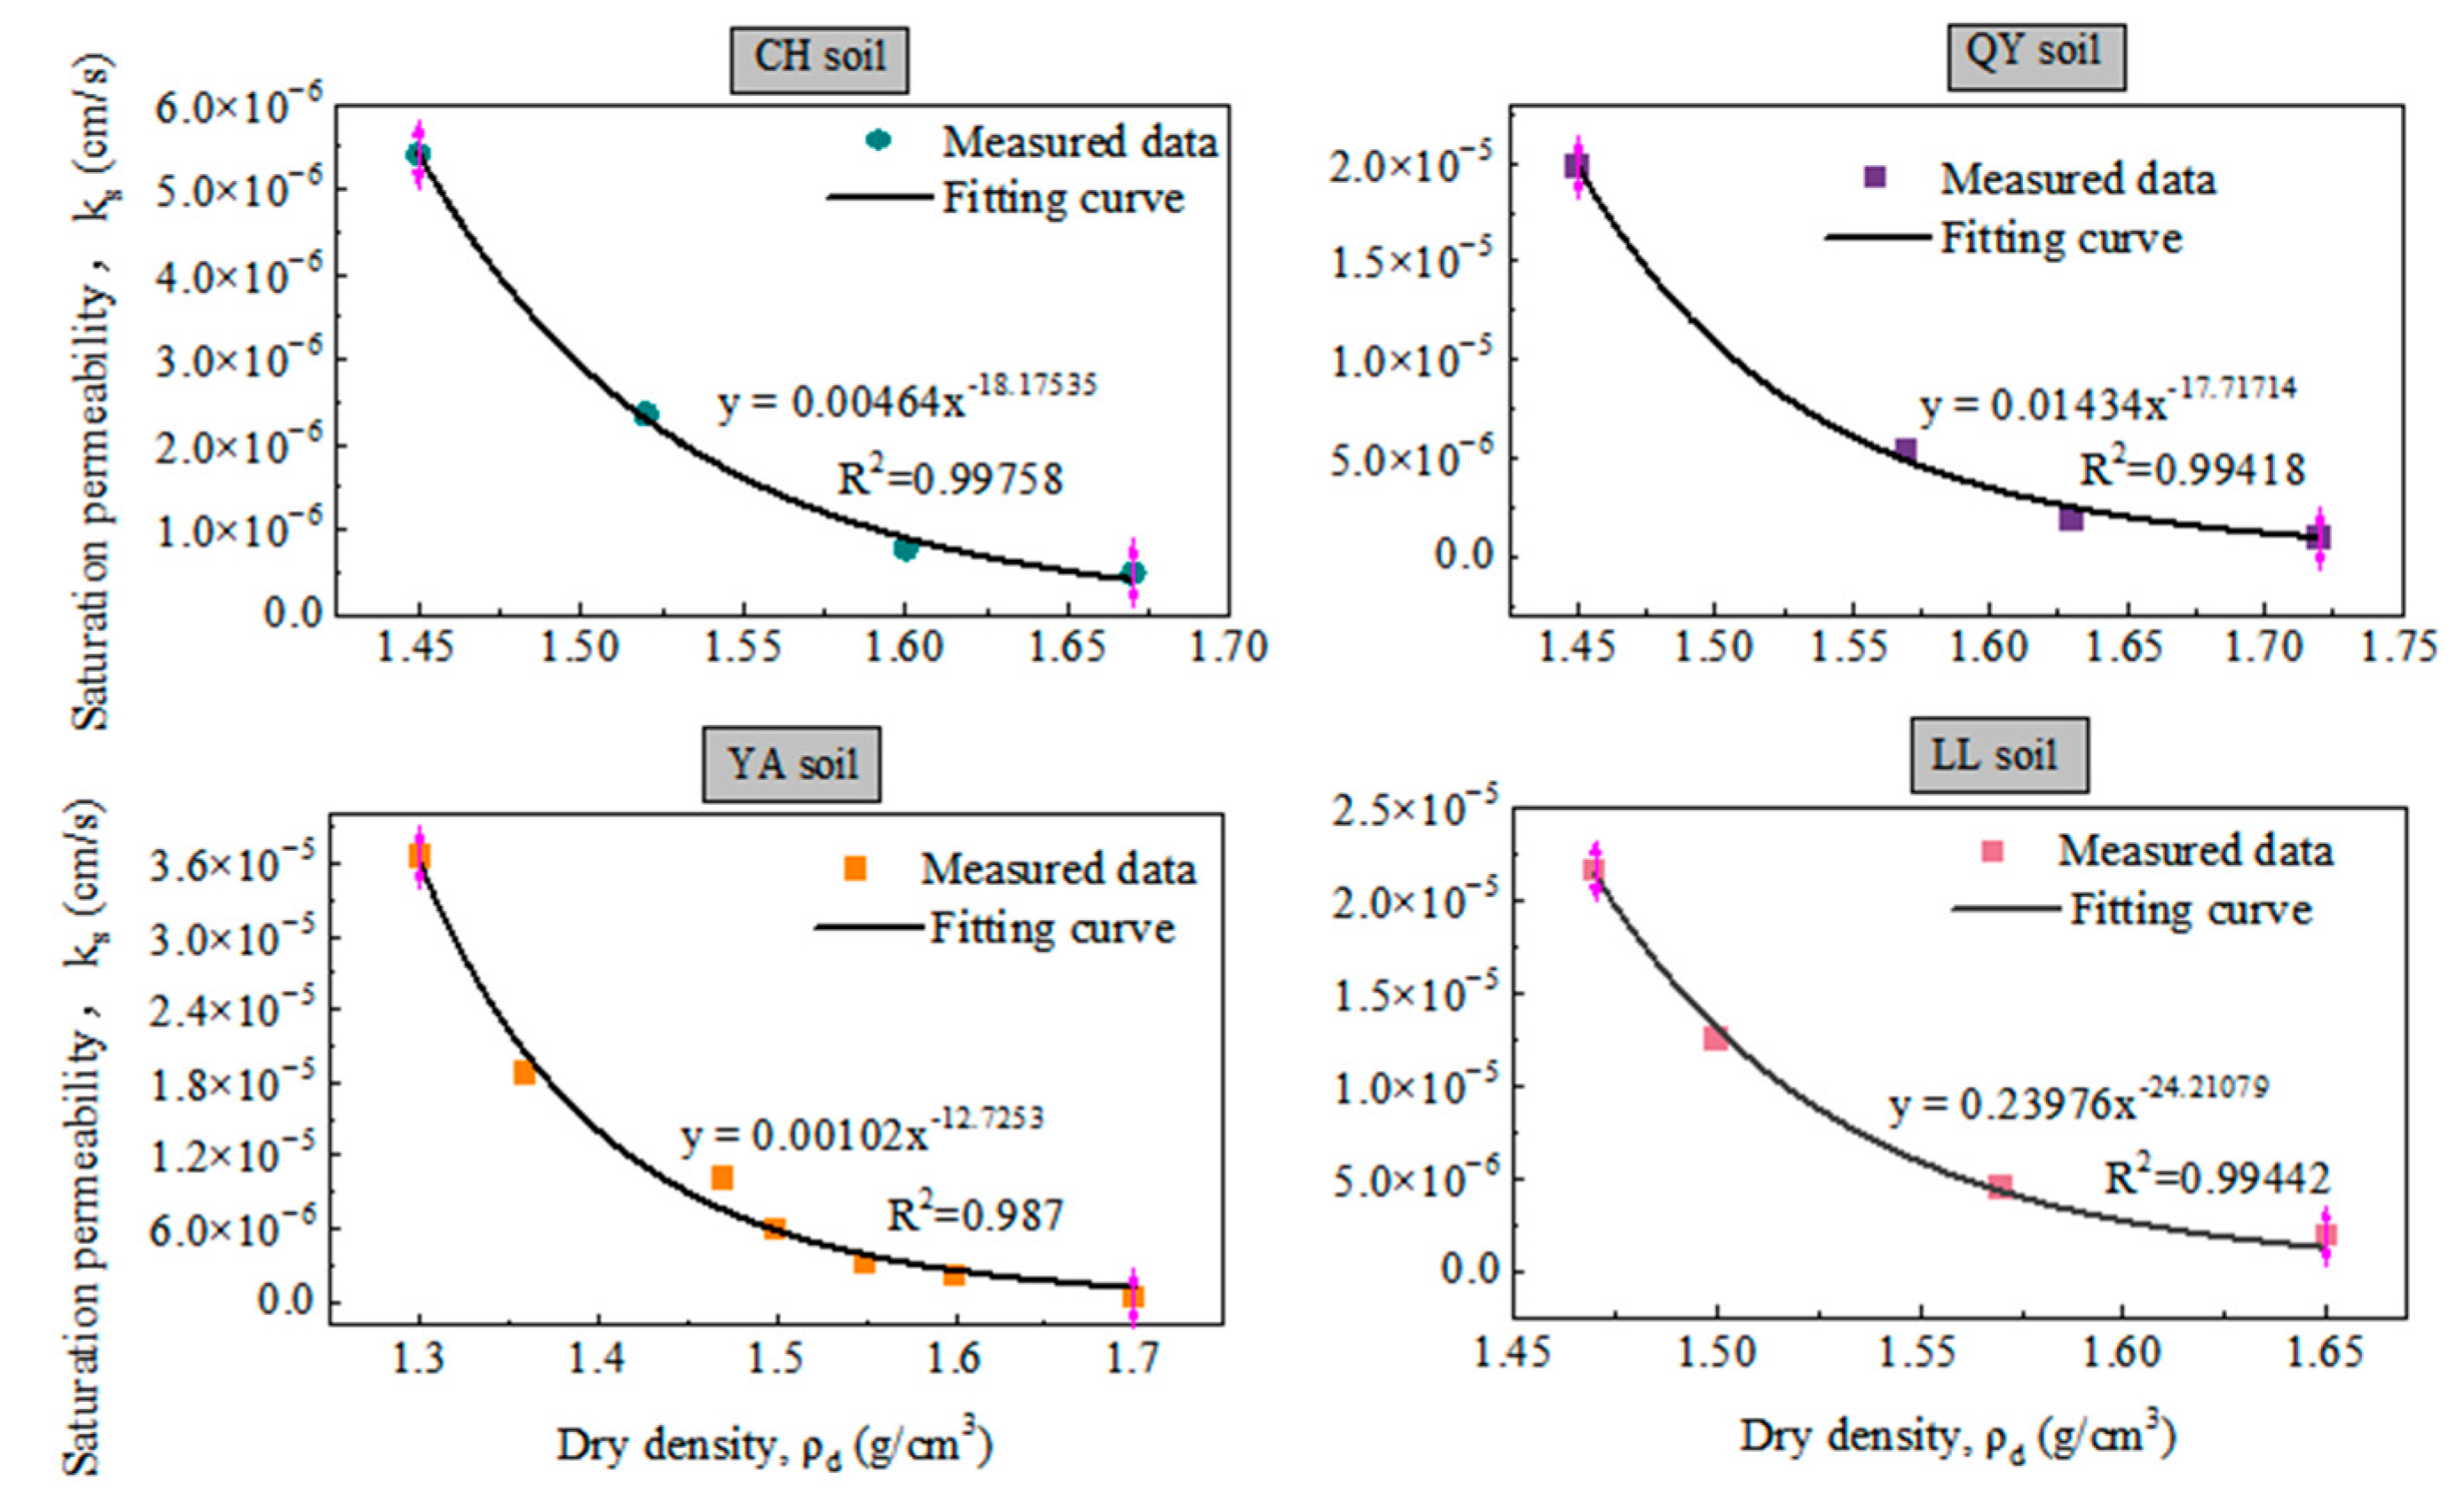
3.2. Influence of Dry Density on Saturated Permeability

The relationship between the permeability ks and dry density ρd of the test materials can be fitted by a power function ks = a·ρdb, as shown in Figure 5, and the correlation coefficients all range from 0.987 to 0.99857, indicating that the fitting reliability is good. When the initial moisture content is the same, the permeability of the remolded loess gradually decreases with increasing dry density. When the dry density of the YA soil samples increases from 1.30 g/cm3 to 1.70 g/cm3, the saturated permeability decreases from 3.65 × 10⁻⁵ cm/s to 2.68 × 10⁻⁷ cm/s, a decrease of two orders of magnitude. When the dry density increases from 1.45 g/cm3 to 1.67 g/cm3, the saturated permeability decreases from 5.41 × 10⁻⁶ cm/s to 4.93 × 10⁻⁷ cm/s. The same phenomenon also applied to the QY and LL loesses. When the dry density was low, the actual measured saturation permeability was on the order of 10−5 cm/s, and when the dry density was high, the permeability was on the order of 10−7 cm/s, decreasing by two orders of magnitude. The slope of the curve in Figure 5 shows that the decrease rate of the saturated permeability gradually decreases. That is, when the dry density of the soil sample is less than 1.6 g/cm3, the saturated permeability decreases significantly; when the density is greater than 1.6 g/cm3, the rate of decrease in ks gradually reduces. Therefore, the correlation between permeability and dry density should be considered in the design and construction of loess structures or protection works, such as earth dams, embankments, roadbeds, slopes and loess foundations. Based on the characteristics of a structure, a reasonable dry density value should be designated for construction that can effectively reduce engineering geological problems such as the deformation and failure of the structure. If the structure requires low permeability, compaction should be performed under the optimal moisture content to the greatest extent possible to obtain a soil body with the maximum dry density, thus achieving infiltration prevention.

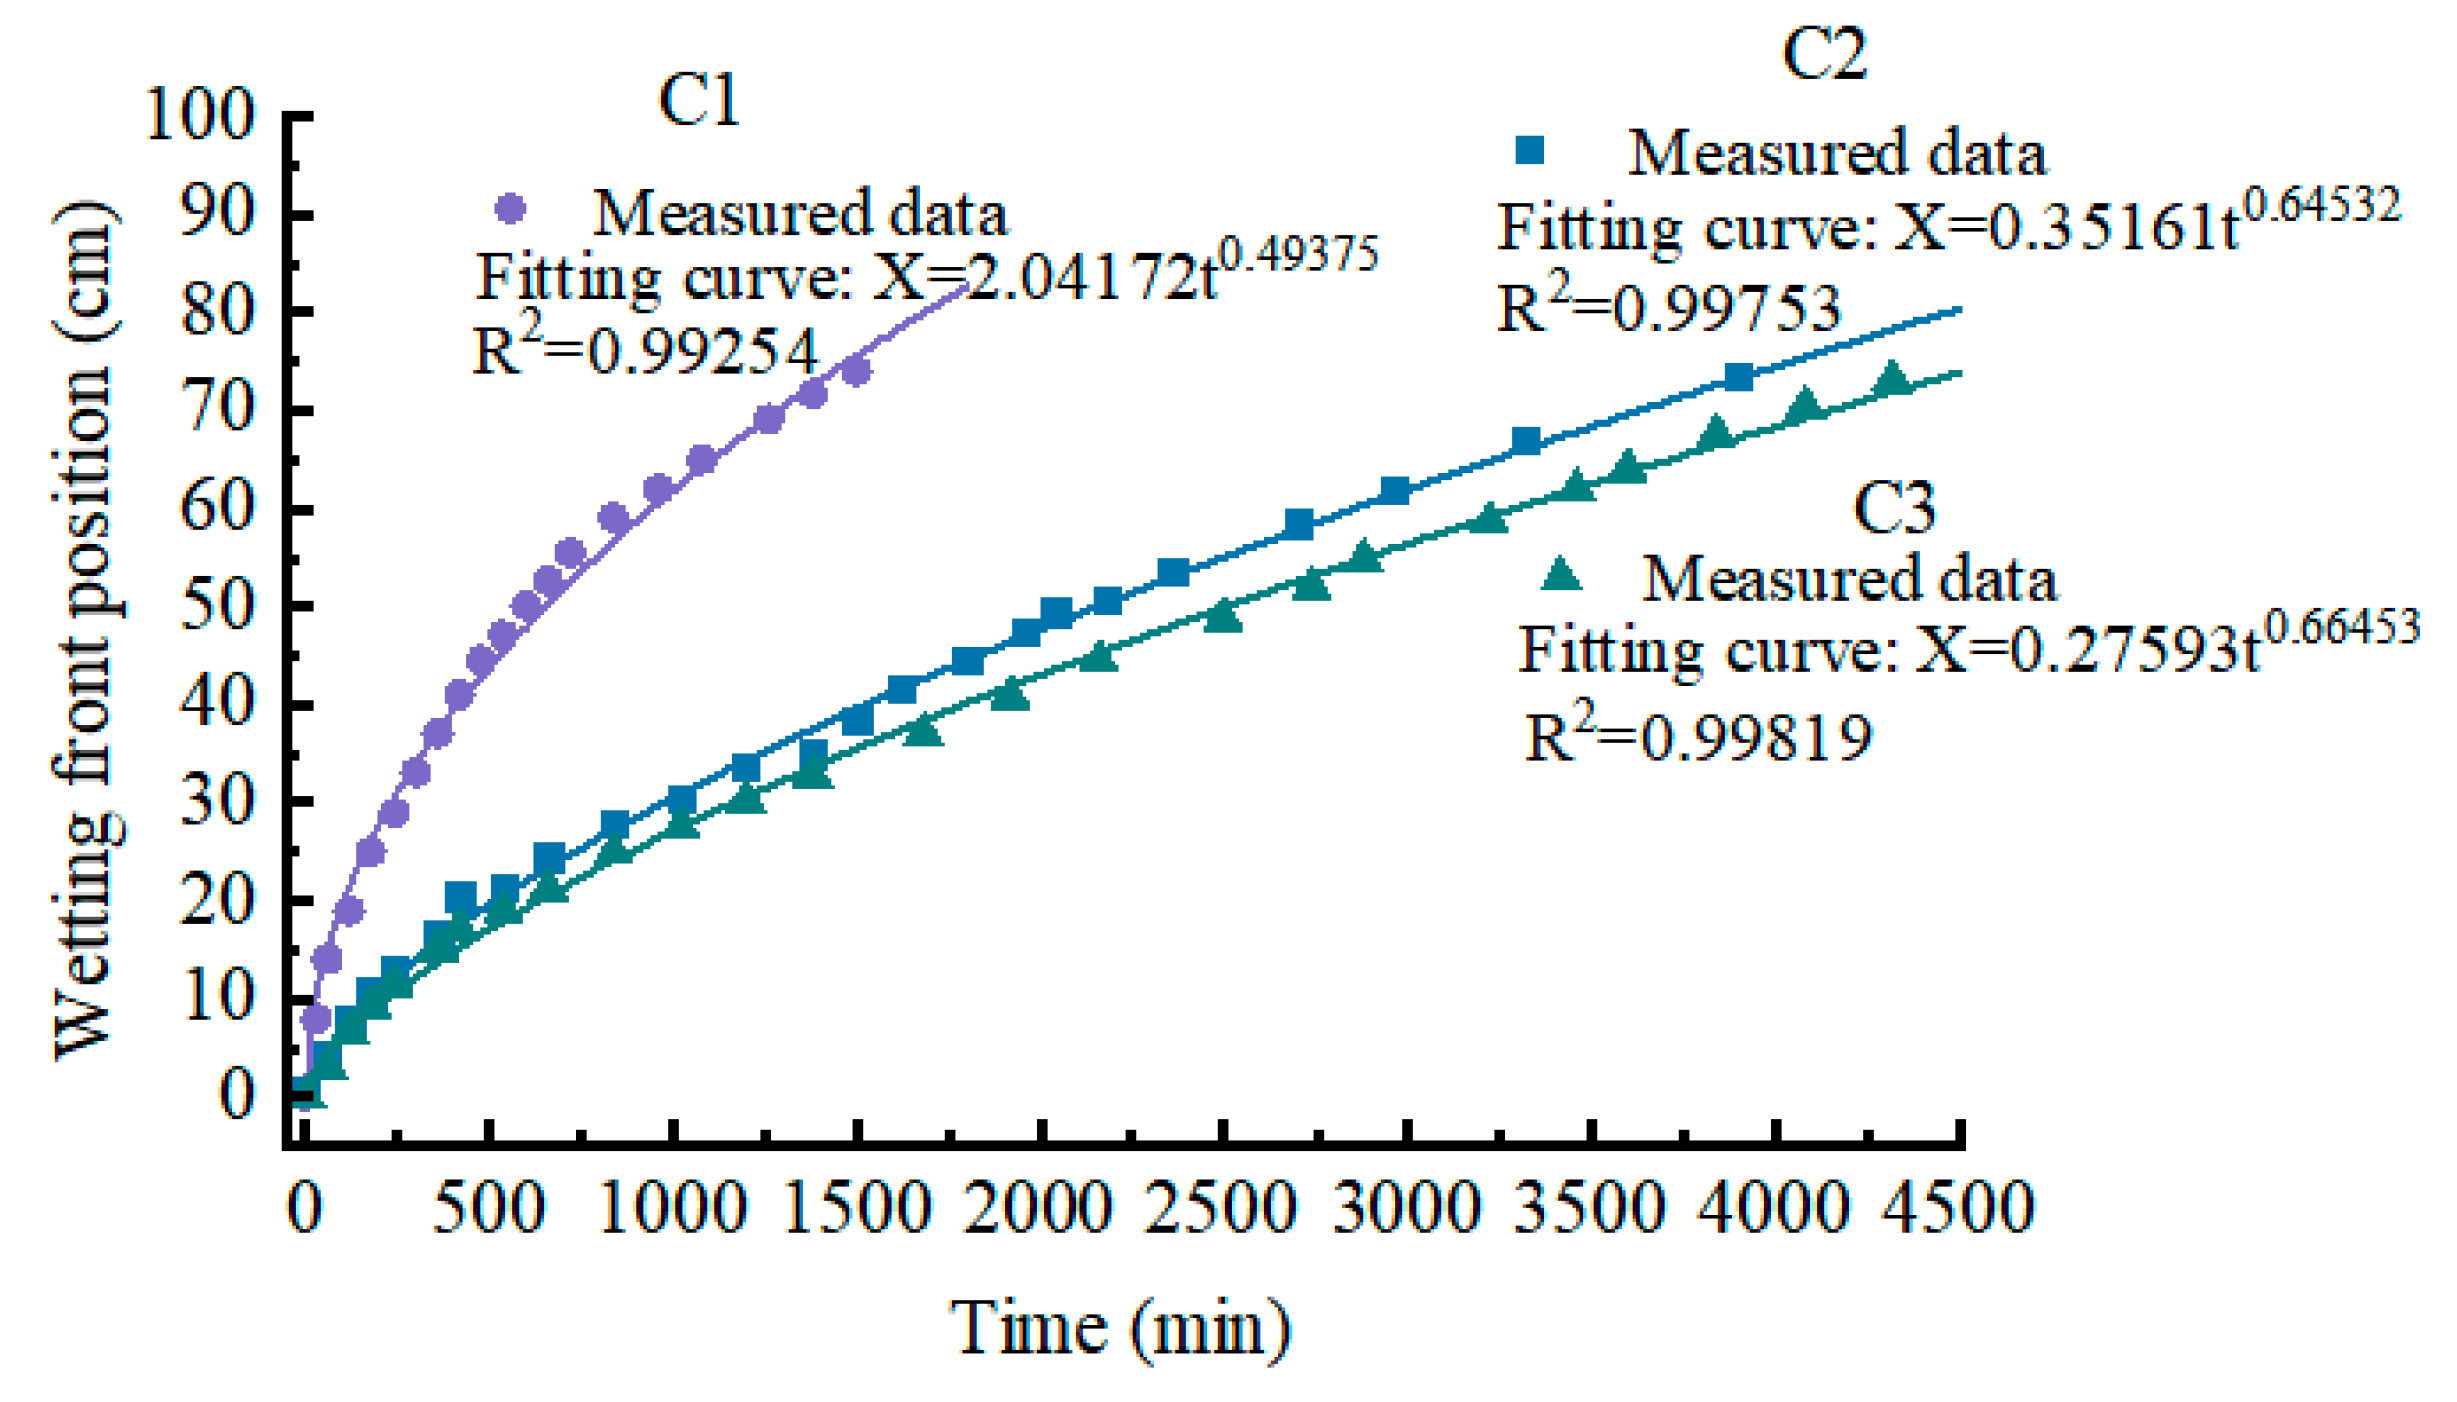
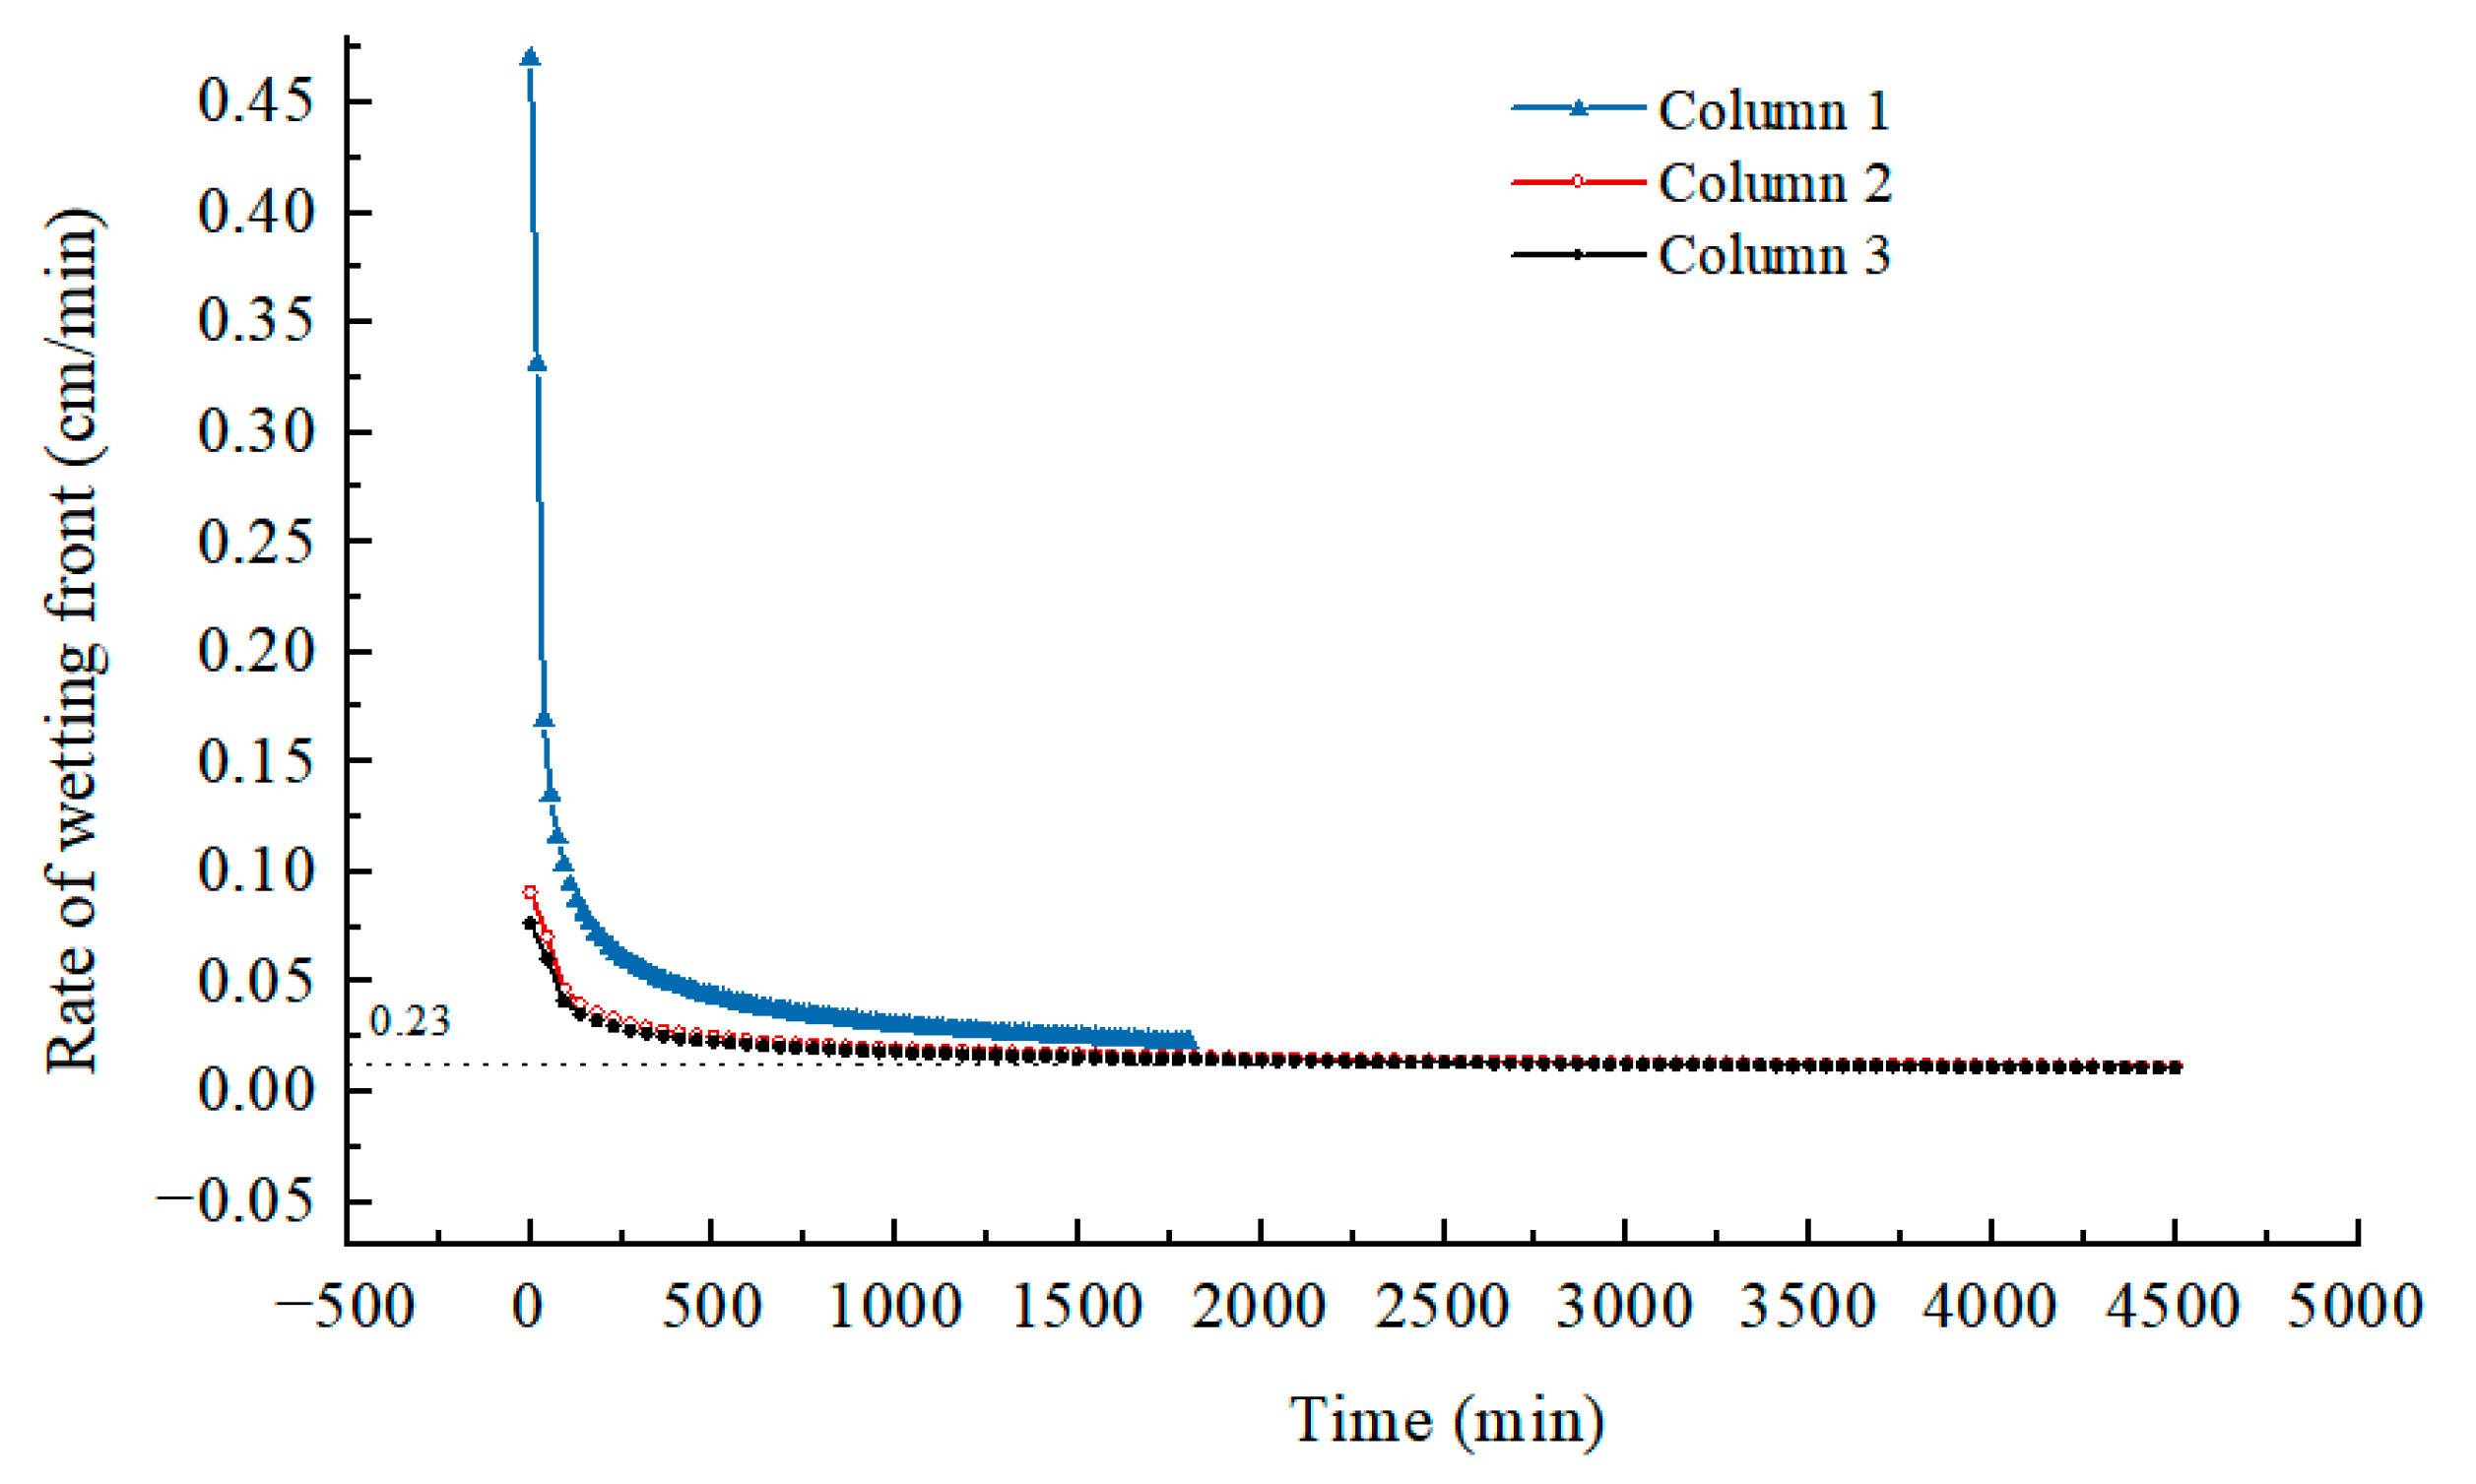
3.3. Wetting Front Under Unsaturated Infiltration

When studying 1D water transport in unsaturated soil in the vertical or horizontal direction, the migration characteristics of the wet and dry interface in the soil, i.e., the wetting front, intuitively reflect the speed of water infiltration in the soil and are an important aspect of analyzing water transport characteristics in unsaturated soils. The migration rate is controlled by the soil properties, bulk density, water supply flow rate, and time. In this section, the migration rates of the wetting fronts of the C1 soil column (density of 1.31 g/cm3) and C2 soil column (density of 1.39 g/cm3) were comparatively analyzed to investigate the effect of the initial structure of homogeneous soil on soil water infiltration. By comparing the infiltration processes of the C2 and C3 soil columns, the effect of the presence of surface ponding water infiltration on the migration displacement and rate of the wetting front was investigated.
As the vertical soil column infiltration test progressed, the wetting front continuously moved forward, and the infiltration displacement of each soil column obeyed the available power function (Figure 6). Based on the derivative of the power function or the migration rate curve of the wetting front, the wetting front advancing rate–time curve gradually changed from relatively steep to relatively gentle (Figure 7). In general, the three unsaturated soil columns are relatively dry at the initial stage of infiltration, so the infiltration capacity of the soil is large, and the downward migration rate of the wetting front is relatively high during the water infiltration process. As infiltration progresses, the upper soil is gradually saturated, and the pores in the upper soil are gradually filled with water, so the infiltration capacity gradually decreases, thus affecting the migration of the wetting front, and the migration rate gradually decreases (Figure 7). During this stage, the main factors affecting the migration of the wetting front are the properties of the soil column, such as the initial dry density, initial porosity, and soil properties, rather than the rainfall intensity.
A comparison shows that the advancing rate of the wetting front of the C1 soil column is significantly higher than that of the C2 soil column (Figure 6). An increase in the initial dry density or a decrease in the initial porosity reduces the effective cross-section of the soil for water flow, so the infiltration capacity and migration ability of the wetting front are reduced (Figure 7). A comparison of the wetting front–time curves of the C2 and C3 soil columns revealed that the displacements of the two wetting fronts are the same before 120 min, the infiltration process at this stage is free infiltration, the infiltration rate mainly depends on the rainfall intensity, and all water migrates into the soil column. As rainfall infiltration progresses, ponding water gradually appears on the upper surface of the C2 soil column, and the C2 soil column enters the ponding water infiltration stage; the migration rate of the wetting front becomes gradually higher than that of the C3 soil column, and the difference in the wetting front displacement gradually becomes more pronounced. Therefore, the infiltration process of the C2 soil column at this stage is referred to as pressure infiltration.

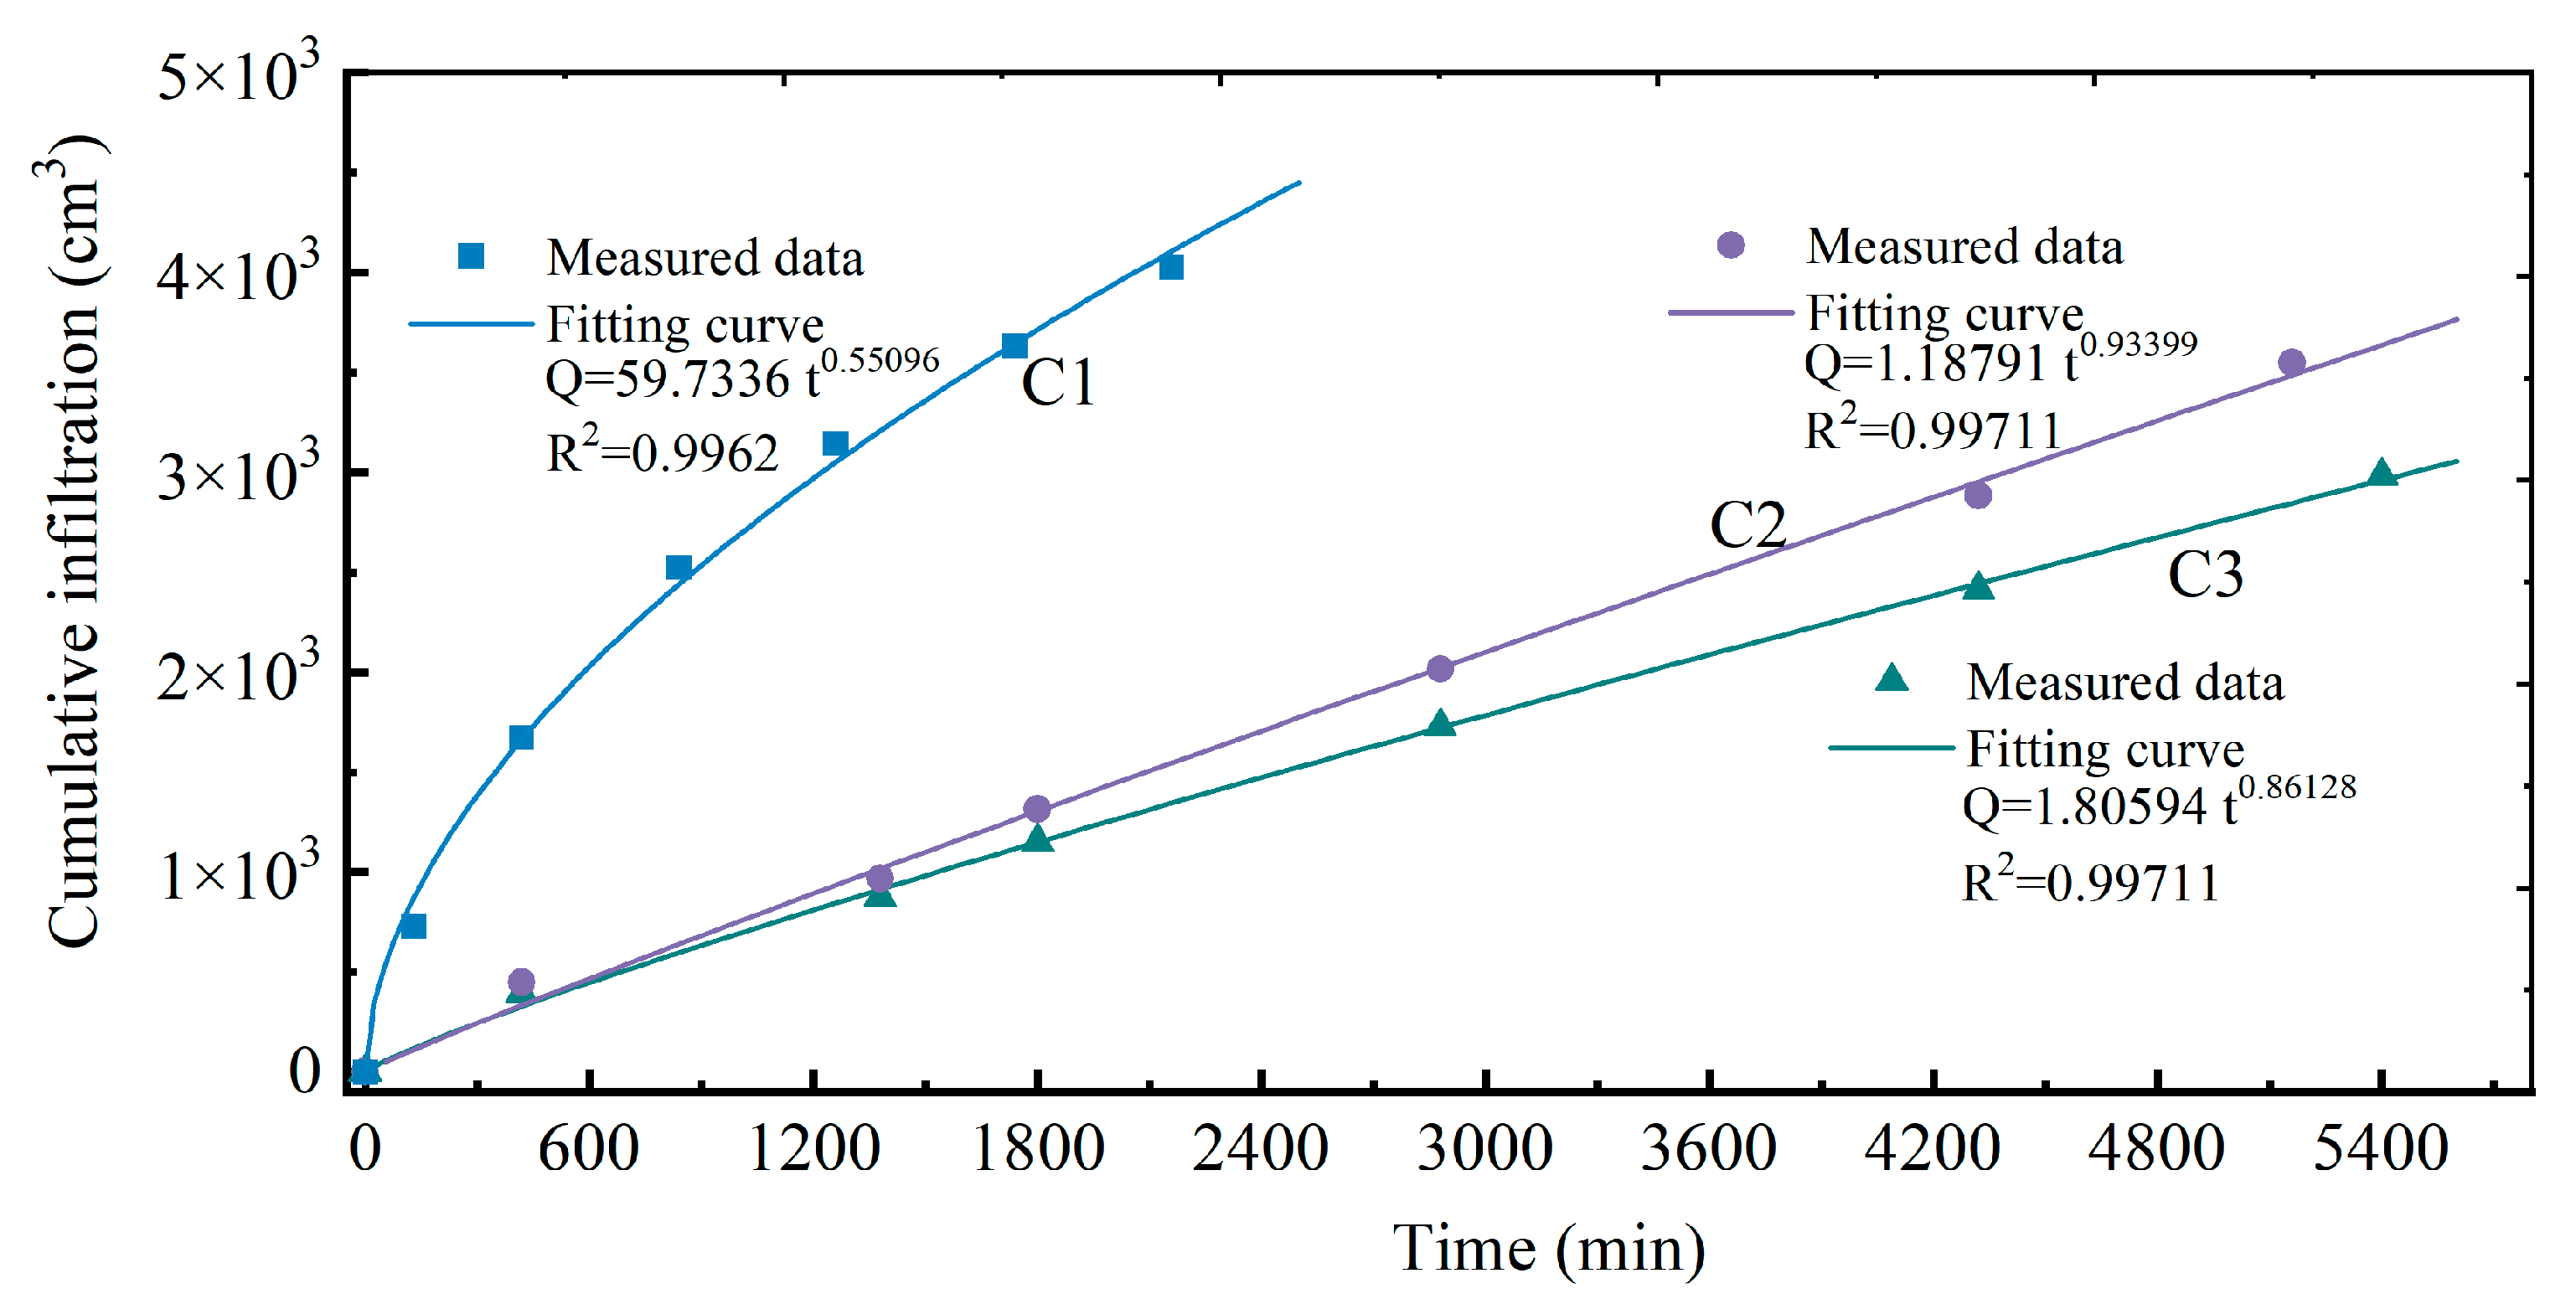
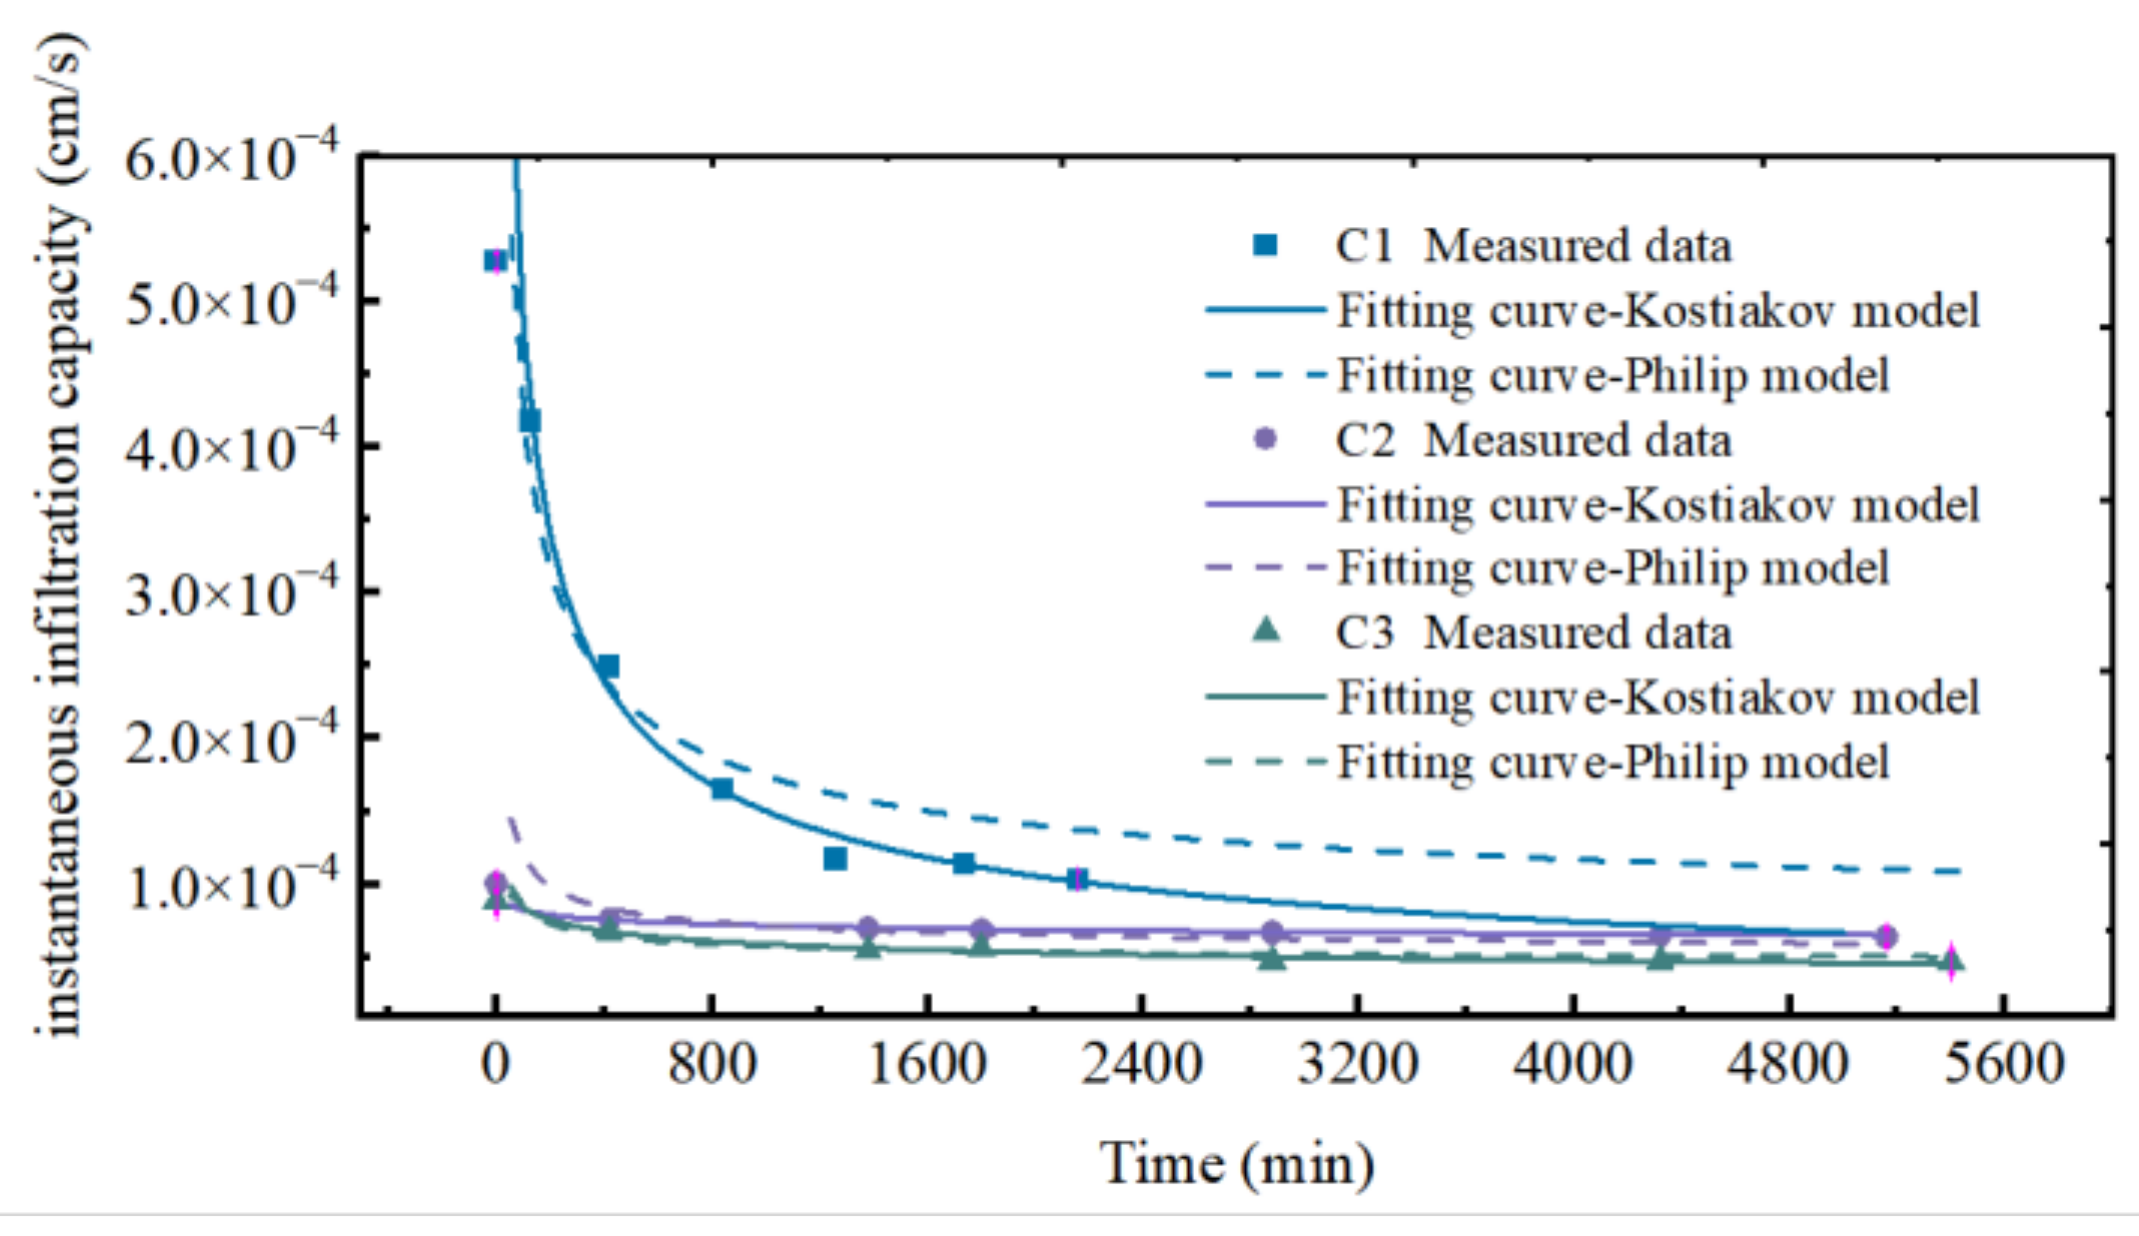
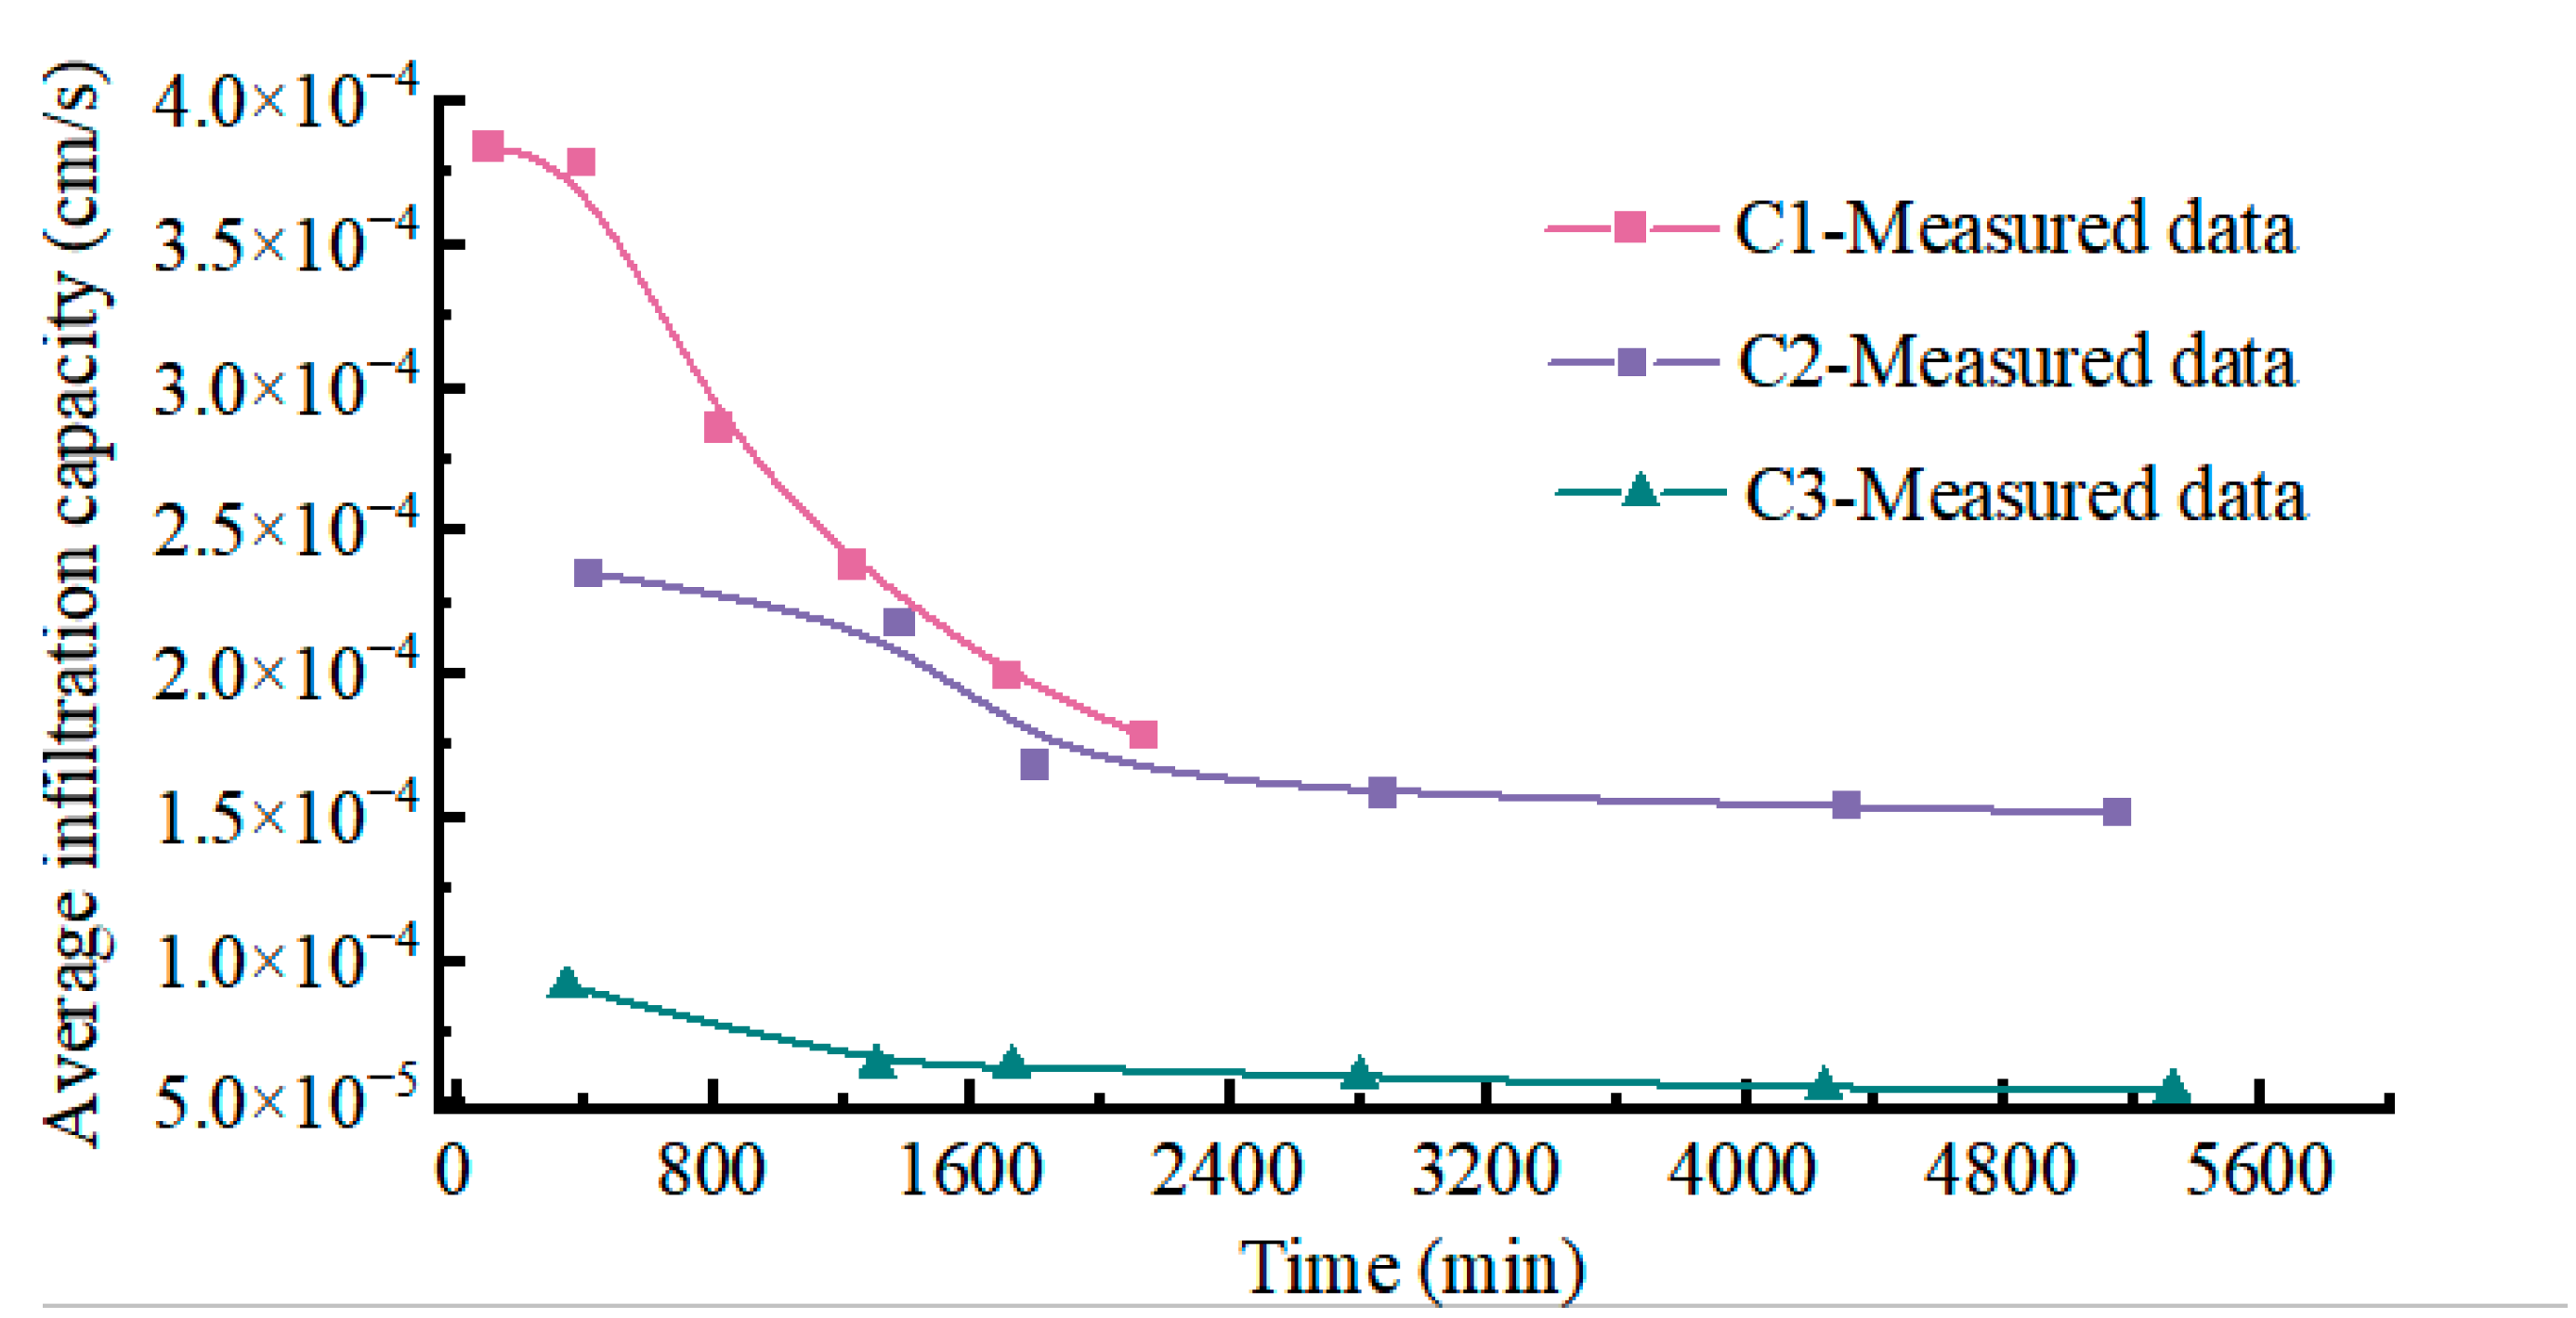
3.4. Infiltration and Infiltration Rate

Previously, Green and Ampt made the following assumptions: the suction hydraulic head where wetting front has not reached is a constant, and the moisture content and permeability of the part where the wetting front has passed also remains unchanged [38]. Then, the total infiltration displacement per unit cross-sectional area q at a certain time can be calculated as follows:
q = ( θ i θ 0 ) z
where θi is the moisture content of the part where the wetting front has passed; θ0 is the moisture content of the part where the wetting front has not reached; and z is the length of the wetting front.
Cumulative infiltration is the total amount of rainfall infiltrating into the ground:
Q = A θ i θ 0 z
If the soil moisture content behind the wetting front is not constant but varies continuously with increasing depth, then the increase in moisture content needs to be integrated along depth.
The instantaneous infiltration rate is equal to the infiltration rate at the water boundary, which can be expressed by Darcy’s law as:
i = 1 A d Q d t = ( θ i θ 0 ) d z d t
In Equation (3), i is the infiltration rate, cm/s; θ i θ 0 is the difference in the moisture content between hydraulic heads 0 and i; z is the length of the wetting front; and A is the cross-sectional area of the soil sample, where A = 176.7146 cm2.
Previously, various infiltration models have been established; the most typical ones are the Kostiakov model, the Horton model and the Philip model [39,40,41], whose formulas are as follows:
Kostiakov model:
I t = a t n
where I(t) is the infiltration rate, mm/min; t is the infiltration time, min; and a and n are model parameters.
Horton model:
I t = I f + ( I i I f ) e c t
where I(t) is the infiltration rate, t is the infiltration time, Ii is the initial infiltration rate, If is the stable infiltration rate, and c is the model parameter.
Philip model:
I t = I f + b t 0.5
where I(t) is the infiltration rate, t is the infiltration time, If is the stable infiltration rate, and b is the model parameter.
In this section, the above models were used to fit the measured infiltration data to describe the soil column infiltration curve. Figure 8 shows the variation curves of moisture content versus time for the C1 soil column, C2 soil column and C3 soil column, and the cumulative infiltration of the soil column can be obtained by integrating over the vertical cross-section (Figure 9). The variation curve of the soil moisture content increment was divided into several straight line segments, and the curve integral was converted to calculate the area of geometric shapes to obtain the cumulative infiltration in each time period. The cumulative infiltration–time curve of the soil column obeyed a power function, which was similar to the displacement pattern of the wetting front.
Figure 10 shows the instantaneous infiltration rate of the soil column, and the fitting parameters are listed in Table 5. The infiltration rate decreases sharply during the infiltration process and then is gradually stabilized, which is consistent with traditional infiltration theory. Due to differences in the initial structure or pore structure, the infiltration and infiltration rate of the C1 soil column are always greater than those of the C2 soil column. The C2 soil column and the C3 soil column have basically the same infiltration rate and infiltration at the initial stage, and both are influenced by rainfall intensity. As the rainfall infiltration progresses and ponding water appears on the soil column, the difference between the two gradually became evident, and both enter the pressure infiltration stage.
Taking the results of the C1 soil column as an example, the change process of the infiltration rate can be roughly divided into three stages. The first stage occurs within two hours of the initial stage of infiltration. The infiltration capacity of the soil under the initial conditions is greater than the rain intensity, causing all water to infiltrate the upper layer of soil column, and the infiltration rate rapidly decreases over time. At this time, the infiltration rate is equal to the rain intensity, and this stage is defined as the rainfall intensity control stage. The time point of water drainage at the bottom of the soil column is used as the endpoint of the second stage, and the duration of the second stage is 1–8 h. At this stage, the saturation range of the upper soil layer gradually increases, the infiltration capacity of the soil gradually decreases once the soil is near saturation, and the instantaneous infiltration rate decreases over time. This stage is defined as the soil infiltration capacity control stage, and in this stage, the infiltration rate of the soil column mainly depends on the properties and initial conditions of the soil. After the time point of water drainage at the bottom of the soil column, the third stage starts, and the soil column reaches the saturation state. At this time, the infiltration rate almost no longer changes, and the infiltration rate is equal to the saturation permeability, which is basically stable at 5.04 × 10⁻⁵ cm/s, so the permeability can be calculated in the stable infiltration stage. The infiltration rate of the sample with a dry density of ρd = 1.39 g/cm3 is basically stable at 1.9 × 10⁻⁵ cm/s, and the saturated permeability is ks = 1.9 × 10⁻⁵ cm/s. Similar to the conclusions of Wang, the rainfall infiltration process can be divided into three stages: rainfall intensity control, unsaturated infiltration and saturated infiltration [42].
The average infiltration rate is defined as the infiltration rate per unit area and per unit time. The change in the infiltration rate of the soil is divided into two stages. The infiltration rate is higher at the initial stage of infiltration, and the infiltration rate gradually stabilizes in the later stage of infiltration, which is numerically referred to as the stable infiltration rate. The infiltration rate in the stable stage is an important parameter for describing the infiltration characteristics of soil. The average infiltration rate of the soil surface at a given time is:
i a v e = Q A t
where iave is the average infiltration rate, Q is the cumulative infiltration, A is the cross-sectional area of the soil column, and t is the duration.
Figure 11 shows the average infiltration rate curve of the soil column. The average infiltration rate can also be divided into three stages. The first stage is a gentle section, the second stage is a slowly decreasing section, and the third stage is a stable section, which is consistent with the three stages of the instantaneous infiltration rate.

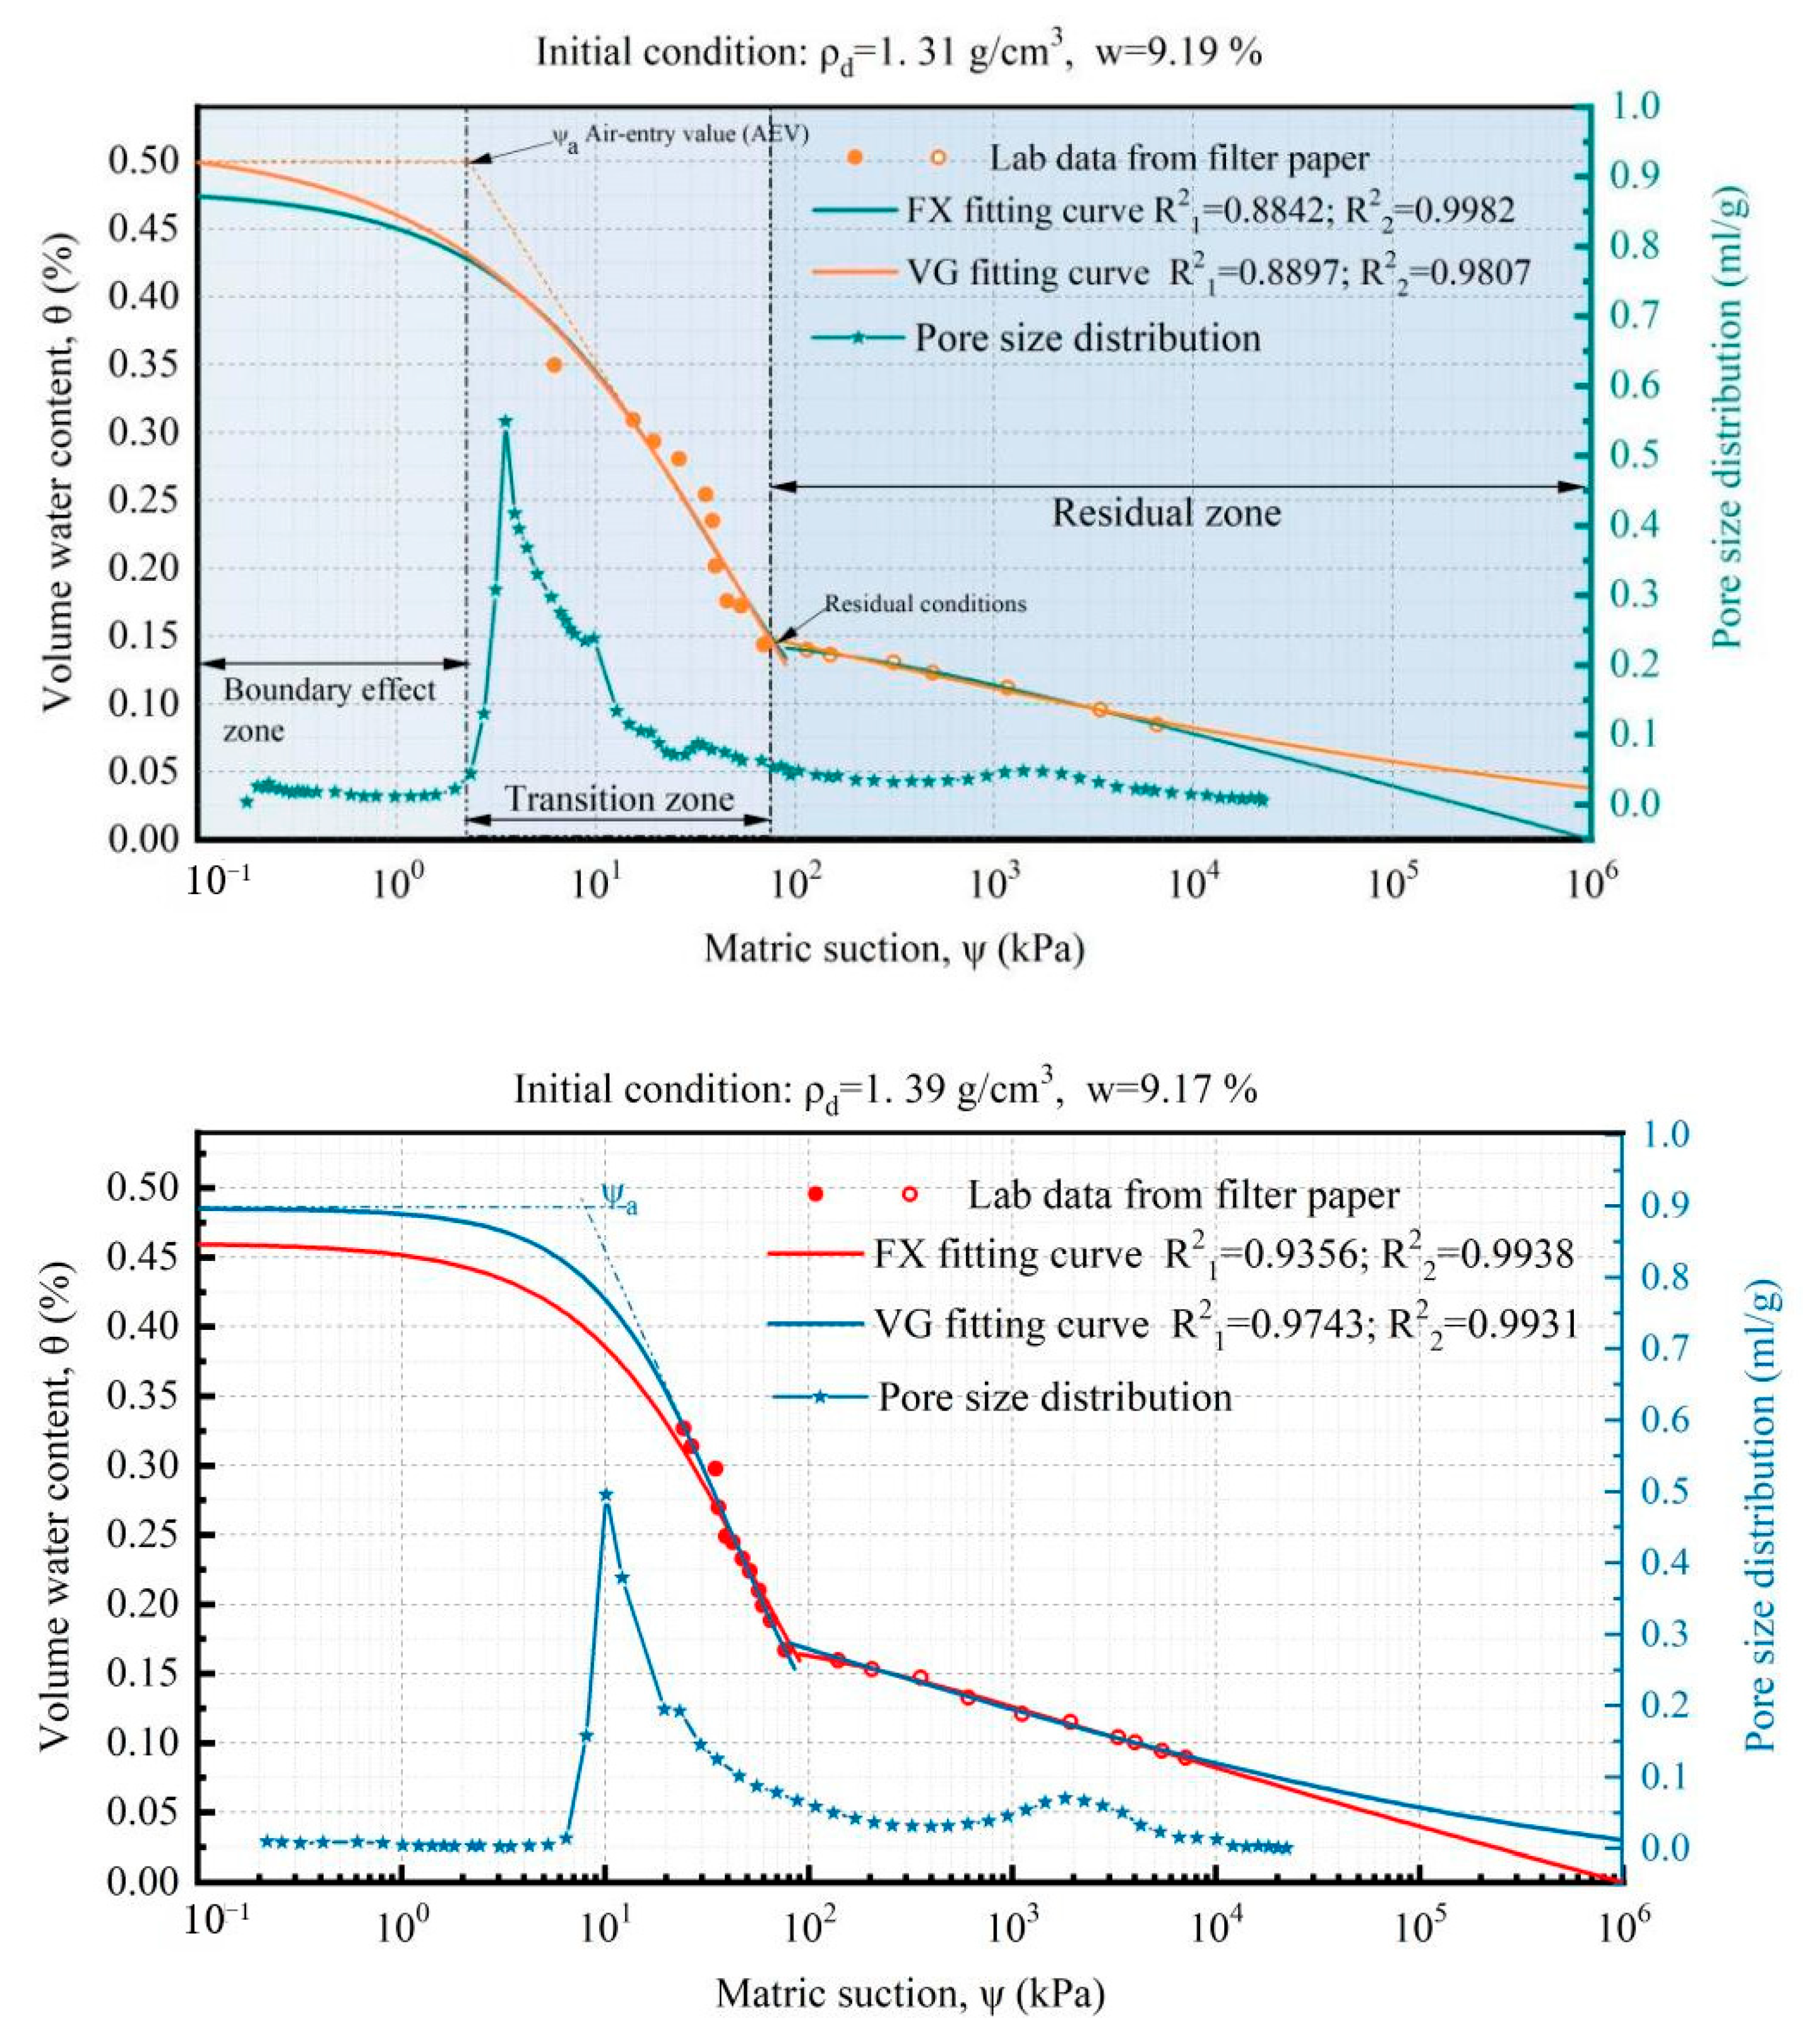
3.5. SWCC and Pore Size Distribution (PSD) Curves

Mercury and air are nonwetting fluids. For pores with the same diameter, the process of mercury intrusion into porous media is similar to that of air intrusion into soil under the dry path of the SWCC [43,44,45,46,47]. The mercury infiltration curve is converted to a PSD curve with the help of the Young–Laplace equation for the capillaries [48], and the PSD density obtained from mercury intrusion porosimetry (MIP) can be converted into a relationship between the pore size and matric suction and is thus related to the SWCC. As Figure 12 shows, the SWCCs for soils exhibit double S-shapes. Cai et al. reported that SWCCs tend to flatten out in the intermediate suction range, regardless of the pore size distribution density, and that the two pore systems correspond to the two stages of the double-down SWCC [49]. The water loss process of pores between saturated aggregates corresponds to the first stage of the SWCC, while the water loss process of pores within saturated aggregates corresponds to the second stage of the SWCC. Consequently, compacted soils are expected to undergo two distinct stages of water loss during the drying process. Water is lost more easily in the first stage than in the later stage because of the existence of a large-volume portion of macropores or interaggregate pores, similar to the observations of Burton et al., Liu et al. and Sun et al. [50,51,52].
In this paper, the double-down SWCC was divided into three zones based on the typical “S”-type SWCC (Figure 12). The first is the saturation zone (ψ < ψa). In the drying path, the first zone is the saturation zone controlled by the total porosity of the soil sample. In this zone, the soil sample is completely saturated until the matric suction reaches the air-entry value. At this stage, the saturated water content of the soil sample is controlled by the total porosity of the soil sample; when the matric suction rises exponentially, the volumetric water content changes slightly. The second zone is the transition zone (ψa ≤ ψ < ψi). In the drying path, when the matric suction is on the right of the air-entry value, the water in pores between saturated aggregates or the interaggregate macropores is preferentially drained from the soil sample as the matric suction increases, and due to the large size and volume of the interaggregate pores, when the suction rises exponentially, the water in the macropores decreases relatively fast, and the slope of the SWCC is relatively large. The third zone is the residual zone (ψ ≥ ψi). When the suction exceeds the inflection point of the SWCC, the small pores in the aggregates in the soil sample are in a saturated state. As the suction continues to increase, the water in the aggregates slowly drains out, and under the same matric suction increment, the water loss rate is far lower than that in the intergranular macropores.

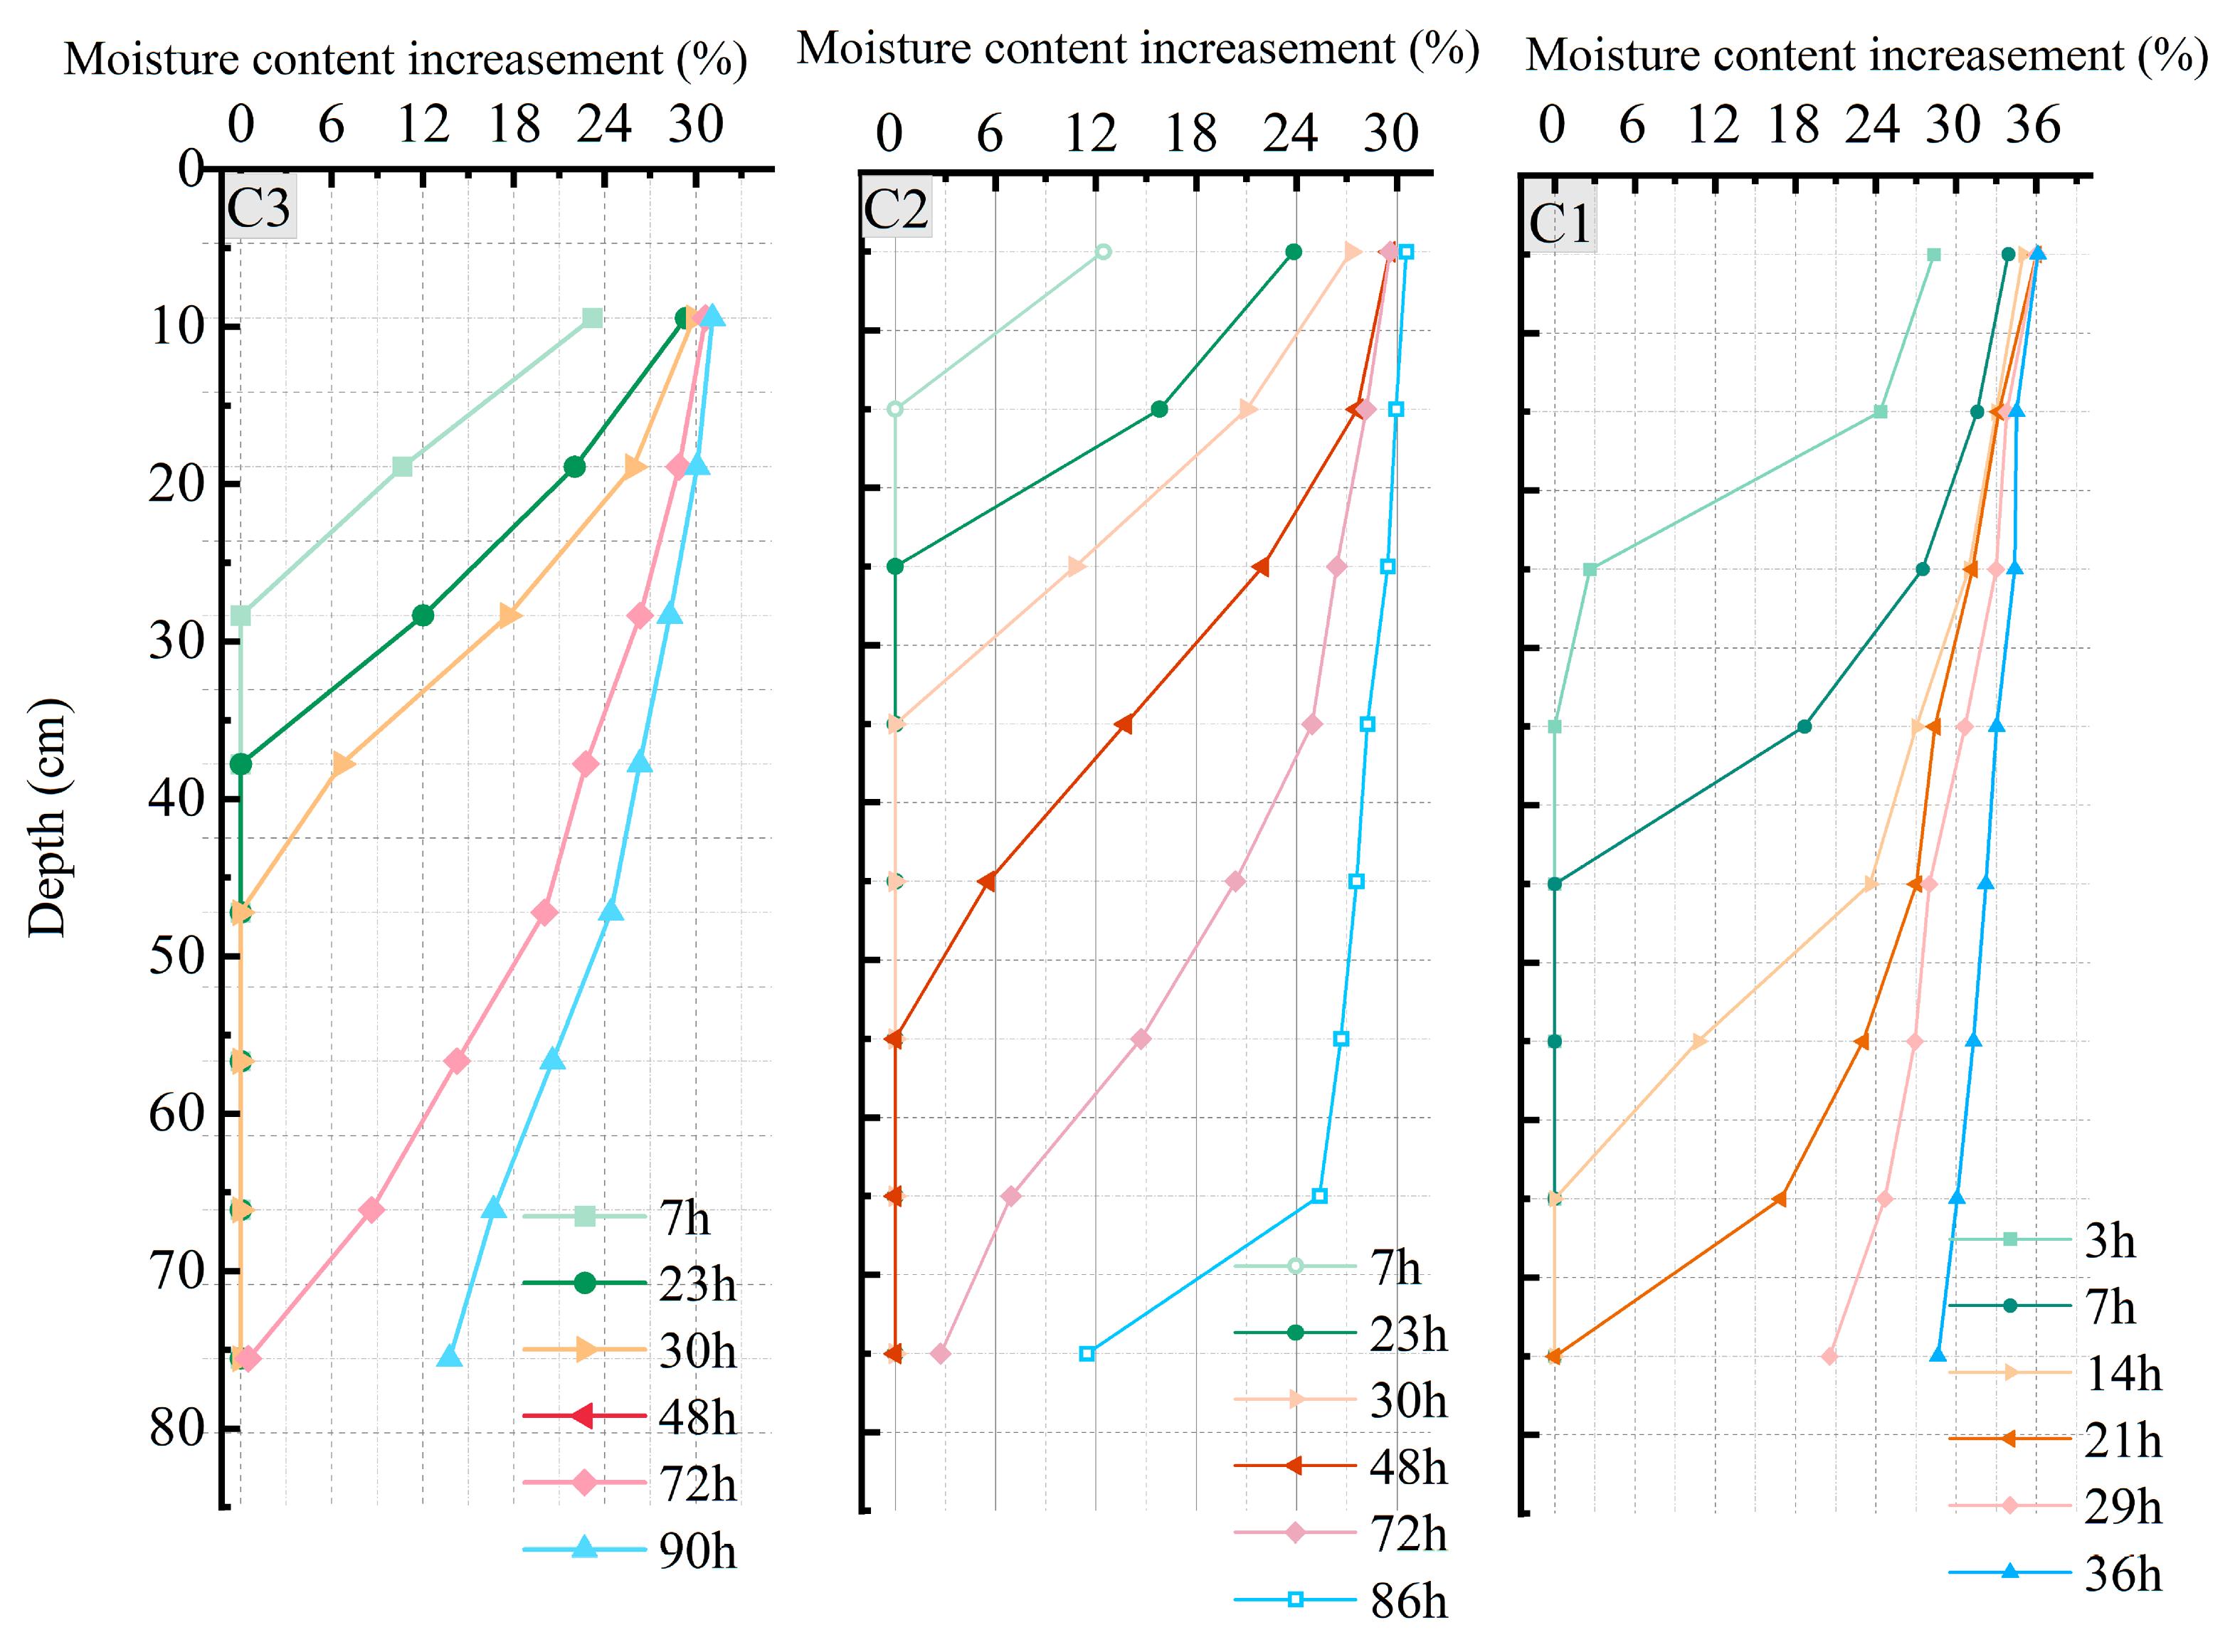
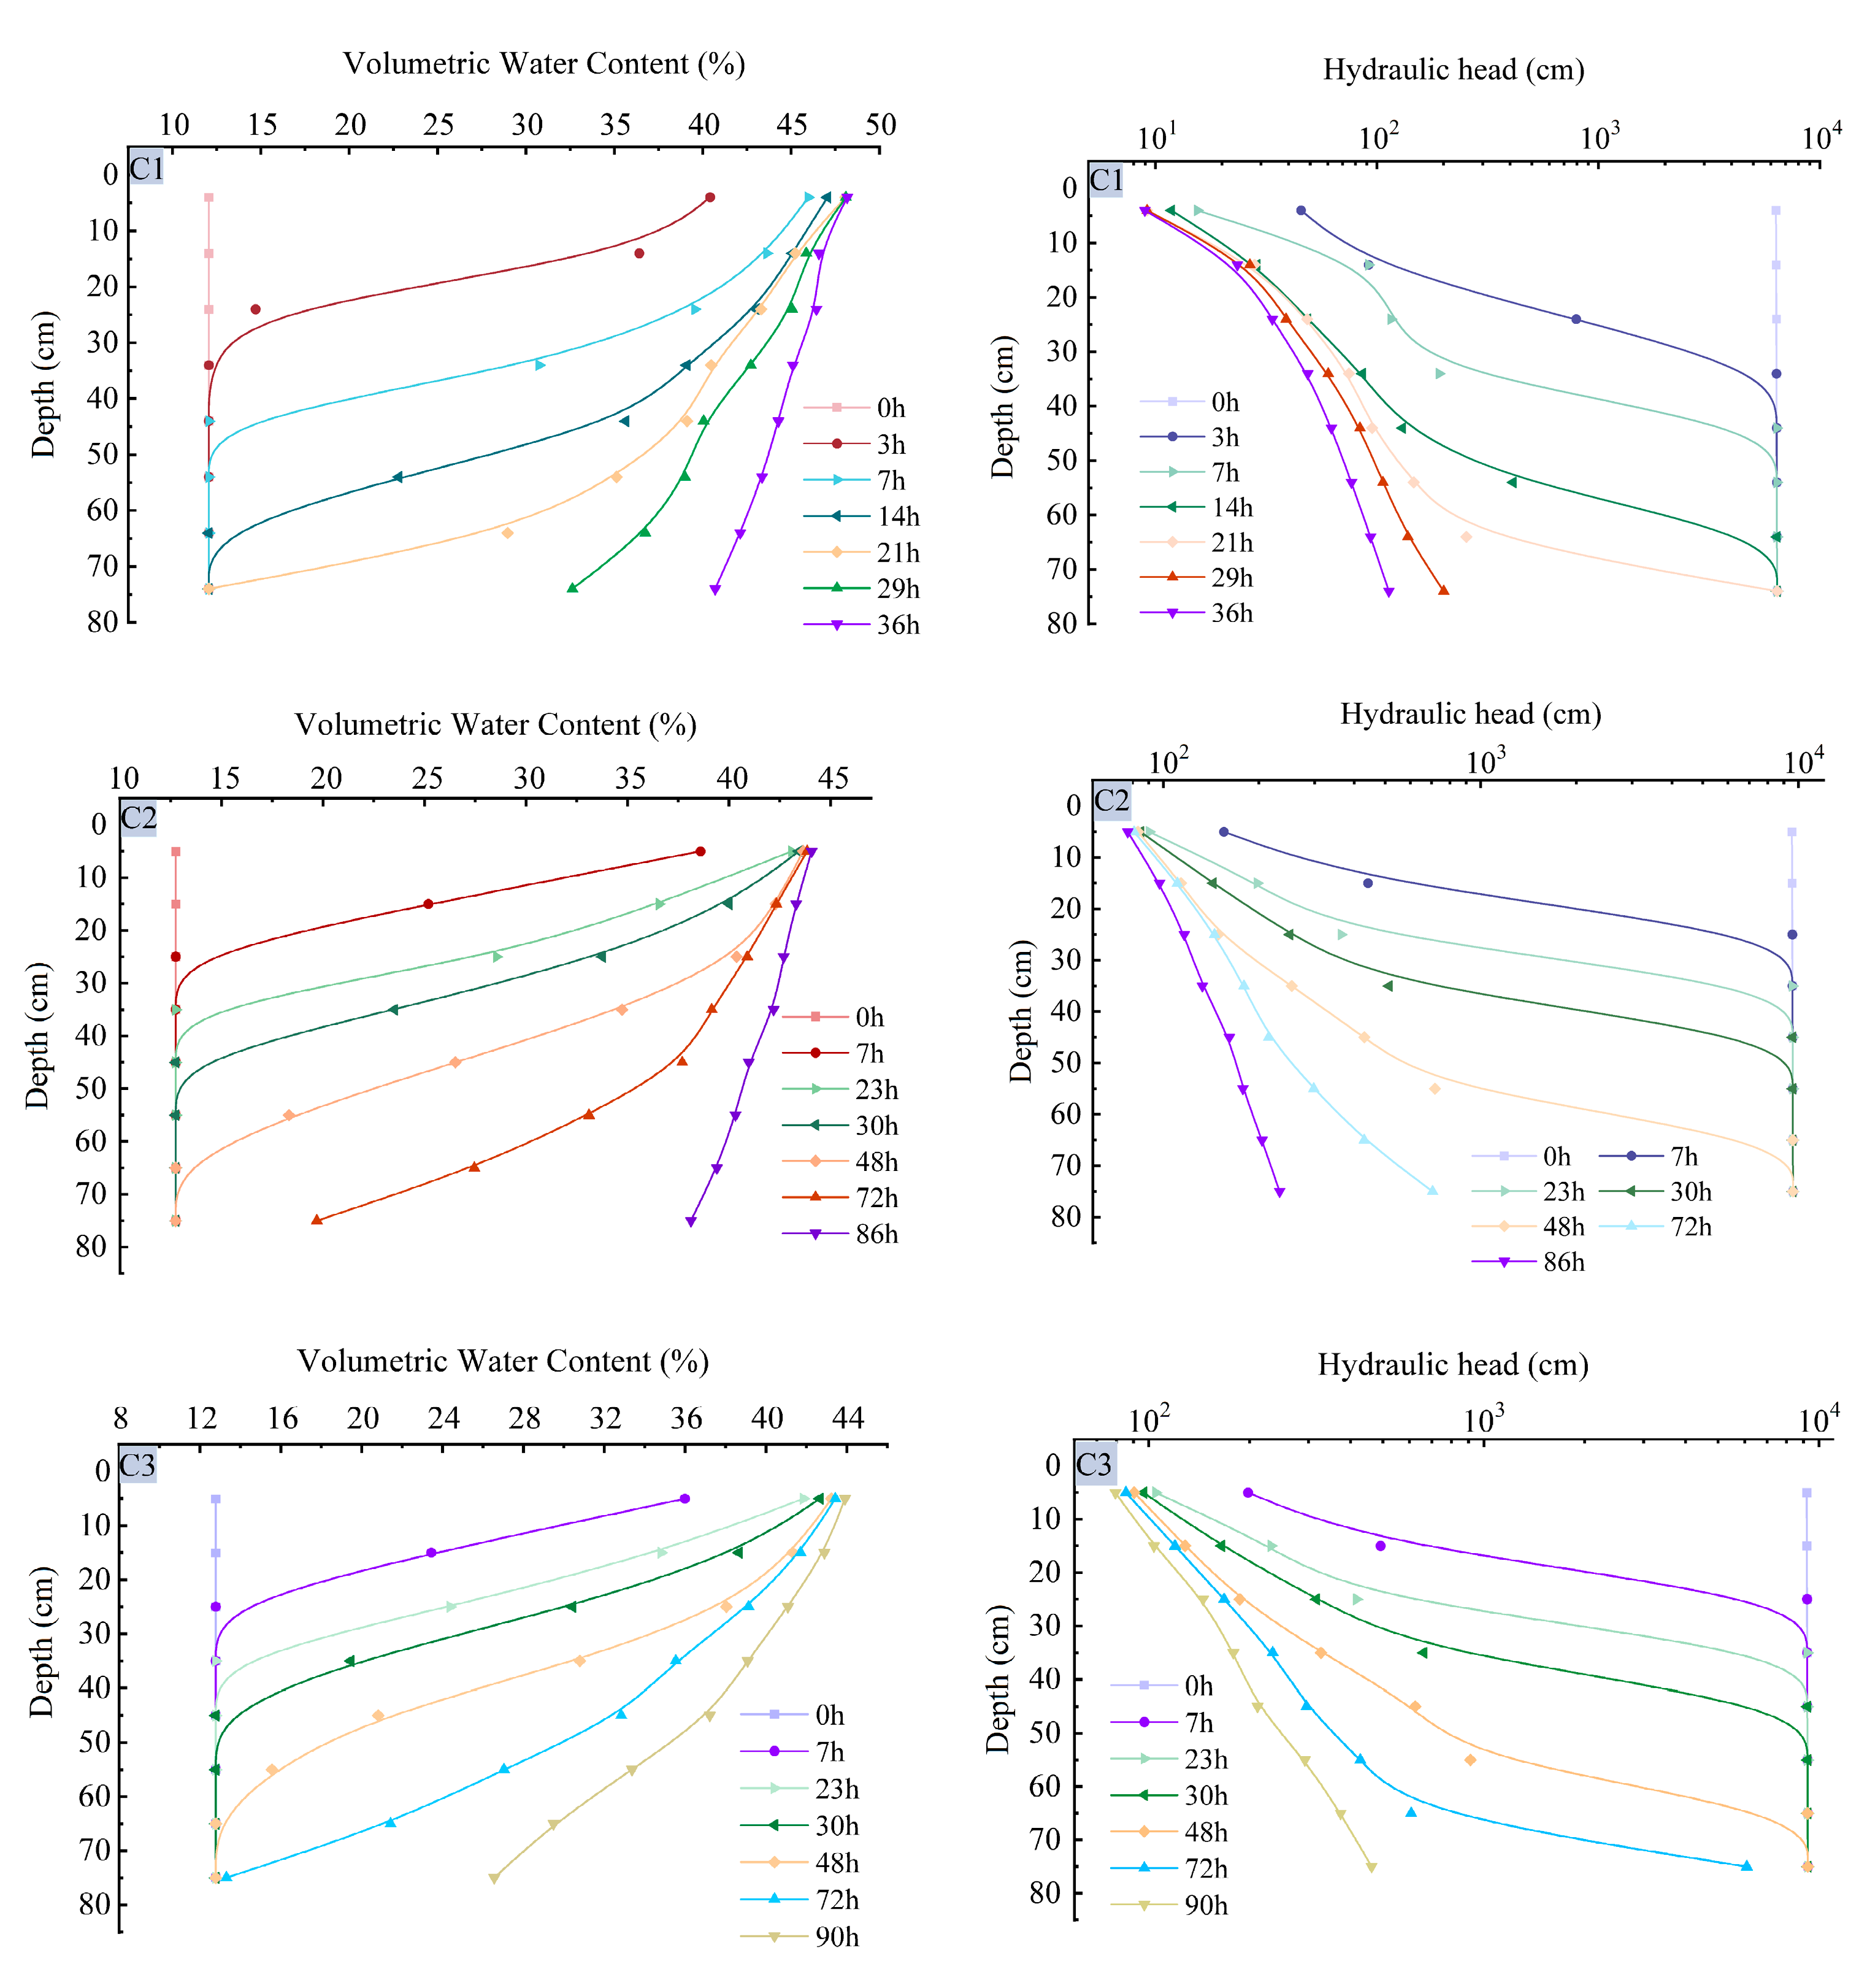
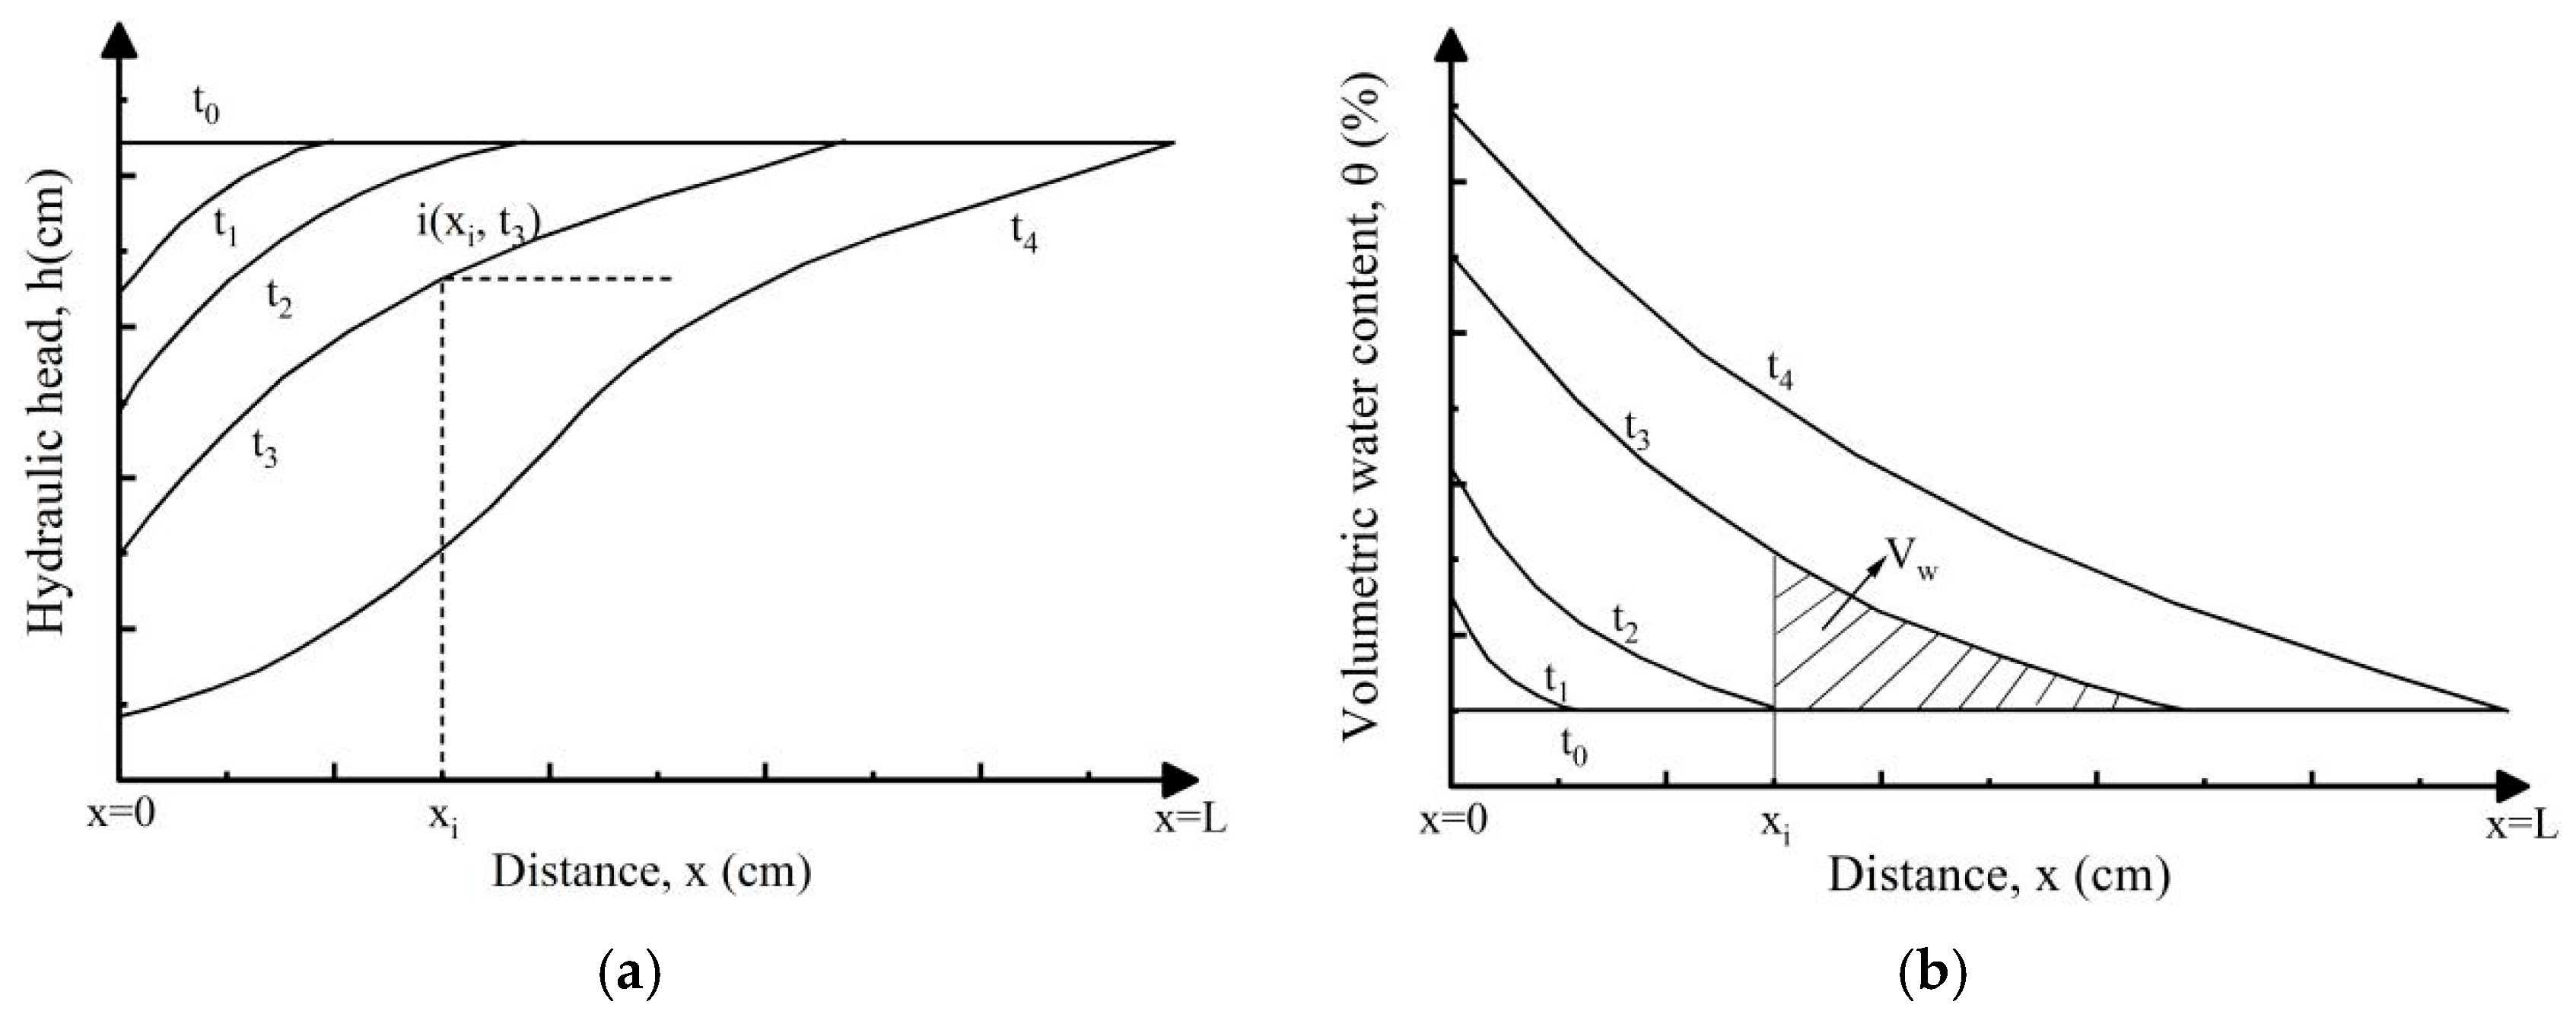
3.6. Soil Column Moisture Profile
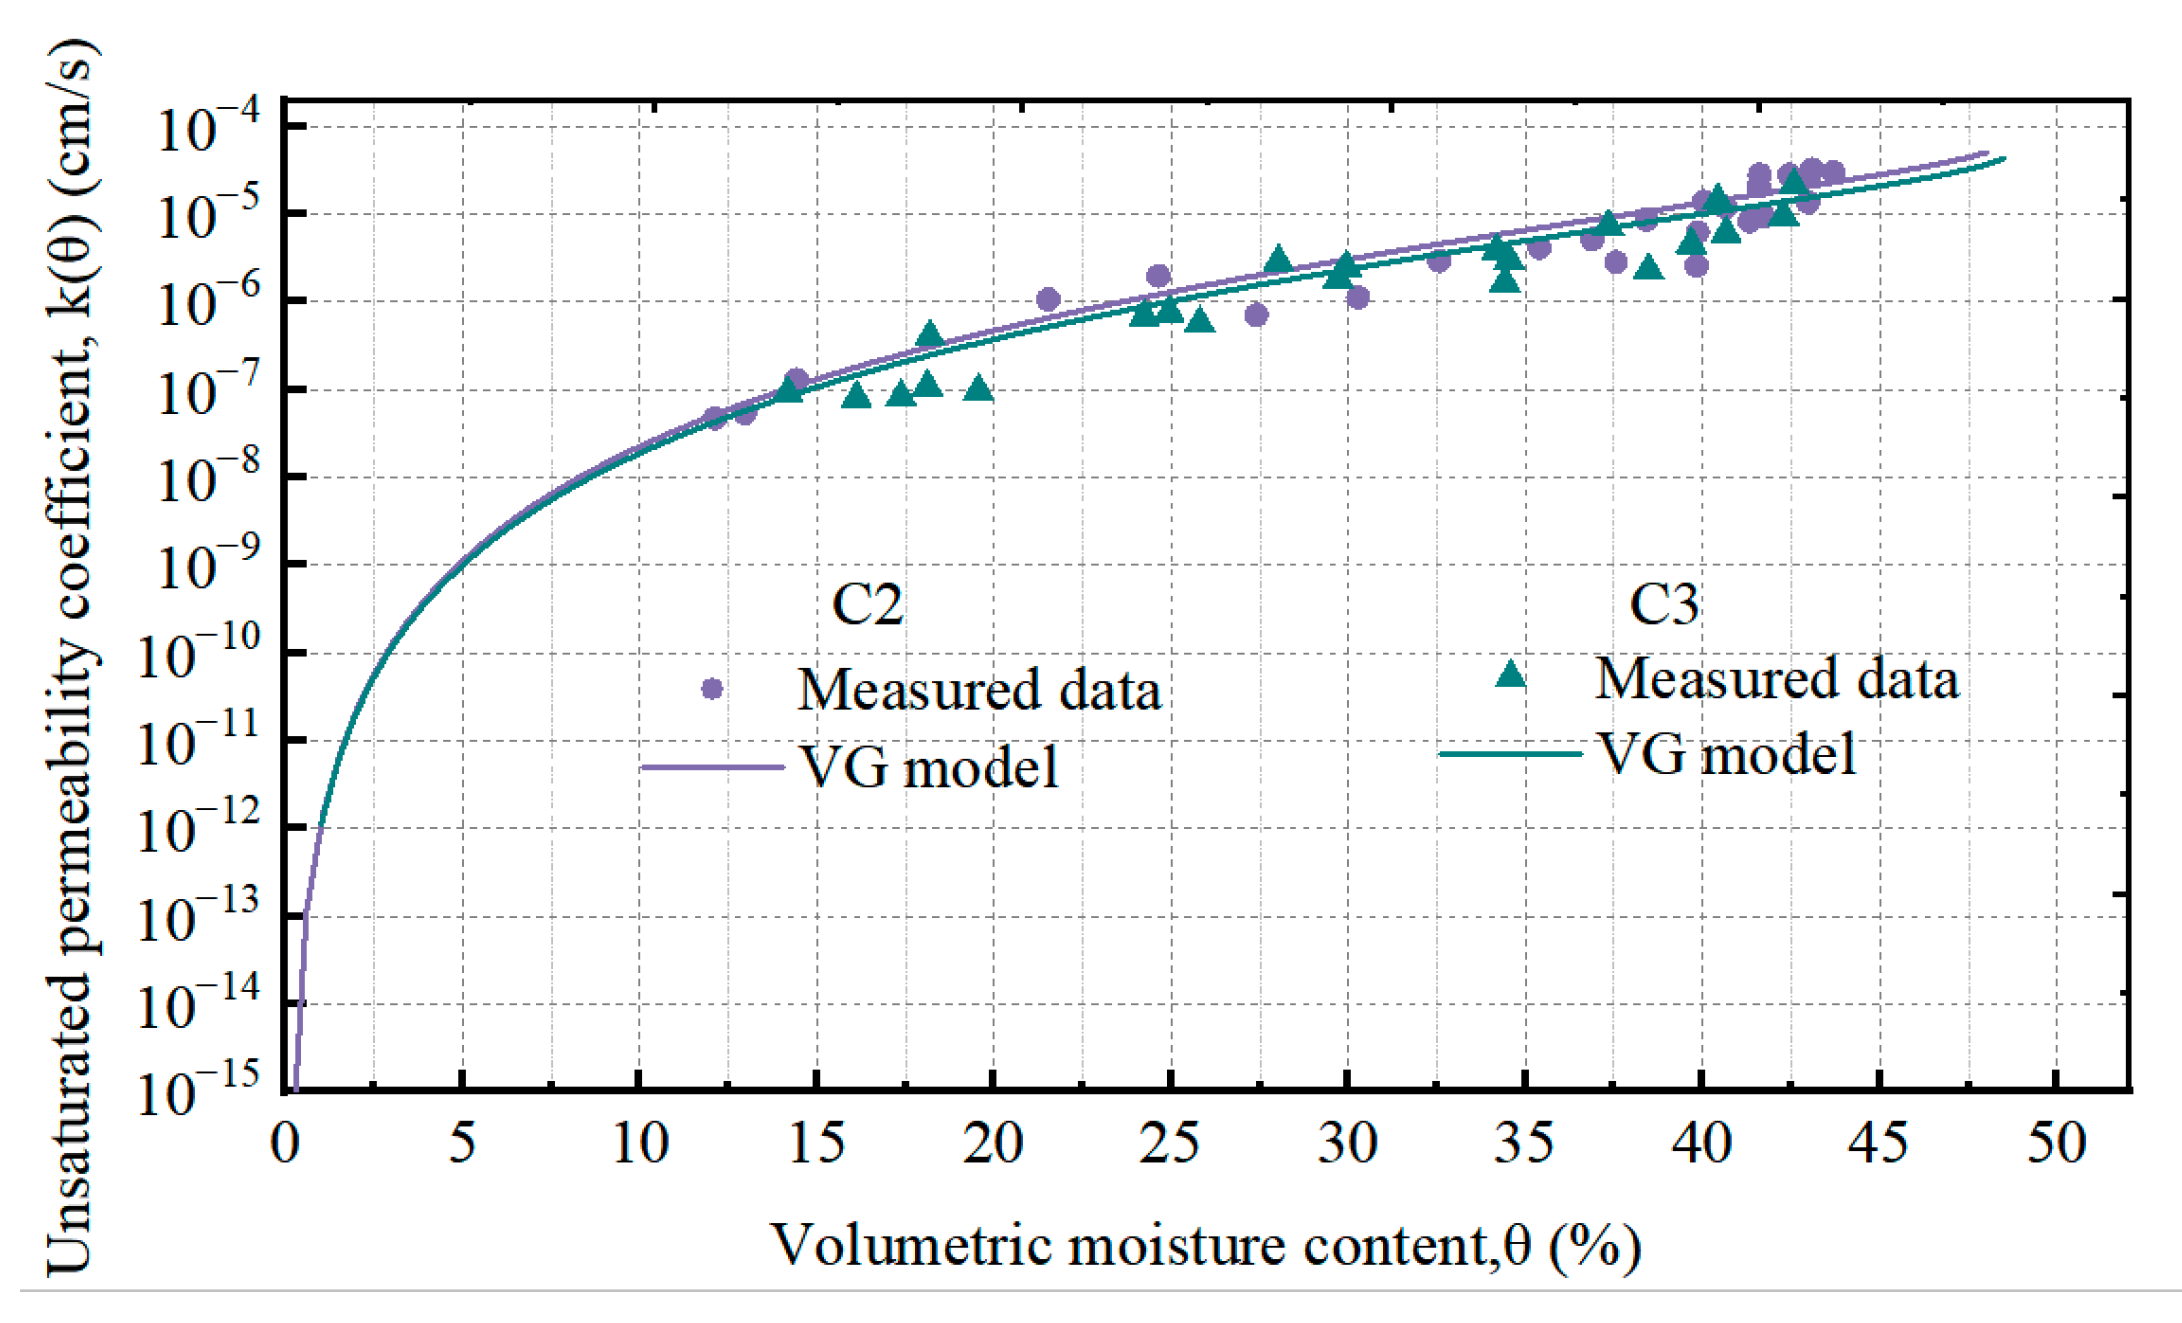
In the transient infiltration test, a series of moisture content and suction measurement points were installed along the soil column from bottom to top to obtain the moisture content and suction distributions of the entire soil main cross-section. This moisture profile can be used to calculate the volume of water from one cross-section to another within a certain period of time. The suction profile can be used to calculate the hydraulic gradient. If only one variable, i.e., the moisture profile or suction profile, is measured, the other variable could be obtained from the SWCC [25]. Figure 13 shows the soil column moisture profile and the total hydraulic head profile versus time. Assuming that the coordinate of the top surface of the soil column is 0 cm, the gravity head is numerically equal to the depth of each cross-section, and the distance between any two test points in this experiment is 10 cm, so the total head profile can be calculated for each moment and position of the soil column by Equation (8). The matric suction at the corresponding moisture content can be calculated based on the SWCC in Figure 12.
The change in the moisture content or matric suction along the vertical direction could be divided into three stages. At the beginning of infiltration, the moisture content near the top increases rapidly, and the matric suction decreases rapidly. With the migration of water, the increase in soil moisture content at the top slows, and the range of the rapid increase in moisture content evolves from gradual to deeper positions until reaching the bottom of the soil column. In the third stage, the wetting front reaches the bottom of the soil column, and the moisture content at each position increases or the decrease rate of matric suction decreases until the moisture content at each position of the soil column tends to reach the same level, and the entire unsaturated infiltration process becomes saturated infiltration, indicating the end of the infiltration test.

3.7. HCF

During transient vertical infiltration, the wetting front continues to move downward under the influence of suction and gravity [25]. Therefore, the total hydraulic head is composed of the gravity head and the pressure head (Figure 14a):
h = h i + z i = u w ρ w g + z i
where h is the total hydraulic head; hi is the pressure head or suction head at point i; zi is the gravity head at point i; uw is the pore water pressure at point i, which is equal to the opposite of the matric suction, and the matric suction can be obtained from the measured volumetric moisture profile and the SWCC; ρw is the density of water, kg/m3; and g is the acceleration of gravity, m/s2.
In the initial stage (t = t0), the initial moisture content of the soil column is θ0, and the corresponding suction head is h0. A steady flow of water is continuously and slowly infiltrated through the upper end of the soil column (x = 0), and the moisture content and suction force on the cross-section of the soil column are constantly changing. When the time reaches ti, the hydraulic gradient i through an arbitrary cross-section xi of the soil column is calculated as:
i x i , t i = d h d z x i , t i
Before the end of the test, at any time in the test, the total volume of water in a certain cross-section of the soil column is calculated as:
V w = A x L θ w x d x
where Vw is the volume of water passing through cross-section xi at any time; θw (x) is a function of the volumetric moisture content in cross-section xi at this moment versus depth; and A is the cross-sectional area of the soil column, where A = 176.7146 cm2. Then, within the time period ∆t from t = j to t = m, the volume change of water passing through position xi is:
V w = A x i L θ t = j x d x A x i L θ t = m x d x = A x i L ( θ t = j x θ t = m x ) d x
θt=j(x) and θt=m(x) are functions of the volumetric moisture content versus depth at t = j and t = m, respectively, and this function can be obtained by piecewise–linear fitting. The product of the area of the shaded portion in Figure 14b and the cross-sectional area A represents the volume of water passing through the cross-section xi during the time period between t0 and t3. Similarly, the graphic area at any position during any time period, that is, the water volume, can be calculated from the moisture profile. For calculation convenience, the curve between any two test points is considered as a straight line segment; that is, every 10 cm is considered a segment. This type of linear distribution is simpler for calculating the change in water volume.
The superficial flow velocity v is equal to the change in water volume between the measurement point and the zero-flow surface, ∆Vw, divided by the product of the cross-sectional area A and the time interval ∆t:
v = V w A t
According to Darcy’s law, the permeability corresponding to the flow rate through a certain cross-section during a certain time period is equal to the ratio of flow velocity and mean hydraulic gradient at that cross-section and during that time period:
k = v i m , a v e
The mean hydraulic gradient im,ave is calculated by the forward difference method:
i x i , a v e = 1 2 ( h x i + 1 , t 1 h x i , t 1 z x i + 1 z x i + h x i + 1 , t 2 h x i , t 2 z x i + 1 z x i )
where hxi+1,t1 and hxi,t1 represent the hydraulic heads at position xi+1 and position xi at time t1, respectively; hxi+1,t2 and hxi,t2 represent the hydraulic heads at position xi+1 and position xi at time t2, respectively; and zxi+1 and zxi are the depths at positions xi+1 and xi, respectively.
The permeabilities under different moisture contents, i.e., unsaturated infiltration curves, are obtained based on Equation (14), and combined with the SWCC, the unsaturated infiltration curve expressed as matric suction–permeability can be obtained. There are many infiltration models for unsaturated soil, and statistical models can indirectly predict the unsaturated permeability based on the SWCC. The most commonly used models are the Gardner model, Van Genuchten (VG) model and Fredlund–Xing (FX) model [53,54,55]. In this study, two permeability models were used to predict the permeability of compacted loess.
Gardner permeability model:
k ψ = k s 1 + a ψ n
van Genuchten substituted Equation (15) into the statistical conductivity model proposed by Burdine and Mualem to obtain the unsaturated permeability model [56,57], which can also be written in the form of effective moisture content Θ:
Θ = θ θ r θ s θ r
k ψ = k s 1 ( a ψ ) n 1 1 + ( a ψ ) n m 2 1 + ( a ψ ) n m / 2
k θ = k s Θ 1 / 2 1 1 Θ 1 / m m 2
where a, n, and m are curve fitting parameters and n = 1/(1 − m).
The vertical patterns volumetric moisture contents of the soil column are different at any time. Repeated calculations are performed according to Equations (8)–(14) to obtain the flow rates at different positions and in different time periods to obtain the HCF. Based on the average volumetric moisture content and average hydraulic gradient in two adjacent cross-sections, as well as the volume change and flow velocity of water for each cross-section during the time period of Δt, a scatterplot of the permeability and volumetric moisture content (or matric suction) was obtained. The complete curve was generated by fitting the data points using the Gardner model and VG model [53,54], and the fitting parameters are shown in Table 6. Figure 15 shows the soil column matric suction–permeability curve, k(ψ), and volumetric moisture content–permeability curve, k(θ).
This test involved a drying process, and the initial mass moisture content of the soil column was approximately 9.20%; therefore, the corresponding permeability when the mass moisture content is less than 9.20% was not obtained in this study. During the wetting process, the moisture content of each soil column increases from the initial value to the saturation moisture content, while the matric suction decreases from the initial value. The permeability curves predicted by the actual data points show that the permeability of the C1 soil column can change by multiple orders of magnitude in the wetting process of the soil column, and the permeability increases in stages with increasing moisture content or decreasing suction force. In the first stage, where the volumetric moisture content changes from 0% to the residual moisture content, the permeability increases rapidly, which is manifested as linear exponential growth of the k(θ) curve. However, this stage was not obtained in this study because the initial moisture content of the soil column was not 0%. In the second stage, from the residual moisture content to the moisture content at air-entry value, the k(θ) curve shows that the permeability increases slowly with increasing moisture content. At this time, the permeability slowly increases with decreasing matric suction, showing straight line segments with a consistent slope in log–log k(ψ). The matric suction decreases from the air-entry value ψa to 0 kPa, and the k(ψ) curve shows that the permeability is basically unchanged with decreasing matric suction. Since the saturation permeability is basically consistent with the stable infiltration rate in Figure 11, this stage is referred to as the saturated infiltration stage. The dual-parameter Gardner model is different from the VG model since it cannot describe three-stage permeability curves. The k(ψ) curve derived by the Gardner model can be divided into a saturated segment with a constant permeability and a straight line segment with a steadily decreasing permeability, which is more suitable for coarse-grained soil.
Figure 16 shows a comparison of the unsaturated permeabilities of the C1 and C2 soil columns, and Figure 17 shows a comparison of the unsaturated permeabilities of the C2 and C3 soil columns. The permeabilities of the soil columns with different initial dry densities differed. For all soil moisture contents, the permeability of the soil column with a low initial dry density is greater than that of the soil column with a high initial density, which is consistent with the pattern of the saturated permeability. The unsaturated permeabilities of C1 and C2 soil columns exhibited differences of several orders of magnitude, i.e., when the soil water content is high, the difference in the permeabilities of soil columns of different densities is small; when the moisture content is low, the difference between the two is large. On the other hand, the unsaturated permeabilities of C2 and C3 soil columns are basically the same. These results suggest that in this study, the unsaturated permeability is not strongly sensitive to the presence of runoff and rather is related to the properties of the soil column, such as dry density, moisture content, soil quality and external temperature. That is, the HCF calculated from the volumetric moisture content is more sensitive to changes in dry density than to changes in runoff or hydraulic head height.

4. Conclusions

This study used a homemade rainfall infiltration device to conduct a 1D vertical soil column infiltration test, investigated the infiltration process of soil columns with different densities with or without runoff, assessed the relationships between the advancing displacement and rate of the wetting front and time, studied the unsaturated infiltration characteristics, such as soil column infiltration, infiltration rate and moisture content change, and discussed the relationship between the permeability and the moisture content or the matric suction. The results show the following:
Pore size distributions in this study exhibited bimodal distributions. The samples compacted at a low water content exhibited a double porous structure with two classes of predominant pores. Correspondingly, the compacted soils were observed to lose water in two clear stages during drying. Thus, the drying process corresponded to a double S-shaped SWCC. Water was lost more easily in the first stage than in the later stage because of the existence of a large volume portion of macropores or interaggregate pores. In the soil column vertical infiltration test, the relation between cumulative infiltration and time, as well as wetting front displacement and time, obeys the power function relationship as Q(t) = atn and D(t) = atn + b, respectively. In the initial stage, the soil column is relatively dry unsaturated soil, all the rainfall infiltrates into the soil, and at this time, the infiltration rate is theoretically equal to the rainfall intensity, called the rainfall intensity control stage. The time point of water drainage at the bottom of the soil column is used as the endpoint of the second stage. As infiltration progresses, the pores in the upper soil layer are gradually filled with water, the infiltration capacity decreases, and the soil infiltration capacity control stage starts. In this stage, infiltration rate of the soil column is mainly determined by the properties of the soil. Once water begins to drain at the bottom of the soil column, the third stage starts. When the entire soil column is saturated, the infiltration rate almost no longer changes, and the infiltration rate is equal to the saturation permeability. The hydraulic conductivity function for soil from permafrost regions is highly coincident with the van Genuchten model. The permeability of the soil column can change by multiple orders of magnitude, from 10−4 to 10−6 when soil moisture decreases from 50% to 20%, during the wetting process. For all moisture contents, the initial unsaturated permeability is not strongly sensitive to the presence of runoff but is related to the properties of the soil column, such as dry density, moisture content, soil quality, and external temperature. That is, the HCF calculated from the volumetric moisture content is more sensitive to changes in dry density than to changes in runoff or hydraulic head height.
In the future, the hydraulic conductivity function in this study can be used to perform seepage simulation and stability analysis in unsaturated soil slopes induced by rainfall infiltration. In addition, this work is significant in furthering understanding of the hydrological mechanisms of slope failure in permafrost regions.

Author Contributions

Conceptualization, L.L.; Software, C.Y.; Validation, X.L. and Y.H.; Formal analysis, Y.H.; Investigation, L.L. and L.W.; Resources, C.L.; Data curation, Y.L. (Yong Li); Writing—original draft, L.L.; Writing—review & editing, L.L.; Visualization, Y.L. (Yonghong Li); Supervision, X.L. and Y.L. (Yonghong Li); Project administration, Y.L. (Yonghong Li); Funding acquisition, L.L. All authors have read and agreed to the published version of the manuscript.

Funding

This research was financially supported by the National Natural Science Foundation of China (Grant No. 42201011, 41877225, 42230712) and the Young Talent Fund of Association for Science and Technology in Shanxi (Grant No. CLGC20225).

Data Availability Statement

The raw data supporting the conclusions of this article will be made available by the authors on request.

Conflicts of Interest

The authors declare no conflicts of interest.

References

  1. Chen, C.Y.; Chen, H.W.; Wu, W.C. Numerical modeling of interactions of rainfall and earthquakes on slope stability analysis. Environ. Earth Sci. 2021, 80, 524. [Google Scholar] [CrossRef]
  2. Chen, L.; Voss, C.I.; Fortier, D.; McKenzie, J.M. Surface energy balance of sub-Arctic roads with varying snow regimes and properties in permafrost regions. Permafr. Periglac. Process. 2021, 32, 681–701. [Google Scholar] [CrossRef]
  3. Vonk, J.E.; Tank, S.E.; Bowden, W.B.; Laurion, I.; Vincent, W.F.; Alekseychik, P.; Amyot, M.; Billet, M.F.; Canario, J.; Cory, R.M.; et al. Reviews and syntheses: Effects of permafrost thaw on Arctic aquatic ecosystems. Biogeosciences 2015, 12, 7129–7167. [Google Scholar] [CrossRef]
  4. Lin, H.Z.; Yu, Y.Z.; Li, G.X.; Peng, J.B. Influence of rainfall characteristics on soil slope failure. Yanshilixue Yu Gongcheng Xuebao/Chin. J. Rock. Mech. Eng. 2009, 28, 198–204. (In Chinese) [Google Scholar]
  5. Bujang, J.S.; Zakaria, M.H.; Arshad, A.B. Distribution and significance of seagrass ecosystems in Malaysia. Aquat. Ecosyst. Health Manag. 2006, 9, 203–214. [Google Scholar] [CrossRef]
  6. Gofar, N.; Lee, L.M.; Kassim, A. Instrumented soil column model for rainfall infiltration study. In Proceedings of the International Conference of Geotechnical & Highway Engineering, Kuala Lumpur, Malaysia, 26–27 May 2008. [Google Scholar]
  7. Shaw-Shong, L. Slope failures in tropical residual soil. In Tropical Residual Soils Engineering; Huat, B.B.K., Sew, G.S., Ali, F.H.J., Eds.; Balkema: Leiden, The Netherlands, 2004; pp. 71–102. [Google Scholar]
  8. Srivastava, R.; Yeh, J.T.-C. Analytical solutions for one-dimensional, transient infiltration toward the water table in homogeneous and layered soils. Water Resour. Res. 1991, 27, 753–762. [Google Scholar] [CrossRef]
  9. Leconte, R.; Brissette, F.P. Soil moisture profile model for two-layered soil based on sharp wetting front approach. J. Hydrol. Eng. 2001, 6, 141–149. [Google Scholar] [CrossRef]
  10. Huat, B.B.K.; Ali, F.H.; Low, T.H. Water infiltration characteristics of unsaturated soil slope and its effect on suction and stability. Geotech. Geol. Eng. 2006, 24, 1293–1306. [Google Scholar] [CrossRef]
  11. Guo, X.L.; Huang, K.; Li, J.; Kuang, Y.; Chen, Y.; Jiang, C.; Luo, M.; Zhou, H. Rainfall–runoff process simulation in the karst spring basins using a sac–tank model. J. Hydrol. Eng. 2023, 9, 28. [Google Scholar] [CrossRef]
  12. Zhao, S.Y.; Zheng, Y.R.; Shi, W.M.; Wang, J.L. Analysis on safety factor of slope by strength reduction FEM. Chin. J. Geotech. Eng. 2002, 24, 343–346. [Google Scholar]
  13. Zheng, Y.R. Development and application of numerical limit analysis for geological mater. Chin. J. Rock. Mech. Eng. 2012, 31, 1297–1316. [Google Scholar]
  14. Xu, B.N.; Pei, X.; Li, J.-J.; Yang, H.; Wang, X. Exploring the stability of unsaturated soil slope under rainfall infiltration conditions: A study based on multivariate interrelated random fields using R-vine copula. Catena 2024, 234, 107587. [Google Scholar] [CrossRef]
  15. Fred, T.; Vahedifard, F. Analytical solution for coupled hydro-mechanical modeling of infiltration in unsaturated soils. J. Hydrol. 2022, 612, 128198. [Google Scholar]
  16. Yang, H.; Rahardjo, H.; Leong, E.C. Behavior of Unsaturated Layered Soil Columns during Infiltration. J. Hydrol. Eng. 2006, 11, 329–337. [Google Scholar] [CrossRef]
  17. Ibrahim, A.; Mukhlisin, M.; Jaafar, O. Effect of rainfall infiltration into unsaturated soil using soil column. AIP Conf. Proc. 2018, 1930, 020022. [Google Scholar]
  18. Zhang, L.; Jiang, X.; Sun, R.; Gu, H.; Fu, Y.; Qiu, Y. Stability analysis of unsaturated soil slopes with cracks under rainfall infiltration conditions. Comput. Geotech. 2024, 165, 105907. [Google Scholar] [CrossRef]
  19. Mohd, A.M.I.; Nur, H.H.; Ng Soon, M.; Mohd, H.Z.A.; Saiful Azhar Ahmad, T.; Aziman, M. Analysis of infiltration-suction response in unsaturated residual soil slope in Gelugor, Penang. J. Phys. Conf. Ser. 2018, 995, 012052. [Google Scholar]
  20. Serrano, S.E. Stochastic differential equation models of erratic infiltration. Water Resour. Res. 1990, 264, 703–711. [Google Scholar] [CrossRef]
  21. Kargas, G.; Kerkides, P. A Contribution to the Study of the Phenomenon of Horizontal Infiltration. Water Resour. Manag. 2011, 25, 1131–1141. [Google Scholar] [CrossRef]
  22. Fredlund, D.G.; Morgenstern, N.R. Stress state variables for unsaturated soils. J. Geotech. Eng. Div. 1977, 103, 447–466. [Google Scholar] [CrossRef]
  23. Fredlund, D.G.; Rahardjo, H. Soil mechanics principles for highway engineering in Arid regions. In Soil Mechanics Considerations: Arid and Semiarid Areas; Transportation Research Record: Washington, DC, USA, 1987; Volume 1137, pp. 1–11. [Google Scholar]
  24. Meyer, M.P.; Knight, S.J. Trafficability of Soils: Soil Classification; University of Illinois: Urbana, IL, USA, 1961. [Google Scholar]
  25. Lu, N.; Likos, W.J. Unsaturated Soil Mechanics; John Wiley & Sons: Hoboken, NJ, USA, 2004. [Google Scholar]
  26. Kim, H.; Ganju, E.; Tang, D.; Prezzi, M.; Salgado, R. Matric suction measurements of compacted subgrade soils. Road Mater. Pavement Des. 2015, 16, 358–378. [Google Scholar] [CrossRef]
  27. Likos, W.J.; Lu, N. Filter paper column for measuring transient suction profiles in expansive clay. Transp. Res. Rec. J. Transp. Res. Board 2023, 1821, 83–89. [Google Scholar] [CrossRef]
  28. Li, L.C.; Li, X.A.; Wang, L.; Hong, B.; Shi, J.; Sun, J. The effects of soil shrinkage during centrifuge tests on SWCC and soil microstructure measurements. Bull. Eng. Geol. Environ. 2020, 79, 3879–3895. [Google Scholar] [CrossRef]
  29. Li, L.C.; Li, X.A.; Lei, H.N.; Hong, B.; Wang, L.; Zheng, H. On the characterization of the shrinkage behavior and soil-water retention curves of four soils using centrifugation and their relation to the soil structure. Arab. J. Geosci. 2020, 13, 1259. [Google Scholar] [CrossRef]
  30. Xie, X.; Li, P.; Hou, X.; Li, T.; Zhang, G. Microstructure of Compacted Loess and Its Influence on the Soil-Water Characteristic Curve. Adv. Mater. Sci. Eng. 2020, 1, 3402607. [Google Scholar] [CrossRef]
  31. Hou, X.K.; Qi, S.W.; Li, T.; Guo, S.; Wang, Y.; Li, Y.; Zhang, L. Microstructure and soil-water retention behavior of compacted and intact silt loess. Eng. Geol. 2020, 277, 105814. [Google Scholar] [CrossRef]
  32. Birle, E.; Heyer, D.; Vogt, N. Influence of the initial water content and dry density on the soil–water retention curve and the shrinkage behavior of a compacted clay. Acta Geotech. 2008, 3, 191–200. [Google Scholar] [CrossRef]
  33. Bulut, R.; Lytton, R.; Wray, W. Soil suction measurements by filter paper. In Proceedings of the Geo-Institute Shallow Foundation and Soil Properties Committee Sessions at the ASCE 2001 Civil Engineering Conference, Houston, TX, USA, 10–13 October 2001; pp. 243–261. [Google Scholar]
  34. Li, H.; Li, T.L.; Jiang, R.J.; Fan, J.W. Measurement of unsaturated permeability curve based on filter paper method. Rock Soil Mech. 2020, 41, 1–10. [Google Scholar]
  35. Chandler, R.; Gutierrez, C. The filter-paper method for suction measurement. Geotechnique 1986, 36, 265–268. [Google Scholar] [CrossRef]
  36. Crilly, M.; Chandler, R. A Method for Determining the State of Desiccation in Clay Soils; Building Research Establishment: Garston, UK, 1993. [Google Scholar]
  37. An, P.; Zhang, A.J.; Liu, H.T.; Wang, T. Degradation mechanism of long-term seepage and permeability analysis of remolded saturated loess. Rock Mech. 2013, 34, 147–153. [Google Scholar]
  38. Green, W.H.; Ampt, G.A. Studies on soil physics I. The flow of air and water through soils. J. Agric. Sci. 1911, 4, 1–24. [Google Scholar]
  39. Kostiakov, A.N. On the dynamics of the coefficient of water-percolation in soils and on the necessity of studying it from a dynamic point of view for purposes of amelioration. Trans. 6th Comm. Int. Soc. Soil Sci. Russ. 1932, A, 17–21. [Google Scholar]
  40. Horton, R.E. An Approach Toward a Physical Interpretation of Infiltration-Capacity. Soil Sci. Soc. Am. J. 1941, 5, 399–417. [Google Scholar] [CrossRef]
  41. Philip, J.R. Theory of Infiltration. Adv. Hydrosci. 1969, 5, 215–296. [Google Scholar]
  42. Wang, X.J. The Water Potential Description, Theoretical Models Study of Rainfall Infiltration and Application. Ph.D. Thesis, Tsinghua University, Beijing, China, 2010; pp. 90–91. [Google Scholar]
  43. Romero, E.; Gens, A.; Lloret, A. Water permeability, water retention and microstructure of unsaturated compacted Boom clay. Eng. Geol. 1999, 54, 117–127. [Google Scholar] [CrossRef]
  44. Simms, P.H.; Yanful, E.K. Measurement and estimation of pore shrinkage and pore distribution in a clayey till during soil-water characteristic curve tests. Can. Geotech. J. 2001, 38, 741–754. [Google Scholar] [CrossRef]
  45. Aung, K.K.; Rahardjo, H.; Leong, E.C.; Toll, D.G. Relationship between porosimetry measurement and soil-Water characteristic curve for an unsaturated residual soil. Geotech. Geol. Eng. 2001, 19, 401–416. [Google Scholar] [CrossRef]
  46. Zhang, L.M.; Li, X. Micro Porosity Structure of Coarse Granular Soils. J. Geotech. Geoenvironmental Eng. 2010, 136, 1425–1436. [Google Scholar] [CrossRef]
  47. Mascarenha, M.; Cordão-Neto, M.P.; Romero, E. Influence of the Microstructure on the Hydro-Mechanical Behaviour of a Natural Silty Clay; Taylor & Francis: Abingdon, UK, 2011. [Google Scholar]
  48. Washburn, W.E. Note on a Method of Determining the Distribution of Pore Sizes in a Porous Material. Proc. Natl. Acad. Sci. USA 1921, 7, 115–116. [Google Scholar] [CrossRef]
  49. Cai, G.; Zhou, A.; Liu, Y.; Xu, R.; Zhao, C. Soil water retention behavior and microstructure evolution of lateritic soil in the suction range of 0-286.7 MPa. Acta Geotech. 2020, 15, 3327–3341. [Google Scholar] [CrossRef]
  50. Burton, G.; Pineda, J.A.; Sheng, D.C.; Airey, D.W. Microstructural changes of an undisturbed, reconstituted and compacted high plasticity clay subjected to wetting and drying. Eng. Geol. 2015, 193, 363–373. [Google Scholar] [CrossRef]
  51. Liu, X.; Buzzi, O.; Yuan, S.Y.; Mendes, J.; Fityus, S. Multi-scale characterization of the retention and shrinkage behaviour of four Australian clayey soils. Can. Geotech. J. 2015, 53, 854–870. [Google Scholar] [CrossRef]
  52. Sun, D.A.; Gao, Y.; Zhou, A.N.; Sheng, D.C. Soil–water retention curves and microstructures of undisturbed and compacted Guilin lateritic clay. Bull. Eng. Geol. Environ. 2016, 75, 781–791. [Google Scholar] [CrossRef]
  53. Gardner, W.R. Some Steady-State Solutions of the Unsaturated Moisture Flow Equation with Application to Evaporation from a Water Table. Soil Sci. 1958, 85, 228–232. [Google Scholar] [CrossRef]
  54. Van Genuchten, M.T. A closed-form equation for predicting the hydraulic conductivity of unsaturated soils. Soil Sci. Soc. Am. J. 1980, 44, 892–898. [Google Scholar] [CrossRef]
  55. Fredlund, D.G.; Xing, A. Equations for the soil-water characteristic curve. Can. Geotech. J. 1994, 31, 1023–1025. [Google Scholar] [CrossRef]
  56. Burdine, N.T. Relative Permeability Calculations From Pore Size Distribution Data. Petr. Trans. Am Inst. Min. Metall. Eng. 1953, 98, 71–78. [Google Scholar] [CrossRef]
  57. Mualem, Y. A new model for predicting the hydraulic conductivity of unsaturated porous media. Water Resour. Res. 1976, 12, 513–522. [Google Scholar] [CrossRef]
Figure 1. Particle distribution curves of the test materials (a) and their XRD results (b).
Applsci 14 10195 g001
Figure 2. Schematic diagram of the infiltration column apparatus.
Applsci 14 10195 g002
Figure 3. Sample preparation for the filter paper test. (a) Whatman Quantitative Filter Papers, (b) component of specimen, (c) Sealed with waterproof tape, (d) sealed with plastic wrap, (e) Sealed with tinfoil, (f) Sealed with paraffin, (g) Numbered sample after completely sealed.
Applsci 14 10195 g003
Figure 4. Relationship curve of ks vs. time. (a) data for CH soil, (b) data for QY soil, (c) data for YA soil, (d) data for LL soil.
Applsci 14 10195 g004
Figure 5. Relationship between the saturated permeability and dry density.
Applsci 14 10195 g005
Figure 6. Wetting front displacement of the soil column.
Applsci 14 10195 g006
Figure 7. Advancing rate of the wetting front of the soil column.
Applsci 14 10195 g007
Figure 8. Moisture content increment in the soil column section.
Applsci 14 10195 g008
Figure 9. Cumulative infiltration of the soil column.
Applsci 14 10195 g009
Figure 10. Instantaneous infiltration rate.
Applsci 14 10195 g010
Figure 11. Average infiltration rate at the upper surface of the soil column.
Applsci 14 10195 g011
Figure 12. SWCC and PSD of the compacted soil sample.
Applsci 14 10195 g012
Figure 13. Volumetric moisture profile and total hydraulic head profile of the soil column.
Applsci 14 10195 g013
Figure 14. Distributions of the hydraulic head (a) and moisture content (b) according to the instantaneous profile method.
Applsci 14 10195 g014
Figure 15. Unsaturated permeability of the soil column.
Applsci 14 10195 g015
Figure 16. Unsaturated permeability of the C1 and C2 soil columns.
Applsci 14 10195 g016
Figure 17. Unsaturated permeability of the C2 and C3 soil columns.
Applsci 14 10195 g017
Table 1. Physical indicators.
Soil Particle Composition/ParameterClassification CriteriaPercent (%)
USDACHQYYALL
Gritd ≥ 2 mm0.000.000.000.00
Sand2 > d ≥ 0.05 mm5.629.7928.9730.30
Silt0.05 > d ≥ 0.002 mm77.0870.2065.5962.90
Clayd < 0.002 mm17.3010.015.446.80
Soil particle compositionUSCS classificationCHQYYALL
Gritd ≥ 4.75 mm0.000.000.000.00
Sand4.75 > d ≥ 0.075 mm0.293.308.699.77
Silt0.075 > d ≥ 0.005 mm73.9280.8782.5280.06
Clayd < 0.005 mm25.7915.838.7910.17
Cu—Unevenness coefficient42.9514.276.288.48
Cc—Coefficient of curvature6.1516.951.561.66
Optimal moisture content (%)17.3416.9115.6815.80
Maximum dry density (g/cm3)1.711.731.761.77
Liquid limit (%)35.1232.2331.3327.60
Plastic limit (%)19.9618.2918.3317.05
Plastic index15.1613.9413.0010.55
Table 2. Chemical composition of the test materials.
Oxide Mass Wt (%)SiO2A12O3CaOFe2O3MgOK2ONa2OTiO2P2O5MnO
XRF resultsCH56.8515.1513.515.443.512.881.260.760.200.11
QY59.7214.5011.774.683.512.701.790.710.210.10
YA59.4714.7211.825.073.212.791.590.720.200.10
LL58.4114.9013.325.653.192.811.650.710.220.11
Element Content (%)SiCaA1FeKMgNaTiPxSum
Normalized mass percent (%)CH51.9513.5315.577.144.674.012.080.840.21100%
QY51.3315.4214.136.924.503.693.080.770.17100%
YA51.9315.7914.556.633.622.204.320.800.15100%
LL50.5215.1515.346.953.423.663.950.800.22100%
Table 3. Design of the saturated infiltration experiments.
SamplesDensity (g/cm3)
CH soil1.451.521.601.67
QY soil1.451.571.631.72
YA soil1.311.391.471.501.551.601.70
LL soil1.451.501.571.65
Table 4. Designed unsaturated infiltration experiments.
Column
Number
Dry DensityInitial Moisture ContentRunoffHydraulic Head DifferenceWater Supply RateRainfall Intensity
C11.31 g/cm39.19%None822 mm/minHeavy rain
C21.39 g/cm39.17%None822 mm/minHeavy rain
C31.39 g/cm39.17%Yes822 mm/minHeavy rain
Table 5. Fitting parameters of the infiltration rate.
Soil Column No.Kostiakov ModelR2Philip ModelR2
Instantaneous infiltration rateC1I(t) = 0.00495t−0.505780.9545I(t) = 6 × 10⁻⁴ + 0.0036t−0.50.8721
C2I(t) = 1.08 × 10⁻⁴t−0.05960.9576I(t) = 5 × 10⁻⁴ + 0.00068t−0.50.9623
C3I(t) = 1.70 × 10⁻⁴t−0.15320.9831I(t) = 4.5 × 10⁻⁴ + 0.00040t−0.50.9473
Table 6. Model parameters.
Parameters ModelGardnerVG
naR2naR2
k(ψ)C11.383770.547470.75361.642340.090350.8463
C23.188360.139330.813792.589660.065780.8167
C32.635630.14570.76981.506460.021090.7378
k(θ)C1 2.32000 0.8791
C2 2.11924 0.7871
C3 2.16766 0.7714
Disclaimer/Publisher’s Note: The statements, opinions and data contained in all publications are solely those of the individual author(s) and contributor(s) and not of MDPI and/or the editor(s). MDPI and/or the editor(s) disclaim responsibility for any injury to people or property resulting from any ideas, methods, instructions or products referred to in the content.

