Article

A Multiclassification Model for Skin Diseases Using Dermatoscopy Images with Inception-v2

College of Medical Technology and Engineering, Henan University of Science and Technology, Luoyang 471023, China
*
Author to whom correspondence should be addressed.
Appl. Sci. 2024, 14(22), 10197; https://doi.org/10.3390/app142210197
Submission received: 30 September 2024 / Revised: 30 October 2024 / Accepted: 5 November 2024 / Published: 6 November 2024

Abstract

:
Skin cancer represents a significant global public health concern, with over five million new cases diagnosed annually. If not diagnosed at an early stage, skin diseases have the potential to pose a significant threat to human life. In recent years, deep learning has increasingly been used in dermatological diagnosis. In this paper, a multiclassification model based on the Inception-v2 network and the focal loss function is proposed on the basis of deep learning, and the ISIC 2019 dataset is optimised using data augmentation and hair removal to achieve seven classifications of dermatological images and generate heat maps to visualise the predictions of the model. The results show that the model has an average accuracy of 89.04%, a precision of 87.37%, recall of 90.15%, and an F1-score of 88.76%, The accuracy rates of ResNext101, MobileNetv2, Vgg19, and ConvNet are 88.50%, 85.30%, 88.57%, and 86.90%, respectively. These results show that our proposed model performs better than the above models and performs well in classifying dermatological images, which has significant application value.

1. Introduction

The skin is the largest organ in the human body and serves a vital function in protecting the body from infection, heat, and ultraviolet radiation. However, the most significant threat to human life is cancer. There are numerous types of cancers that may manifest in the human body, with skin cancer being one of the most lethal and rapidly growing tumours. In fact, one in every three cancers that develop in the human body is skin cancer [1]. In recent years, there has been an increase in the incidence of various dermatological conditions, as well as an increase in the probability of malignant changes associated with these conditions. The consequences can be difficult to control if not diagnosed and treated in a timely manner. Skin cancer screening represents the primary method of reducing the incidence of skin cancer. However, many individuals lack awareness about skin cancer screening and cancer in general. Dermatologists diagnose skin cancer with the naked eye with approximately 60% accuracy. With the use of a dermatoscope and proper training, this accuracy can be increased to 75% to 84% [2,3]. Pathologists require over a decade of diagnostic experience, yet in some remote areas, the diagnostic proficiency of doctors is often limited [4].
A significant proportion of skin cancers originate in the upper layers of the skin. The development of skin cancer is characterised by the uncontrolled proliferation of skin cells. The normal process of skin cell turnover involves the death of old cells and the production of new cells. However, when this process is disrupted, the cells undergo rapid and disorganised growth, forming tumours [5,6]. The aetiology of this condition is multifactorial, with a multitude of potential causes, including alcohol consumption, tobacco use, allergic reactions, viral infections, environmental alterations, and ultraviolet (UV) radiation exposure.
There are seven common dermatological conditions, namely actinic keratosis (AKIEC), basal cell carcinoma (BCC), benign keratosis (BK), dermatofibroma (DF), melanoma (Mel), nevus melanocyticus (NV), and vascular lesions (VASCs) [7]. The primary method of diagnosis for dermatological conditions is through dermoscopic techniques. The research methodologies employed in the analysis of dermoscopic images have evolved over time, progressing from an exclusively dermatological-expertise-based approach to the utilisation of traditional machine learning algorithms and, more recently, the integration of neural networks [8].
Dermoscopy is a non-invasive microscopic technique that enables visualisation of the subtle structures of, colour changes in, and pigment networks of the skin surface that are difficult to discern with the naked eye [9]. It allows a physician to magnify the area of pigmented skin lesions with a magnifying glass to 6 to 40 times magnification. In comparison to the observation of lesions with the naked eye and the use of common photographic techniques, the presentation of details in dermoscopic images facilitates the determination of the correlation between lesions and the underlying skin histopathology. This enables specialised physicians to analyse lesion characteristics for the diagnosis of skin cancer in a rapid and accurate manner in accordance with established diagnostic criteria, such as the ABCD guidelines, the Monsignor’s scoring method, and the seven-point detection method [10].
Skin cancer can be treated effectively when it is diagnosed at an early stage and excised promptly. However, the early stages of skin cancer do not exhibit any discernible abnormalities on the body, and the areas of melanin deposition are highly similar to benign moles. This necessitates a remarkably high level of expertise on the part of dermatologists. Even when dermoscopic images are analysed, dermatologists may have disparate observations of skin cancer due to differences in their skill levels and clinical treatment experience and may be unable to accurately determine whether skin cancer is present [11].
Nevertheless, machine learning is a pervasive tool in numerous domains. In dermatology, for instance, machine learning techniques such as support vector machines (SVMs) [12], Bayesian (NB) classifiers [13], and decision trees (DTs) [14] are employed in classification. Convolutional neural networks (CNNs) have gained considerable traction in recent years, largely due to their capacity to automate feature extraction and their extensive applicability in research contexts [15,16,17]. These techniques facilitate the expeditious and efficacious detection of malignant cells, with a survival rate exceeding 95% among patients who are promptly identified and treated [18,19].
This paper proposes a multiclassification model for dermatological images based on the Inception-v2 architecture, with the objective of addressing the aforementioned issue. Firstly, the dataset is subjected to preprocessing operations, including data enhancement and hair removal. Subsequently, the efficacy of various loss functions is evaluated, and finally, focal loss is selected as the loss function. Subsequently, experimental tests are conducted on three distinct networks, namely Resnet-50, Densenet, and Inception-v2. During the testing phase, confusion matrices and Grad-CAM heat maps are employed as visualisation methods. The optimal classification model is identified through ablation experiments. This paper makes the following contributions:
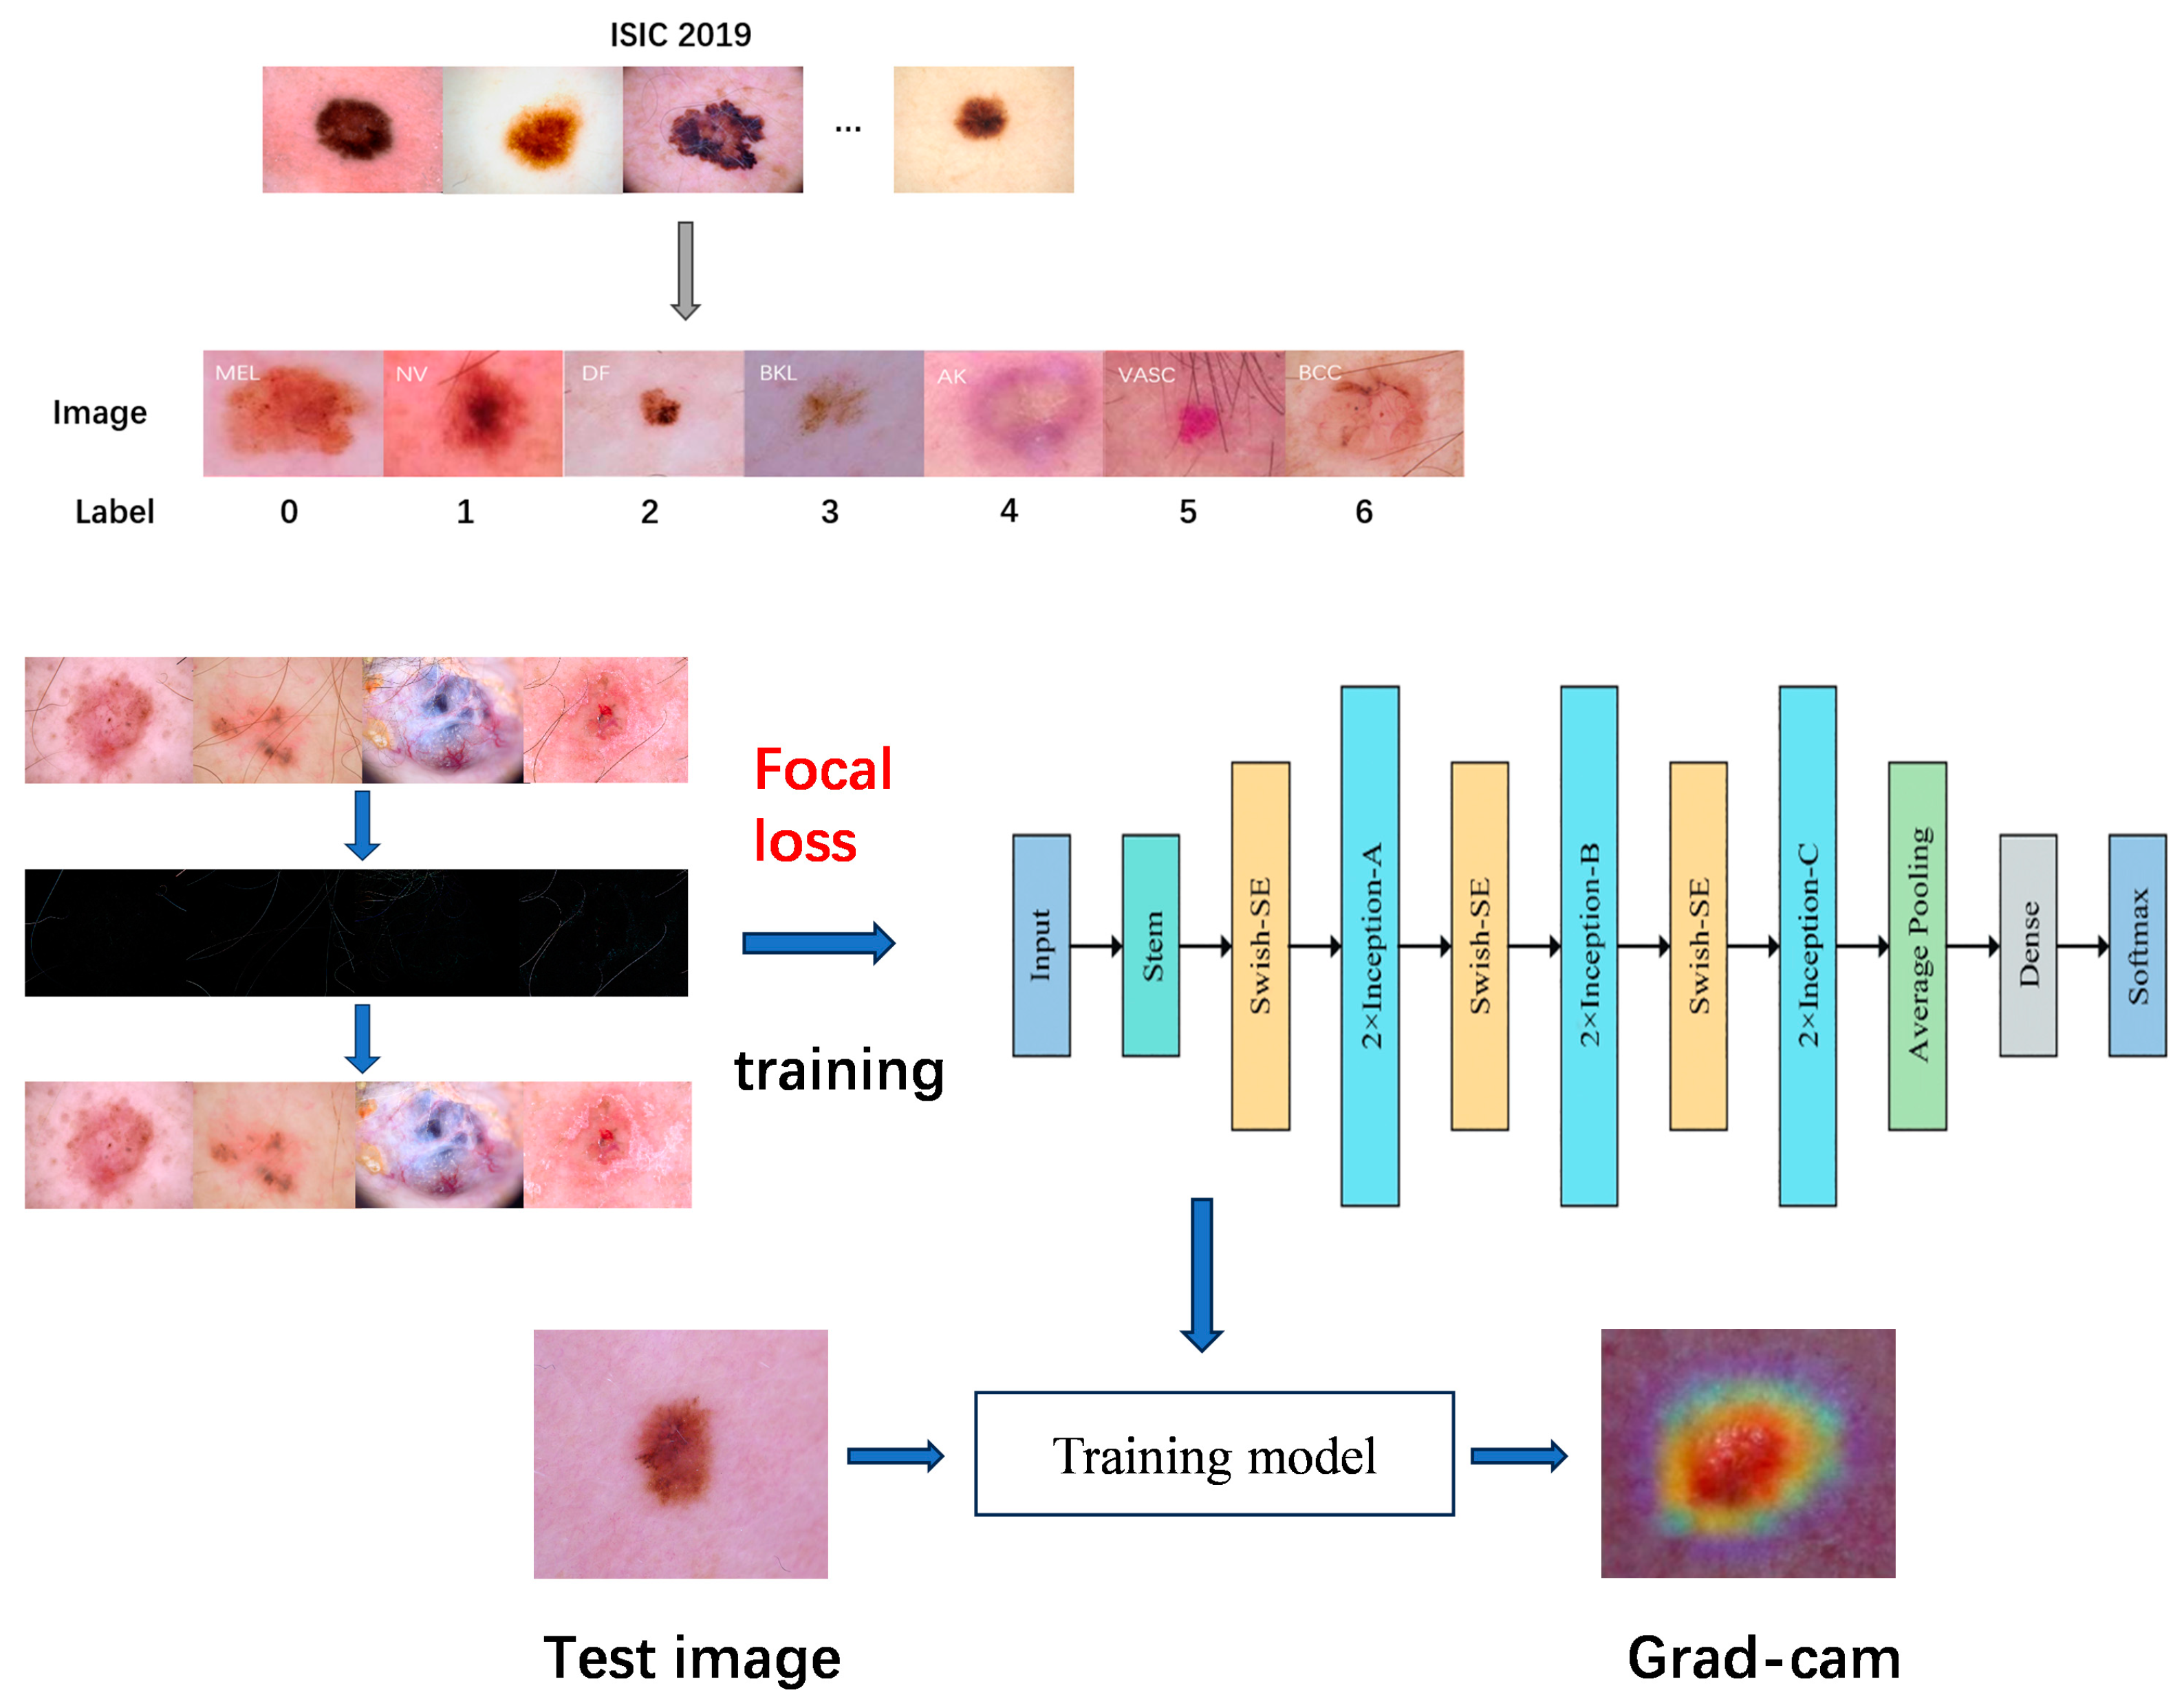
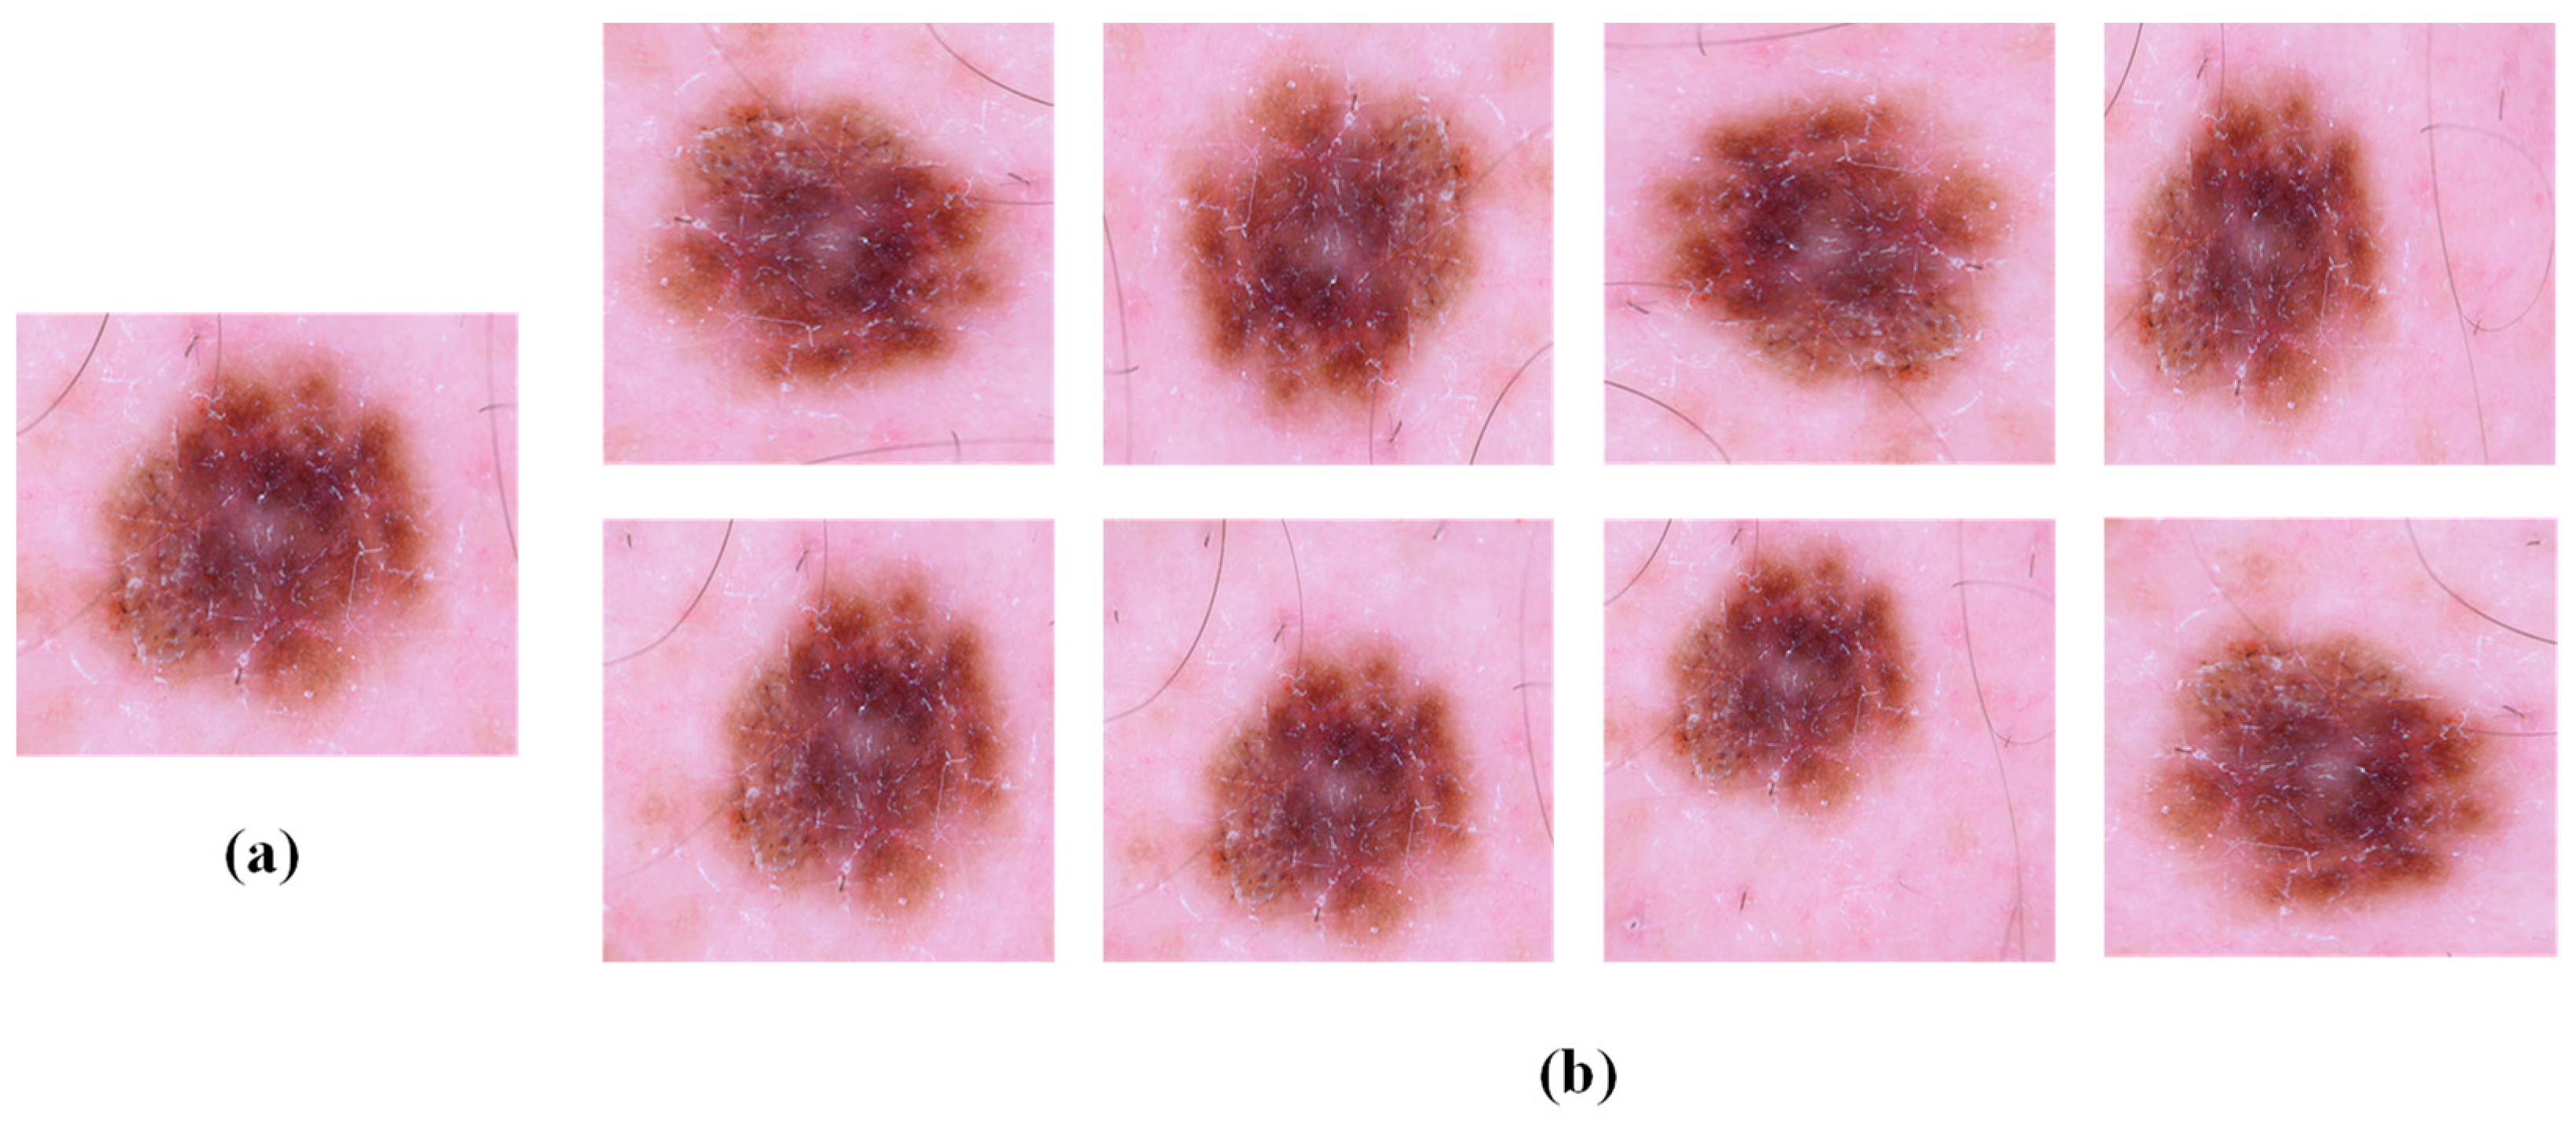
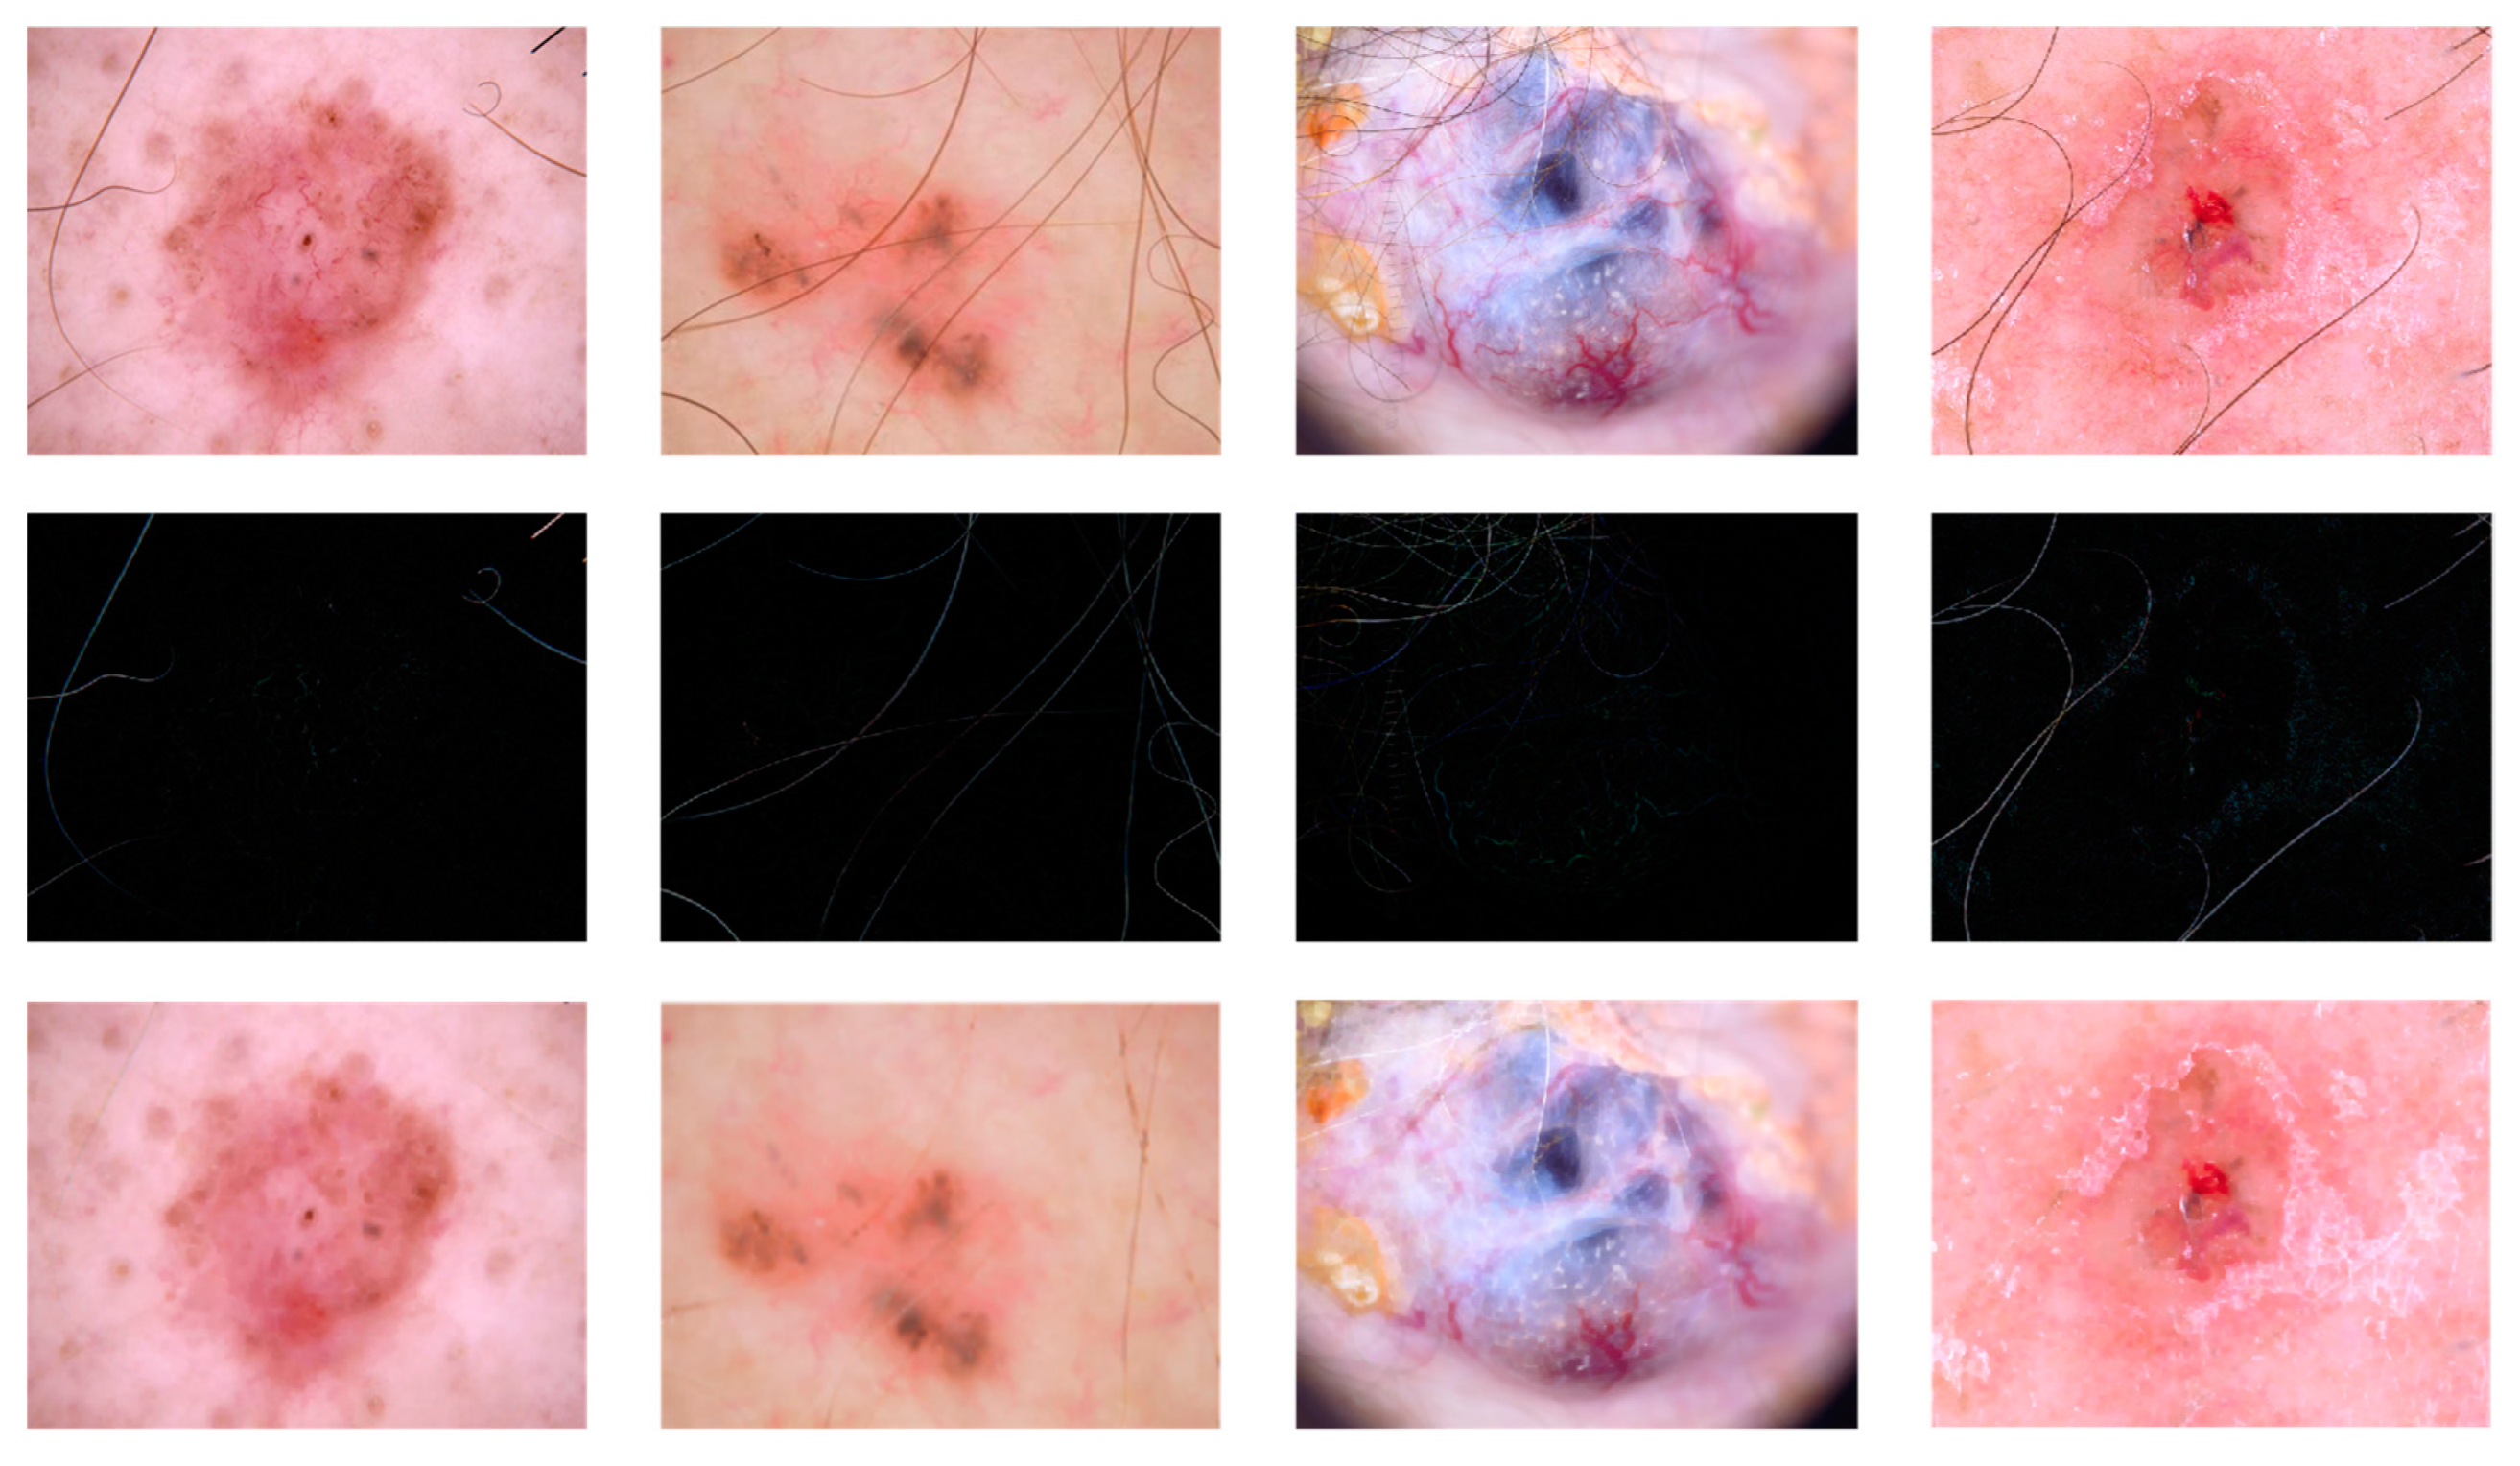
  • The data were enhanced and hair was removed, among other things, to address issues such as an uneven distribution of the original dataset and images. The results of these processes were demonstrated to improve the performance and classification accuracy of the model through the use of ablation experiments.
  • Testing on three different networks, Resnet-50, Densenet, and Inception-v2, and comparing the NNLLoss and focal loss functions, the results show that the focal loss function has a better performance for the classification model, particularly for diseases with limited original datasets.
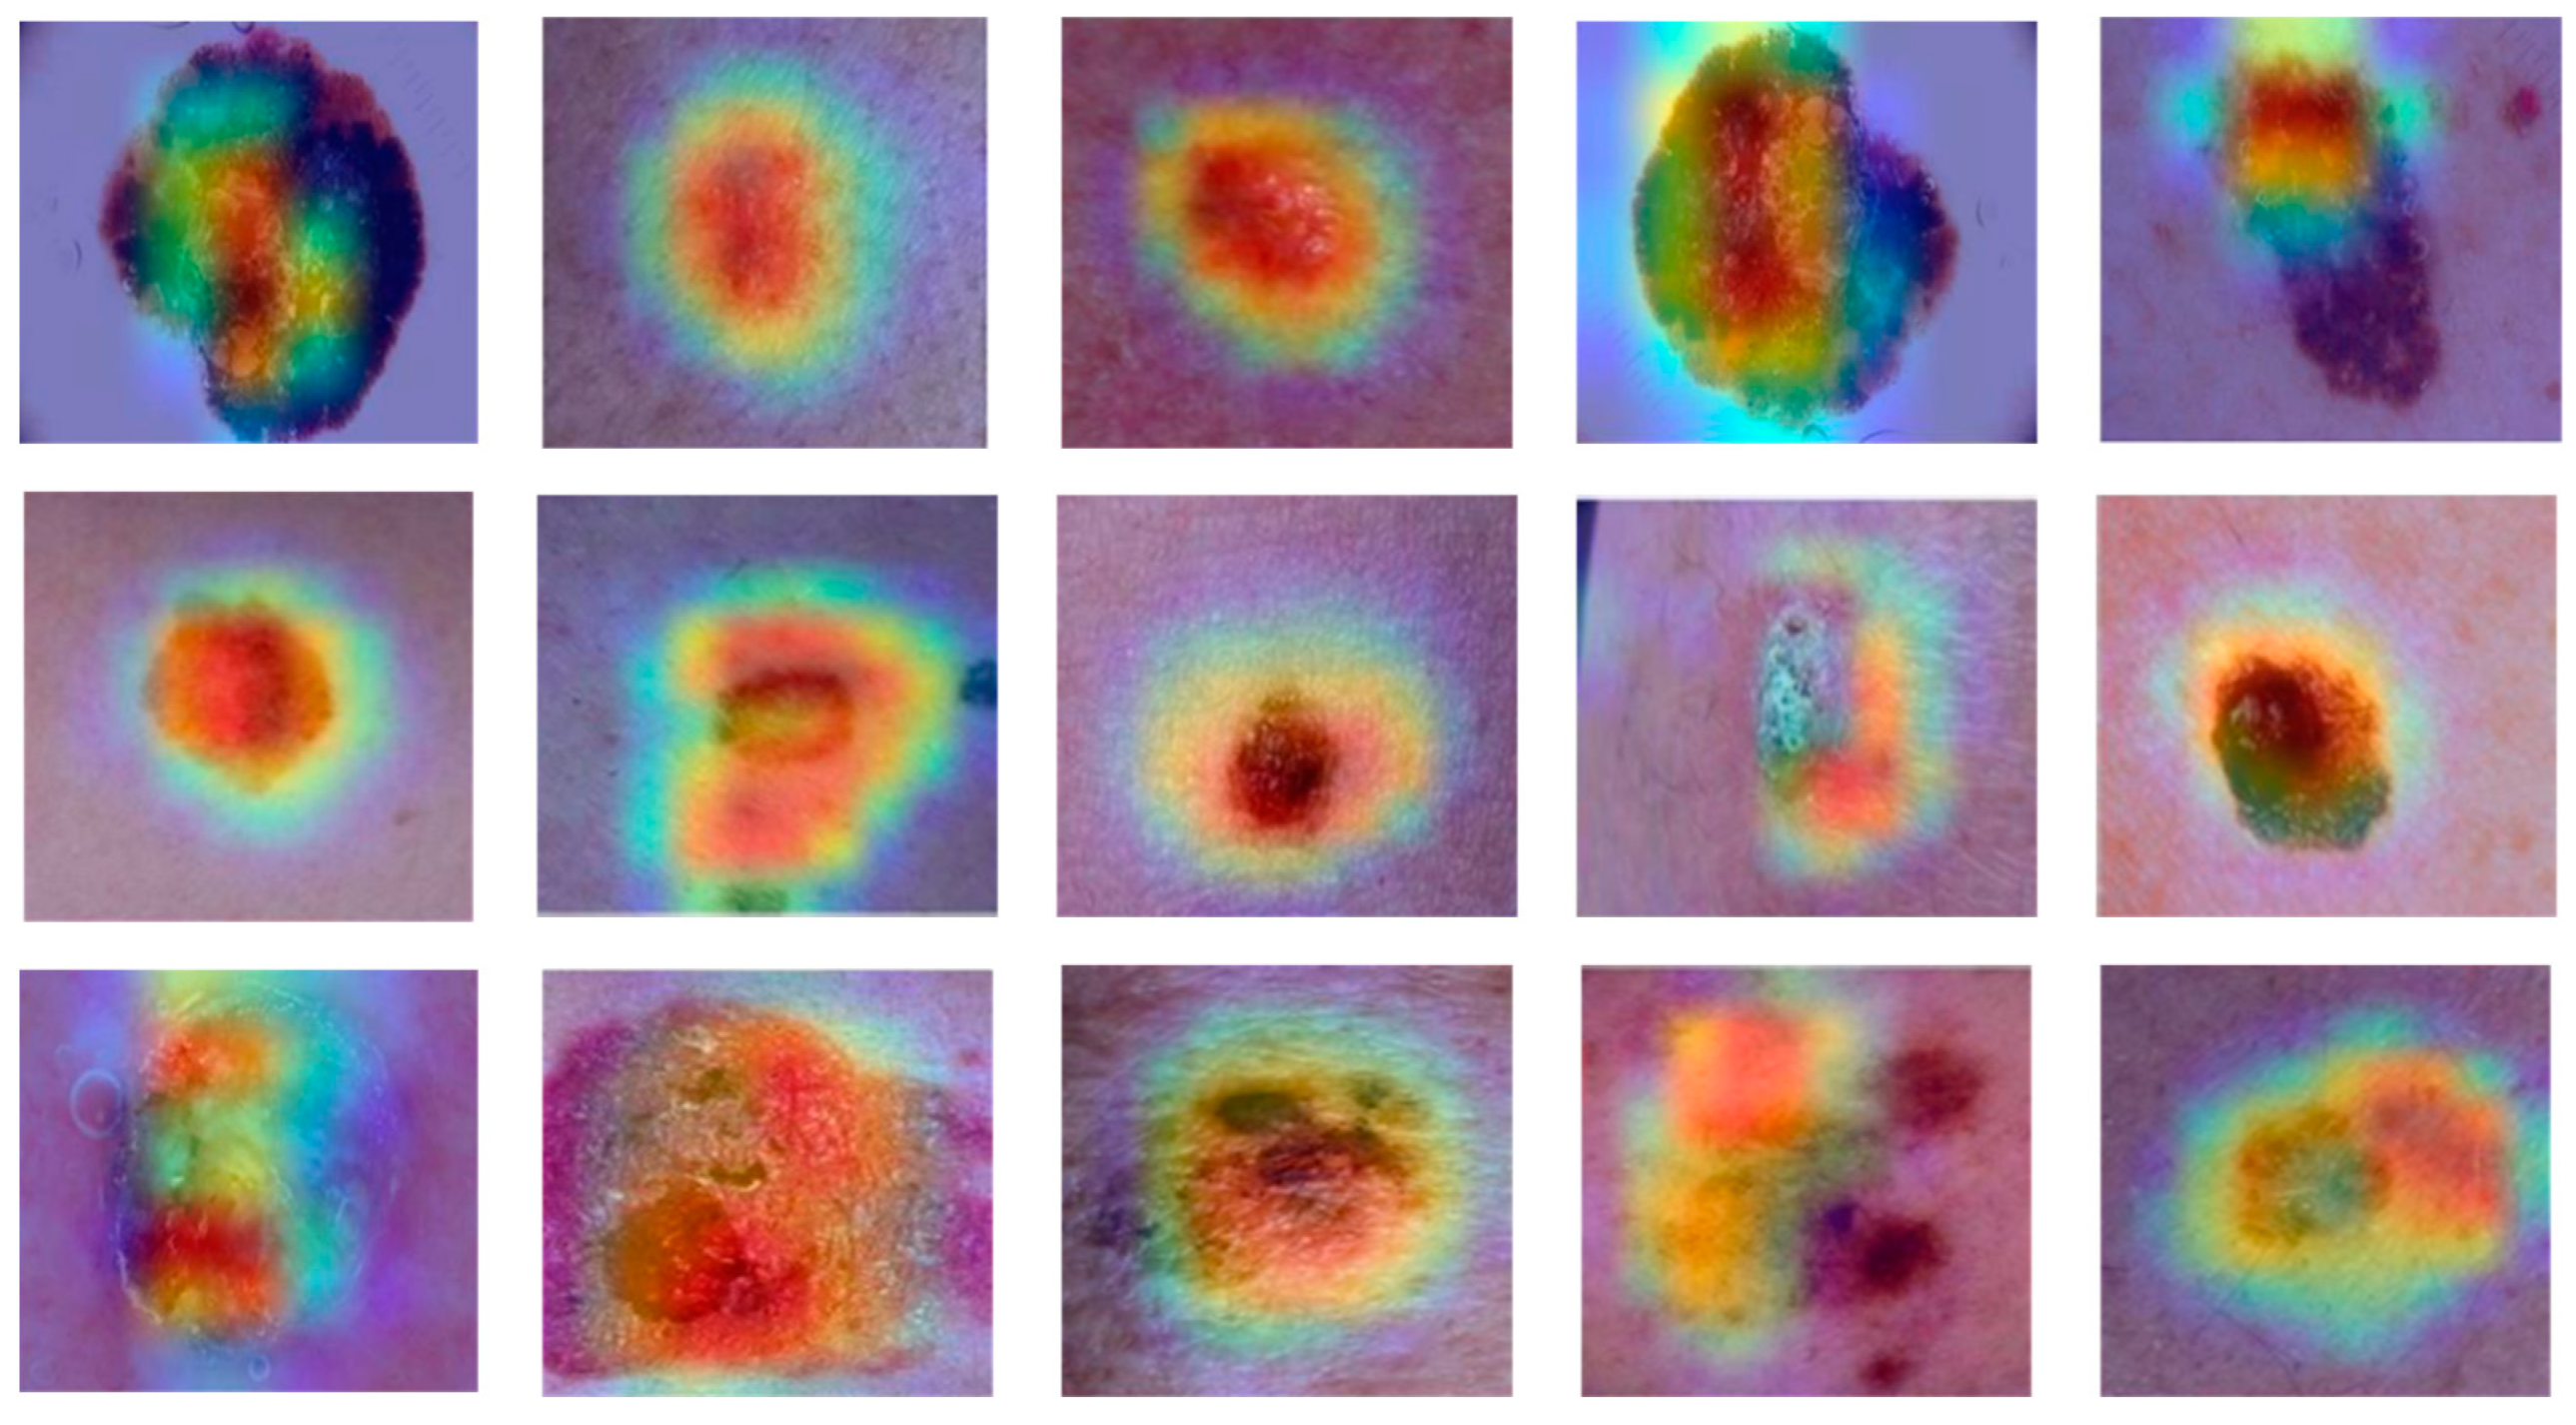
  • The utilisation of Grad-CAM heat maps provides insight into the model’s classification methodology for skin disease images, facilitating a deeper comprehension of the underlying processes.

2. Related Work

The classification of early skin diseases is dependent upon manual extraction of features based on colour, texture, and other characteristics [20]. In the majority of cases, experts rely on a subjective evaluation of the characteristics of the image lesions in question. This is due to the fact that the process of labelling is inherently subjective, and visual evaluation of the human eye is not sufficiently accurate to be relied upon in this context. Furthermore, lesions are often subject to changes in their borders and the presence of hairs, amongst other factors [21].
Conventional edge processing techniques are inadequate for the effective capture of minute texture details in dermatoscopic images. To address this challenge, researchers have devised novel methodologies. Alfed et al. proposed the use of texture and colour feature descriptors, modelled using the bag-of-words approach, which led to an enhancement in accuracy by 3% and 4%, respectively, on the PHP and Dermofit datasets [22]. In their study, Ganster et al. employed decision trees for the purpose of feature selection, with the objective of identifying the optimal combination of features to the recognition of skin cancer [23]. Bajwa et al. employed an artificial neural network to extract the features, which were then integrated with shape and colour features derived from traditional methods to enhance the robustness of the extracted features [24]. Nugroho et al. extracted pertinent features, including colour and texture, from the lesion area through the process of image segmentation [25]. Nevertheless, these methodologies are inadequate for effectively recognising dermoscopic images that exhibit high interclass similarity and high intraclass diversity.
The field of dermatology is characterised by a multitude of classification and recognition methods, many of which are based on convolutional neural networks (CNNs). The advent of CNNs has led to the establishment of CNN-based classification and recognition as a mainstream approach due to the exceptional feature extraction capabilities of neural networks. The growing popularity of deep learning has resulted in the gradual evolution of mainstream feature extraction methods from manual feature selection to convolutional neural networks (CNNs) and their variants [26]. These include the early AlexNet and Inception series of models, the VGG and ResNet [27] series of models for deeper networks, and the lightweight networks applicable to mobile, such as MobileNet and ShuffleNet [28]. These networks employ ImageNet as a pre-trained dataset, which is subsequently utilised as a backbone structure for classification tasks on other datasets or for other deep learning tasks via transfer learning. In contrast to traditional classification methods, where features are selected by human beings, these methods learn features directly from images through deep networks for classification, thereby enhancing the feature extraction capability to a certain extent and, consequently, the classification accuracy [29].
Hasan et al. [30] employed two novel hybrid convolutional neural network (CNN) models with a support vector machine (SVM) at the output layer to categorise dermoscopic images as benign or malignant cancers. A combination of parameters extracted from the initial CNN model and the second CNN model was provided to the SVM classifier. The hybrid DenseNet-201 and the MobileNet model demonstrated an accuracy of 88.02%, while the hybrid DenseNet-201 and the ResNet-50 model exhibited an accuracy of 87.43%.
Gilani et al. [31] applied deep peaking neural networks to 3670 images of melanoma and 3323 images of non-melanoma lesions from the ISIC 2019 dataset. With the peaked Vgg-13 model, they obtained an accuracy of 89.57% and an F1-score of 90.07%, which were higher than those obtained with the Vgg-13 and AlexNet models.
Kousis et al. [32] constructed 11 convolutional neural network (CNN) architectures for the classification of various skin lesions using the HAM10000 dataset. Additionally, a mobile Android application was developed that employs the DenseNet-169 architecture to determine whether a skin lesion is benign or malignant. Ultimately, the DenseNet-169 model exhibited the highest accuracy (92.25%), surpassing other models such as ResNet-50, Vgg-16, and Inception. The DenseNet-121 model attained the second highest accuracy. For mobile applications, the DenseNet-169 model demonstrated an accuracy of 91.10%.
Ranpreet et al. [33] proposed a deep convolutional neural network (CNN)-based automatic classifier for triple classification of dermatologic diseases. The primary objective was to propose a deep CNN that is more straightforward than other techniques in order to identify melanoma skin tumours in an efficient manner. The ISIC datasets were employed to acquire dermoscopic images for this study, which included several image datasets, such as ISIC 2016, ISIC 2017 and ISIC 2020. The accuracy of the classifiers for melanoma, basal cell carcinoma, and nevi on the ISIC 2016, 2017, and 2020 datasets was 81.41%, 88.23%, and 90.42%, respectively.
Alwakid et al. [34] employed a convolutional neural network (CNN) model and a modified residual network (ResNet-50) on the HAM10000 dataset. This categorisation employed an inhomogeneous skin cancer sample. Initially, the image quality was enhanced using ESRGAN, and then data enhancement was employed to address the category imbalance. The results obtained using the CNN and ResNet-50 models exhibited accuracies of 86% and 85.3%, respectively.
Ali et al. [35] employed the EfficientNetsB0-B7 model on the HAM10000 dermoscopic image dataset. The dataset comprises 10,015 images, categorised according to seven distinct types of skin cancer: actinic keratosis (AKIEC), dermatofibrosarcoma (DF), non-vascular lesions (NVs), BCC, MEL, benign keratosis lentis (BKL), and vascular skin lesions (VASCs). Among the eight models, the EfficientNetsB4 model exhibited the highest level of accuracy, with a Top-1 and Top-2 accuracy of 87% and an F1-score of 87.91%.
Majtner et al. [36] employed the ISIC 2018 dataset and, utilising an ensemble of the GoogleNet and Vgg-16 models, augmented the dataset and normalised its colours to construct an integrated method subsequently provided. The accuracy of the method was 84.1%.
In light of the ongoing advancements in dermoscopic image classification algorithms, this paper presents a summary of two key points.
  • The efficacy of feature extraction and classification of dermoscopic images using convolutional neural networks is contingent upon the performance of the network. However, the current algorithms tend to utilise a single convolutional neural network, which has a relatively low classification accuracy rate.
  • Classification studies of dermoscopic images are predominantly binary, particularly in the context of melanoma recognition. Furthermore, studies investigating multiclassification problems are scarce and of limited scope. Consequently, there is considerable scope for research in the area of dermoscopic image multiclassification.
In this paper, a deep convolutional neural network (CNN) model is employed for the classification of dermoscopic images representing seven categories of skin diseases. To enhance the dataset, data augmentation techniques are utilised to expand the sample size, balance the distribution of the data points, and optimise the dataset through hair removal. Furthermore, the focal loss function is applied to improve the classification accuracy for challenging categories.

3. Materials and Methods

The acquired dataset is initially subjected to analysis, during which the images are classified into seven categories based on their labels. The dermatoscopic images are then preprocessed, with hairs removed and the images divided into a training set, a validation set, and a test set. Further data enhancement operations are subsequently applied to the training set, with the objective of expanding the volume of data in the training set in order to achieve a more balanced distribution of samples. Subsequently, the data-enhanced training set is input into the improved model, the Inception-v2 network based on the focal loss function for training, and finally, the softmax classifier is employed to predict the classification results. In order to mitigate the issue of overfitting and enhance the model’s generalisation capacity, Dropout regularisation is employed for the fully connected layer. During the training phase, Dropout randomly eliminates neurons, thereby reducing the likelihood of overfitting. Finally, the outcomes are visualised and analysed using Grad-CAM (Figure 1).

3.1. The Inception-v2 Network

The Inception-v2 [37] network architecture is designed to enhance the network performance through a number of key techniques. These include the decomposition of the 7 × 7 convolution, the utilisation of the RMSProp optimisation algorithm, the implementation of a label smoothing strategy, and the incorporation of an Inception module [38].
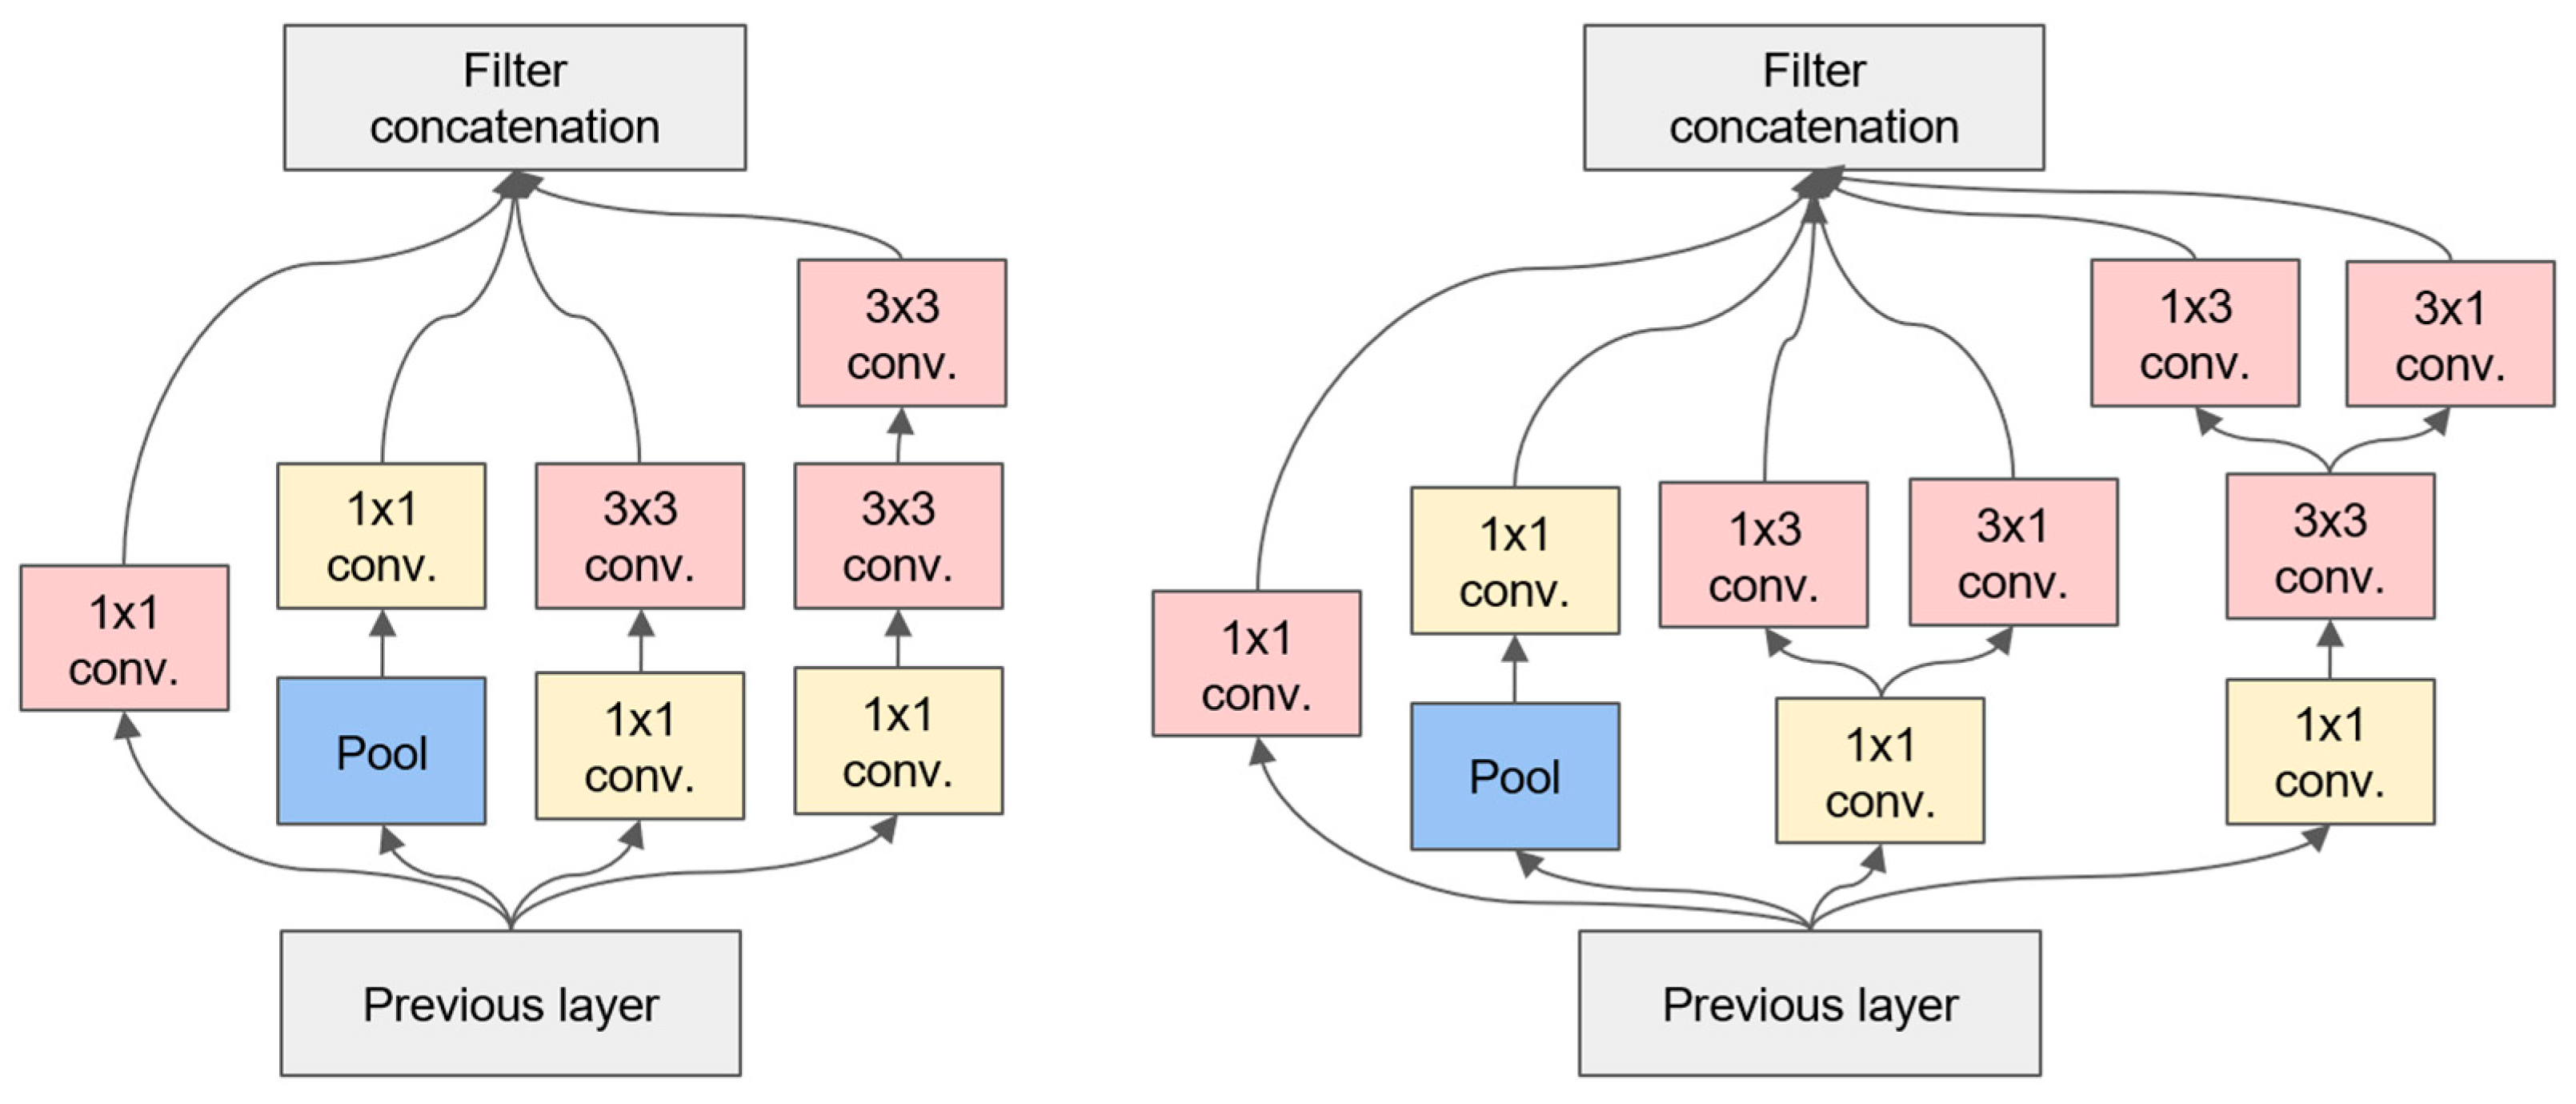
  • Convolutional decomposition: Inception-v2 decomposes the 7 × 7 convolution into two one-dimensional convolutions (1 × 7 and 7 × 1) and the 3 × 3 convolution into two one-dimensional convolutions (1 × 3 and 3 × 1). This decomposition has two beneficial effects: it speeds up the computation and increases the nonlinearity of the network, resulting in an increase in both the depth and width of the network.
  • An update to the optimisation algorithm was implemented in Inception-v2, which now utilises the RMSProp optimisation algorithm in place of the previous SGD algorithm. The RMSProp algorithm was selected due to its superior ability to adapt to the requirements of network training through the introduction of an accumulation term, which enables the historical gradient to contribute to the alteration of the learning rate with designated weighting.
  • In order to mitigate the adverse consequences of labelling errors, Inception v2 employs label smoothing. This approach entails modifying the loss function of the samples so that the output of the label is no longer exclusively 1 or 0 but rather 0.8 or 0.88 approaching 1 and 0.1 or 0.11 approaching 0. This results in the realisation of label smoothing.
For each Inception module, the inputs are replicated four times for distinct layers. This comprises three 1 × 1 + 1(S) convolutional layers and one 3 × 3 + 1(S) maximum pooling layer. The three convolutional layers in the second layer are 1 × 1 + 1(S), 3 × 3 + 1(S), and 5 × 5 + 1(S), which are capable of acquiring feature patterns at different scales. All the convolutional layers in this structure utilise the ReLU activation function.
In the Inception module, all the layers have a step size of 1 and utilise the same padding, ensuring that the output of each layer has identical dimensions (the depth can vary). Given that each output has the same dimensions, they can be stacked in the depth direction to form a depth concat layer. This can be achieved by utilising the concat() function in TensorFlow, with axis = 3 (axis 3 is the depth direction). In comparison to the input, the bottleneck layer outputs a reduced number of feature maps, thereby reducing the dimensionality. This is the rationale behind the term ‘bottleneck layer’. This approach is particularly beneficial when utilised prior to computationally demanding convolutional layers, such as 3 × 3 and 5 × 5. The structure of 1 × 1, 3 × 3 and 1 × 1, 5 × 5 forms a more efficient convolutional layer capable of acquiring more complex feature patterns. Indeed, this combination of convolutional layers is equivalent to a two-layer neural network rather than simple linear classification when traversing a scan of the input image. For further details, please refer to Figure 2 and Figure 3, which show diagrams of the Inception and Inception-v2 network models.
As shown in Figure 2, the Inception module processes input feature maps in parallel through convolutional kernels of three different sizes, 1 × 1, 3 × 3, and 5 × 5, as well as using a 3 × 3 max pooling layer, and integrates them at the end to generate richer feature representations. The 1 × 1 convolutional kernels play a crucial role in this structure, as they are not only used for feature extraction but also to reduce (or increase) the dimensionality of the feature maps, thereby enhancing the model’s expressive power and training efficiency without significantly increasing the computational complexity.
As illustrated in Figure 3, Inception-v2 introduces the concept of Batch Normalisation to accelerate the training process and improve the model’s generalisation ability. Additionally, it replaces a single 5 × 5 convolutional kernel with two stacked 3 × 3 convolutional kernels to reduce the number of parameters and enhance the computational efficiency. Similar to Inception-v1, Inception-v2 generates rich feature representations by processing feature maps of different scales in parallel and integrating them at the end. However, thanks to the introduction of Batch Normalisation and improvements in the convolutional kernels, Inception-v2 sees improvements in both its training speed and model performance.

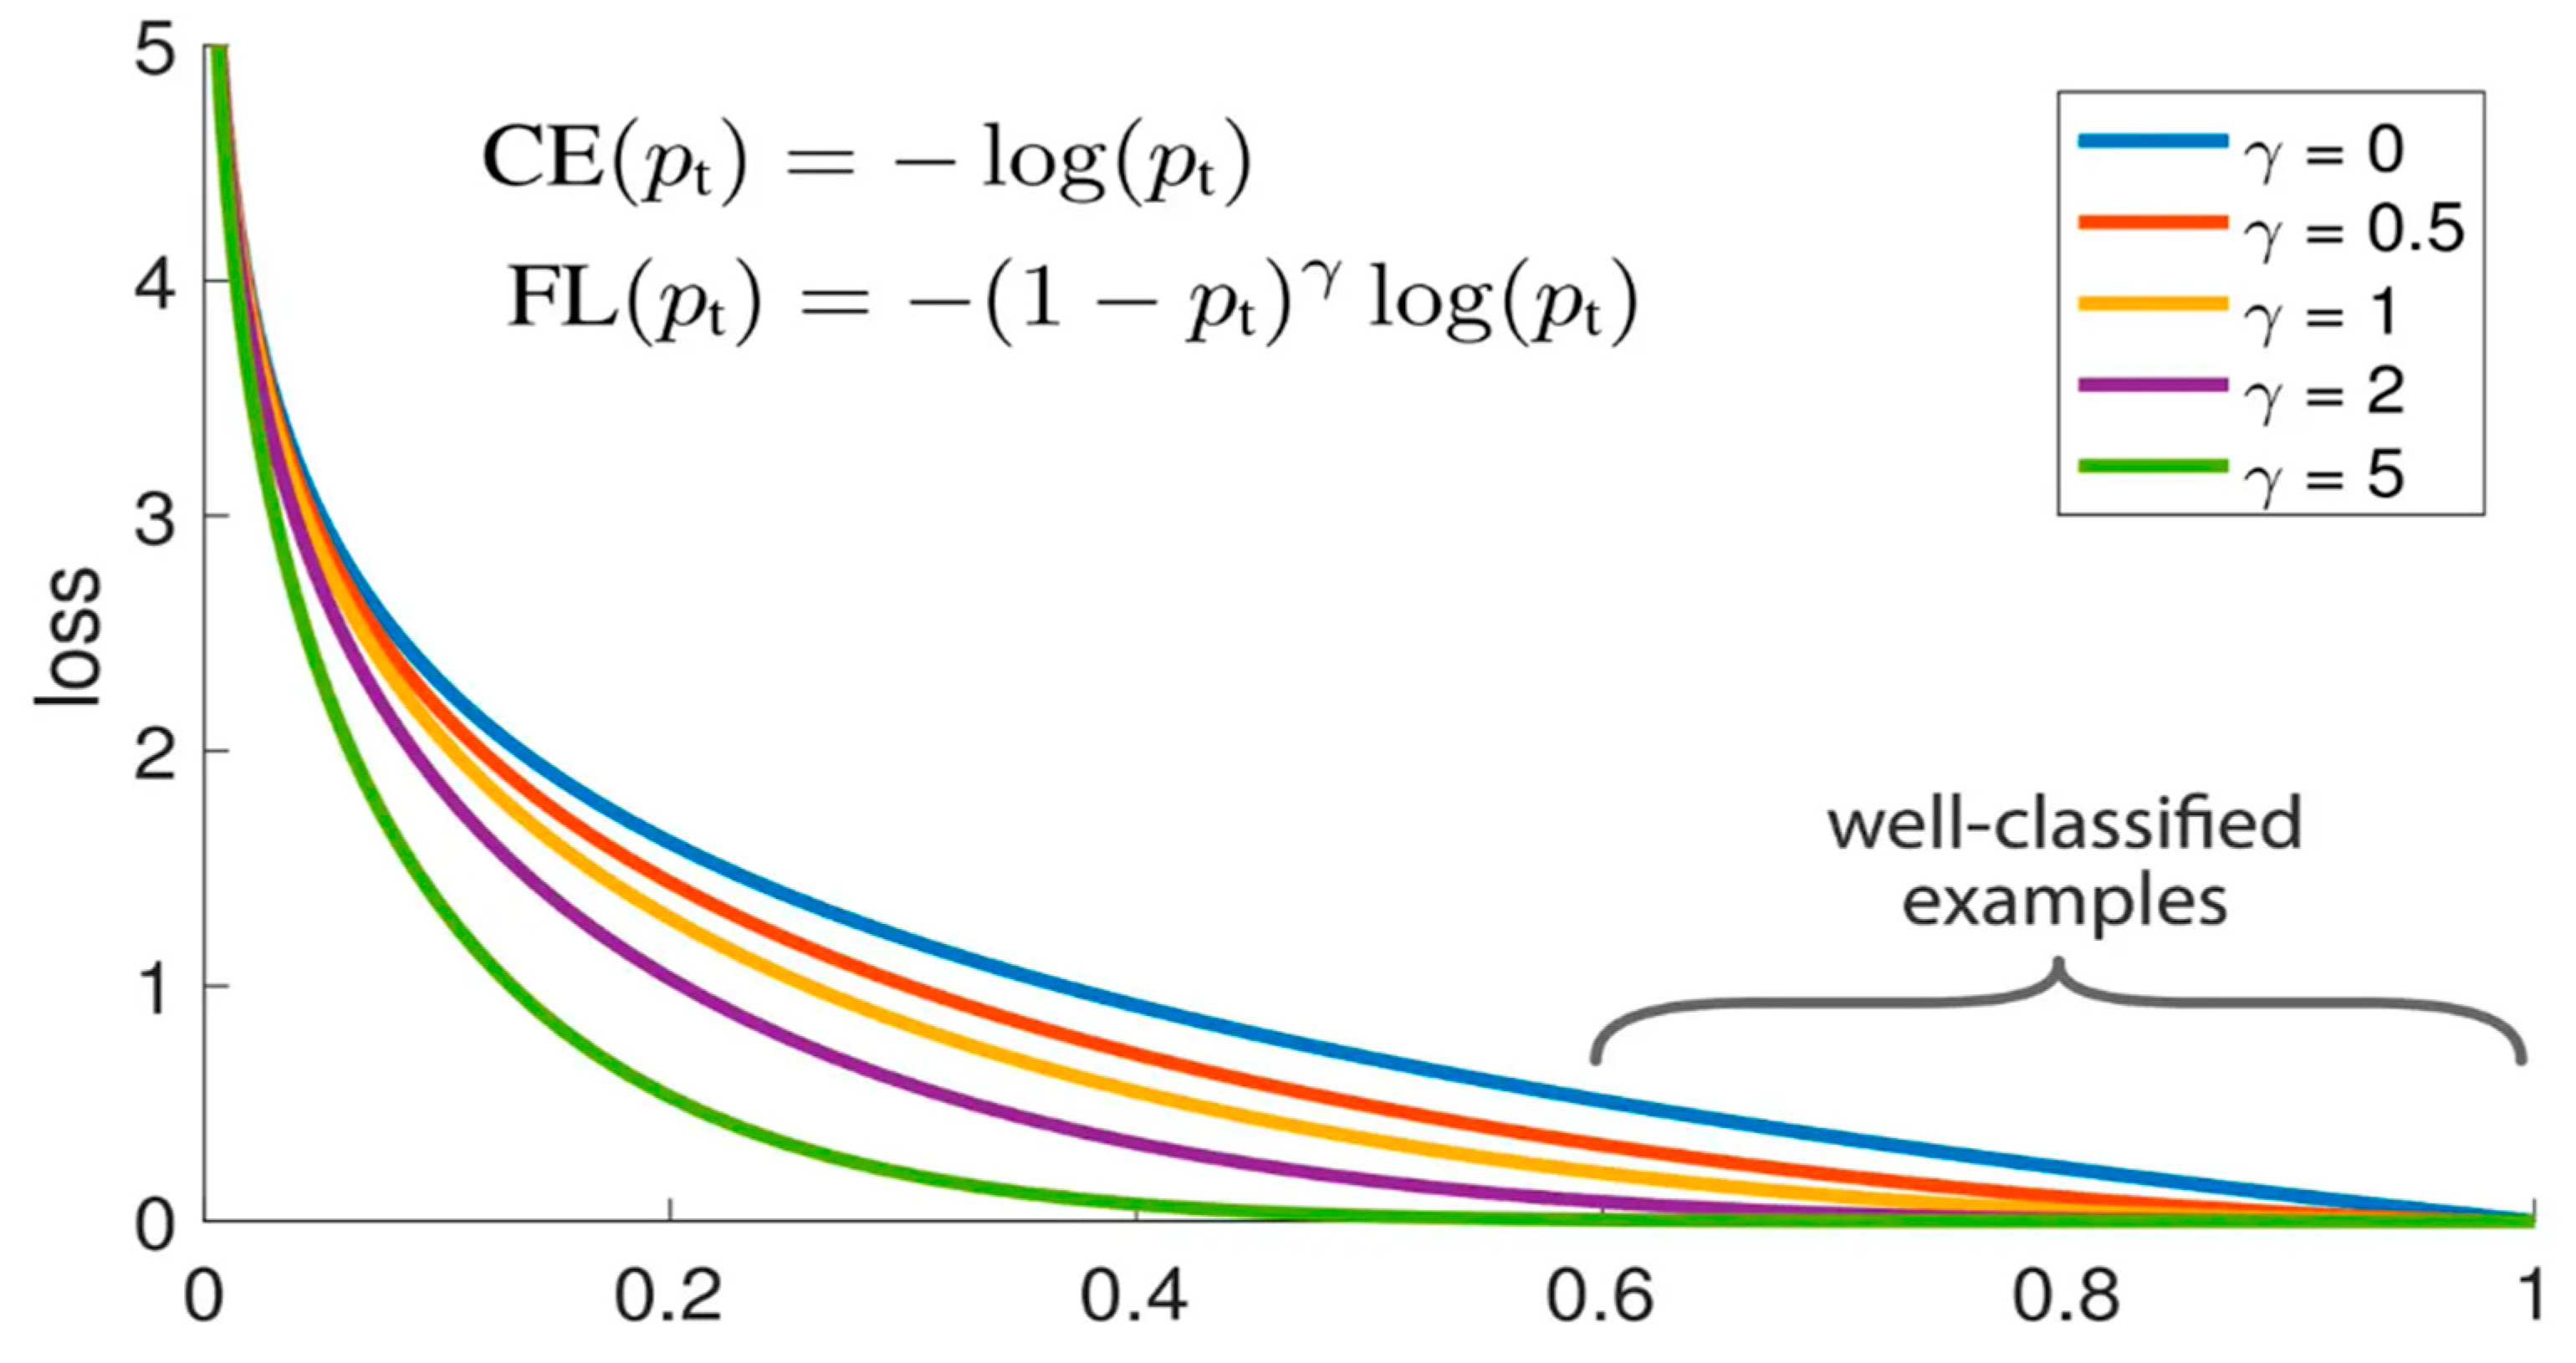
3.2. The Focal Loss Function

The positive and negative samples in the dataset are not balanced, and the amount of negative sample data is larger than that of positive sample data. In network training, negative samples account for most of the input parameters of the loss function, and such negative samples are usually easy to classify, which makes the model pay insufficient attention to positive samples. The large difference in the amount of positive and negative sample data causes data imbalance, which leads to a decrease in accuracy in classification tasks. The focal loss function was proposed to solve this problem [39].
The concept of focal loss is to incorporate a coefficient factor on the basis of standard cross-entropy loss so as to weaken the learning of easy samples and strengthen the learning of difficult samples and improve the classification ability of the model. Focal loss is calculated as shown in Figure 4, where pt denotes the predicted probability of the true category of a sample.

3.3. Datasets

The dataset employed in this study was derived from the dermatologist-annotated dataset from ISIC 2019, which encompasses a total of 25,332 colour dermoscopic images. The ISIC 2019 image database is an international standardised dataset specifically designed for skin image analysis, containing a large number of high-quality dermatoscopic images. These images cover a variety of skin diseases, including but not limited to melanoma, basal cell carcinoma, and squamous cell carcinoma. The database not only provides researchers with abundant experimental data but also facilitates the development and comparison of skin disease diagnosis algorithms. In terms of its content, the ISIC 2019 image database not only includes raw image data but also provides annotations and labels for the images, which are crucial for training and validating classification algorithms. Additionally, the database provides metadata for the images, such as the source and capture device information, aiding researchers in gaining a more comprehensive understanding of the dataset.
A comprehensive description of the subdatasets is presented in Table 1. It can be observed that the distribution of the dataset is uneven, with the NV subdataset comprising the largest amount of data, at 12,876 images, and the DF subdataset comprising the smallest amount of data, at 240 images. Figure 5 illustrates an example of seven dermatologic images.

3.4. Image Enhancement and Hair Removal

The distribution of samples in public datasets is highly heterogeneous, and large-scale datasets are the prerequisite for the successful application of deep convolutional neural networks. Despite the considerable data already present in the ISIC 2019 dataset, they remain inadequate compared to the vast quantities of data typically employed in deep learning. Moreover, the distribution of images depicting various skin diseases is highly uneven. In the experiment, through the data enhancement method, the training set is enhanced with secondary data on the basis of the basic training set, which further increases the amount of training sample data and solves the problem that the image data for various dermatoid diseases are very uneven. Similar but different training samples are generated by rotating and shrinking the training samples, which expands the training set data and balances the number of samples. The data enhancement is performed by randomly rotating, horizontally and vertically translating, randomly deflating, and vertically and horizontally flipping the samples in the original training set within 0° and 180°, as illustrated in Figure 6.
In addition to the melanocyte nevus (NV) samples in the training set, the remaining 6 types of samples were enhanced to expand the sample data so that the amount of data in each of these 6 types was expanded. On the one hand, the total data in the training set were expanded by 3 times, which avoided the overfitting phenomenon caused by there being too few samples and improved the generalisation ability. On the other hand, the volume of data for the sample types with low amounts was increased to roughly equal to that of the melanocyte nevus species with the largest data volume, which solved the problem of an unbalanced sample distribution. The enhanced distribution is illustrated in Figure 7.
Prior to the application of the classification algorithm to the dermoscopic images, it is necessary to undertake the requisite preprocessing. The dataset comprises a variety of sources, resulting in the presence of black boxes of varying sizes and shades of colour in the images. Secondly, the lesion areas may be obscured by body hair due to the location of the lesions. The primary objective of preprocessing is to minimise the impact of the image background on subsequent algorithms, eliminate irrelevant information, and reduce image noise in order to enhance the accuracy of subsequent image classification and recognition. Inappropriate handling by the user or hairiness of the patient frequently results in the generation of blurred images, uneven lighting, and heavy hair occlusion. These factors can render the images challenging to analyse and process. Figure 8 demonstrates the hair removal process for the original image.

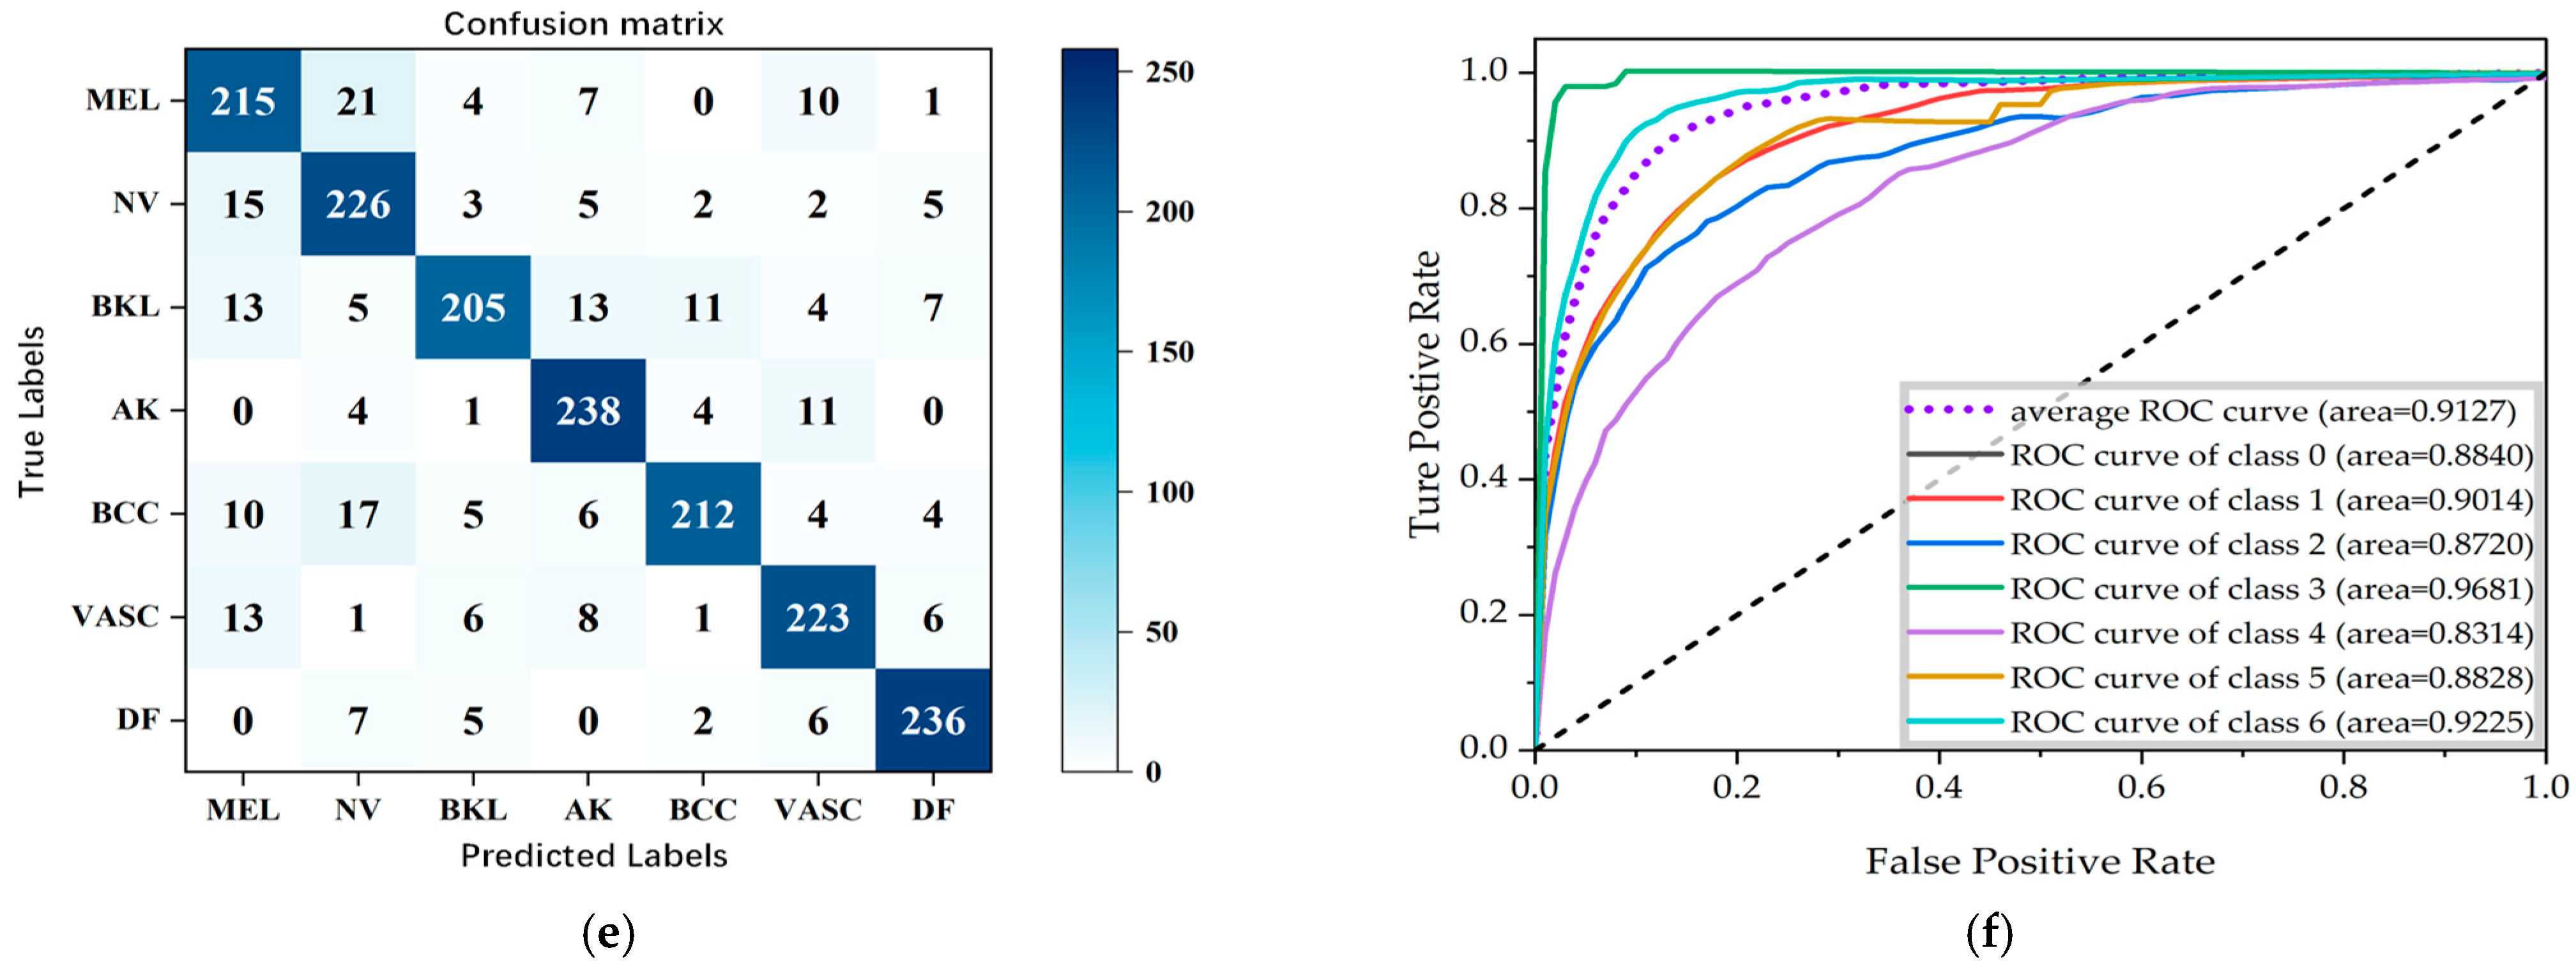
3.5. Evaluation Metrics

In this paper, industry-recognised classification evaluation metrics are employed. The formulas for these evaluation metrics are presented below, whereby the accuracy, precision, and recall of the classification results are calculated in order to ascertain the performance of the algorithm.
a c c u r a c y = T N + T P T N + T P + F N + F P
p r e c i s i o n = T P T P + F P
r e c a l l = T P T P + F N
F 1 s c o r e = 2 T P 2 T P + F P + F N
where TP denotes true positives, the number of positive samples correctly predicted as belonging to the positive category, i.e., of the number judged by the classifier to be ill; FP denotes false positives, denoting the number of negative samples incorrectly predicted as belonging to the positive category, i.e., of the number judged by the classifier to be ill; TN denotes true negatives, the number of negative samples correctly predicted as belonging to the negative category, i.e., of the number judged by the classifier to not be ill; and FN denotes false negatives, denoting the number of positive samples incorrectly predicted as belonging to the negative category, i.e., of the number judged by the classifier as not being diseased.

4. Results and Discussion

The model for this experiment was implemented on the Windows 10 operating system, which was equipped with 64 GB of RAM, an NVIDIA RTX 4090 graphics card, a 24 GB GPU, a 2 TB solid-state drive, the PyTorch 1.7 framework, and the Python 3.7 programming language. Two hundred training iterations, 16 batch samples, and a uniform input image resolution of 224 × 224 were employed to facilitate the training of the model. The input image resolution was standardised to 224 × 224 to facilitate the training of the model. During the training process, this paper saved the model with the highest accuracy and the smallest loss function and selected the model with the highest test accuracy as the optimal model according to comparison.
In this paper, the pre-trained dataset is then trained and tested on the Resnet-50, Densenet, and Inception-v2 network models, respectively. The results of the experiments on the three network models for seven skin diseases using the NLLLoss loss function are presented in Table 2. The results obtained for the same three models using focal loss are presented in Table 3.
From Table 2, it can be seen that NNLLoss, as a traditional commonly used classification loss function, is not balanced in the case of the original dataset in terms of the classification effect, and its performance indicators are not as good as those for the focal loss function, as for the dataset, positive and negative samples are not balanced in the classification for a better performance. Despite the enhancement and expansion of the dataset, the ISIC 2019 original dataset still suffers from a very pronounced imbalance of samples in all categories. The original datasets differ by a factor of almost 60 in the most cases. Especially on AK, VASCs, and DF, which have fewer original datasets, focal loss enhances the model significantly better than NNLLoss.
As can be seen in Table 3, Inception-v2 has the best overall classification indexes, with the accuracy for DF reaching 91.04%, the precision for AK reaching 94.24%, the recall for BKL reaching 89.76%, and the F1-score for AK reaching 91.26%, which represent the best results of those for the seven dermatological conditions. Figure 9 shows the confusion matrices and the ROC curves for the classification results. It is straightforward to observe that the Inception-v2 model exhibits a better classification performance. Figure 10 shows the accuracy curves for the classification results, Figure 11 shows the loss curves for the classification results, and Figure 12 shows a histogram of the classification results.

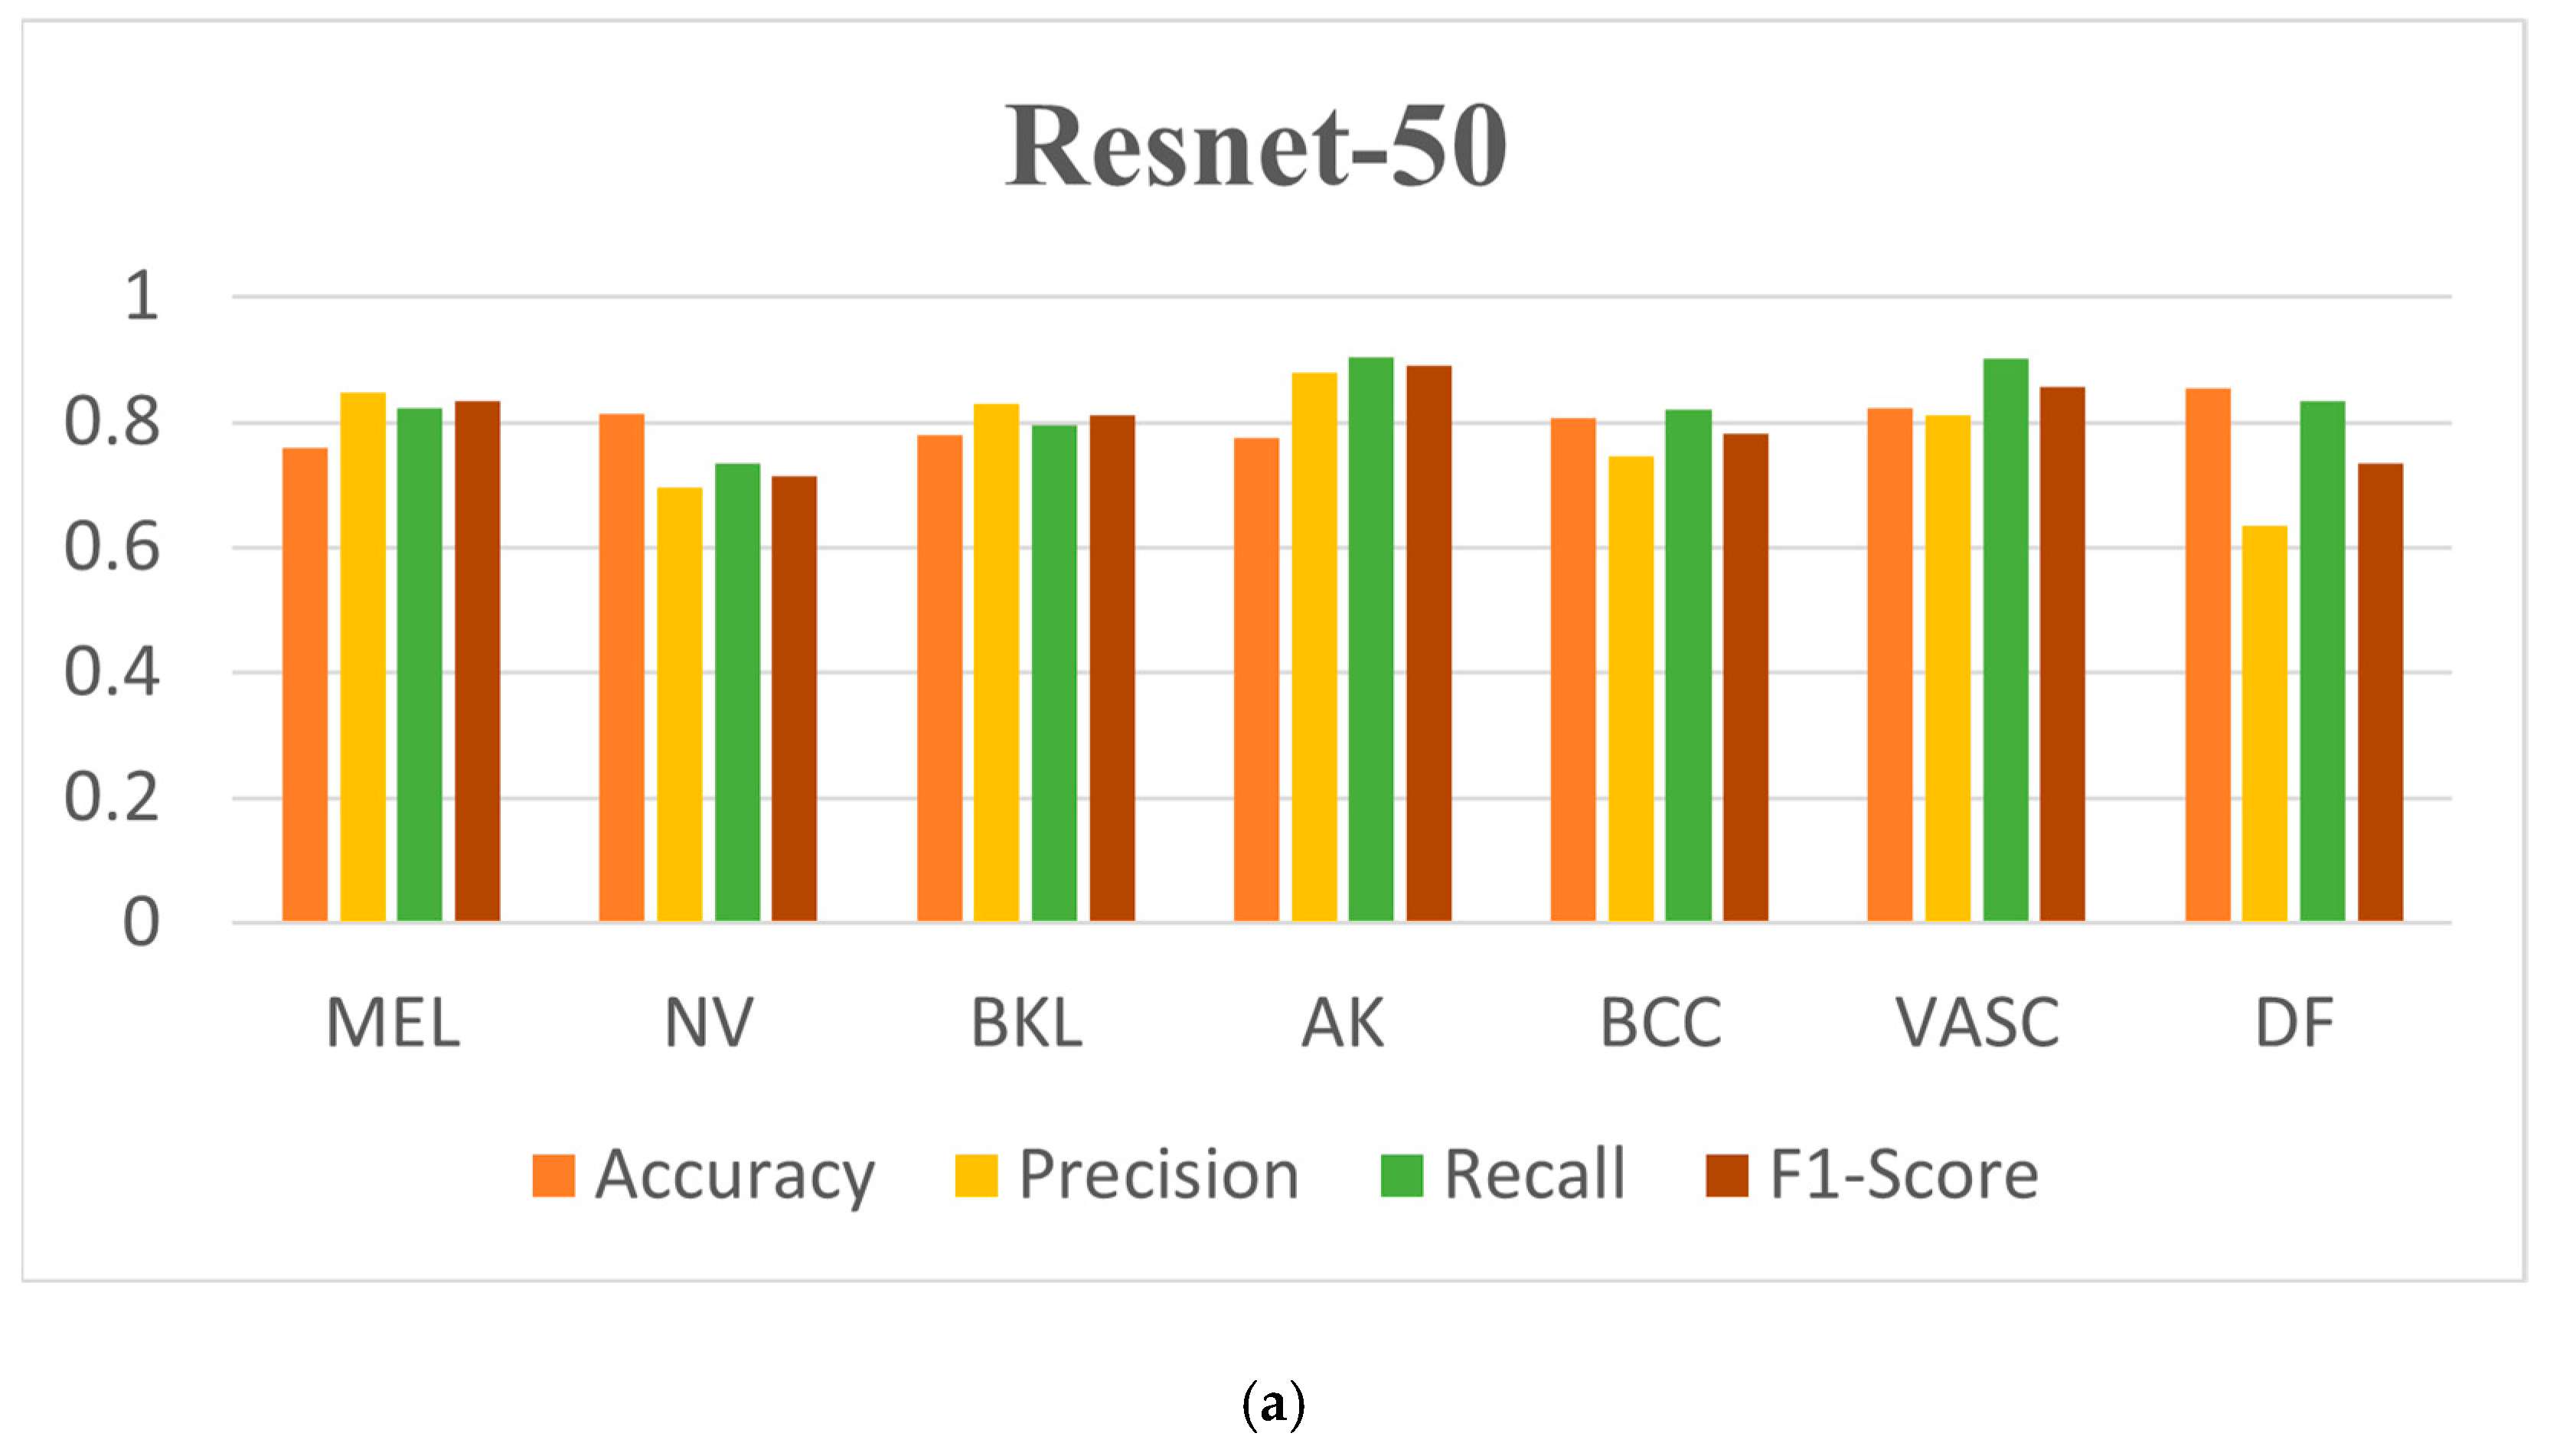
4.1. Comparison with Other Different Models

The following table presents a comparative analysis of this paper’s model with five models from existing studies [38,39,40,41,42]. The overall accuracy, precision, recall, and F1-score metrics were evaluated and compared, and the results are displayed in the table. The accuracy, recall, and F1-score in this paper reached 0.8904, 0.9015, and 0.8876, respectively, which demonstrated the highest performance in the comparison experiments (Table 4).
In order to gain insight into the learning status of dermoscopic images within the model, the optimal model was visualised and analysed using the Gradient-Weighted Class Activation Mapping (Grad-CAM) method. The results are presented in Figure 13. This method enables specific image regions that provide meaningful information for pre-model predictions to be highlighted. This paper employed Grad-CAM to visualise the decision-making mechanism for the predictions in the trained model. Grad-CAM is a gradient-based deep network visualisation method that elucidates the basis of deep neural network classification in the form of heat maps, which facilitate the interpretation of the classification judgments based on the pixel points of an image. The colours in the heat map indicate areas of interest, with red indicating a high degree of relevance to the target category and blue indicating a lesser degree of attention to the area. The purple area represents the result of filling in the blank area after data enhancement of the image. Grad-CAM facilitates the prediction of outcomes when observing the regions of interest that the model prioritises. As illustrated in the figure, the most considerable regions of interest that the model focuses on for dermatoscopic image classification are in the lesion region, indicating that the model has effectively learned the features of the lesion region.

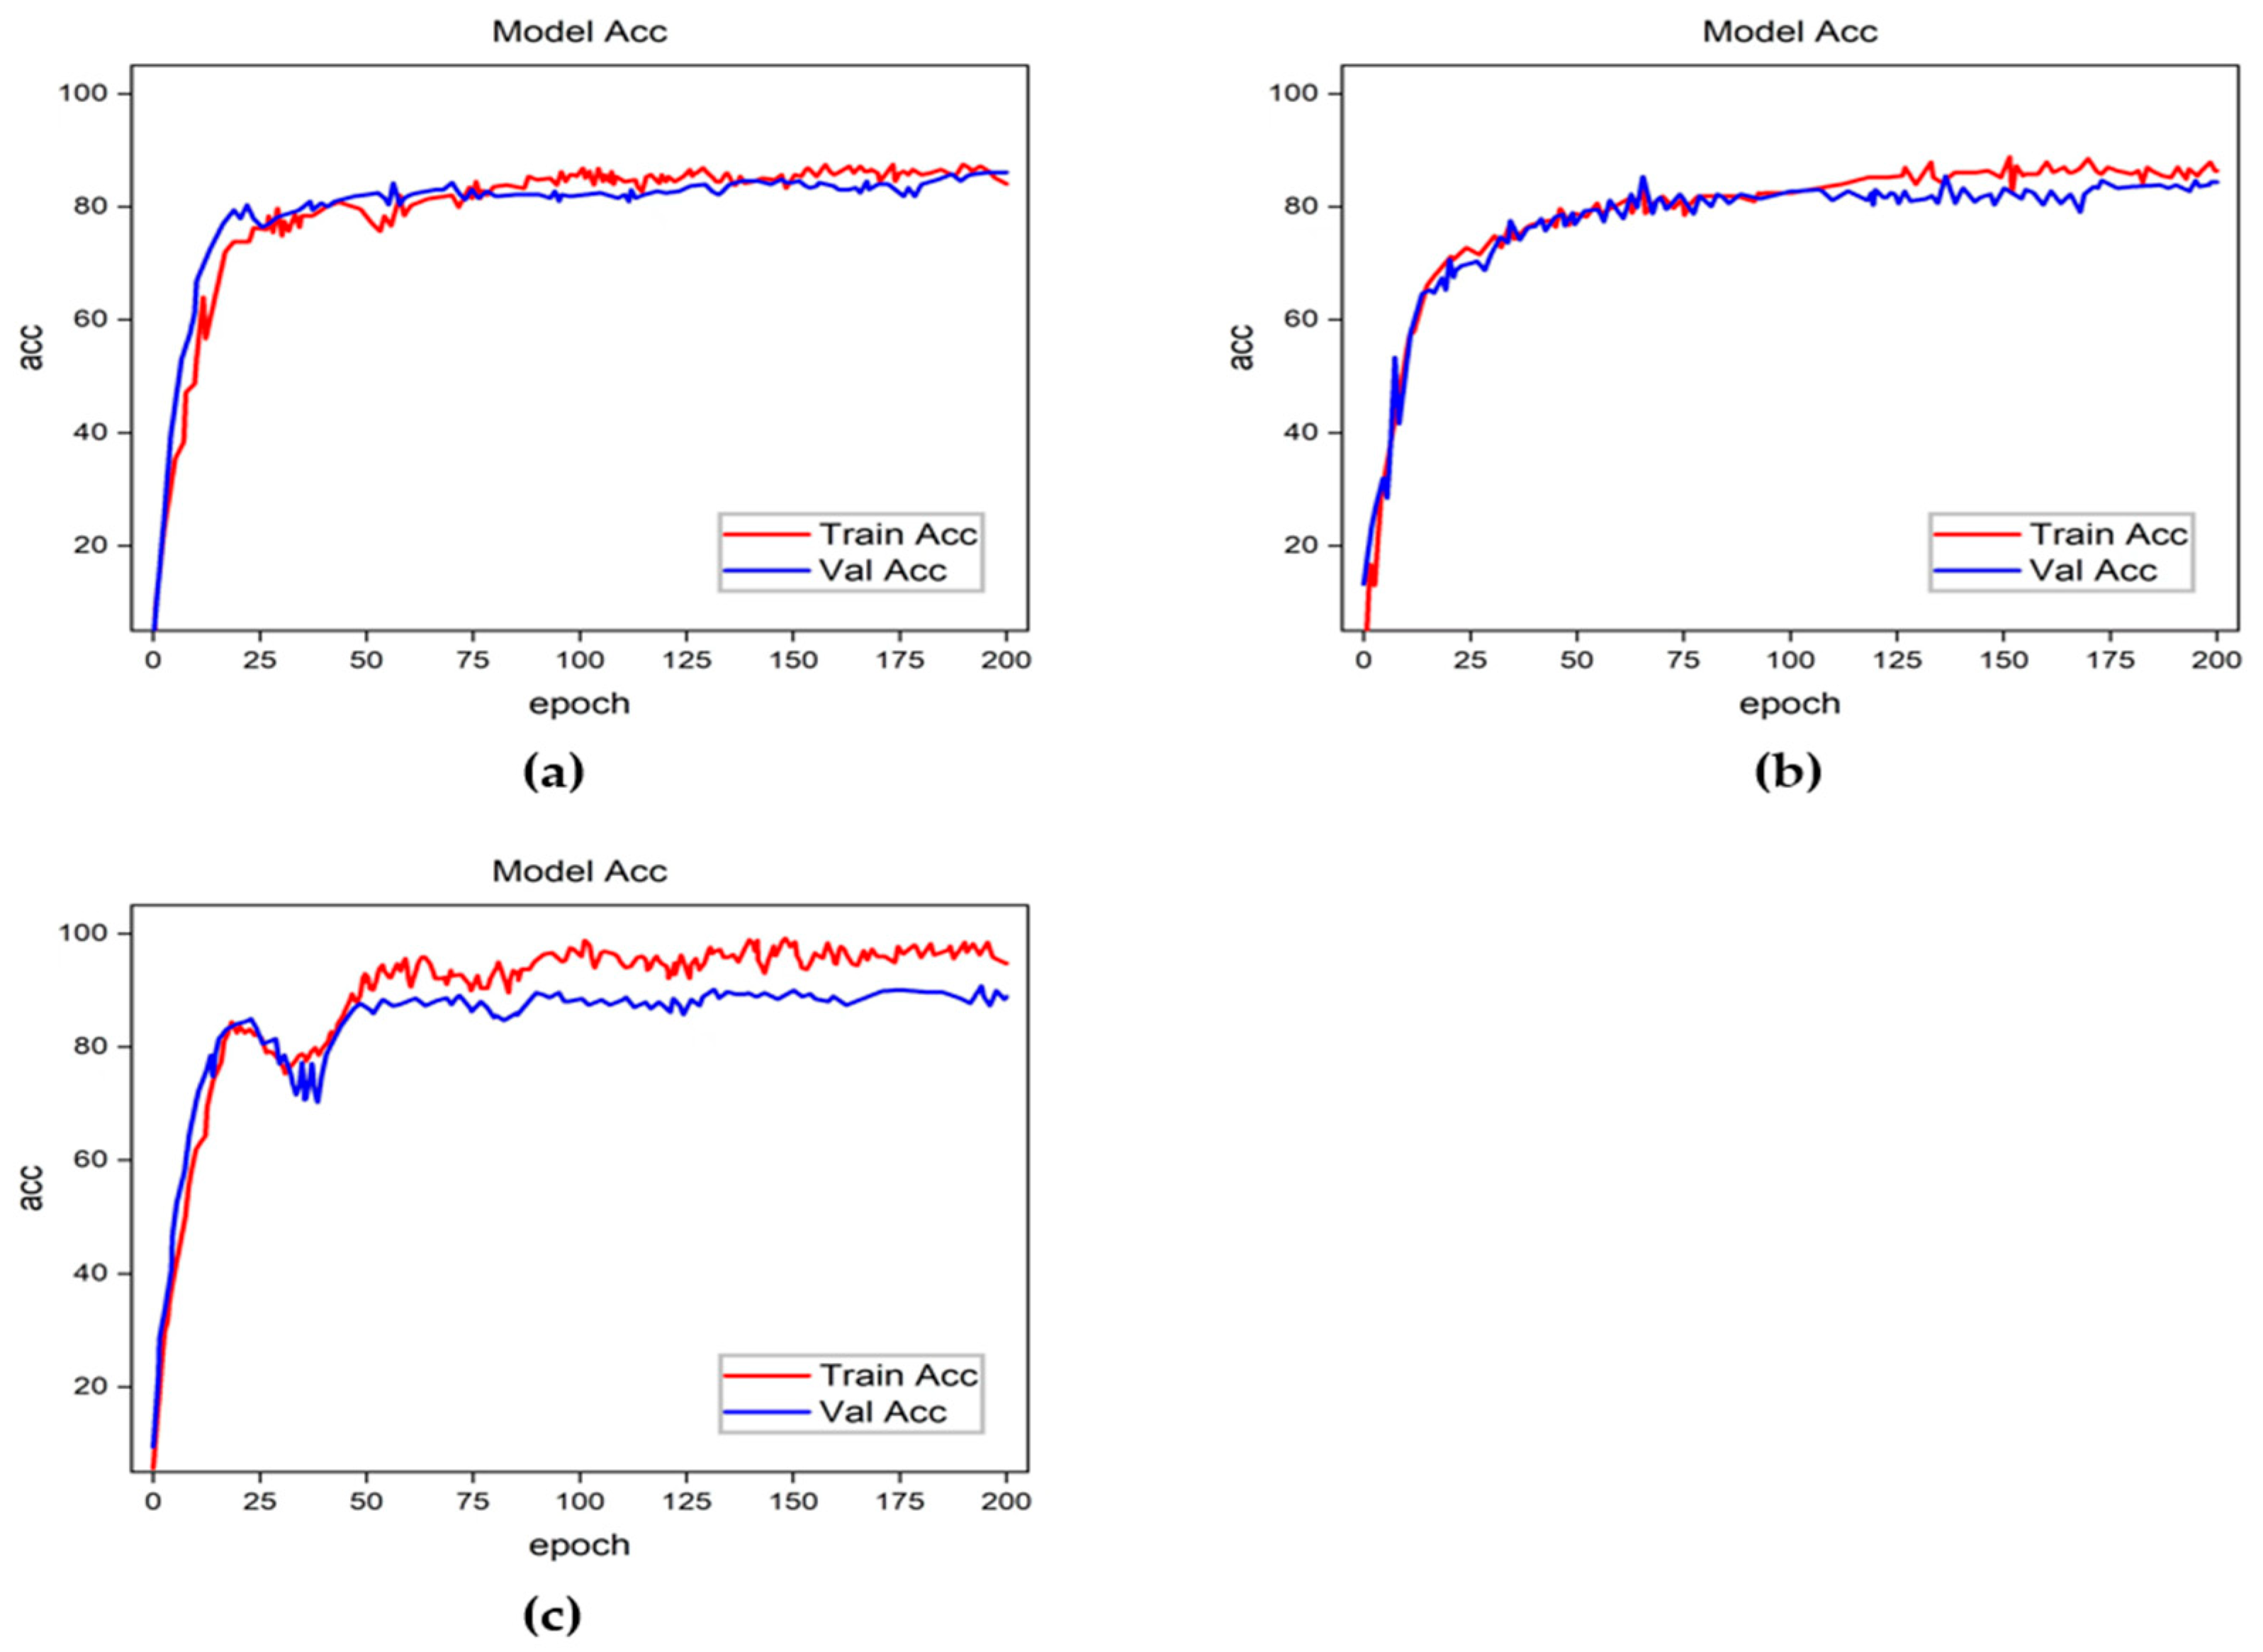
4.2. Ablation Experiments

In order to ascertain the efficacy of this paper’s model for the enhancement of dermoscopic images, hair removal, and the utilisation of the focal loss function, ablation experiments were designed to determine whether these three methods should be employed. The experimental design is as follows:
  • Experiment 1: Using hair removal and focal loss without data enhancement;
  • Experiment 2: Using data enhancement and focal loss without hair removal;
  • Experiment 3: Using hair removal and data enhancement without focal loss;
  • Experiment 4: Using all elements.
Table 5 presents the overall mean accuracy, precision, recall, and F1-score for the four experiments. As can be seen from the table, all three methods contribute to the overall performance, with the metrics decreasing after removal. The greatest impact on the overall model is that of focal loss. The use of focal loss compared to not using it resulted in a 4.6% improvement in accuracy, a 6.1% improvement in F1-score, and a 5.3% improvement in precision. Among the aforementioned factors, data enhancement had the greatest impact on recall, with an improvement of 8.8%. The results of the ablation experiments demonstrate that the combination of data enhancement, hair removal, and the use of the focal loss function can effectively improve the overall classification performance of the model.

5. Conclusions

This paper proposes a unique multiclassification model for dermatological images based on Inception-v2 and the focal loss function. The model is developed by comparing two different loss functions, NNLLoss and focal loss, and is designed to enhance the classification of dermatological images. The results demonstrate that focal loss enhances the functionality of the model in the case of an uneven dataset distribution. Furthermore, the use of data augmentation is shown to balance the dataset in such cases, while hair removal improves detection and classification. Finally, ablation experiments demonstrate the contribution of each module to the overall model performance. The results show that under the training of the proposed method, the proposed model is able to effectively classify seven types of dermatological images with a peak accuracy of 91.42% and an average accuracy of 89.04%, which provides a good classification performance and can provide important support to dermatologists and health professionals in diagnosing dermatological diseases.
It should be noted, however, that the dataset used in this paper is the publicly available dataset ISIC 2019. This dataset contains a greater number of images of light-coloured skin and is finite and unbalanced. In subsequent research, we plan to explore further how these limitations of the ISIC 2019 dataset may restrict the performance of our model across individuals with different skin tones and types. We recognise that in order to enhance the generalisation capability of our model, it is necessary to consider a more diverse dataset. Therefore, we intend to expand the dataset to include a wider range of skin types in order to more comprehensively evaluate and improve the performance of our model.
In the future, we aspire to evolve the model into a comprehensive system or a user-friendly mini programme that accommodates the input of suspected pathological images. The model will then analyse these images to determine the type and likelihood of skin diseases. This innovative system has the potential to greatly aid dermatologists in their auxiliary diagnostic processes and facilitate the remote diagnosis of skin diseases on telemedicine platforms. Furthermore, it will be necessary for more professionals to work together to transform the network model into a powerful tool in the hands of real clinicians.

Author Contributions

Conceptualization, S.Z., Z.L. and X.Y.; methodology, S.Z., Z.L. and X.Y.; data curation, S.Z.; formal analysis, S.Z.; writing—original draft preparation, S.Z.; writing—review and editing, Z.L., X.Y., K.S. and J.W. All authors have read and agreed to the published version of the manuscript.

Funding

This research received no external funding.

Institutional Review Board Statement

Not applicable.

Informed Consent Statement

Informed consent was obtained from all subjects involved in the study.

Data Availability Statement

The original contributions presented in the study are included in the article, further inquiries can be directed to the corresponding author.

Conflicts of Interest

The authors declare no conflicts of interest.

References

  1. Keerthana, D.; Venugopal, V.; Nath, M.K.; Mishra, M. Hybrid convolutional neural networks with SVM classifier for classification of skin cancer. Biomed. Eng. Adv. 2023, 5, 100069. [Google Scholar] [CrossRef]
  2. Arnold, M.; Singh, D.; Laversanne, M.; Vignat, J.; Vaccarella, S.; Meheus, F.; Cust, A.E.; de Vries, E.; Whiteman, D.C.; Bray, F. Global Burden of Cutaneous Melanoma in 2020 and Projections to 2040. JAMA Dermatol. 2022, 158, 495–503. [Google Scholar] [CrossRef] [PubMed]
  3. Myronenko, A. 3D MRI brain tumor segmentation using autoencoder regularization. In International MICCAI Brainlesion Workshop; Springer International Publishing: Berlin/Heidelberg, Germany, 2018; Volume 3. [Google Scholar]
  4. Qing, L.; Wei, W.; Zijun, M.; Haixia, X. A dermatoscope image classification method based on FL-ResNet50. Adv. Lasers Optoelectron. 2020, 57, 224–232. [Google Scholar] [CrossRef]
  5. Piccialli, F.; Di Somma, V.; Giampaolo, F.; Cuomo, S.; Fortino, G. A survey on deep learning in medicine: Why, how and when? Inf. Fusion 2021, 66, 111–137. [Google Scholar] [CrossRef]
  6. Razmjooy, N.; Ashourian, M.; Karimifard, M.; Estrela, V.V.; Loschi, H.J.; Nascimento, D.D.; França, R.P.; Vishnevski, M. Computeraided diagnosis of skin cancer: A review. Curr. Med. Imaging 2020, 16, 781–793. [Google Scholar] [CrossRef]
  7. Naeem, A.; Farooq, M.S.; Khelifi, A.; Abid, A. Malignant melanoma classification using deep learning:Datasets, performance measurements, challenges and opportunities. IEEE Access 2020, 8, 110575–110597. [Google Scholar] [CrossRef]
  8. Yuan, Y.; Chao, M.; Lo, Y.C. Automatic Skin Lesion Segmentation Using Deep Fully Convolutional Networks with Jaccard Distance. IEEE Trans. Med. Imaging 2017, 36, 1876–1886. [Google Scholar] [CrossRef]
  9. Naeem, A.; Anees, T.; Naqvi, R.A.; Loh, W.-K. A comprehensive analysis of recent deep and federated-learning-based methodologies for brain tumor diagnosis. J. Pers. Med. 2022, 12, 275. [Google Scholar] [CrossRef]
  10. Duggani, K.; Nath, M.K. A technical review report on deep learning approach for skin cancer detection and segmentation. Data Anal. Manag. Proc. ICDAM 2021, 54, 87–99. [Google Scholar]
  11. Ronneberger, O.; Fischer, P.; Brox, T. U-net: Convolutional networks for biomedical image segmentation. In International Conference on Medical Image Computing and Computer-Assisted Intervention; Springer: Cham, Switzerland, 2015; pp. 234–241. [Google Scholar]
  12. Celebi, M.E.; Kingravi, H.A.; Uddin, B.; Iyatomi, H.; Aslandogan, Y.A.; Stoecker, W.V.; Moss, R.H. A methodological approach to the classification of dermoscopy images. Comput. Med. Imaging Graph. 2007, 31, 362–373. [Google Scholar] [CrossRef]
  13. Malik, H.; Anees, T.; Din, M.; Ahmad, N. CDC_Net: Multi-classification convolutional neural network model for detection of COVID-19, pneumothorax, pneumonia, lung Cancer, and tuberculosis using chest X-rays. Multimed. Tools Appl. 2022, 82, 13855–13880. [Google Scholar] [CrossRef] [PubMed]
  14. Szegedy, C.; Vanhoucke, V.; Ioffe, S.; Shlens, J.; Wojna, Z. Rethinking the inception architecture for computer vision. In Proceedings of the IEEE Conference on Computer Vision and Pattern Recognition, Las Vegas, NV, USA, 27–30 June 2016; pp. 2818–2826. [Google Scholar]
  15. Ali, M.S.; Miah, S.; Haque, J.; Rahman, M.; Islam, K. An enhanced technique of skin cancer classification using deep convolutional neural network with transfer learning models. Mach. Learn. Appl. 2021, 5, 100036. [Google Scholar] [CrossRef]
  16. Saba, T.; Khan, M.A.; Rehman, A.; Marie-Sainte, S.L. Region extraction and classification of skin cancer: A heterogeneous framework of deep CNN features fusion and reduction. J. Med. Syst. 2019, 43, 289. [Google Scholar] [CrossRef] [PubMed]
  17. Ahmad, N.; Anees, T.; Ahmed, K.T.; Naqvi, R.A.; Ahmad, S.; Whangbo, T. Deep learned vectors’ formation using auto-correlation, scaling, and derivations with CNN for complex and huge image retrieval. Complex Intell. Syst. 2022, 4, 1–23. [Google Scholar]
  18. Chadaga, K.; Prabhu, S.; Sampathila, N.; Chadaga, R.; Sengupta, S. Predicting cervical cancer biopsy results using demographic and epidemiological parameters: A custom stacked ensemble machine learning approach. Cogent Eng. 2022, 9, 2143040. [Google Scholar] [CrossRef]
  19. Khanna, V.V.; Chadaga, K.; Sampathila, N.; Prabhu, S.; Bhandage, V.; Hegde, G.K. A Distinctive Explainable Machine Learning Framework for Detection of Polycystic Ovary Syndrome. Appl. Syst. Innov. 2023, 6, 32. [Google Scholar] [CrossRef]
  20. He, X.Y.; Han, Z.Y.; Wei, B.Z. Identification and classification of pigmented skin diseases based on deep convolutional neural network. Comput. Appl. 2018, 38, 3236–3240. [Google Scholar]
  21. Garnavi, R.; Aldeen, M.; Bailey, J. Computer-Aided Diagnosis of Melanoma Using Borderand Wavelet-Based Texture Analysis. IEEE Trans. Inf. Technol. Biomed. 2012, 16, 1239–1252. [Google Scholar] [CrossRef]
  22. Alfed, N.; Khelifi, F. Bagged textural and color features for melanoma skin cancer detection in dermoscopic and standard images. Expert Syst. Appl. 2017, 90, 101–110. [Google Scholar] [CrossRef]
  23. Ganster, H.; Pinz, P.; Rohrer, R.; Wildling, E.; Binder, M.; Kittler, H. Automated melanoma recognition. IEEE Trans. Med. Imaging 2001, 20, 233–239. [Google Scholar] [CrossRef]
  24. Bajwa, M.N.; Muta, K.; Malik, M.I.; Siddiqui, S.A.; Braun, S.A.; Homey, B.; Dengel, A.; Ahmed, S. Computer-aided diagnosis of skin diseases using deep neural networks. Appl. Sci. 2020, 10, 2488. [Google Scholar] [CrossRef]
  25. Nugroho, A.A.; Slamet, I.; Sugiyanto, S. Skins cancer identification system of HAMl0000 skin cancer dataset using convolutional neural network. AIP Conf. Proc. 2019, 2202, 020039. [Google Scholar]
  26. Sadeghi, M.; Lee, T.K.; McLean, D.; Lui, H.; Atkins, M.S. Detection and Analysis of Irregular Streaks in Dermoscopic Images of Skin Lesions. IEEE Trans. Med. Imaging 2013, 32, 849–861. [Google Scholar] [CrossRef] [PubMed]
  27. Adegun, A.A.; Viriri, S. Deep learning-based system for automatic melanom a detection. IEEE Access 2019, 8, 7160–7172. [Google Scholar] [CrossRef]
  28. Moldovan, D. Transfer learning based method for two-step skin cancer images classification. In Proceedings of the 2019 E-Health and Bioengineering Conference (EHB), Iasi, Romania, 21–23 November 2019; pp. 1–4. [Google Scholar]
  29. Çevik, E.; Zengin, K. Classification of skin lesions in dermatoscopic images with deep convolution network. Avrupa Bilim Teknol. Derg. 2019, 6, 309–318. [Google Scholar] [CrossRef]
  30. Hasan, M.; Barman, S.D.; Islam, S.; Reza, A.W. Skin cancer detection using convolutional neural network. In Proceedings of the 2019 5th International Conference on Computing and Artificial Intelligence, Bali, Indonesia, 19–22 April 2019; pp. 254–258. [Google Scholar]
  31. Gilani, Q.; Syed, S.T.; Umair, M.; Marques, O. Skin Cancer Classification Using Deep Spiking Neural Network. J. Digit. Imaging 2023, 36, 1137–1147. [Google Scholar]
  32. Kousis, I.; Perikos, I.; Hatzilygeroudis, I.; Virvou, M. Deep learning methods for accurate skin cancer recognition and mobile application. Electronics 2022, 11, 1294. [Google Scholar] [CrossRef]
  33. Ranpreet, K.; GholamHosseini, H.; Sinha, R.; Lindén, M. Melanoma classification using a novel deep convolutional neural network with dermoscopic images. Sensors 2022, 22, 1134. [Google Scholar] [CrossRef]
  34. Alwakid, G.; Gouda, W.; Humayun, M.; Sama, N.U. Melanoma Detection Using Deep Learning-Based Classifications. Healthcare 2022, 10, 2481. [Google Scholar] [CrossRef]
  35. Ali, K.; Shaikh, Z.A.; Khan, A.A.; Laghari, A.A. Multiclass skin cancer classification using EfficientNets—A first step towards preventing skin cancer. Neurosci. Inform. 2022, 2, 100034. [Google Scholar] [CrossRef]
  36. Majtner, T.; Bajić, B.; Yildirim, S.; Hardeberg, J.Y.; Lindblad, J.; Sladoje, N. Ensemble of convolutional neural networks fordermoscopic images classification. arXiv 2018, arXiv:1808.05071. [Google Scholar]
  37. Ioffe, S.; Szegedy, C. Batch normalization accelerating deep network training by reducing internal covariate shift. arXiv 2015, arXiv:1502.03167. [Google Scholar]
  38. Peng, S.; Jiang, H.; Wang, H.; Alwageed, H.; Zhou, Y.; Sebdani, M.M.; Yao, Y.D. Modulation classification based on signal constellation diagrams and deep learning. IEEE Trans. Neural Netw. Learn. Syst. 2019, 30, 718–727. [Google Scholar] [CrossRef] [PubMed]
  39. Lin, T.Y.; Goyal, P.; Girshick, R.; He, K.; Dollár, P. Focal loss for dense object detection. IEEE Trans. Pattern Anal. Mach. Intell. 2020, 42, 318–327. [Google Scholar] [CrossRef]
  40. Malik, H.; Farooq, M.S.; Khelifi, A.; Abid, A.; Qureshi, J.N.; Hussain, M. A comparison of transfer learning performance versushealth experts in disease diagnosis from medical imaging. IEEE Access 2020, 8, 139367–139386. [Google Scholar] [CrossRef]
  41. Mijwil, M.M. Skin cancer disease images classification using deep learning solutions. Multimed. Tools Appl. 2021, 80, 26255–26271. [Google Scholar] [CrossRef]
  42. Indraswari, R.; Rokhana, R.; Herulambang, W. Melanoma image classification based on MobileNetV2 network. Procedia Comput. Sci. 2022, 197, 198–207. [Google Scholar] [CrossRef]
  43. Khan, A.M.; Akram, T.; Zhang, Y.-D.; Sharif, M. Attributes based skin lesion detection and recognition: A mask RCNN andtransfer learning-based deep learning framework. Pattern Recognit. Lett. 2021, 143, 58–66. [Google Scholar] [CrossRef]
  44. Zhou, Y.; Koyuncu, C.; Lu, C.; Grobholz, R.; Katz, I.; Madabhushi, A.; Janowczyk, A. Multi-site cross-organ calibrated deeplearning (MuSClD): Automated diagnosis of non-melanoma skin cancer. Med. Image Anal. 2023, 84, 102702. [Google Scholar] [CrossRef]
Figure 1. General flowchart of the proposed method.
Applsci 14 10197 g001
Figure 2. Diagram of the original Inception model.
Applsci 14 10197 g002
Figure 3. Inception-v2 model diagram.
Applsci 14 10197 g003
Figure 4. Subplot of the focal loss calculation equation.
Applsci 14 10197 g004
Figure 5. Examples of seven dermatologic images.
Applsci 14 10197 g005
Figure 6. Example of image enhancement. (a) Original image in the base training set; (b) image after data enhancement.
Applsci 14 10197 g006
Figure 7. Distribution of dataset after image enhancement.
Applsci 14 10197 g007
Figure 8. Example of hair removal.
Applsci 14 10197 g008
Figure 9. Confusion matrix plots and ROC curves for classification results obtained using the focal loss function. (a,b) Resnet-50, (c,d) Densenet, and (e,f) Inception-v2.
Applsci 14 10197 g009aApplsci 14 10197 g009b
Figure 10. Accuracy curves for classification results obtained using the focal loss function. (a) Resnet-50, (b) Densenet, and (c) Inception-v2.
Applsci 14 10197 g010
Figure 11. Loss curves for classification results obtained using the focal loss function. (a) Resnet-50, (b) Densenet, and (c) Inception-v2.
Applsci 14 10197 g011
Figure 12. Histogram of classification results based on focal loss. (a) Resnet-50, (b) Densenet, and (c) Inception-v2.
Applsci 14 10197 g012aApplsci 14 10197 g012b
Figure 13. Grad-CAM heat maps of dermatological images for the network proposed in this paper.
Applsci 14 10197 g013
Table 1. Seven lesion types and distribution in the dataset.
Skin Disease NameDescriptiveNumber of PicturesPercentage
MELMelanoma can be treated with surgical removal in early stages452317.85%
NVsThere are many different variants of melanocytic nevi1287650.83%
BKLThey have similar characteristics to melanoma262510.36%
AKActinic keratosis and carcinoma caused by excessive sun exposure8683.43%
BCCBasal cell carcinoma is a common epithelial skin cancer332413.12%
VASCsVascular skin lesions often look red or purple, with clear boundaries2541.01%
DFDermatofibroma is a proliferation of fibrous tissue2400.95%
Table 2. Classification results obtained using the NNLLoss loss function.
MethodClassAccuracyPrecisionRecallF1-Score
Resnet-50MEL0.75770.82830.81220.8168
NVs0.81330.67600.75680.7230
BKL0.76500.81230.74340.7721
AK0.78770.88650.88210.8822
BCC0.81240.72560.79770.7531
VASCs0.83650.80060.91130.8612
DF0.84280.65770.83450.7455
DensenetMEL0.82750.85030.82900.8345
NVs0.80140.75660.78030.7753
BKL0.81690.81770.85540.8441
AK0.80240.90590.86240.8824
BCC0.82990.71340.78050.7306
VASCs0.82540.81780.79420.8081
DF0.89990.85020.81770.8355
Inception-v2MEL0.81050.88020.80530.8237
NVs0.85210.90110.78250.8460
BKL0.73460.81520.88210.8513
AK0.88290.93260.87650.9003
BCC0.81990.71440.75380.7325
VASCs0.82140.85270.81100.8211
DF0.87020.88600.87230.8724
Table 3. Classification results obtained using the focal loss function. Significant values are in [bold].
MethodClassAccuracyPrecisionRecallF1-Score
Resnet-50MEL0.76020.84770.82230.8350
NVs0.81340.69520.73410.7146
BKL0.77980.82880.79550.8121
AK0.77420.87920.90410.8916
BCC0.80760.74660.81970.7831
VASCs0.82350.81080.90230.8565
DF0.85420.63550.83450.7350
DensenetMEL0.82720.87660.81190.8442
NVs0.79610.79780.77830.7880
BKL0.80130.84020.86560.8529
AK0.81050.91840.87690.8976
BCC0.81170.68750.80020.7438
VASCs0.84320.83330.80530.8193
DF0.90880.86340.82210.8427
Inception-v2MEL0.83310.87570.81690.8463
NVs0.87610.91040.79930.8548
BKL0.79680.82640.89760.8620
AK0.90140.94240.89010.9162
BCC0.82030.76430.81050.7874
VASCs0.86610.86450.82630.8454
DF0.91420.93250.86580.8991
Table 4. Comparison with existing models. Significant values are in [bold].
ModelDatasetsAccuracyPrecisionRecallF1-Score
2D superpixels + RCNN [40]HAM-100000.85500.83400.84500.8530
ResNeXt101 [41]ISIC-20190.88500.87400.88100.8830
MobileNetV2 [42]ISIC-20190.85300.78900.8633
VGG19 [43]ISIC-2019,
Derm-IS
0.88570.90700.86660.8765
ConvNet [44]ISIC-2018,
Derm-IS
0.86900.86140.8747
OursISIC-20190.89040.87370.90150.8876
Table 5. Results of ablation experiments.
ModelData
Enhancement
Hair
Removal
Focal LossAccuracyPrecisionRecallF1-Score
Exp.1×0.87020.84220.81350.8304
Exp.2×0.86510.83310.82900.8315
Exp.3×0.84330.82090.83110.8260
Exp.40.89040.87370.90150.8876
Disclaimer/Publisher’s Note: The statements, opinions and data contained in all publications are solely those of the individual author(s) and contributor(s) and not of MDPI and/or the editor(s). MDPI and/or the editor(s) disclaim responsibility for any injury to people or property resulting from any ideas, methods, instructions or products referred to in the content.

