Article

Experimental Investigations of Seismic Performance of Girder–Integral Abutment–Reinforced-Concrete Pile–Soil Systems

1
College of Civil Engineering, Fuzhou University, Fuzhou 350108, China
2
Fujian Provincial Key Laboratory on Multi-Disasters Prevention and Mitigation in Civil Engineering, Fuzhou University, Fuzhou 350108, China
3
Joint International Research Laboratory of Deterioration and Control of Coastal and Marine Infrastructures and Materials, College of Civil Engineering, Fuzhou University, Fuzhou 350108, China
4
Department of Architecture, Roma Tre University, 00153 Rome, Italy
*
Author to whom correspondence should be addressed.
Appl. Sci. 2024, 14(22), 10166; https://doi.org/10.3390/app142210166
Submission received: 1 October 2024 / Revised: 19 October 2024 / Accepted: 21 October 2024 / Published: 6 November 2024
(This article belongs to the Special Issue Structural Analysis and Seismic Resilience in Civil Engineering)

Abstract

:
Integral abutment bridges (IABs) have been widely applied in bridge engineering because of their excellent seismic performance, long service life, and low maintenance cost. The superstructure and substructure of an IAB are integrally connected to reduce the possibility of collapse or girders falling during an earthquake. The soil behind the abutment can provide a damping effect to reduce the deformation of the structure under a seismic load. Girders have not been considered in some of the existing published experimental tests on integral abutment–reinforced-concrete (RC) pile (IAP)–soil systems, which may not accurately represent real conditions. A pseudo-static low-cycle test on a girder–integral abutment–RC pile (GIAP)–soil system was conducted for an IAB in China. The experiment’s results for the GIAP specimen were compared with those of the IAP specimen, including the failure mode, hysteretic curve, energy dissipation capacity, skeleton curve, stiffness degradation, and displacement ductility. The test results indicate that the failure modes of both specimens were different. For the IAP specimen, the pile cracked at a displacement of +2 mm, while the abutment did not crack during the test. For the GIAP specimen, the pile cracked at a displacement of −8 mm, and the abutment cracked at a displacement of 50 mm. The failure mode of the specimen changed from severe damage to the pile top under a small displacement to damage to both the abutment and pile top under a large displacement. Compared with the IAP specimen, the initial stiffness under positive horizontal displacement (39.2%), residual force accumulation (22.6%), residual deformation (12.6%), range of the elastoplastic stage in the skeleton curve, and stiffness degradation of the GIAP specimen were smaller; however, the initial stiffness under negative horizontal displacement (112.6%), displacement ductility coefficient (67.2%), average equivalent viscous damping ratio (30.8%), yield load (20.4%), ultimate load (7.8%), and range of the elastic stage in the skeleton curve of the GIAP specimen were larger. In summary, the seismic performance of the GIAP–soil system was better than that of the IAP–soil system. Therefore, to accurately reflect the seismic performance of GIAP–soil systems in IABs, it is suggested to consider the influence of the girder.

1. Introduction

Girders and abutments are integrally connected in integral abutment bridges (IABs) to eliminate expansion joints and bearings at the abutments [1,2,3,4]. IABs have been widely applied in bridge engineering because of their advantages of a smooth and comfortable driving experience, reduced noise, excellent overall integrity and durability, and minimal maintenance requirements [5,6,7]. Bridges can be damaged during earthquakes, leading to significant economic losses and risks to human safety. The seismic response of IABs can be reduced significantly because the superstructures of IABs are effectively constrained by the abutments, backfill, piles, and surrounding soil [8,9,10,11]. Under seismic loads, the substantial horizontal cyclic displacements of the girders in IABs can be transmitted to the abutments and the piles beneath them to create complex girder–abutment–pile–soil interactions [12,13,14]. The greater the stiffness of the abutments and piles, the greater their constraint on the horizontal cyclic displacement of the girders, and the larger the internal forces of the structure [15]. When the abutments and piles cannot sufficiently absorb the horizontal deformation, the abutments and piles may crack under small horizontal cyclic displacements [11,16,17].
Field monitoring measurements [18,19,20], finite element analyses [8,19,20,21,22,23,24,25,26,27,28], theoretical research [29,30,31,32], and experimental tests [33,34,35,36] have been used to study the seismic performance of IABs. In References [8,19,20,21,22,23,24,25,26,27,28,29,30,31,32], the seismic performance of IABs was investigated by considering the whole bridge with the soil–structure interactions. It has been found that under seismic loading the nonlinear effects and stress from the soil increase. In this case, the lateral constraint caused by the soil on the girder–abutment–pile system of an IAB increases because the abutment is constrained by the girder. As a result, the structural stiffness of an IAB increases, which could limit the horizontal deformation of the abutments and piles [8,20,21,22,28]. The stress at the girder–abutment connections and in the piles, as well as the pile displacement, significantly increase [23]. With an increase in the span length, the soil–structure interaction, horizontal deformation of abutments and piles, and seismic vulnerability of IABs increase under seismic loads [24]. The seismic performance of an IAB is significantly influenced by the relative stiffness between the girder and abutment [30]. With a decrease in the stiffness of the girder or an increase in the flexibility of the abutment, the restraint effect of the girder on the abutment and the stiffness of the IAB decrease, and the internal forces in the abutment increase [8,25]. The large displacement produced by the girder during an earthquake can easily be transferred to the substructure due to the rigid connection between the girder and abutment in an IAB. The seismic response of the piles is the largest among the different bridge components [19,31]. The maximum displacement and bending moment of the piles under seismic loads can be found at the abutment–pile connection [21,26], producing shear failure [22,32] and plastic rotation [27].
In summary, the bending moment (Ma) at the top of the abutment in IABs cannot be zero because of the constraint of the girder, as observed in analyses of whole IABs [21,23], and the seismic performance of an IAB is significantly influenced by the girder. The seismic performance of IAP–soil systems [33,34,35,36] have been experimentally analyzed using pseudo-static low-cycle tests without considering the girder. In these cases, the Ma is zero, which is different than the findings in the literature [21,23]. To address this gap in the literature, the influence of girders on IAP–soil systems, so-called GIAP–soil systems, should be considered to accurately reflect the actual boundary conditions of girder–abutment connections in IABs. Therefore, the seismic performance of a GIAP–soil system was analyzed.
The paper is organized as follows: Section 2 presents the design of the pseudo-static low-cycle test on the GIAP specimen–soil system based on an IAB; Section 3 discusses the main results of the GIAP specimen by comparing with the results of the IAP specimen without considering the girder; Section 4 summarizes the main conclusions obtained from this study. This paper aims to investigate the impact of the girder on the seismic performance of the girder–integral abutment–RC pile–soil system. The actual mechanical behavior of the system under seismic loading is obtained, and the failure modes, hysteretic characteristics, energy dissipation capacity, skeleton curve, displacement ductility, and stiffness degradation of the system are examined.

2. Methodology

The seismic performance of IAP–soil systems have been experimentally investigated in the literature [36], as illustrated in Figure 1a. The IAP specimen consisted of an abutment and an RC pile. The test setup consisted of a rigid steel container, sand, IAP specimen, and 250 kN MTS hydraulic actuator. The MTS hydraulic actuator was horizontally connected to the front surface of the abutment by a steel plate. Medium-density sand with a relative density of 53% was used. The sand arrangement behind and in front of the abutment was designed to replicate a real scenario, and sand was placed behind the abutment to simulate backfill, and there was no sand in front of the abutment. It can be observed that the top of the abutment of the IAP specimen, as shown in Figure 1a, was free, with an Ma of zero, which differs from the boundary condition at the abutment top in the analyses of the whole IABs, with an Ma of non-zero [21,23]. Therefore, a comparative experiment on the seismic performance of the GIAP–soil system was designed to consider the influence of the girder, as illustrated in Figure 1b. The GIAP specimen consisted of a girder, abutment, and RC pile. The test setup consisted of a rigid steel container, sand, a GIAP specimen, and 250 kN MTS hydraulic actuator. The MTS hydraulic actuator was horizontally connected to the front surface of the girder by a steel plate. The other experimental conditions of the IAP–soil system and GIAP–soil system were identical.

3. Experimental Tests
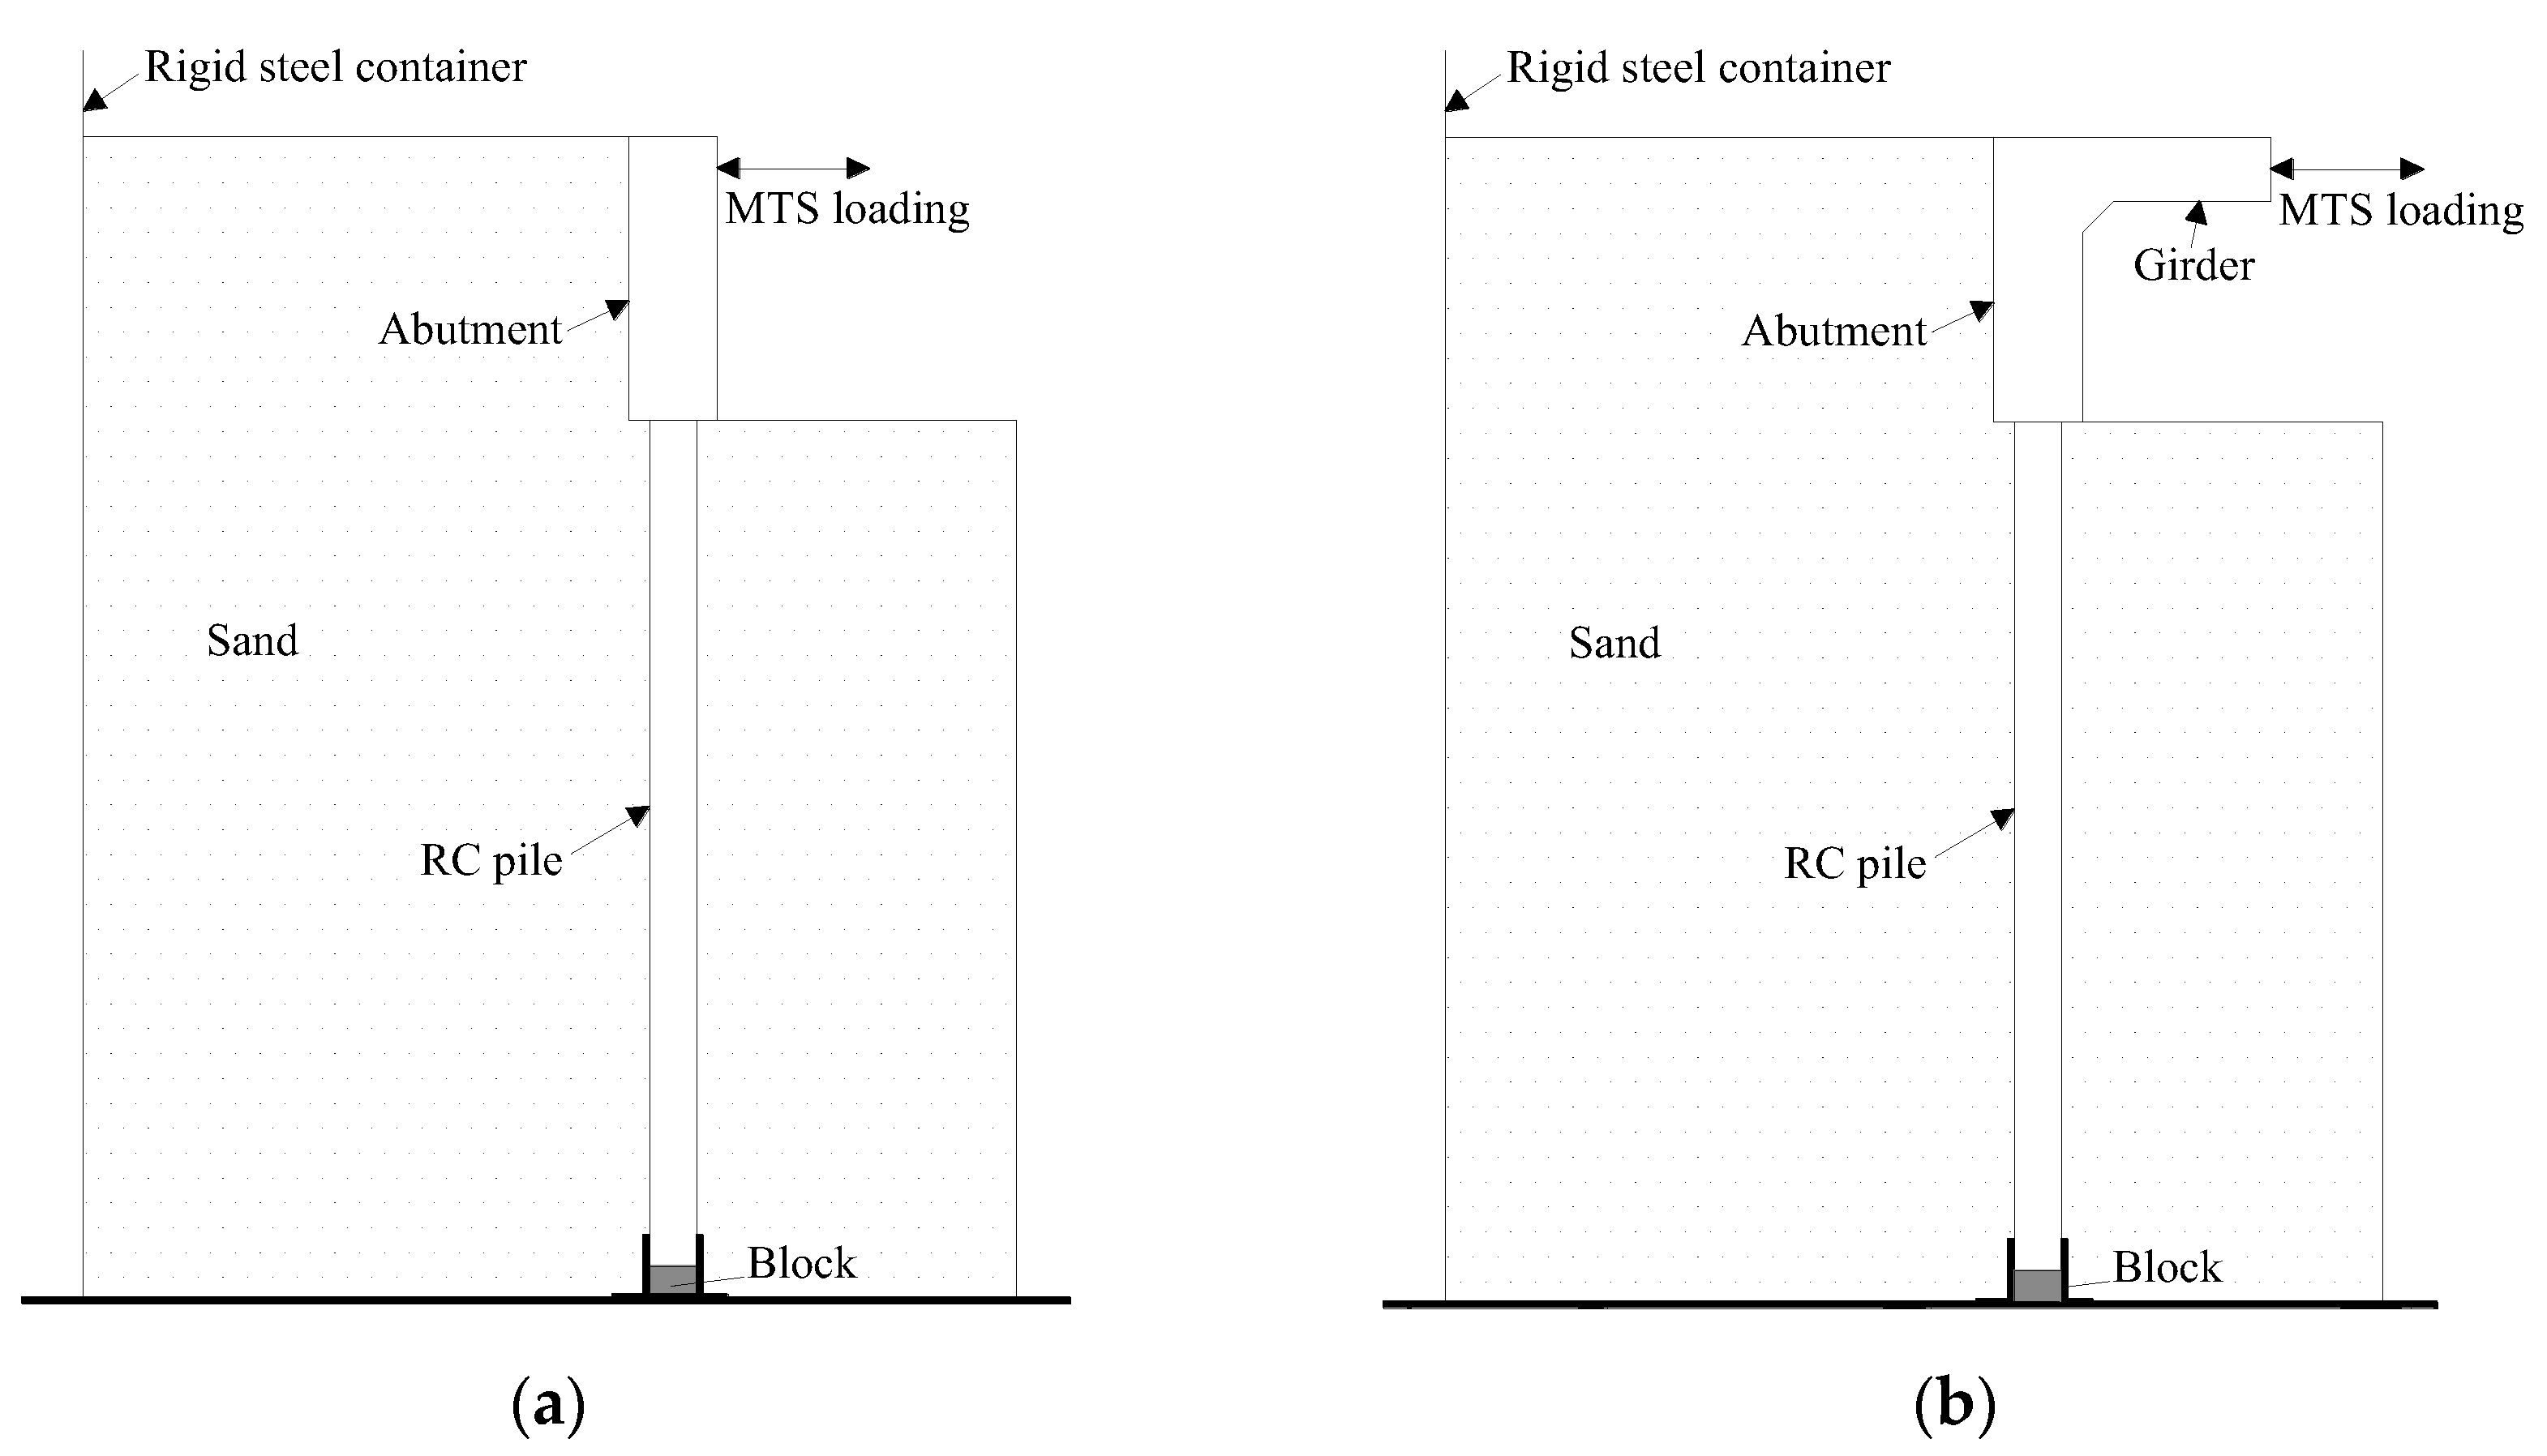
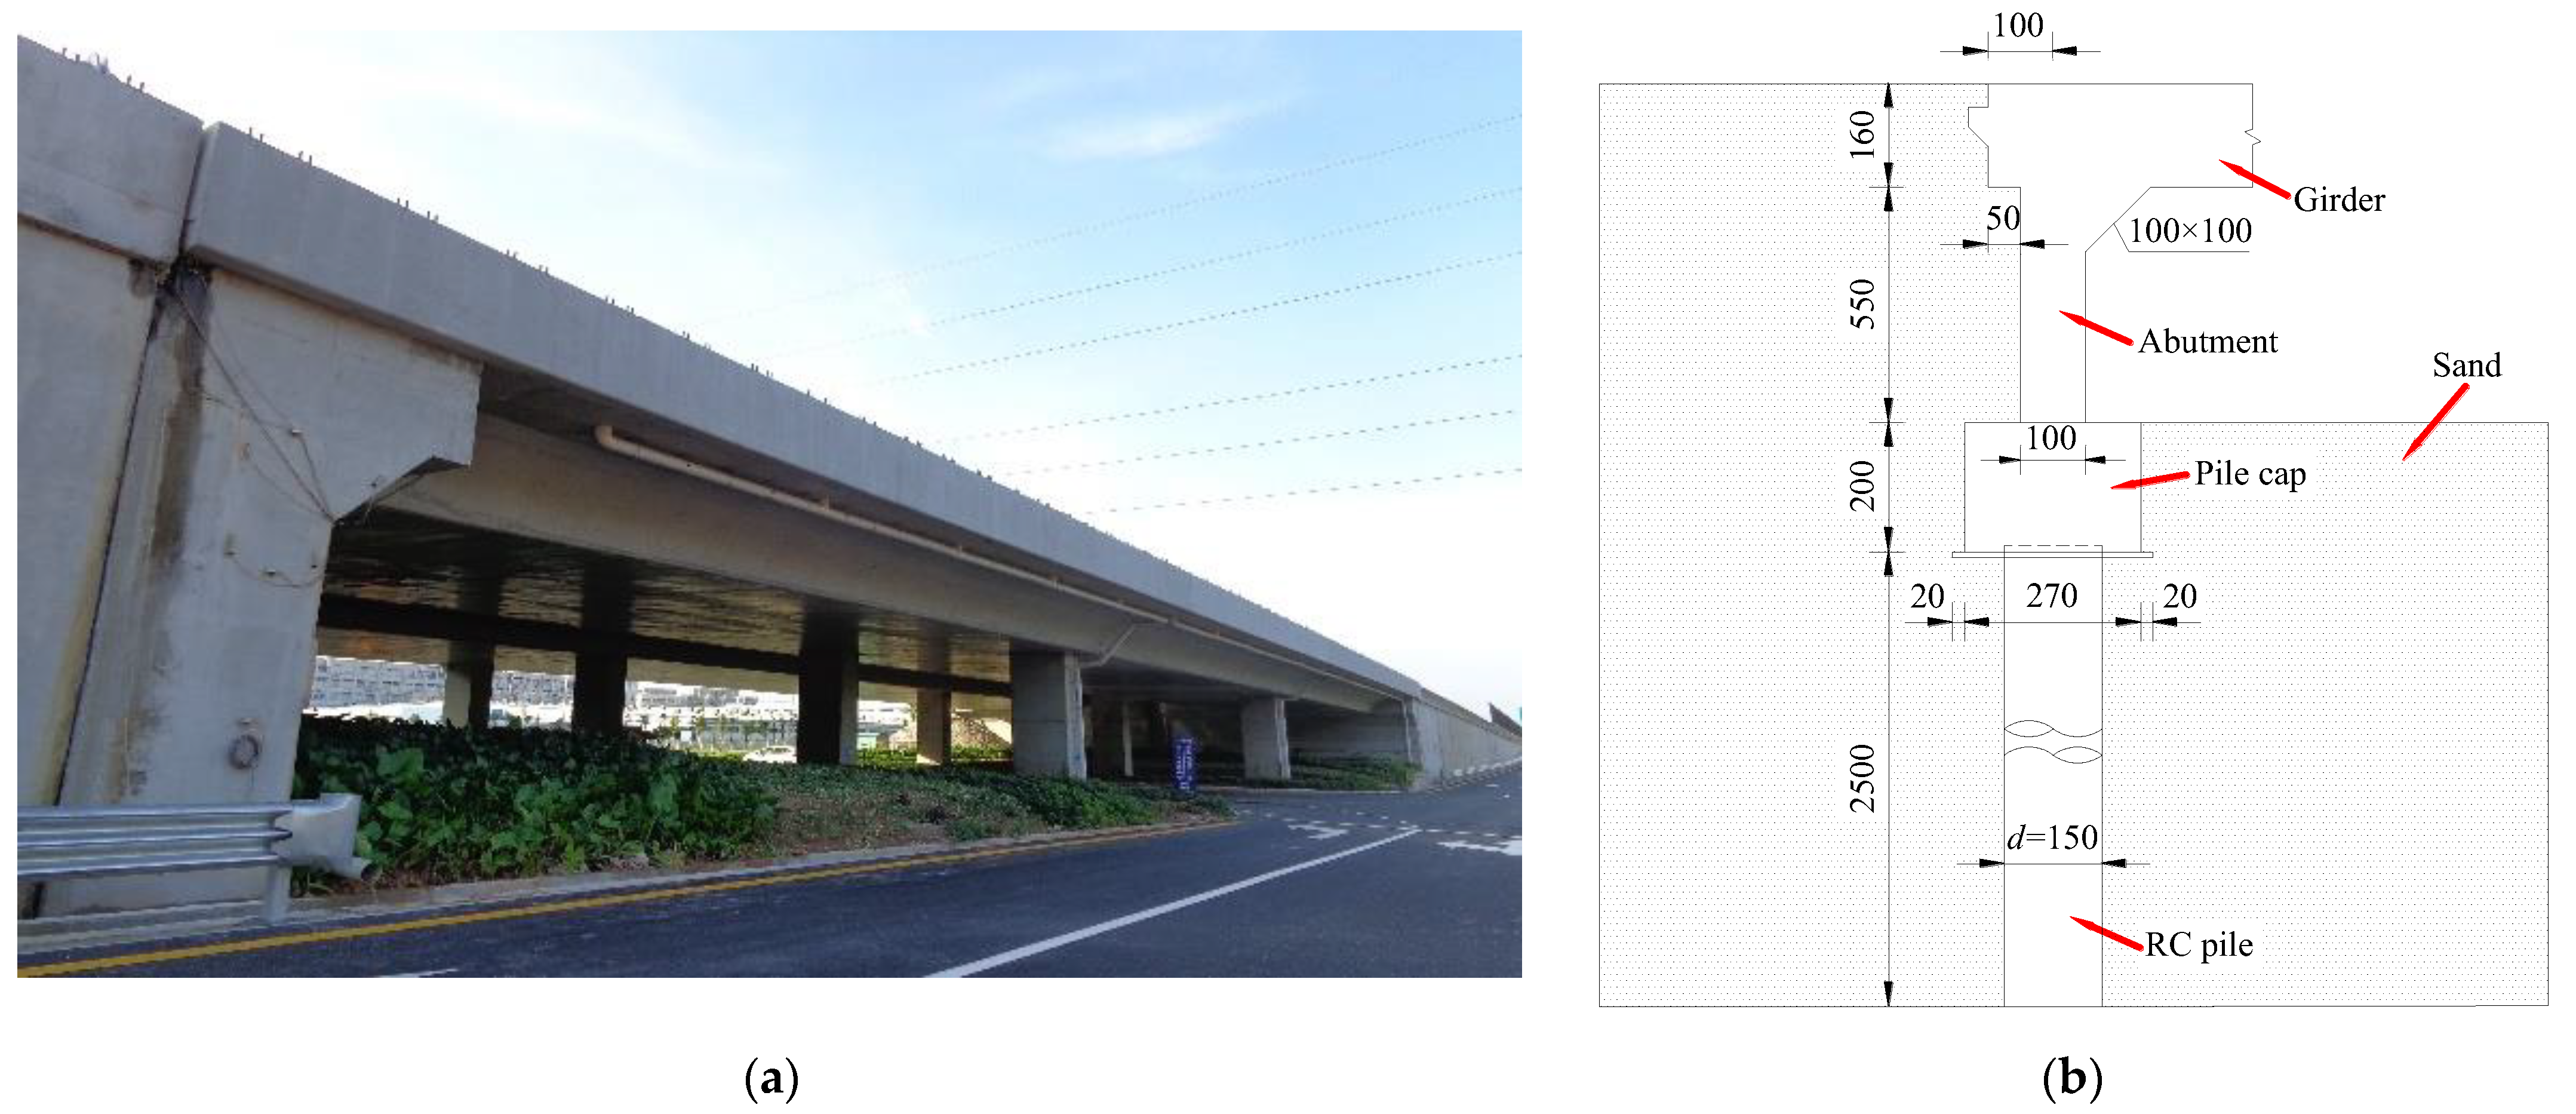
3.1. Case Study

A 3 × 30 m IAB in Shenzhen (China), shown in Figure 2 [37], was selected as the case study. The girder–integral abutment–RC pile represents the reference structure of this investigation. The main features of the bridge are given in Table 1. The concrete grade for the girder and abutments is C50 with a 50 MPa cube strength (fcu) and 3.45 × 10⁴ MPa Young’s modulus (Ec). The concrete grade for the piers is C40 with a 40 MPa fcu and 3.25 × 10⁴ MPa Ec. The concrete grade for the pile caps and piles is C30 with a 30 MPa fcu and 3.0 × 10⁴ MPa Ec.
Because of the spatial limitations of the laboratory, a specimen with a 1/10 scale ratio was designed and fabricated. Based on the law of similitude [38], the scale ratios of the gravity acceleration (Sg), elastic modulus (SE), stress (Sσ), strain (Sε), and density (Sρ) were 1/1; the length (SL) and displacement (Sd) were 1/10; and the moment of inertia (I) was (1/10)4.

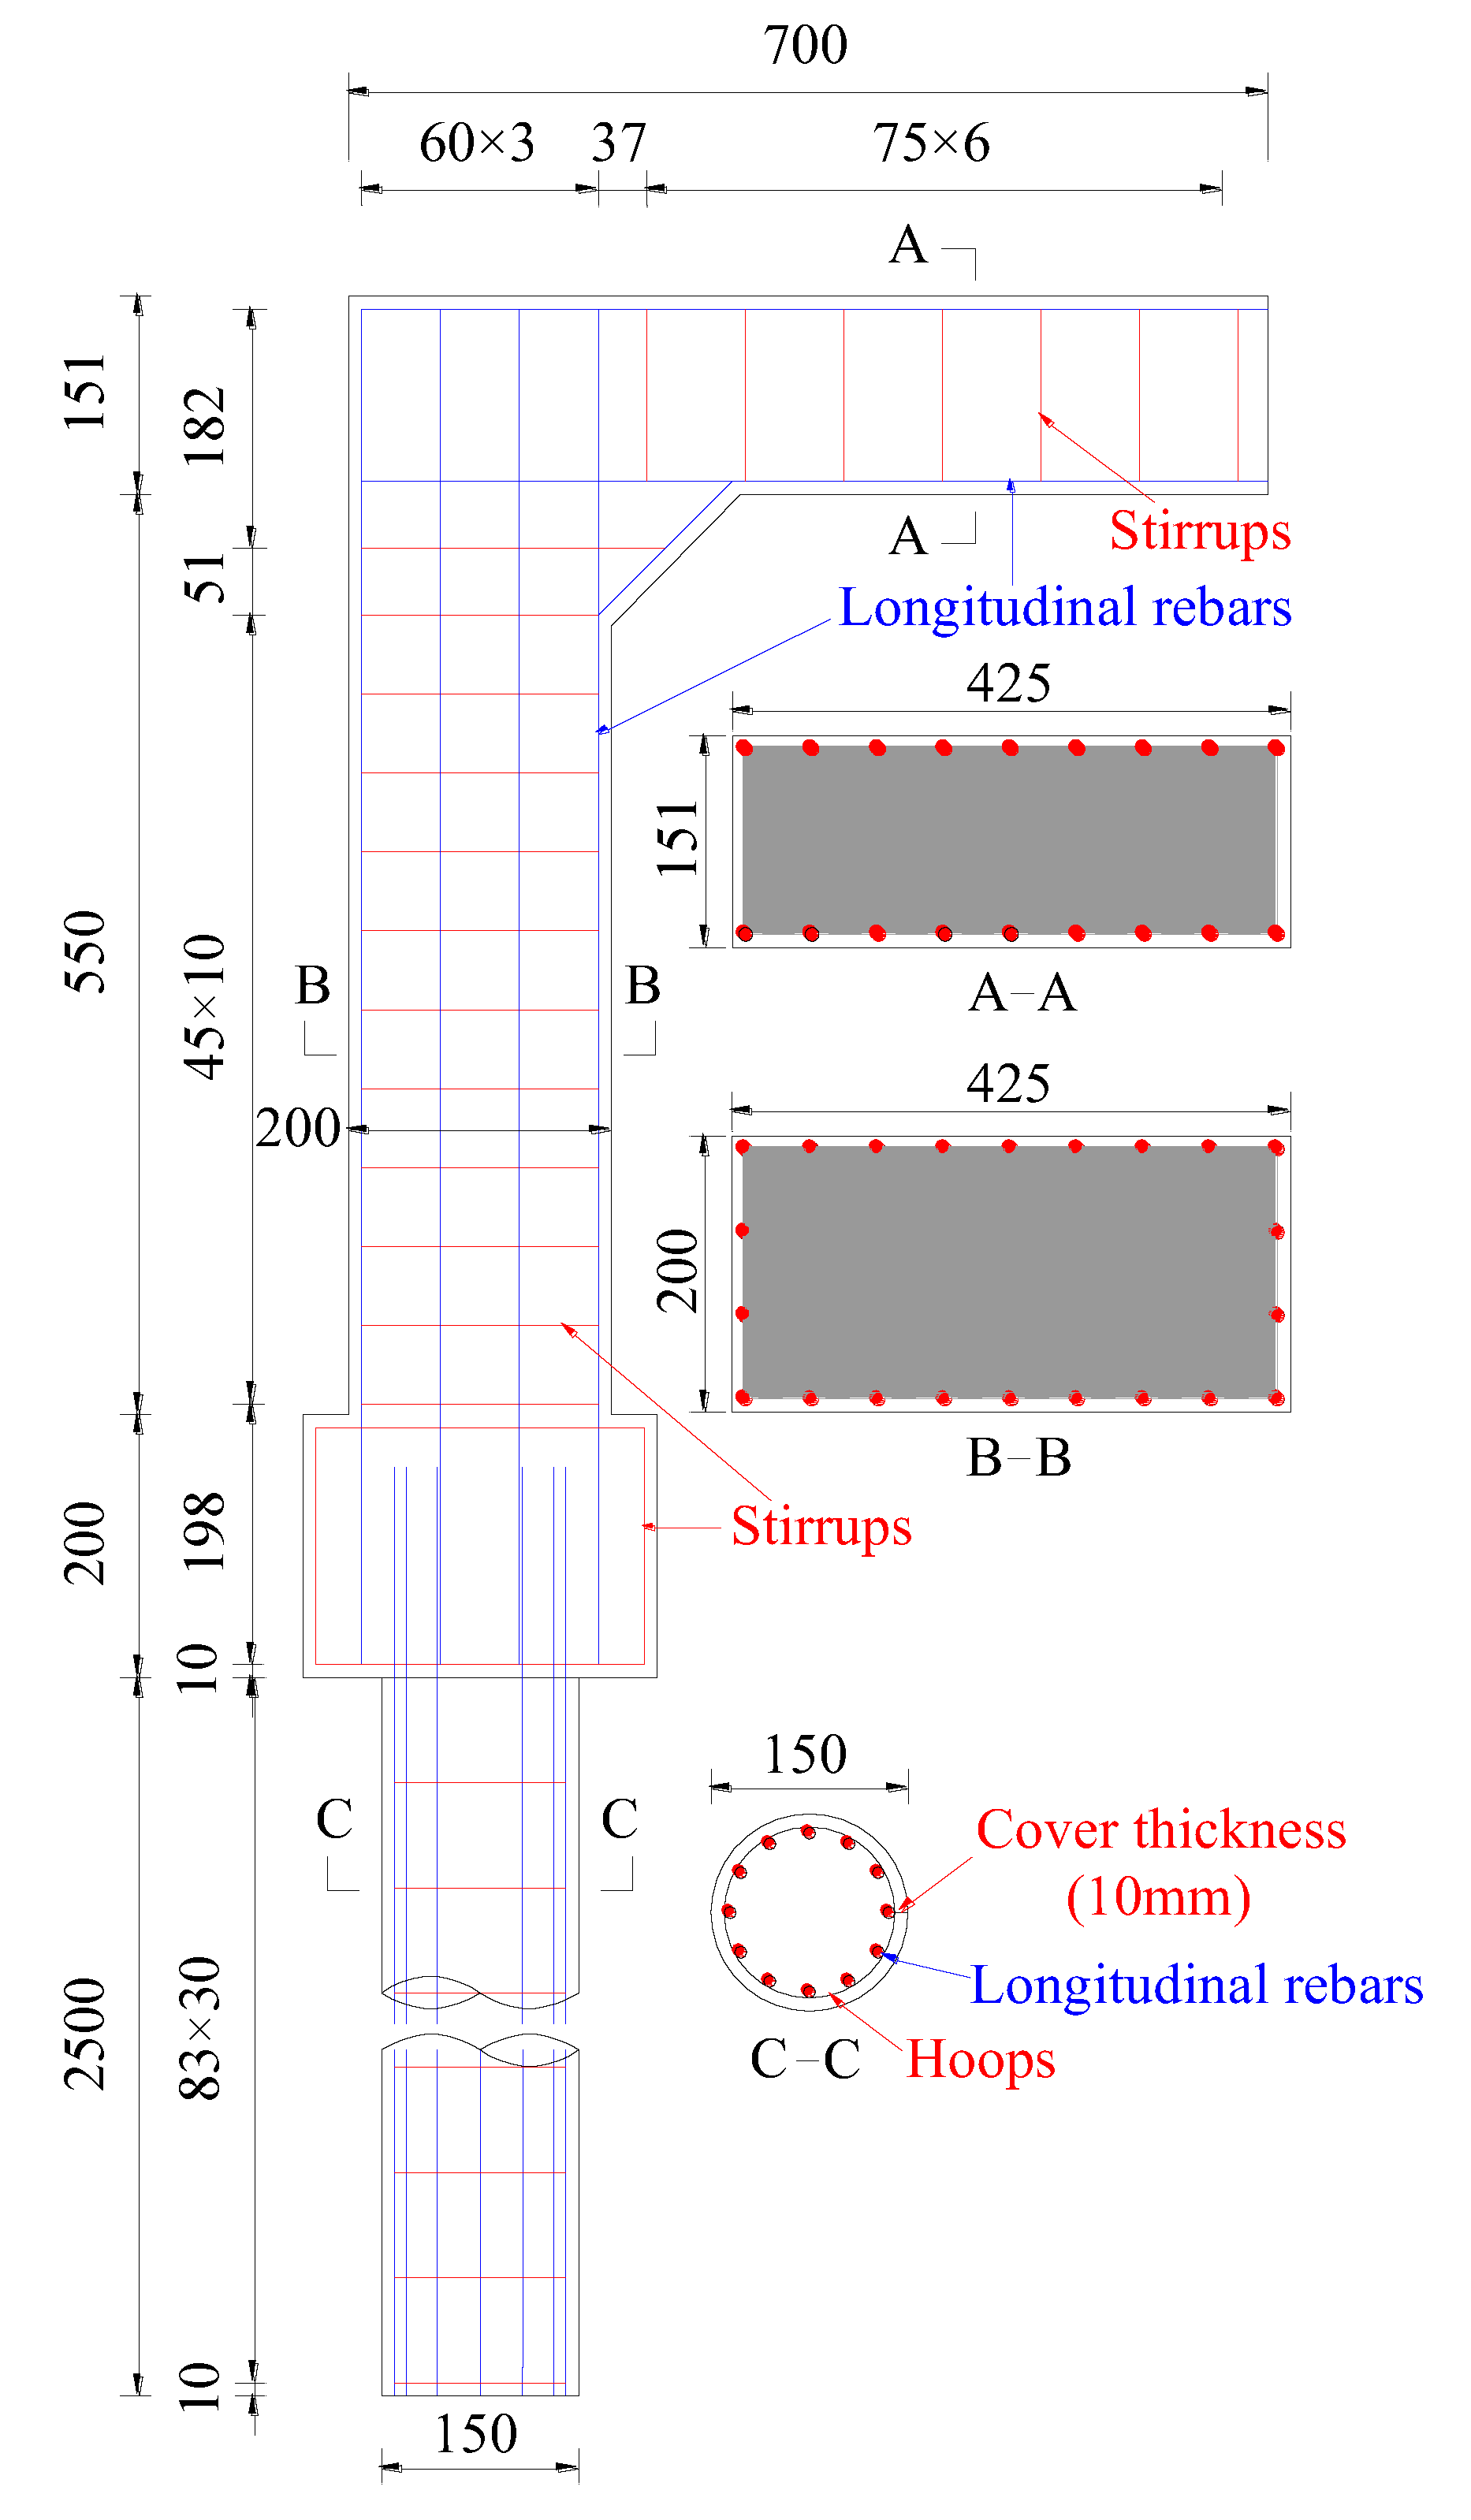
3.2. Specimen Design

3.2.1. Girder Specimen Design

Four piles were horizontally arranged in a single row beneath the abutment in the IAB. Because of the spatial limitations, one-quarter of the width of the girder–abutment–pile cap connection (4.25 m) for one pile was considered for the design of the test specimen. Based on the scale ratio (1/10) and flexural strength similarity relationship, a girder specimen with a length (L) × width (B) × height (H) of 0.7 m × 0.425 m × 0.151 m was obtained, as shown in Figure 3. The XTRACT v3.0.5 software [39] was used to design the longitudinal rebars and stirrups for the girder specimen. Twenty-two round rebars with a 6 mm diameter were arranged in a single row in the rectangular cross-section of the girder, with nine rebars along each of the top and bottom sides, considering a 10 mm cover thickness. Seven stirrups with a 6 mm diameter and 75 mm pitch were arranged along the girder’s length, as shown in Figure 3.

3.2.2. Integral Abutment and Pile Specimen Design

Based on the scale ratio (1/10) and the flexural strength similarity relationship, an abutment specimen with a height (h) × thickness (t) × width (b) of 0.55 m × 0.2 m × 0.425 m was obtained, as shown in Figure 3. The XTRACT v3.0.5 software [39] was used to design the longitudinal rebars and stirrups for the abutment specimen. Twenty-two round rebars with a 6 mm diameter were arranged in a single row in the rectangular cross-section of the abutment, with nine rebars along each of the back and front sides and two rebars along each of the left and right sides, considering a 10 mm cover thickness. Twelve stirrups with a 6 mm diameter and 45 mm pitch were arranged along the height of the abutment, as shown in Figure 3. A pile cap with a height × thickness × width of 0.2 m × 0.27 m × 0.425 m was designed to connect the abutment to the pile.
Based on the scale ratio (1/10) and the flexural strength similarity relationship, an RC pile specimen with a 2.5 m length (l) and a 150 mm diameter (D) were obtained, as shown in Figure 3. The XTRACT v3.0.5 software [39] was used to design the longitudinal rebars and hoops in the pile specimen. Twelve round rebars with a 6 mm diameter were arranged in the cross-section of the pile considering a 10 mm cover thickness. Thirty single-leg hoops with a 6 mm diameter and an 83 mm pitch were arranged along the pile’s length, as shown in Figure 3. The rebar ratio was 1.7%, which is larger than the minimum rebar ratio of 1.6% for the RC pile in IABs [36].

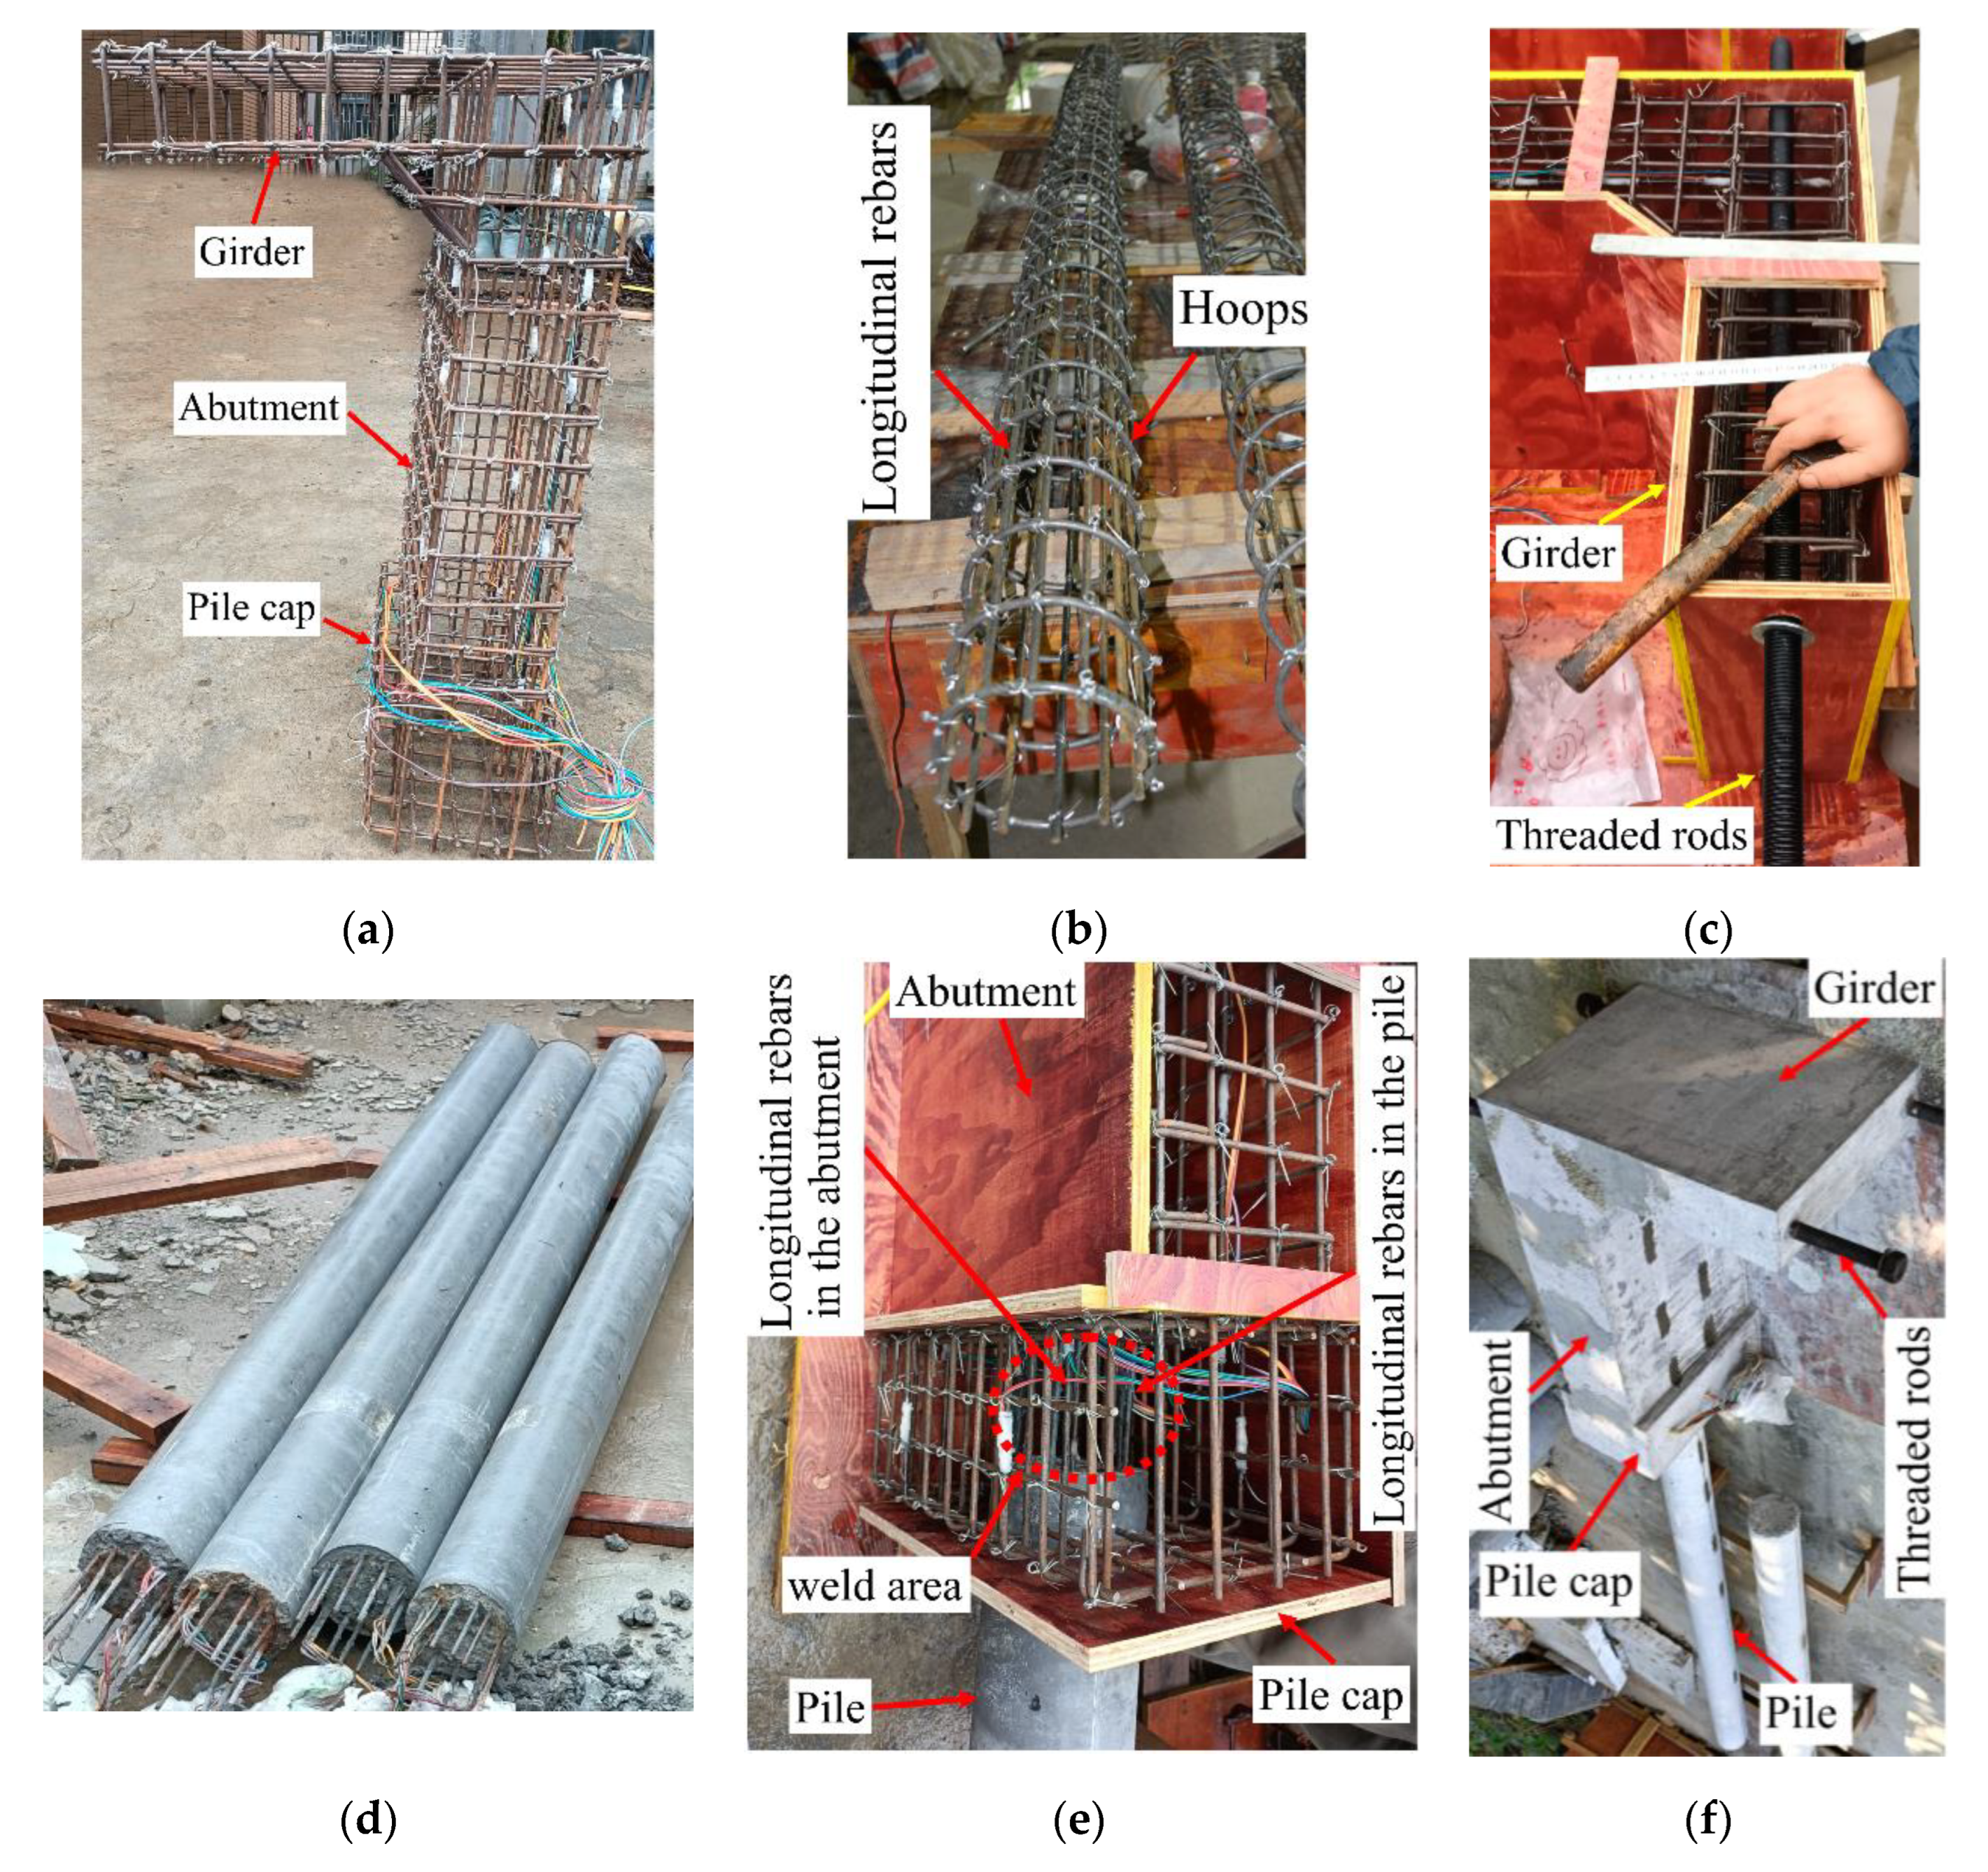
3.3. Specimen Fabrication

The fabrication processes for the GIAP specimen were as follows:
  • The rebar cages for the girder–integral abutment–pile cap connection and pile were fabricated, as shown in Figure 4a,b;
  • The rebar cages for the girder–integral abutment–pile cap connection were placed in the timber formwork, and two high-strength threaded rods with a 30 mm diameter were embedded to connect the girder to the MTS hydraulic actuator, as shown in Figure 4c;
  • The pile was cast using C30 concrete and cured at normal atmospheric temperature for 28 days, as shown in Figure 4d;
  • The rebars that extended from the top surface of the pile were welded to the rebar cages of the pile cap to form the girder–integral abutment–pile cap connection, as shown in Figure 4e;
  • The girder–integral abutment–pile cap connection was cast using C50 concrete and cured at normal atmospheric temperature for 28 days. The girder–integral abutment–pile specimen can be obtained, as shown in Figure 4f.

3.4. Soil Container and Filling Materials
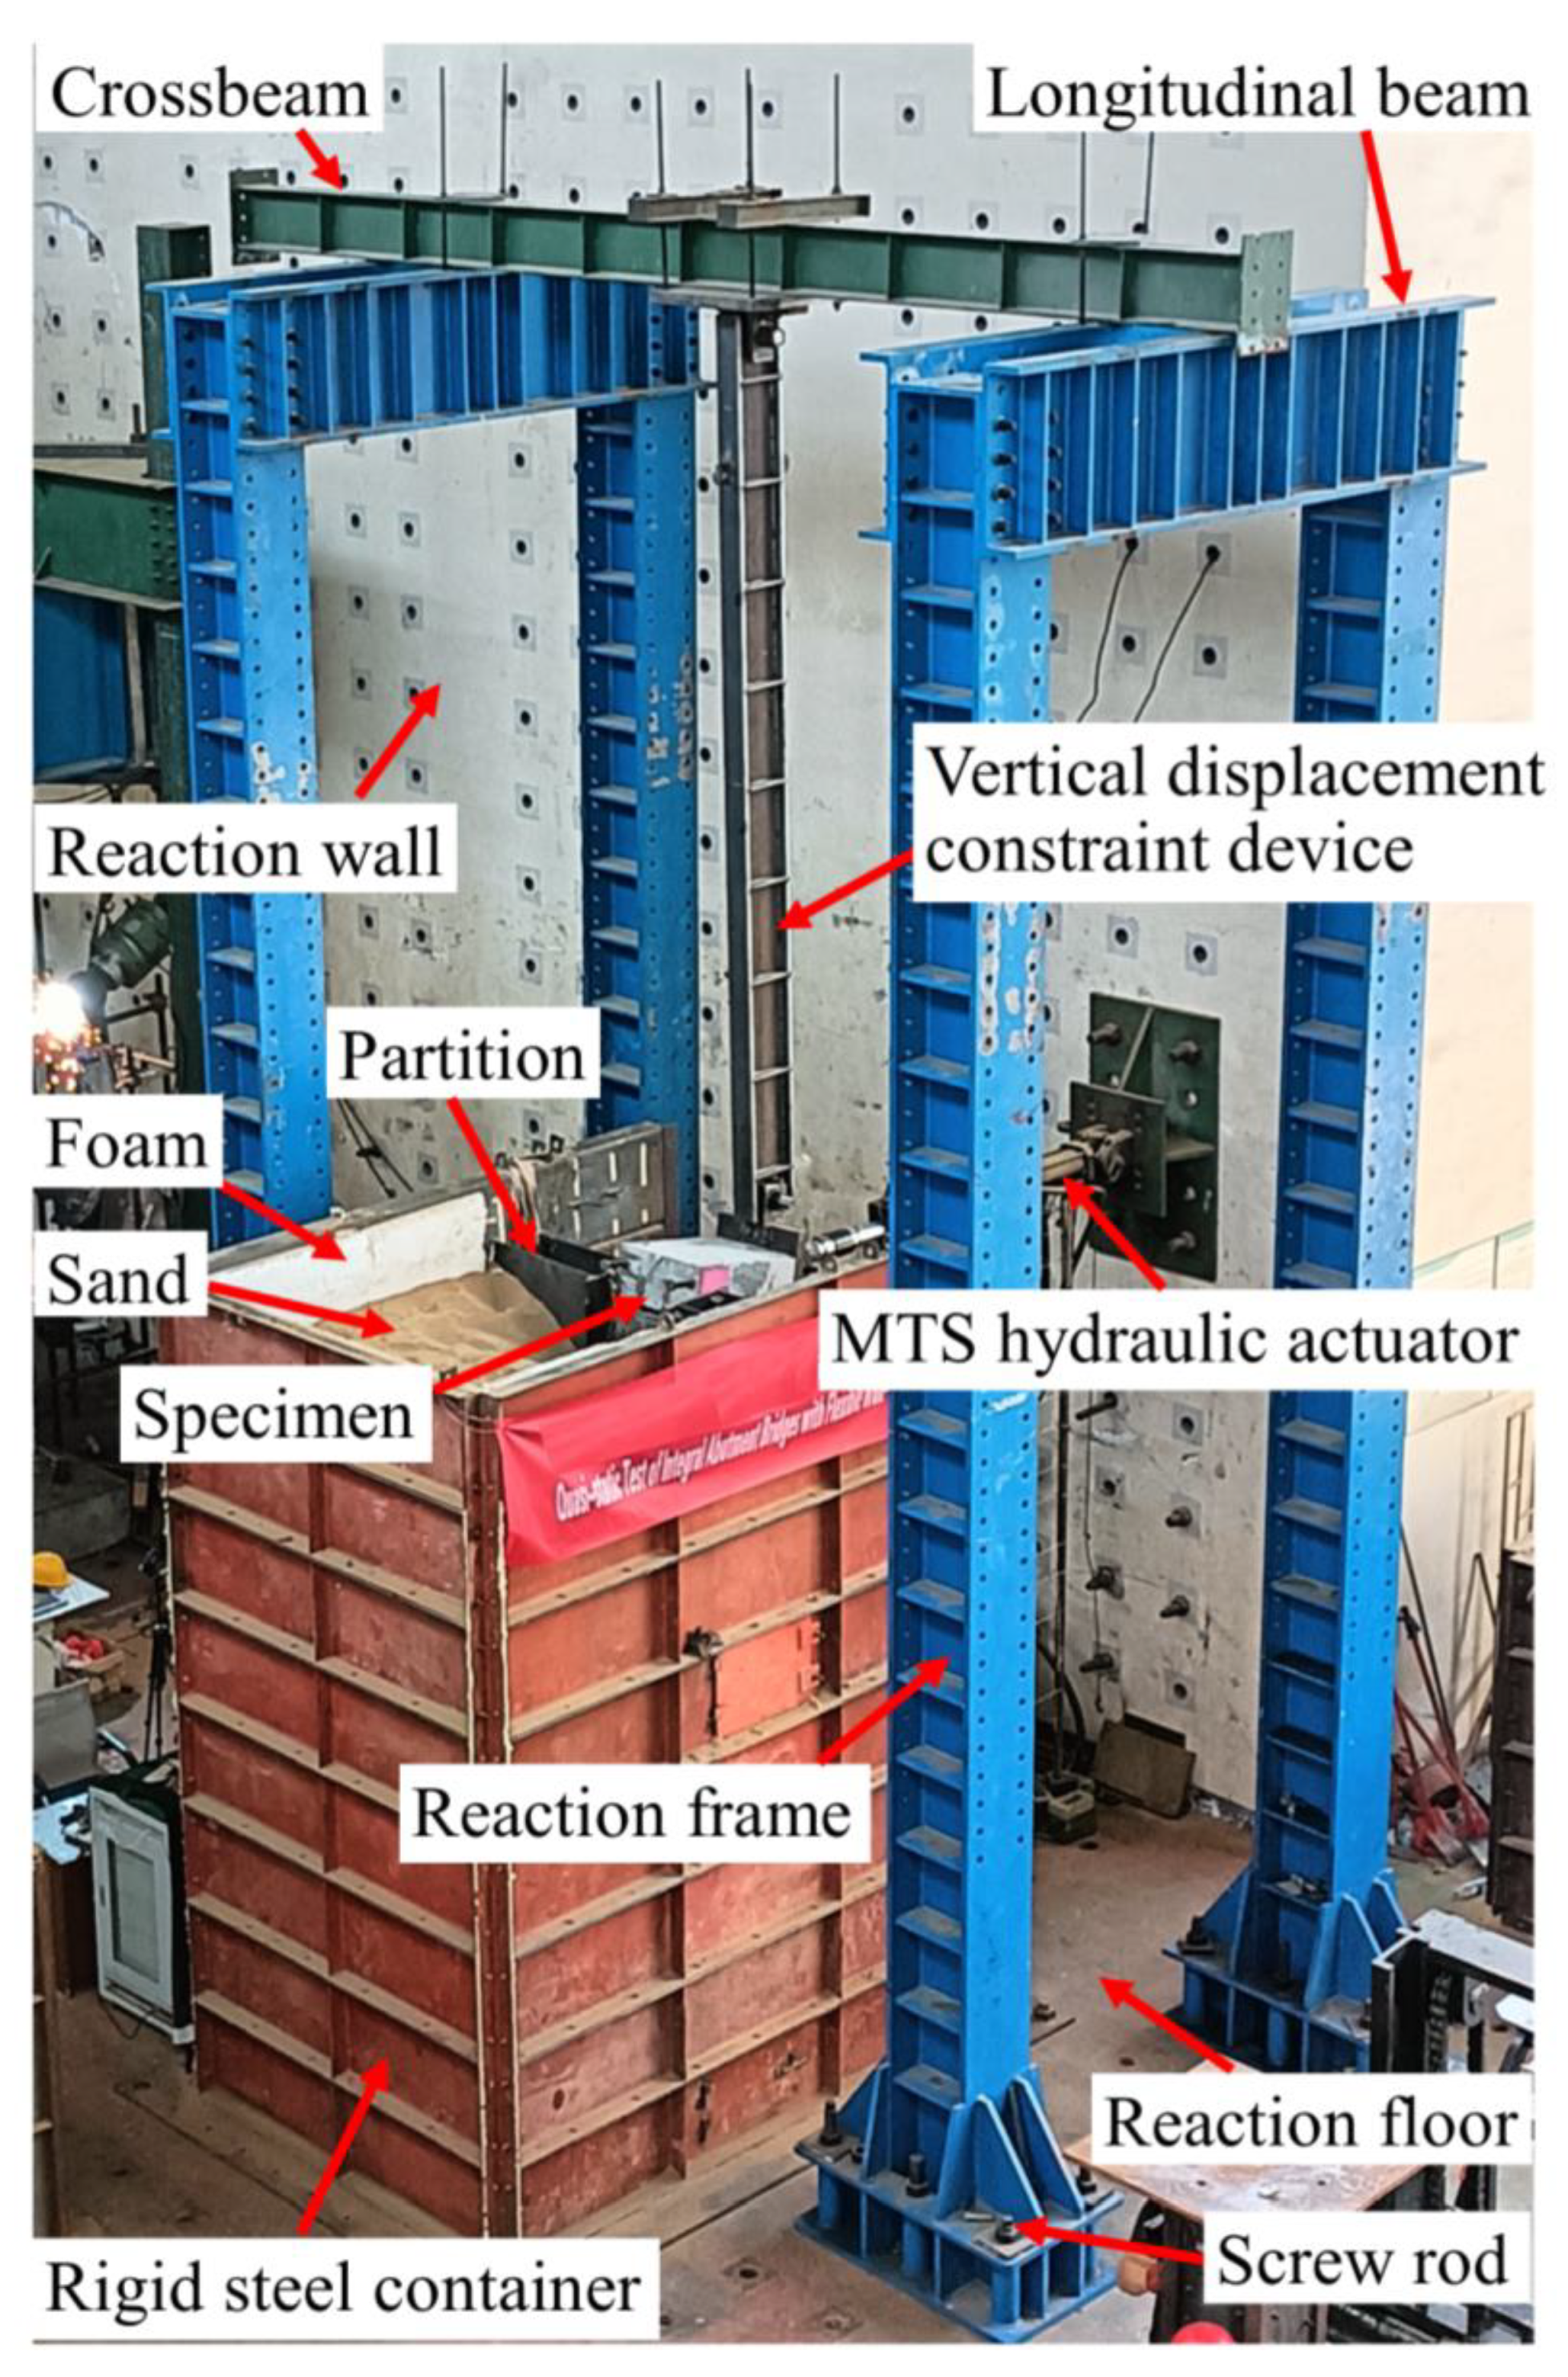
Rigid containers with an absorbing boundary (10 cm thick foam sheets pasted on the inner surface of the container) have previously been used for studying soil–structure interactions under pseudo-static low-cycle loads [37]. When the horizontal cross-sectional dimensions of the rigid container is two times larger than that of the abutment height [40], and the horizontal cross-sectional dimensions of the rigid container is five times larger than that of the pile diameter [41,42], the influence of the boundary condition on the specimen’s response can be neglected. In this test, the ratio between the horizontal cross-sectional dimensions of the soil container and the abutment height and pile diameter were 3.5 and 6.2, respectively, with the dimensions of the rigid steel container being 2 m × 3 m × 4 m, as shown in Figure 5. The bottom plate of the rigid steel container was fixed to the floor by screw rods. A single layer of sand was used, characterized by a 1773 kg/m3 density, 27° friction angle, 53% relative compactness, and 0.65% water content. The boundary conditions of the abutment were designed to replicate the real scenario, in which the sand was placed behind the abutment to simulate the backfill, and there was no sand in front of the abutment. A steel plate was installed as a partition to prevent the sand from moving from the back of the abutment to the front.

3.5. Test Setup

The test setup consisted of a rigid steel container, sand, the GIAP specimen, a vertical displacement constraint device connected to the end of the girder, and a 250 kN MTS hydraulic actuator, as shown in Figure 5 and Figure 6.

3.5.1. Loading Devices

The vertical displacement restraint device for the girder was designed and fabricated to simulate the boundary conditions at cut-off sections of girders in IABs, for which the vertical displacement (dv) is limited and rotation (φg) is allowed [43,44,45,46,47]. The restraint device consisted of, from top to bottom, a locking steel plate, an upper connecting plate, L-shaped steel plates, high-strength threaded rods, an I-beam, and a lower connecting plate, as shown in Figure 6. The locking steel plate and the upper connecting plate arranged on the top and bottom of the crossbeam of the reaction frame, respectively, were locked by screw rods. Two L-shaped steel plates were welded to the bottom surface of the upper connecting plate. Two lower connecting plates were vertically welded on the upper surface of the loading plate, which was connected to the end of the girder using high-strength threaded rods. The gap between two L-shaped steel plates or two lower connection plates was set as the thickness of the web of the I-beam. Holes were drilled in two L-shaped steel plates, two lower connecting plates, and the web plates at both ends of the I-beam. The holes in the L-shaped steel plates and the web plates at the upper end of the I-beam and the holes in the lower connecting plates and the web plates at the lower end of the I-beam, were inserted using two high-strength threaded rods. During the cyclic loading process, the lower connecting plates and the lower end of the I-beam could horizontally move together with the loading plate along the direction of the cyclic loading produced by the MTS hydraulic actuator and rotate around the longitudinal axis of the lower high-strength threaded rod. The upper end of the I-beam could rotate around the longitudinal axis of the upper high-strength threaded rod. Considering the maximum d (130 mm) and the length of the I-beam (4135 mm), the maximum dv of the girder end was 2.1 mm based on the principle of similar triangles, which can be neglected. In summary, the boundary condition of the girder ends with a certain φg, and a negligible dv can be obtained.

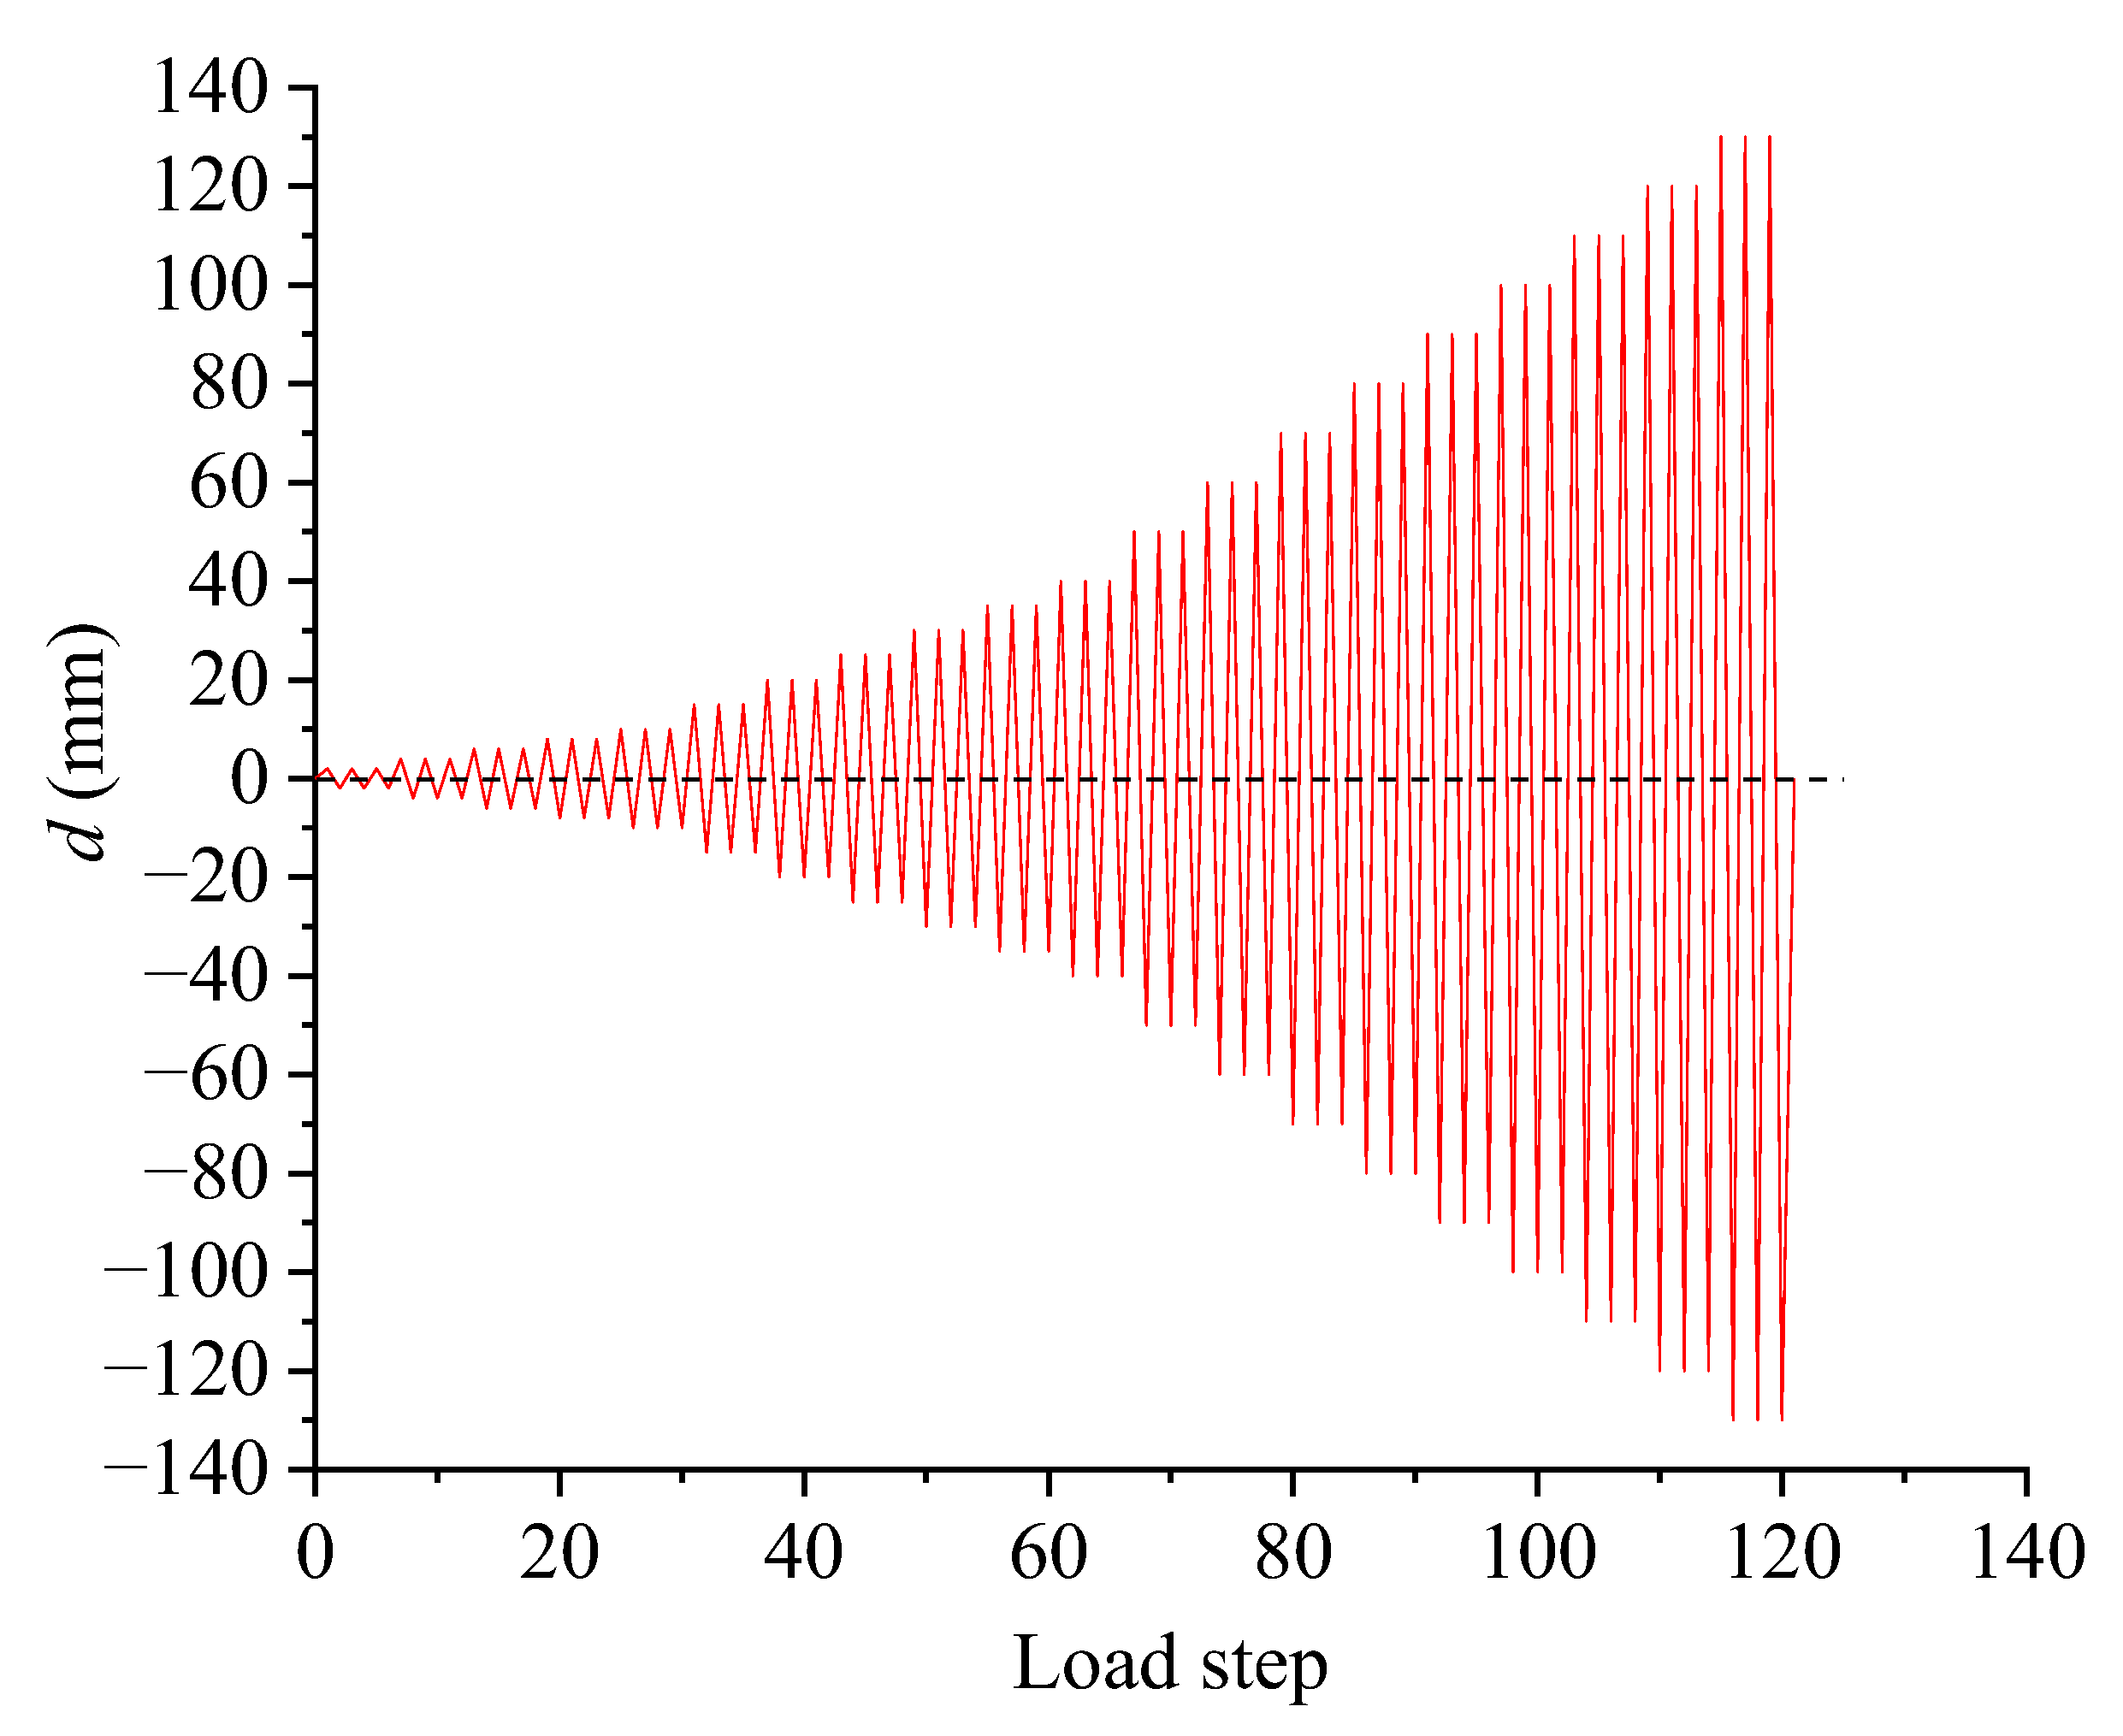
3.5.2. Loading Protocol

When the abutment moves toward the backfill, the horizontal displacement (d) is defined as the positive d; when the abutment moves away from the backfill, the d is defined as the negative d [36]. The d was applied to the center point of the cross-section of the girder by an MTS hydraulic actuator using a displacement-control method [36,48], with peak values (three cycles for each peak value) of ±2 to ±10 mm (intervals of 2 mm), ±10 to ±40 mm (intervals of 5 mm), and ±50 to ±130 mm (intervals of 10 mm), as shown in Figure 7. The load rate was 1 mm/s [34]. When the loading direction changed, the holding time was 30 s.

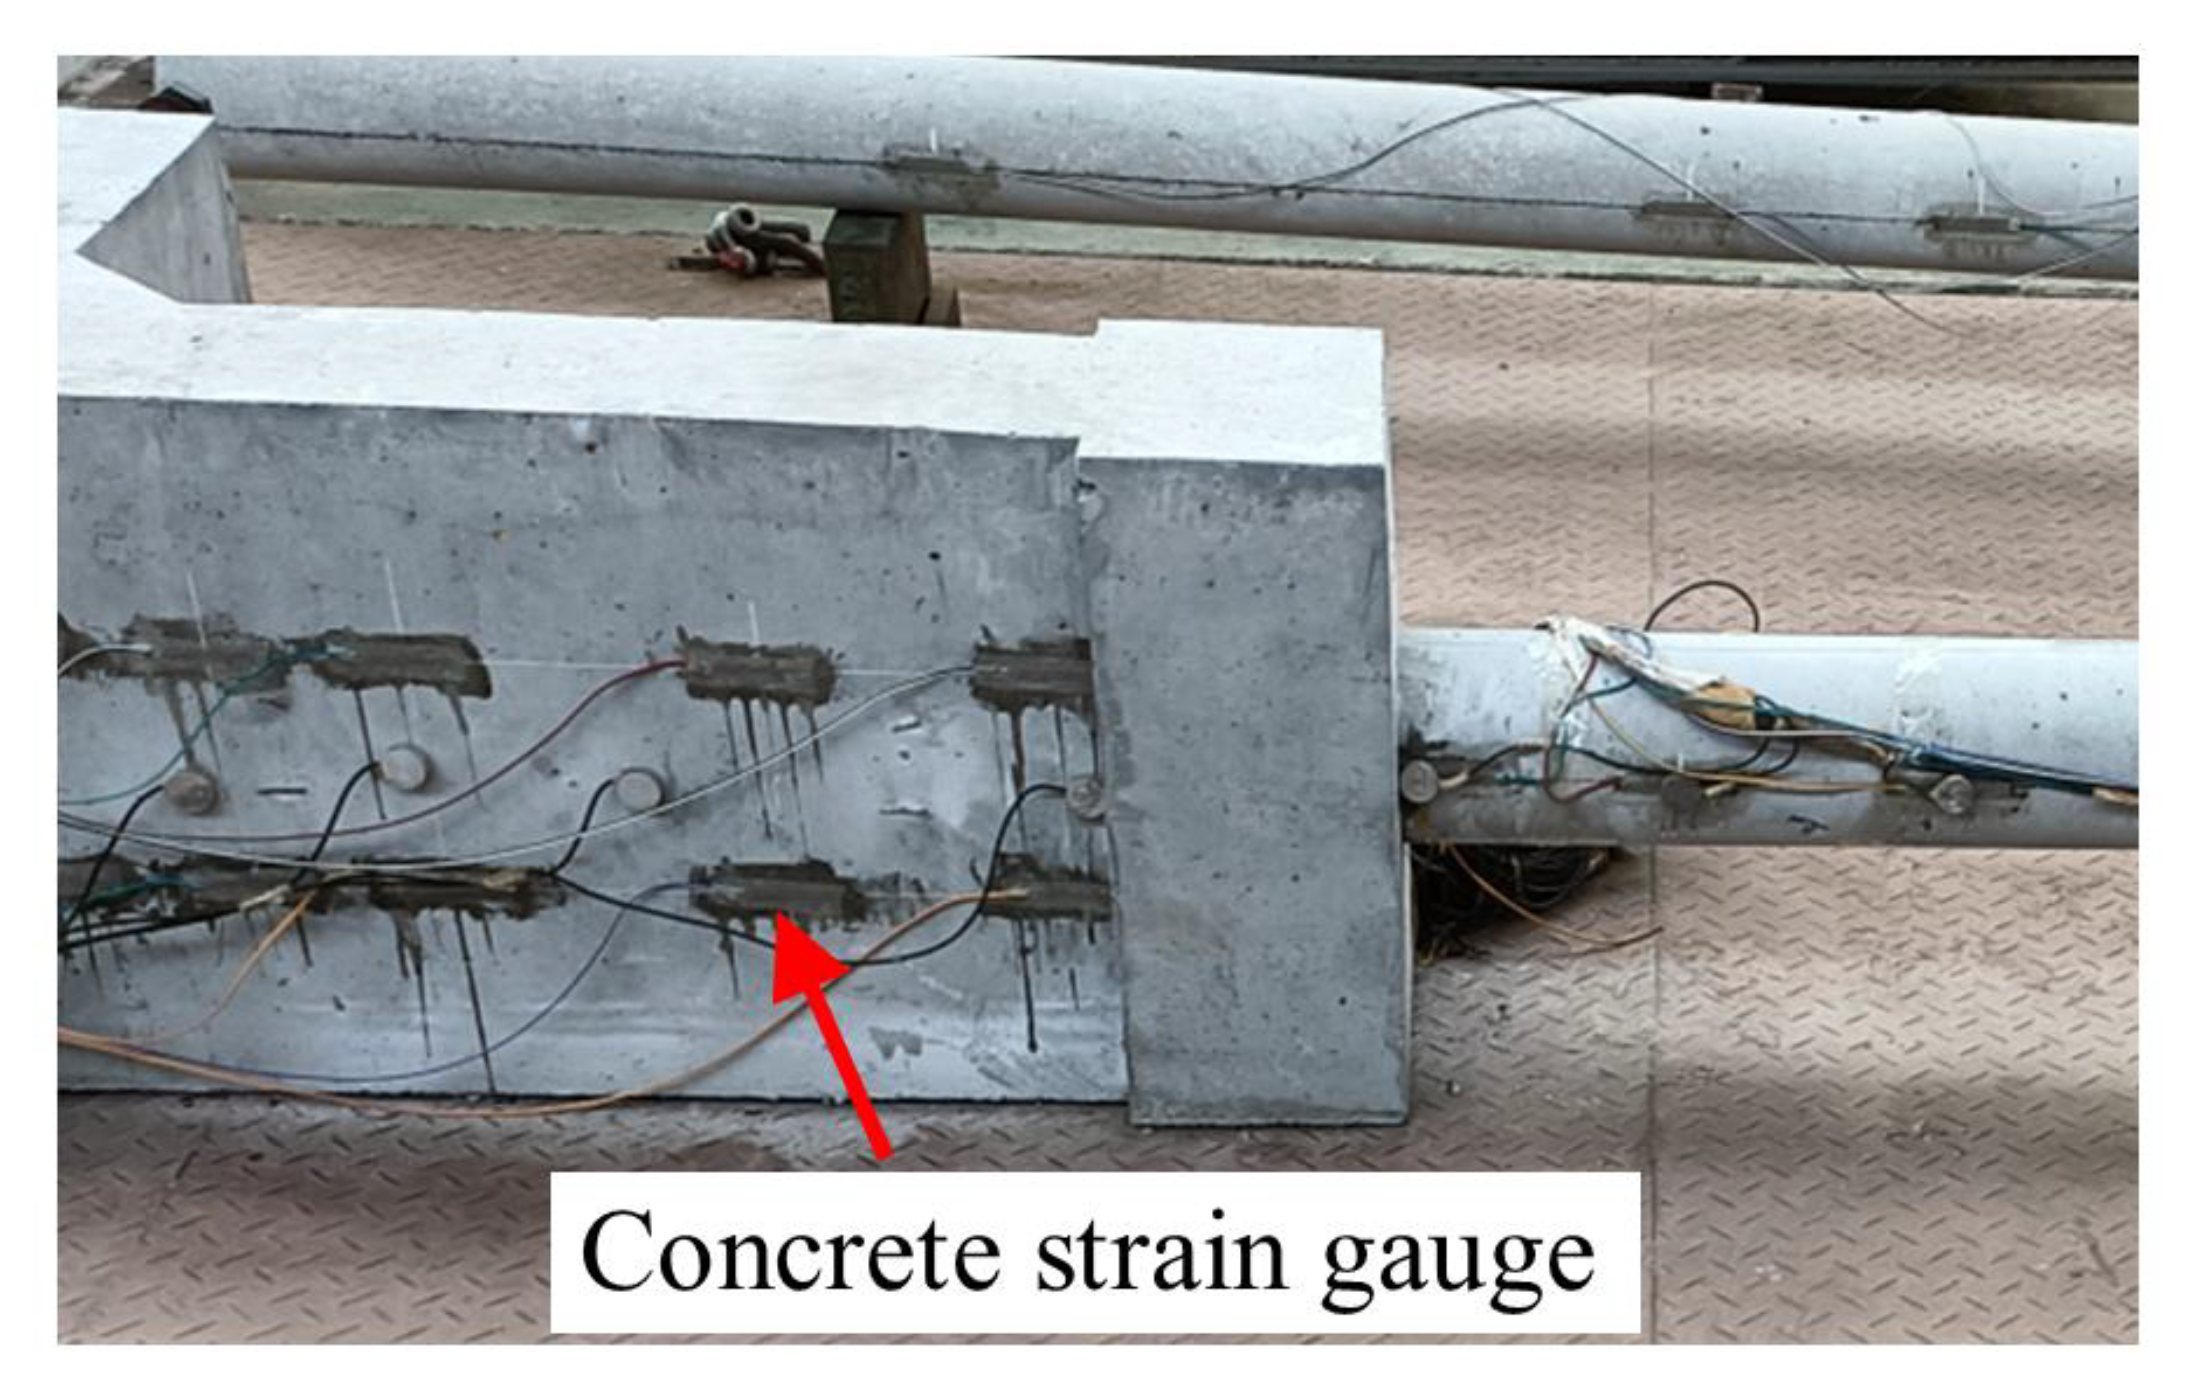
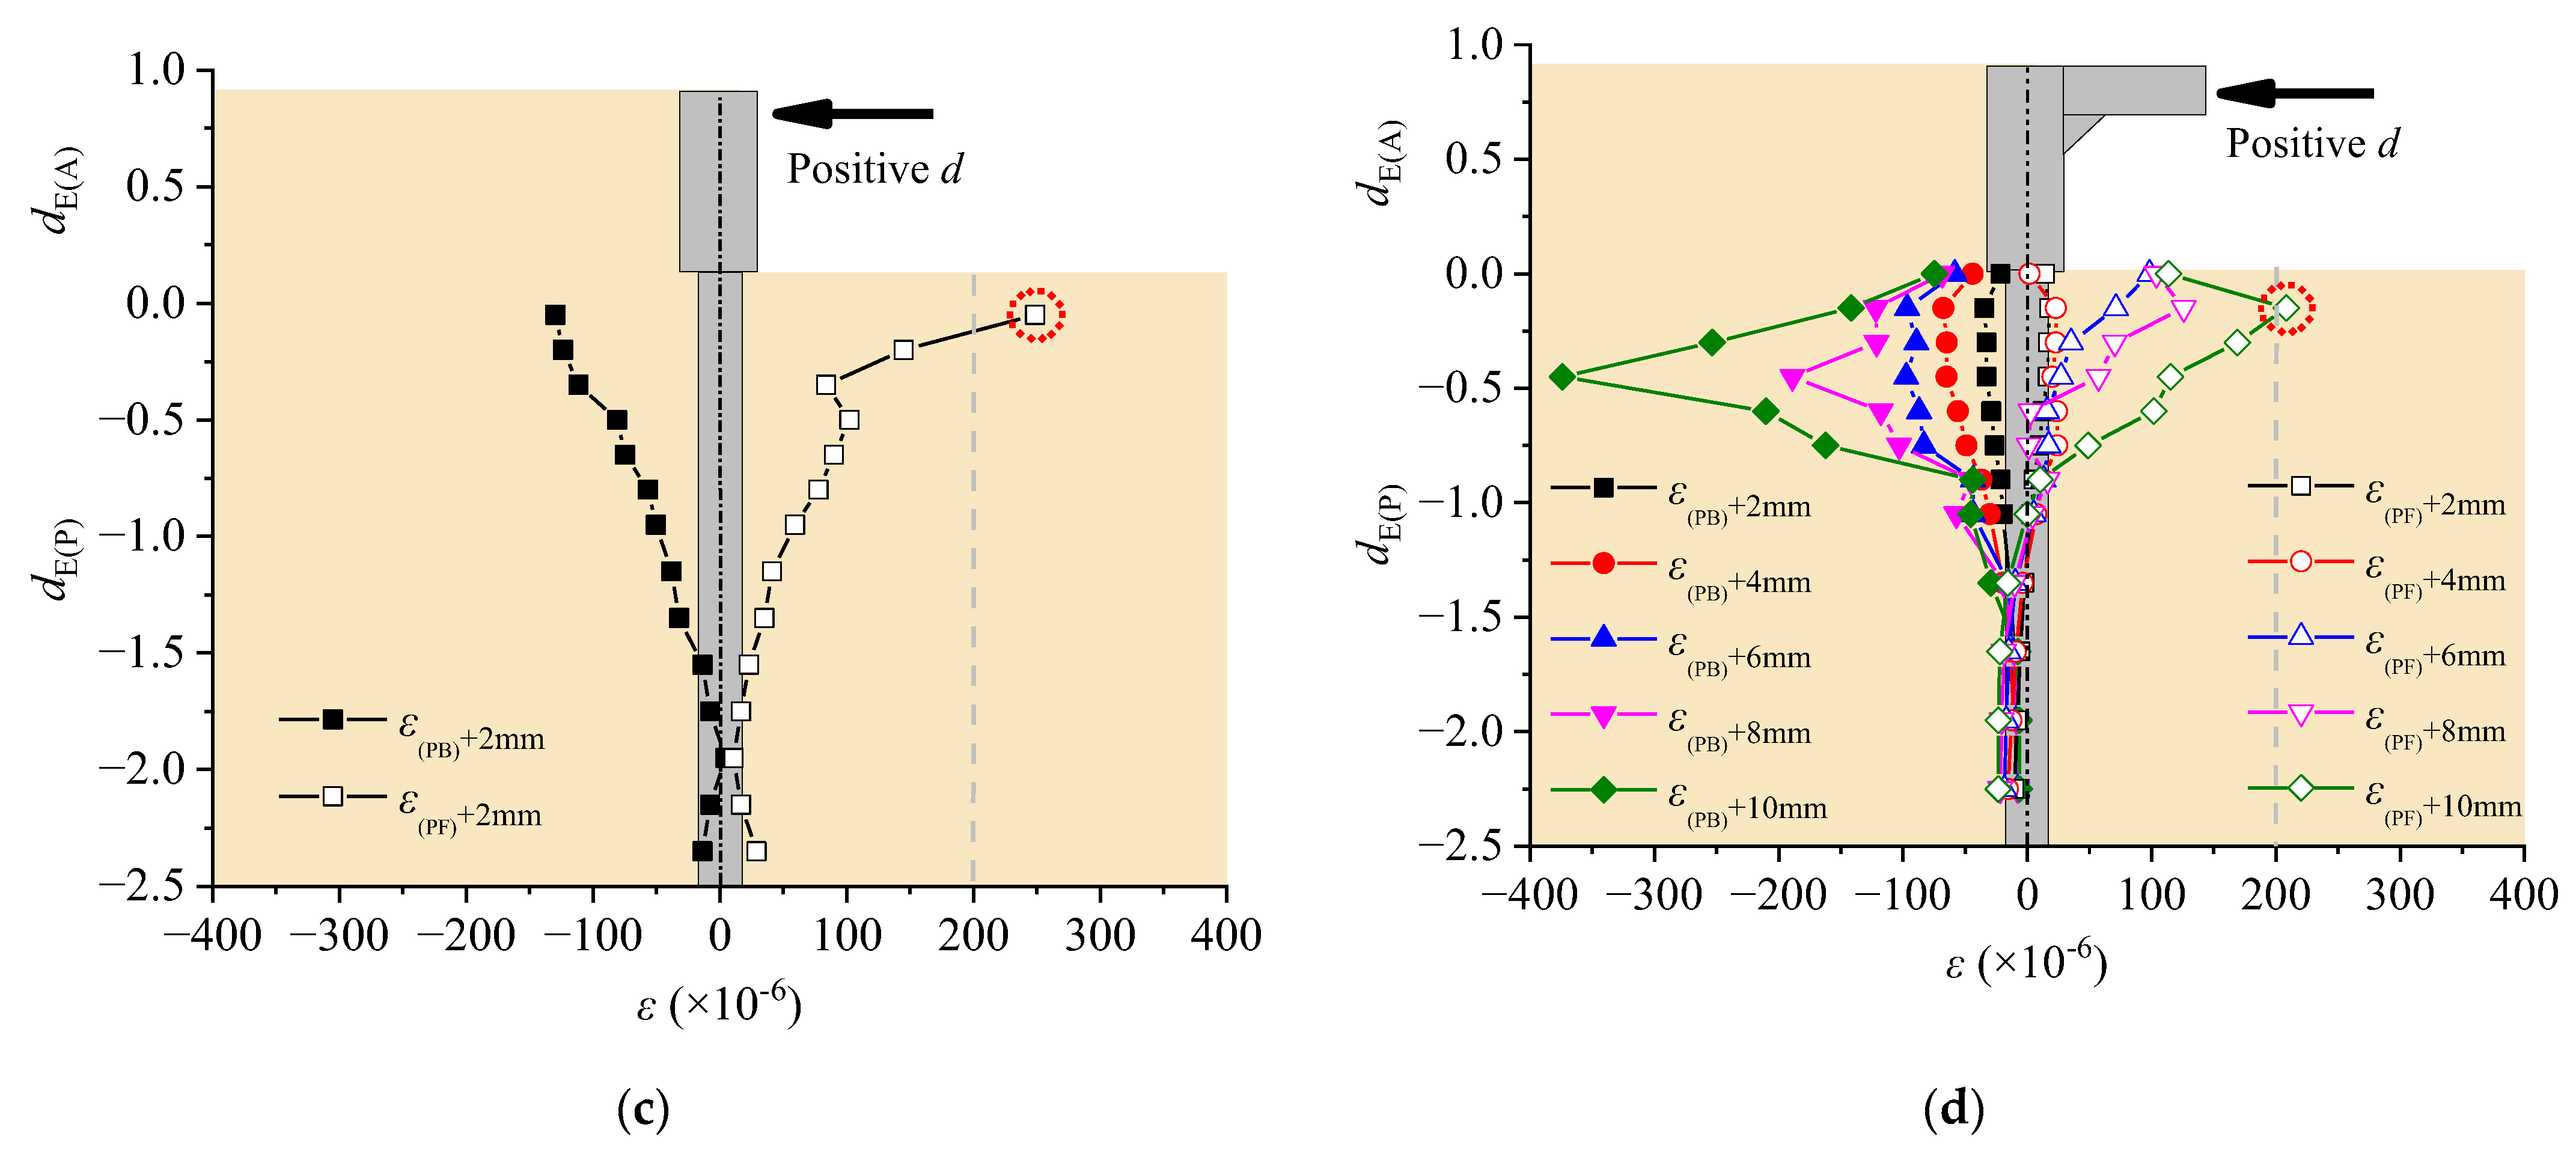
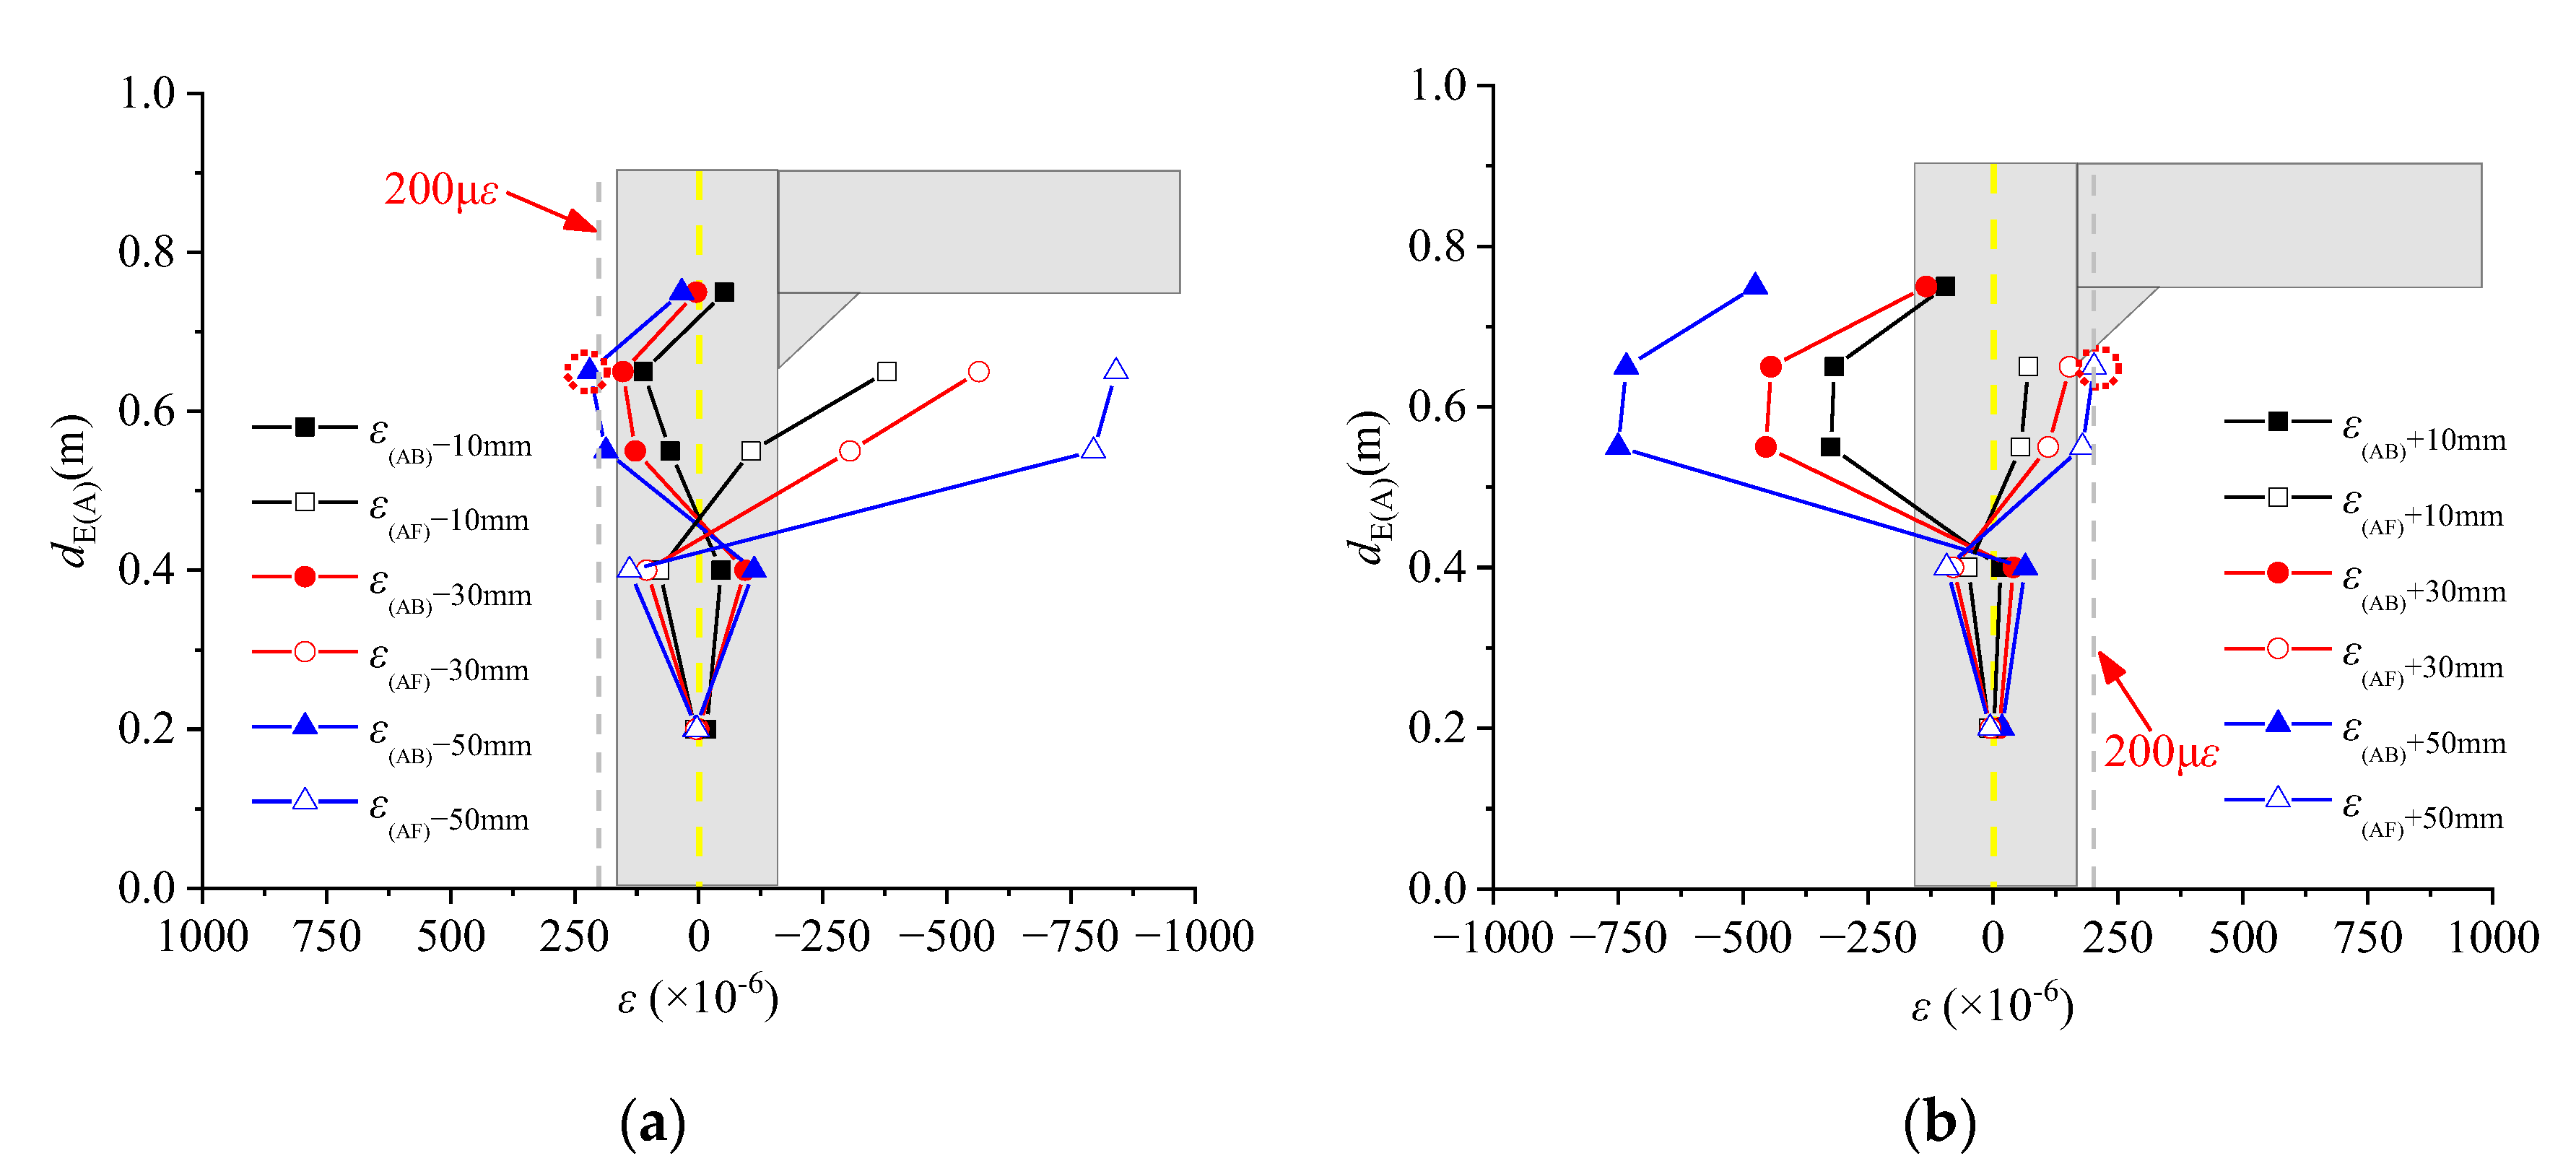
3.6. Instrument Setup

The embedded depth of the specimen (dE) at the pile top was set as 0 m, with the embedded depth of the abutment (dE(A)) measured from the top of the pile to the top of the abutment, and the embedded depth of the pile (dE(P)) measured from the top of the pile to the bottom. Forty-two concrete strain gauges (S1~S42) were vertically arranged along the height of the specimen, as shown in Figure 6. Ten concrete strain gauges were vertically arranged in two columns on the back surface of the abutment at dE(A) values of 200 mm, 400 mm, 550 mm, 650 mm, and 750 mm (S1~S5 and S6~S10). Eight concrete strain gauges were vertically arranged in two columns on the front surface of the abutment at dE(A) values of 200 mm, 400 mm, 550 mm, and 650 mm (S11~S14 and S15~S18). Twenty-four concrete strain gauges were vertically arranged on two opposite sides of the specimen in the plane of the load direction at dE(P) values of 0 mm, −150 mm to −1050 mm (interval of −150 mm), and −1050 mm to −2250 mm (intervals of −300 mm) (S31~S42 and S19~S30). The concrete strain gauges are shown in Figure 8.

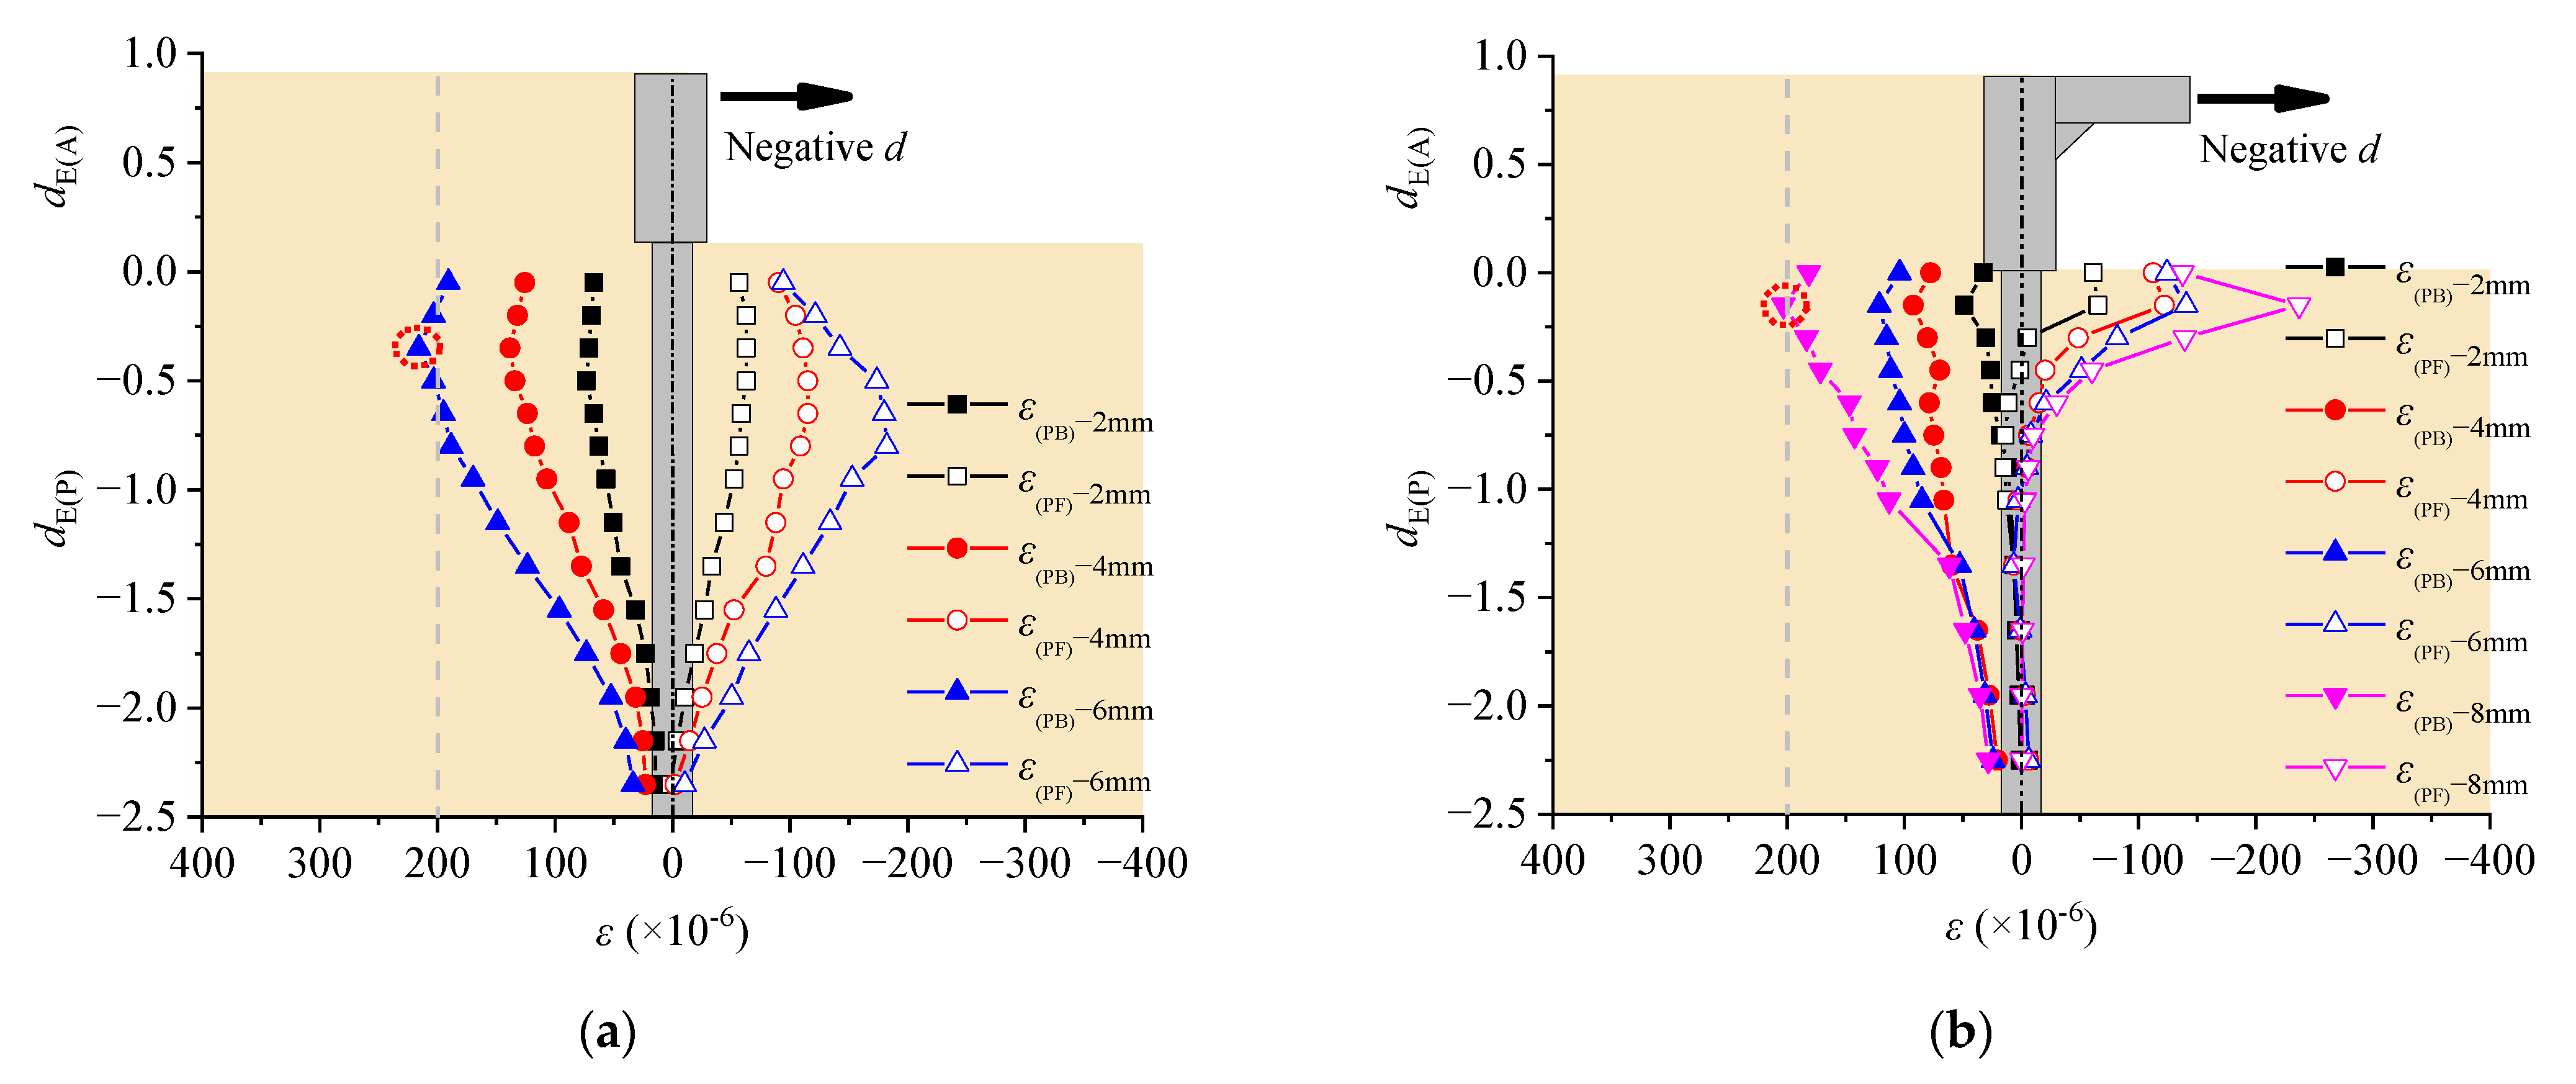
4. Experimental Results
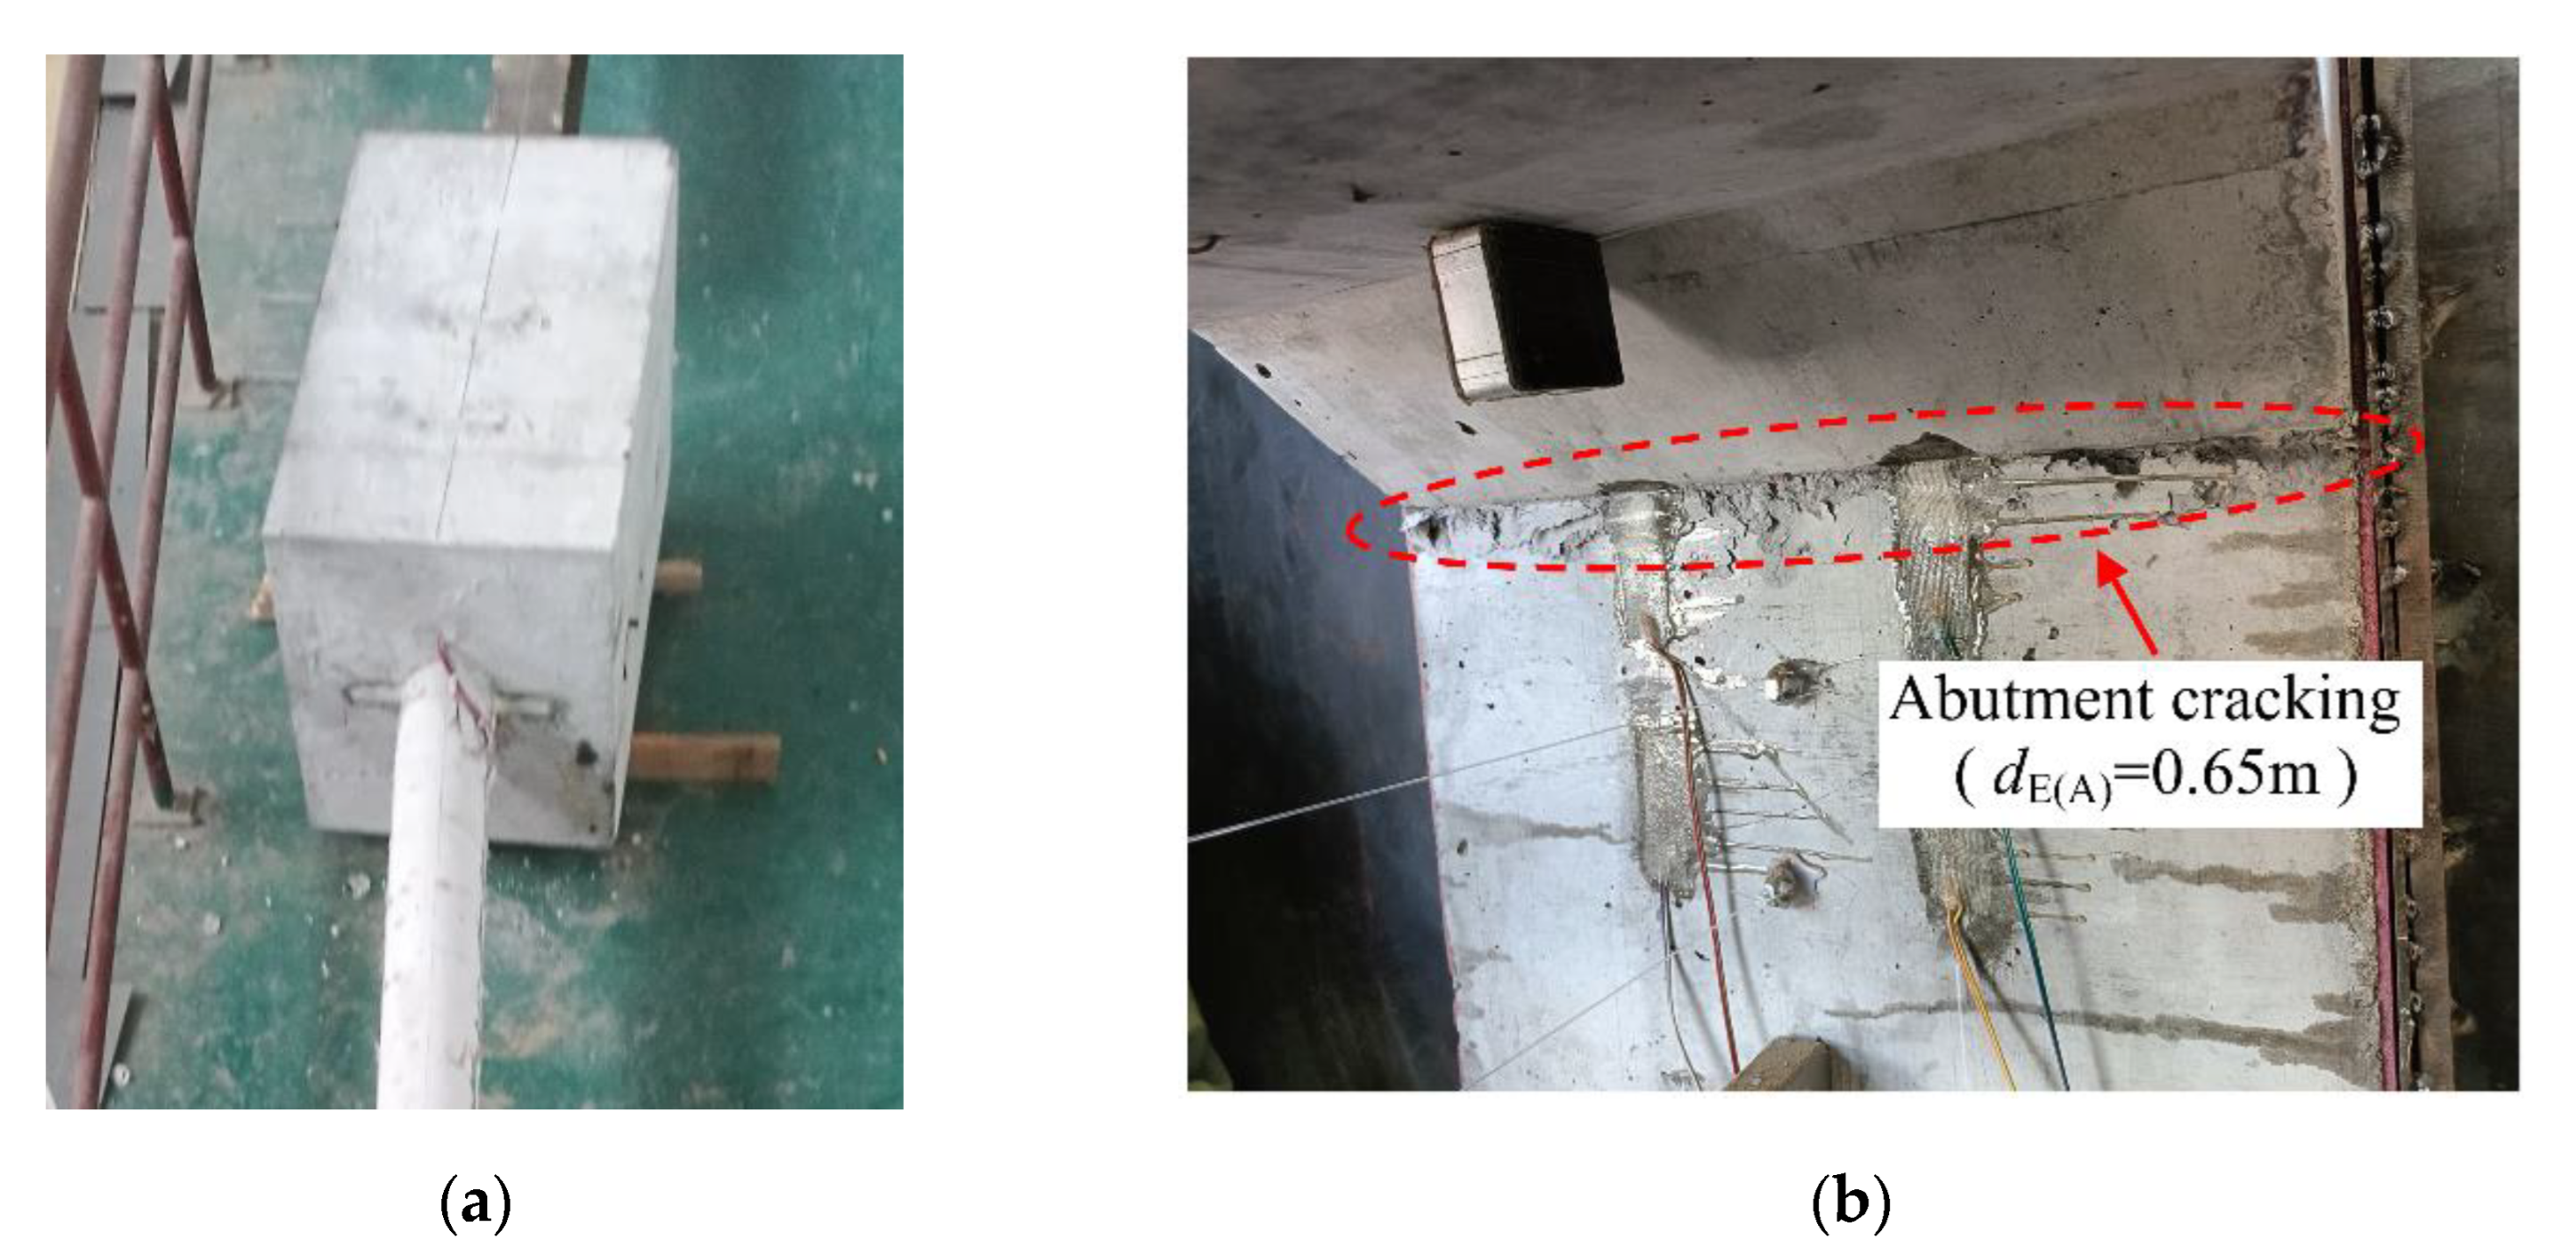
The experimental results for the GIAP specimen obtained in this study were compared with those of the IAP specimen from References [36,49] to analyze the influence of the girder on the girder–integral abutment–RC pile–soil system.

4.1. Failure Mode

The concrete strains (ε) along the dE(P) of both sides of the pile for the IAP and GIAP specimens under various d values were compared in Figure 9. The tensile and compressive ε are indicated as the positive and negative ε, respectively. The ε values of the back and front sides of the pile (ε(PB) and ε(PF)) under various d values are defined as ε(PB)d and ε(PF)d, respectively. For instance, ε(PB)-2mm represents the ε on the back side of the pile at a d of −2 mm.
Under a negative d, the ε(PB) and ε(PF) for the IAP and GIAP specimens initially increased and then gradually decreased along the dE(P), as shown in Figure 9a,b. The increment in ε(PB) for the GIAP specimen was significantly smaller than that for the IAP specimen. When d was −6 mm, the maximum tensile ε for the GIAP specimen (83.42 με) was 61.3% smaller than that for the IAP specimen (215.71 με). It should be pointed out that the maximum tensile ε for the IAP specimen exceeded 200 με [50], which means cracks could be found at a dE(P) of −0.35 m. When d was −8 mm, the maximum tensile ε on the back side of the GIAP specimen (203.1 με) exceeded 200 με, which means cracks could be found at a dE(P) of −0.15 m. The location of the maximum tensile ε of the pile for the GIAP specimen at a dE(P) of −0.15 m was shallower than that for the IAP specimen at a dE(P) of −0.35 m.
Under a positive d, the ε(PB) and ε(PF) for the GIAP specimen initially increased and then gradually decreased along the dE(P), while those for the IAP specimen decreased along the dE(P), as shown in Figure 9c,d. The increment in ε(PF) for the GIAP specimen was significantly smaller than that for the IAP specimen. When d was +2 mm, the maximum tensile ε for the GIAP specimen (17.58 με) was 92.9% smaller than that for the IAP specimen (248.86 με). It should be pointed out that the maximum tensile ε for the IAP specimen exceeded 200 με, which means cracks could be found at dE(P) = 0 m. When d was +10 mm, the maximum tensile ε on the front side of the GIAP specimen (208.38 με) exceeded 200 με, which means cracks could be found at a dE(P) of −0.15 m. The location of the maximum tensile ε of the pile for the GIAP specimen at a dE(P) of −0.15 m was deeper than that for the IAP specimen at a dE(P) of 0 m.
It can be concluded that without considering the girder, the d corresponding to the pile cracks in the GIAP specimen is underestimated, and the locations of the maximum tensile ε of the pile are different.
The ε of the abutment was not provided for the IAP specimen [36]. The ε values along the dE(A) on both sides of the abutment for the GIAP specimen under d values of 10, 30, and 50 mm were analyzed, as shown in Figure 10. The ε values for the back and front sides of the abutment (ε(AB) and ε(AF)) under different d values are defined as ε(AB)d and ε(AF)d, respectively. For instance, ε(AB)-10mm represents the ε on the back side of the abutment at a d value of −10 mm. There were no cracks in the abutment of the IAP specimen at a d value of 40 mm (which is the maximum d value in the literature [36]), as shown in Figure 11a.
For the GIAP specimen, under a negative d, ε(AB) changed from tensile to compressive, and ε(AF) changed from compressive to tensile, respectively, from top to bottom, along the dE(A), as shown in Figure 10a. The tensile ε(AB)d was observed to be within the range of the dE(A), from 0.47 m to 0.75 m, with a peak value at a dE(A) of 0.65 m. The compressive ε(AB)d was observed to be within the range of the dE(A), from 0.2 m to 0.47 m, with a peak value at a dE(A) of 0.4 m. The compressive ε(AF)d was observed to be within the range of the dE(A), from 0.44 m to 0.65 m, with a peak value at a dE(A) of 0.65 m. The tensile ε(AF)d was observed to be within the range of the dE(A), from 0.2 m to 0.44 m, with a peak value at a dE(A) of 0.4 m. With an increase in d, the peak tensile ε(AB)d increased progressively. When d was −50 mm, the peak tensile ε(AB)d (219.73 με) exceeded 200 με, while the peak tensile ε(AF)d was 139.37 με. Cracking on the back side of the abutment for the GIAP specimen could not be observed during the test because of the filled sand.
For the GIAP specimen, under a positive d, the ε(AF) changed from tensile to compressive, and the ε(AB) changed from compressive to tensile, from top to bottom, along the dE(A), as shown in Figure 10b. The tensile ε(AF)d was observed to be within the range of the dE(A), from 0.46 m to 0.65 m, with a peak value at a dE(A) of 0.65 m. The compressive ε(AF)d was observed to be within the range of dE(A), from 0.2 m and 0.46 m, with a peak value at a dE(A) of 0.4 m. The compressive ε(AB)d was observed to be within the range of the dE(A), from 0.43 m to 0.75 m, with a peak value at a dE(A) of 0.55 m. The tensile ε(AB)d was observed to be within the range of the dE(A), from 0.2 m to 0.43 m, with a peak value at a dE(A) of 0.4 m. With an increase in the d, the peak tensile ε(AF)d increased progressively. When the d was +50 mm, the peak tensile ε(AF)d (202.09 με) exceeded 200 με, while the peak tensile ε(AB)d was 64.24 με. Cracks on the front side of the abutment for the GIAP specimen were found at a dE(A) of 0.65 m (Figure 11b).
The failure modes of the piles and abutments in the IAP and GIAP specimens were analyzed based on ε(PB)d, ε(PF)d, ε(AB)d, and ε(AF)d in Figure 9 and Figure 10. For the IAP specimen, the tensile damage was first observed at the front side of the pile top; with an increase in d, the damage to the pile top became more severe; however, there was no damage to the abutment, because there was no constraint from the girder on the abutment, and the rotation of the abutment was large. For the GIAP specimen, tensile damage was first observed on the back side of the pile when d was −8 mm; then, tensile damage on the front side of the pile was found when d was +10 mm. When the value of d reached +50 mm and −50 mm, cracks occurred on both the front and back sides (dE(A) = 0.65 m) of the abutment because of the constraint from the girder on the abutment, which limited the horizontal deformation and rotation of the abutment top and increased the internal forces at the girder–abutment connection [8,20,21,22,28]. In summary, compared to the IAP specimen, the damage to the pile for the GIAP specimen was less severe; however, damage was found to the abutment. Without considering the girder, the failure mode of the GIAP specimen is not accurately reflected.

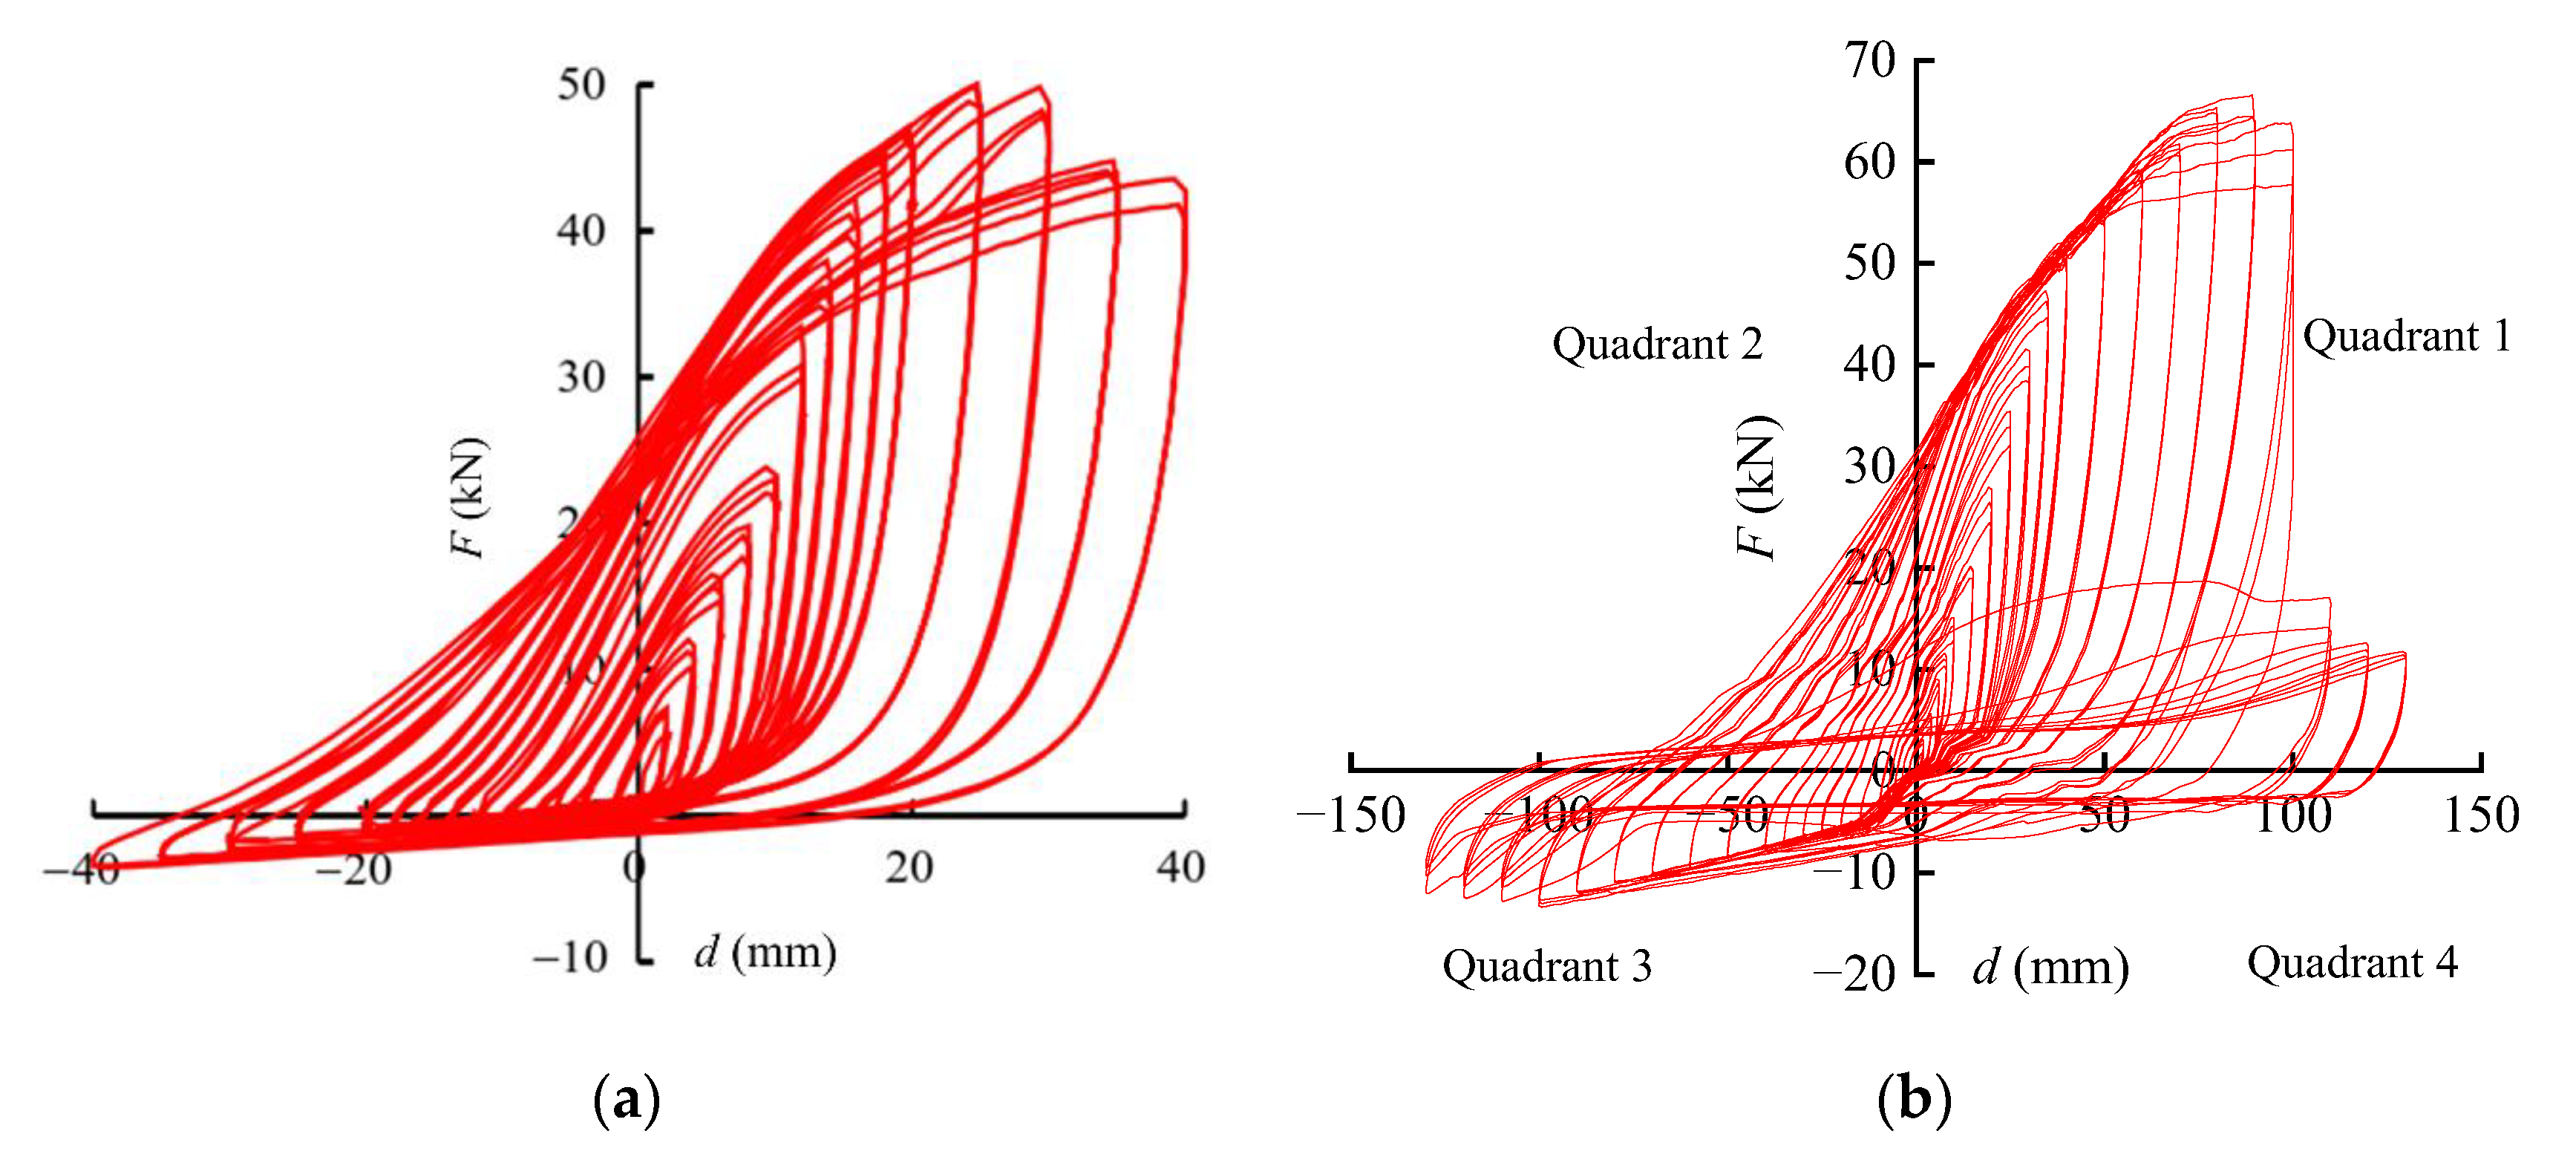
4.2. Hysteresis Curve

Under a positive or negative d, the force generated by the MTS hydraulic actuator (F) is defined as push or pull, respectively. The deformation corresponding to an F of 0 kN is defined as residual deformation (dH-R), while the deviation of the horizontal displacement of the specimen from its central axis at a d of 0 mm is defined as cumulative deformation [1].
The hysteresis curves of the IAP and GIAP specimens are compared in Figure 12. It was observed that the hysteresis curve for each specimen is distributed asymmetrically along the coordinate axes, with a symmetric d and an asymmetric F because the soil was filled behind the abutment and there was no soil in front of the abutment. In the first quadrant, a typical spindle shape for the F-d curve can be observed, with a large area enclosed by the hysteresis loop due to the soil–structure interaction. In the third quadrant, the F values are significantly smaller than those in the first quadrant for the same value of d, and the curves appear more pinched, without a distinct spindle shape. When the value of d returns to 0 in the hysteresis curve, F is not 0, indicating residual force accumulation. The residual force accumulation increases with an increase in d and the number of cycles. When F was 0 during the change in d from −35 mm to +40 mm, the dH-R for the GIAP specimen (30.6 mm) was 12.6% smaller than that for the IAP specimen (35 mm). When d was 0 during change in d from −35 mm to +40 mm, the residual force accumulation for the GIAP specimen (20.9 kN) was 22.6% smaller than that for the IAP specimen (27 kN). Therefore, dH-R and the residual force accumulation in the GIAP specimen caused by the soil’s nonlinearity are overestimated if the girder is not considered.

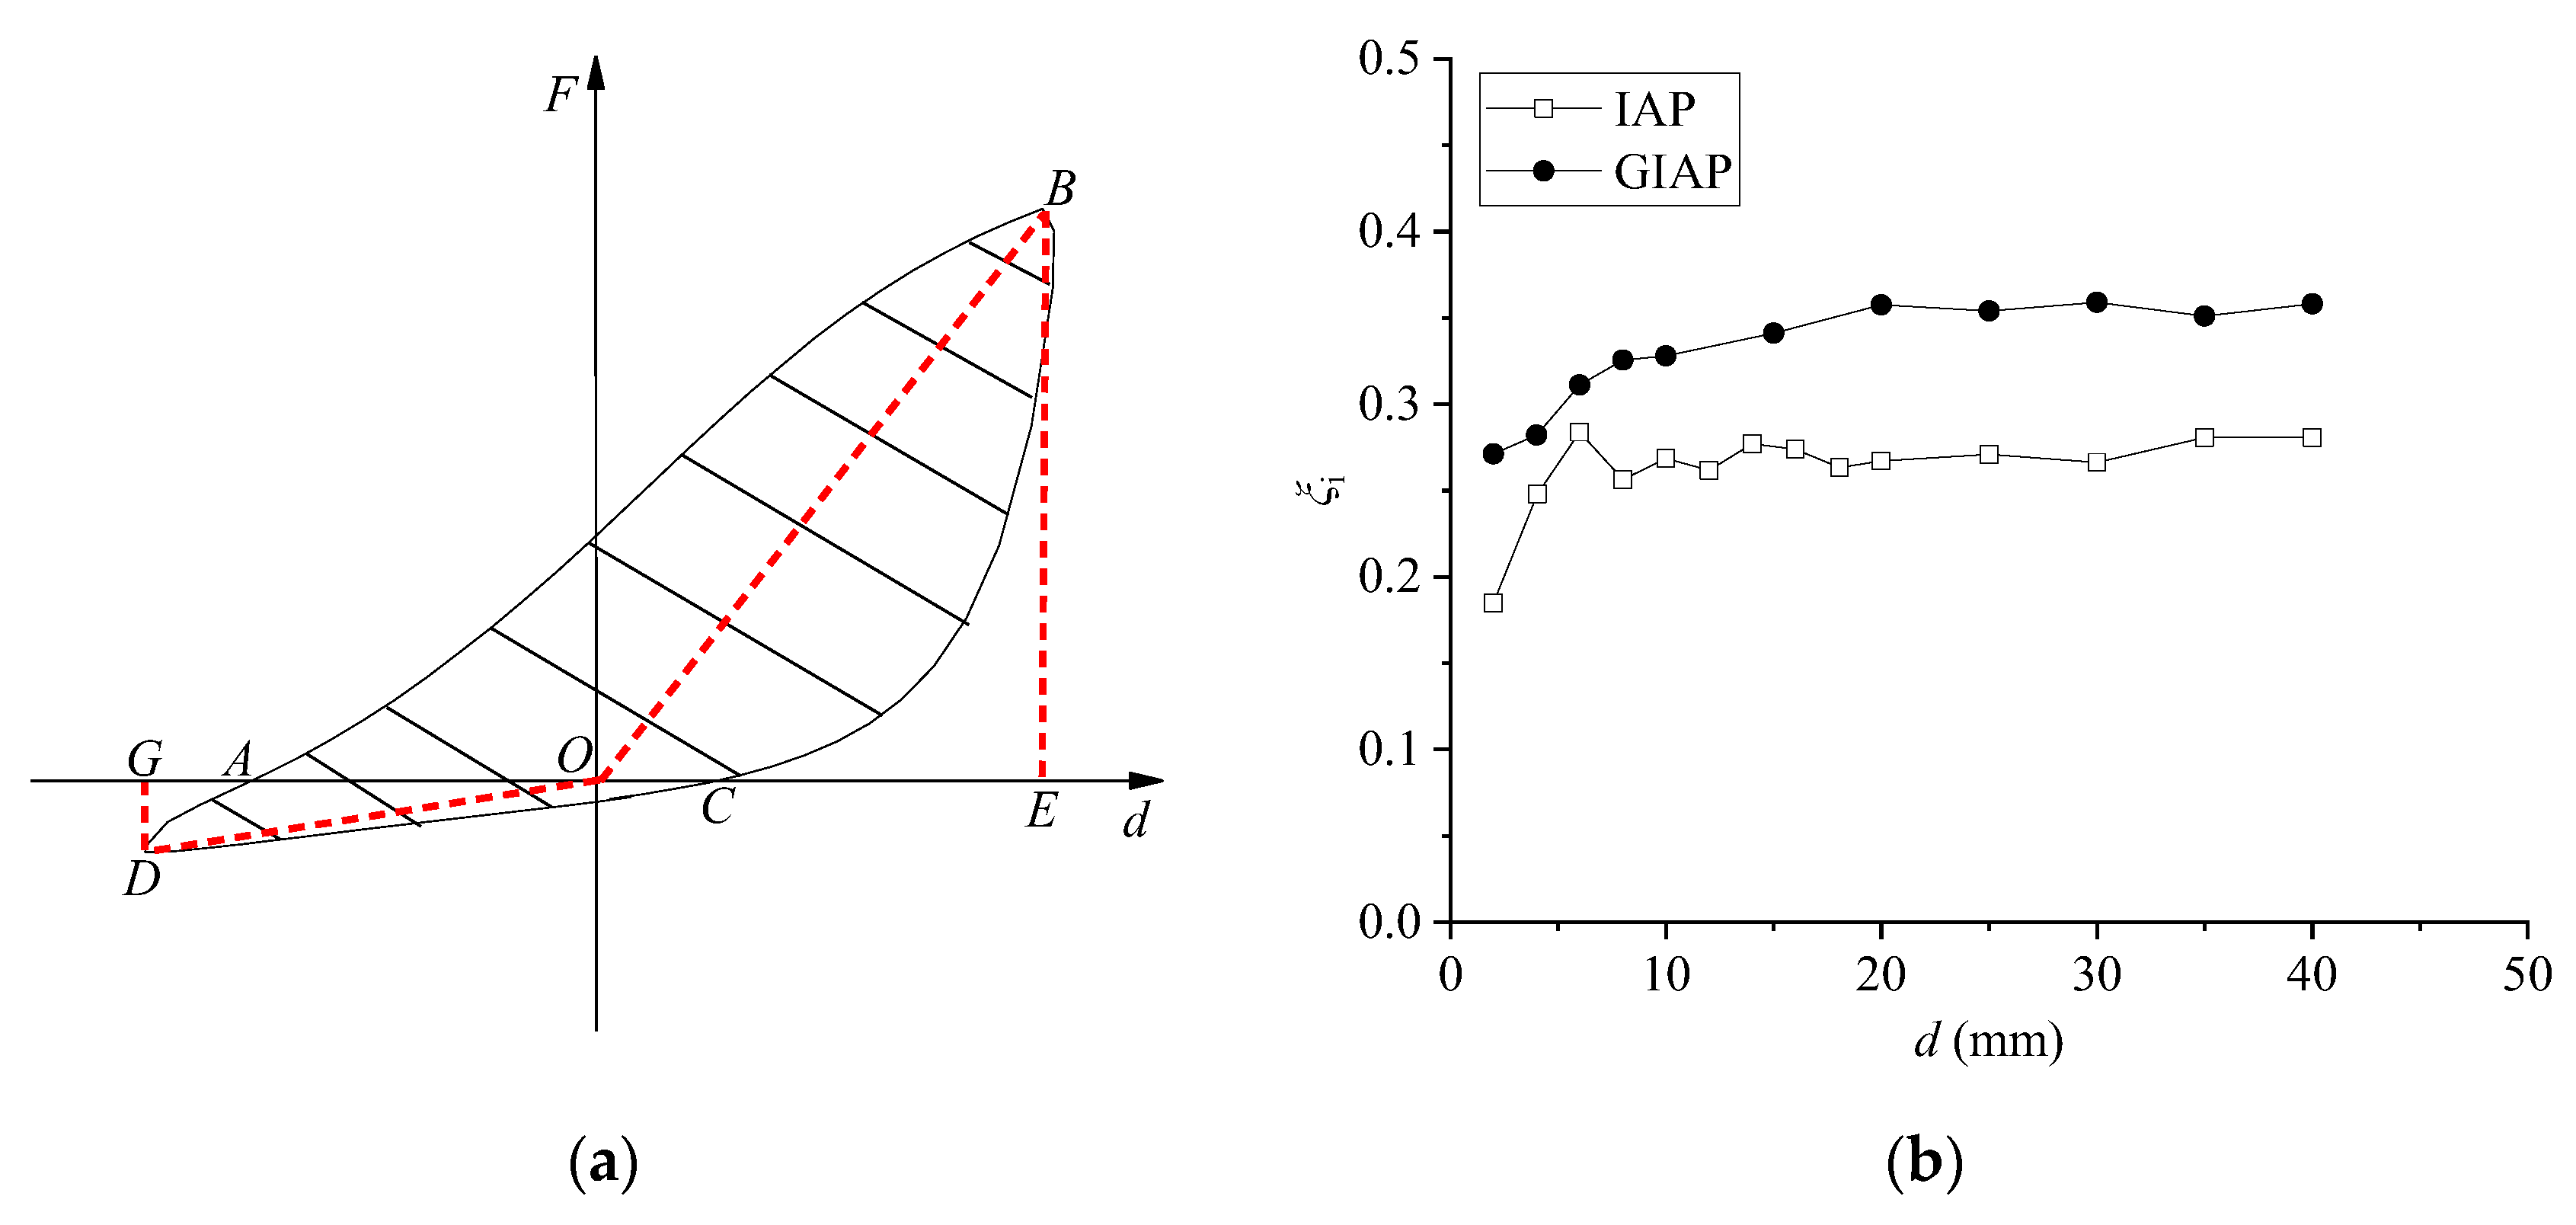
4.3. Equivalent Viscous Damping Ratio
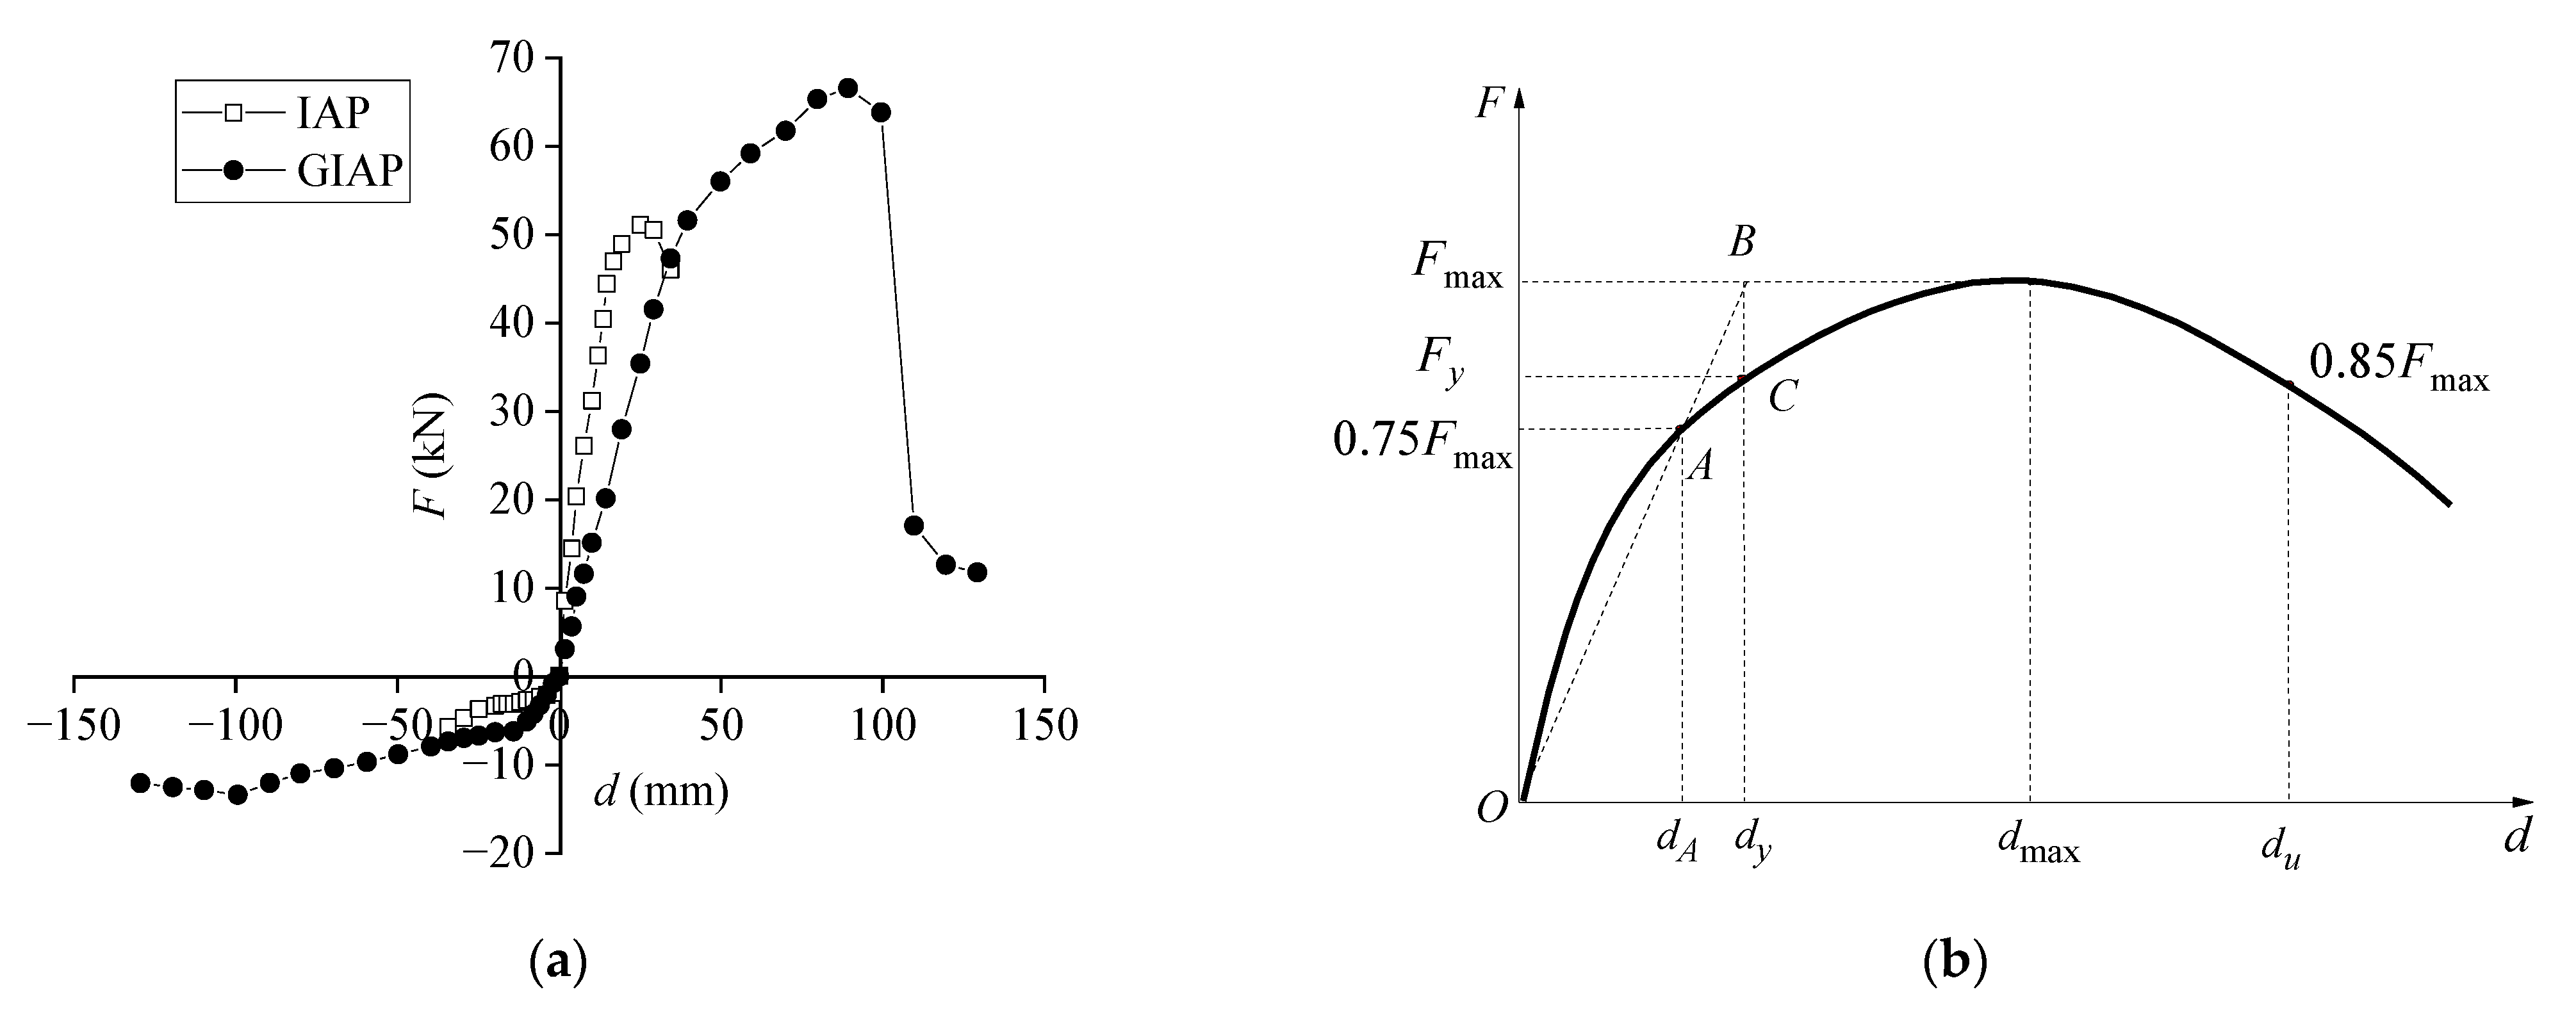
The equivalent viscous damping ratio (ξi) can be used to evaluate the energy dissipation capacity of a structure, which is the ratio between the dissipated energy due to viscous damping and the elastic strain energy corresponding to a load cycle [34]. Under a positive d, soil–structure interactions, including both soil–abutment interactions and soil–pile interactions, should be considered. Whereas under a negative d, only soil–pile interactions should be considered. As a result, the energy dissipation capacity of the GIAP specimen–soil system under a positive d is significantly larger than that under a negative d. Therefore, only the energy dissipation capacity under a positive d was analyzed. The ξi was calculated using Equation (1), where SABCD (area filled with black inclined lines) represents the dissipated hysteretic energy and SOGD + SOBE (triangles formed by red dash lines) is the elastic strain energy obtained from the hysteresis curves, as illustrated in Figure 13a. The larger ξi, the larger the dissipated energy and the better the seismic performance of the structure.
ξ i = 1 2 π S A B C D S O G D + S O B E
Each d has three cycles. Therefore, the average ξi between three cycles of each d was calculated. The experimental ξi-d curves for IAP and GIAP specimens are illustrated in Figure 13b. It can be found that the ξi for IAP specimen changes from 0.18 to 0.28 with an approximate average ξi of 0.26, and the ξi for GIAP specimen changes from 0.27 to 0.36 with an approximate average ξi of 0.34. Therefore, the energy dissipation capacity in the GIAP specimen is underestimated when the girder is not considered.

4.4. Skeleton Curve

The skeleton curves for the IAP and GIAP specimens can be obtained from the hysteresis curves, as shown in Figure 14a. The skeleton curves decrease when d exceeds +25 mm for the IAP specimen and when d exceeds +90 mm for the GIAP specimen, which indicates the failure of the specimen. It is demonstrated that the load-bearing capacity of the GIAP specimen–soil system may be underestimated if the girder is not considered. The determination process of the Park method [51] is, as shown in Figure 14b, the following: (1) A horizontal line is drawn at 75% of the maximum load-bearing capacity (Fmax), intersecting the skeleton curve at Point A. The horizontal coordinate of Point A is defined as the elastic displacement (dA). (2) A line is extended from the origin through Point A to intersect the horizontal line at the peak of the skeleton curve at Point B. (3) A vertical line is drawn through Point B to intersect the skeleton curve at Point C. The vertical coordinate of Point C is taken as the yield load (Fy) and the horizontal coordinate as the yield displacement (dy). The ultimate load (Fu) is defined as 0.85 Fmax, with the corresponding horizontal coordinate as the ultimate displacement (du). As mentioned in Section 3.3, the soil–abutment interaction and soil–pile interaction should be considered under a positive d, and only the soil–pile interaction should be considered under a negative d. As a result, the Fy and Fu of the GIAP specimen–soil system under a positive d are significantly larger than those under a negative d. Therefore, only the parameters for the skeleton curves under a positive d were analyzed. The Fy, Fu, elastic displacement range (0~dA), and elastoplastic displacement range (dA~dy) for the GIAP specimen, as determined using the Park method [51] with the same parameters for the skeleton curve for the IAP specimen [36], under a positive d are listed in Table 2. It can be observed that the Fy, Fu, and du for the GIAP specimen are larger than those of the IAP specimen. The elastic stage of the skeleton curve for the GIAP specimen (0~37.7 mm) is larger than that for the IAP specimen (0~12 mm). Therefore, the load-bearing capacity and elastic range of the skeleton curve for the GIAP specimen are underestimated if the girder is not considered.

4.5. Displacement Ductility

The structural ductility can describe the relative deformation capacity under seismic loads. The displacement ductility factor (μ) is the ratio of the ultimate displacement to the yield displacement, which can be calculated using Equation (2) [52,53].
μ = du/dy
By substituting the values of du and dy for the IAP and GIAP specimens listed in Table 2 into Equation (2), the μ for the GIAP specimen (2.14) is 1.67 times larger than that for the IAP specimen (1.28). The IAP specimen is classified as having moderate ductility with an average deformation capacity during earthquakes [54]. The GIAP specimen has a greater deformation capacity and better seismic performance than the IAP specimen. Therefore, the relative deformation capacity of the GIAP specimen is underestimated if the girder is not considered.

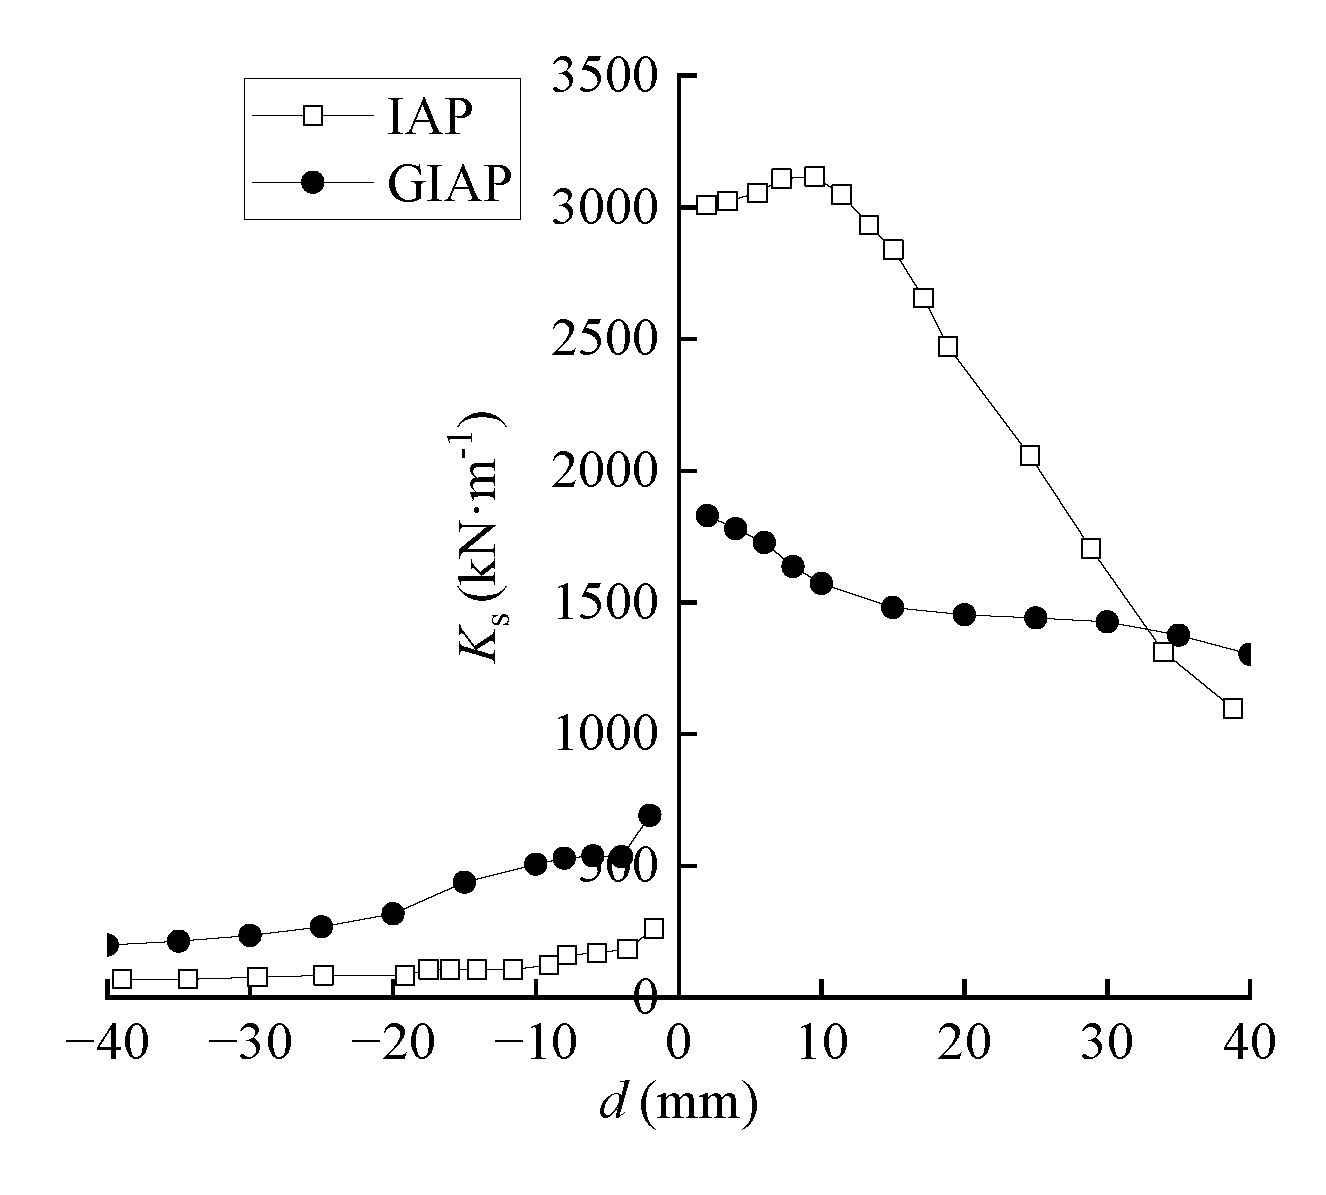
4.6. Stiffness Degradation

The secant stiffness (Kg), as in the “Specification for seismic test of buildings (JGJ/T 101-2015)” [52], reflects the stiffness degradation of the structure caused by an increasing horizontal displacement. Kg is calculated using Equation (3), where the ±Fi is the positive or negative peak load and ±Xi is the corresponding positive or negative peak displacement during the i-th cycle.
K g = + F i + F i + X i + X i
Kg [52], as modified in the literature [36], can be calculated using Equation (4).
Ks = ±FiXi
The stiffness degradation (Ks-d) curves of the IAP and GIAP specimens are compared in Figure 15. Under a positive d, the initial Ks for the IAP and GIAP specimens are 3009 and 1830 kN·m−1, respectively. When d is +40 mm, the positive Ks for the IAP and GIAP specimens are 1098 and 1327 kN·m−1, with reductions of 63.5% and 27.5%, respectively. Under a negative d, the initial Ks for the IAP and GIAP specimens are 261 and 555 kN·m−1, respectively. When d is −40 mm, the negative Ks for the IAP and GIAP specimens are 69 and 199 kN·m−1, with reductions of 73.6% and 64.1%, respectively. It was found that the Ks for the GIAP specimen is smaller than that for the IAP specimen under a positive d, while the Ks for the GIAP specimen is larger than that for the IAP specimen under a negative d. The reduction in Ks for the GIAP specimen is smaller than that for the IAP specimen under any d. Therefore, the initial Ks under a positive d and the reduction in Ks under any d in the GIAP specimen are overestimated, while the initial Ks under a negative d in the GIAP specimen is underestimated if the girder is not considered.

5. Conclusions

Experimental pseudo-static low-cycle tests on the girder–integral abutment–RC pile–soil system revealed the following aspects within the limitations of this paper, as follows:
  • The failure modes of the girder–integral abutment–pile system with or without the girder were different. For the integral abutment–pile system, only the piles were severely damaged, and no damage could be found to the abutments. For the girder–integral abutment–pile system, the piles were damaged at the beginning and then the abutments were also damaged under a large horizontal displacement. Compared to the system without the girder, the horizontal displacement corresponding to the first crack on the pile of the girder–integral abutment–pile system was larger, and the damage to the pile was less severe, which is beneficial to the piles. The damage to the abutments in the girder–integral abutment–pile system should attract attention;
  • Compared to the system without a girder, reductions of 39.2%, 22.6%, and 12.6% in the initial stiffness under positive horizontal displacement, residual force accumulation, and residual deformation were observed in the girder–integral abutment–pile system, respectively. Increments of 112.6%, 67.2%, 30.8%, 20.4%, and 7.8% in the initial stiffness under negative horizontal displacement, displacement ductility ratio, average equivalent viscous damping ratio, yield load, and ultimate load were observed in the girder–integral abutment–pile system, respectively;
  • Compared to the system without the girder, a smaller elastoplastic stage range and a larger elastic stage range of the skeleton curve, as well as less reduction in the stiffness, were observed in the girder–integral abutment–pile system;
  • To accurately reflect the seismic performance of a girder–integral abutment–RC pile–soil system, it is suggested to consider the girder. When the girder was considered, the resistance of the girder–integral abutment–RC pile–soil system against earthquakes increased because of the increased energy dissipation capacity and displacement ductility, as well as the decreased stiffness degradation. Moreover, the failure mode of the specimen changed from severe damage to the pile top under a small displacement to damage to both the abutment and pile top under a large displacement. From a practical point of view, the repair of abutments is easier than that of piles.
This research serves as a basis for more in-depth investigations into the performance of girder–integral abutment–pile–soil systems in IABs. In future research, the influence of different parameters on the seismic performance of the girder–integral abutment–pile–soil system will be investigated in detail through experimental tests.

Author Contributions

Conceptualization, B.B., J.X. and C.N.; methodology, W.G., B.B., J.X. and C.N.; validation, W.G., B.B., J.X. and C.N.; formal analysis, W.G. and J.X.; investigation, W.G.; resources, F.H.; data curation, W.G. and J.X.; writing—original draft preparation, W.G.; writing—review and editing, W.G., B.B., J.X., C.N. and F.H.; visualization, W.G.; supervision, B.B., J.X. and C.N.; project administration, J.X.; funding acquisition, B.B. and J.X. All authors have read and agreed to the published version of the manuscript.

Funding

This research was funded by the National Natural Science Foundation of China (51778148); the National Natural Science Foundation of China (51508103); the Recruitment Program of Global Experts Foundation (TM2012-27); the 2023 Fujian Provincial Transportation Science and Technology Demonstration Project (SF20230202); the Open Project Fund of the Sustainable and Innovative Bridge Engineering Research Center of Fujian Province University (Grant No. SIBERC 202203); and the Open Project of Fujian Provincial Key Laboratory on Multi-Disasters Prevention and Mitigation in Civil Engineering (MPMC-2022-4).

Institutional Review Board Statement

Not applicable.

Informed Consent Statement

Not applicable.

Data Availability Statement

The original contributions presented in the study are included in the article, further inquiries can be directed to the corresponding author.

Acknowledgments

The authors would also like to acknowledge the Sustainable and Innovative Bridge Engineering Research Center (SIBERC) of the College of Civil Engineering, Fuzhou University (Fuzhou, China), and the Joint International Research Laboratory of Deterioration and Control of Coastal and Marine Infrastructures and Materials, College of Civil Engineering, Fuzhou University (Fuzhou, China).

Conflicts of Interest

The authors declare no conflicts of interest.

References

  1. Huang, F.Y.; Lin, Y.W.; Chen, J.F.; Yang, F.F. Interaction of integral abutment-H-shaped steel pile-soil under reciprocating low-cycle pseudo-static test. China J. Highw. Transp. 2019, 32, 100–114. (In Chinese) [Google Scholar]
  2. Aloisio, A.; Pelliciari, M.; Xue, J.Q.; Fragiacomo, M.; Briseghella, B. Effect of pre-hole filled with high-damping material on the inelastic response spectrum of integral abutment bridges. J. Earthq. Eng. 2023, 27, 3319–3340. [Google Scholar] [CrossRef]
  3. Dicleli, M.; Erhan, S. Effect of soil and substructure properties on live-load distribution in integral abutment bridges. J. Bridge Eng. 2008, 13, 527–539. [Google Scholar] [CrossRef]
  4. Khodair, Y.A.; Hassiotis, S. Analysis of soil–pile interaction in integral abutment. Comput. Geotech. 2005, 32, 201–209. [Google Scholar] [CrossRef]
  5. Arockiasamy, M.; Butrieng, N.; Sivakumar, M. State-of-the-art of integral abutment bridges: Design and practice. J. Bridge Eng. 2004, 9, 497–506. [Google Scholar] [CrossRef]
  6. Kim, W.; Laman, J.A.; Zareian, F.; Min, G.; Lee, D. Influence of construction joint and bridge geometry on integral abutment bridges. Appl. Sci. 2021, 11, 5031. [Google Scholar] [CrossRef]
  7. Sigdel, L.D.; Al-Qarawi, A.; Leo, C.J.; Liyanapathiranaet, S.; Hu, P. Geotechnical design practices and soil–structure interaction effects of an integral bridge system: A review. Appl. Sci. 2021, 11, 7131. [Google Scholar] [CrossRef]
  8. Ní Choine, M.; O’Connor, A.J.; Padgett, J.E. Comparison between the seismic performance of integral and jointed concrete bridges. J. Earthq. Eng. 2015, 19, 172–191. [Google Scholar] [CrossRef]
  9. Kozak, D.L.; LaFave, J.M.; Fahnestock, L.A. Seismic modeling of integral abutment bridges in illinois. Eng. Struct. 2018, 165, 170–183. [Google Scholar] [CrossRef]
  10. Mahjoubi, S.; Maleki, S. Finite element modelling and seismic behaviour of integral abutment bridges considering soil–structure interaction. Eur. J. Environ. Civ. Eng. 2020, 24, 767–786. [Google Scholar] [CrossRef]
  11. Salman, N.N.; Issa, M.A. Calibration and parametric investigation of integral abutment bridges. Eng. Struct. 2021, 227, 111381. [Google Scholar] [CrossRef]
  12. Faraji, S.; Ting, J.M.; Crovo, D.S.; Ernst, H. Nonlinear analysis of integral bridges: Finite-element model. J. Geotech. Geoenviron. Eng. 2001, 127, 454–461. [Google Scholar] [CrossRef]
  13. Perić, D.; Miletić, M.; Shah, B.R.; Esmaeily, A.; Wang, H.Y. Thermally induced soil structure interaction in the existing integral bridge. Eng. Struct. 2016, 106, 484–494. [Google Scholar] [CrossRef]
  14. Naji, M.; Firoozi, A.A.; Firoozi, A.A. A review: Study of integral abutment bridge with consideration of soil-structure interaction. Lat. Am. J. Solids Struct. 2020, 17, e252. [Google Scholar] [CrossRef]
  15. Briseghella, B.; Huang, F.Y.; Fiorentino, G. Seismic behaviour of novel integral abutment bridges. NED Univ. J. Res. 2019, 1, 1–20. [Google Scholar] [CrossRef]
  16. Liang, C.; Liu, Y.; Yang, F. Flexural strengths of steel girder-concrete abutment connections incorporating the effect of perfobond connectors. Eng. Struct. 2020, 214, 110611. [Google Scholar] [CrossRef]
  17. Xue, J.Q.; Aloisio, A.; Lin, Y.B.; Fragiacomo, M.; Briseghella, B. Optimum design of piles with pre-hole filled with high-damping material: Experimental tests and analytical modeling. Soil Dyn. Earthq. Eng. 2021, 151, 106995. [Google Scholar] [CrossRef]
  18. Goel, R.K. Earthquake characteristics of bridges with integral abutments. J. Struct. Eng. 1997, 123, 1435–1443. [Google Scholar] [CrossRef]
  19. Peng, D.W.; Hong, J.X.; Guo, A.M.; Fang, D.M. Dynamic field-test of integral abutment bridge. China J. Highw. Transp. 2004, 17, 59–63. (In Chinese) [Google Scholar]
  20. Peng, D.W.; Hong, J.X.; Guo, A.M.; Fang, D.M. Dynamic analysis and field-test of jointless bridge. Earthq. Eng. Eng. Dyn. 2005, 25, 72–76. (In Chinese) [Google Scholar]
  21. Zhao, Q.H.; Qi, Z.Y.; An, Z.Y.; Chen, B.C. Parametric analysis on seismic behavior of integral abutment steel bridge considering SSI. J. Traffic Transp. Eng. 2018, 18, 35–46. (In Chinese) [Google Scholar]
  22. Erhan, S.; Dicleli, M. Comparative assessment of the seismic performance of integral and conventional bridges with respect to the differences at the abutments. Bull. Earthq. Eng. 2015, 13, 653–677. [Google Scholar] [CrossRef]
  23. Kozak, D.L.; Fahnestock, L.A.; Lafave, J.M. Effect of soil conditions on the seismic response of three-span integral abutment bridges. In Proceedings of the Structures Congress, Fort Worth, TX, USA, 19–21 April 2018; pp. 100–110. [Google Scholar]
  24. Huang, C.G. Seismic response analysis of integral abutment skew beam bridges under earthquake excitation. J. Water Resour. Archit. Eng. 2020, 18, 182–188. (In Chinese) [Google Scholar]
  25. An, Z.Y. Seismic Performance Studies of Integral Abutment Steel Bridges Considering Soil-Structure Interaction. Master’s Thesis, Tianjin University, Tianjin, China, 2016. (In Chinese). [Google Scholar]
  26. Hong, J.X.; Peng, D.W. Effect of the abutment stiffness on integral abutment bridges. J. Highw. Transp. Res. Dev. 2006, 23, 77–81. (In Chinese) [Google Scholar]
  27. Vasheghani-Farahani, R.; Zhao, Q.H.; Burdette, E.G. Seismic analysis of integral abutment bridge in Tennessee, including soil–structure interaction. Transp. Res. Rec. 2010, 2201, 70–79. [Google Scholar] [CrossRef]
  28. Shi, L.F.; Xu, M. Analysis of seismic response of integral bridge abutments. Rock Soil Mech. 2014, 35, 3289–3297. (In Chinese) [Google Scholar]
  29. Dhar, S.; Dasgupta, K. Seismic soil structure interaction for integral abutment bridges: A review. Transp. Infrastruct. Geotech. 2019, 6, 249–267. [Google Scholar] [CrossRef]
  30. Frosch, R.J.; Kreger, M.E.; Talbott, A.M. Earthquake Resistance of Integral Abutment Bridges; Technical Report; Purdue University: West Lafayette, IN, USA, 2009. [Google Scholar]
  31. Wilson, J.C.; Tan, B.S. Bridge abutments: Formulation of simple model for earthquake response analysis. J. Eng. Mech. 1990, 116, 1828–1837. [Google Scholar] [CrossRef]
  32. Easazadeh Far, N.; Barghian, M. Safety identifying of integral abutment bridges under seismic and thermal loads. Sci. World J. 2014, 2014, 757608. [Google Scholar] [CrossRef]
  33. Elmy, M.H.; Nakamura, S. Static and seismic behaviours of innovative hybrid steel reinforced concrete bridge. J. Constr. Steel Res. 2017, 138, 701–713. [Google Scholar] [CrossRef]
  34. Huang, F.Y.; Wu, S.W.; Luo, X.Y.; Chen, B.C.; Lin, Y.W. Pseudo-static low cycle test on the mechanical behavior of PHC pipe piles with consideration of soil-pile interaction. Eng. Struct. 2018, 171, 992–1006. [Google Scholar] [CrossRef]
  35. Huang, F.Y.; Shan, Y.L.; Javanmardi, A.; Luo, X.Y.; Chen, B.C. Seismic performance of various piles considering soil–pile interaction under lateral cycle loads for integral abutment jointless bridges (IAJBs). Appl. Sci. 2020, 10, 3406. [Google Scholar] [CrossRef]
  36. Huang, F.Y.; He, L.F.; Shan, Y.L.; Hu, C.X.; Zhou, Z.M. Experiment on interaction of soil-abutment-RC pile in integral abutment jointless bridges (IAJBs). Rock Soil Mech. 2021, 42, 1803–1814. (In Chinese) [Google Scholar]
  37. Fu, R.H.; Briseghella, B.; Xue, J.Q.; Aloisio, A.; Lin, Y.B.; Nuti, C. Experimental and finite element analyses of laterally loaded RC piles with pre-hole filled by various filling materials in IABs. Eng. Struct. 2022, 272, 114991. [Google Scholar] [CrossRef]
  38. Durante, M.G.; Di Sarno, L.; Mylonakis, G.; Taylor, C.A.; Simonelli, A.L. Soil–pile–structure interaction: Experimental outcomes from shaking table tests. Earthq. Eng. Struct. Dyn. 2016, 45, 1041–1061. [Google Scholar] [CrossRef]
  39. XTRACT Analysis User’s Manual, v3.0.5; XTRACT Inc.: Charlotte, NC, USA, 2006.
  40. Zhao, M.H.; Chen, C.F. Soil Mechanics and Foundation Engineering; Wuhan University of Technology Press: Wuhan, China, 2014; pp. 96–97. (In Chinese) [Google Scholar]
  41. Qian, H.M. Experimental Investigation on Seismic Performance of PHC Pile in Integral Abutment Bridge. Master’s Thesis, Fuzhou University, Fuzhou, China, 2016. (In Chinese). [Google Scholar]
  42. Lou, M.L.; Wang, W.J.; Zhu, T.; Ma, H.C. Soil lateral boundary effect in shaking table model test of soil-structure system. Earthq. Eng. Eng. Vib. 2000, 20, 30–36. (In Chinese) [Google Scholar]
  43. Lawver, A.; French, C.; Shield, C.K. Field performance of integral abutment bridge. Transp. Res. Rec. 2000, 1740, 108–117. [Google Scholar] [CrossRef]
  44. William, G.W.; Shoukry, S.N.; Riad, M.Y. Study of thermal stresses in skewed integral abutment steel girder bridges. Struct. Eng. Int. 2012, 22, 308–317. [Google Scholar] [CrossRef]
  45. Dicleli, M.; Erhan, S. Effect of soil–bridge interaction on the magnitude of internal forces in integral abutment bridge components due to live load effects. Eng. Struct. 2010, 32, 129–145. [Google Scholar] [CrossRef]
  46. Gama, D.; Almeida, J.F. Concrete integral abutment bridges with reinforced concrete piles. Struct. Concr. 2014, 15, 292–304. [Google Scholar] [CrossRef]
  47. Noorzaei, J.; Abdulrazeg, A.A.; Jaafar, M.S.; Kohnehpooshi, O. Non-linear analysis of an integral bridge. J. Civ. Eng. Manag. 2010, 16, 387–394. [Google Scholar] [CrossRef]
  48. Pan, W.T. Research on Reduced Scale Effect on Pre-Hole Pile-Soil Interaction of Integral Abutment Bridge. Master’s Thesis, Fuzhou University, Fuzhou, China, 2020. (In Chinese). [Google Scholar]
  49. Huang, F.Y.; Li, L.; He, L.F.; Hu, C.X. Mechanical behavior of abutment-RC pile-soil structure in integral abutment bridges. Harbin Inst. Technol. 2023, 55, 128–138. (In Chinese) [Google Scholar]
  50. GB 50010-2010; Code for Design of Concrete Structures. China Architecture & Building Press: Beijing, China, 2015. (In Chinese)
  51. Park, R. Evaluation of ductility of structures and structural assemblages from laboratory testing. Bull. N. Z. Soc. Earthq. Eng. 1989, 22, 155–166. [Google Scholar] [CrossRef]
  52. JGJ/T 101-2015; Specification for Seismic Test of Buildings. China Architecture & Building Press: Beijing, China, 2015. (In Chinese)
  53. Ye, X.G.; Wang, H.B.; Sun, L.M.; Zuo, X.M.; Wang, R.G. Experimental research on seismic energy dissipation performance of reinforced concrete bridge pier. J. Hefei Univ. Technol. (Nat. Sci.) 2005, 28, 1171–1177. (In Chinese) [Google Scholar]
  54. Wang, K.H. Seismic Research of Bridge; China Railway Publishing House: Beijing, China, 2014; pp. 544–554. (In Chinese) [Google Scholar]
Figure 1. Experiment diagram: (a) IAP [36]; (b) GIAP.
Applsci 14 10166 g001
Figure 2. Engineering background: (a) overall view of the IAB; (b) details on the girder, integral abutment, and pile (unit: cm).
Applsci 14 10166 g002
Figure 3. Information on the GIAP specimen (unit: mm).
Applsci 14 10166 g003
Figure 4. GIAP specimen fabrication: (a) rebar cages for the girder–integral abutment–pile cap connection; (b) rebar cages for the pile; (c) pre-embedded high-strength threaded rods in the girder; (d) pile specimen; (e) welded connection of rebars between the pile and pile cap; (f) girder–integral abutment–pile specimen.
Applsci 14 10166 g004
Figure 5. Rigid steel container and test setup.
Applsci 14 10166 g005
Figure 6. Vertical displacement restraint device at the girder end.
Applsci 14 10166 g006
Figure 7. Horizontal displacement history.
Applsci 14 10166 g007
Figure 8. Concrete strain gauges.
Applsci 14 10166 g008
Figure 9. Concrete strain of the pile: (a) IAP under a negative d; (b) GIAP under a negative d; (c) IAP under a positive d; (d) GIAP under a positive d. The points with a tensile strain larger than 200 με were emphasized by red dash circle.
Applsci 14 10166 g009aApplsci 14 10166 g009b
Figure 10. Concrete strain of the abutment in the GIAP specimen: (a) negative d; (b) positive d. The points with a tensile strain larger than 200 με were emphasized by red dash circle.
Applsci 14 10166 g010
Figure 11. Damage to the abutment: (a) IAP [36]; (b) GIAP.
Applsci 14 10166 g011
Figure 12. Hysteresis curves: (a) IAP (d = −40~ + 40 mm) [36]; (b) GIAP (d = −130~ + 130 mm).
Applsci 14 10166 g012
Figure 13. ξi of specimen: (a) calculation diagram of ξi; (b) ξi-d curves.
Applsci 14 10166 g013
Figure 14. Skeleton curve and parameters: (a) skeleton curve; (b) parameters of the skeleton curve determined using the Park method.
Applsci 14 10166 g014
Figure 15. Improved secant stiffness degradation curve.
Applsci 14 10166 g015
Table 1. Main features of the bridge.
ComponentsDimensionValues (m)
Girder (prestressed concrete, single-box girder with three cells)Width17
Height1.6
Abutments (rectangular wall)Height5.5
Thickness1.0
Width17
Piles beneath each abutment (4 piles with a circular cross-section)Length25
Diameter1.5
Piers (rectangular twin-column piers)Height6.06
Thickness1.2
Width1.8
Piles beneath each pier (2 piles with a circular cross-section )Length32
Diameter1.8
Table 2. Comparison of the skeleton curve parameters.
SpecimenFy (kN)Fu (kN)Elastic Range (0~dA) (mm)Elastoplastic Range (dA~dy) (mm)du (mm)
IAP [36]46.652.50~1212~19.424.8
GIAP56.156.60~37.737.7~50.5108.1
Disclaimer/Publisher’s Note: The statements, opinions and data contained in all publications are solely those of the individual author(s) and contributor(s) and not of MDPI and/or the editor(s). MDPI and/or the editor(s) disclaim responsibility for any injury to people or property resulting from any ideas, methods, instructions or products referred to in the content.

