Article

Analysis of Changes in the Stress–Strain State and Permeability of a Terrigenous Reservoir Based on a Numerical Model of the Near-Well Zone with Casing and Perforation Channels

1
Oil and Gas Technologies Department, Perm National Research Polytechnic University, 614990 Perm, Russia
2
Institute of Oil and Gas Problems of the Russian Academy of Sciences, 119333 Moscow, Russia
3
School of Petroleum Engineering, China University of Petroleum, Qingdao 266580, China
*
Authors to whom correspondence should be addressed.
Appl. Sci. 2024, 14(21), 9993; https://doi.org/10.3390/app14219993
Submission received: 8 July 2024 / Revised: 30 September 2024 / Accepted: 25 October 2024 / Published: 1 November 2024
(This article belongs to the Topic Petroleum and Gas Engineering)

Abstract

:
A finite element model, which includes reservoir rock, cement stone, casing, and perforation channels, was developed. The purpose of the study is to create a geomechanical model of the zone around the well, which includes support elements and perforation channels. This model will help predict changes in the productivity coefficient of a terrigenous reservoir and determine the most efficient mode of operation of a producing well. In order to exclude the stress concentration within the casing–cement stone and cement stone–rock, the numerical model applies contact elements. As a result, structural elements slip, while the stresses are redistributed accurately. The numerical simulation of a stress state in the near-well zone was carried out by using the developed model with differential pressure drawdown on the terrigenous reservoir, one of the oil fields in the Perm region. It is shown that the safety factor of the casing reaches roughly 3–4 units. The only exceptions are the upper and lower parts of the perforations, where this parameter is close to one unit. The safety factor of cement stone accounts for 2–3 units. However, parts with its lowest value (1.35) are also concentrated near the perforation channels. In order to analyze the change in permeability, the dependence of the safety factor on effective stresses was taken into account. Therefore, it was found that, in the upper and lower parts of perforations, the stresses decreased, while permeability rose by up to 20% of the initial value. An increase in differential pressure drawdown, on the contrary, can lead to a permeability reduction of 25%, especially in the lateral parts of the perforations. Areas of rock destruction under tensile and compressive forces were identified by using the Mohr–Coulomb criterion. It is estimated that with an increase in pressure drawdown, the areas of rock destruction under tensile force disappear, while the areas of rock destruction under compression increase. After further analysis, it was found that, with the maximum pressure drawdown of 12 MPa, the well productivity index can decrease by 15% due to the reservoir rock compaction.

1. Introduction

Geomechanical and thermohydromechanical modeling is often used in the development of oil fields and the drilling, construction, and completion of wells [1,2,3,4]. For example, 1D geomechanical models have been widely applied in order to optimize the wellbore trajectory in drilling. Such models also allow us to calculate drilling the mud density window for preventing accidents during well construction in complex mining and geological conditions [5,6,7]. Based on 1D models, 3D geomechanical models are essential for determining the stress distribution throughout the oil field, including the overlying stratum. Besides, these models can be applied to analyze the influence of variable effective stresses on the filtration capacitive properties of reservoirs when reducing reservoir pressure and in the process of oil field development as a whole [8,9,10,11].
In order to predict the effectiveness of hydraulic crack creation in reservoirs and determine their geometric characteristics, geomechanical modeling is extensively applied [12,13,14], as well as to prevent sand removal from poorly cemented reservoirs [15,16,17]. For a more detailed analysis of the stress state near the well, numerical models of near-well zones are examined, considering cumulative and slotted perforations [18,19].
Currently, the issues of determining the stress–strain state of the near-well formation zone remain relevant. A number of models are based on an accurate analytical solution of the Lame problem of elasticity theory for a thick-walled cylinder loaded with external and internal pressures, but despite their widespread use, they do not take into account the influence of pore pressure and its gradient on the stress–strain state, which makes calculations very approximate [20].
The present research discusses the features and results of modeling the near-well zone on the example of a numerical finite element model, which includes casing, cement stone, and oil-saturated rocks and takes into account the geometry of perforation channels.
There are a large number of wells in the Perm Region, and their number is growing every year. An increase in the flow rate of these wells by 3–5% is of great importance for oil production in the region. This model will ensure that there are reliable calculations of the stress distribution in the considered elements of the well and rocks, which in turn, will allow the user to assess the stability of the casing, cement stone, and rocks. Moreover, the model will estimate changes in the rock permeability of the near-well zone and in the well productivity index.

2. Methodology

To calculate stresses near the well, we applied the ANSYS 19 simulation software, which contains ratios describing the behavior of elastic and poroelastic material. This software has been widely used for solving geomechanical problems in the development of oil fields [21,22,23].
In order to understand how solid bodies (casing and cement stone) change their shape, it is useful to compute the relation between the forces applied on the object and the corresponding change in shape. In simple terms, it relates the stresses and the strains in the material. Thus, to calculate stresses in the casing and cement stone, we used the following ratios, which describe a linear elastic material (where the relationship between stress and strain is linear):
Equations of motion (moments):
j σ i j x j + ρ f i = 0 ;   i , j     = 1 , 2 , 3 ,
where σji are the components of the stress tensor; ∂xj is the derivative of the J-coordinate; ρfi are the mass forces;
Geometric equations:
ε i j = 1 2 u i x j + u j x i ;   i , j = 1 , 2 , 3 ,
where εji is the components of the strain tensor; u is the components of the displacement vector;
Physics relations (in this case, Hooke’s law of linear elasticity):
σ = D ε ,
where {σ} is the stress tensor; [D] is the matrix of elastic constants; {ε} is the strain tensor.
ANSYS also provides a special model of porous elasticity, which contains the following system of equations describing the behavior of poroelastic material:
· σ + f = 0   o r   · σ α p I + f = 0 α   ε ˙ V + 1 K m p ˙ + · q = S  
where σ is the stress tensor; ε ˙ V is derivative of volumetric deformations of the rock matrix; p ˙ is the pore pressure derivative; · is the divergence operator; σ′ is the effective stress tensor; α is the Biot coefficient; p is the pore pressure; I is the second order unit tensor; f is the force vector; εV stands for the volumetric deformations of the rock matrix; Km is the Biot modulus; q is the fluid flow vector; S is the flow source.
Besides, we applied the equations for the inter-relations between stresses and deformations:
σ = D ε e ,
where εe is the strain tensor; D is the matrix of elastic constants.
Darcy’s law was used to describe the fluid flow in a porous media:
q = k p / μ ,
where k is the second order permeability tensor; ∇ is the gradient operator; μ is the fluid viscosity.
Figure 1 shows the finite element model of the stress–strain state near the well. We developed the model based on the well patterns commonly used in the oil fields of the Perm Region. Table 1 presents the geometric characteristics of the model and the elastic properties of the steel casing. Apart from perforation channels and productive rocks, this model also includes the main structural elements of the well: the casing and cement stone. For modeling an elastic medium, eight-node finite elements in the form of solid185 prisms were used, and for a poroelastic medium, cpt215, was also represented by eight-node prisms. In the ANSYS system, it is possible to replace eight-node finite elements with sixteen-node ones: cpt216 and solid186, respectively. However, this approach significantly increases the number of nodes in the model, which in turn, significantly increases the calculation time. Since we needed to perform calculations on a variety of options depending on the pressure in the well, we decided to save time and use eight-node finite elements, which are more efficient for our case.
In the ANSYS software package, to determine the convergence criterion, the calculation accuracy was set for stresses, which was 1 × 10⁻⁸, and for pressure at 1 × 10⁻¹⁰. At lower accuracy values, for example 1 × 10⁻⁹ for stresses, the numerical calculation stopped converging.
The following commands were used to set up the calculation:
  • ANTYPE, STATIC: this command was used for static analysis, which is used in calculating stresses in a linearly elastic medium and pressure for a poroelastic medium.
  • NROPT, full: This command configures the Newton–Raphson method for a static or full transient analysis. The “full” parameter means using the full Newton–Raphson method with nonsymmetric element matrices, if such an option is available.
A contact element represents a simulation component used to model the contact behavior between materials with different deformation properties. In our case, the finite element model applies contact elements between casing–cement stone and cement stone–rock. Thus, the contact elements simulate the slip of cement stone along the casing and the rocks. On the contrary, if we were to consider the model with the continuous contact elements, the stresses would not be redistributed accurately. When vertical stresses are applied to the upper boundary of the finite element model, stress concentrations occur within the casing–cement stone and cement stone–rock points of contact due to the different values of their elastic characteristics. Therefore, the stress distribution will not correspond to reality. To avoid this effect, researchers set a condition in the form of displacements fixed along the normal to the surface at the upper boundary of the model. This approach is possible when stresses are calculated near the open trunk of a vertical well or a cased well without perforation channels. However, if the model includes perforations, the vertical stress component will not be calculated accurately with the same boundary conditions.
To test the model, calculations were first performed without taking into account the perforation channels, cement stone, and production column, that is, assuming an open vertical borehole. Filtration rates were calculated, and well productivity was determined. The results of the numerical calculation of the well productivity were compared with the analytical calculation using the Dupuy formula. The discrepancies between the numerical and analytical solutions amounted to 3.8%, which is considered quite acceptable. In the future, the authors plan to compare the calculation model with data from field studies of the productivity of wells, developing this productive facility.
At the same time, if we use contact elements for obtaining the slip of material, the stress concentration will not occur, and radial stresses between the rock, cement stone, and casing will be transmitted naturally.
The chosen approach allows us to calculate the stress distribution (including the vertical component) in the near-well zone more accurately.
The following assumptions were made during the calculations:
  • A linear elastic model was used to describe the behavior of a steel production column, since it adequately describes the properties of durable steel in the range of design stresses.
  • The plastic properties of the reservoir rock have not been studied in the laboratory, so it was decided to consider it as a poroelastic medium. It is worth noting that during the operation of the well, the near-well zone and the rock areas around the perforation channels are subjected to multiple cycles of loading and unloading. The experience of experimental studies has shown that, after the third cycle, such deformations of the rock are not observed, which confirms the choice of a poroelastic model for this study.
  • Cement stone has been accepted as impenetrable, which is to some extent an assumption. However, experiments show that the permeability of cement stone can manifest itself during gas filtration due to its greater mobility compared to liquid. Nevertheless, when modeling an environment saturated with water and oil, cement stone can be considered practically impenetrable.
Experimental studies of cement have also shown that the dependence of stress on deformation is close to linear. In this regard, an elastic medium was set for the cement support.
4.
The calculations did not take into account phase permeability; that is, it was assumed that only oil is filtered, and residual water saturation does not affect the phase permeability of oil.
It is important to note that the following parameters were set in the ANSYS software package to determine the convergence criterion: the accuracy of the stress calculation is 1 × 10⁻⁸, and the accuracy of the pressure calculation is 1 × 10⁻¹⁰. If we set a lower accuracy, for example, for stresses of 1 × 10⁻⁹, then the numerical calculation stopped converging.
Considering the above, the finite element model contains the following boundary conditions:
  • Vertical movements were fixed at the lower boundary;
  • Movements along the normal to the surface were fixed at the left and right lateral boundaries;
  • wo boundary conditions were set at the outer lateral surface:
Fluid pressure based on the differential pressure drawdown and the pressure on the supply circuit:
p = p b Δ p ln r / r w ln r b / r w ,
where p is the determined pressure value; pb is the pressure on the supply circuit; ∆p is the differential pressure drawdown; rb is the radius of the supply circuit; rw is the radius of the well; r is the radius from the center of the well, for which we determine the pressure value;
Horizontal stress based on the values of vertical stress and Poisson’s ratio;
4.
Vertical movements were set at the upper boundary for the casing and cement stone (imitation of a cased well); vertical stresses were applied to the rock, based on the reservoir depth and the average volume weight of the overlying rock stratum;
5.
Fluid pressure was set inside the well and in the perforation channels, taking into account the pressure drawdown value.
To determine the rock permeability, we calculated the average effective stresses in each finite element of the model according to the following ratio:
σ a v = σ 1 + σ 2 + σ 3 3 ,
where σav is the average effective stress; σ1, σ2, and σ3 are the main effective stresses.
To assess the stability of the rocks and the occurrence of plastic deformations, we applied the Mohr–Coulomb criterion to the main effective stresses:
σ 1 α p = σ c + ( σ 3 α p ) 1 + sin φ 1 sin φ ,
where σ1 and σ3 are the main maximum and minimum stresses; σc is the ultimate rock strength under uniaxial compression; φ is the angle of internal friction; α is the Biot coefficient.
The elastic strength properties of cement stone, shown in Table 2, were determined in the framework of earlier studies [18].
The physical properties of reservoir rock and the permeability dependence on average effective stresses, presented in Table 3 and Figure 2, were also determined in previous studies [21]. As shown in Figure 2, the permeability was calculated depending on the average effective stresses in each finite element.
Figure 2 presents the average effective stress of 14.2 MPa, which corresponds to the initial formation conditions.

3. Results and Discussion

Figure 3, Figure 4, Figure 5, Figure 6 and Figure 7 reveal the main calculation results obtained by simulating the stress–strain state near the well.
In order to analyze stresses for the steel casing and cement stone, we determined a safety factor from the following equations:
For the casing,
k c = σ Y σ 1 ,   safety   factor   of   the   casing
where σY is the yield strength of steel; σ1 is the maximum main stress.
For the cement stone,
k s t = σ 3 1 + s i n ( 1 s i n ) + σ U C S σ 1 ,   safety   factor   of   the   cement   stone
where σUCS is the tensile strength of cement stone under uniaxial compression.
Figure 3 proves that the casing remains stable regardless of the pressure drawdown, and the safety factor reaches 3–4 units. It should also be noted that the zones of increased and decreased stresses occur near the perforation channel. Highly stressed zones are located in the upper and lower parts of the perforation (Figure 3a). In these parts, the safety factor is significantly reduced and close to one unit, indicating that casing integrity damage may occur. At the same time, these parts are quite small and are located at a distance comparable to the radius of the perforation.
On the contrary, the zones of decreased stresses arise in the lateral parts of the perforations, where the safety factor reaches 32 units; although, these parts are also quite small.
The safety factor distribution for the cement stone differs due to its distinct elastic strength properties (Figure 4). Figure 4 indicates that depending on the differential pressure drawdown, the safety factor of cement stone varies from about 2 to 3 units. The lowest value of this parameter is concentrated near the perforation channels and represents 1.35 units. It is important to note that, with an increase in the pressure drawdown, the maximum safety factor increases, while the minimum one decreases.
The maximum value of this parameter is concentrated on the outer surface of the cement stone in contact with rocks, as well as on the upper and lower surfaces of the perforation channel.
As shown in Figure 5, permeability changes due to the creation of perforation channels and subsequent transformation of the stress distribution. We can conclude that even with the initial pressure, highly stressed zones arise on the lateral surface of the perforation due to the influence of the vertical load from the overlying rock stratum. In such zones, the permeability immediately decreases by about 15%. Moreover, with an increase in differential pressure drawdown to 9 MPa, the decrease in permeability can reach 25% of the initial value.
On the contrary, in the upper and lower parts of the perforation channels, permeability can be restored by reducing the magnitude of stresses. Thus, when we create perforations, the permeability increases by 20% of the initial value without pressure drawdown. With an increase in pressure drawdown, the zone of decreased stresses becomes smaller, and the maximum increase in permeability reaches 10–15%.
Figure 6 reveals the possible areas of rock destruction near the perforation channel. The compressive stress areas are marked in a red color, while tensile stress areas are highlighted in green. As shown in the figure, the compressive stress area lies in parallel to the tensile stress area, which extends along the lateral surface of the perforation. It is important to note that both kinds of destruction areas are close to each other, because we applied the effective stresses when using the Mohr–Coulomb criterion. It means that the pressure value, multiplied by the Biot coefficient (Ratio (8)), was subtracted from the total stresses.
When we increase the pressure drawdown, the tensile stress areas decrease because the effective stresses grow. With a pressure drawdown of 9 MPa, these zones completely disappear, while compressive stress areas can increase.
Furthermore, we assessed the dependence of the normalized productivity index on differential pressure drawdown, as shown in Figure 7. Although we consider a well section with a small thickness, it is possible to predict a change in the well productivity index caused by a decrease in permeability and an increase in pressure drawdown.
This result is a consequence of the change in permeability under the influence of effective stresses shown in Figure 5. As shown in Figure 7, a decrease in the well productivity index can reach 15% with a maximum pressure drawdown of 12 MPa. This change indicates the need to optimize well production.

4. Discussion

We developed the finite element model, which includes perforation channels, casing, rock, and cement stone. The numerical simulation of the stress–strain state near the well allows us to draw the following main conclusions:
  • In order to exclude stress concentration at the boundaries of adjacent media, the present model includes the contact elements between the casing–cement stone and cement stone–rock. As a result, it is possible to distribute stresses both in the rock and in the structural elements of the well more accurately. The reservoir rock was modeled as a poroelastic media with permeability varying due to the effective stresses.
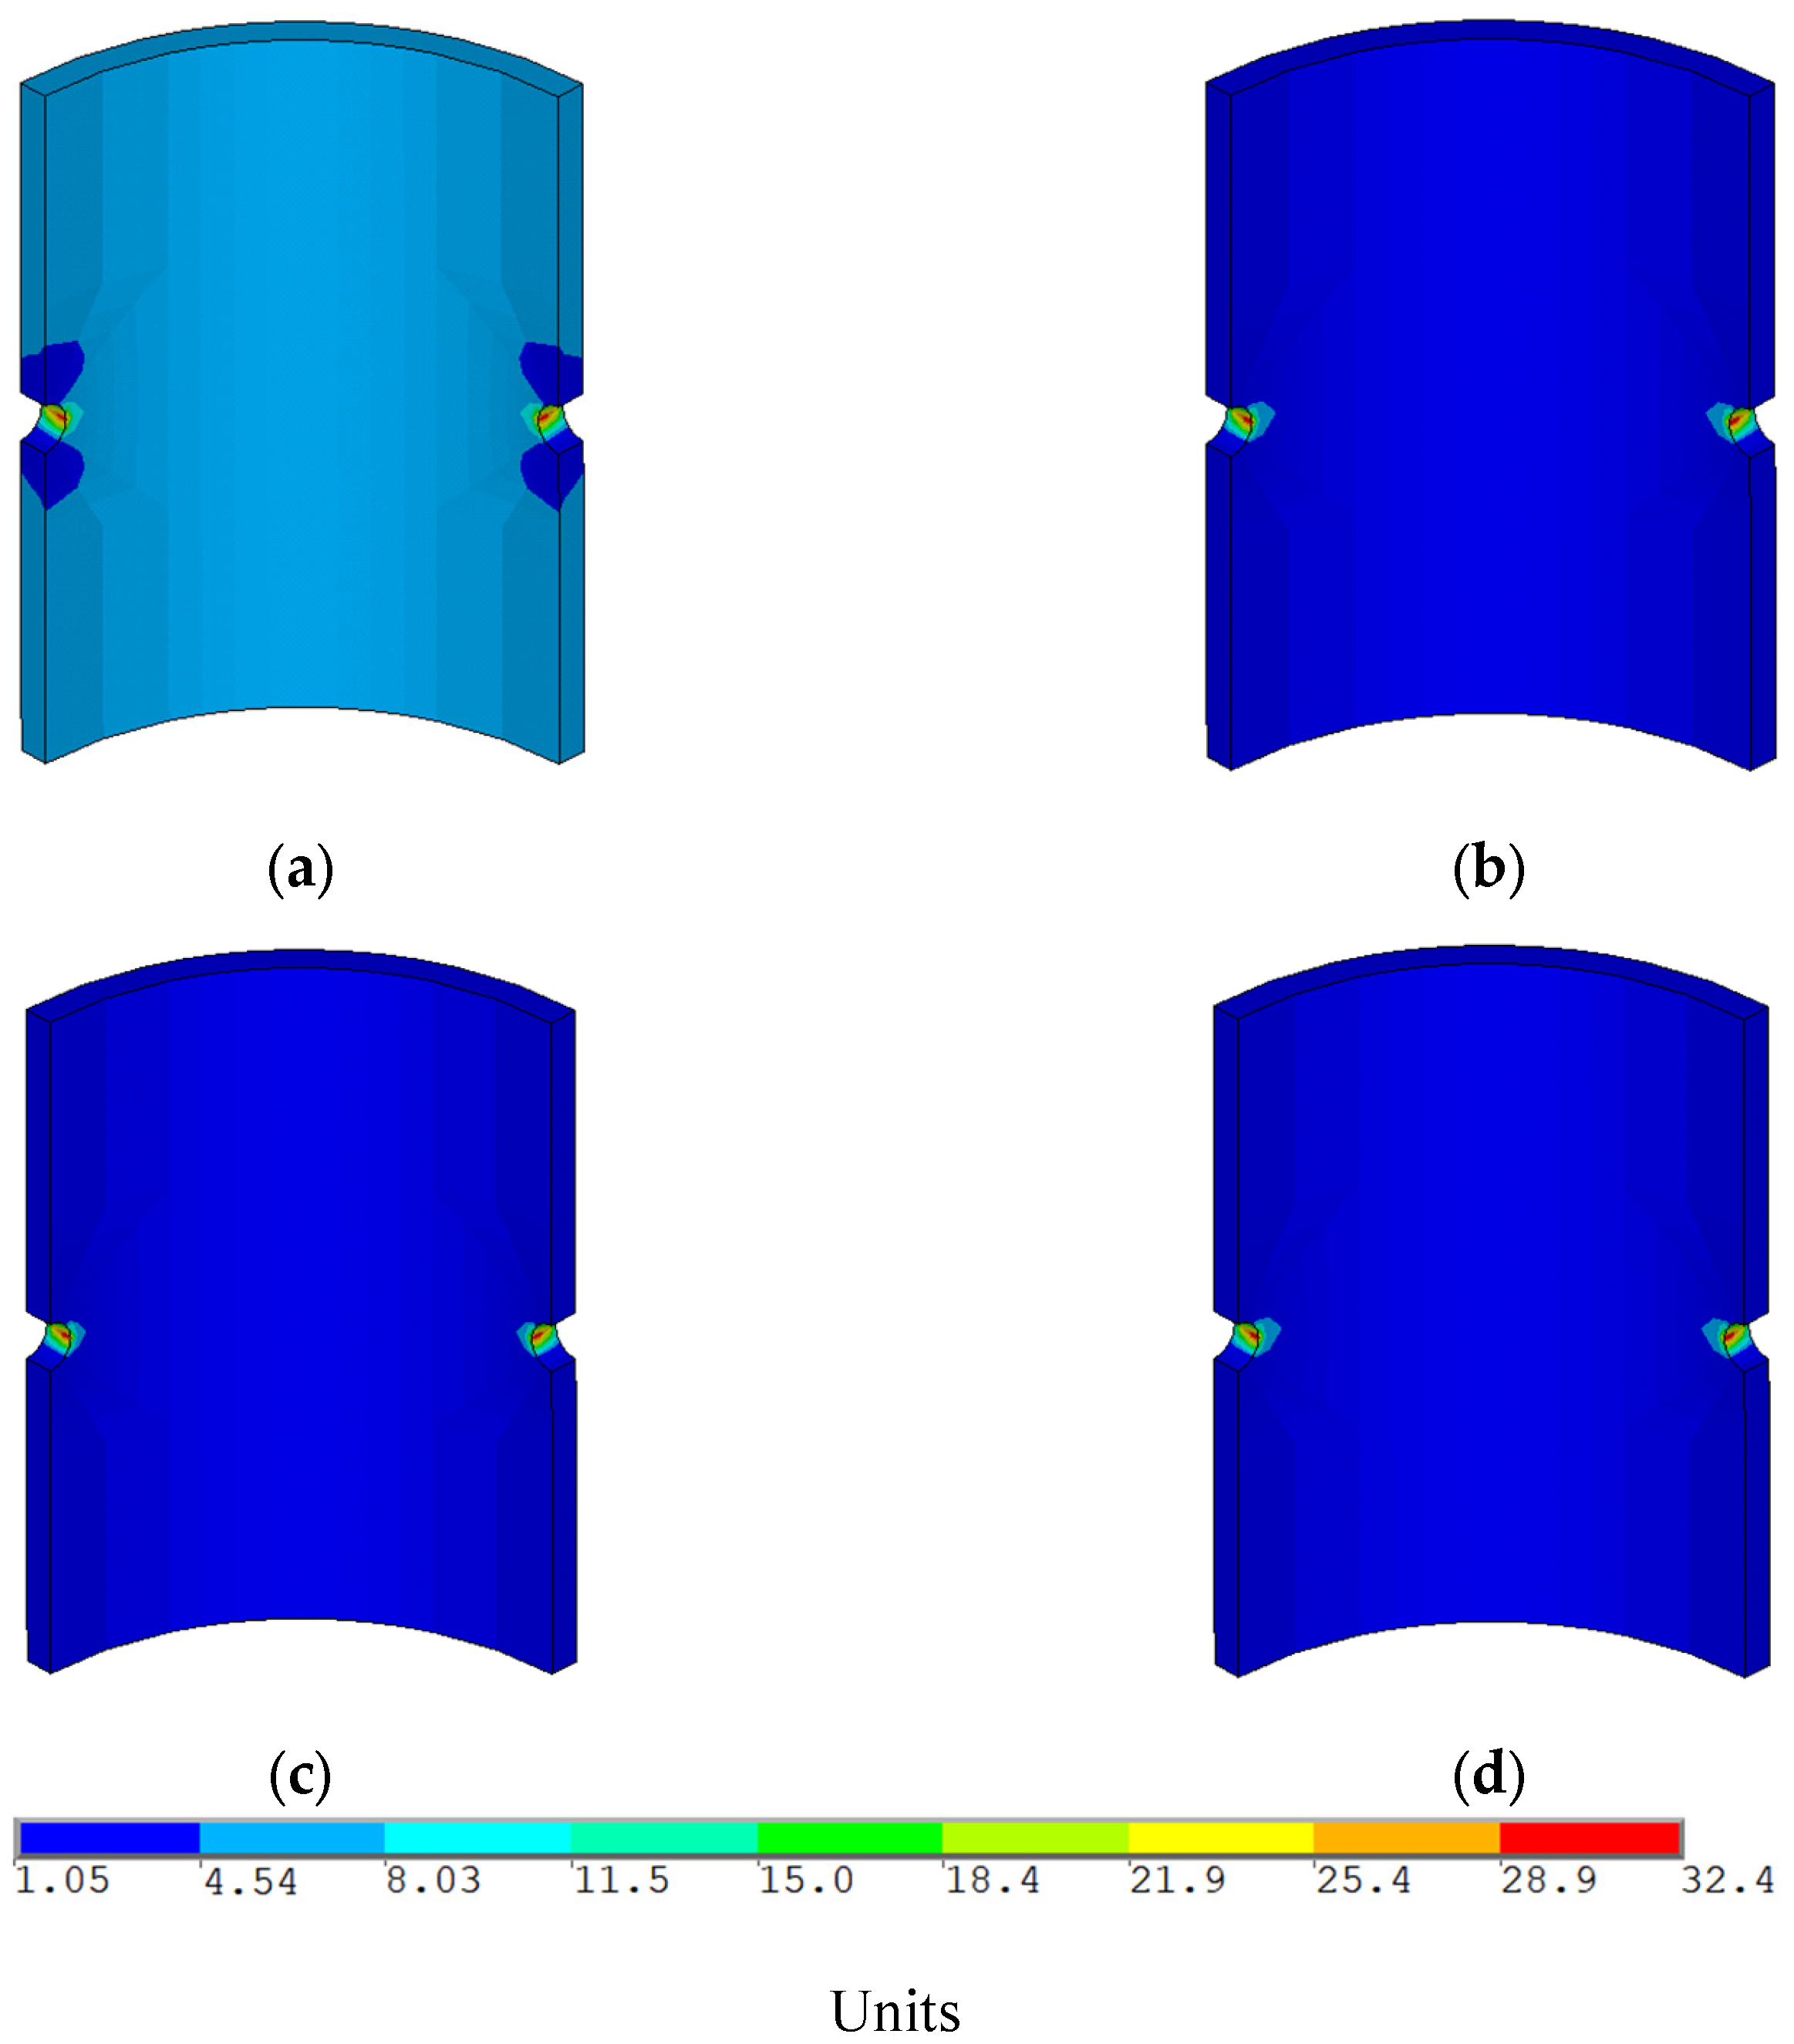
  • Analysis of the stress distribution in the casing based on the safety factor shows that, in the main part of the casing, the value of this parameter represents 3–4 units, which indicates its high stability. The exception is small parts near the perforation channels, where this value is close to one unit.
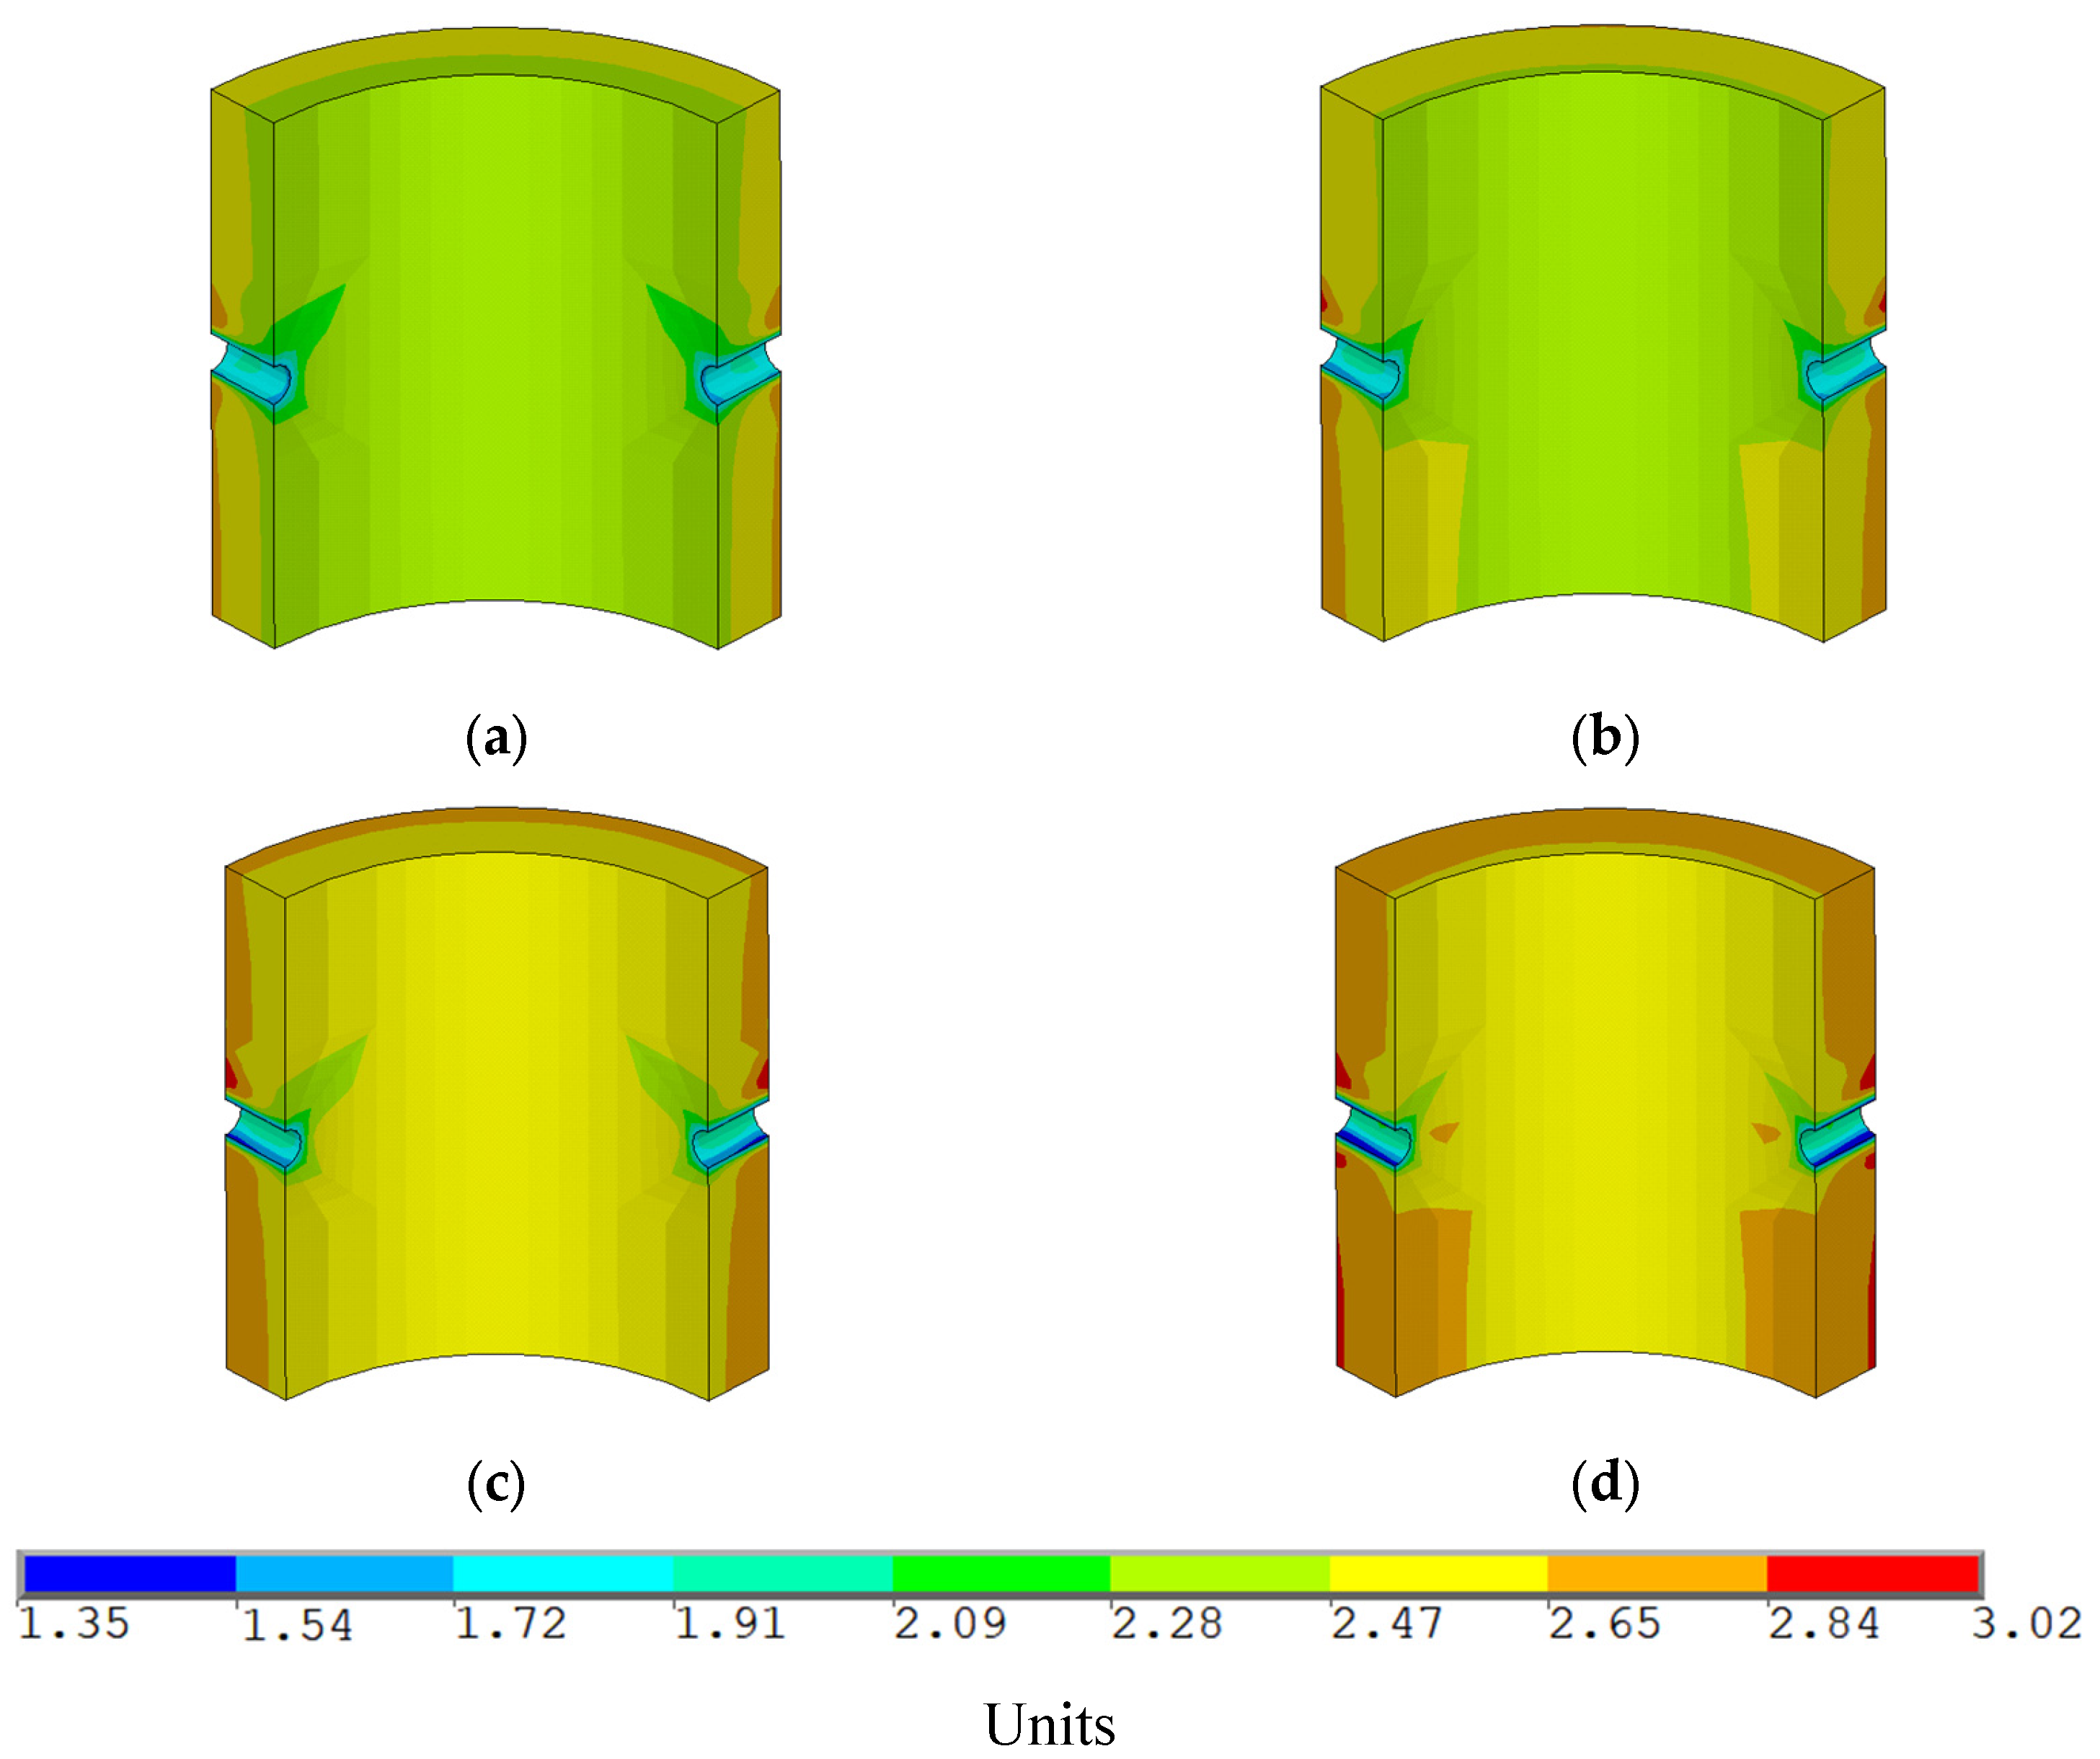
  • The safety factor for the main part of the cement stone reaches 2–3 units, which also indicates its sufficient strength. The safety factor of the cement stone reaches the minimum value under the maximum pressure drawdown. The parts with its minimum value are located near the perforations.
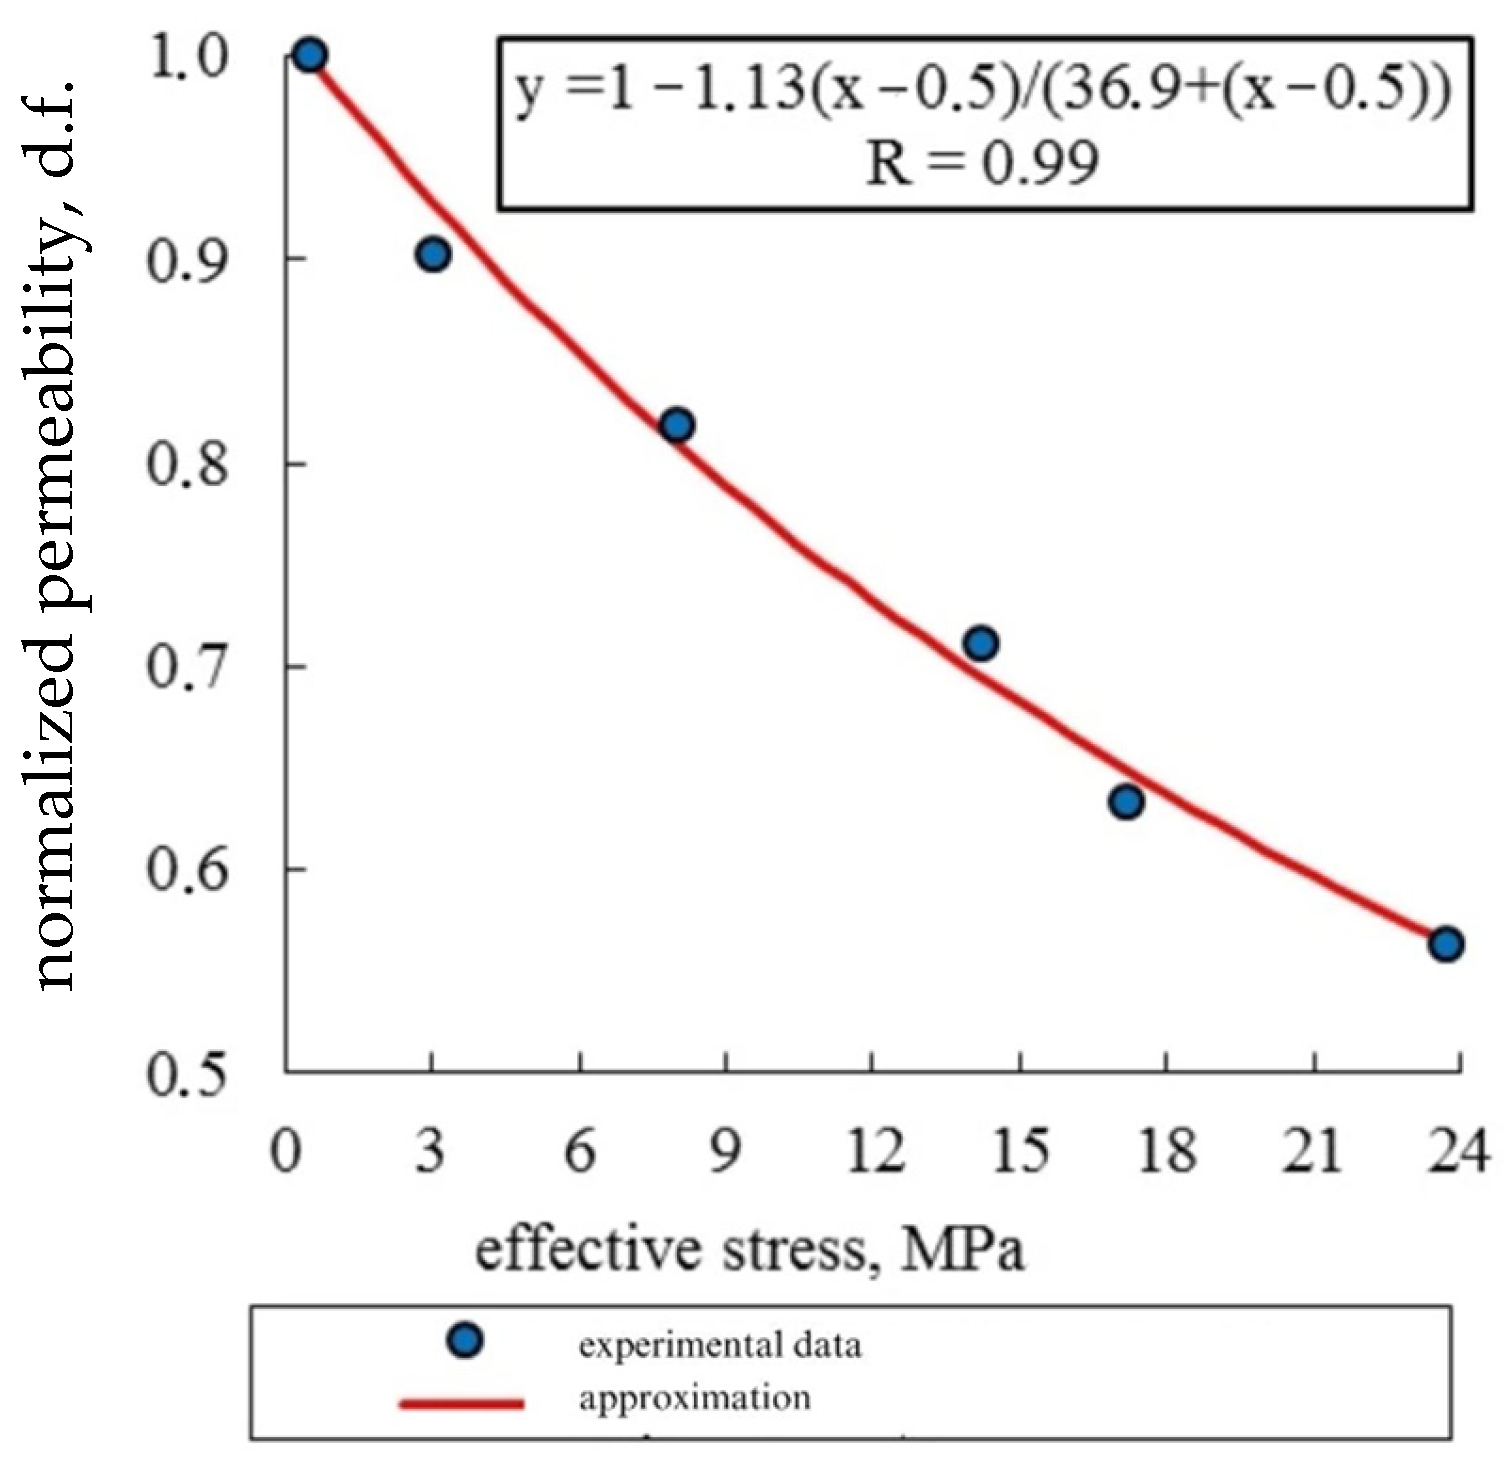
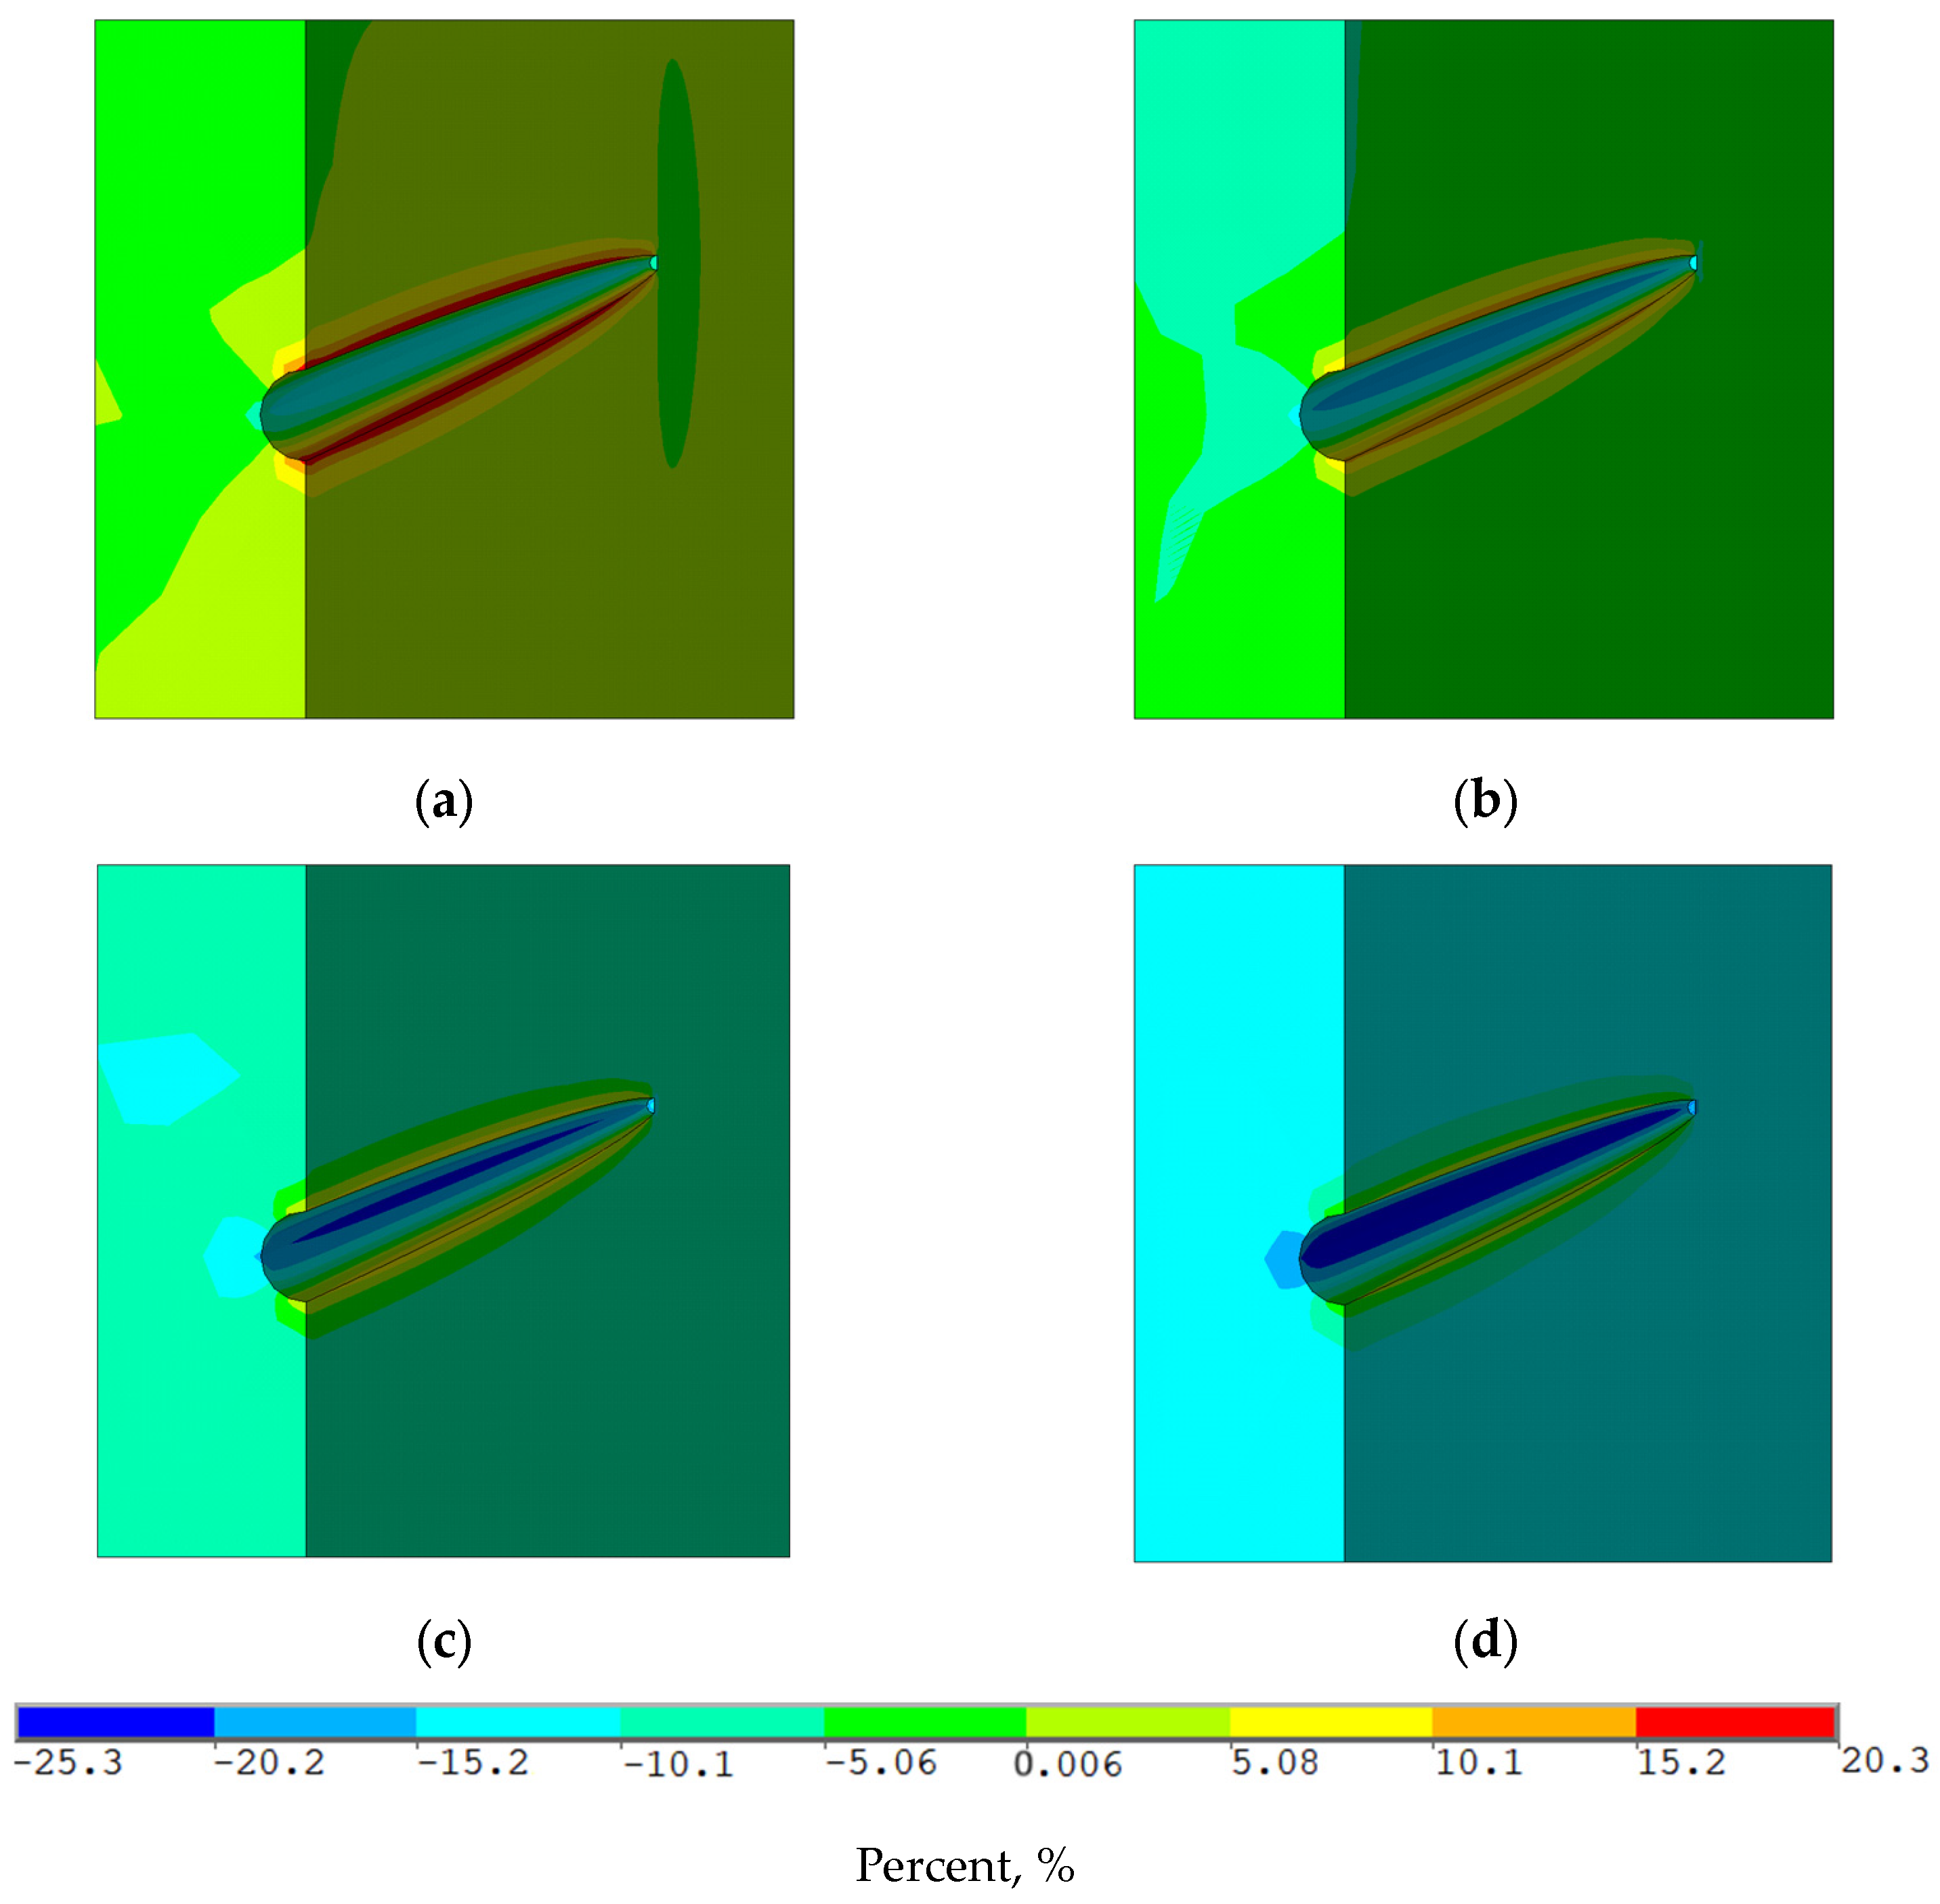
  • The permeability dependence on effective stresses, previously determined on core samples, proves that areas of increased (in the lateral parts) and decreased (in the upper and lower parts) stresses arise on the perforation channels’ surface. As a result, these areas have both an increase (up to 20%) and a decrease (up to 25%) in permeability from the initial values caused by variable effective stresses.
  • With an increase in pressure drawdown, the areas with increasing permeability diminish, while the areas with decreasing permeability grow, which is caused by an increase in effective stresses.
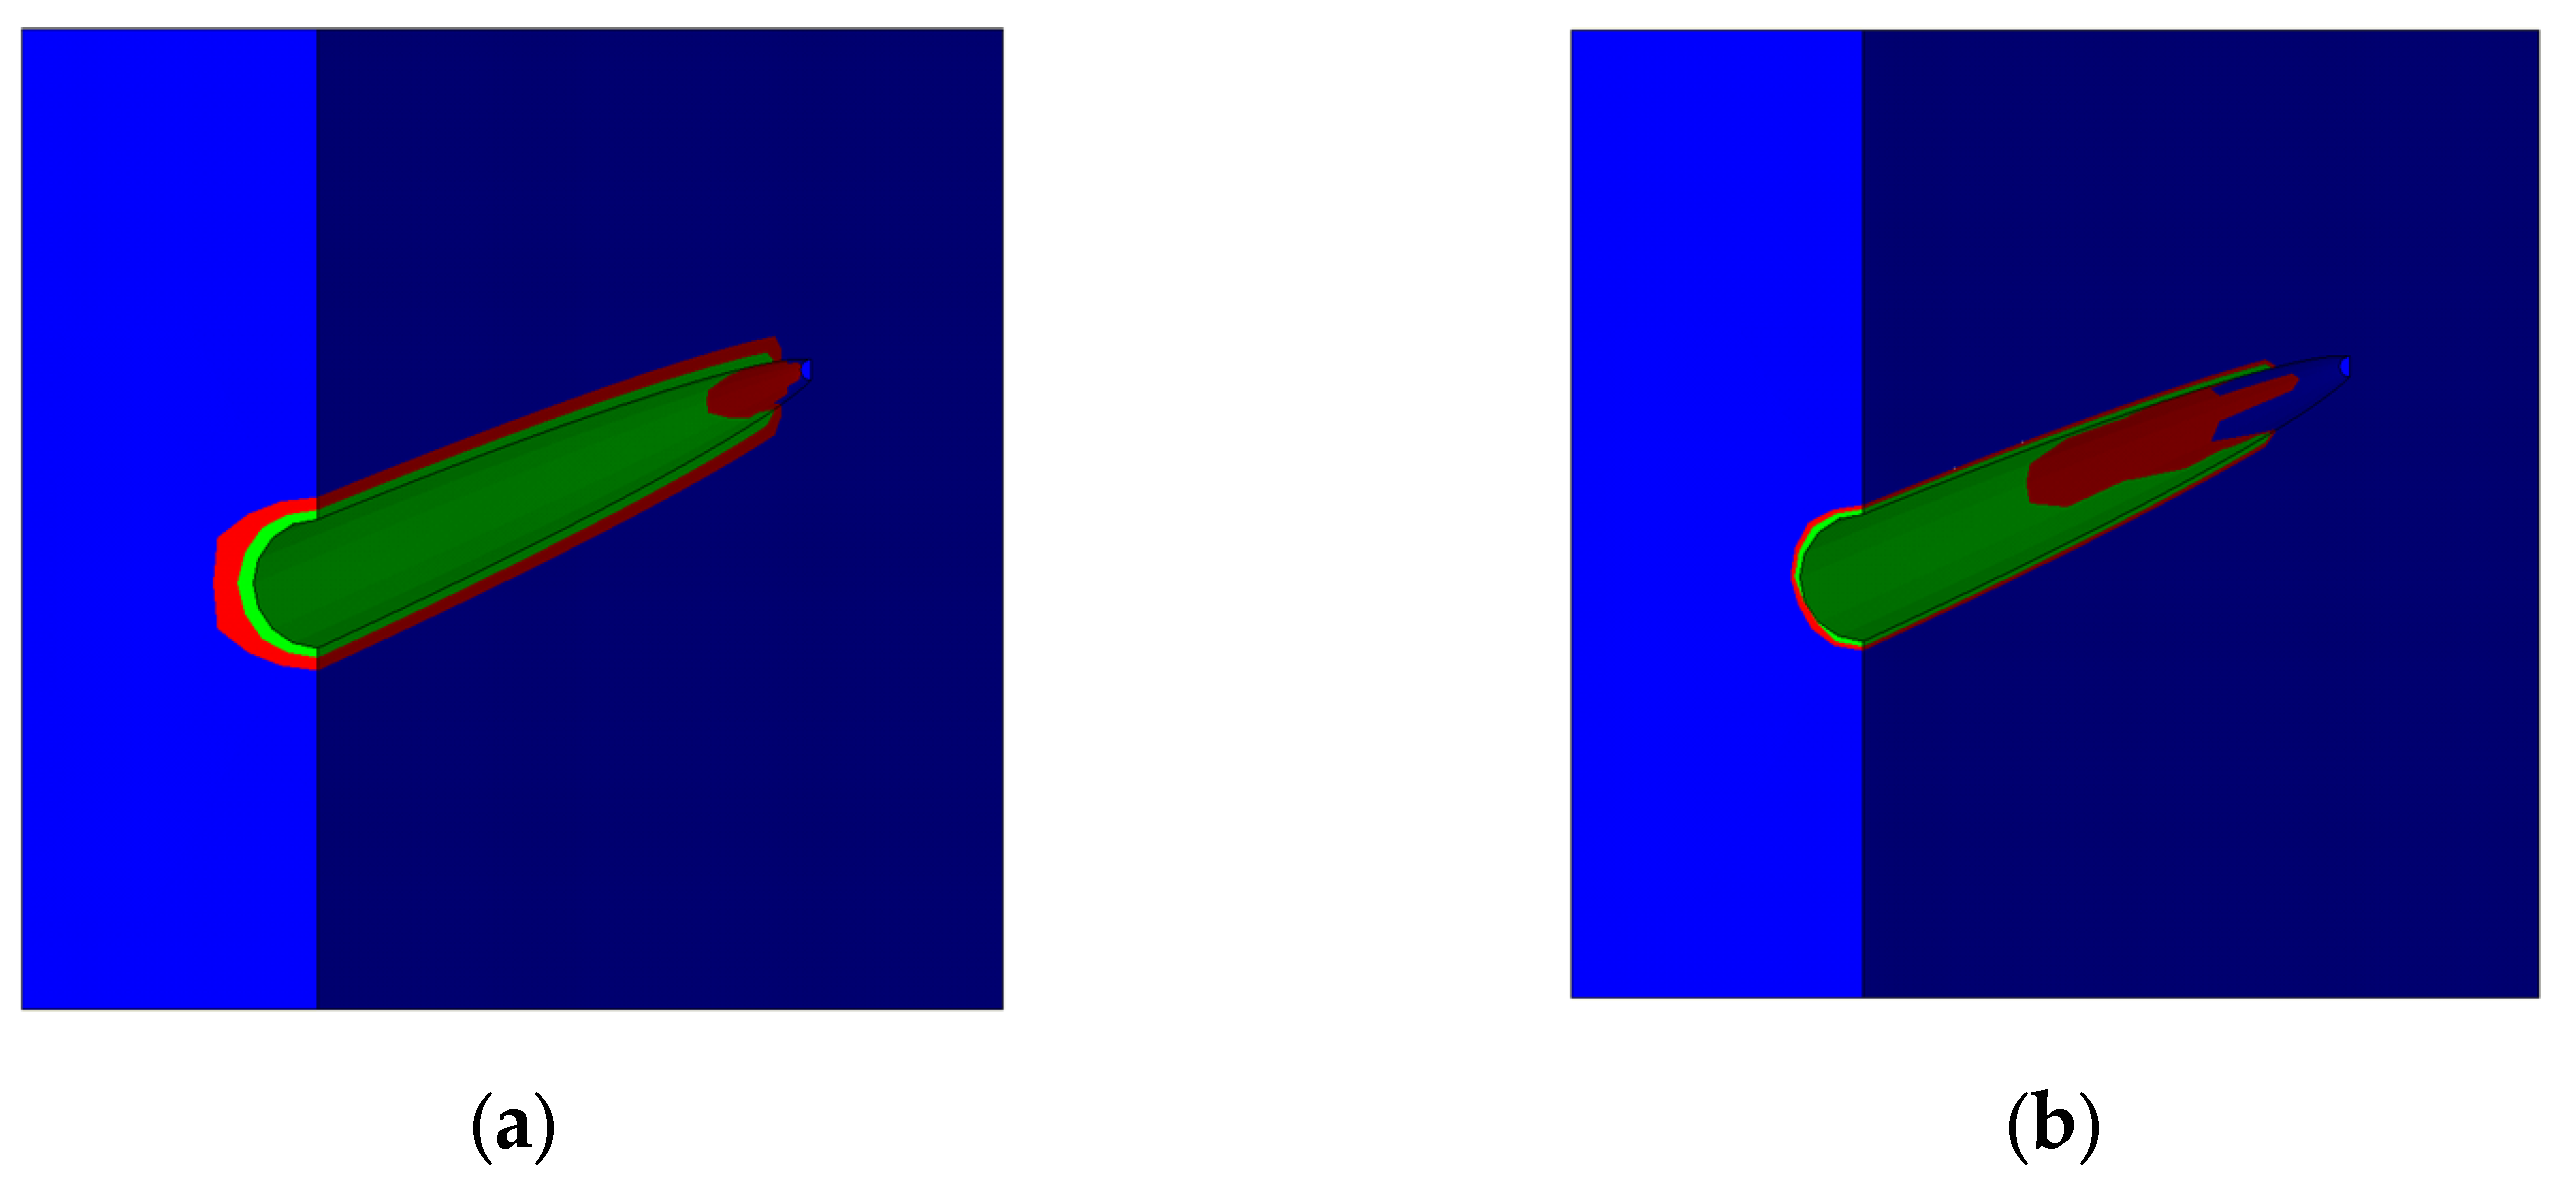
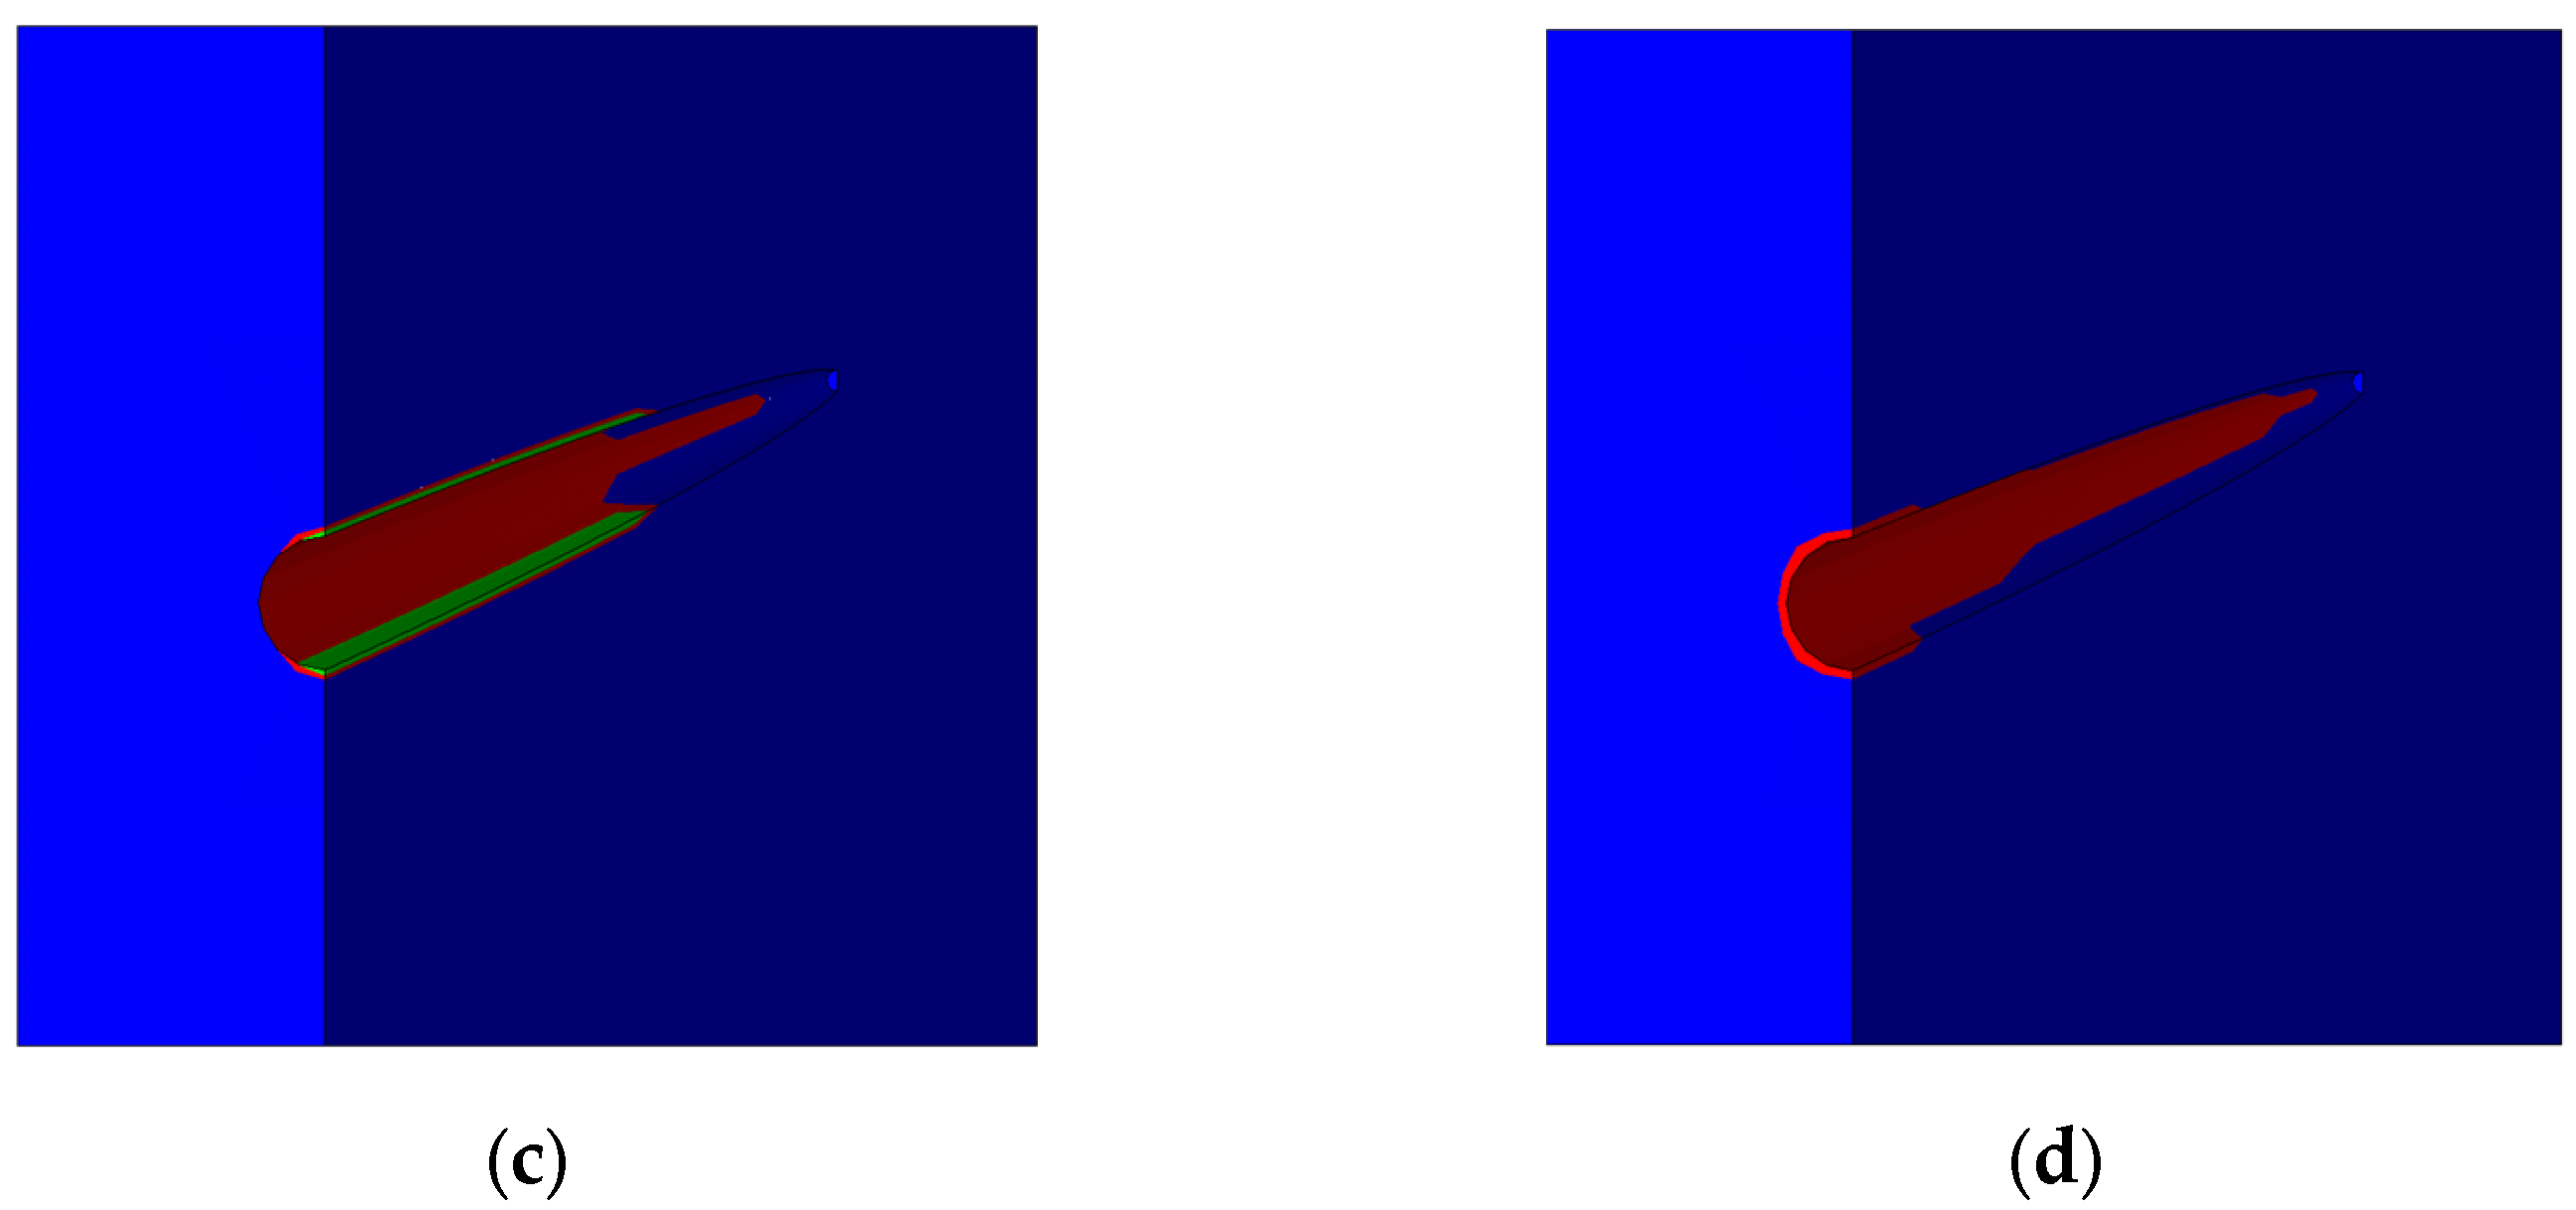
  • Analysis of the destruction areas of reservoir rocks, based on the Mohr–Coulomb criterion and the impact of effective stress, shows that areas of destruction due to both compressive and tensile stresses appear near the perforations. With an increase in pressure drawdown, tensile stress areas decrease and then disappear completely, while compressive stress areas increase, which is also explained by an increase in effective stresses.
  • Due to a decrease in permeability and an increase in pressure drawdown to 12 MPa, the well productivity index can decrease by up to 15%, which indicates the need to optimize well production in order to prevent intensive reservoir compaction due to a decrease in bottom hole and reservoir pressures.

5. Conclusions

The scientific article is devoted to an urgent and understudied problem related to the structural stability of the well, reservoir, and changes in the rocks permeability during the secondary opening of productive formations by cumulative perforation. Most of the existing publications in this area either consider the open trunk or do not take into account the perforation channels’ geometry. At the same time, in the process of creating perforations, the stress state of reservoir rocks transforms due to the rock-free areas, as well as when the bottom hole pressure changes to create the pressure drawdown.
The numerical finite element model based on the safety factor allows us to analyze the stress state of the casing, cement stone, and rock section near the well. A feature of the model consists of the use of contact elements and the simultaneous use of elastic (for casing and cement stone) and poroelastic (for rock) finite elements. Previously obtained dependence of the permeability change on effective stresses makes it possible to estimate the deformation effects’ impact on reservoir permeability.
Numerical calculations indicate that the casing and cement stone have a sufficient safety factor. However, small destruction areas are likely to occur near the perforation channels. The analysis of permeability changes revealed areas of increase and decrease in the rock’s permeability caused by changes in stresses due to the occurrence of perforations and an increase in differential pressure drawdown. Analysis of the destruction areas of the reservoir rock revealed that, depending on the pressure drawdown, destruction areas arise near the perforation channels due to both tensile and compressive stresses. In conclusion, it is proved that a significant increase in pressure drawdown can lead to a decrease in the well productivity index of up to 15% of the initial value.

Author Contributions

Conceptualization, S.C. and S.P.; methodology, S.C.; software, S.P.; validation, S.C. and X.W.; formal analysis, Y.Y.; investigation, V.D.; data curation, S.C. and H.L.; writing—original draft preparation, S.P.; writing—review and editing, V.D.; visualization, S.P.; supervision, X.W.; funding acquisition, S.C. All authors have read and agreed to the published version of the manuscript.

Funding

The paper was completed with support of the state task “Experimental and theoretical studies of interfacial phenomena, thermodynamic, physicochemical and geomechanical properties of oil and gas reservoir systems to improve the efficiency of development of hard-to-recover hydrocarbon reserves” (FMME-2022-0008, Reg. No. NIOKTR 122022800364-6).

Institutional Review Board Statement

Not applicable.

Informed Consent Statement

Not applicable.

Data Availability Statement

The original contributions presented in the study are included in the article; further inquiries can be directed to the corresponding author.

Conflicts of Interest

The authors declare no conflicts of interest.

References

  1. Zoback, M.D. Reservoir Geomechanics; Cambridge University Press: Cambridge, UK, 2007; 505p. [Google Scholar]
  2. Fjear, E.; Holt, R.M.; Horsrud, P.; Raaen, A.M.; Risnes, R. Petroleum Related Rock Mechanics; Elsevier: Amsterdam, The Netherlands, 2008; 492p. [Google Scholar]
  3. Kashnikov, Y.U.A.; Ashihmin, S.G. Mechanics of Rocks in the Development of Hydrocarbon Deposits; OOO «Nedra Biznes-Centr»: Moscow, Russia, 2007; 476p. [Google Scholar]
  4. Ma, T.; Liu, J.; Fu, J.; Qiu, Y.; Fan, X.; Martyushev, D.A. Fully Coupled Thermo-hydro-mechanical Model for Wellbore Stability Analysis in Deep Gas-Bearing Unsaturated Formations Based on Thermodynamics. Rock Mech. Rock Eng. 2024. [Google Scholar] [CrossRef]
  5. Lukin, S.V.; Esipov, S.V.; Zhukov, V.V.; Ovcharenko, Y.u.V.; Khomutov AYu Shevchuk, T.N.; Suslyakov, I.V. Borehole stability prediction to avoid drilling failures. Neft. Hozyajstvo 2016, 6, 70–73. [Google Scholar]
  6. Vashkevich, A.A.; Zhukov, V.V.; Ovcharenko, Y.u.V.; Bochkov, A.S.; Lukin, S.V. Development of integrated geomechanical modeling in “Gazprom neft” PJSC. Neft. Hozyajstvo 2016, 12, 16–19. [Google Scholar]
  7. Popov, S.N.; Chernyshov, S.E. Development of a geomechanical model and determination of the drilling fluid “density window” in the interval of famennian productive deposits (on the example of a site of one of the Timano-Pechora oil and gas province oilfield). Geol. Geophys. Dev. Oil Gas Fields 2023, 11, 32–39. [Google Scholar]
  8. Wang, L.; Shen, X.; Wu, B.; Shen, T.; Shi, J. Integrated analysis of the 3D geostress and 1D geomechanics of an exploration well in a new gas field. Energies 2023, 16, 806. [Google Scholar] [CrossRef]
  9. Kashnikov, Y.A.; Ashikhmin, S.G.; Shustov, D.V.; Yakimov, S.Y.; Kukhtinskii, A.E. Increasing efficiency of hydrocarbon fields development based on complex geomechanical research. Neft. Hozyajstvo 2019, 3, 66–69. (In Russian) [Google Scholar] [CrossRef]
  10. Yang, Y.; Liu, Z.; Sun, Z.; An, S.; Zhang, W.; Liu, P.; Yao, J.; Ma, J. Research on Stress Sensitivity of Fractured Carbonate Reservoirs Based on CT Technology. Energies 2017, 10, 1833. [Google Scholar] [CrossRef]
  11. Galkin, V.I.; Martyushev, D.A.; Ponomareva, I.N.; Chernykh, I.A. Developing features of the near-bottomhole zones in productive formations at fields with high gas saturation of formation oil. J. Min. Inst. 2021, 249, 386–392. [Google Scholar] [CrossRef]
  12. Li, W.; Chen, L.; Wang, X.; Fan, Q.; Xu, G.; Xiao, W.; Li, X.; Ye, Z. Acid fracturing technology and effect evaluation of carbonate horizontal well in Fuman oilfield. J. Phys. Conf. Ser. 2024, 2679, 012010. [Google Scholar] [CrossRef]
  13. Liu, F.; Fan, Y.; Li, L.; Li, J.; Chen, Y.; Lv, Z.; He, T. Case study of successfully staged acid fracturing on the ultra-deep horizontal well for the Qixia fm HTHP tight carbonate gas reservoir in China. Front. Energy Res. 2022, 10, 917740. [Google Scholar] [CrossRef]
  14. Safari, R.; Smith, C.; Fragachan, F. Improved Recovery of Carbonate Reservoir by Optimizing Acidizing Strategy: Coupled Wellbore, Reservoir, and Geomechanical Analysis. In Proceedings of the Abu Dhabi International Petroleum Exhibition & Conference, Abu Dhabi, United Arab Emirates, 13 November 2017. [Google Scholar] [CrossRef]
  15. Al-Awad, M.N.J.; Al-Ahaidib, T.Y. Estimating the amount of free sand in the yielded zone around horizontal oil wells. In Proceedings of the SPE Technical Symposium of Saudi Arabia Section, Dhahran, Saudi Arabia, 14 May 2005. [Google Scholar] [CrossRef]
  16. Araujo-Guerrero, E.F.; Alzate-Espinosa, G.A.; Arbelaez-Londono, A.; Pena Clavijo, S.; Cardona Ramirez, A. Analytical prediction model of sand production integrating geomechanics for open hole and cased—perforated wells. In Proceedings of the SPE Heavy and Extra Heavy Oil Conference, Latin America, Medellín, Colombia, 24 September 2014. [Google Scholar] [CrossRef]
  17. Ermolayev, A.I.; Efimov, S.I.; Pyatibratov, P.V.; Minikhanov, E.D.; Dubinya, N.V.; Leonova, A.M. Estimation of the maximum downhole pressure, excluding the destruction of the bottom-hole zone of the formation, based on geomechanical core studies. SOCAR Proc. 2023, 1, 61–69. (In Russian) [Google Scholar] [CrossRef]
  18. Chernyshov, S.E.; Popov, S.N.; Savich, A.D.; Derendyaev, V.V. Analysis of wells cement sheath stability during shaped charge perforating based on geomechanical modeling. Georesursy = Georesources 2023, 25, 245–253. [Google Scholar] [CrossRef]
  19. Fallahzadeh, S.H.; Shasizadeh, S.R. Modeling the Perforation Stress Profile for Analyzing Hydraulic Fracture Initiation in a Cased Hole. In Proceedings of the Nigeria Annual International Conference and Exhibition, Tinapa, Calabar, Nigeria, 31 July 2010. [Google Scholar] [CrossRef]
  20. Strelchenko, V.V.; Melnichyk, D.A.; Abrosimov, A.A. Modelling the stress-strain state change of near-wellbore area and its reservoir properties during drilling. Vestn. Assoc. Burovyh Podryadchikov 2014, 1, 35–37. [Google Scholar]
  21. Popov, S.N.; Chernyshov, S.E.; Krivoshchekov, S.N. Comparative analysis of the analytical and numerical methods for calculating the stress-strain state of the near-wellbore zone based on the elastic model taking into account the main structural elements of the well. Bull. Tomsk. Polytech. Univ. Geo Assets Eng. 2023, 334, 94–102. (In Russian) [Google Scholar] [CrossRef]
  22. Zhang, J.; Moridis, G.; Blasingame, T.A. Message passing interface (MPI) parallelization of iteratively coupled fluid flow and geomechanics codes for the simulation of system behavior in hydrate-bearing geological media. Part 1: Methodology and validation. SPE Reserv. Eval. Eng. 2022, 25, 600–620. [Google Scholar] [CrossRef]
  23. Kharlamov, S.N.; Janghorbani, M.; Chernov, A.G. Transportation of cuttings by drilling mud in horizontal wells. Part 2. Numerical results of drilling at optimal rheological properties of mud. Bull. Tomsk Polytech. Univ. Geo Assets Eng. 2023, 334, 7–24. [Google Scholar] [CrossRef]
Figure 1. Finite element scheme used for calculations.
Applsci 14 09993 g001
Figure 2. Dependence of permeability on average effective stresses.
Applsci 14 09993 g002
Figure 3. Safety factor of the casing with a differential pressure drawdown of 0 MPa (a), 3 MPa (b), 6 MPa (c), and 9 MPa (d).
Applsci 14 09993 g003
Figure 4. Safety factor of the cement stone with a differential pressure drawdown of 0 MPa (a), 3 MPa (b), 6 MPa (c), and 9 MPa (d).
Applsci 14 09993 g004
Figure 5. Change in rock permeability (in %) in relation to the initial value with the initial reservoir pressure and differential pressure drawdown of 0 MPa (a), 3 MPa (b), 6 MPa (c), and 9 MPa (d).
Applsci 14 09993 g005
Figure 6. Visualization of possible zones of rock destruction on the basis of the Mohr–Coulomb criterion with a differential pressure drawdown of 0 MPa (a), 3 MPa (b), 6 MPa (c), and 9 MPa (d). The green color indicates tensile stress areas, red color indicates compressive stress areas, blue color indicates nonstress areas (without units of measurement).
Applsci 14 09993 g006aApplsci 14 09993 g006b
Figure 7. Dependence of the normalized well productivity index on the differential pressure drawdown.
Applsci 14 09993 g007
Table 1. Geometric characteristics of the model and elastic strength properties of the casing.
CharacteristicValue
1Outer diameter of the casing, mm168.3
2Casing thickness, mm7.3
3Drilling size, mm215.9
4Radius of the model, m5
5Young’s modulus of the casing, GPa200
6Poisson’s ratio of the casing, d.f.0.2
7Yield strength of casing steel, MPa372
Table 2. Elastic strength characteristics of cement stone.
CharacteristicValue
1Young’s modulus, GPa11.3
2Poisson’s ratio, d.f.0.179
3Compressive strength, MPa31.5
4Angle of internal friction, °29.6
Table 3. Characteristics of a productive object used in calculations.
CharacteristicValue
1Young’s modulus, GPa9.4
2Poisson’s ratio, d.f.0.32
3Biot coefficient, d.f.0.75
4The average depth of the reservoir, m1489
5Initial reservoir pressure, MPa14.5
6Differential pressure drawdown, MPa0–12
7Compressive strength, MPa36.3
8Angle of internal friction, °25
Disclaimer/Publisher’s Note: The statements, opinions and data contained in all publications are solely those of the individual author(s) and contributor(s) and not of MDPI and/or the editor(s). MDPI and/or the editor(s) disclaim responsibility for any injury to people or property resulting from any ideas, methods, instructions or products referred to in the content.

