Article

Shear Mechanical Behaviours and Size Effect of Band–Bedrock Interface: Discrete Element Method Simulation Insights

1
School of Civil Engineering, Chongqing University, Chongqing 400045, China
2
National Joint Engineering Research Center for Prevention and Control of Environmental Geological Hazards in the TGR Area, Chongqing University, Chongqing 400045, China
3
Key Laboratory of New Technology for Construction of Cities in Mountain Area of the Ministry of Education, Chongqing University, Chongqing 400045, China
4
School of River and Ocean Engineering, Chongqing Jiaotong University, Chongqing 400074, China
*
Author to whom correspondence should be addressed.
Appl. Sci. 2024, 14(20), 9481; https://doi.org/10.3390/app14209481
Submission received: 31 August 2024 / Revised: 11 October 2024 / Accepted: 15 October 2024 / Published: 17 October 2024
(This article belongs to the Special Issue Recent Advances in Rock Mass Engineering)

Abstract

:
The shear band is a prominent feature within the Banbiyan hazardous rock mass located in the Wushan section of the Three Gorges Reservoir area. This band constitutes a latent risk, as the potential for the rock mass to slide along the region threatens the safety of lives and property. Presently, the understanding of the shear mechanisms and the impact of shear band size on the band–bedrock interface is incomplete. In this study, based on band–bedrock shear laboratory tests, DEM simulation is used to investigate the shear-induced coalescence mechanism, stress evolution, and crack-type characteristics of the band–bedrock interface. In addition, the shear mechanical properties of samples considering specimen size, rock step height, and step width are further studied. The results show that the crack initiation and failure crack types observed in the first rock step are predominantly tensile. In contrast, the failure cracks in the remaining rock slabs and steps are primarily characterised by shear mode in addition to other mixed modes. The stress condition experienced by the first step is very near to the position of the applied point load, whereas the stress distribution across the remaining steps shows a more complex state of compressive–tensile stress. The relationship between shear parameters and sample size is best described by a negative exponential function. The representative elementary volume (REV) for shear parameters is suggested to be a sample with a geometric size of 350 mm. Notably, the peak shear strength and shear elastic modulus demonstrate a progressive increase with the rise in rock step height, with the amplifications reaching 91.37% and 115.83%, respectively. However, the residual strength exhibits an initial decline followed by a gradual ascent with increasing rock step height, with the amplitude of reduction and subsequent amplification being 23.73% and 116.94%, respectively. Additionally, a narrower rock step width is found to diminish the shear parameter values, which then tend to stabilise within a certain range as the step width increases.

1. Introduction

Tectonic discontinuity is the result of geotectonic movement and is widely distributed in rock mass, which leads to uncertainty regarding the stability of engineering geological bodies [1]. There are special engineering geological conditions in the Three Gorges Reservoir (TGR) area [2,3,4,5]. After many years of geological evolution, a large number of engineering rock masses with discontinuities have been formed. Located in the Wushan section of the TGR area, a special filling discontinuity exists in the Banbiyan dangerous rock mass (BDRM), as shown in Figure 1. The filling of this discontinuity is a shear band composed of rock blocks, which gradually formed in the process of rock mass unloading and structural movement. The failure mode of the BDRM is most likely to be of the slip type [6]. This kind of failure mainly depends on the material properties and structural form of the fillings. Once the BDRM becomes unstable, the safety of the Yangtze River waterway and surrounding people and property will be threatened. Therefore, further research on the shear mechanical behaviour and failure mechanism of the shear band has great significance for the stability control of the BDRM.
As common special structures in natural rock mass, the shear mechanical properties of discontinuities have been widely researched. In the field of shear strength, the bilinear shear strength model was first proposed by Patton [7]. Subsequently, Barton et al. [8] developed the JRC-JCS model of discontinuity shear strength based on a large number of shear laboratory tests. Since then, numerous tests on the shear strength of discontinuities have been carried out, and a variety of peak strength models have been put forward, including the JRC-JMC model that considers the structural plane coincidence coefficient [9], the three-parameter hyperbolic nonlinear failure criterion [10], the strength model based on quantified surface descriptions [11], the peak strength criterion that considers morphology [12], and the brittle drop mode damage-based constitutive model [13]. The shape of a discontinuity is a considerable factor used to determine shear strength and failure, so research examining the shear behaviour of discontinuities with different morphological structural planes has received extensive attention. Liu et al. [14] studied the shear mechanical behaviour of rock joints under different morphologies, and the result showed that the peak shear stress approximately linearly increased and the peak shear displacement decreased with the increase in first-order asperities. According to an anisotropic plaster shear test, Liu et al. [15] found that with an increment of the inclination angle of the critical waviness, both the normal displacement and sheared-off asperity mass increased, following power law functions. Zhang et al. [16] conducted a sandstone discontinuity shear test under water deterioration and determined that the chemical action of water reduces the structural plane roughness and leads to a decrease in the shear strength. Le et al. [17] focused on the failure characteristics of rock-like samples with different geometric steps, and the influence of normal stress and step height on peak strength was identified. In addition to the above research, morphology characteristics [18,19,20,21] and lithological differences between upper and lower plates [22,23,24] were also considered during research involving discontinuity shear testing. From the aforementioned studies, it is evident that research on the shear mechanical behaviour of discontinuities has primarily focused on joints with natural roughness and rock bridges between joints, as these represent common models of discontinuities found in nature. However, special discontinuities such as the shear band in the Banbiyan dangerous rock mass, which are formed due to unique tectonic movements, are rarely encountered in either engineering or research. In particular, interfaces with rock steps have not been a focus of discontinuity research. As a result, their mechanical properties are often overlooked. In this context, there is a scarcity of in-depth studies on how the size of prominent steps affects the mechanical properties of such interfaces, especially regarding the size effect. Hence, it is clear that novel research on step-like band–bedrock interfaces needs to be conducted.
Understanding crack propagation during the shear process may help to identify the shear failure path in engineering rock mass. However, due to limitations in test conditions, it is difficult to clearly and accurately record some shear failure processes. In recent years, the development of numerical methods has solved this problem to some extent. The main advantage of the discrete element method (DEM) is to obtain information on the dynamic failure process and crack propagation of the specimen, and to monitor information that cannot be obtained from a variety of laboratory tests. Therefore, the DEM has been widely used in geotechnical engineering when numerical simulation is required. Bahaaddini et al. put forward the shear box genesis approach for generating the upper and lower plates in direct shear simulation [25], solving the problem of particle interlocking in the bond removal method. Cement–rock interface shear simulation tests were conducted by Yang et al. [26], and the evolution law of the sample force chain during the shear process was presented. Cao et al. [27] explored the shear behaviour of 3D nonpersistent jointed rock-like specimens using PFC software (Version 5.0) and obtained the structural plane stress variation law, which cannot be observed in experimental testing. The energy evolution process and the change in the crack number of samples with nonpersistent joints were clarified by Tai et al. [28] through simulation. Moreover, Chen et al. [29] summarised the crack types in rock containing nonpersistent joints under uniaxial compression by analysing the particle relative displacement. Song et al. [30] utilised the discrete element method to simulate the mechanical properties of sandstone under multi-level cyclic loading, revealing that models with higher heterogeneity in tensile strength and cohesion can better reproduce the stress–strain relationship patterns. In addition to reproducing the experimental results, numerical simulation is often used for extended learning due to its convenience. Observational studies have been carried out based on the DEM that examined the effect of size [31,32,33,34], random discrete fracture [35,36,37], fracture numbers, and geometry size [38,39] on the mechanical behaviour of rock or rock-like samples. It follows that the discrete element method may be helpful for the study of the micro-mechanical properties of shear bands in the BDRM. At the same time, the challenge of large workloads in size effect laboratory tests will be effectively solved through numerical simulation.
In summary, with the help of existing survey data and related references on the BDRM, a series of laboratory experiments and numerical simulations were carried out on the shear mechanical behaviour of the band–bedrock interface generalised from the BDRM. This paper is structured as follows. In Section 2, the geological conditions of the BDRM are briefly described. In Section 3, the establishment and schemes of the experiment and numerical simulation tests are introduced. Then, in Section 4, the shear coalescence mechanism, stress evolution, and crack-type characteristics of the band–bedrock interface are analysed. The effect of the sample and step geometry size on the shear mechanical properties of the band–bedrock interface is discussed in Section 5. Finally, the conclusions are presented in Section 6. It is hoped that this paper may provide some help in understanding the instability and failure mechanisms of the BDRM, contributing to the mitigation of geohazards in regions such as the Three Gorges Reservoir area.

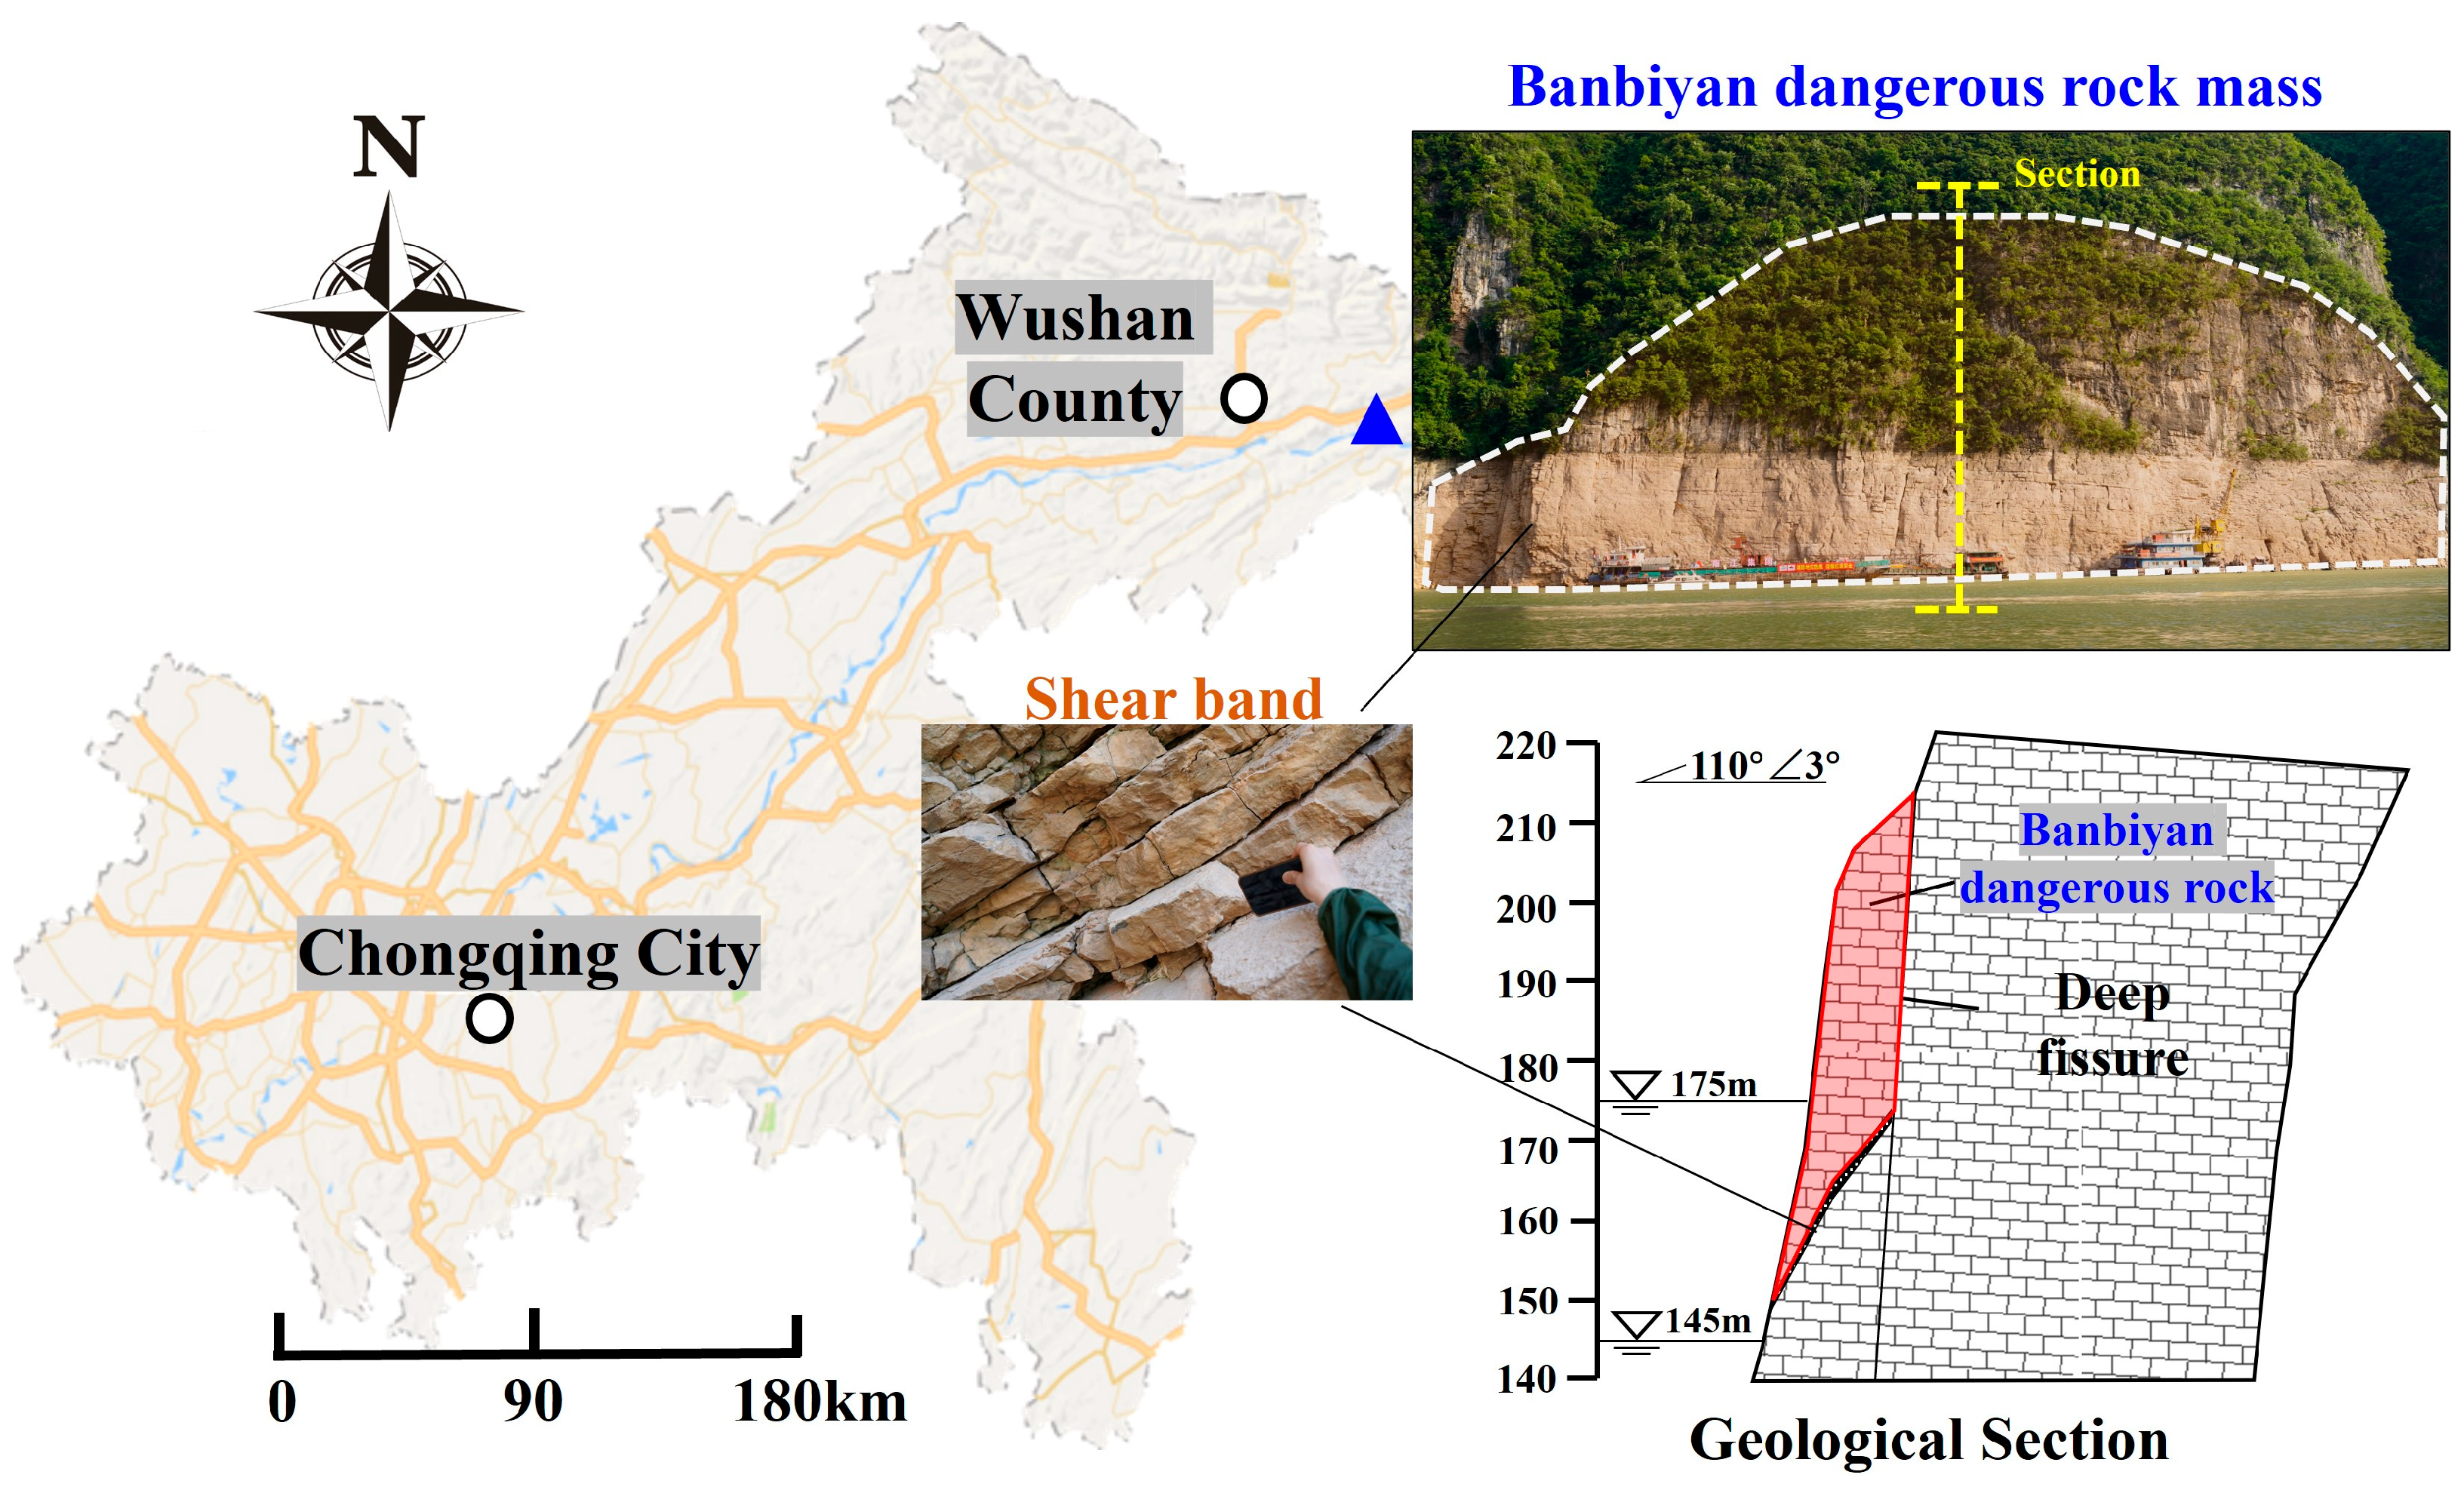
2. Characteristics of Shear Bands

The Banbiyan dangerous rock mass, situated along the right bank of the Wushan section within the Three Gorges Reservoir area, is geographically positioned with approximate coordinates of latitude N29° to N32° and longitude E109° to E111°, as depicted in Figure 1. The principal lithology of this rock mass comprises medium- to thickly bedded marlstone, argillaceous limestone, and thin- to medium-bedded limestone, which are predominantly found in members 2 to 3 of the Lower Triassic Jialingjiang Formation. The trailing edge of the dangerous rock mass has been severed by profound fissures, effectively disconnecting it from the mother rock. Within the BDRM, two distinct shear bands of considerable width are present. Notably, Shear Band 1 is located above the waterline at 145 m and exhibits macroscopic fragmentation. Locally, there are scattered fragments with diameters ranging from approximately 8 cm to 45 cm. The lateral surface of Shear Band 1 is exposed within the hydro-fluctuation zone, making it particularly susceptible to erosion by river water. The interstitial material between these fragments is predominantly of low mud content and exhibits low cementation. The disorderly arrangement of the blocks leads to an interlocking effect. The presence of deep and large fissures significantly influences the stability of the BDRM, with the characteristics of the shear bands playing a pivotal role in determining the overall stability of the rock mass.

3. Laboratory and DEM Modelling Establishment

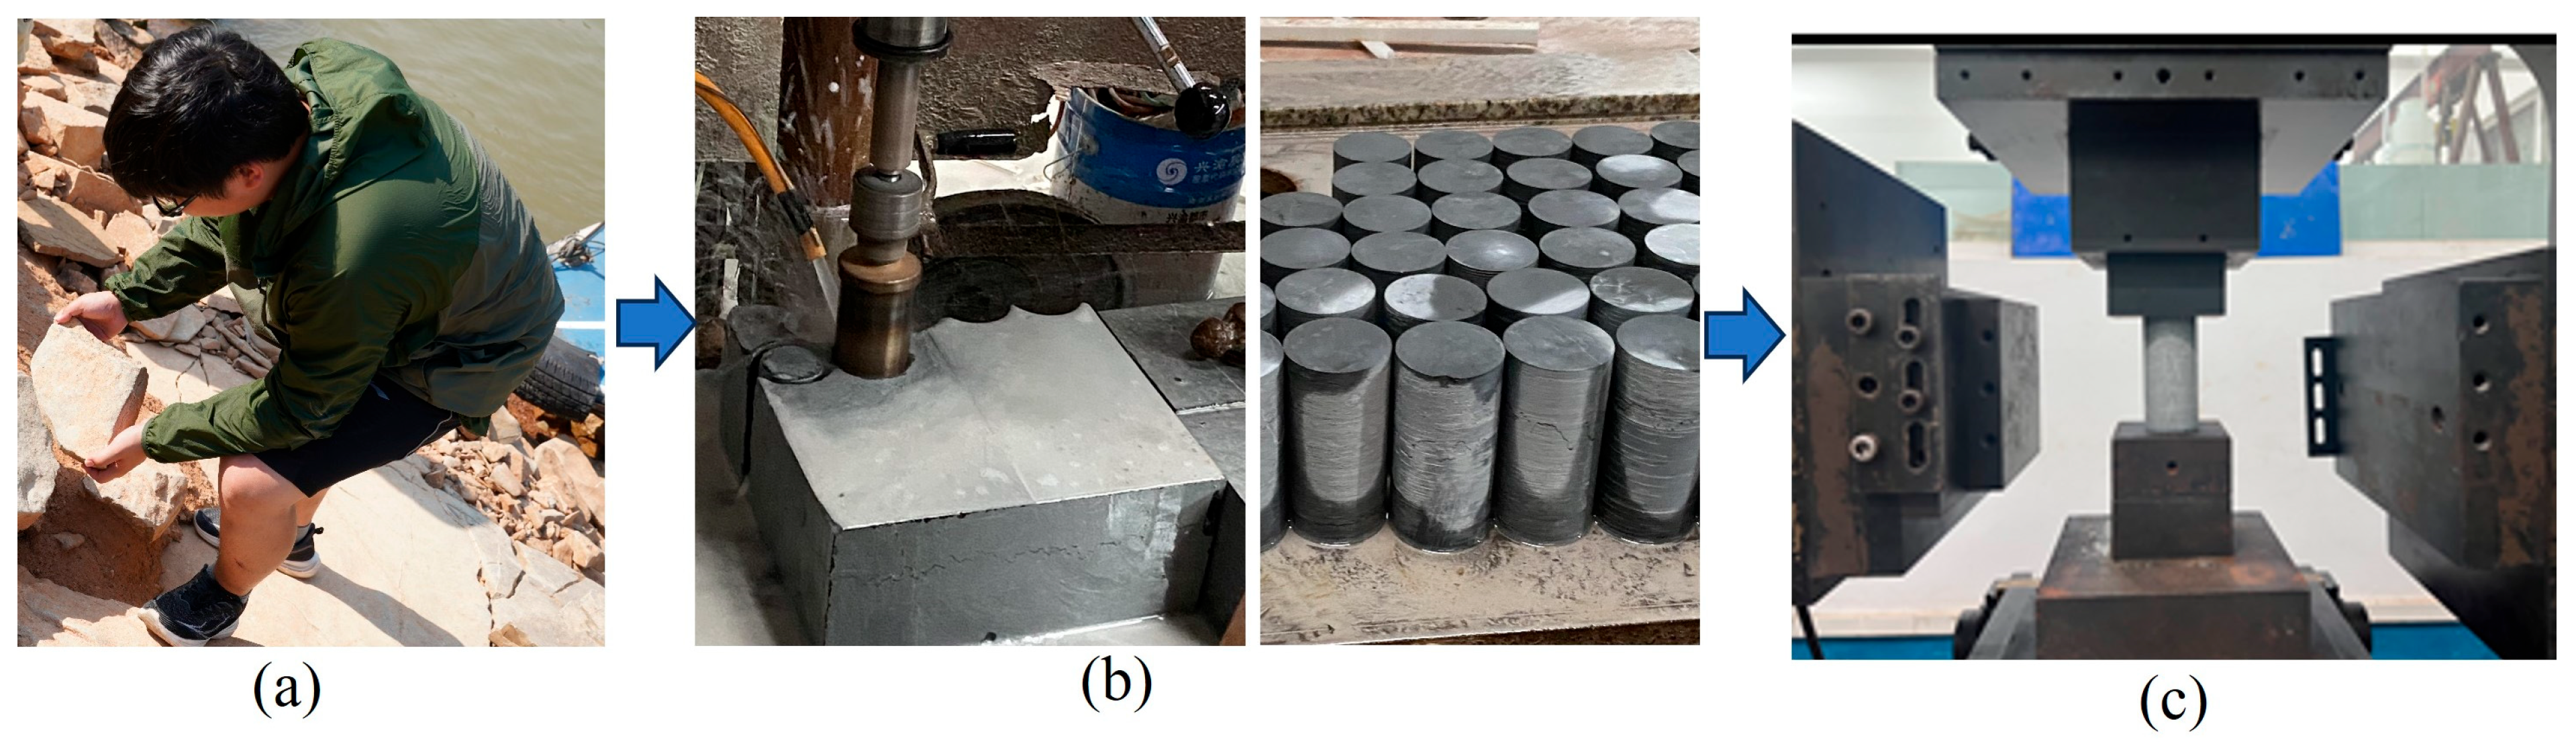
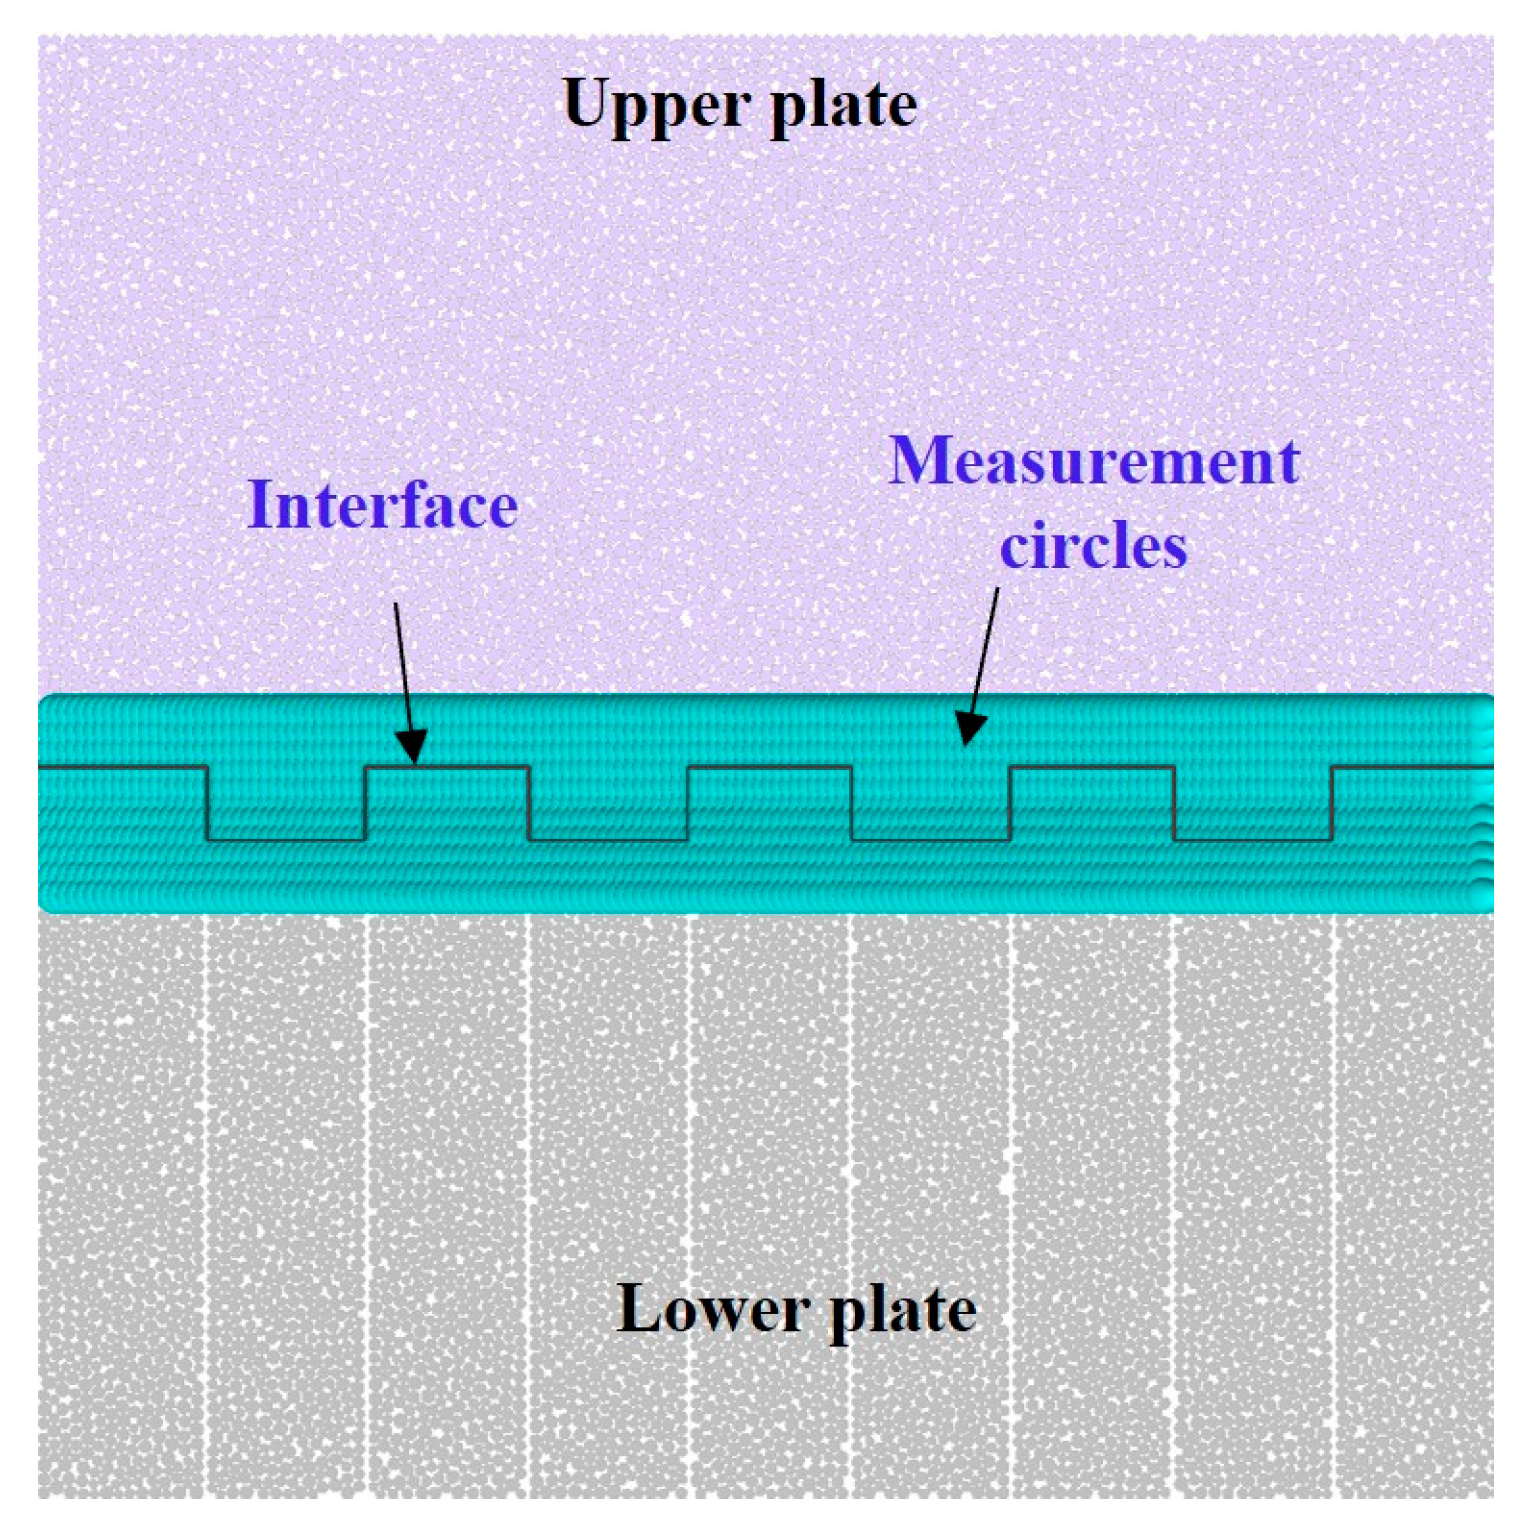
3.1. Sample Preparation

The fundamental materials for laboratory experiments were sourced from a location adjacent to the BDRM, ensuring that the stratigraphic lithology matched that of the BDRM, with the native material being limestone, as illustrated in Figure 2a. Through meticulous procedures of cutting, grinding, and other preparatory steps, the rock samples were fashioned into standard cylindrical specimens with precise geometric dimensions of 100 mm in height and 50 mm in diameter, as depicted in Figure 2b. These prepared samples were then subjected to a series of uniaxial compression tests to ascertain the fundamental mechanical properties of the rock, including, but not limited to, elastic modulus and compressive strength, as outlined in Figure 2c. The macroscopic mechanical parameters of the rock, as detailed in Table 1, served as a crucial foundation for all subsequent analyses and simulations.
Combining geological data with on-site survey results (Figure 3a), it can be observed that the shear band and the bedrock exhibit the characteristics of layered rock masses. The interface is stepped, and the stability is maintained by the interlocking of more regular rock slabs within the shear band and the recessed parts in the bedrock. Based on the characteristics of the layered rock mass, considering the size limitations of the servo direct shear testing machine, the precision of the experimental processing, and the proportion of the on-site block size within the shear band, the shear band was generalised into rock slabs of uniform thickness but varying heights, and the bedrock was a complete rock block with protruding steps. The step height was set at 10 mm, and the width at 22 mm. The rock slabs and the bedrock accurately formed a cube with dimensions of 200 mm. The generalised model and dimensions of the entire specimen are shown in Figure 3a. It is worth noting that regular stratified rock masses are generally isotropic in the horizontal plane; thus, the three-dimensional stratified rock mechanics problem can be treated as a planar problem perpendicular to the stratification. This is the reason why the interface roughness is considered a simple two-dimensional geometric problem. However, there are certain limitations to this kind of model generalisation, as the step size at the interface actually has some spatial variability, making it difficult to assess the mechanical properties of the interface. Despite this limitation, in this study, the mechanical shear behaviour of the interface with a stepped shape was the focus, and the non-uniform step size within the same specimen was not considered a harsh initial condition. This was essentially a preliminary exploratory study, hence the step size being unified. This model generalisation method can be applied to shear zones formed by the lateral unloading of layered slopes in steep gorge areas due to river incision or open-pit mining excavation. This is because the fracturing of layered rock masses will inevitably lead to the formation of interlayer fractures, resulting in this stepped interlocking structure.

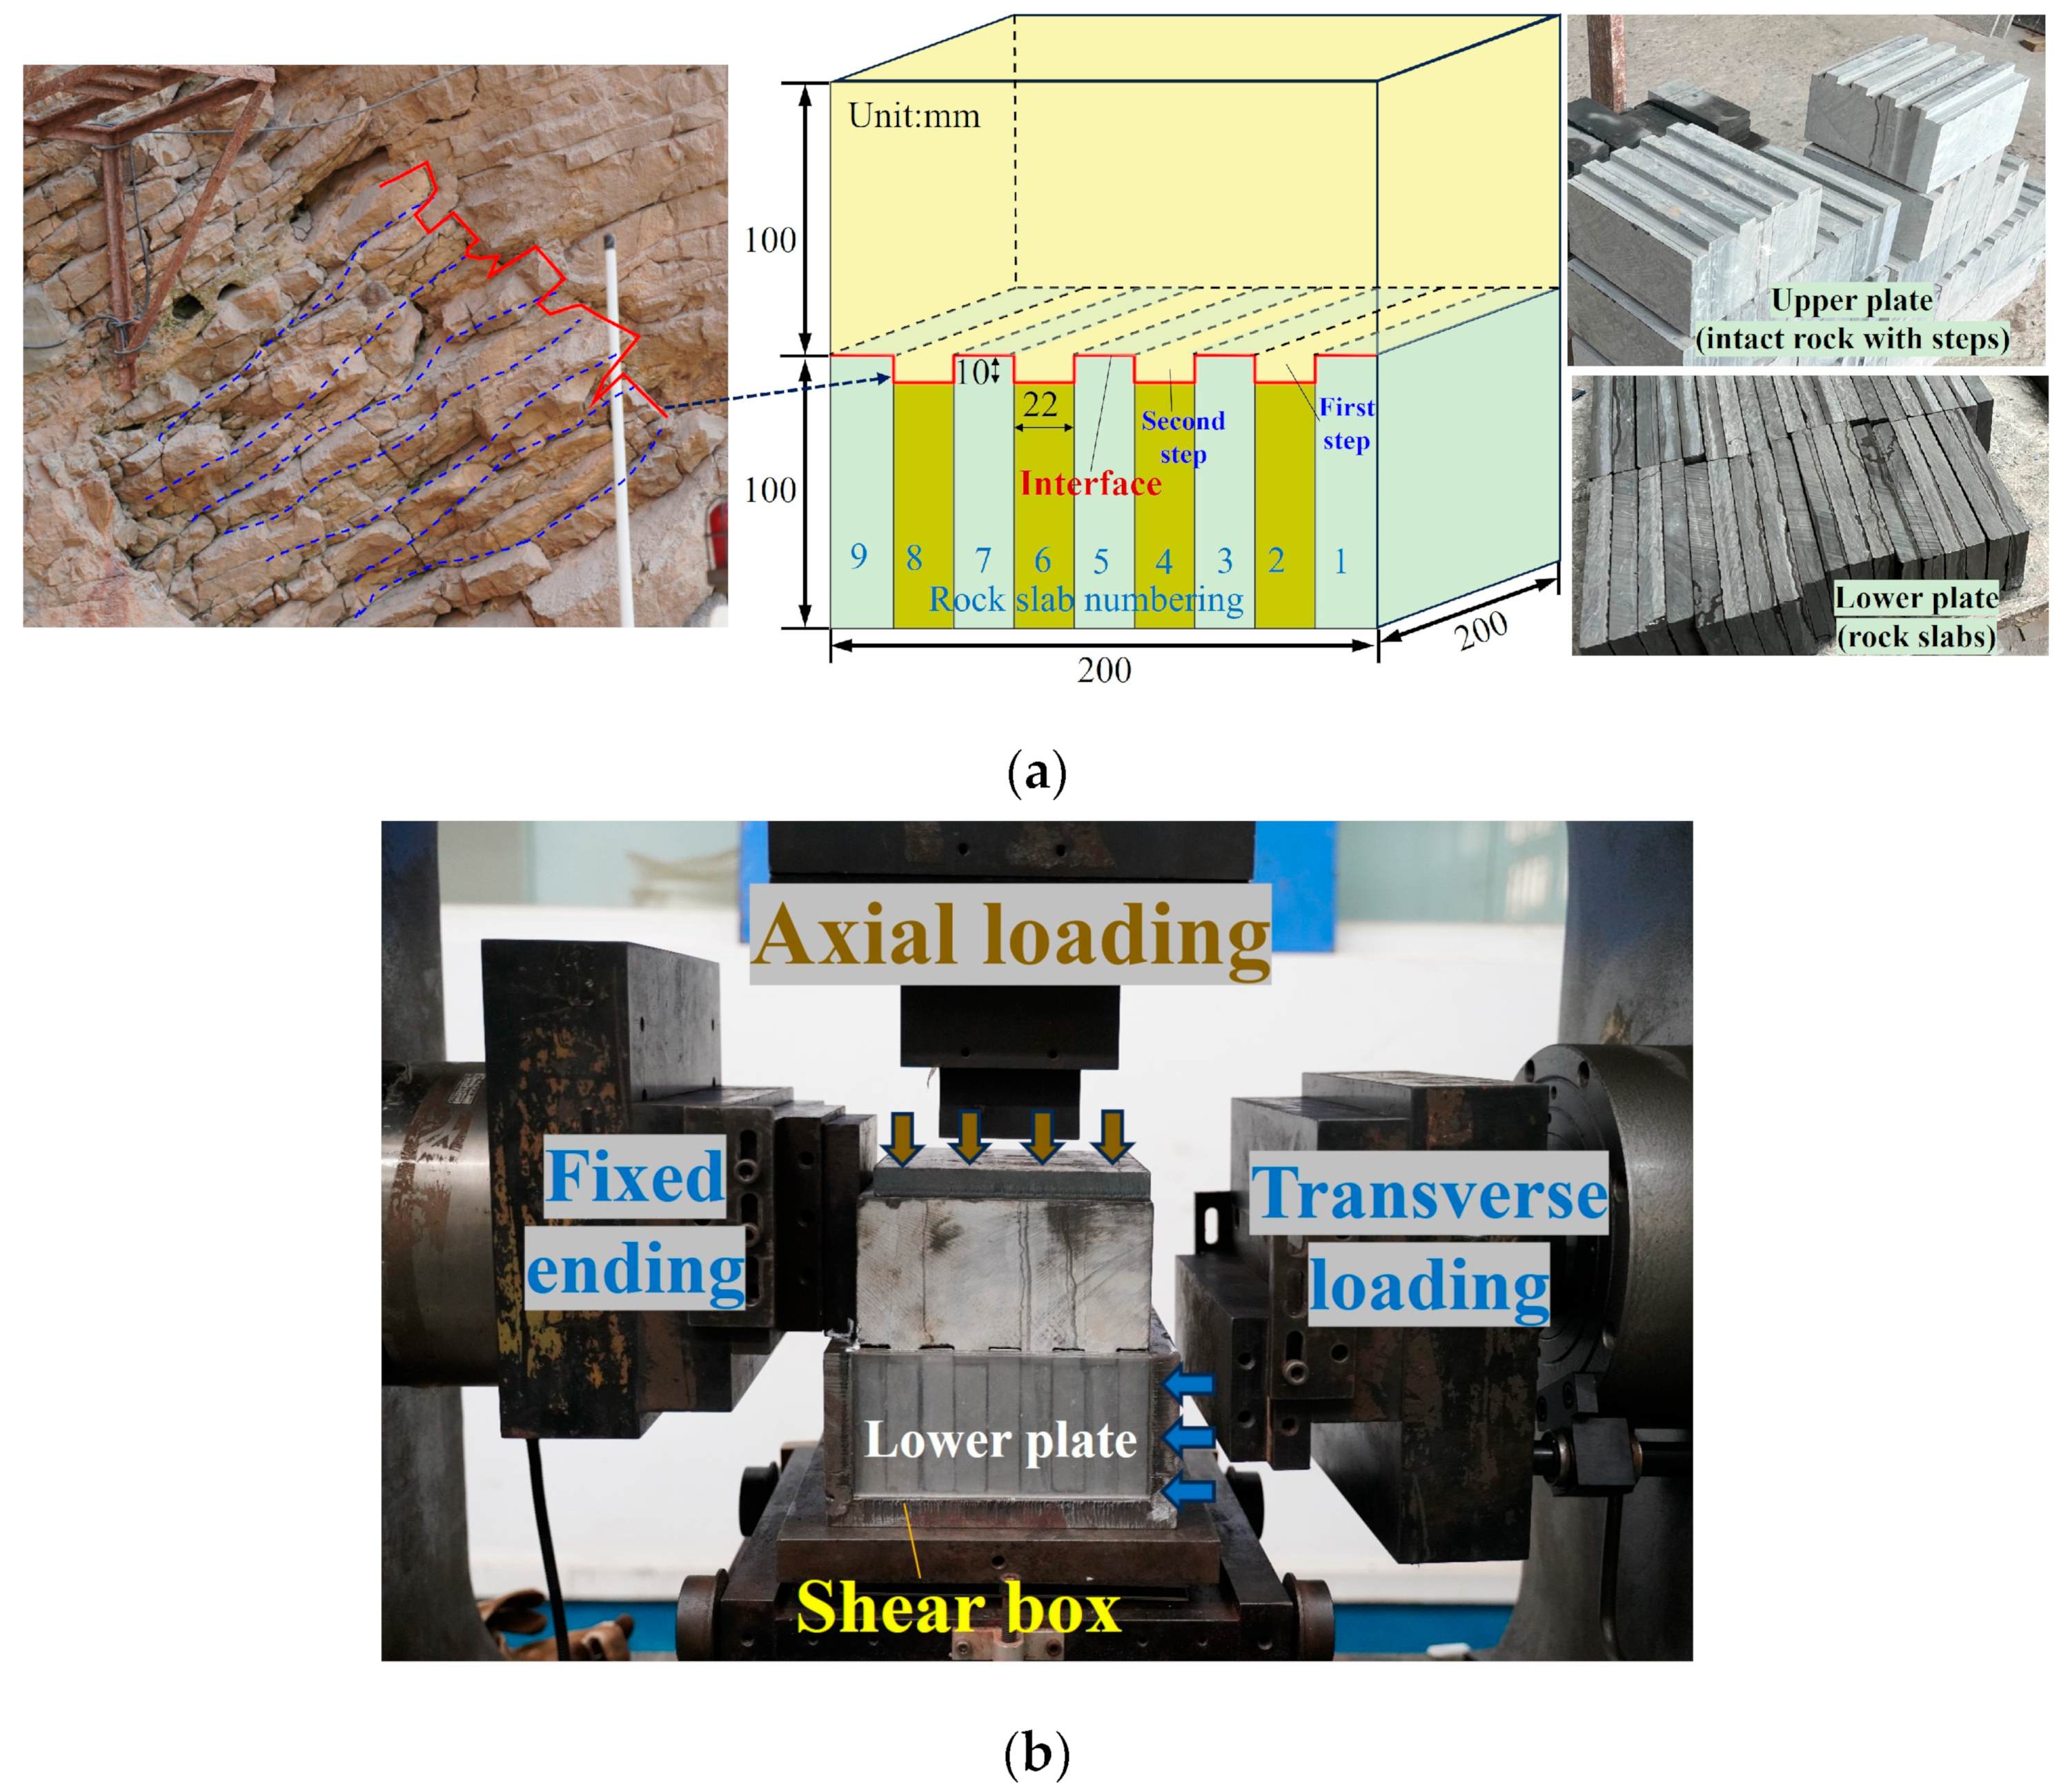
3.2. Testing System and Procedure

The exposure of the shear band does not impose any additional stress constraints, thus allowing for a straightforward setting of boundary conditions in the shear tests. Consequently, the boundary condition for the shear tests was established as constant normal stress. The height of the dangerous rock mass situated above the shear band is approximately 110 m. Considering the height and density of the overburden rock, three distinct constant normal stress levels were set: 1 MPa, 2 MPa, and 4 MPa. The experimental procedures were conducted using a WDAJ-600 microcomputer-controlled electro-hydraulic servo rock shear rheological testing machine, as shown in Figure 3b. In these tests, the upper plate remains stationary, while the lower plate is put into the shear box. Normal stress is applied through a stress servo mechanism, and the shear load is incrementally applied to the lower plate in a leftward direction. The tangential loading is applied with a displacement-controlled loading speed of 0.5 mm/min.

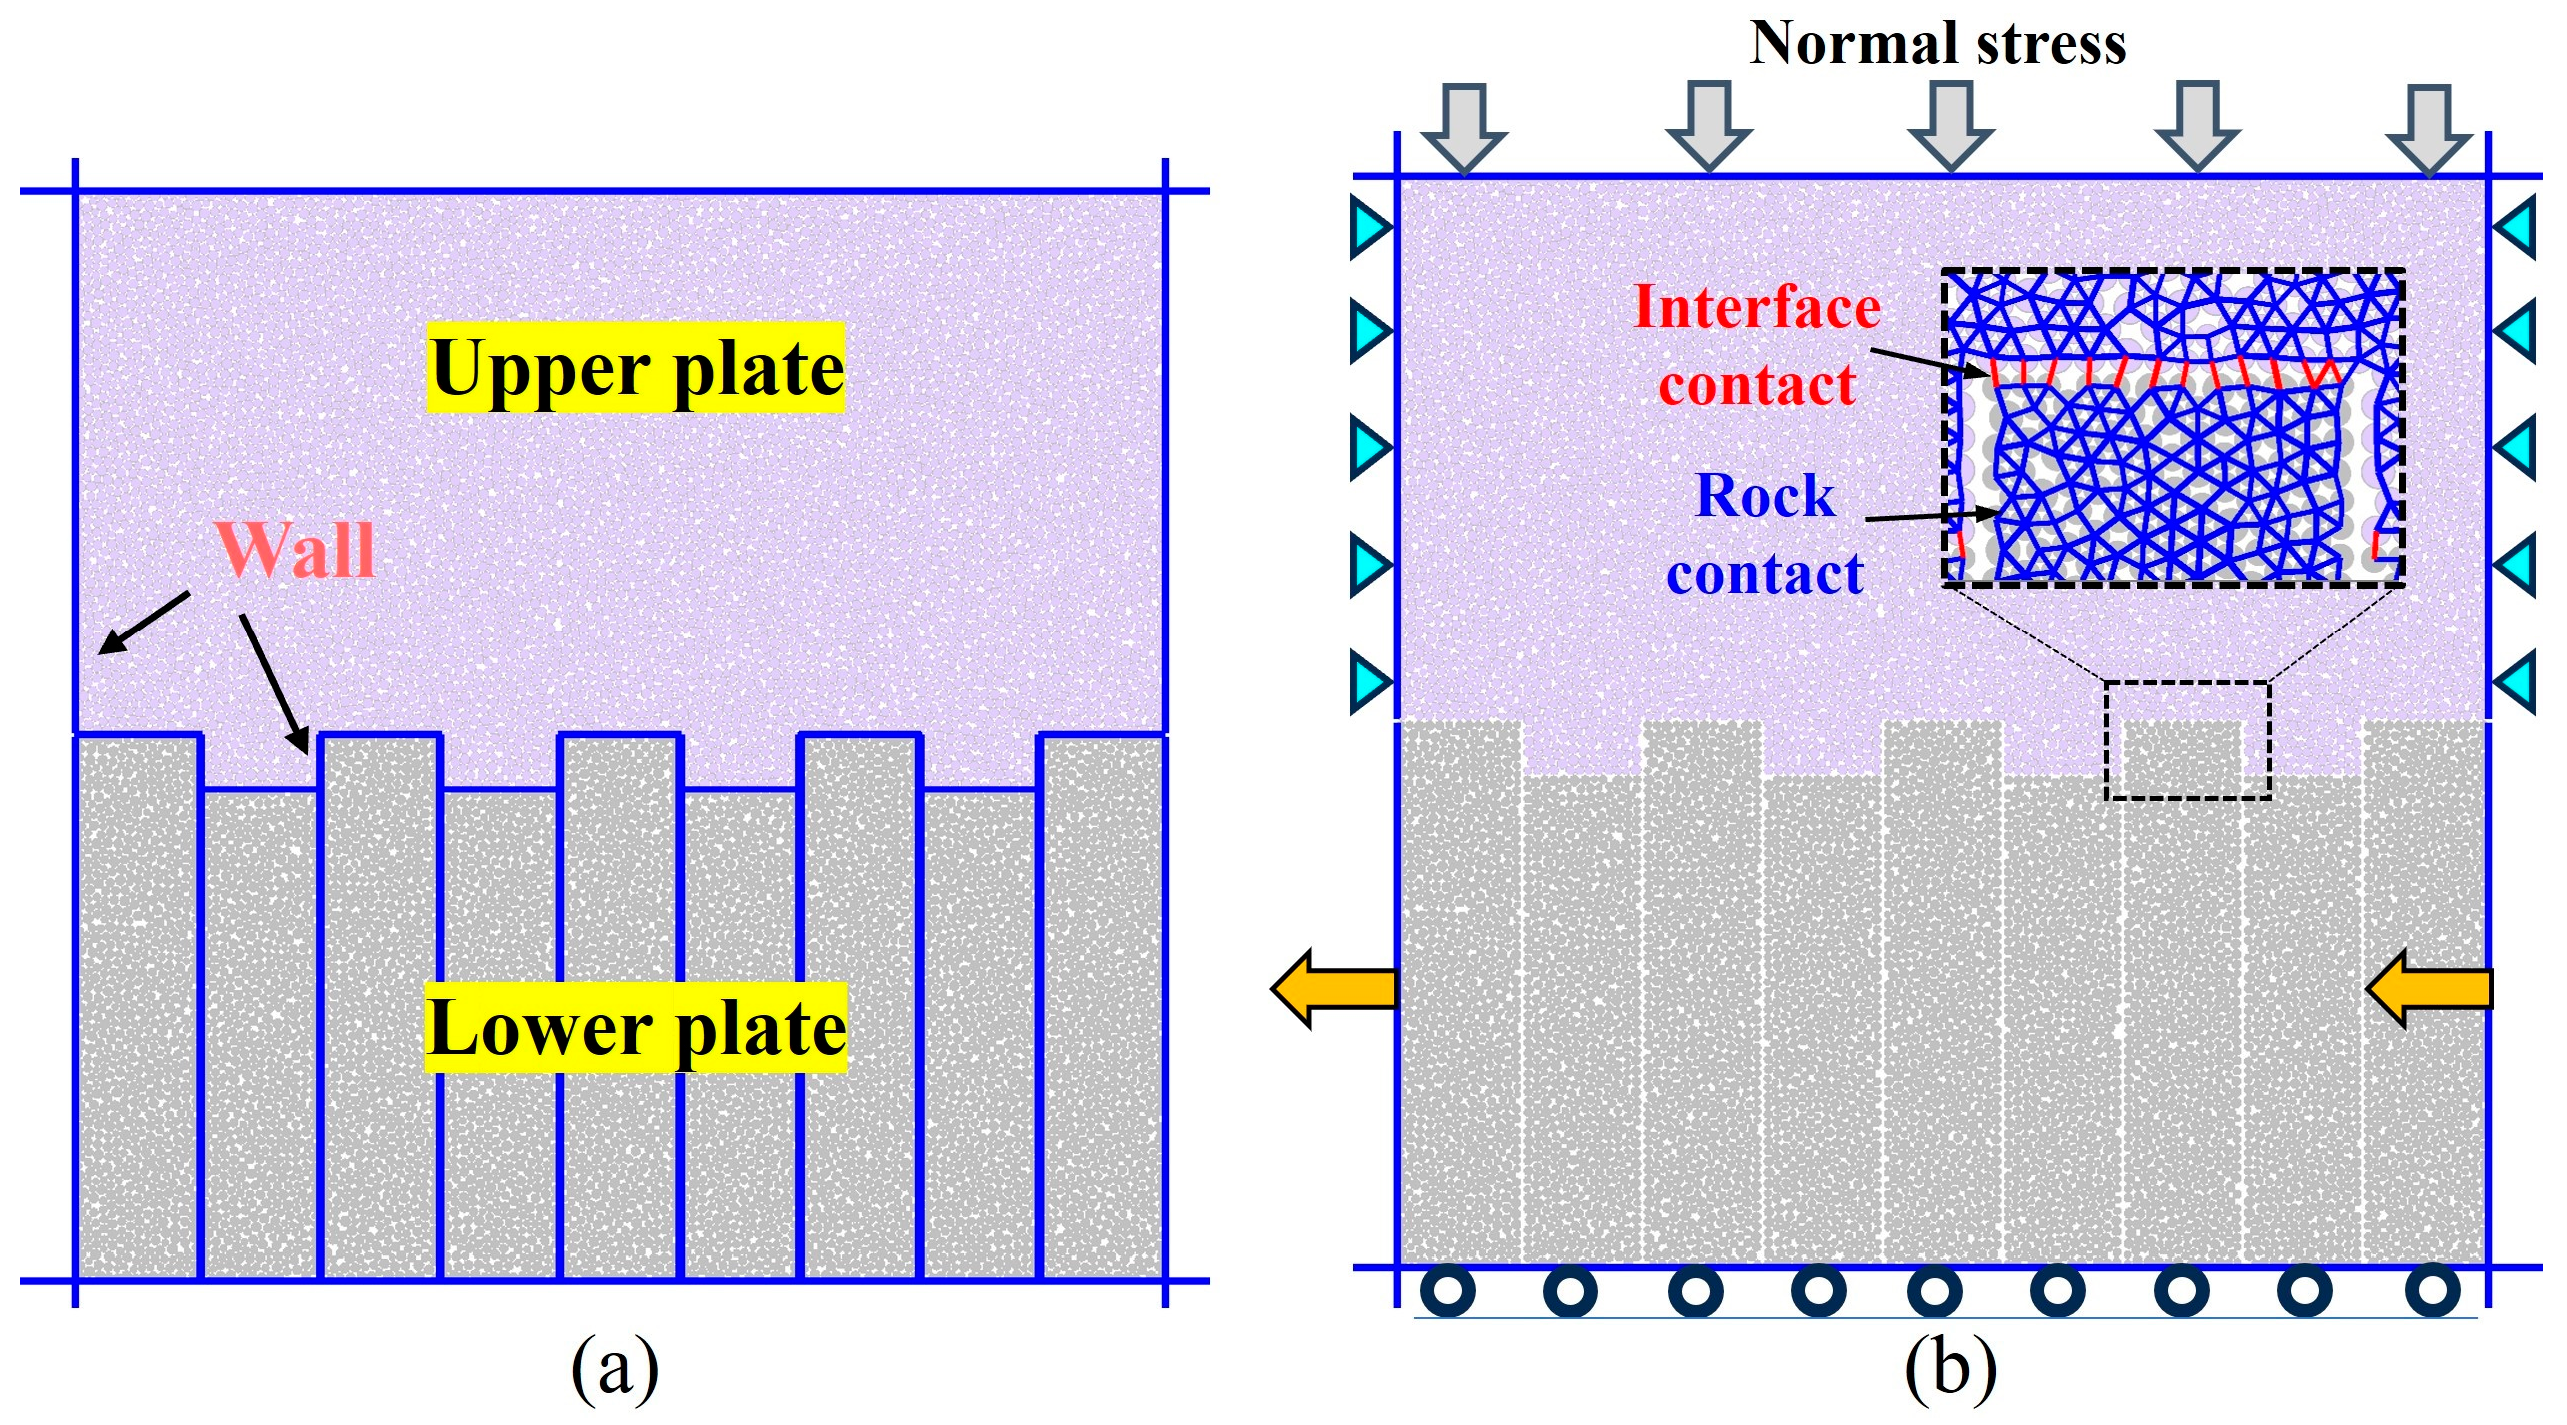
3.3. DEM Modelling Establishment

PFC (Particle Flow Code) (Version 6.0 used in this study) is a DEM simulation analysis software program developed by Itasca, a company in the United States. In this software, the smallest units of the simulated object are circular particles (2D) or spheres (3D), and the particles (or spheres) are connected to each other through contacts [40]. Contacts can transmit forces and moments, and are updated and calculated at each timestep [40]. Therefore, PFC software can be used to simulate the complex mechanical behaviour of granular materials or blocks, including particle flow, breakage, deformation, and other large deformation issues [41,42,43]. However, due to the mechanical calculations and updates of tens of thousands of particles and contacts at each timestep, the computational efficiency and accuracy significantly increase with the increase in particle numbers. For complex models, modelling and computational time and accuracy have become its inevitable shortcomings. However, for rock or rock mass simulation tests, while ensuring the size effect, the number of particles can be controlled within an effective range. Therefore, PFC software has been proven to be an effective means of numerically simulating rock mechanics [15,22,27,28,29,41,42,43]. It can be seen from Figure 3a that the design of the on-site rock mass and indoor experiment has certain planar problem characteristics because the interface between the rock slab and the dangerous rock mass only has changes in two directions. In light of this, the three-dimensional characteristics of the interface roughness can be simplified into a planar problem. Considering the calculation speed and accuracy, the 2D version of the PFC software (PFC2D) was chosen for numerical simulations in this study. It is important to ensure that the dimensions of the simulated samples align precisely with those of the laboratory test specimens, as depicted in Figure 4a. The samples were established using a shear box genesis approach [25]. Particles were generated within the upper plate and the rock slabs of the lower plate, thereby maintaining the structural integrity and independence of each component. The particle radius in the simulation varies, with the maximum being 1.05 mm and the minimum 0.7 mm, resulting in a total of 13,812 particles that constitute the sample. As shown in Figure 4b, the simulation loading methodology involves the application of shear stress through the movement of the lower wall from left to right. The movement velocity of the walls is set to 0.05 m/s. Under this velocity, the calculation timestep is automatically set to 2.01 × 10⁻⁷ s/step. It needs 0.995 × 10⁵ steps to move 1 mm. Referring to the related study results in reference [44], this loading velocity adheres to the quasi-static requirements necessary for the experimental testing.

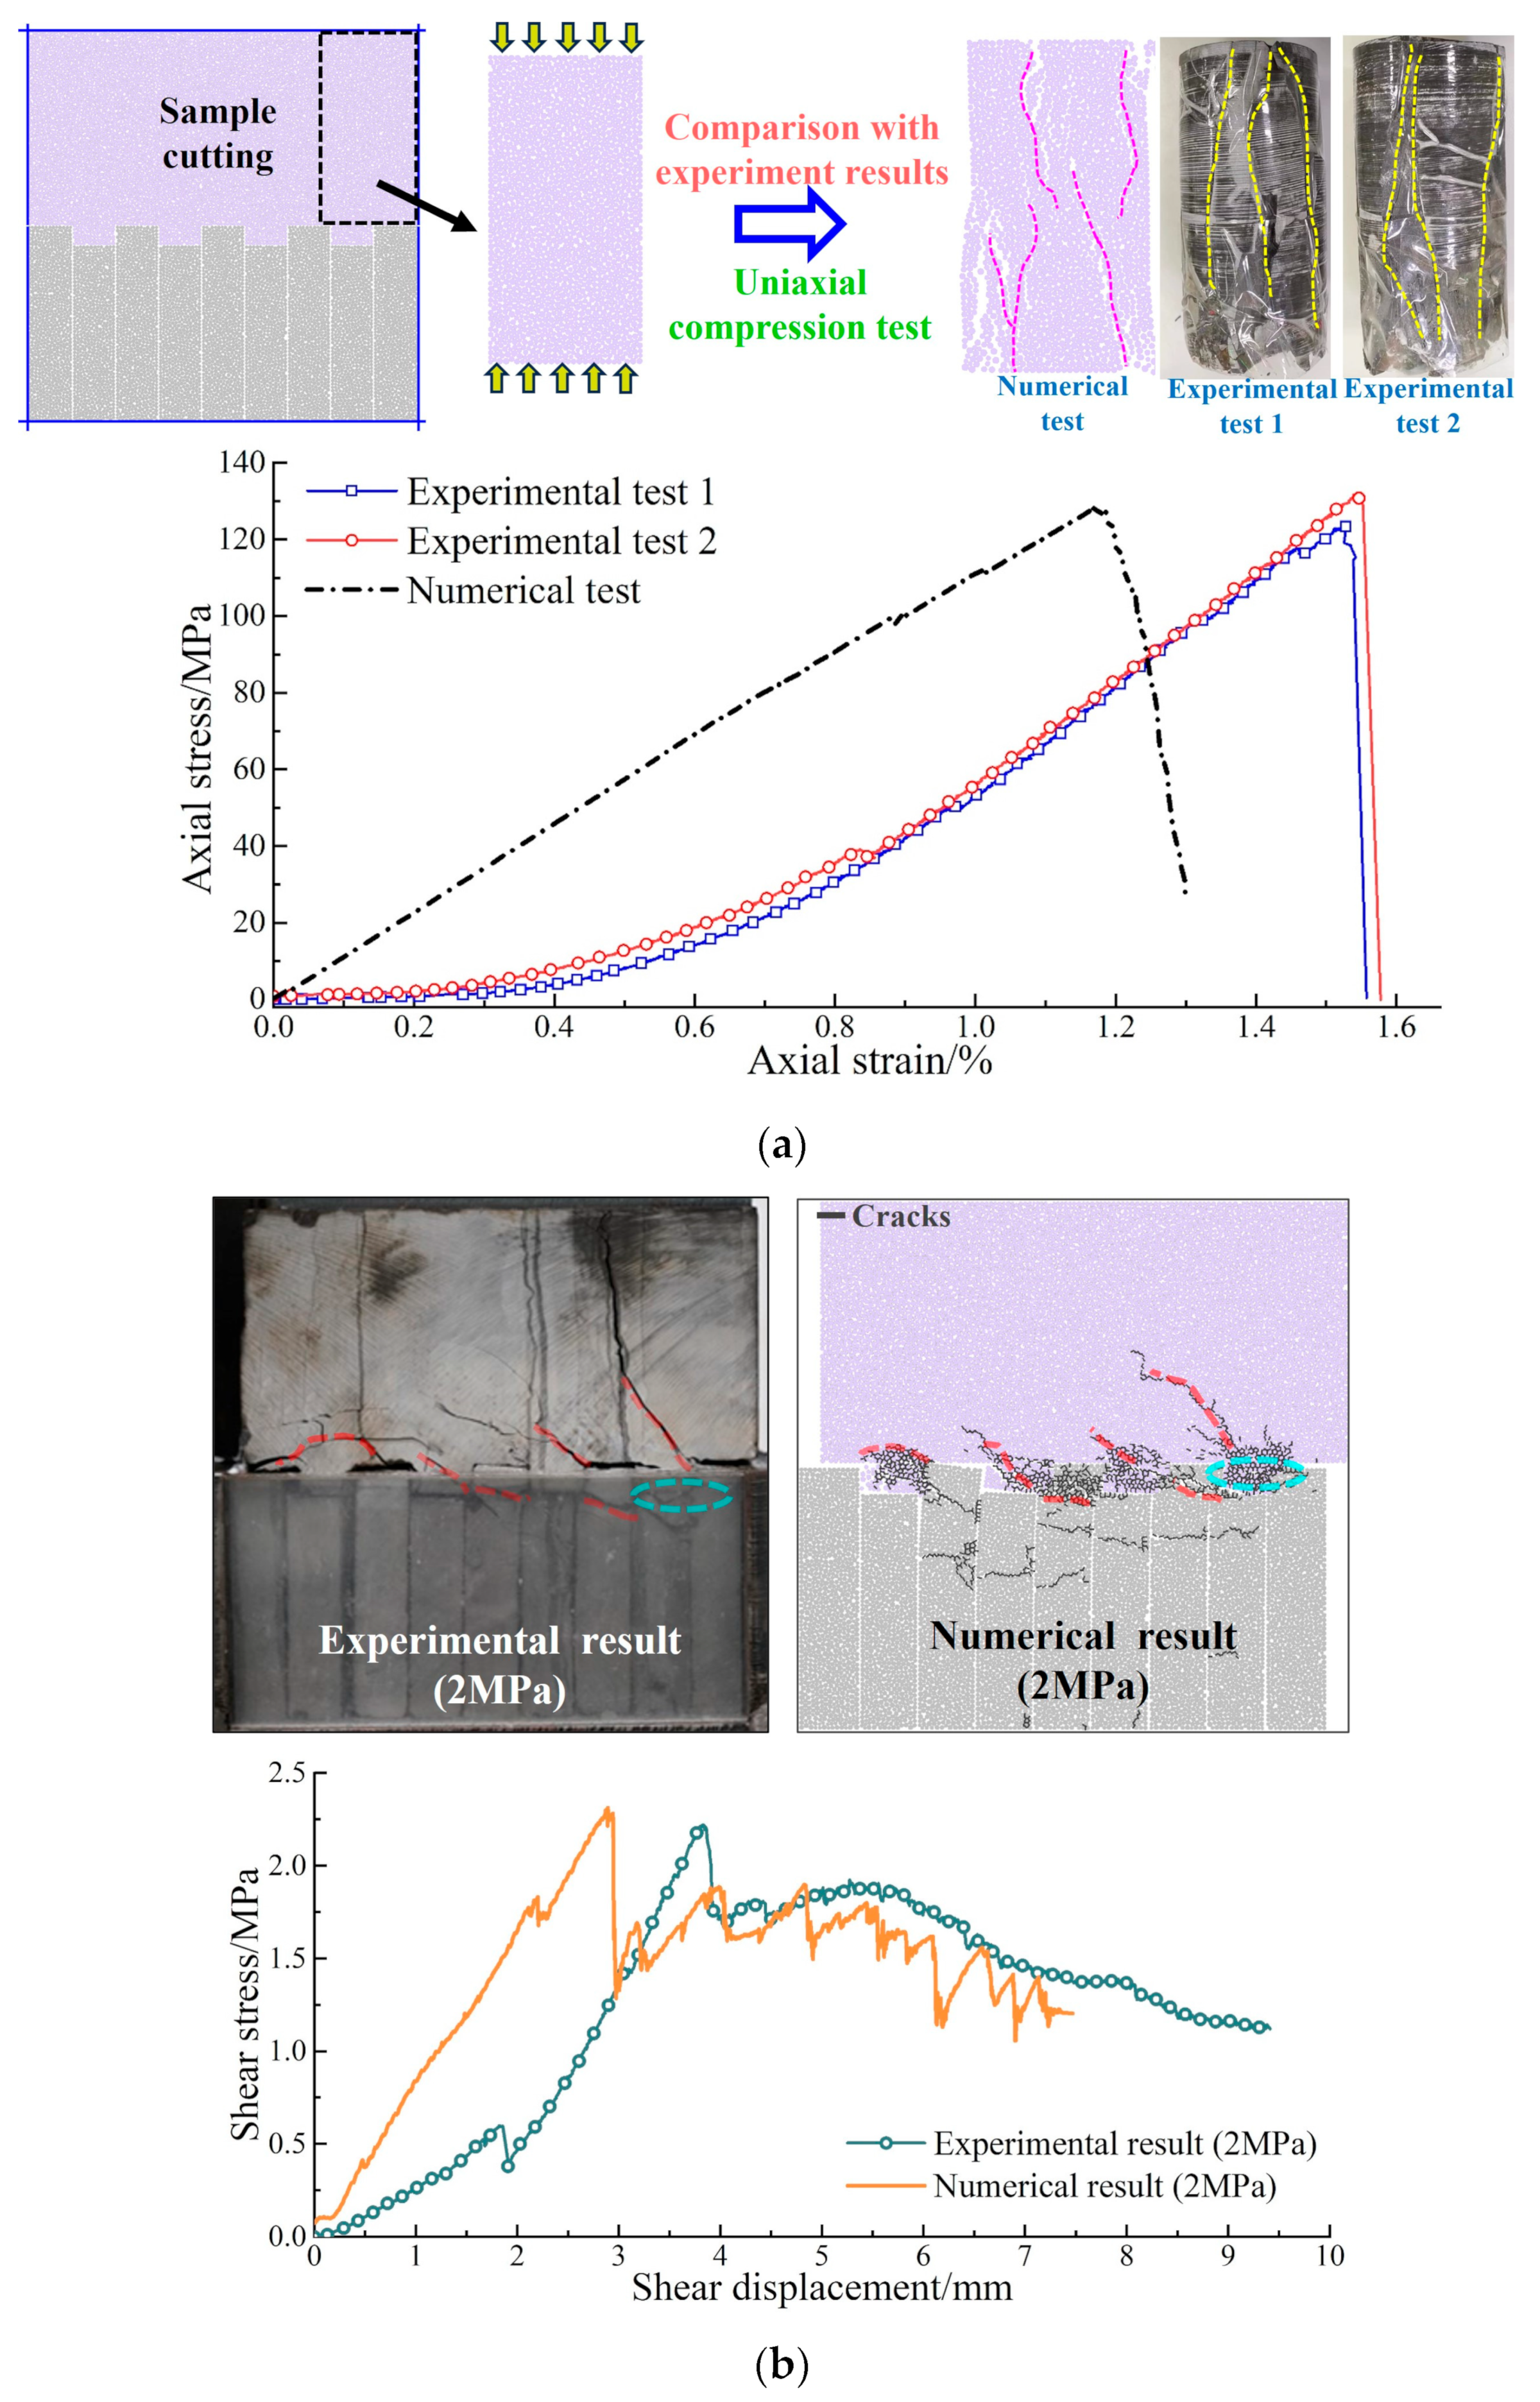
3.4. Contact Model and Parameter Calibration

In PFC software, compared with the parallel-bond contact model, using a flat-joint model can address the issues of particle interlocking and the mismatched tensile-to-compressive strength ratio [45,46]. Hence, it is considered to be a constitutive model that can better simulate the failure and matching strength of rock samples and has been widely used in a number of studies [47,48,49]. In view of this, in the simulation test in this study, the flat-joint model was selected as the contact model for the rock and rock slab particles. The smooth-joint model is mainly used to simulate the friction action of rock discontinuities [25,50]. However, in addition to friction action, force transmission also occurs at the interface position during the loading process, and the use of the flat-joint model can give consideration to these two actions. Therefore, the flat-joint model was also chosen as the contact model for the interface.
The “trial and error” approach is the most commonly used method of parameter calibration [27,29,51,52]. With a given set of microscopic parameters, the simulated samples are subjected to loading conditions that mirror those of the laboratory tests. If the simulation results fall within an acceptable error range and show good correspondence with the experimental macroscopic parameters and failure modes, the microscopic parameters are deemed suitable for other simulation tests involving the same rock type. Consequently, in this study, the results of the uniaxial and laboratory shear tests on limestone were reproduced through numerical simulation. To maintain uniformity and accuracy in the simulation parameters, the uniaxial simulation sample was cut directly from the shear sample, as depicted in Figure 5a. Through a process of constant trial and error, results that closely correspond with the experimental data were obtained, as evidenced in Figure 5. Table 2 gives the microscopic parameters used in this study. A quantitative comparison of the mechanical characteristics between the simulation and experimental results is shown in Table 3. The findings further validate the accuracy of the parameter calibration by showing that the errors between the two are within a reasonable range.

3.5. Experimental and Numerical Simulation Schemes

Besides the three fundamental laboratory shear tests, this study also explored how changes in the sample and step geometry size affect shear mechanical behaviour. Across all models, the microscopic parameters are held constant, following those listed in Table 2, to ensure the consistency and comparability of the results. The specific conditions for both the laboratory tests and numerical simulations are detailed in Table 4, along with their corresponding descriptions. The abbreviations “L” and “S” denote the basic laboratory and simulation tests, respectively. To probe the effects of varying sample sizes, step heights, and step widths, the simulation tests are categorised as “SS” for sample size, “SH” for step height, and “SW” for step width, with the subsequent numbers representing the specific altered values.

4. Results Analysis

4.1. Failure Mode and Curve Characteristics

Figure 6a,b display the experimental and numerical shear stress–shear displacement and normal displacement–shear displacement curves for the “L” and “S” samples, respectively. The results from both the laboratory and simulation tests exhibit a strong correlation, indicating good agreement between the two sets of data. The shear stress curves reveal several distinct stages in the shear behaviour. The initial stage, marked by contact gap closure and micro-crack compaction, is unique to the experimental shear stress curves. The second stage corresponds to elastic behaviour, followed by the pre-peak elastic–plastic stage in the third stage. A noticeable stress drop is observed after reaching the peak (first peak) stress point, which is the fourth stage. In the post-peak stage, the shear stress initially increases slightly, and then gradually decreases, ultimately reaching a residual value. Notably, for samples “L-4” and “S-4”, the post-peak shear stress value surpasses the first peak value, indicating high residual strength. This phenomenon can be explained by the heightened frictional force caused by the increased normal stress.
The normal displacement–shear displacement curves highlight the samples’ dilatation effects. The experimental curves typically exhibit no growth during the compaction stage, stable growth during the failure stage, and gradual growth as they approach the residual value. Due to limitations in particle radius and the accuracy of stress servo, the residual part of the simulation curves exhibits some fluctuation, with the normal displacement value in the residual region being marginally larger than that observed in the experimental results. Nevertheless, the overall trend of the simulation curves closely mirrors that of the experimental curves.
Figure 6c,d illustrate the failure modes observed in the tests. As the normal stress increases, the interface strength increasingly relies on both the strength of the steps and the frictional action at the interface, with the contribution of friction to the shear strength being progressively enhanced. Under low normal stress, specimen failure is predominantly characterised by step fracture, with a limited frictional area and minimal rock fragments at the interface. With intermediate normal stress, the failure mode transitions to step fragmentation accompanied by a significant accumulation of rock fragments. At high normal stress, the steps break, the rock fragments are ground into powder, and a large frictional area is formed at the interface.

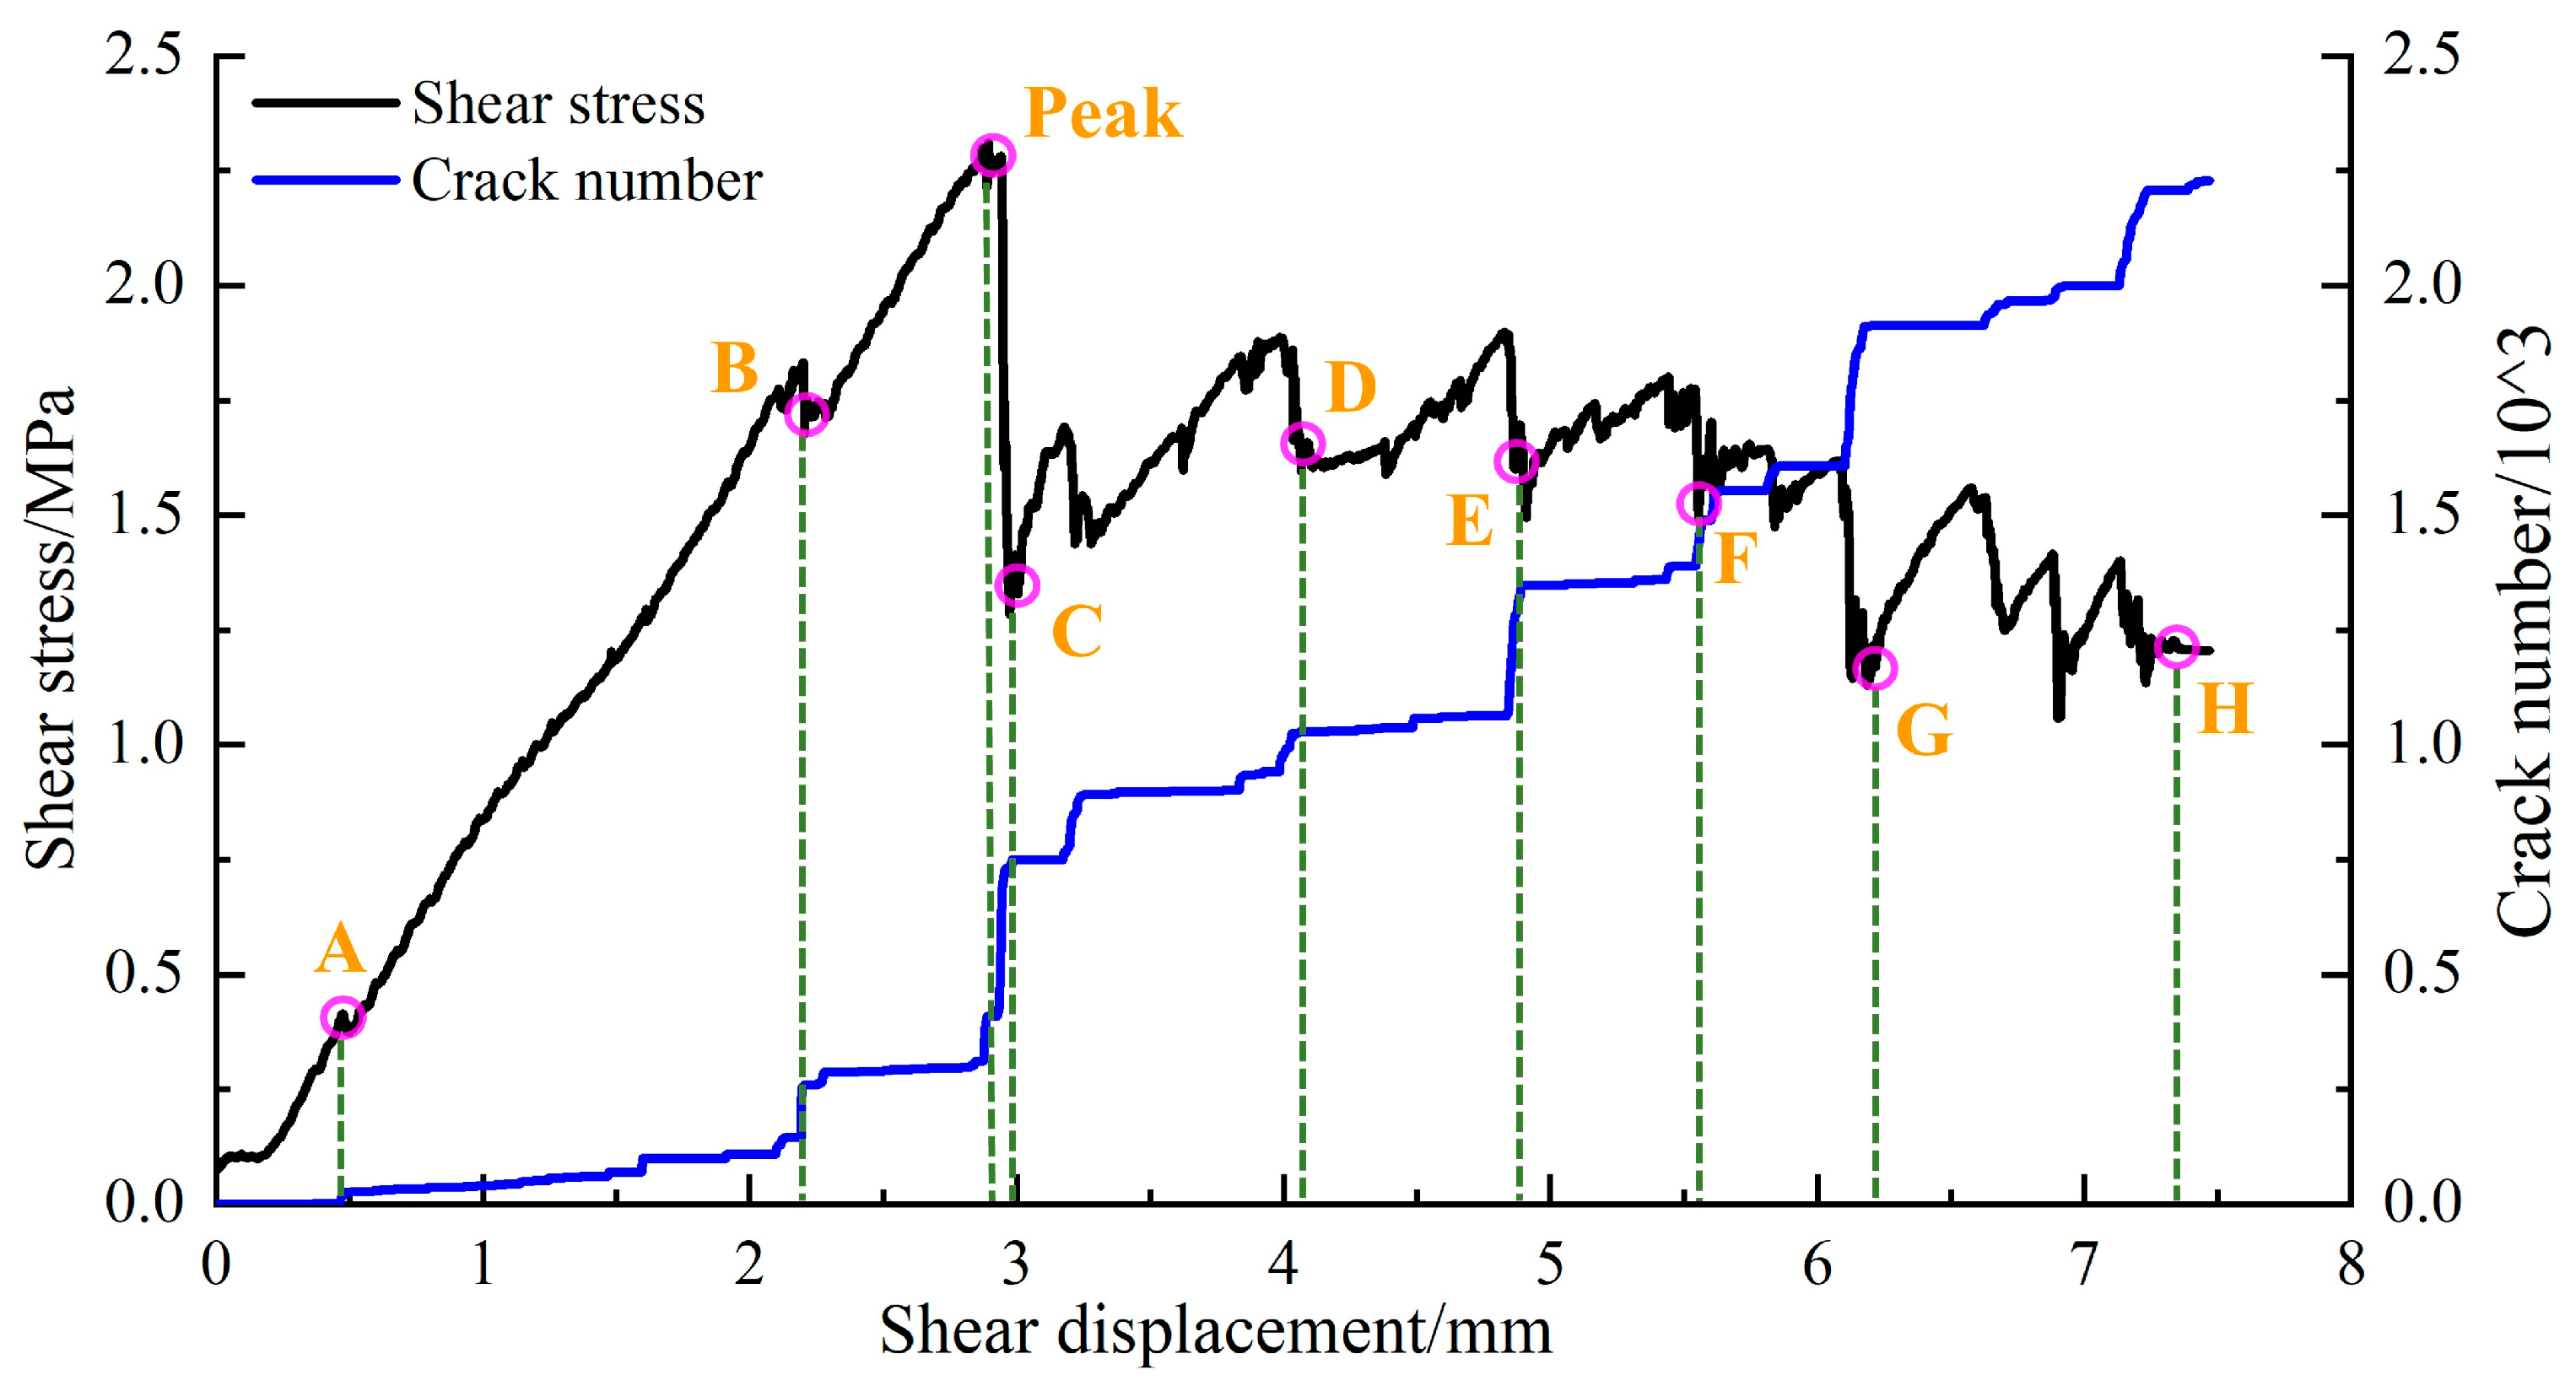
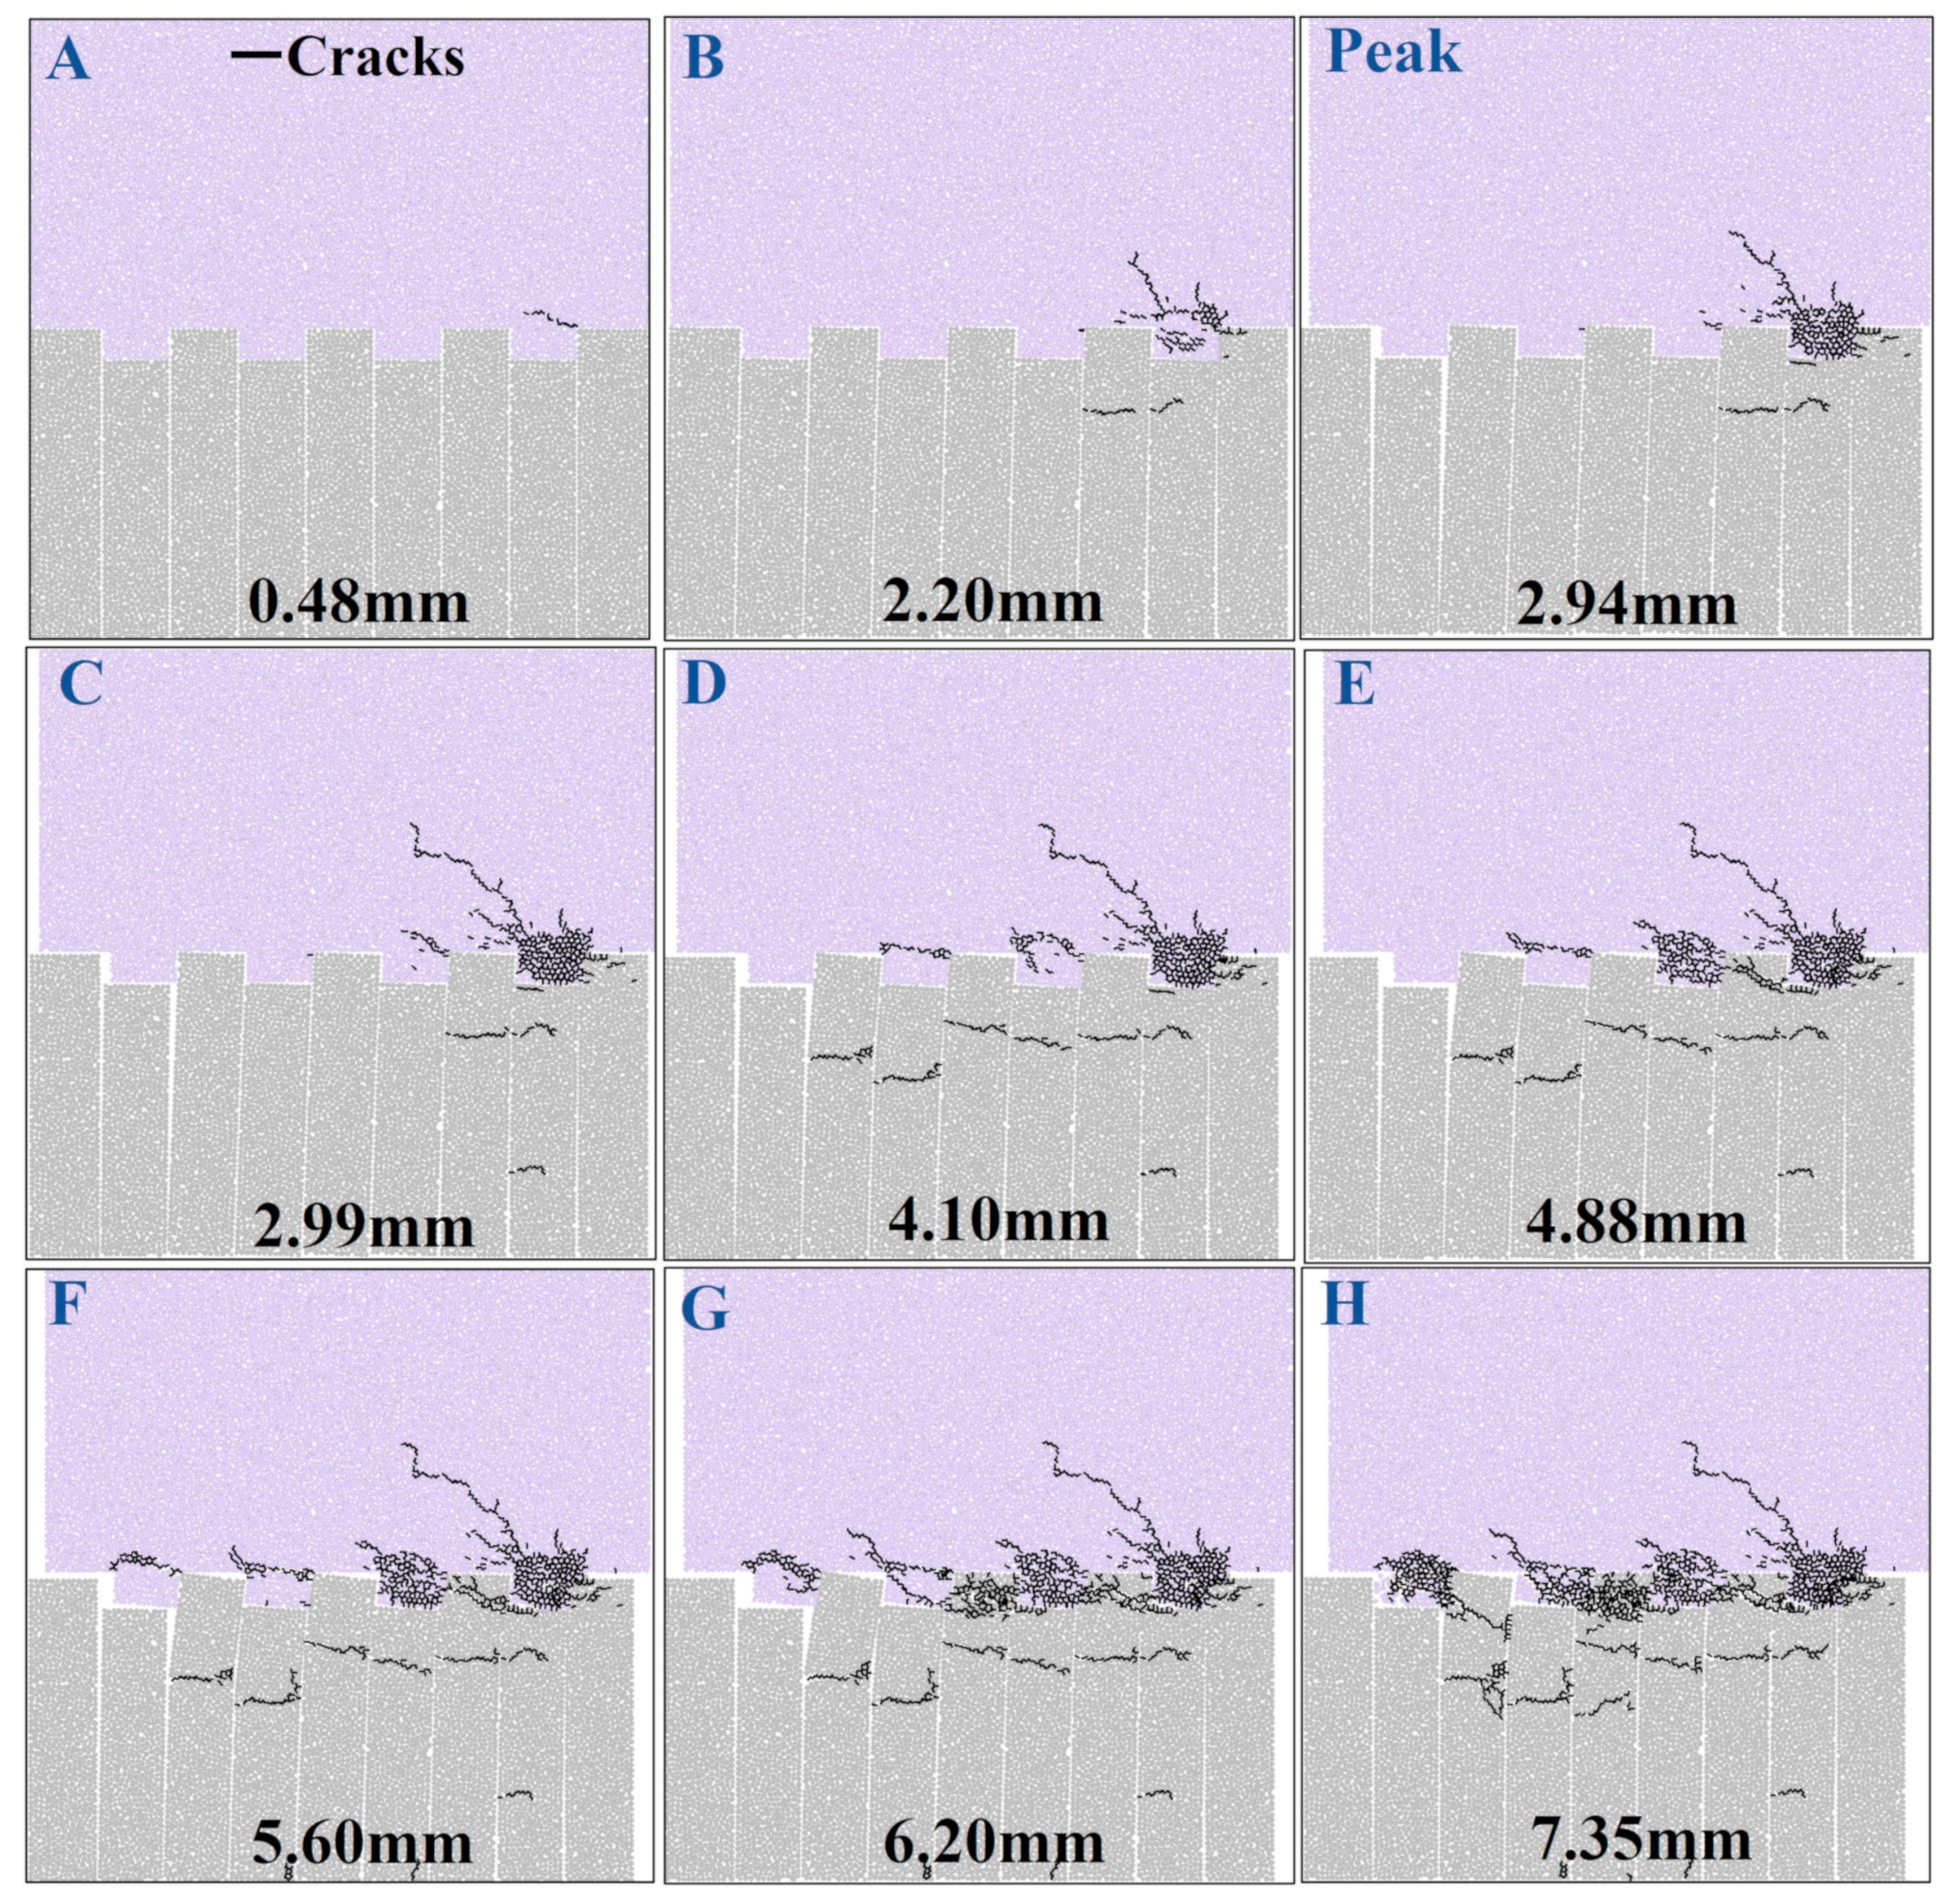
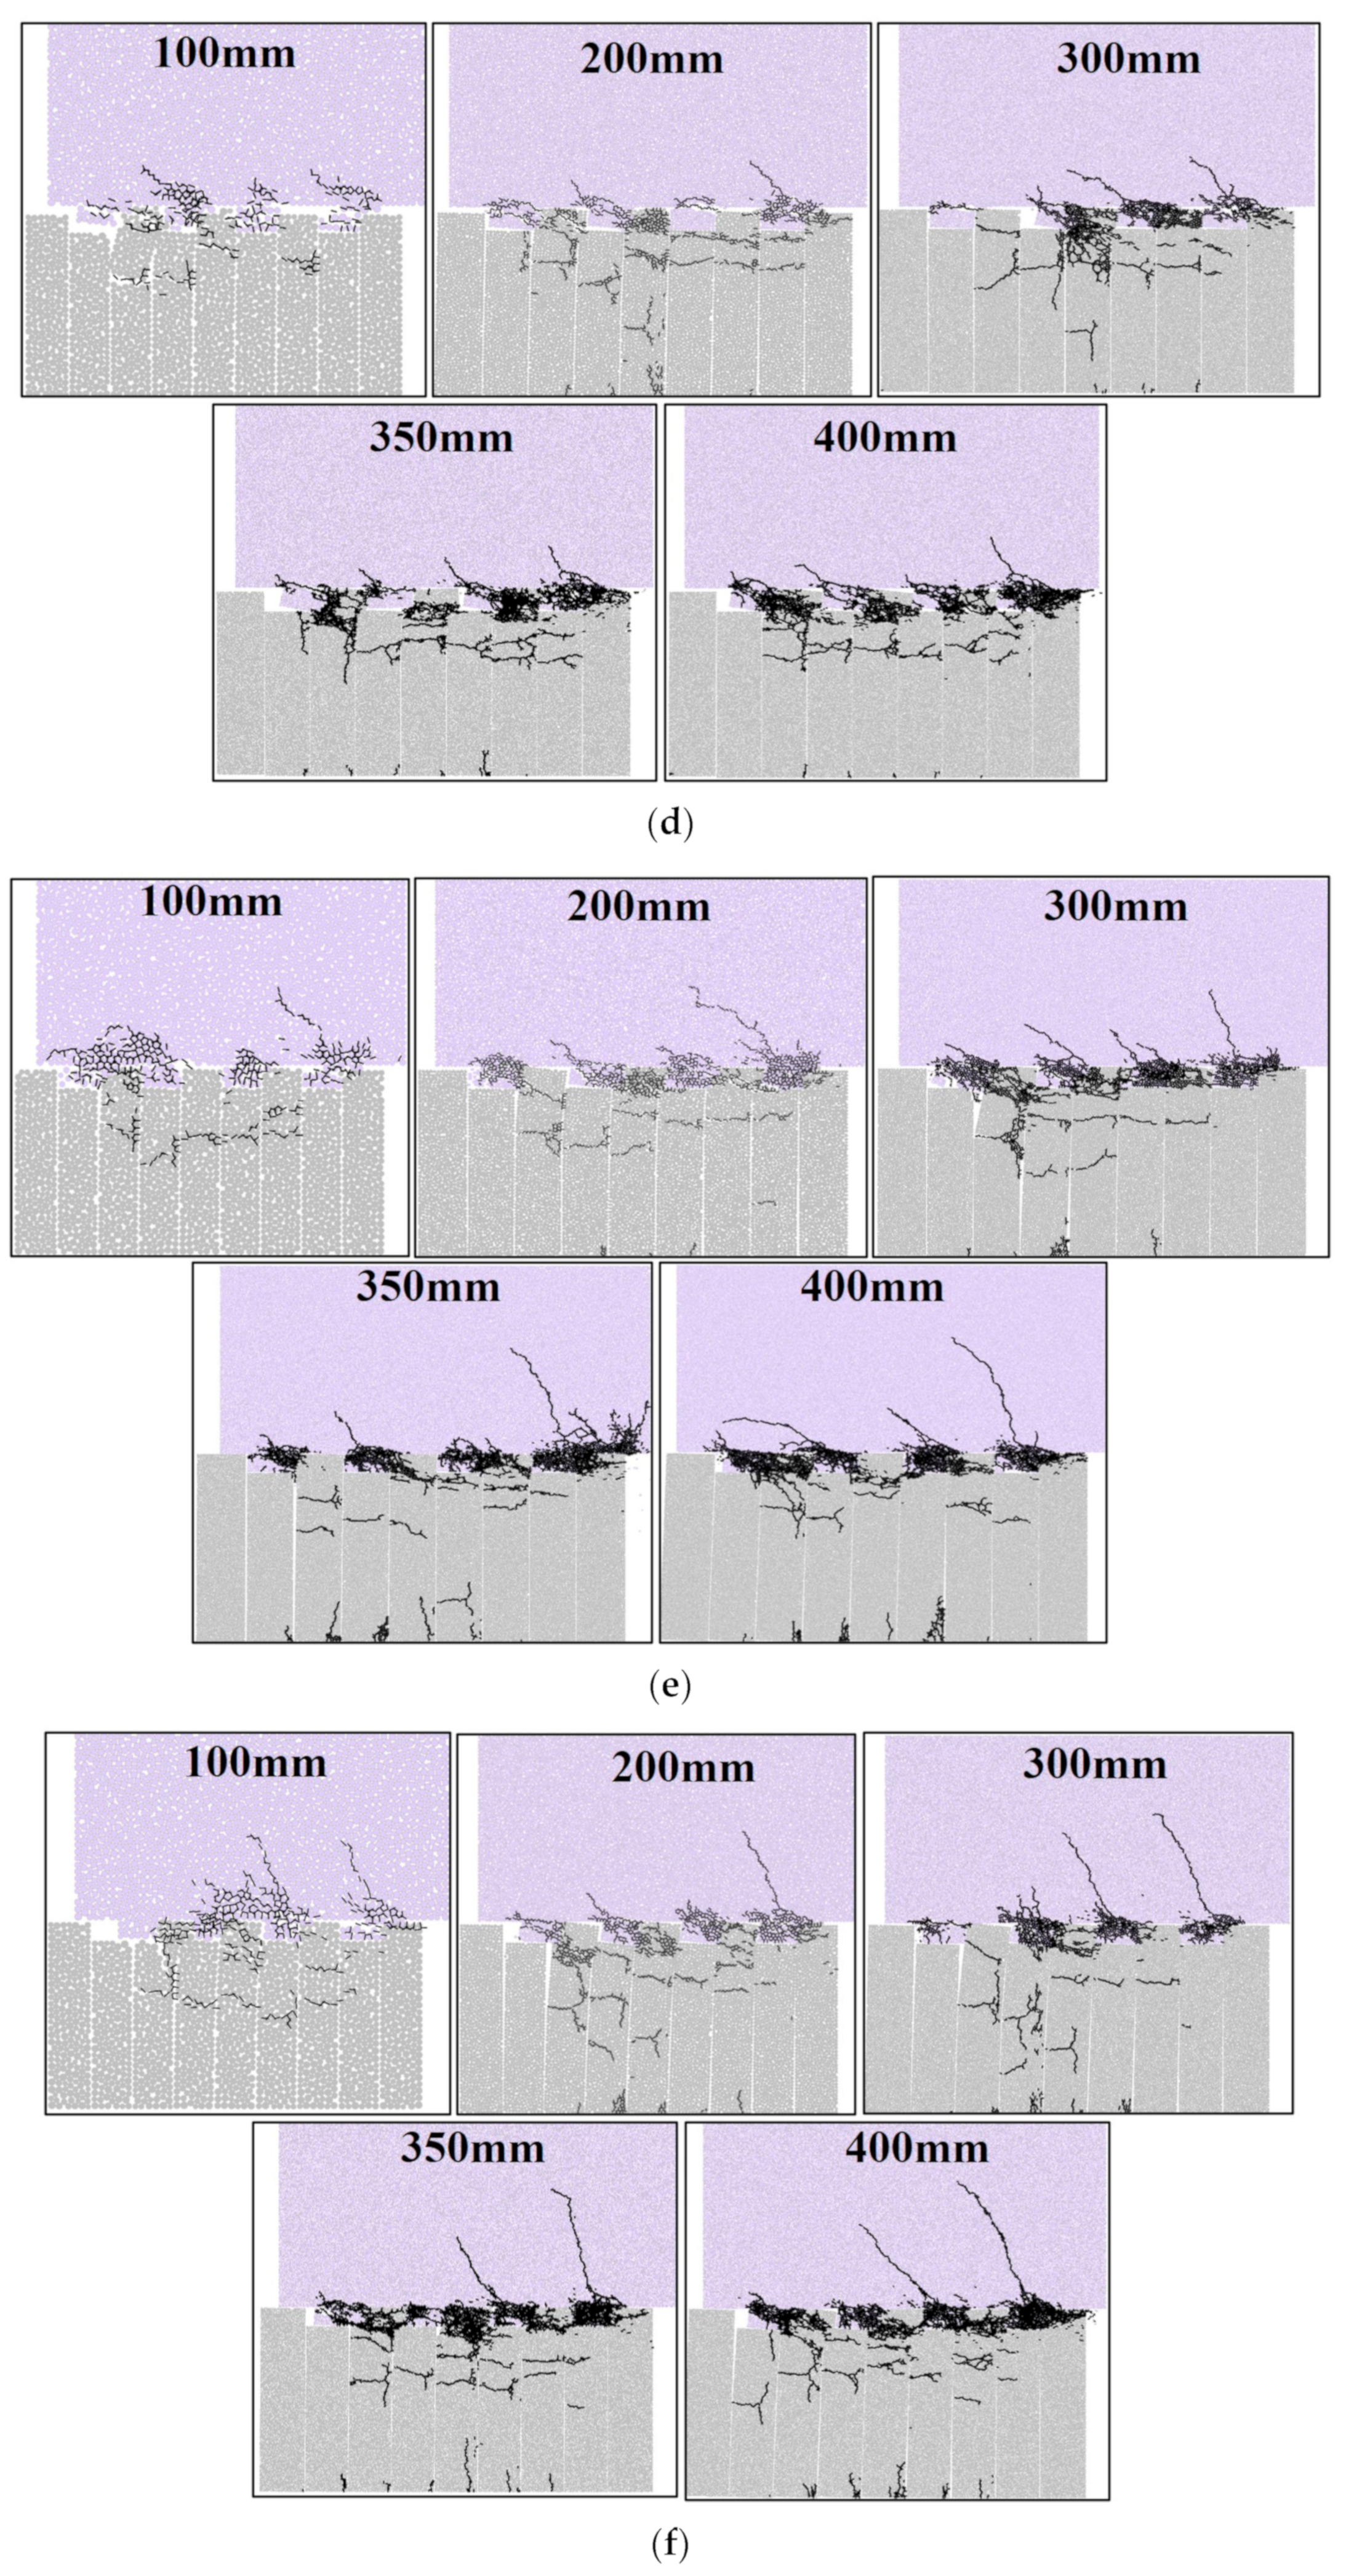
4.2. Failure and Crack Evolution Process Analysis

Using sample “S-2” as a representative case, Figure 7 illustrates the progression of failure and crack evolution. At a shear displacement of 0.48 mm, cracks initiate from the root of the first rock step to the upper right place (point A). As the displacement continues to increase, cracks spread over a small area, with a few emerging in the lower rock slab and the first rock step (point B). Upon reaching the peak stress point, the first step experiences failure, marked by a sudden increase in the number of cracks and an instantaneous drop in stress. With the broken step no longer able to provide effective shear resistance, the second step immediately assumes the primary load-bearing role at point C, leading to the initiation of cracks within it. From point C to D, during the post-peak stage, transversely propagating cracks begin to appear within the rock slabs. Another stress drop is observed at point E, signalling the failure of the second rock step and the coalescence of numerous cracks. Subsequently, the shear stress starts to decline gradually. At point F, cracks in the two steps on the right side propagate transversely. Finally, at the point of ultimate failure (point H), both the upper rock step and the lower rock slab near the interface are severely damaged, with cracks coalescing horizontally across the interface.
A comparative analysis of the simulation results for samples “S-1”, “S-2”, and “S-4” (with the results for “S-1” and “S-4” not presented due to length constraints) reveals variations in the degree of damage and the timing of failure events among the three samples. Despite these differences, the overall failure process remains consistent across the samples, characterised by progressive failure from right to left.

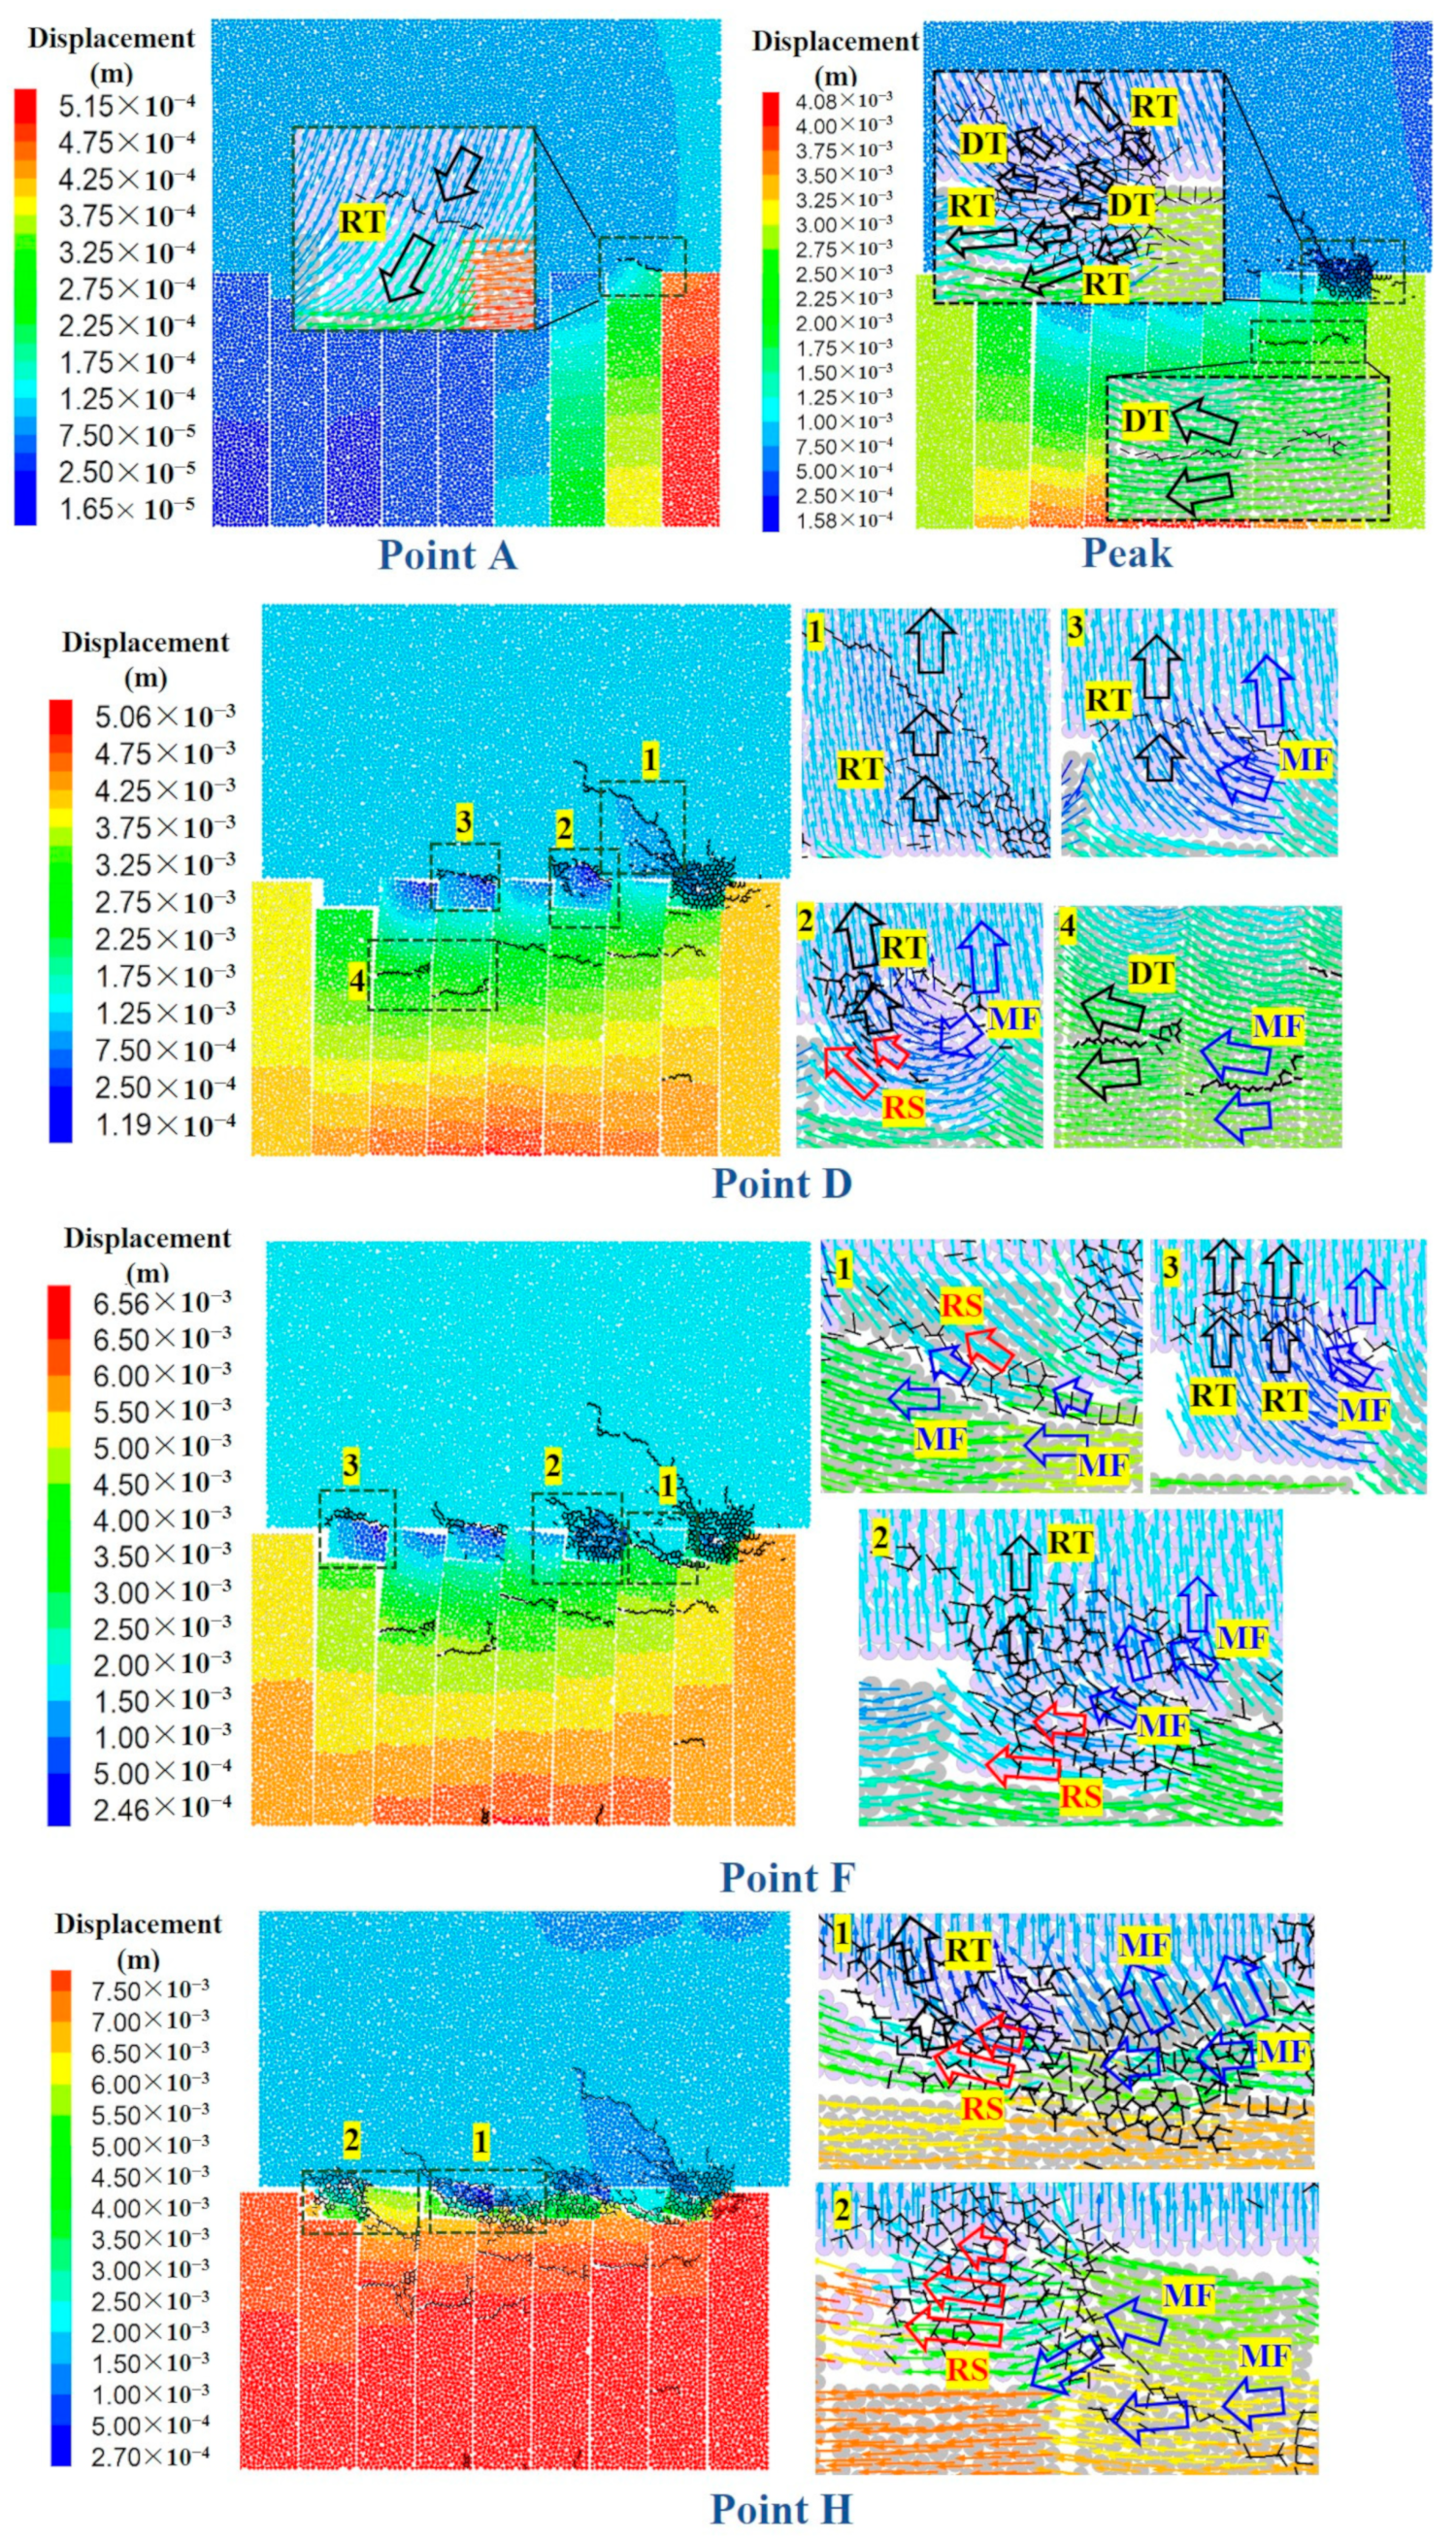
4.3. Displacement Field and Crack Type Analysis

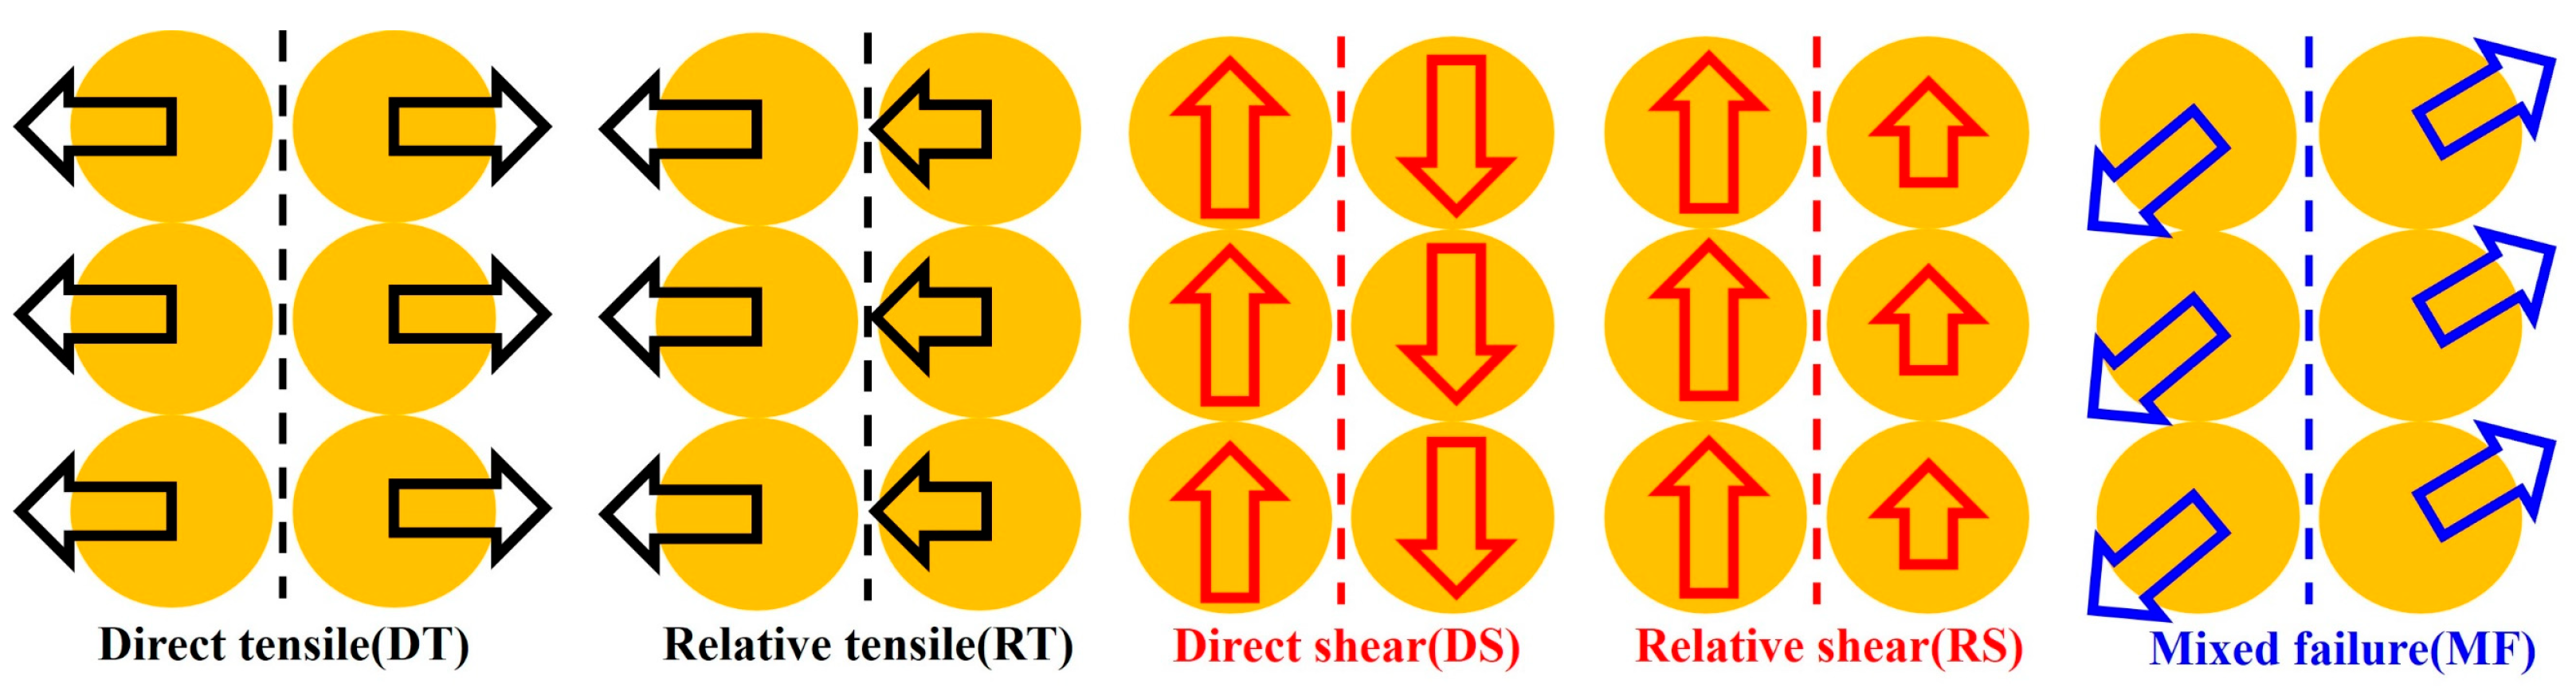
4.3.1. Description of Crack Types

In the discrete element method, the excessive relative displacement between particles can lead to broken bonds, as reflected in the contacts within the PFC software. This process is instrumental in simulating the formation of cracks within the material. The classification of crack types is typically based on the relative normal and tangential displacements of the particles [29,53,54,55,56], and they are broadly categorised into three main types: tension, shear, and mixed failure. The types of cracks are described as follows and plotted in Figure 8:
(1)
Direct tensile (DT). This type of crack forms when the displacement directions of two particles are opposite and parallel to the line connecting their centres.
(2)
Relative tensile (RT). The displacement directions of the two particles are aligned and parallel to the line connecting their centres; however, the magnitudes of the displacements differ.
(3)
Direct shear (DS). The directions of the two particles’ displacement are opposite and perpendicular to the line connecting their centres.
(4)
Relative shear (RS). The directions of the two particles’ displacement are uniform and perpendicular to the line connecting their centres, but with differing displacement magnitudes.
(5)
Mixed failure (MF). This mode of failure is characterised by the simultaneous presence of relative displacements in both the normal and tangential directions for the two particles.

4.3.2. Displacement Field Evolution and Crack Types

Figure 9 presents a displacement field cloud chart of sample “S-2” throughout its failure process, where the orientation of the displacement vectors is indicated by arrows, and the presence of cracks is denoted by short black lines. To facilitate a more nuanced understanding of the crack types, several magnified local views are included.
At point A, the root of the first rock step exhibits RT cracks, indicating that the initial failure is primarily influenced by tensile stress. Upon reaching the peak stress point, both DT and RT cracks are observed within the first step, while the cracks in the rock slab are predominantly DT in nature. This further confirms that the failure of the first rock step is largely driven by tensile stress. At point D, the crack propagation patterns in the second and third rock steps begin to deviate from those observed in the first rock step. Notably, the cracks initiating at the left root are of the mixed failure (MF) type, and those propagating to the right are of the relative tensile (RT) type. During this stage, shear stress starts to exert a more pronounced effect, particularly evident as direct shear (DS) cracks at the bottom of the second step. By point F, RS and MF cracks are observed in rock slab 3, signifying a transition to shearing as the dominant mode of failure. Similarly, the failure of the second rock step is primarily attributed to shear stress, with the cracks therein being predominantly of the RS and MF types. Upon the ultimate failure of the sample, the fourth rock step is characterised by the predominance of RS cracks, which are largely influenced by shear stress. Additionally, the third rock step and rock slab 5 exhibit the presence of both RS and mixed failure (MF) cracks. The interplay of these crack types within these regions indicates a complex interaction of tensile and shear stresses leading to the comprehensive failure of the rock mass.
In summary, the initiation and failure of the first rock step are predominantly influenced by tensile stress, resulting in tensile-type cracks. For the subsequent rock steps, failure occurs after the peak stress point. The lateral and vertical movement of the particles gradually increases, leading to the progressive enhancement of the shear stress influence. As the deformation continues to accumulate, the sample transitions to a state where shear stress becomes the predominant factor in the failure mechanism.

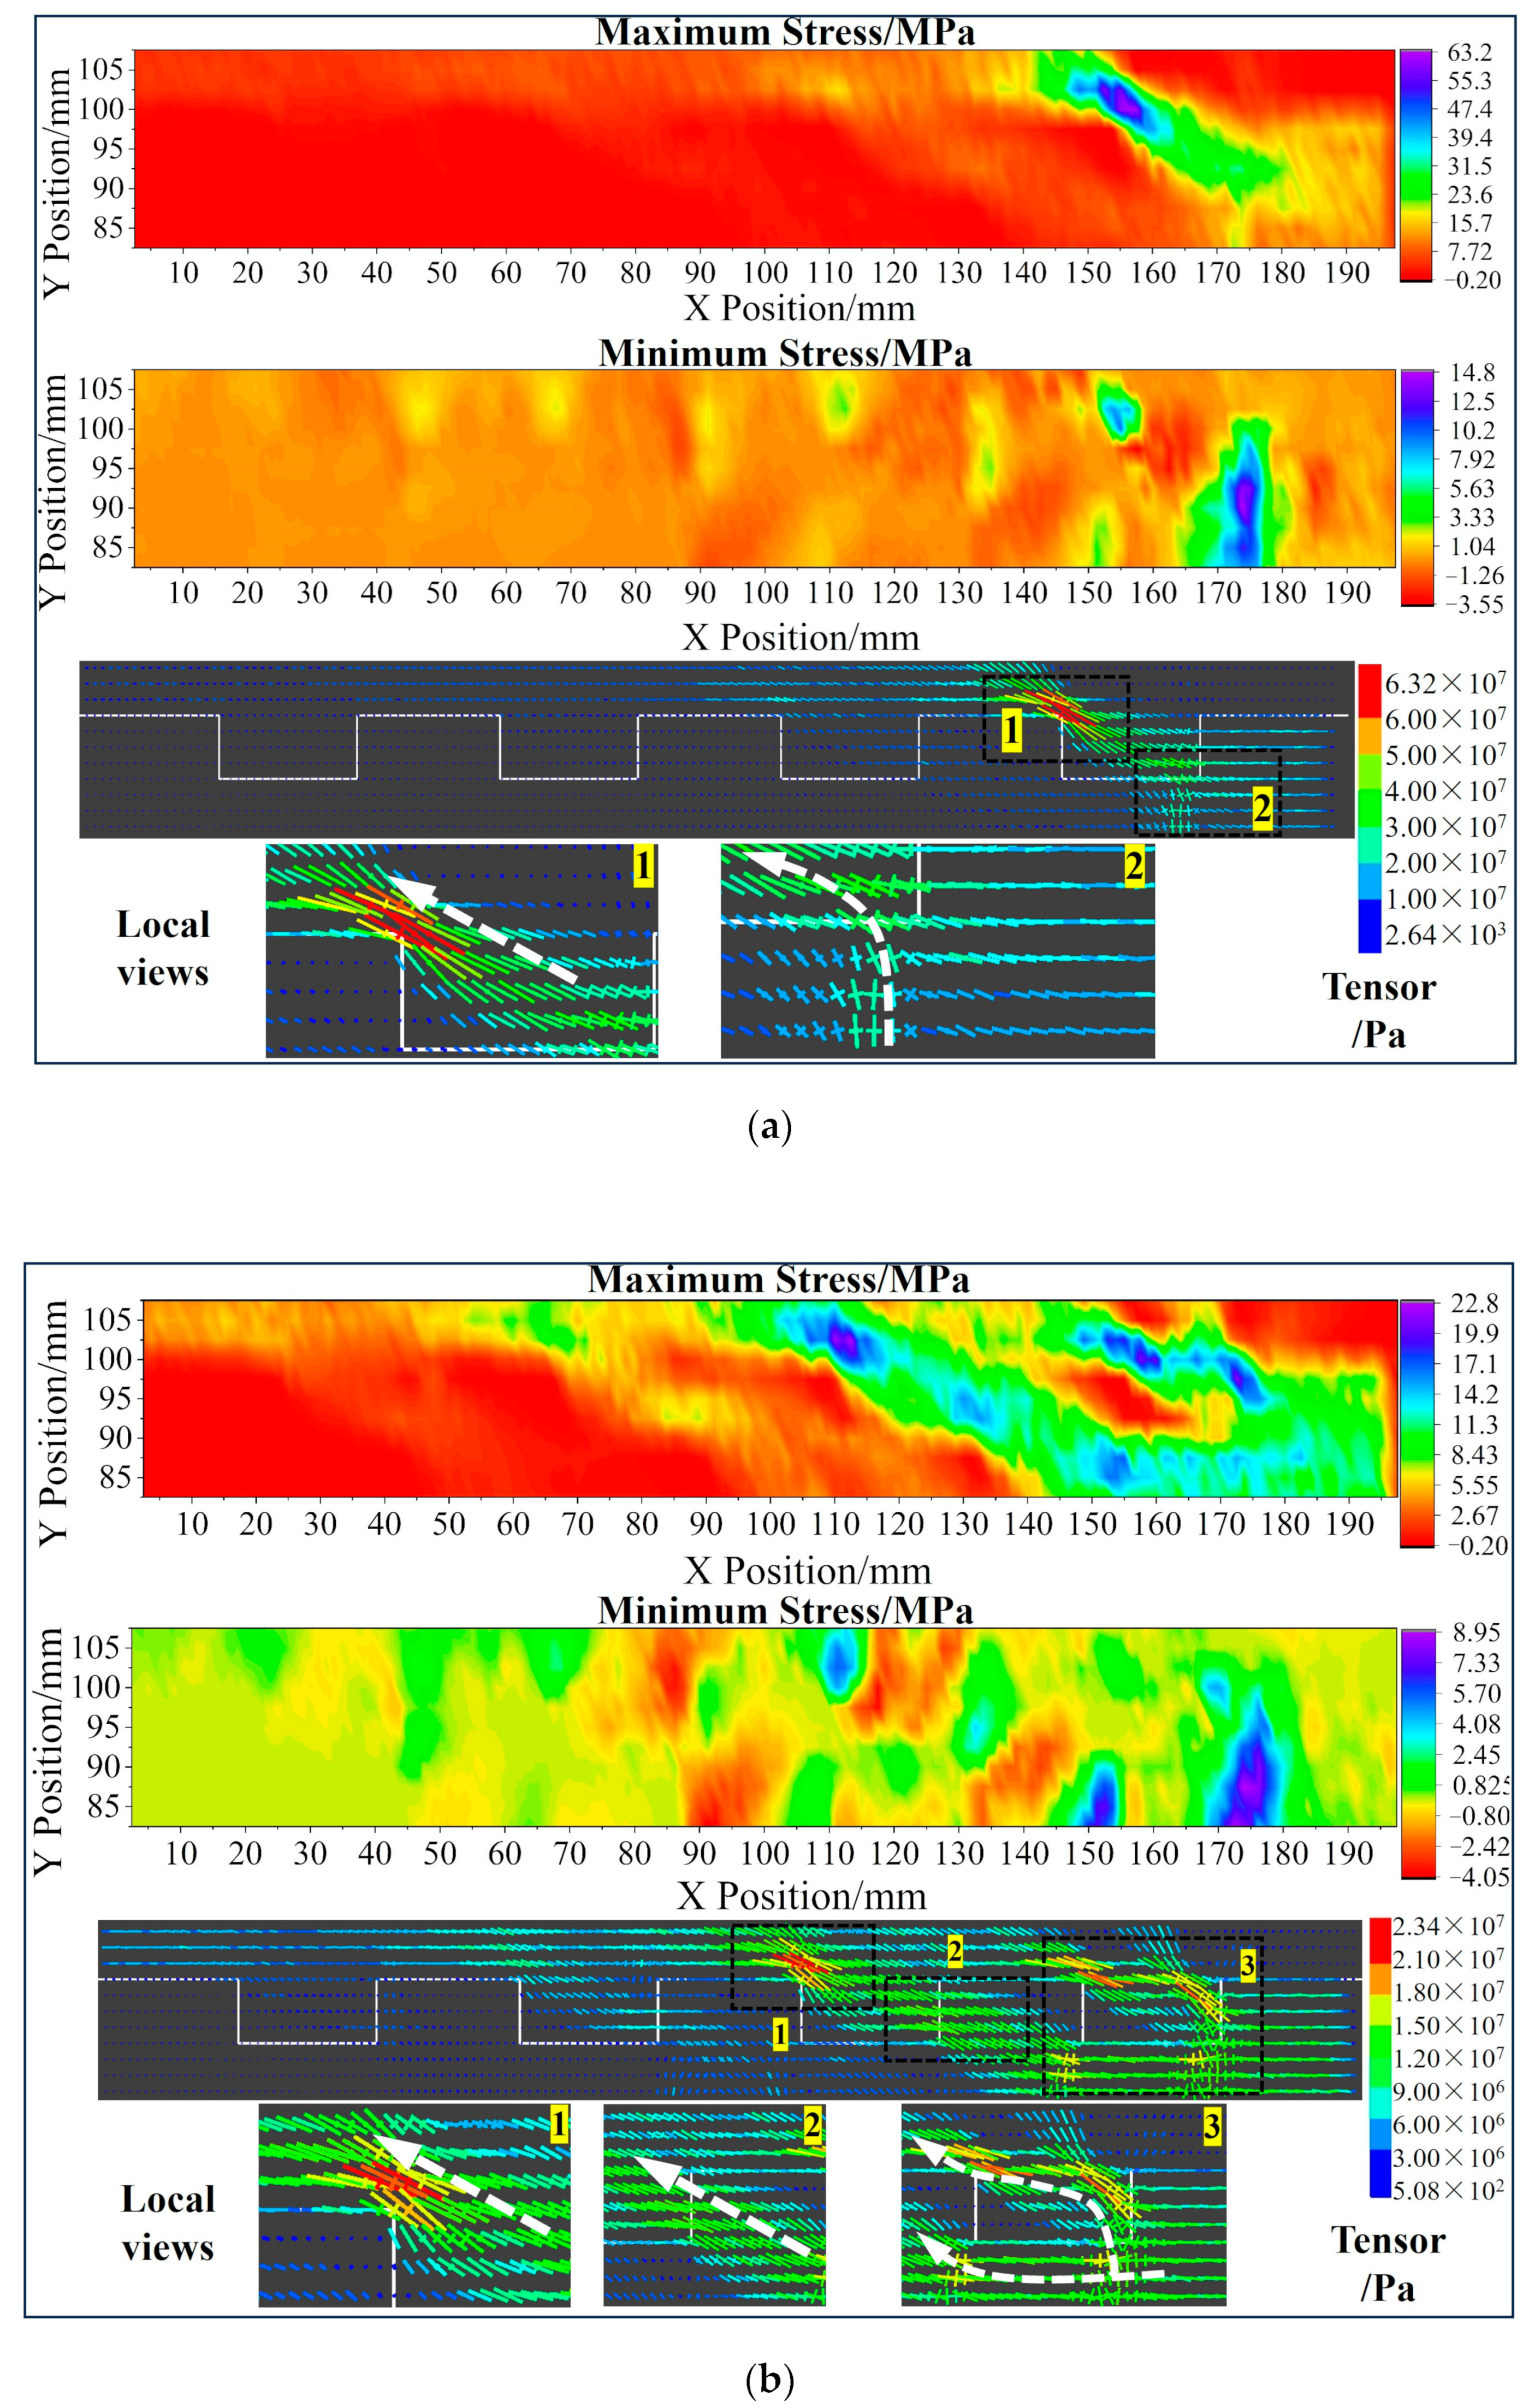
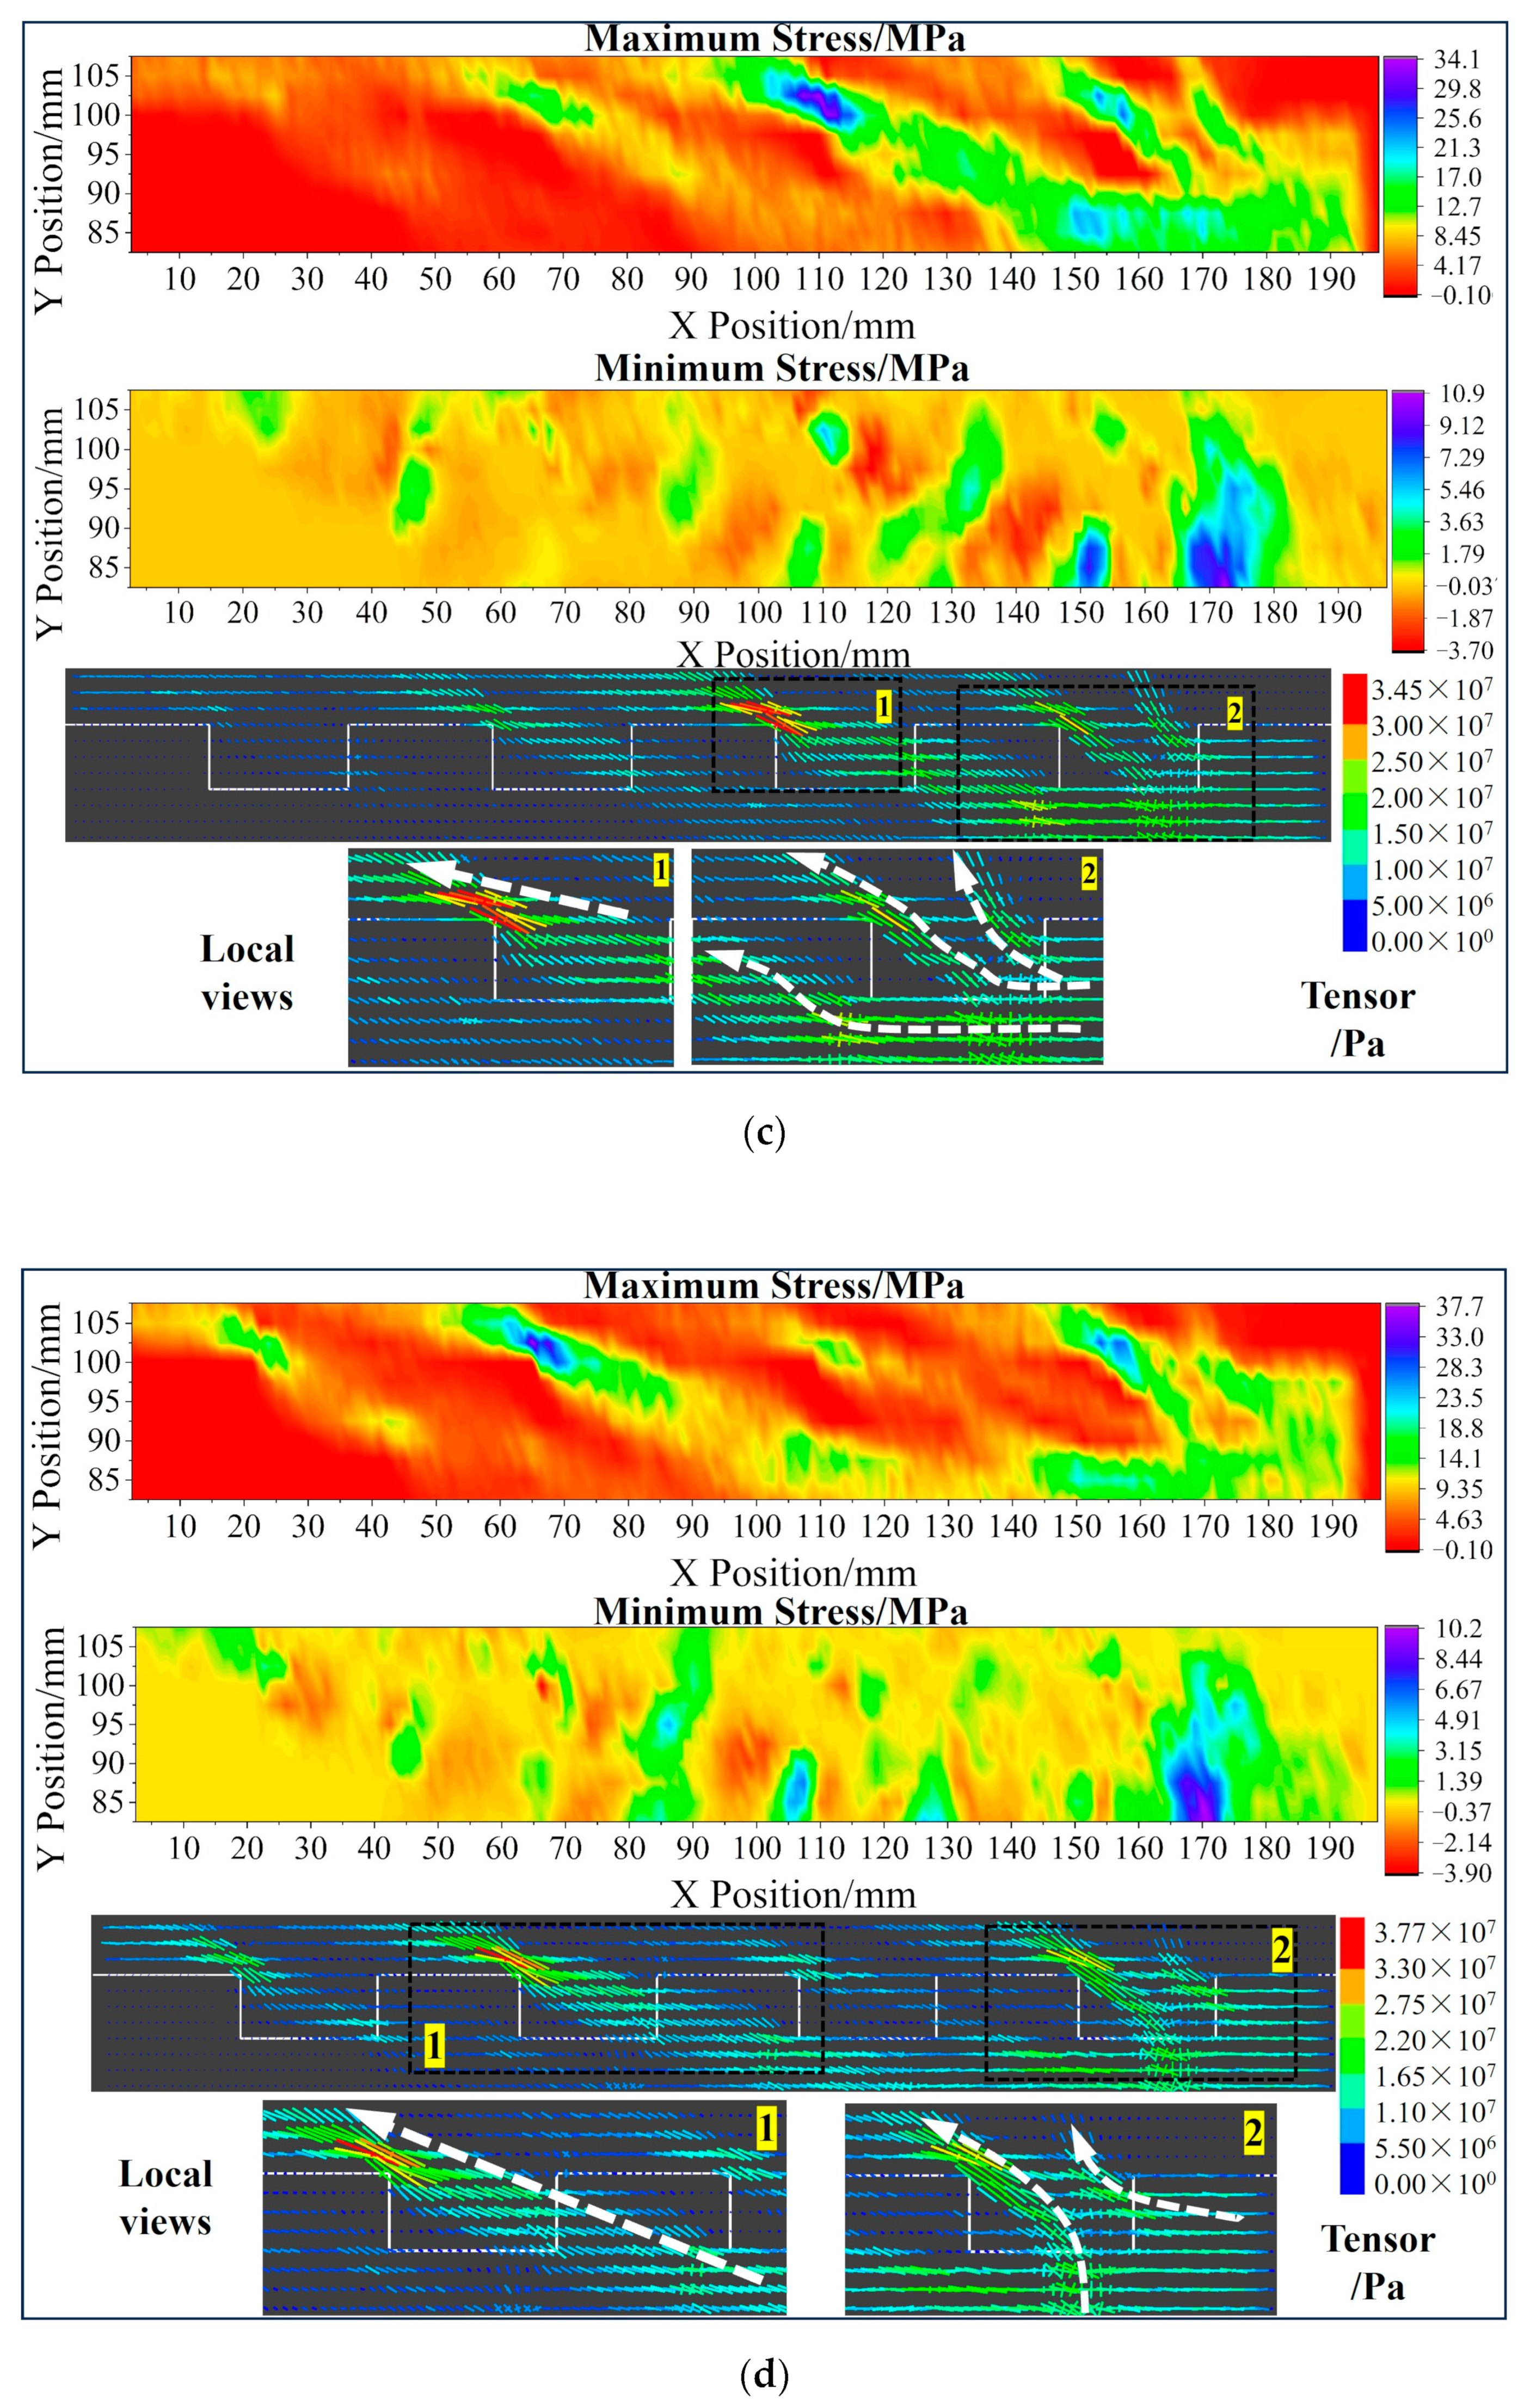
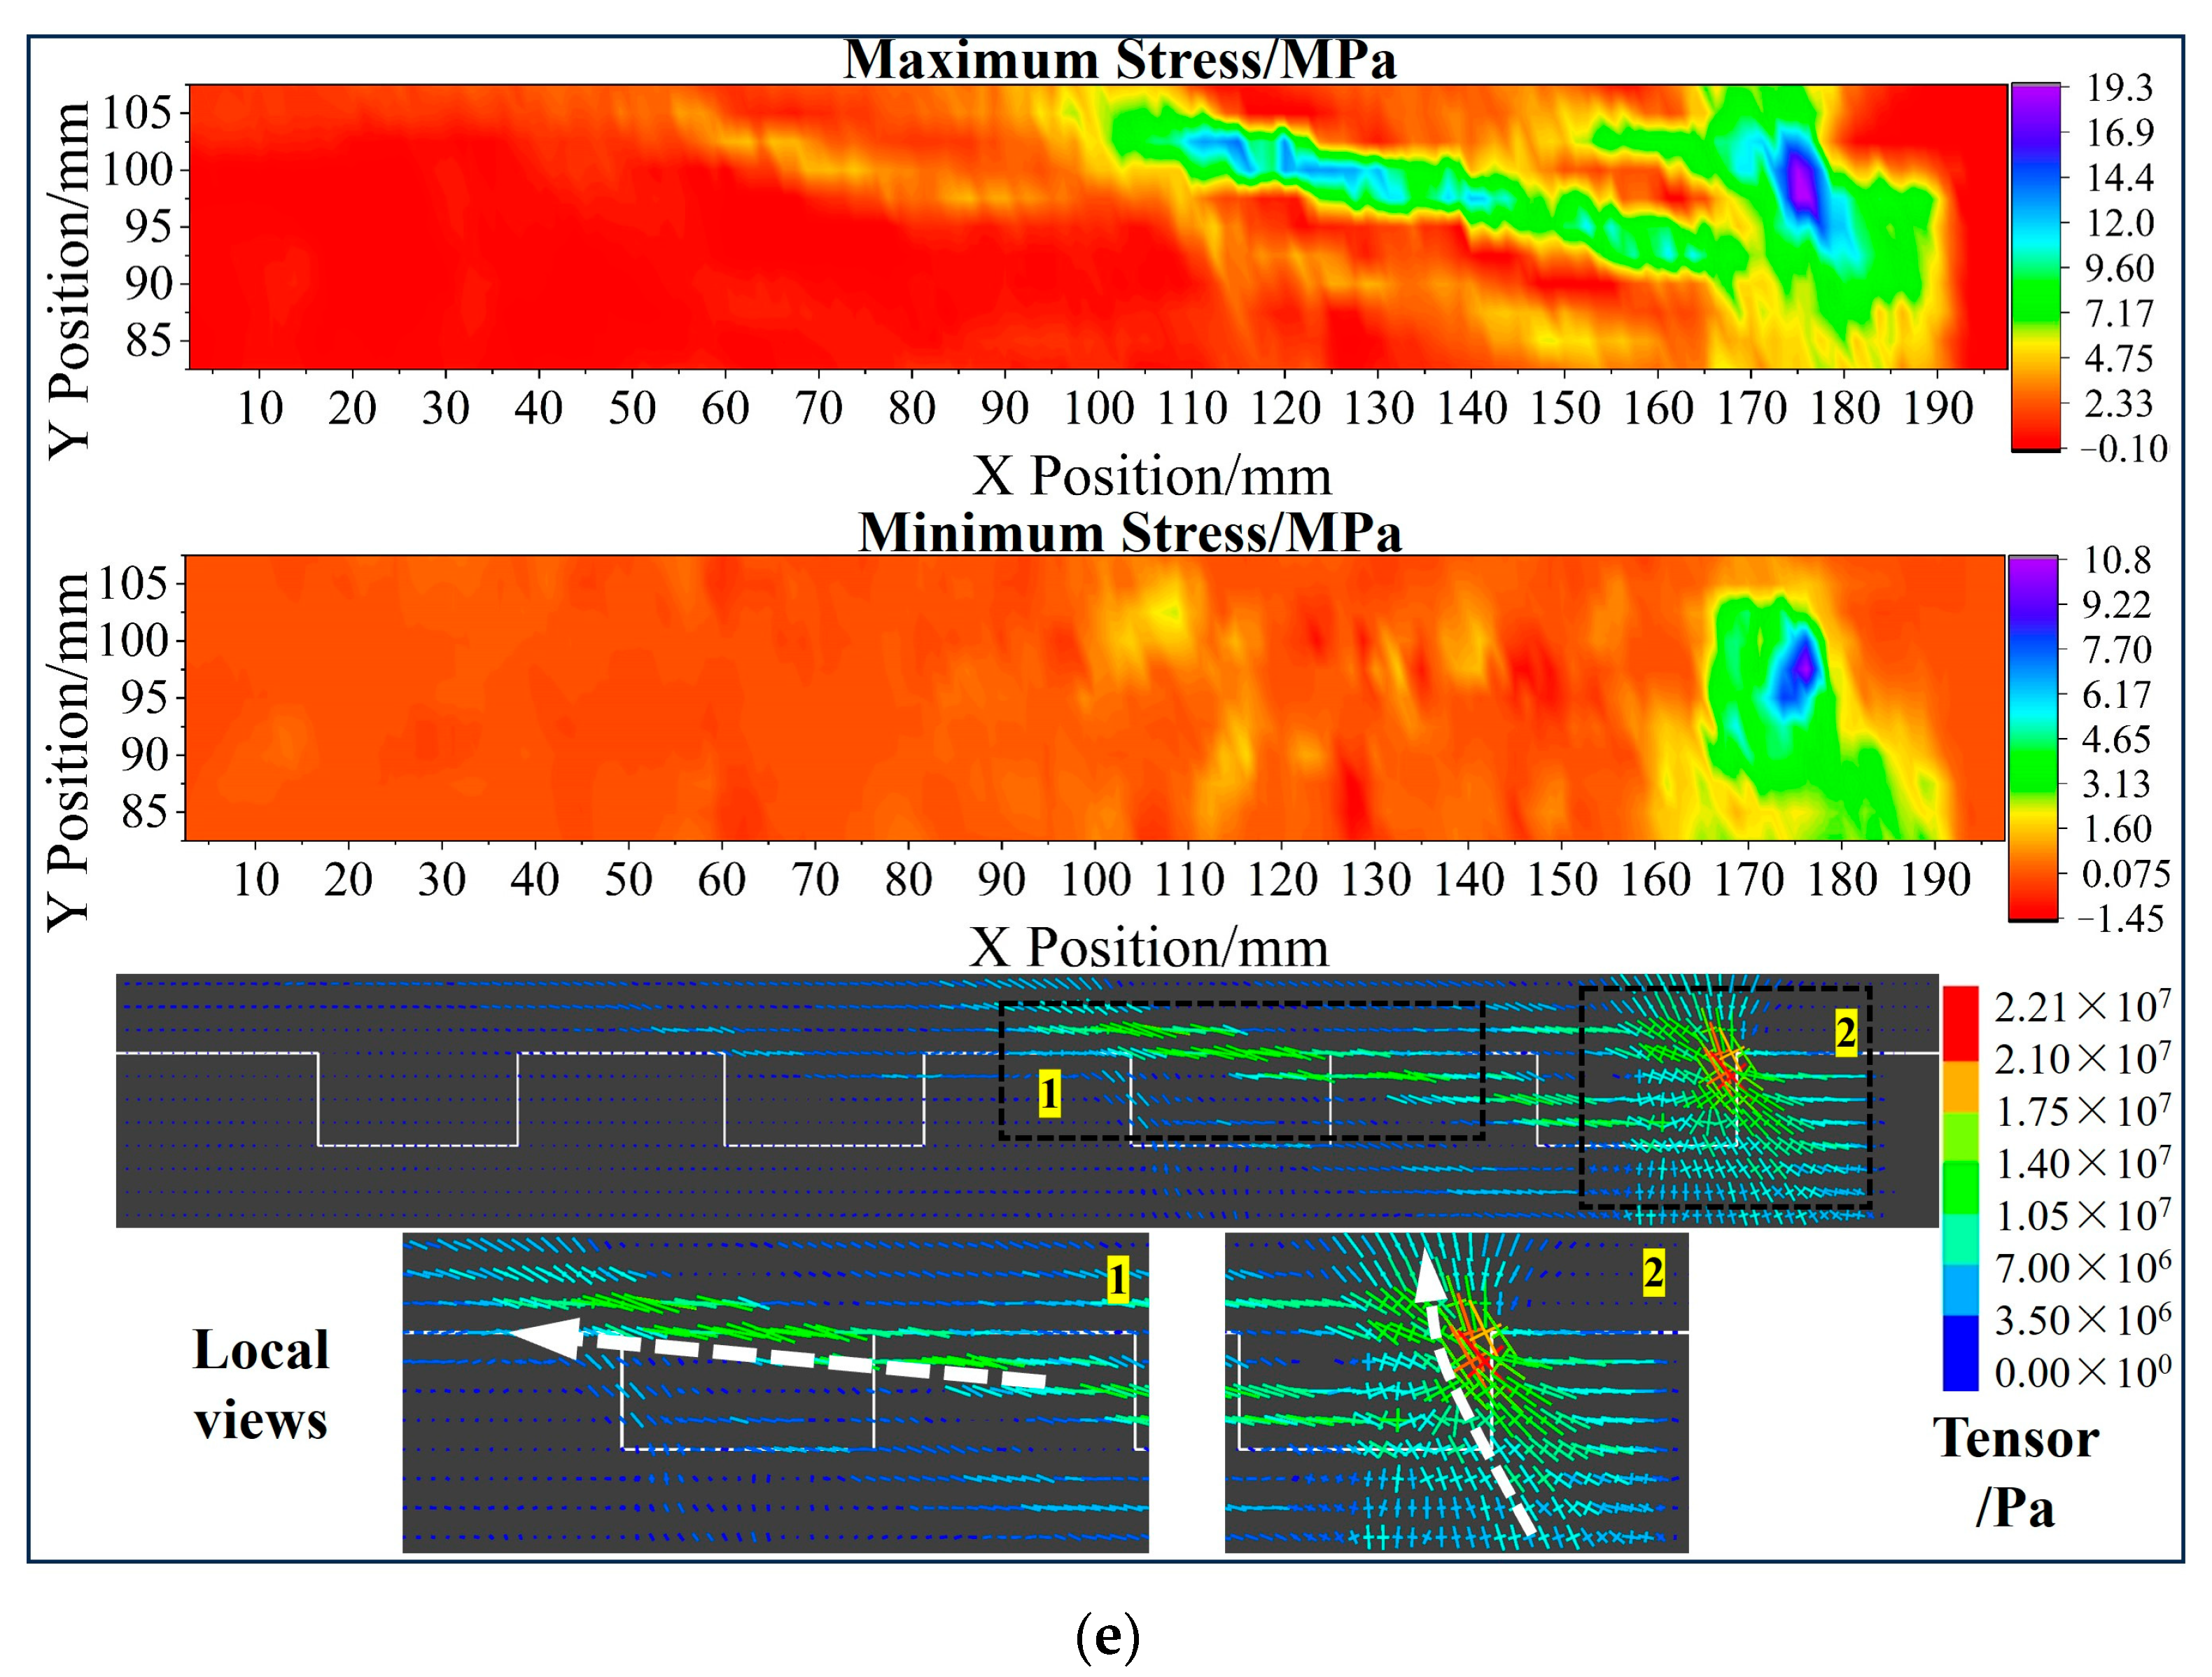
4.4. Stress Evolution and Failure Mechanism

The visualisation of the stress field is an invaluable technique for observing the failure process and analysing crack behaviour [57]. Principal stress axes serve as an effective tool for depicting the state of stress and the orientation of the principal stress directions, which can greatly aid in the analysis of failure mechanisms [58,59]. To capture the stress field within the sample, a total of 1727 measurement circles were arranged, as depicted in Figure 10. These measurement circles were designed with an overlap to ensure the acquisition of more detailed and comprehensive stress data. The horizontal, vertical, and shear stress values monitored by these measurement circles were extracted and utilised to calculate the maximum and minimum principal stresses. Furthermore, the “Tensor” tool within the PFC software was employed to plot the principal stress axes, which were drawn by importing the stress values. As presented in Figure 11, the long line at the stress cross in the figure signifies the direction of the maximum principal stress, while the short line indicates the direction of the minimum principal stress. Compressive stress is shown as positive and tensile stress as negative in the colour representation of the stress values. For an in-depth examination, five different states of sample “S-2” were chosen in order to obtain better knowledge of the failure process.
Point B (Figure 11a): The maximum value of the maximum principal stress is observed at the left root of the first step. In this step, the minimum principal stress is nearly zero, and the direction of the maximum principal stress deflects counterclockwise by approximately 60 degrees (noting that the maximum principal stress direction is vertical during the servo stage). The first step is in a point-load stress state, which could lead to splitting failure. Because of its biaxial compression, the rock slab is the primary vertical load-bearing element.
Point C (Figure 11b): Following the attainment of bearing capacity limitations, splitting cracks appear in the first step (refer to Figure 7). The propagation path of these cracks aligns with the direction of the maximum principal stress identified at Point B. A pronounced concentration of the maximum principal stress is evident on both sides of the first step root and the left root of the second step. The horizontal direction in rock slab 2, the leftward deflection direction in rock slab 3, and the counterclockwise deflection in the second rock step make up a whole maximum primary stress transmission path.
Point D (Figure 11c): The direction of the maximum principal stress in the first rock step gradually deflects towards the vertical direction. This indicates that the first rock step has lost its bearing capacity, which is also evident from the significant stress concentration at the left root of the second rock step. The two sides of rock slab 2 continue to bear the majority of the minimal principal stress. At the interface of rock slab 3 and the second rock step, there is slight tensile stress.
Point F (Figure 11d): As the shear displacement increases, the particles in the first rock step are compressed. The stress concentration in the first rock step reemerges due to particle re-contact. The left root of the third rock step becomes the primary location of the stress concentration. The fracturing of the lower rock slabs results in the disrupted continuity of the stress distribution.
Point H (Figure 11e): After all rock steps have failed, the maximum principal stress in the first rock step deflects to a near-vertical direction, making it the main location to bear normal stress at the residual stage. The direction of the maximum principal stress in the second rock step and rock slab 3 is near horizontal, with the minimum principal stress being almost zero, indicating that this area is the origin of residual shear stress.
Based on the analysis of crack development and stress evolution throughout the failure process of the sample, the following failure mechanism can be summarised. The failure of the first rock step occurs before the peak, and the crack initiation is mainly driven by the tensile stress. A point-load stress state is experienced by the initial rock step, which frequently leads to splitting failure. The interlocking characteristics of the rock steps allow the initially fractured step to continue bearing a portion of the shear force. The stress distribution among the remaining rock steps is then changed by this initial collapse, putting them in a complicated compressive–tensile stress condition. The rock steps’ mode of failure shifts to a combination of shear and tensile processes in the post-peak stage as displacement grows and the impact of shear friction becomes more noticeable.

5. Discussion

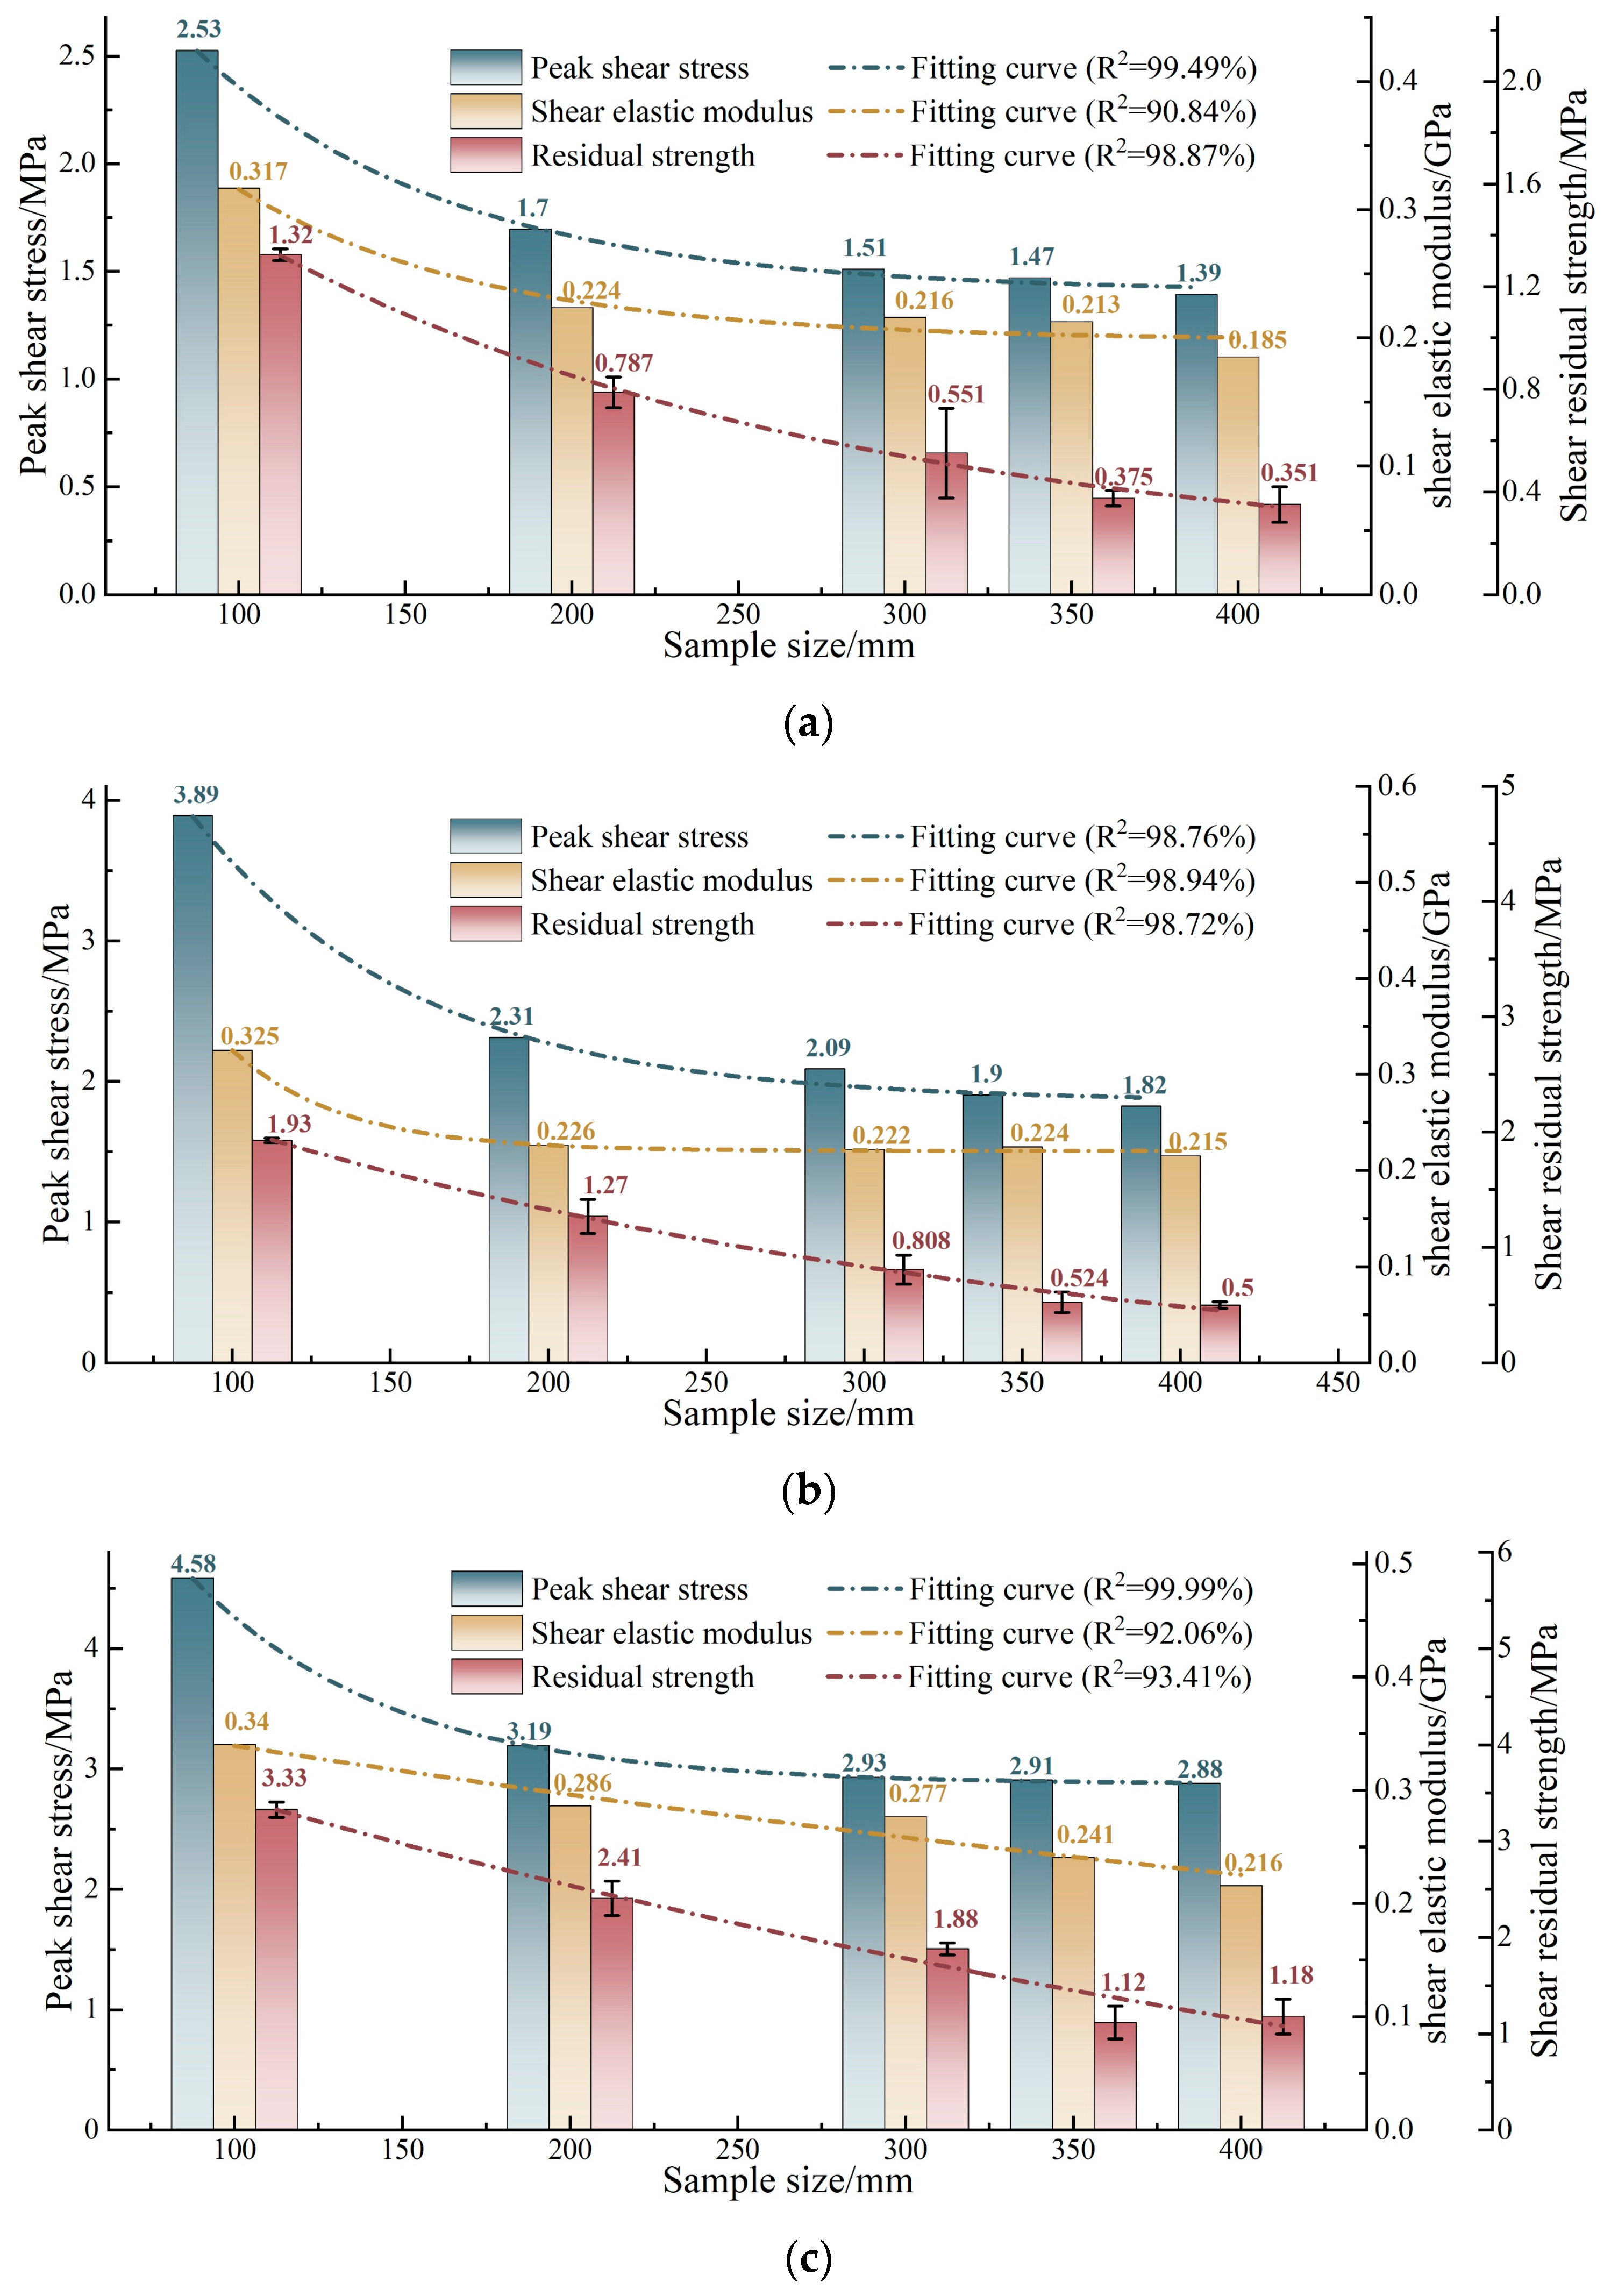
5.1. Effect of Model Size on Shear Characteristics

Figure 12 shows the failure modes and the associated shear stress–shear displacement curves for the sample group “SS”. With the increase in the sample size, the post-peak plasticity becomes more obvious in the curves. In particular, strain softening behaviour is apparent in the curves when the sample size surpasses 200 mm, and it is difficult for the stress values to rebound after the peak stress point (as demonstrated in the 200 mm sample). This is primarily attributed to the diminishing interlocking of particles as the sample size expands. Larger sample sizes lead to both an increase in the quantity of cracks generated during the shear process and an improvement in the degree of crack propagation. Under a normal stress of 1 MPa, large-sized samples exhibit a failure pattern similar to that of smaller-sized samples, with shear dilatancy being a common phenomenon. However, under higher normal stresses of 2 MPa and 4 MPa, the occurrence of shear dilatancy is less frequent in the failure of large-sized samples. Rather, there is more damage near the interface, especially to the steps and rock slabs.
The shear mechanical parameters of samples varying in size under different stress conditions were calculated, with the results presented in Figure 13. Residual strength is a value that falls within a specified interval because, during the residual stage, the curves show oscillations within a set range. To determine this range value, the residual strength is calculated as the average of the maximum and minimum values within the fluctuation range, with the standard deviation used to construct the error bars for graphical representation. As can be seen in Figure 13, a distinct size effect is observable in the variation of the three shear parameters (peak shear strength, shear elastic modulus, and residual strength) as the sample size increases. When the model size expands from 100 mm to 200 mm, there is a significant decrease in the values of all three shear parameters. However, as the sample size increases from 200 mm to 400 mm, the rate of decrease for these shear parameters begins to slow down, indicating a less pronounced attenuation. This change in the shear parameters can be characterised by a negative exponential function. To describe the variation law of the shear mechanical parameters with sample size more clearly, fitting functions were employed, which are listed in Equations (1)–(3).
1   MPa τ p = 4.128 e x p ( d / 76.639 ) + 1.405 E s h e a r = 0.449 e x p ( d / 74.657 ) + 0.198 τ r = 2.114 e x p ( d / 175.356 ) + 0.126
2   MPa τ p = 8.331 e x p ( d / 70.807 ) + 1.857 E s h e a r = 1.829 e x p ( d / 34.974 ) + 0.220 τ r = 3.197 e x p ( d / 273.597 ) 0.286
4   MPa τ p = 9.213 e x p ( d / 59.403 ) + 2.874 E s h e a r = 0.389 e x p ( d / 729.927 ) τ r = 6.377 e x p ( d / 544.967 ) 1.981
Here, τp, Eshear, τr, and d are the shear peak strength (MPa), shear elastic modulus (GPa), residual strength (MPa), and sample size (mm), respectively.
As the sample size exceeds 350 mm, the variation in the shear parameter values becomes minor with further increases in sample size. Consequently, for the band–bedrock interface under investigation in this study, under the given stress conditions and step height-to-width ratio, the representative elementary volume (REV) for the shear parameters is determined as a sample with a geometry size of 350 mm.

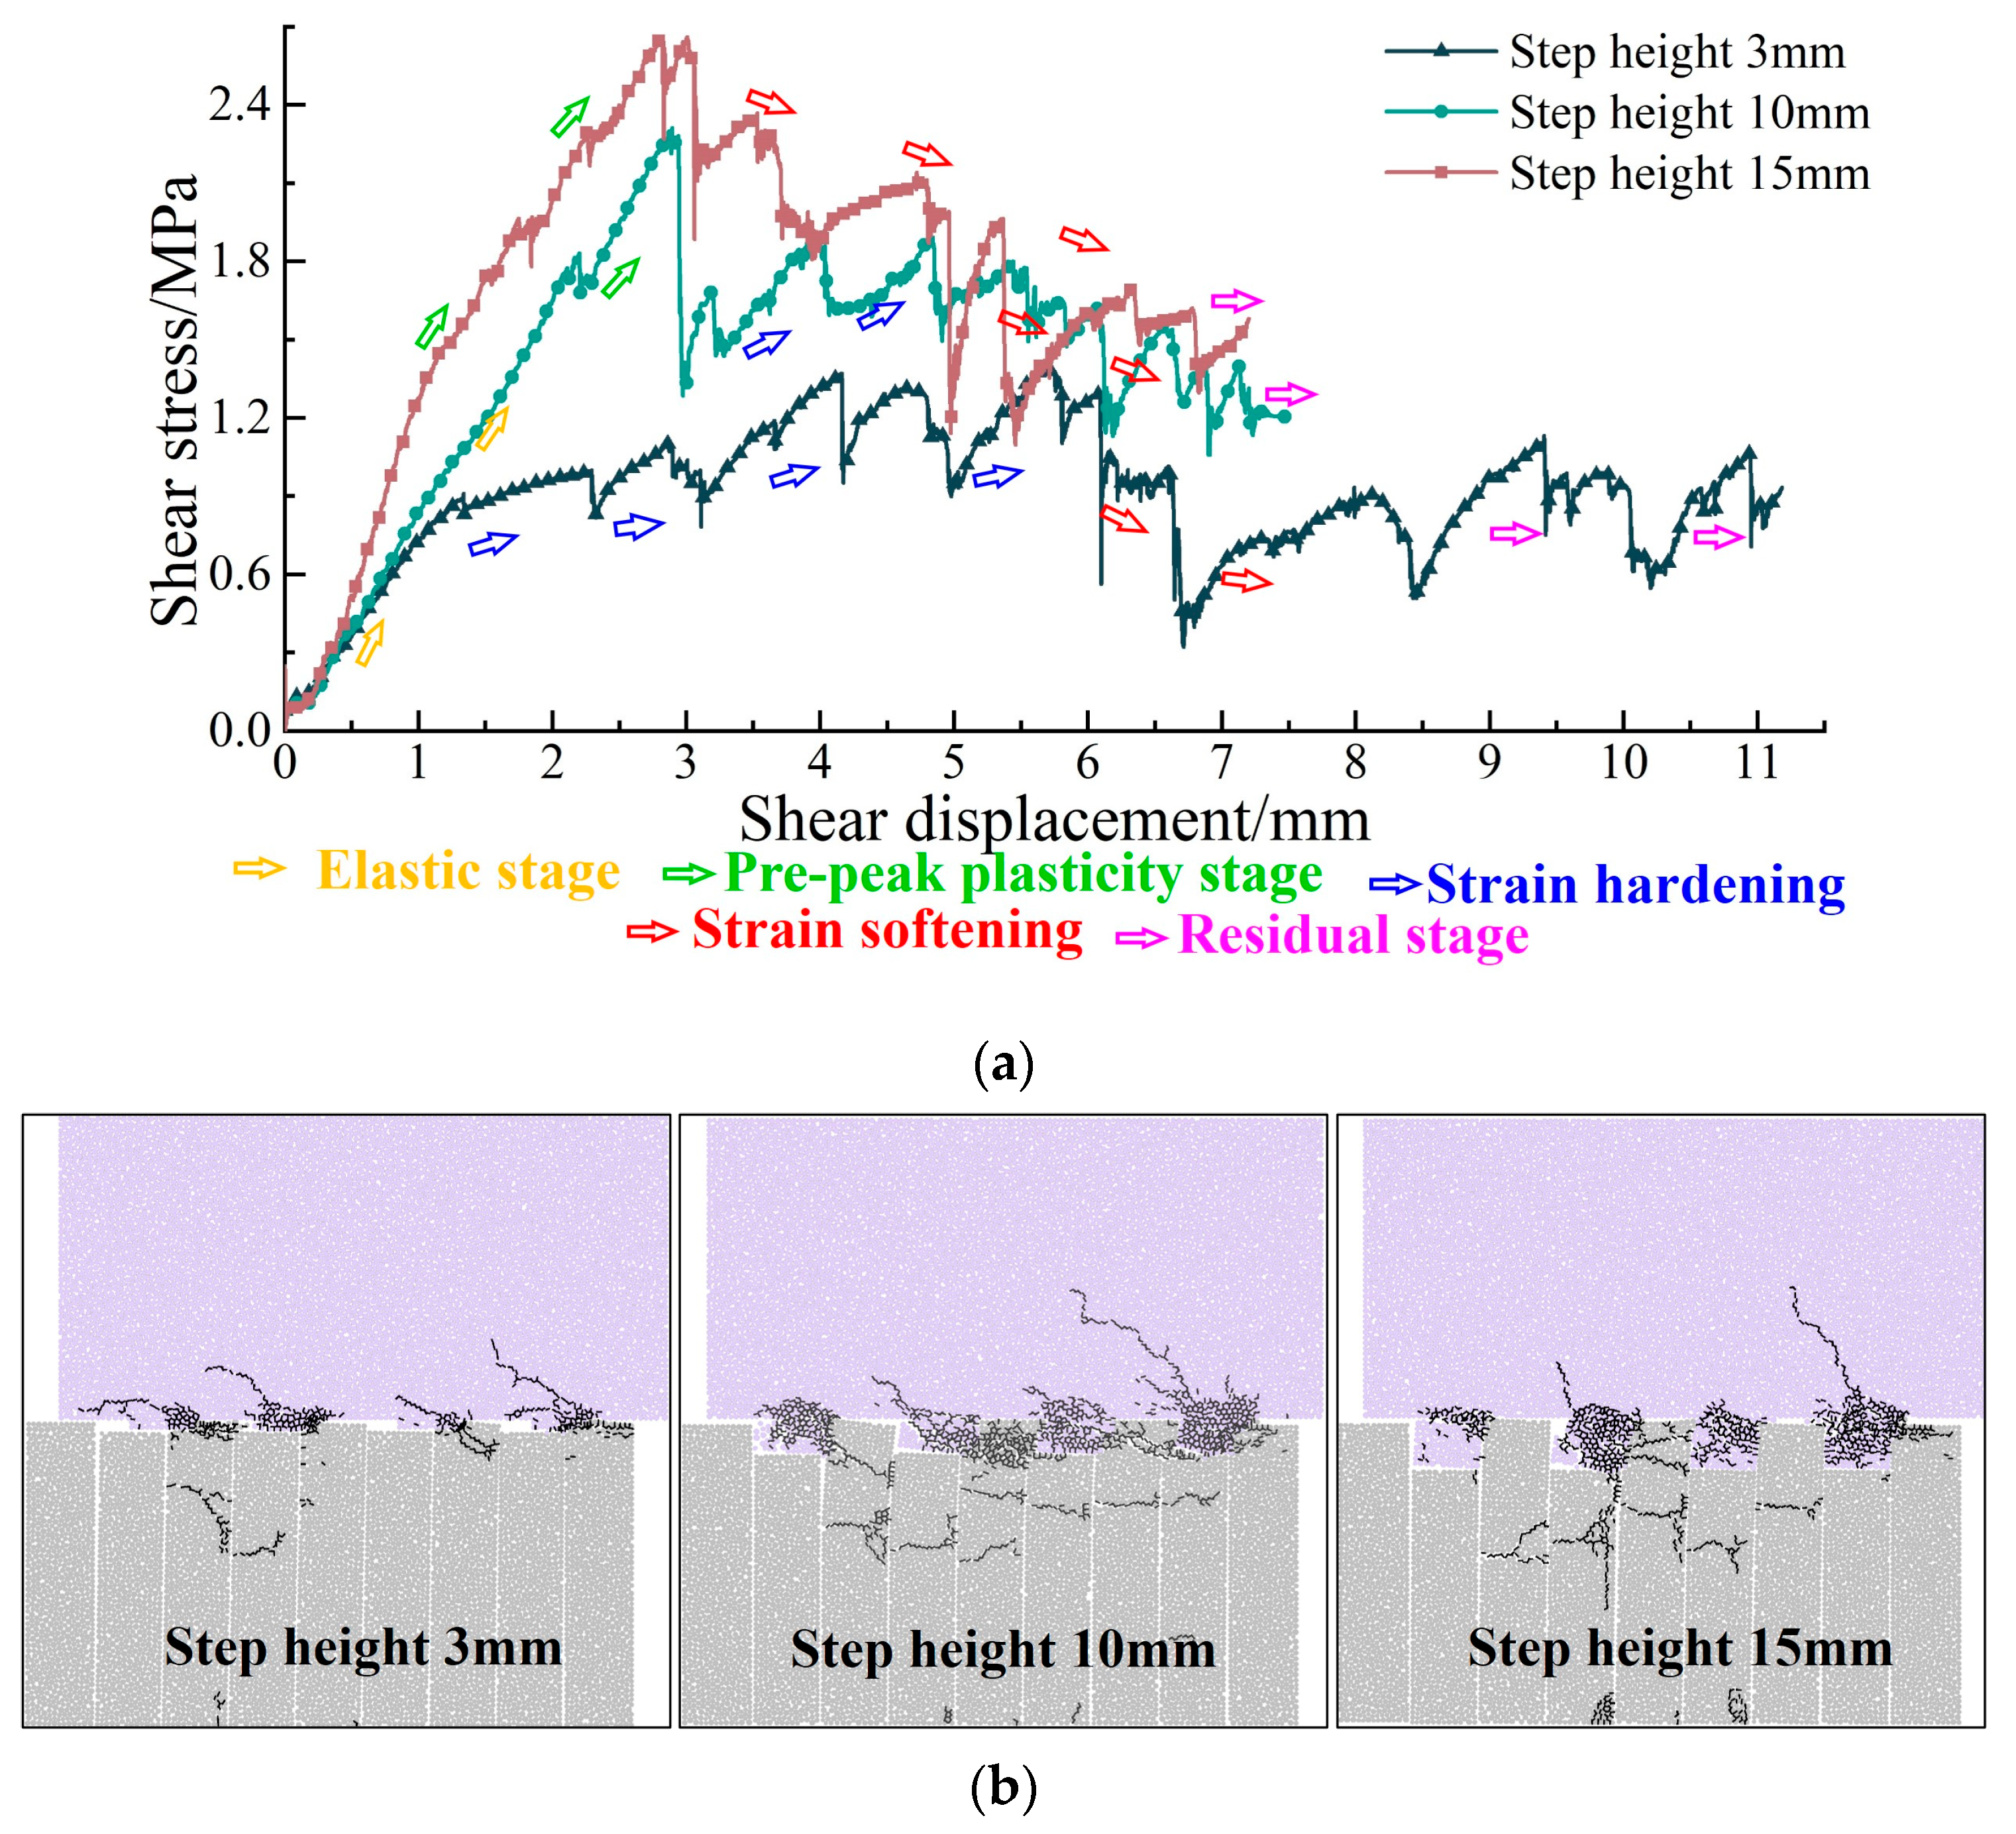
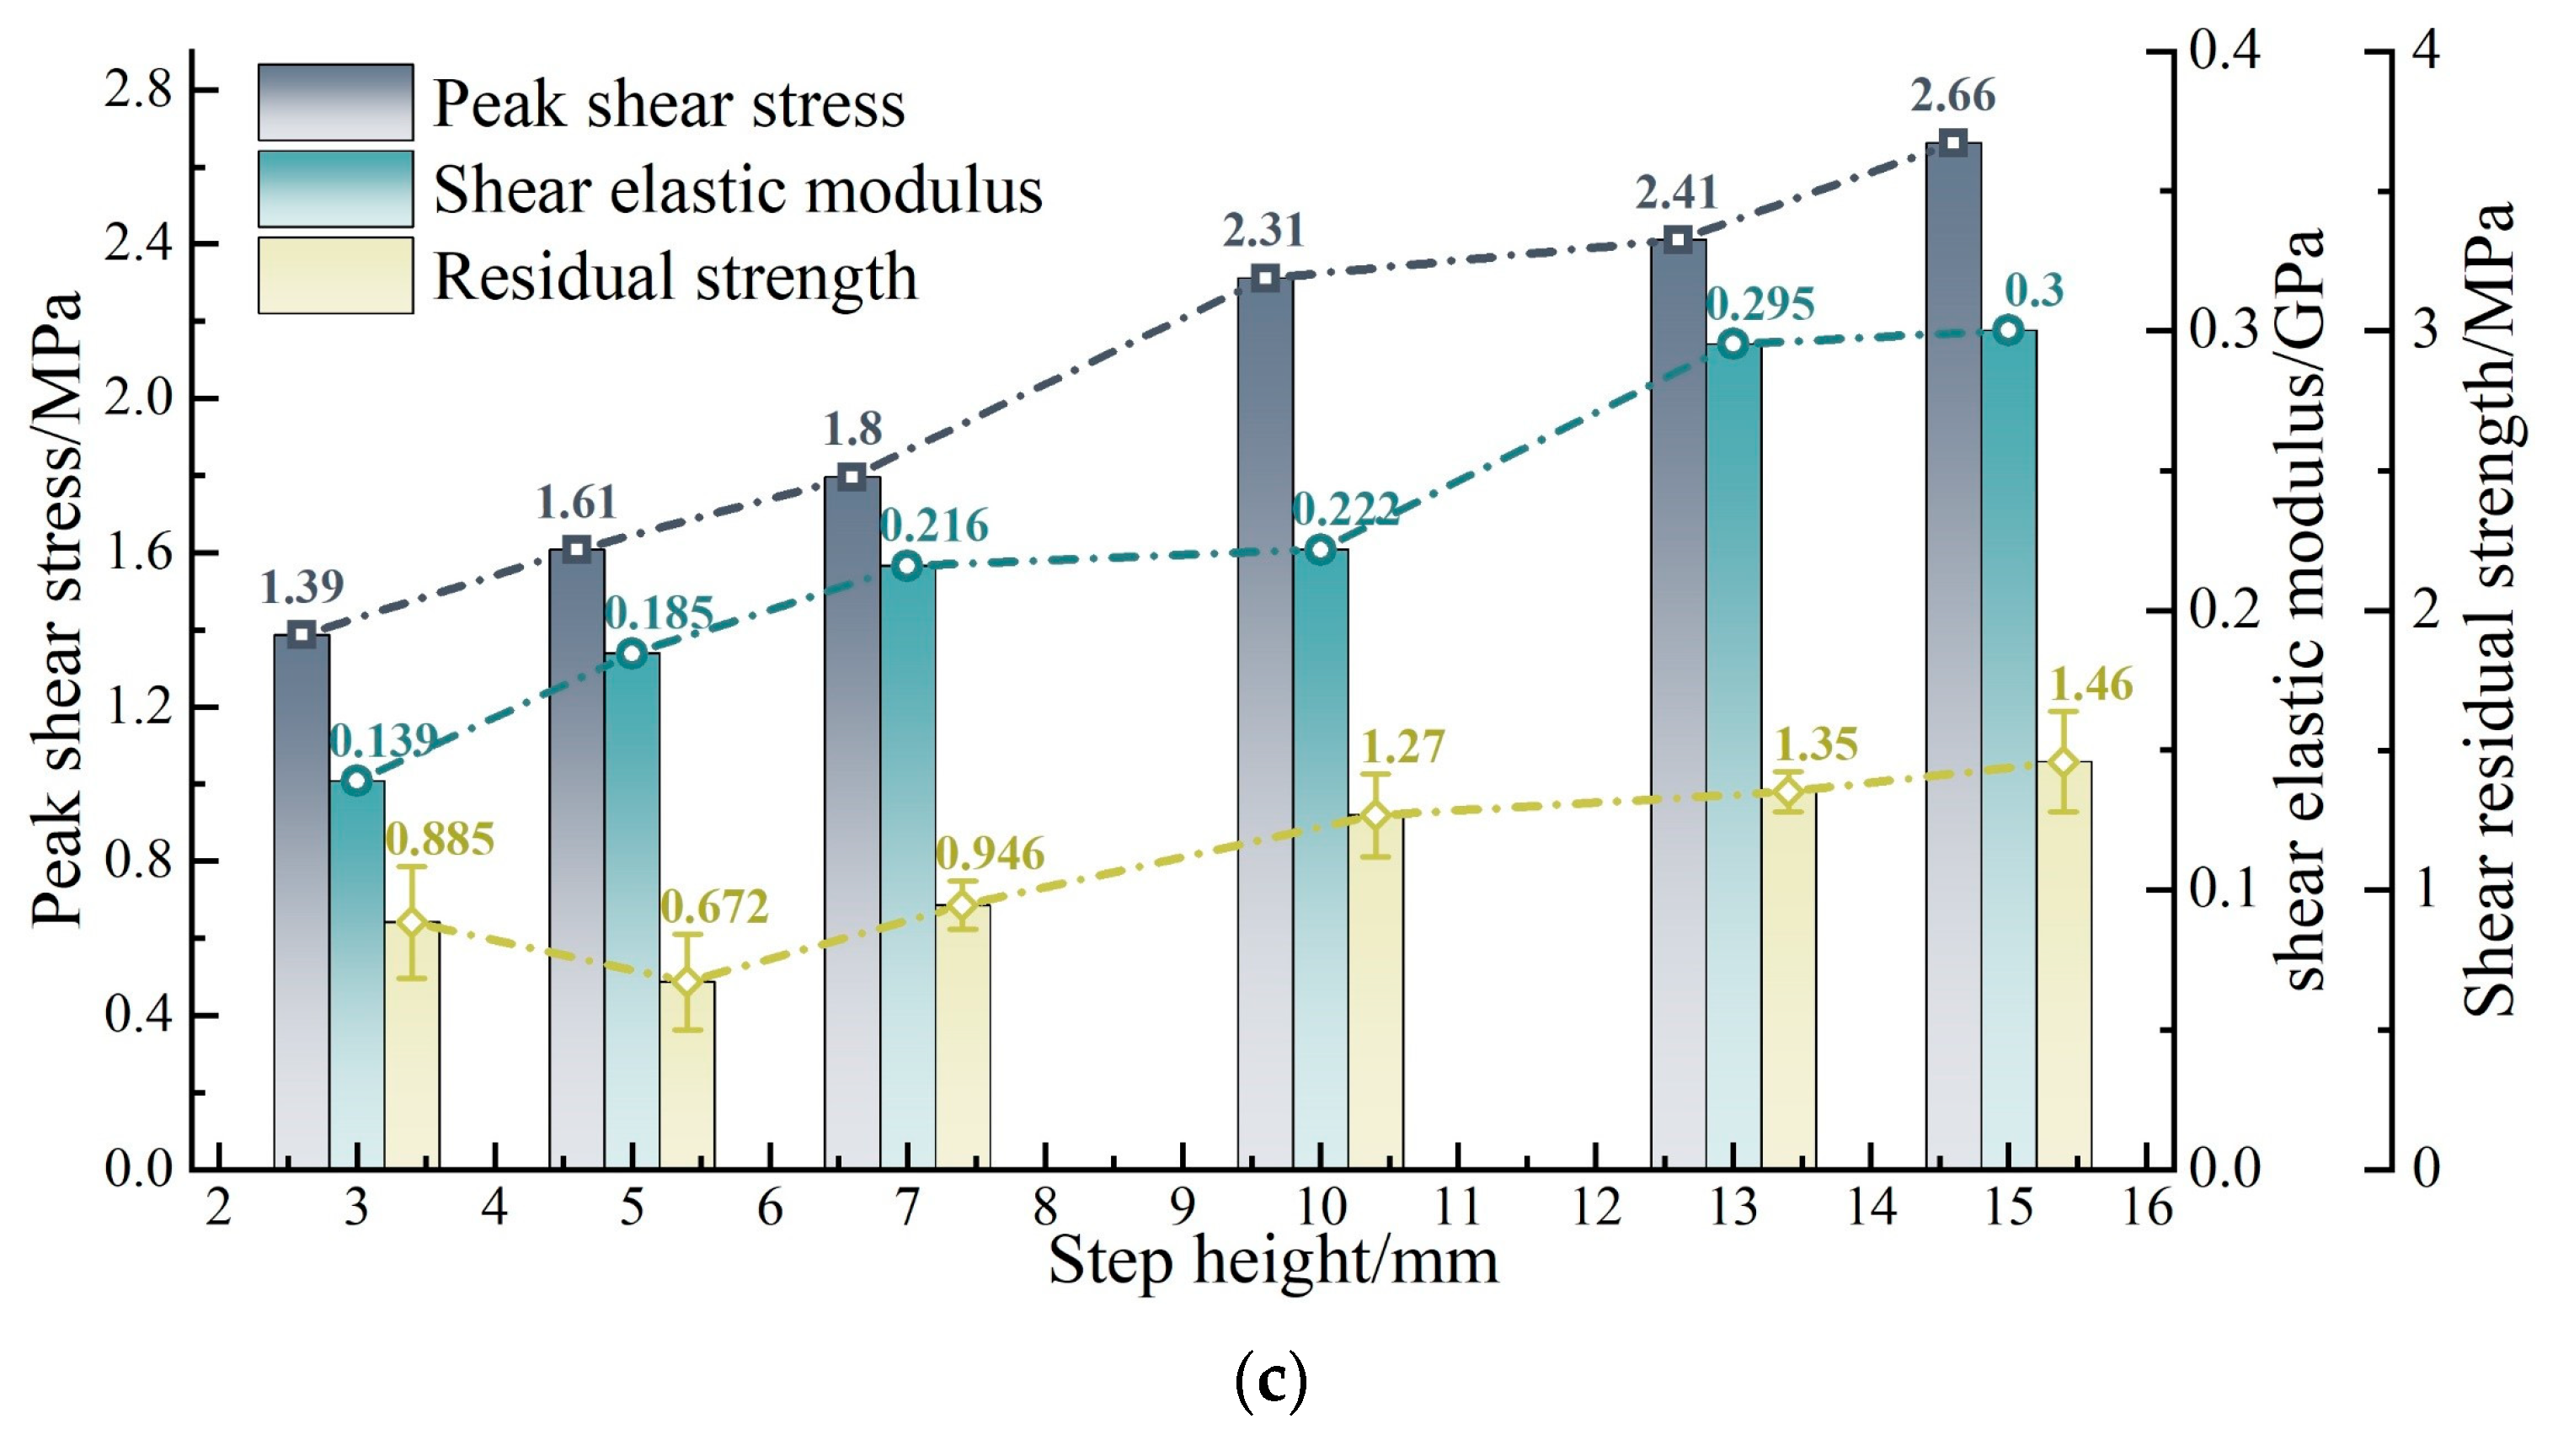
5.2. Effect of Rock Step Height on Shear Characteristics

Figure 14 illustrates the effect of rock step height on the shear characteristics of samples with a size of 200 mm, summarising three typical shear stress curves (Figure 14a) and failure modes (Figure 14b). When the rock step height is small, the stress curve transitions from strain hardening to strain softening following the elastic stage. The characteristics of the curves and failure modes for moderate rock step height were discussed in Section 4 and are not reiterated here. With large rock step height, a plastic stage emerges prior to the peak, and the strain softening stage occurs immediately after the peak.
During the shear process of the samples with a small rock step height, the degree of stress concentration is high due to the limited contact area. After failure, the reduction in the contact area exacerbates the stress concentration, which is the primary cause of strain hardening. Once the steps have broken to a certain extent, shear resistance is primarily provided by particle friction, leading to shear contraction within the sample and resulting in strain softening. Conversely, when the rock step height is large, the increased contact area mitigates the degree of stress concentration, making the shear behaviour of the specimen more prone to plastic deformation. Shear dilation is less noticeable near the beginning of the steps, where failure usually starts. It is evident that the rock step height regulates the failure mode and the characteristics of the stress curve by influencing the level of stress concentration and the degree of shear dilation.
The variation in shear mechanical parameters influenced by rock step height is depicted in Figure 14c. Both the peak shear strength and shear elastic modulus incrementally rise with increasing rock step height. At a step height of 3 mm, the values of these parameters are 1.39 MPa and 0.139 GPa, respectively. At a rock step height of 15 mm, they escalate to 2.66 MPa and 0.30 GPa, with amplifications of 91.37% and 115.83%, respectively. The residual strength initially declines from 0.885 MPa (at a rock step height of 3 mm) to 0.672 MPa (at a rock step height of 5 mm) and then gradually ascends to 1.46 MPa (at a step height of 15 mm), with amplitude reductions and amplifications of 23.73% and 116.94%, respectively.

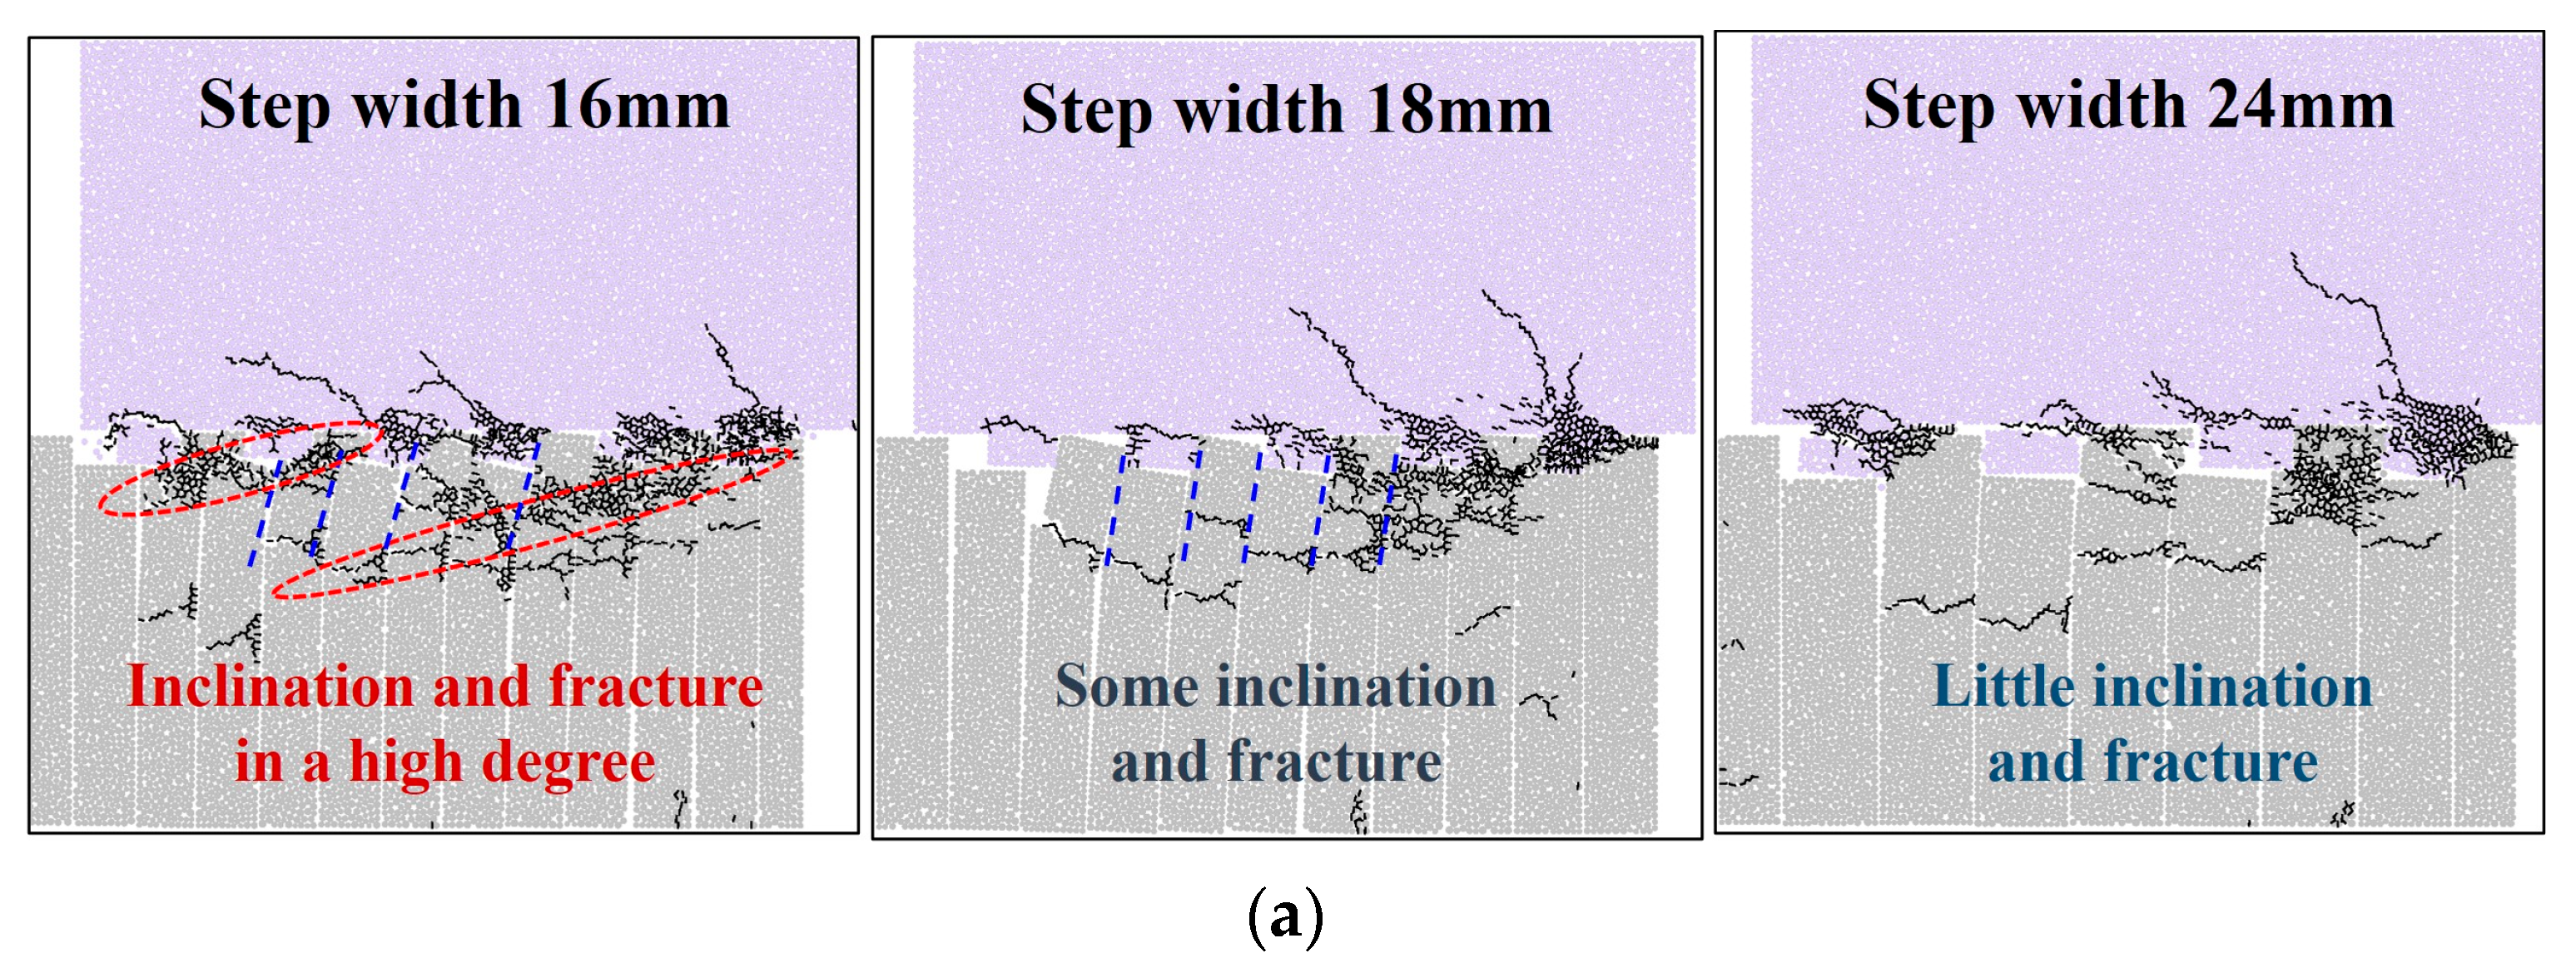
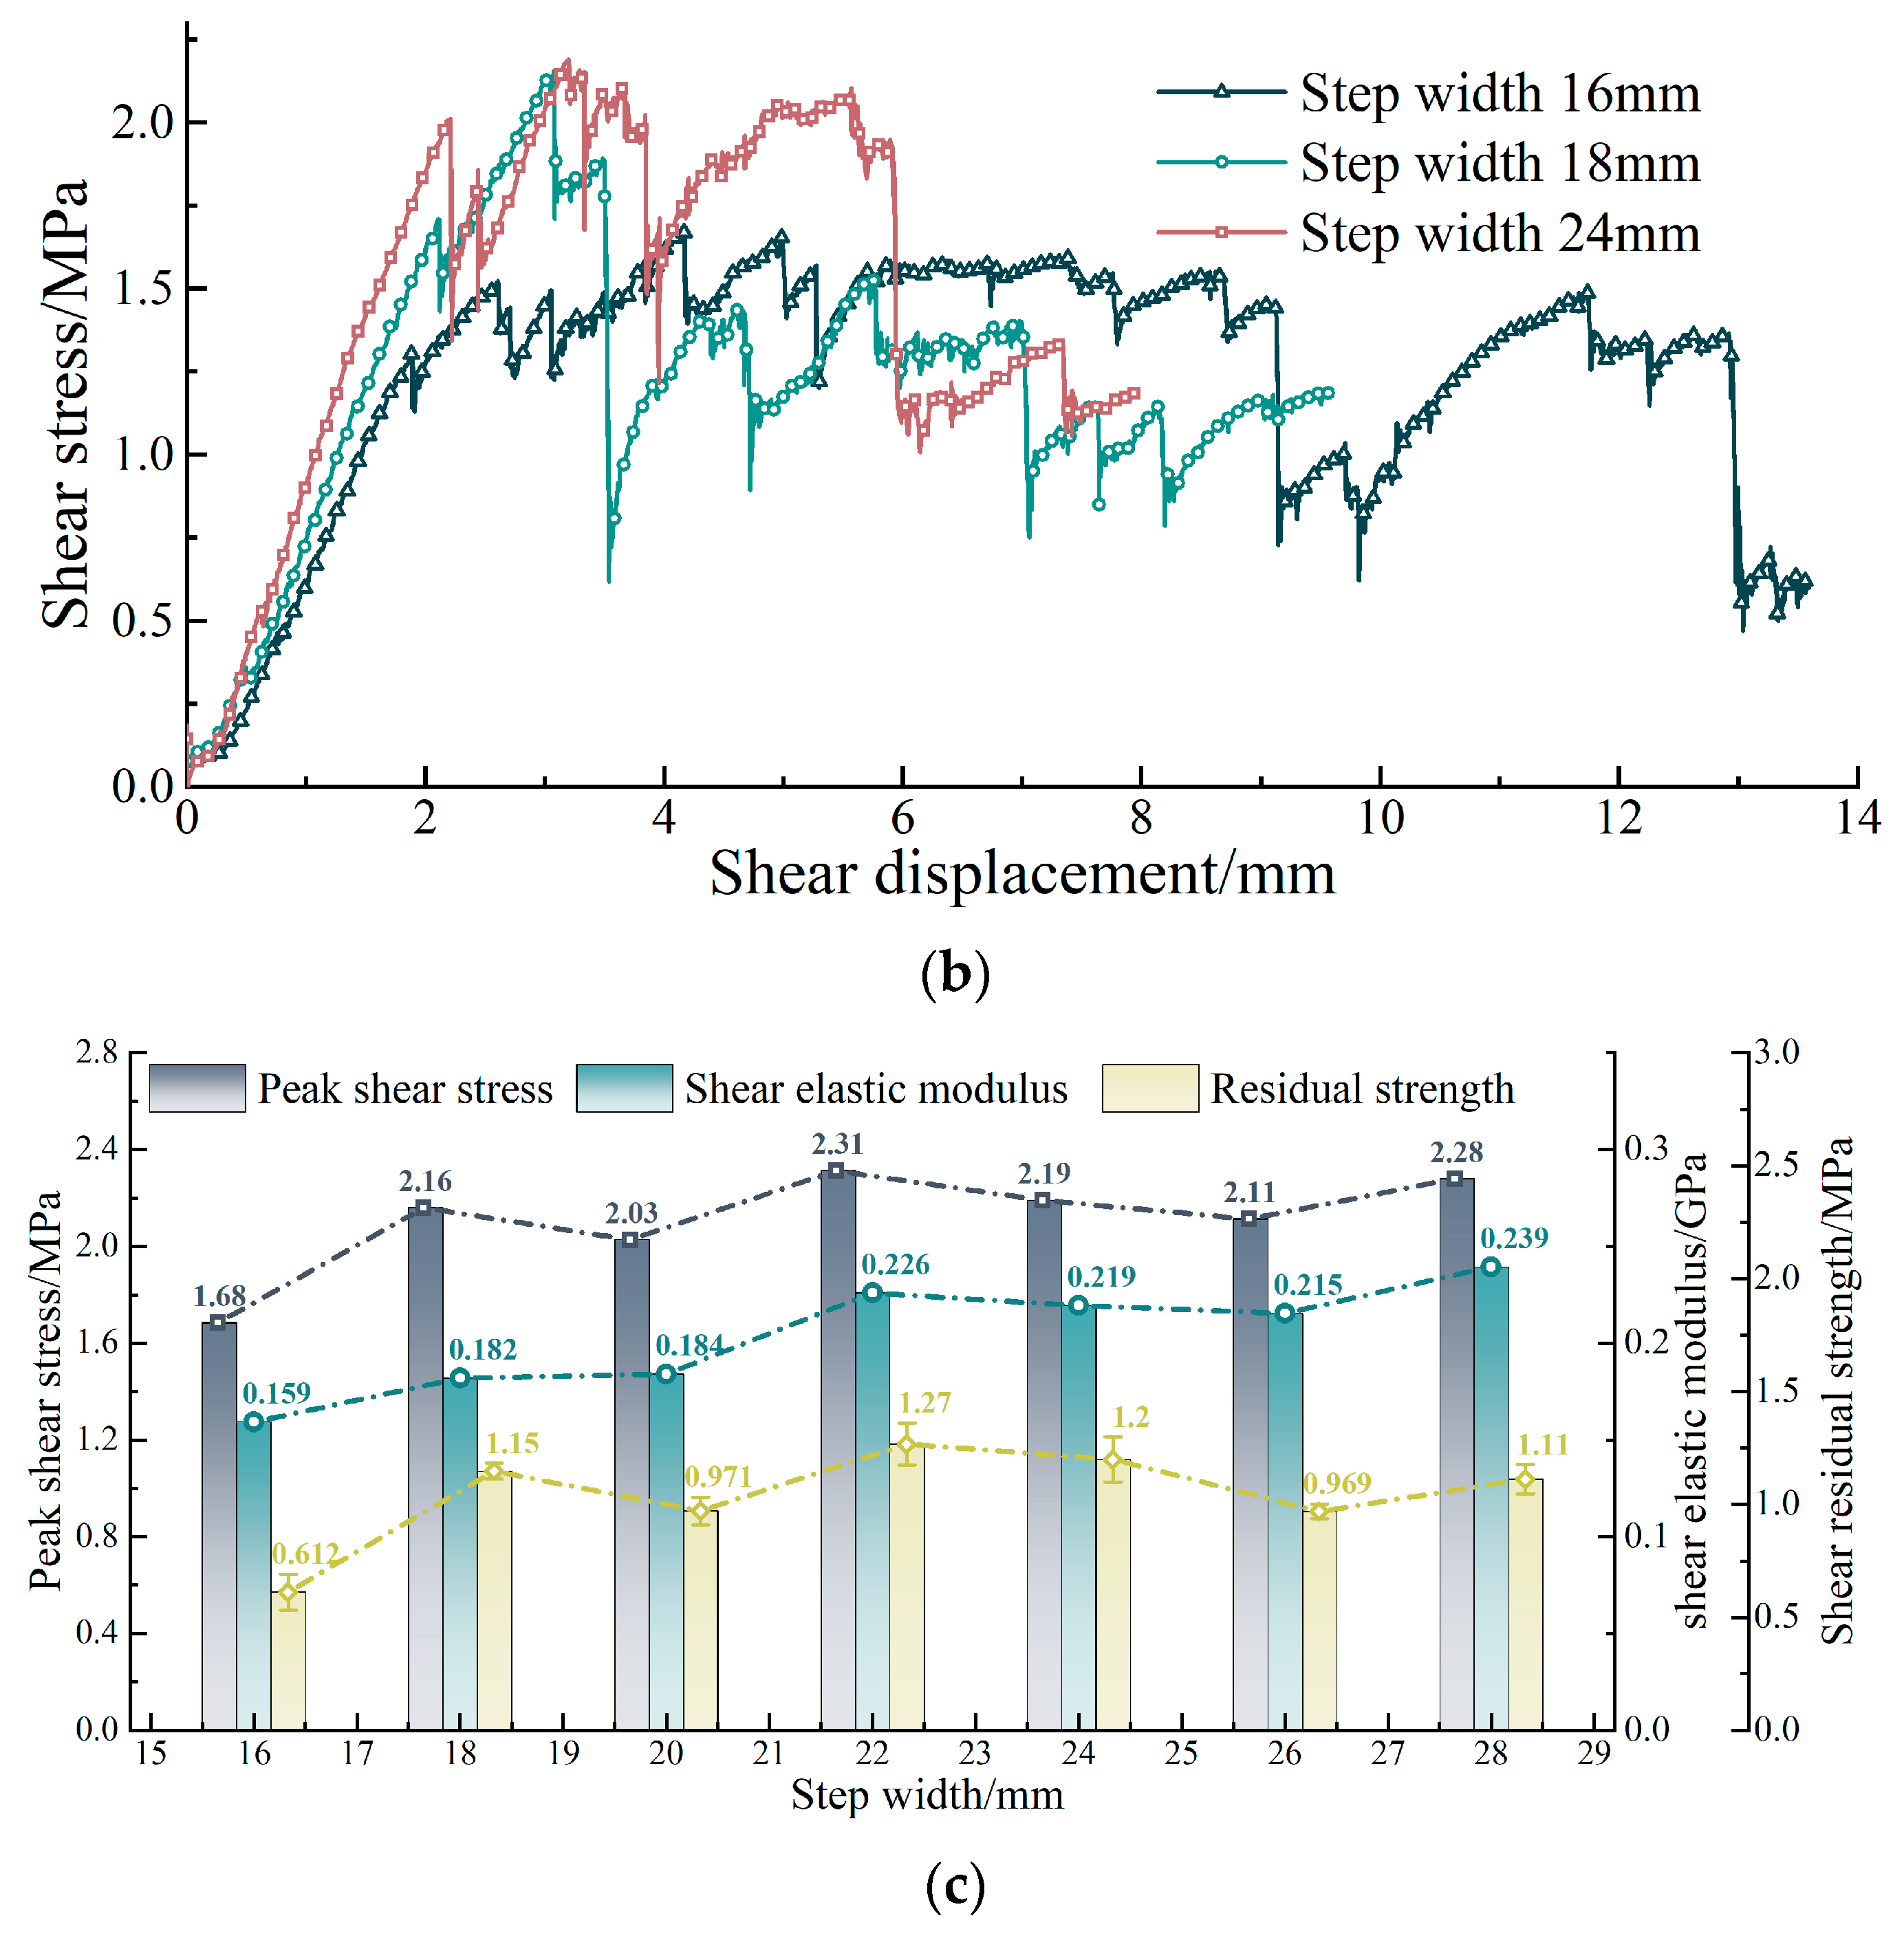
5.3. Effect of Step Width on Shear Characteristics

The influence of rock step width on the failure mode and curve type of the samples is pronounced, as depicted in Figure 15a,b. With a narrow rock step width (16 mm), the rock slab exhibits lower bending and shear stiffness, leading to the formation of a multitude of fractures within the slab during the shearing process. Upon the failure of the rock slabs, they tend to incline along the fracture lines, resulting in point contacts between the fractured blocks and the step blocks, which helps to sustain shear resistance. This mechanism is reflected in the shear stress curve, which exhibits an approximately flat segment. As the stress concentration at the point contacts gradually increases, damage to the steps becomes evident, causing a drop in the stress curve before it enters the residual stage. Conversely, as the step width increases, stress concentration is less likely due to the reduced inclination of the rock slab. This results in a more uniform distribution of stress, and the interface damage tends to progress in a relatively smooth manner.
Figure 15c shows the effect of rock step width on the shear mechanical parameters. An analysis of the figure reveals that the minimum values for peak shear stress, shear elastic modulus, and residual strength, which are observed in the 16 mm sample, are 1.68 MPa, 0.159 GPa, and 0.612 MPa, respectively. When the layer thickness ranges from 18 to 28 mm, these parameters exhibit irregular fluctuations, with ranges of 2.03–2.31 MPa, 0.182–0.239 GPa, and 0.969–1.27 MPa, respectively. It can be deduced that decreasing the step width will result in a drop in the shear parameter values, which then stabilise within a given range when the step width increases.

6. Conclusions

In this study, numerical simulation was used to examine the shear coalescence mechanism, stress evolution, and crack type characteristics of the band–bedrock interface. Moreover, the effects of the sample and step geometry size on the shear mechanical properties of the band–bedrock interface were identified. The specific conclusions are as follows:
(1)
The initiation and failure cracks in the first rock step are predominantly tensile. As the induced shear displacement increases, the influence of shear stress becomes more pronounced, leading to shear and mixed types of failure cracks in the subsequent rock slabs and steps.
(2)
The failure of the first rock step occurs before the peak, primarily due to tensile stress, resulting in a point-load stress state that induces splitting failure. The remaining steps transition into a complex compressive–tensile stress state, with their failure occurring progressively.
(3)
With the increase in the sample size, the post-peak plasticity of the stress curves with strain softening becomes the predominant characteristic when the sample size exceeds 200 mm. The variation in the shear parameters with sample size can be described by a negative exponential function. Once the sample size surpasses 350 mm, the shear parameter values approach consistency. The representative elementary volume of the shear parameters can be considered as a sample with a geometry size of 350 mm.
(4)
The rock step height significantly influences the failure mode and stress curve characteristics by affecting the stress concentration and shear dilation. The peak shear strength and shear elastic modulus increase with rock step height, with respective amplifications of 91.37% and 115.83%. The residual strength initially decreases and then gradually increases with step height, exhibiting amplitude reductions and amplifications of 23.73% and 116.94%.
(5)
A smaller step width results in a higher number of fractures during shearing, maintaining shear resistance through point contacts between rock slabs and step blocks. As the rock step width increases, the stress concentration is mitigated due to the reduced inclination of the broken rock slab, leading to the stabilisation of the shear parameter values.

Author Contributions

Conceptualization, H.W., X.G., X.L. and X.Z.; methodology, H.W., X.G. and X.Z.; software, H.W. and X.G.; validation, X.L., X.Z. and B.X.; formal analysis, H.W. and X.G.; investigation, H.W., X.G. and B.X.; resources, X.L. and B.X.; data curation, X.L., X.Z. and B.X.; writing—original draft preparation, H.W. and X.G.; writing—review and editing, X.G., X.L., X.Z. and B.X.; visualization, X.G. and X.Z.; supervision, X.L. and B.X.; project administration, X.L. and B.X.; funding acquisition, X.L. and B.X. All authors have read and agreed to the published version of the manuscript.

Funding

This research was funded by the Chongqing Talents and Out-standing Scientists Project (cstc2024ycjh-bgzxm0032), the National Natural Science Foundation of China (41972266), the China Postdoctoral Science Foundation (2023M730432) and the Special Funding for Chongqing Postdoctoral Research Project (2022CQBSHTB1010). And The APC was funded by Liu, X. and Xu, B.

Data Availability Statement

The original contributions presented in the study are included in the article, further inquiries can be directed to the corresponding author.

Acknowledgments

The authors are very grateful for the editor and the anonymous reviewers’ valuable comments. The authors are also very grateful for the Suliman’s work on language proofreading which improves readability of this paper.

Conflicts of Interest

The authors declare that they have no conflicts of interest which may affect paper publication.

References

  1. Shang, J.; West, L.; Hencher, S.; Zhao, Z. Geological discontinuity persistence: Implications and quantification. Eng. Geol. 2018, 241, 41–54. [Google Scholar] [CrossRef]
  2. Chen, C.; Yang, H.; Song, K.; Liang, D.; Zhang, Y.; Ni, J. Dissolution feature differences of carbonate rock within hydro-fluctuation belt located in the Three Gorges Reservoir Area. Eng. Geol. 2023, 327, 107362. [Google Scholar] [CrossRef]
  3. Tang, H.; Wasowski, J.; Juang, C. Geohazards in the three Gorges Reservoir Area, China—Lessons learned from decades of research. Eng. Geol. 2019, 261, 105267. [Google Scholar] [CrossRef]
  4. Yin, Y.; Huang, B.; Wang, W.; Wei, Y.; Ma, X.; Ma, F.; Zhao, C. Reservoir-induced landslides and risk control in Three Gorges Project on Yangtze River, China. J. Rock Mech. Geotech. Eng. 2016, 8, 557–595. [Google Scholar] [CrossRef]
  5. Liu, X.; Wang, Y.; Xu, B.; Zhou, X.; Guo, X.; Miao, L. Dynamic damage evolution of bank slopes with serrated structural planes considering the deteriorated rock mass and frequent reservoir induced earthquakes. Int. J. Min. Sci. Technol. 2023, 33, 1131–1145. [Google Scholar] [CrossRef]
  6. Yin, Y.; Wang, L.; Huang, B.; Zhang, Z.; Dai, Z. Evolution analysis of the Banbiyan dangerous rock mass in the three gorges reservoir area. Georisk-Assess. Manag. Risk Eng. Syst. Geohazards 2023, 17, 376–386. [Google Scholar] [CrossRef]
  7. Patton, F. Multiple modes of shear failure in rock. In Proceeding of the Congress of 1st International Society of Rock Mechanics, Lisbon, Portugal, 25 September–1 October 1966; International Society for Rock Mechanics and Rock Engineering: Lisbon, Portugal, 1966; pp. 509–513. [Google Scholar]
  8. Barton, N.; Choubey, V. The shear strength of rock joints in theory and practice. Rock Mech. Rock Eng. 1977, 10, 1–54. [Google Scholar] [CrossRef]
  9. Zhao, J. A new JRC-JMC shear strength criterion for rock joint. Chin. J. Rock Mech. Eng. 1998, 17, 349–357. [Google Scholar]
  10. Maksimović, M. The shear strength components of rough rock joint. Int. J. Rock Mech. Min. Sci. Geomech. Abstr. 1996, 33, 769–783. [Google Scholar] [CrossRef]
  11. Xia, C.; Tang, Z.; Xiao, W.; Song, Y. New peak shear strength criterion of rock joints based on quantified surface description. Rock Mech. Rock Eng. 2014, 47, 387–400. [Google Scholar] [CrossRef]
  12. Yang, J.; Rong, G.; Hou, D.; Peng, J.; Zhou, C. Experimental study on peak shear strength criterion for rock joints. Rock Mech. Rock Eng. 2016, 49, 821–835. [Google Scholar] [CrossRef]
  13. Liu, X.; Li, P.; Guo, X.; Luo, X.; Zhou, X.; Miao, L.; Zhou, F.; Wang, H. A statistical damage-based constitutive model for shearing of rock joints in brittle drop mode. Int. J. Min. Sci. Technol. 2024. [Google Scholar] [CrossRef]
  14. Liu, X.; Xu, B.; Huang, J.; Lin, G.; Zhou, X.; Wang, J.; Xiong, F. Macro-meso shear mechanical behaviors of coalescent rock joints with different morphologies. Chin. J. Geotech. Eng. 2021, 43, 406–415. [Google Scholar]
  15. Liu, R.; Lou, S.; Li, X.; Han, G.; Jiang, Y. Anisotropic surface roughness and shear behaviors of rough-walled plaster joints under constant normal load and constant normal stiffness conditions. J. Rock Mech. Geotech. Eng. 2022, 12, 338–352. [Google Scholar] [CrossRef]
  16. Zhang, G.; Zhang, J.; Zou, B.; Zou, J.; Xiong, F.; Lin, Z.; Zhang, Z. An Empirical Study on Water-Induced Shear Weakening Behaviors of Rough-Walled Sandstone Joints. Rock Mech. Rock Eng. 2023, 56, 3475–3497. [Google Scholar] [CrossRef]
  17. Le, H.; Wei, J.; Sun, S.; Zhang, C. Cracking behaviors and strength of rock-like samples with steps of different geometries under shear stress. J. Mt. Sci. 2021, 18, 1352–1370. [Google Scholar] [CrossRef]
  18. Zhang, S.; Wang, G.; Jiang, Y.; Wang, C.; Xu, F. Shear behaviours and roughness degeneration based on a quantified rock joint surface description. Int. J. Min. Sci. Technol. 2023, 33, 1301–1316. [Google Scholar] [CrossRef]
  19. Jiao, F.; Xu, J.; Peng, S.; Hei, M.; Zhang, X.; Cheng, L. Experimental study on shear mechanical properties and damage evolution of artificial structural plane under constant normal stiffness. J. China Coal Soc. 2023, 48, 4065–4077. [Google Scholar]
  20. Bao, H.; Hu, Q.; Lan, H.; Yan, C.; Sun, W.; Liu, S.; Ma, K.; Wang, J. Spatio-temporal evolution law of anisotropic shear damage on rock mass joint surface affected by joint morphology. Eng. Fail. Anal. 2024, 165, 108820. [Google Scholar] [CrossRef]
  21. Zhang, Q.; Luo, Z.; Shen, D.; Shi, Z.; Pan, Q. Shear stress relaxation behavior of rock joints considering 3D morphological characteristics. Bull. Eng. Geol. Environ. 2023, 84, 429. [Google Scholar] [CrossRef]
  22. Song, L.; Jiang, Q.; Li, Y.; Yang, C.; Liu, C.; Yang, B.; Li, S. Improved JRC-JCS shear strength formula for soft-hard natural joints. Rock Soil Mech. 2017, 38, 2789–2798. [Google Scholar]
  23. Ghazvinian, A.; Taghichian, A.; Hashemi, M.; Mar’ashi, S. The shear behaviour of bedding planes of weakness between two different rock types with high strength difference. Rock Mech. Rock Eng. 2010, 43, 69–87. [Google Scholar] [CrossRef]
  24. Hu, Z.; Wang, Q.; Ma, Y.; Lv, H.; Liu, W.; Yan, R.; Wang, K.; Shao, T.; Sun, Y. Study on shear failure characteristics of fiber-reinforced shotcrete-granite interface based on surface scanning. Case Stud. Constr. Mater. 2024, 21, e03486. [Google Scholar] [CrossRef]
  25. Bahaaddini, M.; Sharrock, G.; Hebblewhite, B. Numerical direct shear tests to model the shear behaviour of rock joints. Comput. Geotech. 2013, 51, 101–115. [Google Scholar] [CrossRef]
  26. Yang, K.; Hu, Q.; Zhao, H.; Zhao, M.; Zhou, S. Numerical study on the shear behavior of concrete-rock joints with similar triangular asperities. Comput. Geotech. 2023, 159, 105468. [Google Scholar] [CrossRef]
  27. Cao, R.; Yao, R.; Lin, H.; Lin, Q.; Meng, Q.; Li, T. Shear behaviour of 3D nonpersistent jointed rock-like specimens: Experiment and numerical simulation. Comput. Geotech. 2022, 148, 104858. [Google Scholar] [CrossRef]
  28. Tai, D.; Qi, S.; Zheng, B.; Wang, C.; Guo, S.; Luo, G. Shear mechanical properties and energy evolution of rock-like samples containing multiple combinations of non-persistent joints. J. Rock Mech. Geotech. Eng. 2023, 15, 1651–1670. [Google Scholar] [CrossRef]
  29. Chen, M.; Yang, S.; Ranjith, P.; Zhang, Y. Cracking behavior of rock containing non-persistent joints with various joints inclinations. Theor. Appl. Fract. Mech. 2020, 109, 102701. [Google Scholar] [CrossRef]
  30. Song, Z.; Yang, Z.; Zhang, M.; Wang, F.; Herbst, M.; Konietzky, H. Effect of heterogeneity on mechanical and micro-seismic behaviors of sandstone subjected to multi-level cyclic loading: A discrete element method investigation. J. Rock Mech. Geotech. Eng. 2023, 15, 2556–2581. [Google Scholar] [CrossRef]
  31. Shao, X.; Chi, S.; Tao, Y.; Zhou, X. DEM simulation of the size effect on the wetting deformation of rockfill materials based on single-particle crushing tests. Comput. Geotech. 2020, 123, 103429. [Google Scholar] [CrossRef]
  32. Bahaaddini, M.; Hagan, P.; Mitra, R.; Hebblewhite, B. Scale effect on the shear behaviour of rock joints based on a numerical study. Eng. Geol. 2014, 181, 212–223. [Google Scholar] [CrossRef]
  33. Lin, H.; Kang, W.; Oh, J.; Canbulat, I.; Hebblewhite, B. Numerical simulation on borehole breakout and borehole size effect using discrete element method. Int. J. Min. Sci. Technol. 2020, 30, 623–633. [Google Scholar] [CrossRef]
  34. Sun, Y.; Kwok, C.; Duan, K. Size effects on crystalline rock masses: Insights from grain-based DEM modeling. Comput. Geotech. 2024, 171, 106376. [Google Scholar] [CrossRef]
  35. Ye, Y.; Li, C.; Zeng, Y.; Tang, H. 3D DEM simulations of the variability of rock mechanical behaviour based on random rock microcracks. Int. J. Rock Mech. Min. Sci. 2023, 167, 105395. [Google Scholar] [CrossRef]
  36. Wei, Y.; Feng, Y.; Tian, Z.; Yang, T.; Li, X.; Dai, Z.; Deng, J. Borehole stability in naturally fractured rocks with drilling mud intrusion and associated fracture strength weakening: A coupled DFN-DEM approach. J. Rock Mech. Geotech. Eng. 2024, 16, 1565–1581. [Google Scholar] [CrossRef]
  37. Jiang, S.; Chen, J.; Wang, Z.; Zheng, J.; Huang, J.; Lv, Q. Three-Dimensional Discrete Element Analysis of Jointed Rock Slope Stability Based on the Universal Elliptical Disc Model. Rock Mech. Rock Eng. 2024, 57, 505–525. [Google Scholar] [CrossRef]
  38. Vaziri, M.; Tavakoli, H.; Bahaaddini, M. Statistical analysis on the mechanical behaviour of non-persistent jointed rock masses using combined DEM and DFN. Bull. Eng. Geol. Environ. 2022, 81, 177. [Google Scholar] [CrossRef]
  39. Zhang, Y.; Jiang, Y.; Asahina, D.; Wang, C. Experimental and numerical investigation on shear failure behavior of rock-like samples containing multiple non-persistent joints. Rock Mech. Rock Eng. 2020, 53, 4717–4744. [Google Scholar] [CrossRef]
  40. ICG (Itasca Consulting Group). PFC-Particle Flow Code Documentation, Version 7.0; Itasca Consulting Group Inc.: Minneapolis, MN, USA, 2019. [Google Scholar]
  41. Lei, X.; Gong, W.; Li, B.; Zhao, C.; Tang, H.; Wang, L. Probabilistic Analysis of Earthquake-induced Failure and Runout Behaviors of Rock Slopes with Discrete Fracture Network. Comput. Geotech. 2023, 159, 105487. [Google Scholar]
  42. Ni, X.; Ma, J.; Zhang, F. Mechanism of the variation in axial strain of sand subjected to undrained cyclic triaxial loading explained by DEM with non-spherical particles. Comput. Geotech. 2024, 165, 105846. [Google Scholar] [CrossRef]
  43. Rafiee, R.; Ataei, M.; KhalooKakaie, R.; Jalali, S.; Sereshki, F.; Noroozi, M. Numerical modeling of influence parameters in cavabililty of rock mass in block caving mines. Int. J. Rock Mech. Min. Sci. 2018, 105, 22–27. [Google Scholar] [CrossRef]
  44. Zhang, X.; Wong, L. Loading rate effects on cracking behavior of flaw-contained specimens under uniaxial compression. Int. J. Fract. 2013, 180, 93–110. [Google Scholar] [CrossRef]
  45. Xu, X.; Wu, S.; Gao, Y.; Xu, M. Effects of Micro-structure and Micro-parameters on Brazilian Tensile Strength Using Flat-Joint Model. Rock Mech. Rock Eng. 2016, 49, 3575–3595. [Google Scholar] [CrossRef]
  46. Wu, S.; Xu, X. A Study of Three intrinsic problems of the classic discrete element method using flat-joint model. Rock Mech. Rock Eng. 2016, 49, 1813–1830. [Google Scholar] [CrossRef]
  47. Yang, Y.; Qiao, W. Numerical investigation of the shear behavior of granite materials containing discontinuous joints by utilizing the flat-joint model. Comput. Geotech. 2018, 104, 69–80. [Google Scholar] [CrossRef]
  48. Chen, Y.; Wong, L. A study on mechanical properties and fracturing behavior of Carrara marble with the flat-jointed model. Int. J. Numer. Anal. Methods Geomech. 2020, 44, 803–822. [Google Scholar] [CrossRef]
  49. Cao, R.; Yao, R.; Dai, H.; Qiu, X.; Lin, H.; Li, K. Fracture behaviour of transversely isotropic rocks under pure mode III fracture: Experiment and numerical simulation. Theor. Appl. Fract. Mech. 2024, 129, 104208. [Google Scholar] [CrossRef]
  50. Xie, S.; Lin, H.; Duan, H.; Liu, H.; Liu, B. Numerical study on cracking behavior and fracture failure mechanism of fractured rocks under shear loading. Comput. Part. Mech. 2024, 11, 903–920. [Google Scholar] [CrossRef]
  51. Cao, R.; Cao, P.; Lin, H.; Ma, G.; Chen, Y. Failure characteristics of intermittent fissures under a compressive-shear test: Experimental and numerical analyses. Theor. Appl. Fract. Mech. 2018, 96, 740–757. [Google Scholar] [CrossRef]
  52. Lin, Q.; Cao, P.; Meng, J.; Cao, R.; Zhao, Z. Strength and failure characteristics of jointed rock mass with double circular holes under uniaxial compression: Insights from discrete element method modelling. Theor. Appl. Fract. Mech. 2020, 109, 102692. [Google Scholar] [CrossRef]
  53. Zhao, Y.; Li, B.; Wu, S.; Chen, L. Failure mechanism of brittle rock with 3D parallel preset flaws based on the particle displacement trend method. Theor. Appl. Fract. Mech. 2022, 117, 103193. [Google Scholar] [CrossRef]
  54. Zhang, X.; Wong, L. Displacement field analysis for cracking processes in bonded-particle mode. Bull. Eng. Geol. Environ. 2014, 71, 13–21. [Google Scholar] [CrossRef]
  55. Sharafisafa, M.; Aliabadian, Z.; Tahmasebinia, F.; Shen, L. Experimental and numerical investigations on crack development in 3D printed rock-like specimens with pre-existing flaws. Eng. Fract. Mech. 2021, 241, 107396. [Google Scholar]
  56. Luo, X.; Cao, P.; Lin, Q.; Li, S. Mechanical behaviour of fracture-filled rock-like specimens under compression-shear loads: An experimental and numerical study. Theor. Appl. Fract. Mech. 2021, 113, 102935. [Google Scholar] [CrossRef]
  57. Cai, W.; Li, Y.; Gao, K.; Wang, K. Crack propagation mechanism in rock-like specimens containing intermittent flaws under shear loading. Theor. Appl. Fract. Mech. 2022, 117, 103187. [Google Scholar] [CrossRef]
  58. Zhao, Y.; Chen, C.; Qi, Q.; Wu, S. Rotation and deflection of 3D principal stress axes induced by a prefabricated single flaw in sandstone: A numerical investigation based on DEM. Theor. Appl. Fract. Mech. 2022, 120, 103430. [Google Scholar] [CrossRef]
  59. Chen, C.; Zhao, Y.; Wu, S. Influences of true 3D twin flaws on principal stress status and crack occurrence of brittle rock-like samples under uniaxial compression: Insights from experimental and DEM studies. Theor. Appl. Fract. Mech. 2023, 127, 104057. [Google Scholar] [CrossRef]
Figure 1. Geographical location and characteristics of shear band in Banbiyan dangerous rock mass.
Applsci 14 09481 g001
Figure 2. Field sampling and parameter measurement: (a) Field sampling; (b) Sample processing; (c) Parametric measurement.
Applsci 14 09481 g002
Figure 3. Experimental model and loading methods: (a) Experimental sample design; (b) Experimental loading methods.
Applsci 14 09481 g003
Figure 4. Numerical model establishment and loading methods: (a) Model establishment; (b) Loading methods.
Applsci 14 09481 g004
Figure 5. Parameter calibration results comparison: (a) Uniaxial compression test; (b) Shear test.
Applsci 14 09481 g005
Figure 6. Curve characteristics and failure modes of sample “L” and “S”: (a) Shear stress–shear displacement curves; (b) Normal displacement–shear displacement curves; (c) Interface failure; (d) Failure mode comparison.
Applsci 14 09481 g006aApplsci 14 09481 g006b
Figure 7. Failure process and crack evolution of sample under 2 MPa normal stress (Points A to H are different state points in the whole failure process).
Applsci 14 09481 g007aApplsci 14 09481 g007b
Figure 8. Schematics of different crack types (modified from reference [56]).
Applsci 14 09481 g008
Figure 9. Displacement field and crack type of sample “S-2” during failure process.
Applsci 14 09481 g009
Figure 10. Arrangement of measurement circles.
Applsci 14 09481 g010
Figure 11. Maximum and minimum stress evolution of sample “S-2” during failure process: (a) Point B; (b) Point C; (c) Point D; (d) Point F; (e) Point H.
Applsci 14 09481 g011aApplsci 14 09481 g011bApplsci 14 09481 g011c
Figure 12. Size effect on stress–displacement curves and failure modes: (a) Curve 1 MPa; (b) Curve 2 MPa; (c) Curve 4 MPa; (d) Failure mode 1 MPa; (e) Failure mode 2 MPa; (f) Failure mode 4 MPa.
Applsci 14 09481 g012aApplsci 14 09481 g012b
Figure 13. Size effect on shear mechanical parameters: (a) 1 MPa; (b) 2 MPa; (c) 4 MPa.
Applsci 14 09481 g013
Figure 14. Effect of step height on sample shear characteristics with geometry size 200 mm: (a) Three typical shear–displacement curves; (b) Three typical failure modes; (c) Shear parameters.
Applsci 14 09481 g014aApplsci 14 09481 g014b
Figure 15. Effect of step width on sample shear characteristics with geometry size 200 mm: (a) Three typical failure modes; (b) Shear–displacement curves; (c) Shear parameters.
Applsci 14 09481 g015aApplsci 14 09481 g015b
Table 1. Basic physical and mechanical parameters of limestone.
LimestoneDensity
(kg/m3)
Elastic Modulus
(GPa)
Uniaxial Compressive
Strength (MPa)
Poisson’s
Ratio
Value258013.99131.740.24
Table 2. Microscopic parameters used in simulation.
Microscopic ParametersLimestoneInterface
Particle minimum radius Rmin (mm)0.70/
Particle maximum radius Rmax (mm)1.05/
Deformability modulus E* (GPa)10.200.11
Normal to shear stiffness ratio k*2.000.50
Tensile strength fj_ten (MPa)18.500.00
Bond strength fj_coh (MPa)60.000.00
Friction angle fj_fa (°)35.0055.00
Friction coefficient fj_fric0.450.80
Table 3. Parameter value comparison between experiment and simulation.
Mechanical ParametersExperimental ResultSimulation ResultError
Elastic Modulus (GPa)13.9913.642.50%
UCS (Mpa)131.74128.512.45%
Poisson’s Ratio0.240.254.17%
Table 4. Test scheme designs in this paper.
Scheme
Name
DescriptionScheme NameDescription
L-1normal stress 1 MPa
model size 200 mm
step height 10 mm
step width 22 mm
L-2normal stress 2 MPa
model size 200 mm
step height 10 mm
step width 22 mm
L-4normal stress 4 MPa
model size 200 mm
step height 10 mm
step width 22 mm
S-1normal stress 1 MPa
model size 200 mm
step height 10 mm
step width 22 mm
S-2normal stress 2 MPa
model size 200 mm
step height 10 mm
step width 22 mm
S-4normal stress 4 MPa
model size 200 mm
step height 10 mm
step width 22 mm
SS-100model size 100 mm
normal stress 1, 2, 4 MPa
SS-300model size 300 mm
normal stress 1, 2, 4 MPa
SS-350model size 350 mm
normal stress 1, 2, 4 MPa
SS-400model size 400 mm
normal stress 1, 2, 4 MPa
SH-3Step height 3 mm
normal stress 2 MPa
SH-5Step height 5 mm
normal stress 2 MPa
SH-7Step height 7 mm
normal stress 2 MPa
SH-13Step height 13 mm
normal stress 2 MPa
SH-15Step height 15 mm
normal stress 2 MPa
SW-16Step width 16 mm
normal stress 2 MPa
SW-18Step width 18 mm
normal stress 2 MPa
SW-20Step width 20 mm
normal stress 2 MPa
SW-24Step width 24 mm
normal stress 2 MPa
SW-26Step width 26 mm
normal stress 2 MPa
SW-28Step width 28 mm
normal stress 2 MPa
Disclaimer/Publisher’s Note: The statements, opinions and data contained in all publications are solely those of the individual author(s) and contributor(s) and not of MDPI and/or the editor(s). MDPI and/or the editor(s) disclaim responsibility for any injury to people or property resulting from any ideas, methods, instructions or products referred to in the content.

