1. Introduction
In recent years, several wireless sensor network (WSN) technologies have emerged to support Internet of Things (IoT) devices and relevant applications. WSNs provide wide coverage and low deployment costs compared to wired communication networks, providing reliable and scalable coverage with the inherent flexibility in relocating or moving wireless sensors within the coverage area [
1]. Such WSNs support meeting the requirements of many IoT-based monitoring applications, such as those developed for smart cities. There are specific monitoring-system scenarios that involve linear sensor topologies, such as oil and gas pipeline monitoring systems [
2]. In such linear topologies, the devices are arranged according to a linear layout to monitor pipelines with long lengths and, in many cases, within environments (e.g., deserts) that do not provide adequate wireline network coverage or connectivity to energy grids. Additionally, this type of deployment introduces many challenges, such as high signal delays, low reliability, and high sensor energy consumption that may impact the actual sensor performance [
2]. We are considering a case study on a large-scale oil pipeline leak-detection system—one kind of monitoring system. The oil pipeline runs through the desert in the Kingdom of Saudi Arabia (KSA).
In the pipeline monitoring scenario, there are various deployment lengths, which can reach hundreds of kilometers. According to the pipeline length, different WSN technologies can be used [
3]. Wi-Fi, Bluetooth, and ZigBee technologies can be applied for short pipeline lengths. Long pipelines need long-range communication technologies that ensure low energy consumption. To address these challenges and limitations, many WSN technologies have been developed. Low-power wide-area networks (LPWANs) provide a low deployment cost and high energy efficiency [
4]. In addition, these networks cover wide areas. Some examples of LPWANs are LoRaWAN, Sigfox, and DASH7 [
4]. LoRaWAN networks demonstrate good results for environment and monitoring applications in terms of their long range and low energy consumption [
5]. In addition, such networks offer a large communication range and several years of battery life while operating on unlicensed frequency bands. Also, LoRaWAN networks provide high channel capacity, meaning several devices may transmit data simultaneously over a single channel. Large-scale IoT monitoring systems have many challenges, such as the need for a large transmission range and the huge number of sensors affecting the network lifetime due to their limited battery duration. Additional challenges are network congestion and decreased throughput, which result from high data traffic, delay, packet loss, and heavy load. LoRaWAN has been designed while taking such challenges into consideration [
5].
In cases of linear sensor networks that involve long end–end communication ranges, multi-hop LoRa networks may provide a more promising solution than single-hop LoRa networks, which are based on star topologies. In multi-hop communication, the sensing device acts as a relay for other nearby devices during data transmission [
4,
5]. However, the choice of deploying multi-hop LoRa networks needs to be studied cautiously to address possible tradeoffs, such as increased end–end delay and energy consumption on the one hand and throughput on the other hand. Another issue is that multi-hop networks have better scalability in comparison to single-hop networks; however, to support increasing network scalability, adding more devices must be carried out while setting network parameters by avoiding LoRa limitations and the challenges caused by network requirements [
6,
7,
8].
Multi-hop LoRaWAN was used in our previous study [
9]. The authors measured temperature and pressure for leak detection in the oil pipeline. Some of the results obtained determined the optimal distance between sensors and defined the number of hops in multi-hop scenarios. In this paper, we extend the work and aim to quantify the energy consumption, network coverage, and throughput of multi-hop LoRaWAN. Considering the LoRaWAN specification, we define an analytical model. The evaluation of the multi-hop LoRaWAN performance is carried out by comparing the multi-hop scenario with the single-hop scenario. It is worth noting that the length of the area of both scenarios is set to 10 km since it is limited by how far the coverage of the single-hop gateway can reach. To fine-tune the hop range of the multi-hop LoRaWAN, three multi-hop scenarios are defined. However, since the coverage constraint does not apply here, we can extend the length of the study area to 88.6 km.
The contributions of this work are as follows:
- -
Estimating the energy consumption of the proposed multi-hop LoRaWAN solution based on equations that include LoRa parameters that affect the metrics of network performance. Other research considers similar models [
10] but does not focus on optimizing energy consumption.
- -
Estimating the maximum capacity of the proposed solution and computing the upper limits that can be realistically reached. This research highlights two possible limiting factors. One limiting factor is related to the bit rate, and it has been discussed in previous research. The other limiting factor is related to the duty cycle that has been described in [
11].
- -
Assessing the performance of the multi-hop LoRaWAN network by using the analytical model. This assessment is demonstrated by comparing single-hop and multi-hop LoRaWAN scenarios.
- -
Studying the trade-offs involved in deploying a linear multi-hop LoRaWAN, pointing out some issues that need to be considered when deploying such networks. The study follows a scientific method, where three multi-hop LoRaWAN network scenarios are defined and utilized for the study.
The rest of the paper is organized as follows.
Section 2 presents some background about the LPWAN technologies and a brief description of LoRa technology. Work related to multi-hop LoRa used in monitoring networks is described in
Section 3.
Section 4 describes the case study, network architecture, and LoRaWAN configuration.
Section 5 presents the proposed LoRaWAN multi-hop analytical model for linear sensor networks.
Section 6 presents the model results and relevant discussion.
Section 7 concludes the paper.
2. Overview of LoRa and LoRaWAN
WSN technologies are the standards that support network communication and allow sensing devices to share data packets. They are used widely in IoT applications, and each standard has different frequency bands, topologies, ranges, and energy consumption [
12]. However, these technologies have coverage limitations [
13]. Low-power wide-area networks (LPWANs) emerged to address this challenge and support large-scale IoT applications.
LPWAN technologies operate in the sub-GHz frequency band. These technologies’ specifications are low power, long range, and a low data rate, which make them appropriate solutions for monitoring systems (such as pipeline monitoring systems). In addition, LPWANs have low costs in the deployment of large-scale networks [
14]. NB-IoT, Sigfox, DASH 7, and LoRa are examples of LPWANs. Based on our review, no single technology works for all IoT applications; its suitability depends on the actual application requirements. In this paper, we consider the large-scale pipeline monitoring system. Pipeline systems demand low-cost, wide-range, and low-power networking technologies. Due to its use of the licensed band, NB-IoT is more costly than other technologies. It also depends on the wide coverage provided by 4G and 5G cellular licensed networks, which may not be possible in large, unpopulated regions like deserts. In terms of coverage, Sigfox and LoRa are the two best technologies for pipeline monitoring. Sigfox can reach up to 30 km and LoRa up to 15 km. However, Sigfox requires a subscription, whereas LoRa is public software (no cost to use this technology). LoRa enables greater communication rates and larger payloads. In Sigfox, the data rate can reach 100 bps with a payload size of 12 bytes, whereas in LoRa, it can reach 50 kbps with a payload size of 243 bytes. Both use a star topology. Although Sigfox’s network architecture is centralized, the network relies on Sigfox’s infrastructure to operate, whereas in LoRa, users can operate the network. Sigfox has additional limits; LoRa, on the other hand, is less costly as well as more flexible. Determining which technologies to use is based on an application’s needs, such as network cost, range, and payload size. LoRa’s flexibility and adaptive features give more resilience than Sigfox in various environments. Both LoRa and Sigfox have useful battery life, generally 5–10 years. According to the in-pipeline monitoring system, LoRa has the best characteristics to address the application’s requirements. In the following, we briefly present LoRa technology and the key technical parameters.
LoRa and LoRaWAN
Long-range technology (LoRa) was provided by Semtech company in 2015 as a low-power, long-range connectivity solution. It operates on an unlicensed frequency spectrum of 868 MHz in Europe and 915 MHz in the United States. LoRa transmits data via chirp spread spectrum (CSS) modulation. LoRa has a restricted duty cycle, so throughput is low [
15].
LoRa operating parameters are crucial for analyzing network performance, as they are utilized to develop test scenarios and evaluation methods. The parameters are bandwidth (BW), spread factor (SF), coding rate (CR), and transmitted power (TP). The network BW and SF determine the data rate. To deliver data to remote places, larger SF and transmission power values are used. Also, a smaller bandwidth enhances receiver sensitivity and range. LoRa supports three BW values: 125, 250, and 500 kHz, with SF values ranging from 7 to 12. The CR improves the link’s reliability in the presence of interference. While greater coding rates improve noise and interference resistance, they also result in less data [
15].
The LoRa packet format consists of a preamble (for synchronization), a header, and a payload (actual data). Another set of options related to the header and payload include coding rate (CR), explicit header (EH), and low data rate optimization enabled (DE). The CR ranges from 1 to 4, representing the number of bits utilized in error corrections; 1 is most commonly used in LoRa [
16]. The value of the EH is either 0 or 1. If a low data rate is enabled, the DE value is one; otherwise, it is zero. The LoRa packet size can be up to 255 bytes [
16].
LoRaWAN is the network protocol responsible for connecting LoRa nodes. LoRaWAN supports star-of-stars topologies and can be created as a single-hop network. Data are transmitted from sensors to base stations (gateways) at a rate of up to 50 kbps. LoRaWAN provides low-power communication with a range of up to 15 km.
Figure 1 illustrates the LoRaWAN architecture, which consists of four basic components: LoRa end devices, LoRa gateways, network servers, and application servers [
17]. The end devices (sensors) are responsible for sensing the area and transmitting the data to the GW. LoRa GWs are more capable devices that act as bridges between end devices and network servers. The network server manages the entire LoRaWAN network. Application servers are in control of securely processing, maintaining, and interpreting sensor application data [
17].
In this work, we focus on studying the challenges of interconnecting the end devices and the GW.
3. Related Work
WSN technologies have been studied in many literature works to address the requirements of monitoring systems. These also include non-LoRa technologies such as Zigbee and Wi-Fi, and they cover applications such as pipeline monitoring systems, marine and underwater monitoring systems, and tunnel monitoring. Some are star networks, such as in [
18], and some are related to linear networks, like [
19,
20,
21,
22]. These papers apply multi-hop communication to provide a reliable linear WSN. However, these systems face two challenges: high energy consumption and limited network coverage.
The work in [
22] studied a monitoring system based on LoRaWAN technology. The evaluation showed that LoRaWAN could provide promising results in terms of network coverage in monitoring applications. The system had efficient results in leak detection. Another development of LoRaWAN in monitoring applications was presented in [
23] for the deployment of a cost-effective monitoring system. The system had efficient results in terms of energy and coverage; however, there was no estimation of the network throughput. In [
24], the authors studied a LoRaWAN system targeting enhanced network reliability and avoiding packet collisions by using clusters; however, there were no relevant energy consumption estimations or delay evaluations. In [
25], the authors present an oil pipeline monitoring system using LoRa technology and show the limitations of the system in terms of network coverage.
In [
26], the authors applied the multi-hop LoRa network in smart city applications to extend the required coverage area. They concluded that multi-hop LoRa achieves a better result in energy consumption compared to LoRa single-hop networks, with some concerns about network scalability. Another comparison between single- and multi-hop LoRa was made in [
27]. The authors used the multi-hop LoRa in monitoring systems and applied a mesh topology. The results showed an enhancement in the packet delivery ratio; however, they highlighted some limitations in terms of end–end delay and energy consumption. The work in [
28] proposed a general multi-hop protocol based on the LoRaWAN network. In the evaluation, the authors compared the single-hop and multi-hop scenarios in terms of energy consumption and showed that the multi-hop protocol achieved better results.
In [
29], the authors proposed a linear multi-hop infrastructure to monitor gas pipelines. The aim was to use multi-hop LoRa to achieve wide network coverage for long pipelines. The results showed improvement in the duty cycle. There was no throughput estimation. Furthermore, the work presented in [
30] proposed a linear multi-hop LoRa network that enhanced the coverage range in monitoring systems. The authors also presented a new sensor synchronization solution that was evaluated in terms of achieved throughput. However, energy consumption was an issue. Additionally, the authors in [
31] provided various network architectures (scenarios) to monitor a gas pipeline. Their objective was to find the best scenario that decreased network failures. The energy consumption and the throughput were not considered. Another work [
32] proposed a LoRaWAN network, and the authors analyzed the system throughput using different multi-hop scenarios. Additionally, the authors of [
33] presented an underground monitoring system based on multi-hop LoRaWAN technology to solve the problem of increasing the distance between the gateway and sensors, which enhanced the packet delivery for sensors, highlighting the issue of packet collisions. Another work [
34] proposed a solution for extending the coverage limits of LoRa gateways. They presented a linear multi-hop uplink extension for the LoRaWAN network and a mechanism to solve the issue of packet collisions, identifying relevant throughput limitations. The system was generalized, and no application requirements were considered. In [
35], the authors suggested a scalable multi-hop mechanism based on a linear LoRaWAN network. The work enhanced the achieved throughput and had a smaller number of packet transmissions than a simple peer-to-peer, multi-hop topology with specific delay tradeoffs. The work in [
36] focused on the problem of delay and throughput in linear LoRa multi-hop networks. The results showed an improvement in throughput, but when the number of sensors increased, the network performance was affected, thus impacting the system scalability and the sensor energy. In [
37], the authors proposed an underground monitoring system. They considered a linear multi-hop network; they also studied an energy model for evaluating the energy cost per sensor and presented a synchronization method to enhance the duty cycle and reduce energy consumption without considering the network throughput. We use the same sensor types.
The following works performed an analytical evaluation of the network performance. Throughput can be improved by editing the network configurations (parameters) such as packet size, transmission range, and the number and distribution of sensors. Selecting the best network parameters (such as payload size) to provide high throughput provides good results, as in [
38], where the authors introduced a mathematical model to assess the achieved throughput of NB-IoT technology. The work in [
38] focused on network planning with the aid of an analytical model that estimated the network capacity throughput and network coverage using different network scenarios (different network parameters such as payload size). In our work, we follow the same methodology for the LoRaWAN analytical model to estimate the capacity. There was no energy consumption assessment. In a similar work [
39], the model assessed the network coverage, throughput, and scalability using different scenarios and experimental verification. There was no energy assessment. In [
40], the authors investigated different scenarios (various numbers of sensors and different distributions) to provide optimal throughput of LoRaWAN technology. All scenarios were single-hop; we derived our single-hop scenario from this study. Additionally, a mathematical model for assessing the performance of a single-hop LoRaWAN was introduced. The works in [
10,
41] studied the interdependence between application requirements and network configurations because of the diversity of data traffic, environmental conditions, and coverage range (distance between sensors), showing that uneven sensor density and distribution limit the scalability of single-hop LoRaWAN. Both studies involved an analytical model, the model in [
10] studied a multi-hop LoRaWAN in general, and in [
41] they evaluated the network capacity and throughput for NB-IoT.
All the analytical studies were conducted on single-hop LoRaWAN except [
10]. Since our work involves measuring performance in a LoRaWAN multi-hop network, the only research that is analytical and studies the multi-hop is the one in the [
10]. This work also studies similar parameters to our research, i.e., energy consumption, network capacity, and throughput. However, we consider the pipeline requirements in the model, and the sensor in our model plays the role of a replay device dissimilar to the work in [
10]. However, their results show an energy issue in high-traffic scenarios.
To evaluate performance, the studies used three different methods: real experiments, simulation, and analytical evaluation (mathematical approach).
To conclude, some of the studies presented earlier addressed the LoRaWAN star or hierarchical networks. Furthermore, many multi-hop LoRaWAN studies did not consider the application requirements and network throughput. Also, energy consumption was not widely studied. However, most of the related work used experiments or simulations.
In this work, we propose a multi-hop linear LoRaWAN model that evaluates the performance of a long linear sensor topology. The studied system has a high sensor density, may involve high network traffic, and considers different network architectures (scenarios). Our model assessments include energy consumption, network capacity, and throughput.
4. Using LoRaWAN in Linear Monitoring Systems: KSA Oil Pipeline Case Study
To design the LoRaWAN for linear monitoring systems with limited access to cellular networks and energy grids, we need to specify the application requirements, determine the WSN architecture, and configure the network according to LoRa specifications. We have chosen an oil pipeline monitoring system in the desert of the KSA as a case study. Thus, in
Section 4.1, we introduce the requirements of the pipeline application in Saudi Arabia and describe the case study. After that, in
Section 4.2, we introduce the proposed architecture and our assumptions. Finally, in
Section 4.3, we present the configuration of the network based on the LoRaWAN specifications.
4.1. Description of the Application Requirements and the Oil Pipeline Monitoring System in the KSA
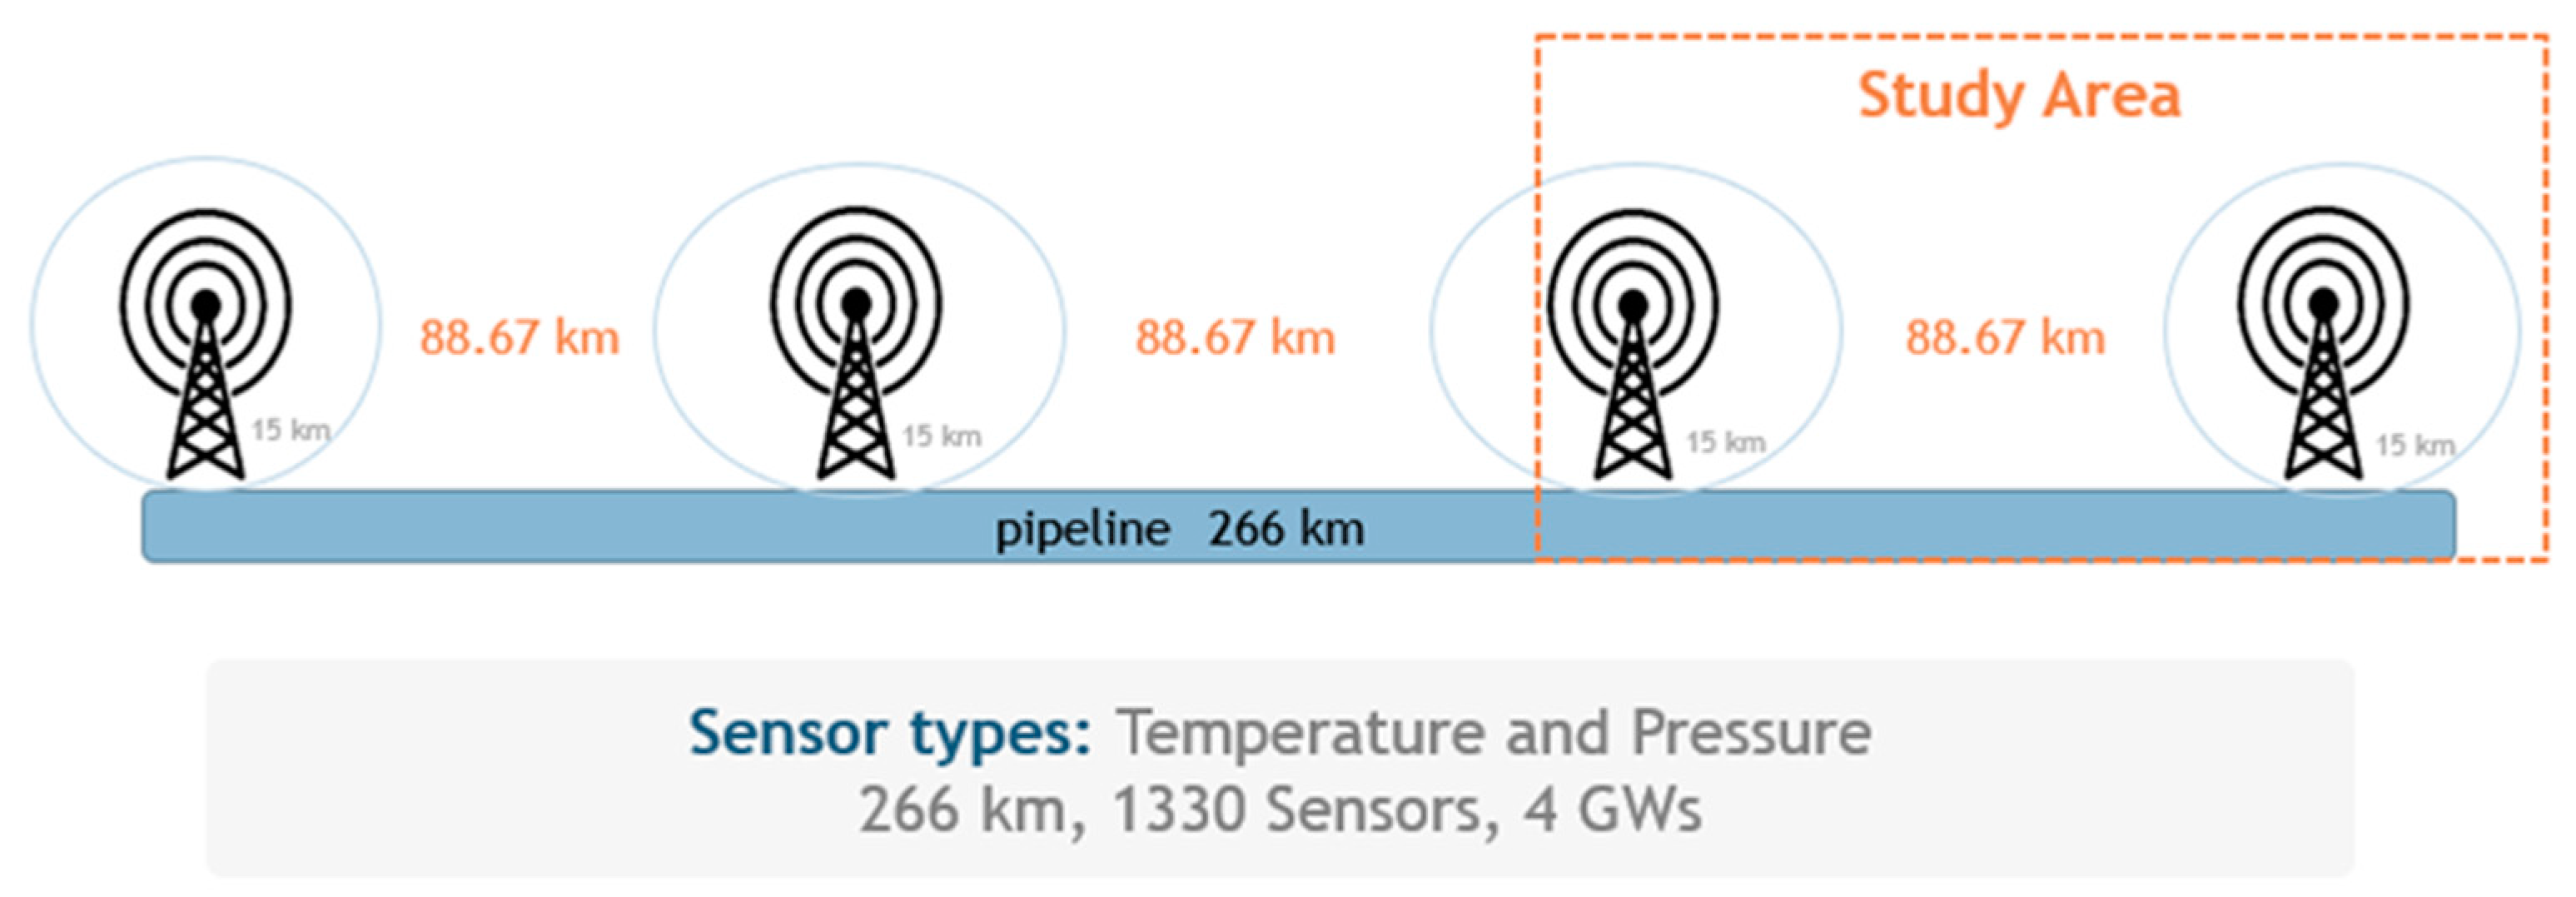
We follow the requirements for applying the oil pipeline monitoring system described in [
9], where the pipeline is above ground and lies in the desert in the KSA. The length of the pipeline reaches 1200 km (266 km in the desert), and it is used to transfer oil and gas from the east of Saudi Arabia to the west. The desert part of the pipeline is deployed in a sparsely populated area where there is no power supply. There are four pump stations in this part, and we assume each station has a GW. As can be noticed, only four GWs support an area with a length of 266 km, providing a limited source of energy. Thus, the area is divided into three parts, each having a length of 88.67 km. The application requires that the distance between sensors does not exceed 200 m based on the result obtained in our previous paper.
4.2. The Design of the Architecture of the Multi-Hop LoRaWAN
From the previous application requirements, the objectives that the network architecture needs to fulfill are as follows. First, to provide a linear network with good coverage to transmit packets with higher throughput. The reached throughput needs to be higher towards the GW while avoiding increased network congestion. The second objective is to preserve the energy of the sensors.
Our solution for the oil pipeline monitoring system is based on multi-hop LoRaWAN. The network architecture consists of sensors that are distributed along the pipelines. Considering the leak-detection systems [
42,
43,
44] and our review in [
9], to detect leaks in oil pipelines we monitor pressure and temperature. Two types of sensors were used: temperature and pressure sensors.
Our proposed network architecture has two types of nodes: sensor nodes and gateway nodes (GWs). The sensors are hybrid nodes; they can only be end devices or relays that aggregate the received packet(s) and send it (them) to the next relay. That means that the sensors have both sensing and relay functionalities.
The study of the network capacity, energy consumption, and throughput was conducted over a distance of 88.6 km, considering 443 sensors distributed among the pipelines.
Figure 2 shows the architecture of the study area. The temperature sensor takes samples every 3 h, so we have eight packets per day, while the pressure sensor sends the measurements every 1 h.
4.3. The Configuration of the Network Based on LoRaWAN Specifications
Since the network architecture is linear and multi-hop, the number of sensors, the distance between sensors, and the data rate all have an impact on what network configuration is selected.
LoRaWAN parameters such as SP and CR affect performance metrics such as the capacity and energy of the LoRaWAN network. Hence, the setting of these parameters should not be carried out randomly, and the effect of each parameter on the performance needs to be investigated. In this section, we study the impact of parameters by deriving the relationship between the parameter and its effect on a specific performance metric from its description in the LoRaWAN specifications.
SF, TP, and CR parameters have an impact on all performance metrics [
41,
42,
43,
44,
45,
46], causing high throughput and low energy consumption. Using smaller SF along with low TP has many advantages, such as decreasing energy consumption and increasing throughput, as the data can be sent more quickly. This is beneficial for applications that prioritize lowering energy consumption, as in our application. However, it reduces the communication range. We set SF and TP to their minimum values of 7 and 2 dBm, respectively.
SF and CR affect the time over the air (ToA), which is the time during which the packet is transmitted over the air and may interfere with other packet transmissions. The ToA, in turn, affects energy consumption and throughput. Increasing SF and CR will result in increasing ToA, thus increasing energy consumption and decreasing throughput. Hence, we set SF and CR to the minimum, which is 7 and 1 for SF and CR; respectively. Consequently, this will result in energy consumption being lower, and throughput will become higher.
The communication range between sensors is limited by SF and TP; decreasing SF and TP will result in reduction of the communication range. For example, setting SF to 7 and TP to 2 dBm will limit the communication range to 2 km. Generally, this decrease in communication range may be problematic; however, according to the specific requirements of our application, such a decrease will not cause a degradation in performance. In our design, the communication range between sensors is set to less than 2 km in the multi-hop scenarios (200, 600, and 1800 m). It is important to note that the limitation of the communication range to 2 km has affected the maximum hop range we can use in our architecture design. The maximum hop range we can reach is 11.
Having the communication range set to lower values—less than 2 km—results in a smaller transmission area. Thus, energy consumption and ToA will become lower. Consequently, the throughput will increase. Another favorable side effect of having a communication range set to lower values is increasing reliability and scalability in data transmission, since the number of sensors communicating with each other will decrease, hence decreasing collision and packet loss.
The effects of DE and EH will be described when presenting the analytical model in
Section 5.
5. The Proposed Linear Multi-Hop Analytical Model
This section introduces the mathematical models that were developed for estimating capacity, energy consumption, and throughput for single-hop and multi-hop LoRaWAN networks in pipeline monitoring scenarios. The network capacity is determined by the number of sensors distributed along the pipeline and the amount of data transmitted through the network. Subsequently, data traffic can be assessed by calculating the packets generated by the sensors. The inner distance between sensors is set to 200 m.
To assess the network capacity, the number of sensors in the coverage area as well as the achieved throughput were calculated. For the number of sensors, the following equation was used:
In a single-hop topology, the resulting number will be divided by 2e (considering Aloha access-scheme collisions). Equation (2) describes the throughput per sensor [
41,
46]. We applied the equations to fit pipeline scenarios for both single-hop and multi-hop topologies. The sensors were set up in various zones based on their distance from the GW (4 km, 6 km, 8 km, and 10 km). First, the throughput per sensor was calculated, and then the aggregation of the sensor’s throughput (TH) at each distance from the GW was calculated. Equation (3) was used for single-hop topologies, and Equation (4) was used for multi-hop cases:
where n is the total number of sensors at each distance from the GW, and the sample rate corresponds to the frequency of measurements (temperature and pressure sensors).
To estimate the energy consumption, it is essential to calculate the ToA [
11,
41], because the time required to transmit data packets affects energy consumption. To model the ToA, we used a set of equations that were applied in [
10,
39,
41,
46]. There are several alternative equations for calculating the ToA; however, we ought to select the most accurate one that produces exact results, such as the online LoRaWAN calculator. Equation (5) was used to identify the payload duration, and the preamble payload was given by Equation (6):
where PL is the payload,
DE is the low data optimization, DE = 0 if SF < 11, which means disabled, EH shows if the header is explicit, EH = 1 when it is not, and CR is the coding rate that has a value of 1–4, here CR = 1.
After that, we calculate the symbol rate (Rs) using Equation (7):
where the BW = 125 MHz, and SF = 7 for multi-hop scenarios.
In the end, the ToA can be calculated using the following equation:
For multi-hop topologies, the equation included all concurrent packet transmissions to fit the topology:
The energy consumption per sensor can be calculated using only the sending and receiving energy, as described in [
11,
40,
47]. Since the LoRaWAN configurations SF, BW, and TP affect the sensor energy, the equations were customized to include that. Thus, we incorporated the ToA into the equations. Equation (10) describes the energy consumption per sensor in a single-hop scenario, while Equation (11) describes the energy consumption in multi-hop scenarios:
where E
Rm is the energy cost of receiving, E
Sm is the energy cost of transmission, and N is the number of hops in communication.
LoRaWAN has different transmission power (TP) values, ranging from 2 dBm to 20 dBm, and we calculated the energy cost for each of them. Considering one day of transmissions and the two abovementioned sensor types,
Table 1 shows the energy costs. Based on this, we used 2 dBm in the proposed model to reduce the energy cost.
Finally, to identify the throughput limitation, we compute the maximum number of packets that can be transmitted (
Tpackets) [
11] using the ToA and the following equation:
where n is the number of channels, and d is the duty cycle, which is 1% (36 s per hour).
6. Model Result
In this section, we present the single- and multi-hop network scenarios and present and discuss the multi-hop LoRaWAN analytical model result.
To determine the performance of single-hop and multi-hop LoRaWAN networks, the analytical model was considered. In addition, it was also used to assess the performance of several multi-hop LoRaWAN network scenarios.
Consequently, two experiments were conducted, one to compare single-hop and multi-hop in terms of capacity, throughput, and energy consumption. The second experiment was to compare three different multi-hop scenarios using the same performance metrics. To conduct the experiments, we needed to determine the parameters of LoRaWAN specifications.
6.1. Single-Hop and Multi-Hop LoRaWAN
This section presents a comparison between the two topologies in terms of network capacity, throughput, and energy consumption. The experiments were conducted considering 10 km of the pipeline (similar to the GW coverage), 1 GW, and 50 devices. We assumed that each sensor sends 1 packet per hour with a payload of 20, 30, or 51 bytes and set the following parameter values: BW = 125 MHz, TP = 2 dBm, and CR = 1. The parameters are listed in
Table 2.
In the single-hop scenario, the number of sensors was determined using Equation (1), taking into account the star LoRaWAN limitation (the model mentioned in [
40]). Sensors are distributed in different zones; as we move away from the GW, the number of sensors decreases. To determine the actual number of sensors, divide the estimated number by 2e. This leads to varying transmission ranges. As a result, different SF values were used to transmit data (7, 8, 9, 11). Using different settings for SF results in different ToA and energy consumption values.
Since all devices were assumed to have the same transmitted range in the multi-hop scenario, there was no limitation in the single-hop scenario, so SF = 7 was used (refer to
Section 4). Data packets were assumed to be transmitted hop-by-hop to the GW. Various payloads were assessed to determine the optimal selection.
Results and Discussions
The following results were calculated using our analytical model for both single-hop and multi-hop scenarios.
Table 3 shows the capacity and throughput and also the maximum number of packets that can be transmitted according to the LoRaWAN duty cycle.
The results in
Table 3 show that the multi-hop scenario achieves more throughput compared to the single-hop, for example when the distance from the sensor to the GW is 6 km and the payload is 51 bytes, in a single-hop scenario the throughput is 21,504 bytes/h and the maximum packet rate transmitted is 97 packets/h, whereas in the multi-hop scenario, the throughput is 391,680 bytes/h and the packet rate is 7320 packets/h.
Figure 3 shows the generated packets per day in a single hop at different payloads (20, 30, 51 bytes). It is limited by GW coverage, as we discussed previously. The network has high generated data traffic when payload = 51 bytes.
Figure 4 shows a throughput comparison between single- and multi-hop scenarios (when the payload length is equal to 20 bytes). The multi-hop LoRaWAN monitoring network achieved more throughput than the single-hop network.
Considering the previous results, the multi-hop solution has more throughput than the single-hop by 38%; however, it increases the data traffic (leading to network congestion). Furthermore, in a single-hop network, the sensors are deployed non-uniformly (the zone close to GW has a larger number of sensors, and it decreases when we go far away). That affects scalability.
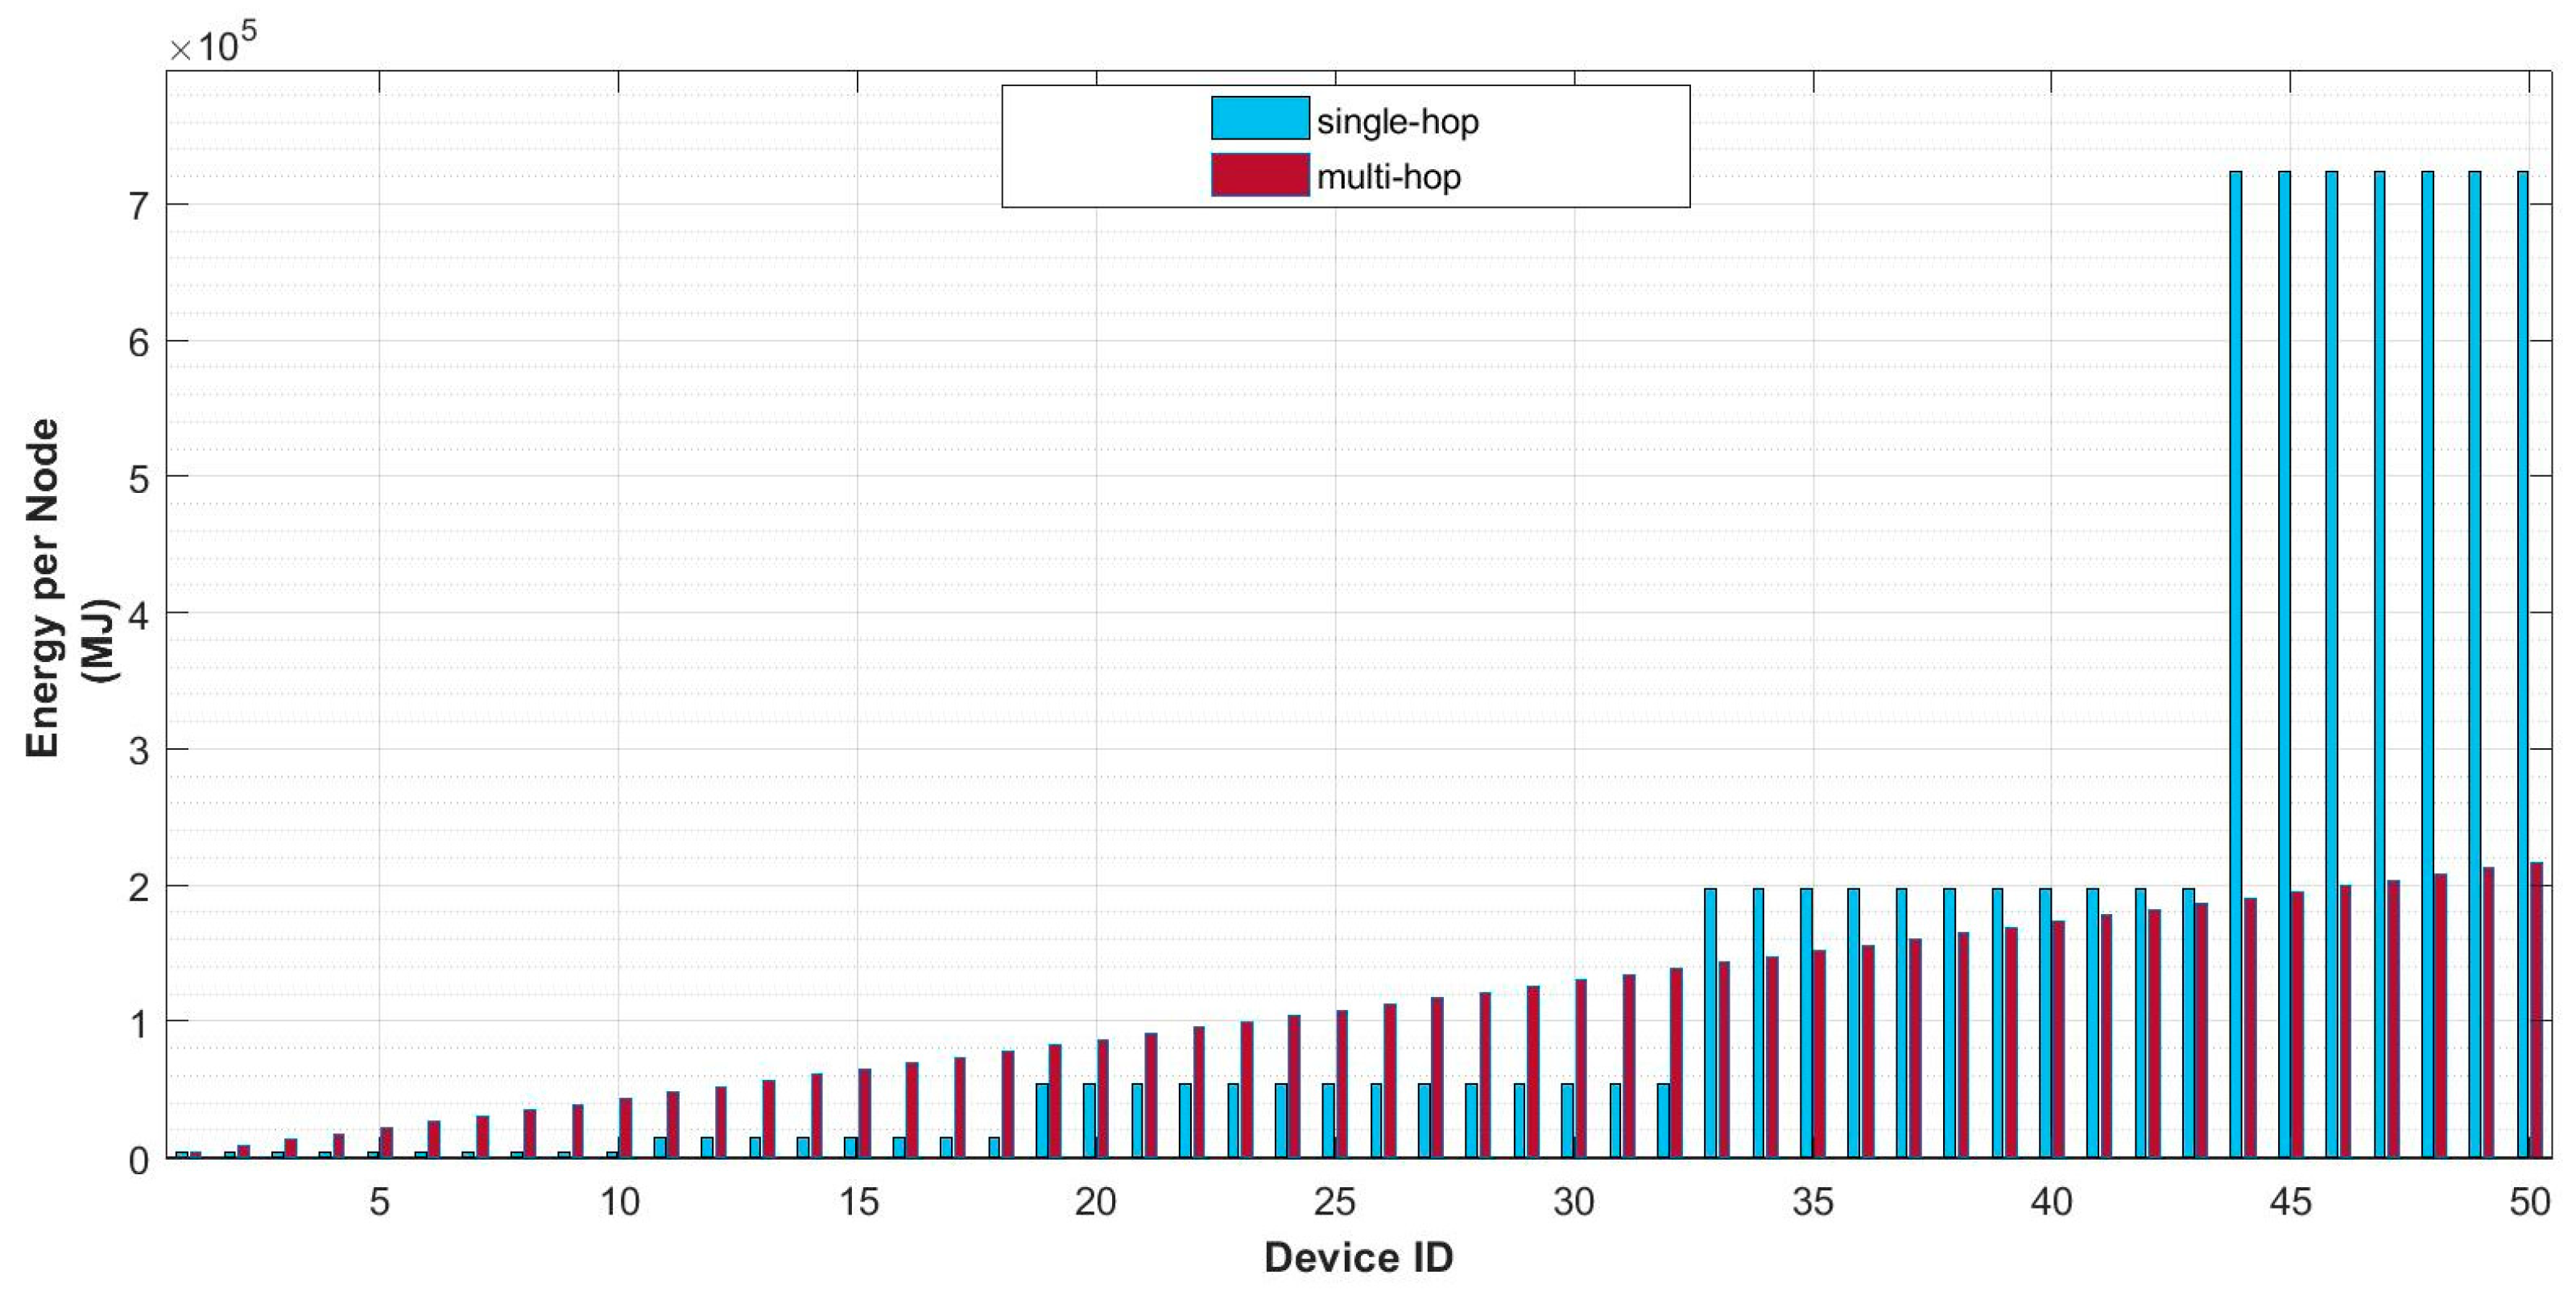
For energy-cost estimation, we computed the energy consumption per node in the single-hop and multi-hop for 1 day with a payload of 20 bytes. The LoRaWAN configurations for single-hop considered SF values equal to 7, 8, 9, 10, and 11, whereas for multi-hop scenarios, SF was considered to be equal to 7.
Figure 5 shows the energy consumption for both single- and multi-hop scenarios. It is observed that devices located farther away from the GW (devices 44–50 are the farthest devices from the GW) consume more energy in a single-hop scenario. That is because high SF is used to achieve a long communication range. Sensor 45, for example, consumes 55.5% more energy in the single-hop scenario than in the multi-hop scenario.
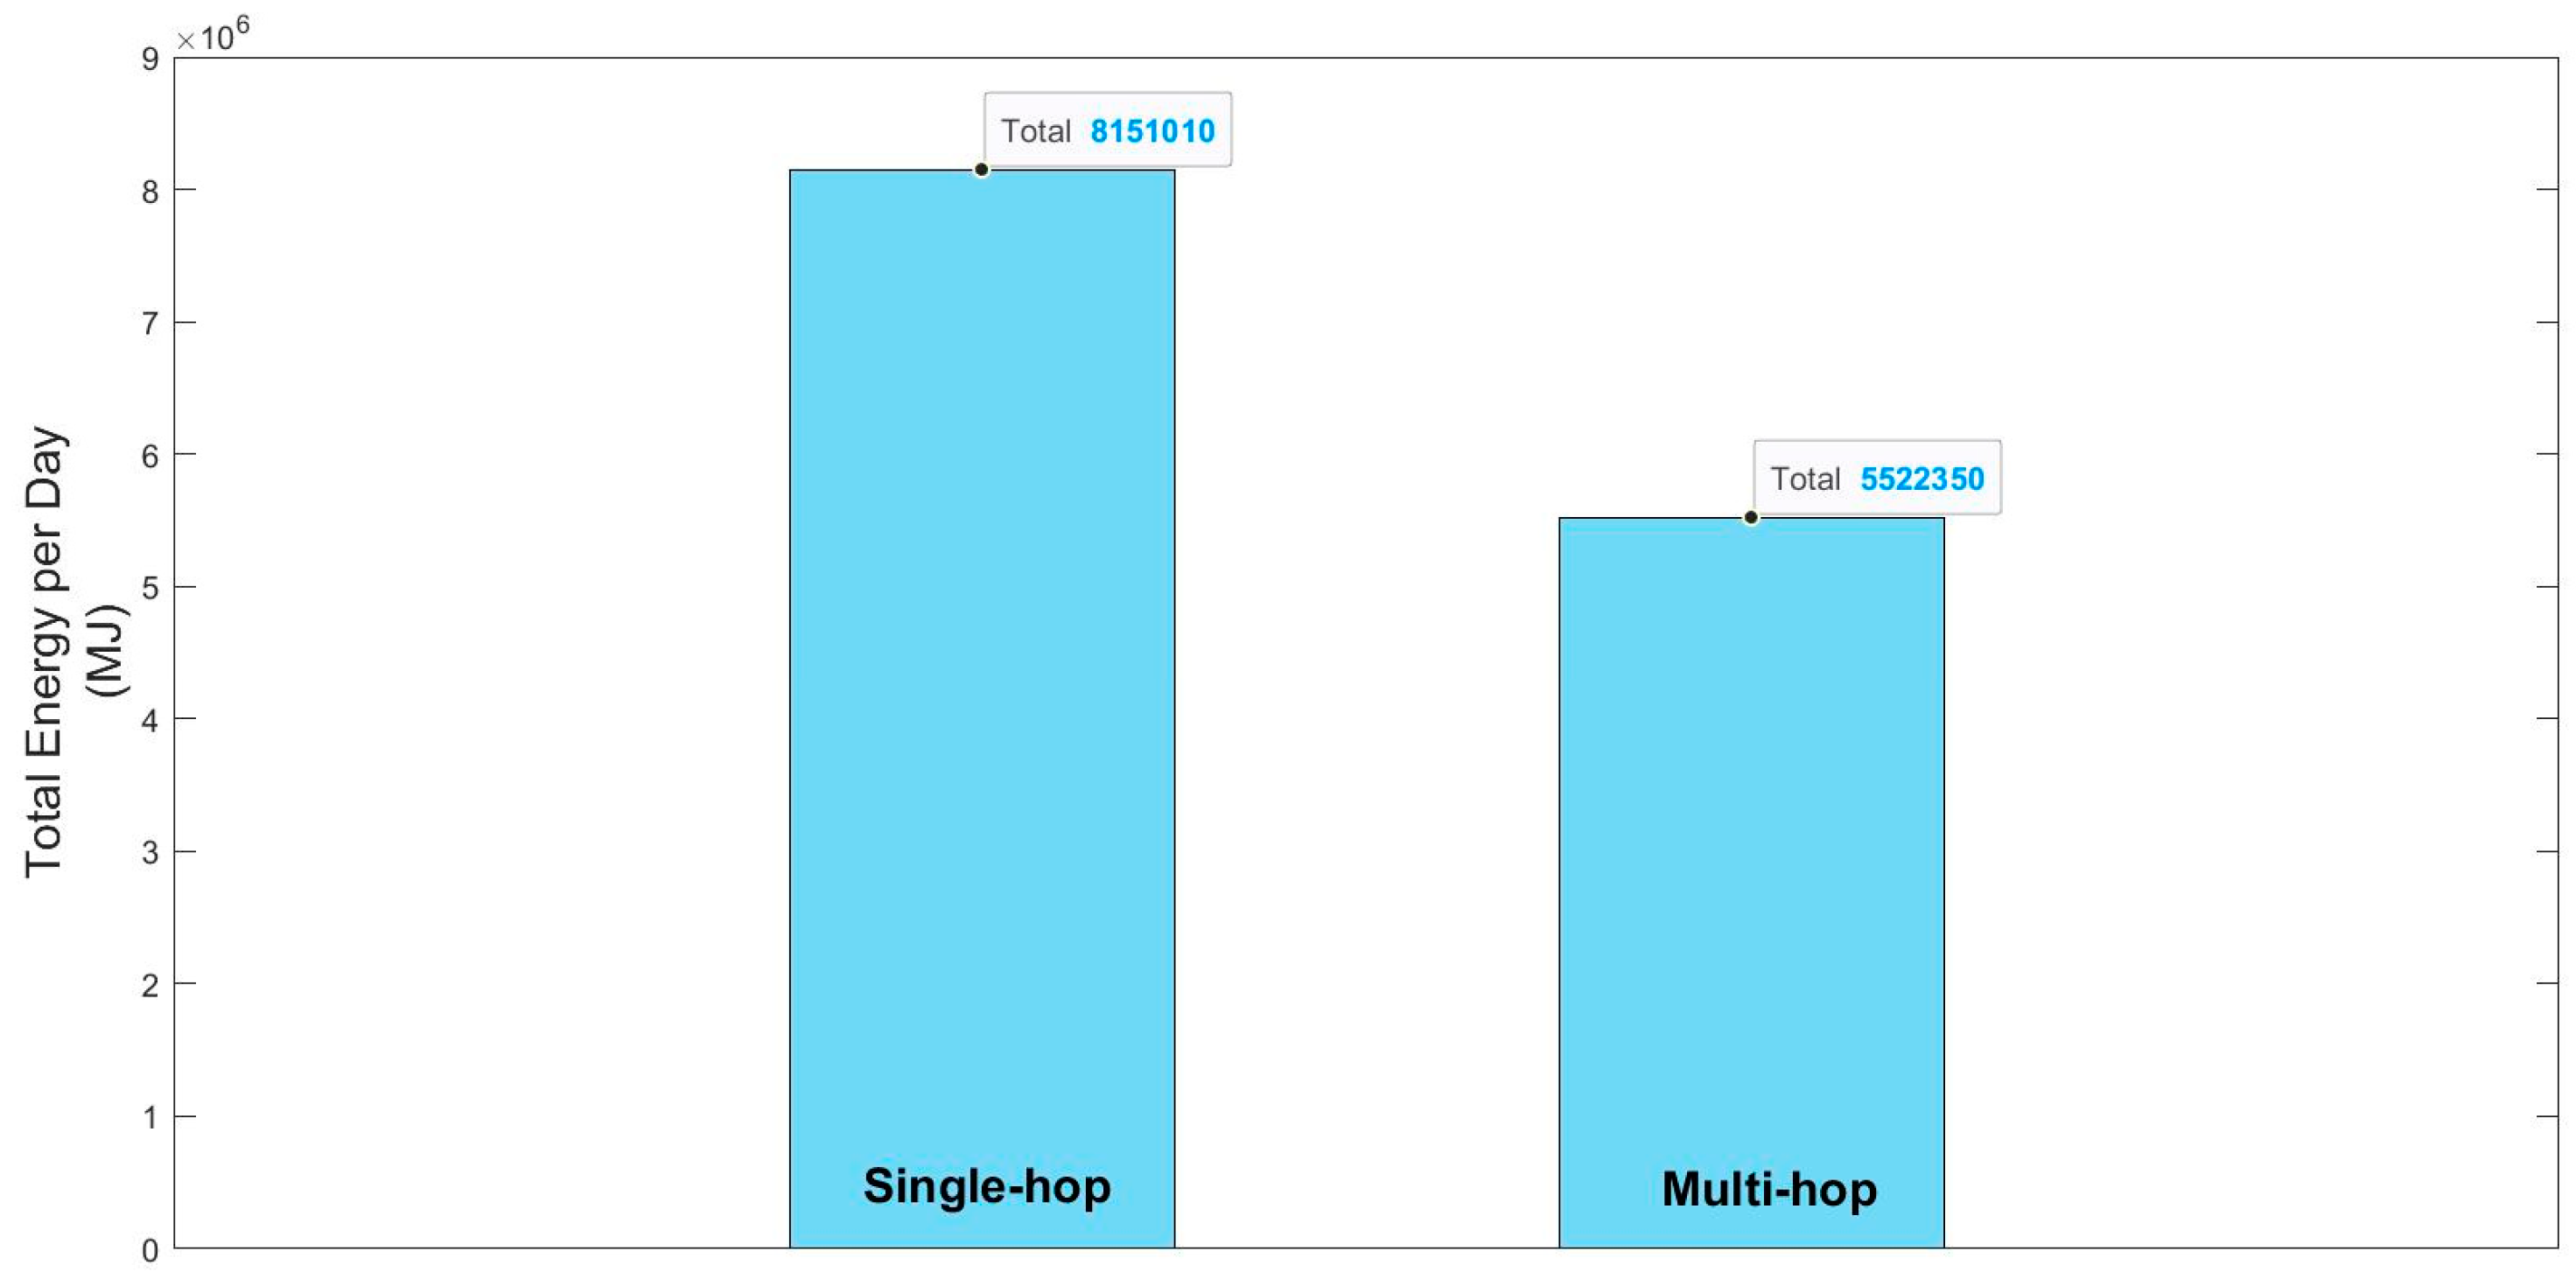
The results in
Figure 6 show the total energy consumption per node for 1 day. Since devices in single-hop use larger SF values (9, 10, 11) to increase the transmission range, the energy consumption is higher than that in the multi-hop scenario.
The multi-hop scenario has advantages as we go farther than the GW, as we observe in
Figure 5 and
Figure 6. That is because the sensors that are far away in the single-hop scenario have higher transmission ranges than in the multi-hop scenario. However, the result proves the benefits of setting SF to 7 in terms of energy consumption.
Based on the pipeline application requirements and our results, multi-hop topology offers less energy and extends the network coverage. However, single-hop shows better results in the network traffic.
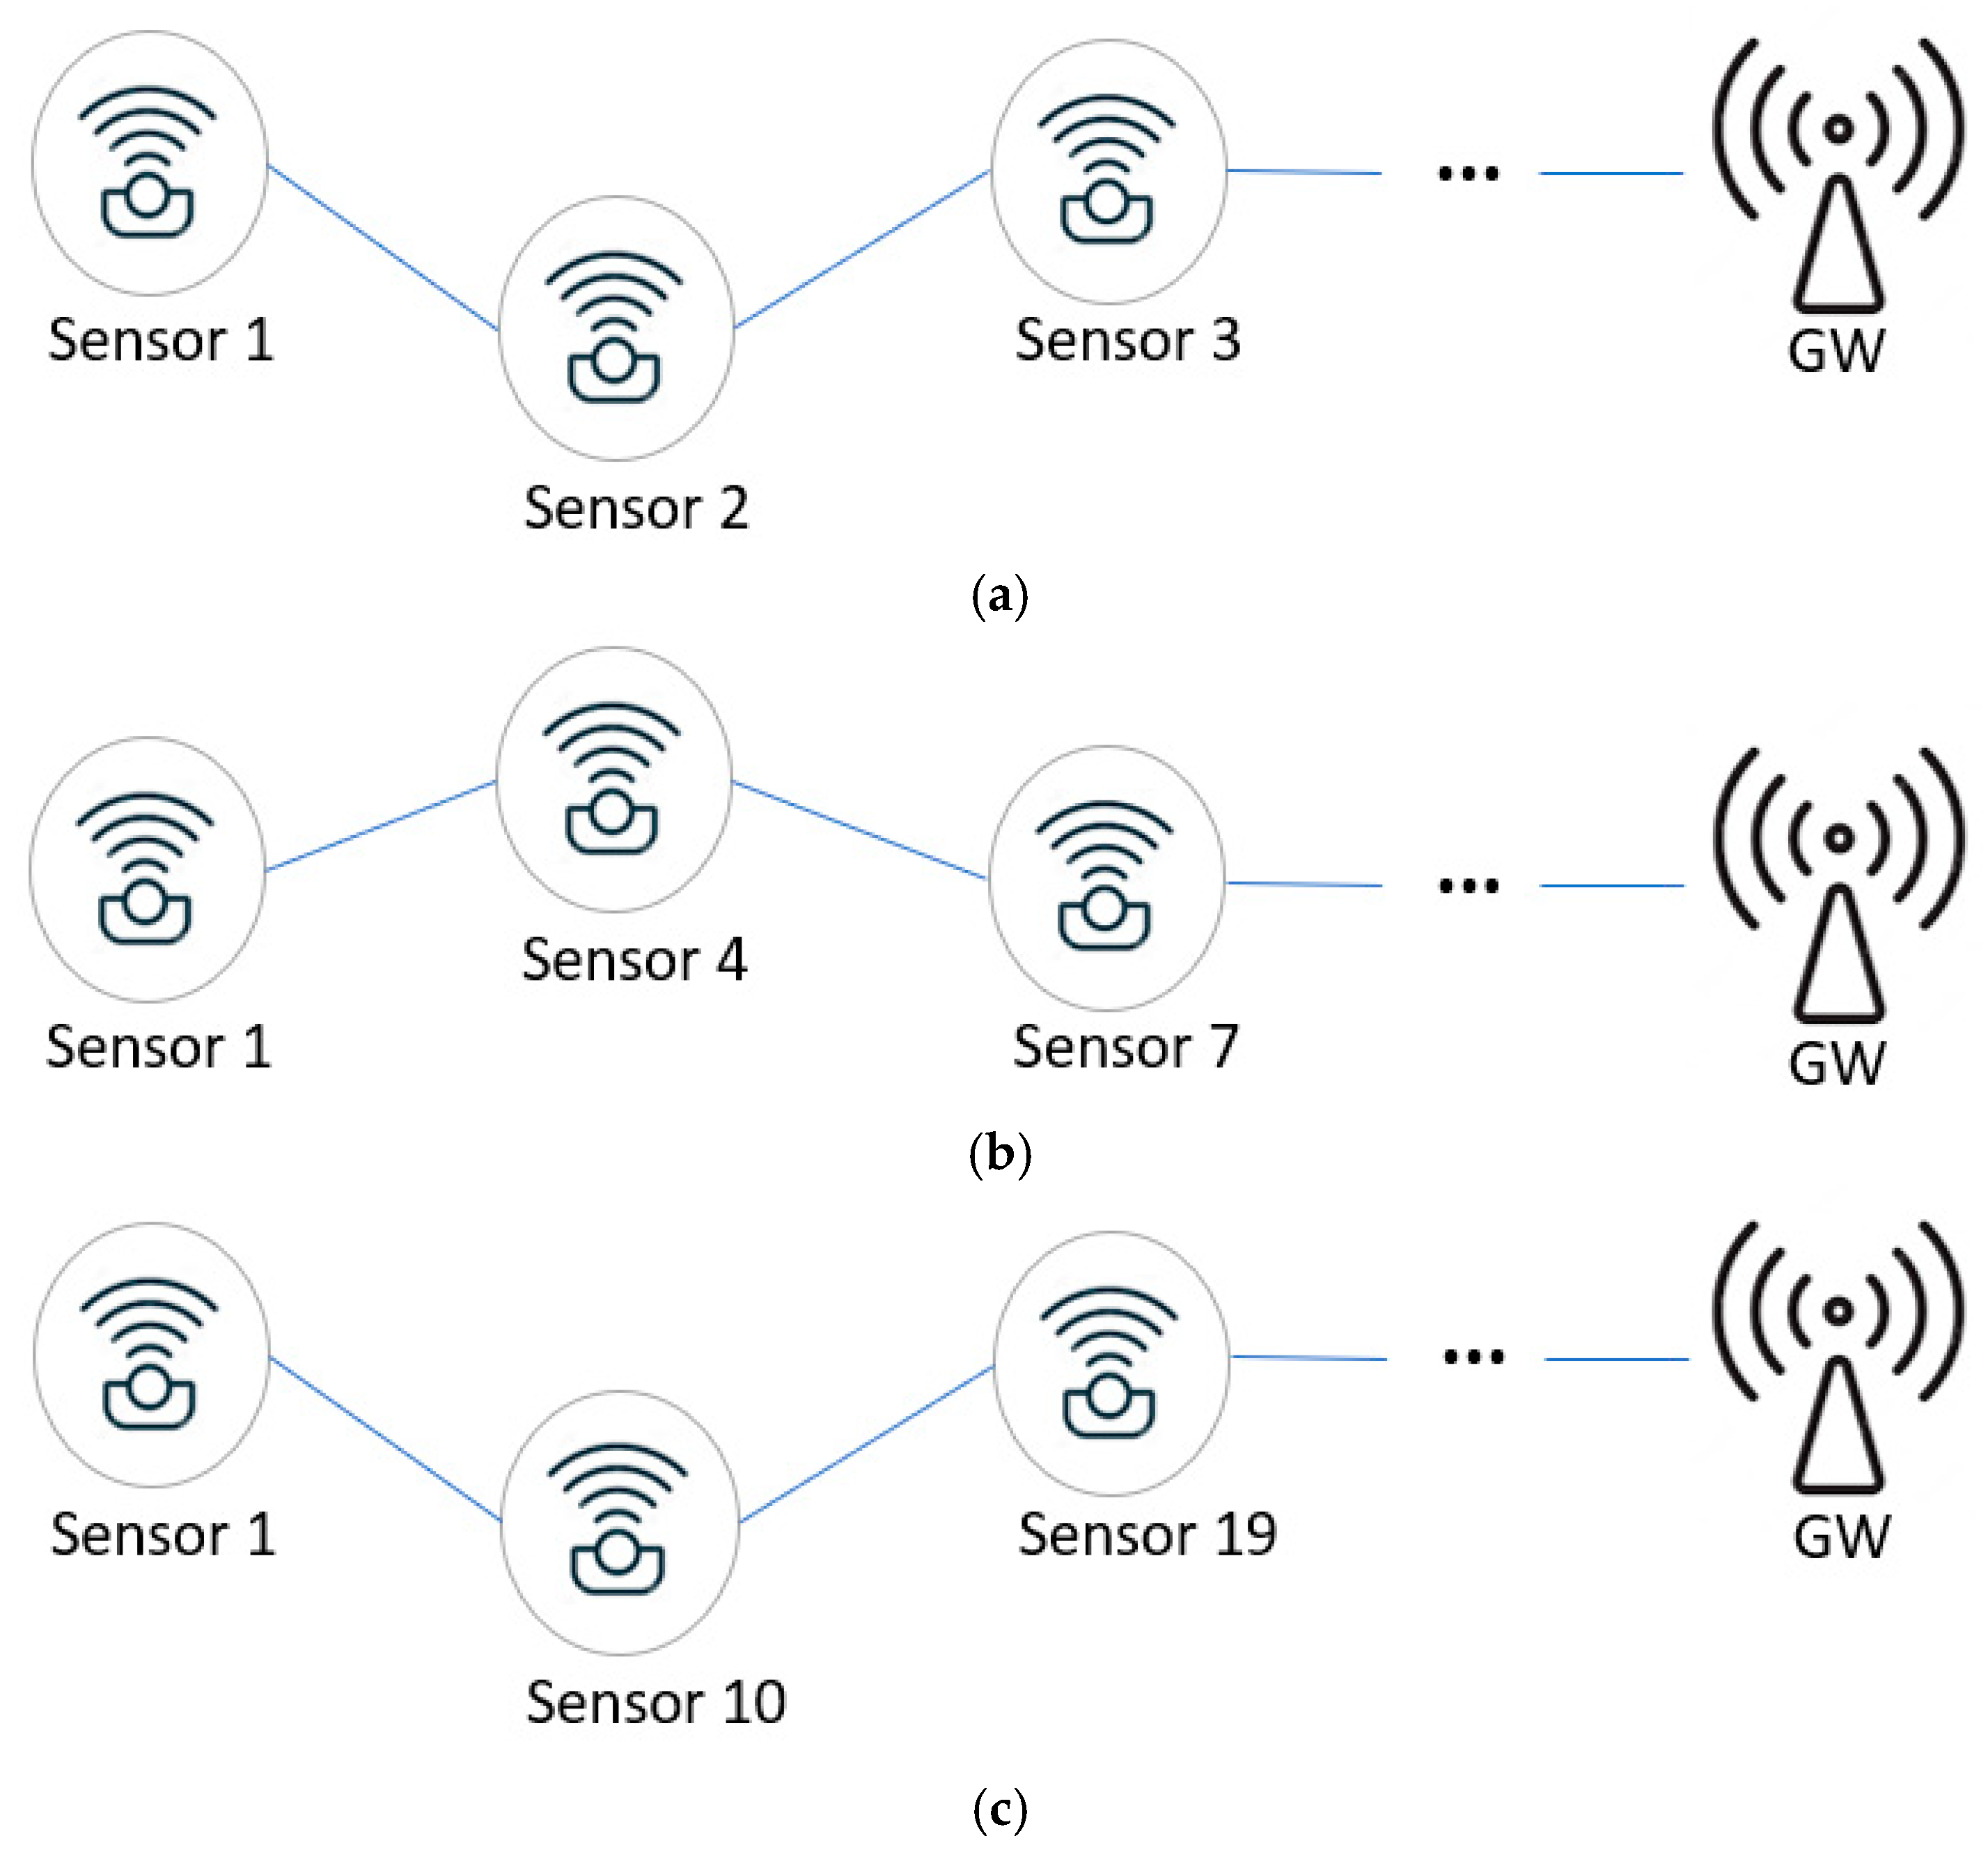
6.2. Multi-Hop LoRaWAN Scenarios
The following experiments estimate the capacity throughput and energy cost for temperature and pressure sensors; the sensors have different sample rates. Three multi-hop scenarios are used to evaluate the performance model. In these scenarios, the area length is set at 86 km, whereas it is set to 10 km in the multi-hop scenario described in
Section 4.1. Also, we have 443 devices. The three scenarios have different hop ranges. The first scenario is hop-by-hop, where all sensors cooperate in communication. In the other scenario, the number of sensors involved in communication is reduced. Packets were sent to the third neighbor in the second scenario, and to the ninth neighbor in the third.
Figure 7 shows the multi-hop scenarios.
We considered different sensor types involving temperature and pressure sensors (temperature sensor generating eight packets/day and pressure sensor generating 24 packets/day). The payload size varied between 20, 30, and 51 bytes, and the other parameter values that were considered were SF = 7, BW = 125 kHz, TP = 2 dBm, and CR = 1.
Table 4 shows the parameters of the scenarios. We used MATLAB to perform all evaluations. In the rest of this section, we will present the multi-hop LoRaWAN model results, showing the throughput and network capacity results and then the energy consumption results of both sensor types.
We first estimated the throughput of both types of sensors for various payload sizes and used these results to assess the data traffic and network congestion, then discussed the LoRaWAN throughput limitation. Finally, we estimated the energy consumption of both sensor types at different multi-hop scenarios. In our experiments, we computed the highest limit the throughput could reach (traffic limitation) by considering the capability of the LoRaWAN. Two aspects affect the capability: the maximum bit rate and the maximum transmitted packets (based on duty cycle and ToA).
Results and Discussions
The following throughput and energy consumption results were calculated using our analytical model for both sensor types and for each multi-hop scenario.
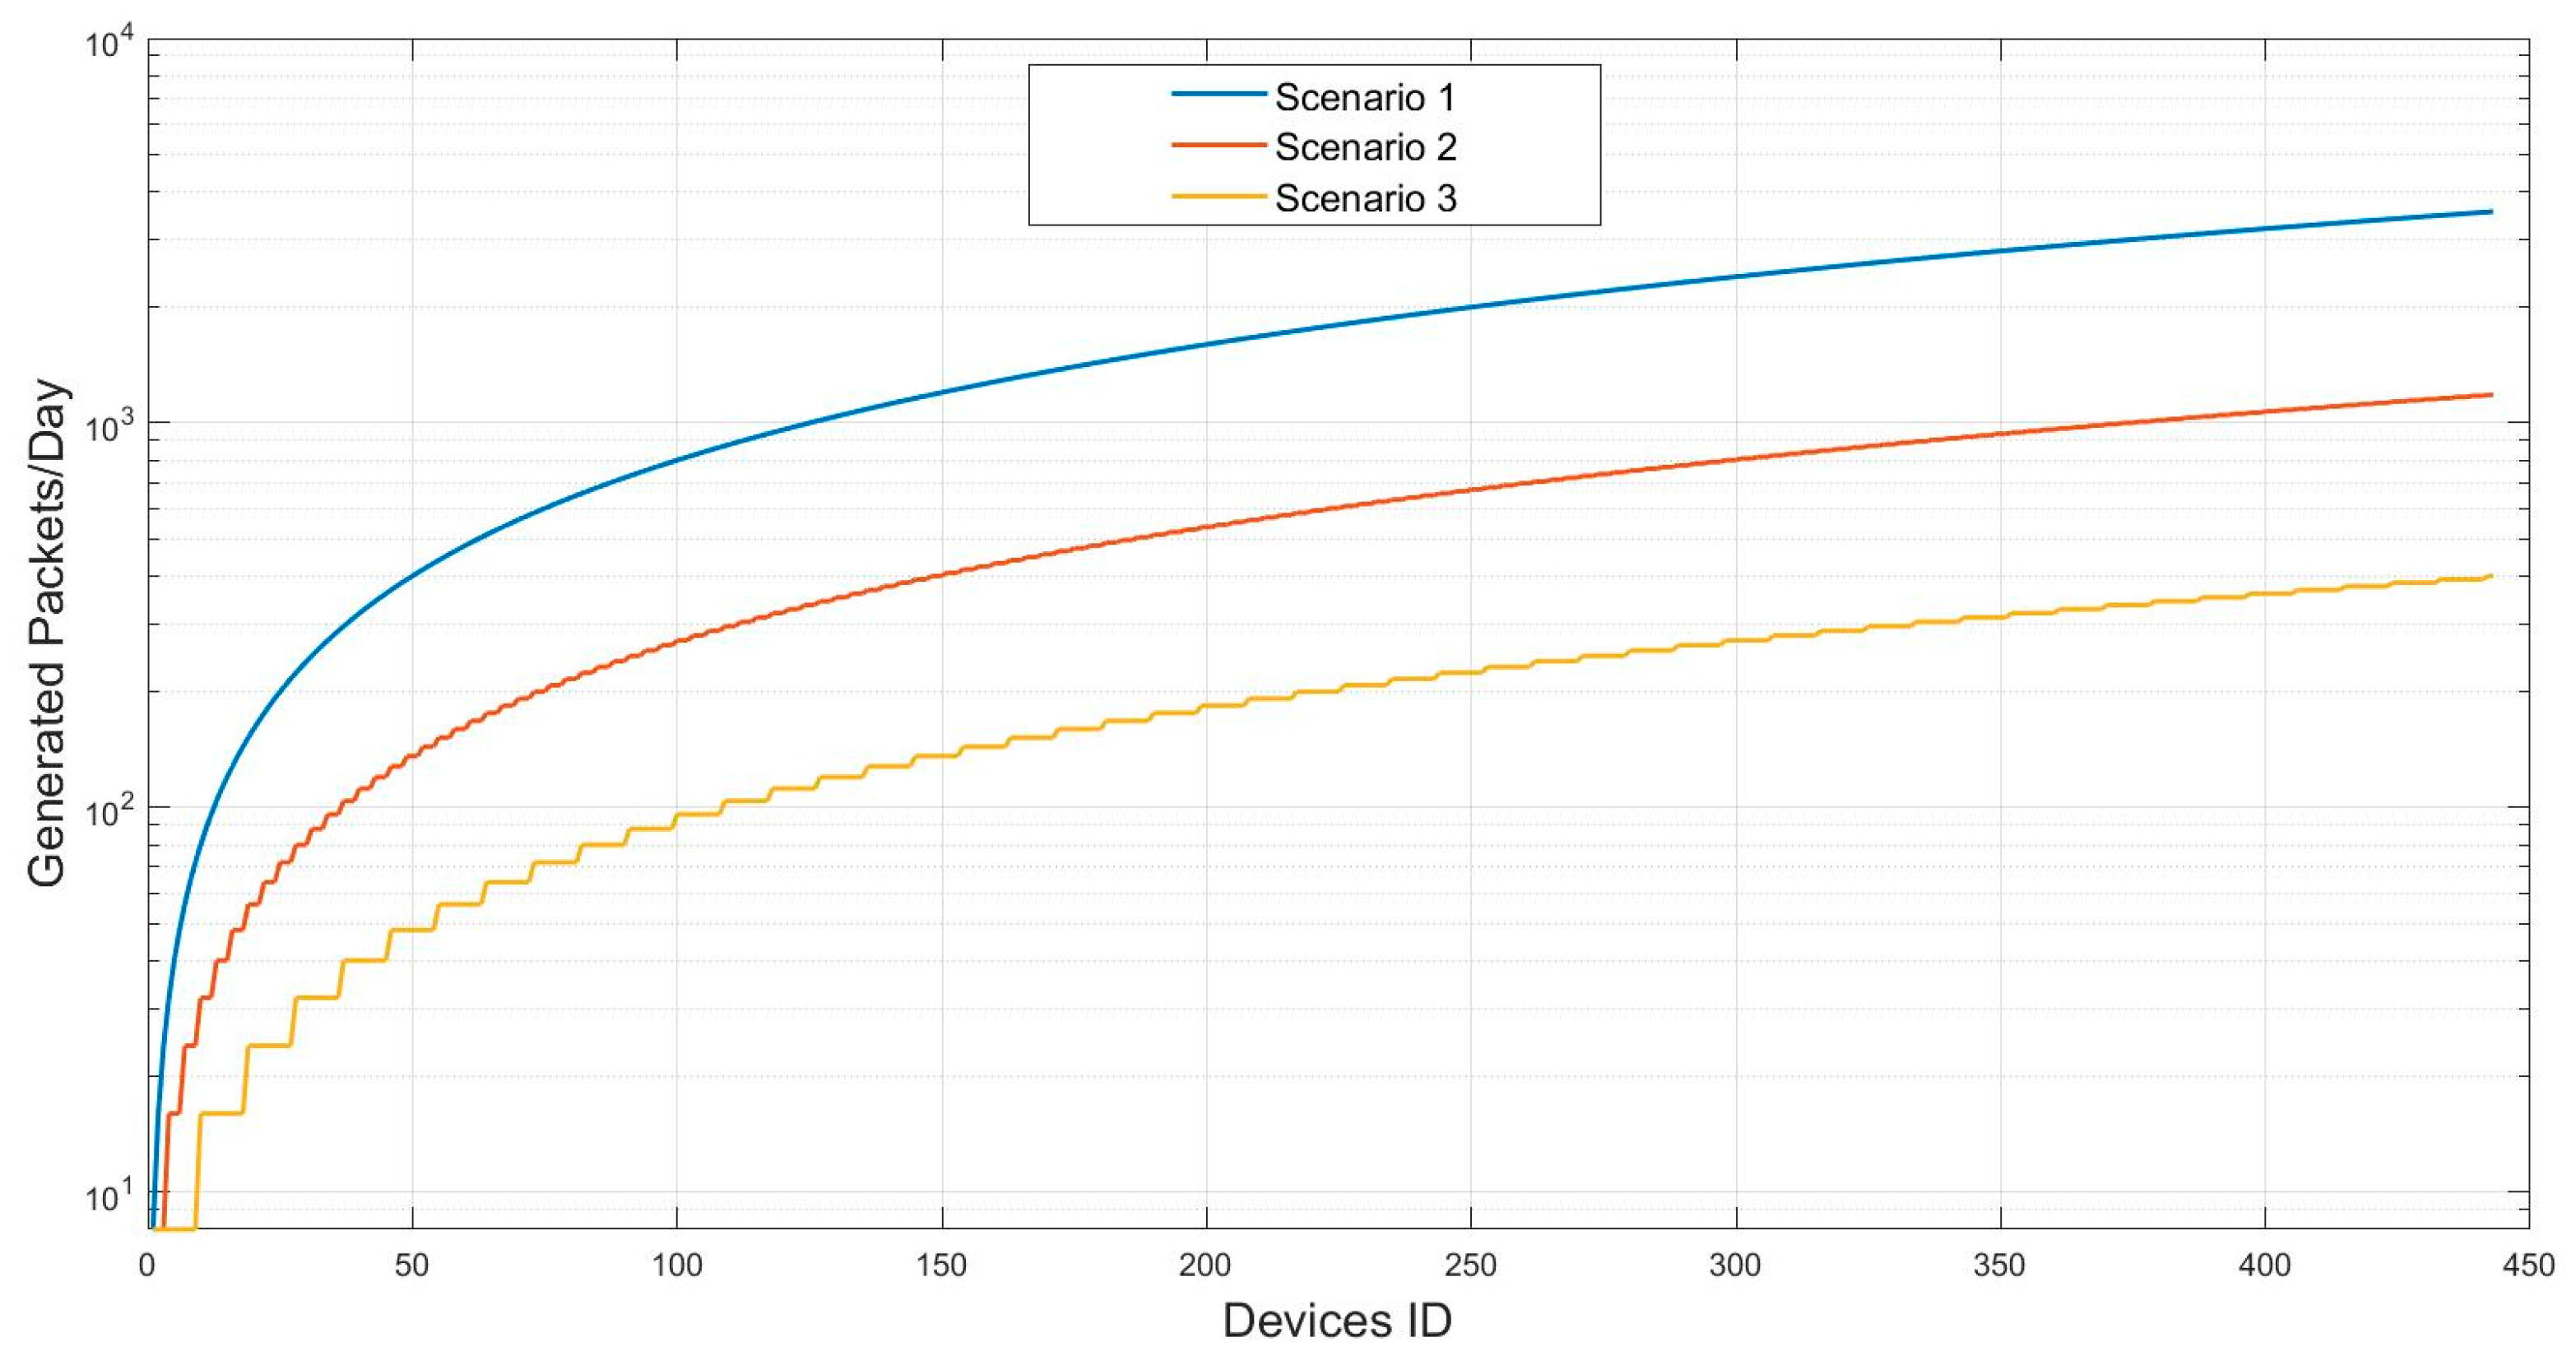
Figure 8 presents the analysis of the generated packets per day for temperature sensors via the sensor network according to multi-hop scenarios. For example, device 400 generates 3200 packets in the first scenario, 1072 packets in the second, and 360 packets in the third. Scenario 1 obtained the highest throughput compared to the other scenarios.
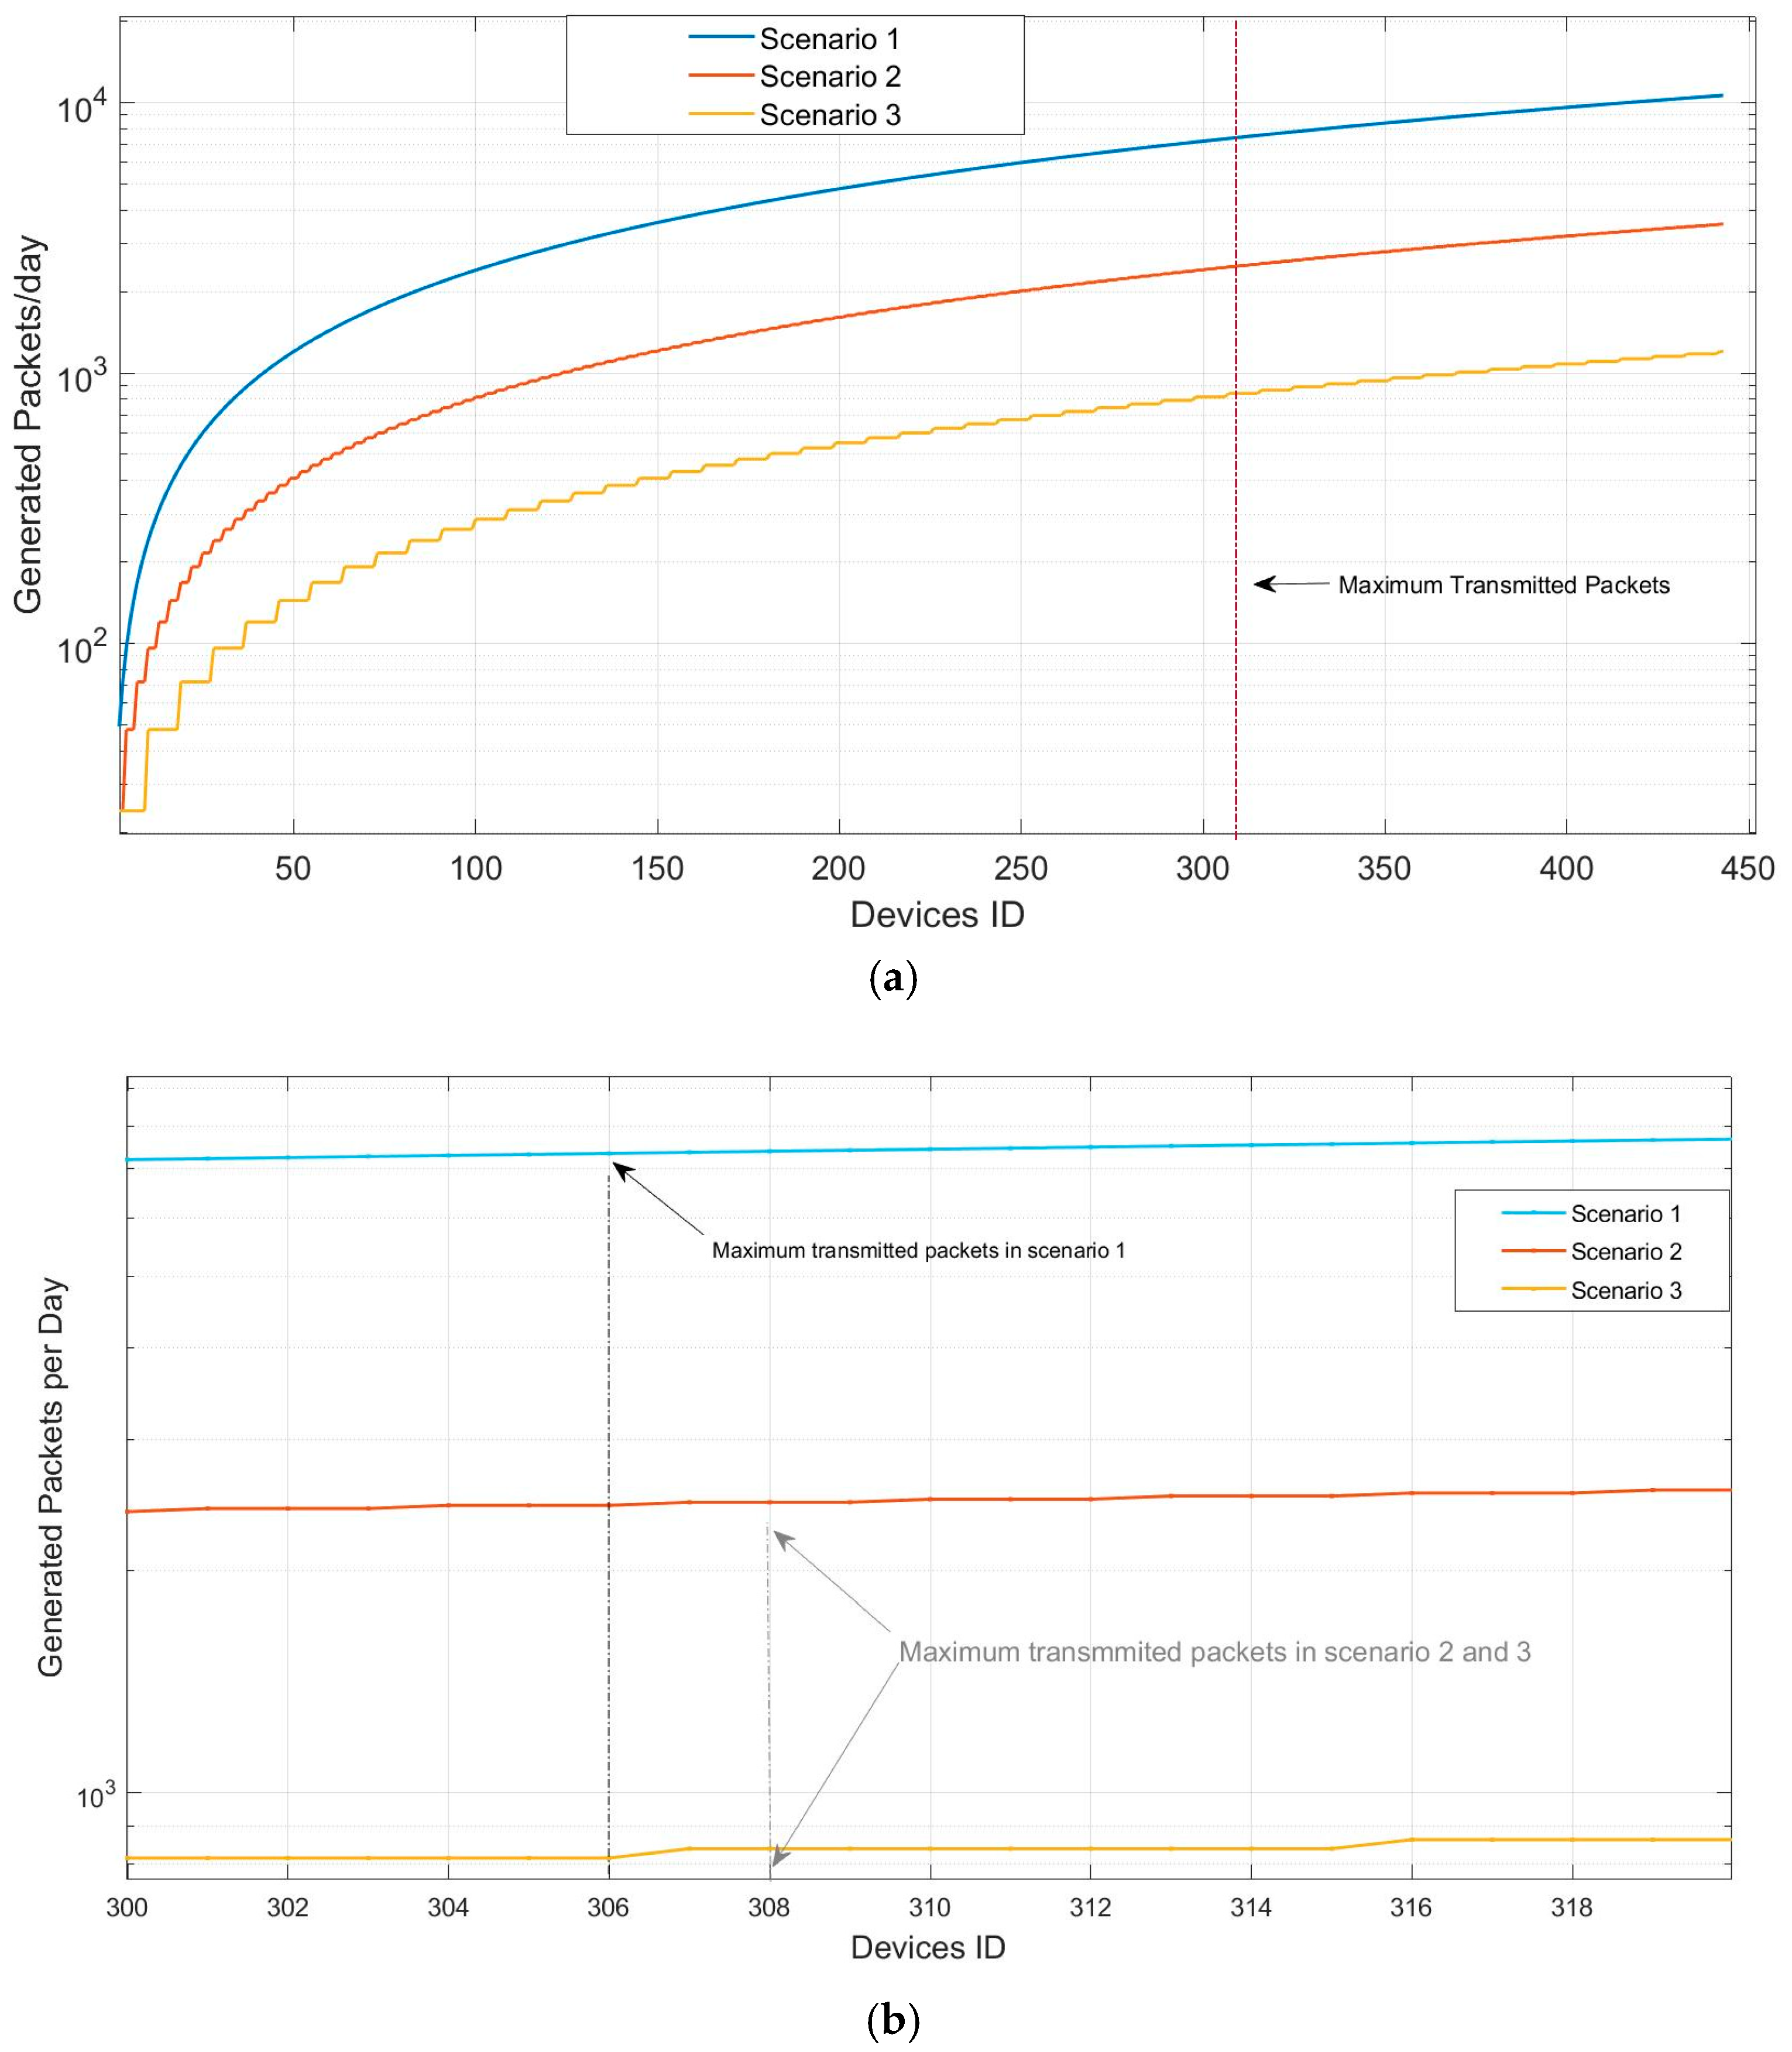
Figure 9a shows the maximum number of generated packets per day that the network can accommodate in the instance of a pressure sensor.
We computed the ToA to determine the maximum number of packets transmitted and the expected energy consumption. As we set the SF = 7 and BW = 125 kHz, the maximum bit rate that can be transmitted is 5470 bit/s, so the data traffic can be handled in all three scenarios and for both types of sensors. In order to determine the maximum number of packets that could be transmitted, we used Equation (12). When the payload is 51 bytes, ToA is equal to 118 ms, which results in a maximum packet rate equal to 305 packets/h. When the payload is 20 bytes, the ToA is decreased to 71.9 ms, so the maximum number of transmitted packets increases to 500 packets/h. For temperature sensors, there is no traffic limitation for the different payload sizes (20–30–51 bytes). The pressure sensors in the first scenario network exceed the limit at device 306, whereas the second and third achieve it at device 308, as shown in
Figure 9b.
Due to the higher sample rate of the pressure sensors compared to the temperature sensor, the payload size must be 20 bytes or less to avoid more throughput, as we see in
Figure 9. Thus, using a low payload size can solve the aforementioned issues in multi-hop scenarios and help avoid network congestion. Furthermore, that will allow the LoRaWAN network to accommodate more sensors.
In terms of energy consumption analysis, both transmitted and received energy were considered, as well as the number of bytes and LoRaWAN configurations (SF = 7, CR = 1, BW = 125 kHz, payload = 20 bytes). We tested various transmission powers and selected the best in energy consumption (TP = 2 dbm). When the TP and SF increase, the ToA increases, which means more energy is needed for transmission. Equation (11) was used.
Table 5 presents the energy test parameters.
Figure 10 and
Figure 11 show the energy consumption/bytes for two sensor types within three multi-hop scenarios. The test uses previous LoRaWAN configurations (packet size = 35 bytes (15 bytes header and 20 bytes payload), SF = 7, BW = 125 kHz, CR = 1, TP = 2 dbm) and tests the energy of 50 devices. In the temperature sensor, the energy is high in the first scenario and lower in the third. For example, device 40 consumes 800 MJ in the first scenario and approximately 100 MJ in the third scenario. This means that the devices use more energy to cooperate in communication and send packets. Also, the energy consumption results show that pressure sensors demand more energy than temperature sensors. The second scenario decreased the transmission energy consumption by 44%, while the third scenario decreased it by 59%. We can conclude that the network architecture and the coordination of data transmission have a great impact on energy consumption.
The hop ranges affect the performance metrics like throughput and energy consumption. The first scenario achieved more throughput than the others; however, that increased data traffic by 38%. Energy consumption was lower by 44% in the second scenario and 59% in the third.
As
Figure 9b shows, setting the payload to 51 bytes achieved higher throughput; however, it exceeded the traffic limit and could not accommodate all sensors. To solve that, the number of sensors must be decreased. When payload = 20 bytes, the network could accommodate more sensors, which increased the scalability. Additionally, packets with larger sizes consumed more energy. Because our case study has medium traffic demand and energy consumption is a priority, setting the payload to 20 bytes fits our network requirements.
To summarize, when throughput increases, more energy will be consumed. So, we applied a low transmission range by using low transmission power to minimize interference as well as energy consumption. Our proposed system can enhance the coverage and control the balance between energy consumption and throughput. To get the optimum results, the LoRaWAN parameters were set to SF = 7, CR = 1, BW = 125 kHz, payload = 20 bytes, and TP pow = 2 dbm. These are suitable if we have a network with medium traffic requirements.
7. Conclusions and Future Work
This paper discussed multi-hop LoRaWAN networks as solutions for pipeline networks’ monitoring systems. The focus was to design a linear multi-hop sensor network based on LoRa technology. Also, the paper presented existing multi-hop LoRaWAN systems and defined the limitations in terms of network throughput depending on the volume of data traffic that is generated by the sensors and energy consumption.
We defined the network capacity in terms of the number of sensors of different types and the total throughput. We evaluated the multi-hop LoRaWAN network performance using an analytical model that considered different multi-hop communication scenarios.
The analytical model evaluation for the multi-hop LoRaWAN monitoring system included network capacity, energy, and throughput. The results showed that the multi-hop solution increased the throughput by 38% compared to single-hop LoRaWAN. In terms of energy consumption, we observed that the second multi-hop scenario improved energy by 44% and the third scenario by 59%. The tradeoff was that enhancing energy consumption decreased the network throughput. When we have a large-scale network, such as an oil pipeline with medium traffic load requirements, multi-hop will be an efficient solution with low deployment costs, and the best multi-hop LoRaWAN network configurations require small SF, payload size, and low transmission power. Reducing the transmission range via selecting small SF and TP results in decreases in the total energy costs and packet collisions due to interference.
In future work, we will consider different configurations for relay sensors, which will allow us to accommodate more devices and decrease collisions, in combination with the use of various intermediate GWs, and we will also study synchronization protocols to achieve better throughput by minimizing packet collisions.


