Article

Research on Intrusion Detection Based on an Enhanced Random Forest Algorithm

1
School of Resource Engineering, Xi’an University of Architecture and Technology, Xi’an 710055, China
2
Key Laboratory of Intelligent Industry Perception Computer and Decision Making, Xi’an University of Architecture and Technology, Xi’an 710055, China
3
School of Electrical and Control Engineering, Shaanxi University of Science and Technology, Xi’an 710021, China
*
Author to whom correspondence should be addressed.
Appl. Sci. 2024, 14(2), 714; https://doi.org/10.3390/app14020714
Submission received: 23 December 2023 / Revised: 8 January 2024 / Accepted: 9 January 2024 / Published: 15 January 2024

Abstract

:
To address the challenges posed by high data dimensionality and class imbalance during intrusion detection, which result in increased computational complexity, resource consumption, and reduced classification accuracy, this paper presents an intrusion-detection algorithm based on an improved Random Forest approach. The algorithm employs the Bald Eagle Search (BES) optimization technique to fine-tune the Kernel Principal Component Analysis (KPCA) algorithm, enabling optimized dimensionality reduction. The processed data are then fed into a cost-sensitive Random Forest classifier for training, with subsequent model validation conducted on the reduced-dimension data. Experimental results demonstrate that compared to traditional Random Forest algorithms, the proposed method reduces the training time by 11.32 s and achieves a 5.59% increase in classification accuracy, an 11.7% improvement in specificity, and a 0.0558 increase in the G-mean value. These findings underscore the promising application potential and performance of this approach in the field of network intrusion detection.

1. Introduction

With the increasing risks in network security, the implementation of effective intrusion-detection mechanisms has become a crucial strategy for safeguarding computer systems and network security [1,2,3,4]. Traditional intrusion-detection methods heavily rely on known attack patterns and behaviors, acquired through expert knowledge or historical data. Consequently, their effectiveness in detecting new and unknown attack methods is limited [5,6]. In addressing this issue, decision tree algorithms [7], in the form of attribute splitting, have improved the efficiency of intrusion detection by classifying network behaviors and determining their involvement in the intrusion process. However, these methods often neglect the aspect of detection accuracy. Support Vector Machines, on the other hand, excel in intrusion detection with superior accuracy and classification efficiency when dealing with a limited-data experience. However, they face significant challenges in encoding and normalizing data, particularly with the emergence of novel unknown attack methods, making them less suitable for the evolving landscape of information technology [8]. K-means clustering, known for its speed and interpretability, has also found its place in intrusion detection. It excels in grouping similar instances into subsets for intrusion determination. However, it exhibits sensitivity to outliers and the difficulty of determining the optimal K value [9].
Currently, with the development of new information technologies, such as the Internet of Things, cloud computing, and big data, the issue of information security is increasingly emphasized. In order to guarantee the security of data, a large number of models for classification and avoidance, facilitated by focusing on the behavior of different nodes, have been generated, such as the Enhanced Random Forest Classifier (ERF-KMC) with the K-mean clustering algorithm, which helps to accurately classify the attacks so that the system can more accurately block the attacking information and protect the security of the information [10], and the Improvement of Mutant Bald Eagle Search (IMBES) optimizer optimization of the Kernel Extreme Learning Machine (KELM) model, which predicts data information as points and analyzes parameter confidence intervals through point density metrics as system security intervals and reduces the interference caused by errors [11]; encrypting traditional standard protocols through elliptic curve encryption technology, which guarantees the network and data security while meeting the network time constraints, is also a way to solve the problem [12]. And the intrusion-detection mechanism as the second security protection mechanism, through the real-time monitoring of the network, can ensure the security of network resources at the same time but also effectively reduces the losses caused by network attacks. In contrast, the Random Forest algorithm stands out as a favorable approach in the field of intrusion detection and has seen extensive exploration and applications [13,14]. As research has progressed, the literature [15,16,17,18] has compared various datasets commonly used in intrusion detection, revealing their complex high-dimensional nature and the imbalance between positive and negative classes. These characteristics can lead to lower detection rates for certain classes. Nevertheless, the Random Forest algorithm, when dealing with large datasets, demands the construction of multiple decision trees and ensemble integration. When computational resources are limited, this can result in excessive resource consumption and reduced computational efficiency. Additionally, when high-dimensional sparse data serve as the input to the classification algorithm, the similarity between data samples becomes pronounced, making it challenging to identify effective split points. Furthermore, the Random Forest employs Gini impurity [19] in node splitting, which tends to favor majority classes in imbalanced datasets, resulting in poor classification performance for minority classes.
To address the challenges posed by high-dimensional data and class imbalance in the Random Forest algorithm, researchers have primarily focused on two approaches: data dimensionality reduction and feature selection. To improve classification accuracy when facing imbalanced datasets, efforts have been made at the data, algorithm, and decision levels. When dealing with high-dimensional datasets, the literature [20,21,22,23] has employed feature selection methods to reduce dataset dimensionality by selecting the most relevant features. However, this approach may inadvertently remove some useful features, potentially leading to the loss of inter-feature relationships. The literature [24] has explored the combination of Principal Component Analysis (PCA) and Linear Discriminant Analysis (LDA), mapping the original feature set into a lower-dimensional space and subsequently applying the reduced data to classifier training, offering a direction for data dimensionality reduction in intrusion-detection scenarios. Moreover, to address the issue of classification results leaning toward majority classes due to a class imbalance, the literature [25] has combined adaptive oversampling, undersampling clustering algorithms, and Gaussian mixture models at the data level and applied them to preprocess the original dataset for classification decision-making. While sampling methods hold advantages in handling imbalanced datasets, strategies that modify data distributions may affect subsequent model construction and hinder the effective extraction of underlying relationships between data. The literature [26] has proposed improvements at the algorithm level by embedding cost information into the model, obtaining cost-sensitive information through expected loss minimization, and applying it to both binary and multi-class classification scenarios, demonstrating superior performance in classification problems. The literature [27,28] has addressed the issue at the decision level by adjusting classifier decision thresholds, shifting them towards the majority class to reduce the probability of misclassifying minority classes, and effectively mitigating class imbalance.
Traditional Random Forest algorithms applied to intrusion detection suffer from excessive computational costs, low classification accuracy, and a tendency to favor minority class results. The current research indicates that to address these issues, optimizing the Random Forest algorithm should consider three key aspects: data dimensionality reduction, algorithm enhancement, and decision evaluation. Therefore, this paper proposes a Random Forest classification model designed for handling high-dimensional and class-imbalanced data. The aim is to address the limitations in network-intrusion detection research, ensuring the security and integrity of computer networks.

2. Research Method

2.1. Data-Level Improvement

Intrusion detection involves the identification of unauthorized activities [29]. It entails the collection and analysis of network behavior, security logs, audits, data, information available on other networks, and critical information from various points within a computer system. The goal is to inspect whether there are indications of security policy violations or signs of attacks within a network or system. Intrusion detection, as an actively proactive security technique, offers real-time protection against internal and external attacks, as well as accidental mishaps. It intercepts and responds to intrusions before they can harm a network, and thus, it is considered the second line of defense after firewalls. It accomplishes this without significantly affecting network performance, making it suitable for continuous network monitoring [30].

2.2. The Random Forest Algorithm

The Random Forest Algorithm is an ensemble learning method that models large-scale ensembles by combining multiple independent decision trees. The principle lies in combining multiple decision trees together, with the dataset randomly having put back selected each time, while randomly selecting some of the features as input; therefore, the Random Forest Algorithm can also be regarded as a Bagging (1) algorithm with a decision tree as an estimator [31]. Each decision tree is trained on a randomly sampled subset of training data. Ultimately, the classification decision is made by a voting mechanism among the decision trees [32]. The specific construction process is as follows:
(1) Sample selection: Select randomly from the original data set using Bootstrap sampling to form N independent data subsets D N   n = 1 , 2 , , N
(2) Feature selection: M features are randomly selected from m features.
(3) Decision tree construction: Build a decision tree according to the samples of the data set. At each node, the best partition feature is selected according to Gini impurity.
Gini ( t ) = 1 i = 1 c p ( i | t ) 2
Integrated prediction: For a new sample, a majority vote is conducted through the prediction results of each decision tree to finally determine the classification result of the sample.
In the context of intrusion detection, applying the Random Forest method can be challenging due to high-dimensional data in the dataset and class imbalance, which leads to suboptimal performance in metrics, such as classification accuracy. Furthermore, the algorithm’s classification performance is heavily dependent on two factors: the accuracy of individual decision trees and the bias in the voting results among multiple decision trees. Therefore, to enhance the overall performance of Random Forest in intrusion detection, we are considering the integration of data dimensionality reduction algorithms and cost-sensitive learning methods. The critical steps and improvement strategies are depicted in Figure 1.
This paper addresses the enhancement of the Random Forest algorithm from three key perspectives:
Data Dimensionality Reduction for Classifier Input: in the first aspect, we focus on reducing the dimensionality of the data fed into the classifier.
Construction of Cost-Sensitive Base Classifiers: The second aspect involves the creation of cost-sensitive base classifiers.
Weighted Majority Voting at the Decision Stage: In the third aspect, we introduce weighted majority voting techniques at both the leaf nodes of decision trees and the ensemble decision stage. These improvements collectively aim to elevate the performance and effectiveness of the Random Forest algorithm in the context of intrusion detection.

3. Cost-Sensitive Random Forest Algorithm

3.1. Introduction to Intrusion Detection

The redundancy and high-dimensionality of intrusion-detection datasets can significantly impact classification algorithms. On one hand, high-dimensional datasets increase the computational complexity of classifiers and consume more storage resources. On the other hand, redundant features reduce model usability and may introduce noise and unnecessary information, affecting the classification performance.
To mitigate the adverse effects of high-dimensional data, we introduce the Kernel Principal Component Analysis (KPCA) algorithm [33]. This approach maps the original dataset’s samples to a higher-dimensional space and then projects and reduces the high-dimensional sample data while maximizing the variance in the projected data. This results in a reduction in data dimensions and the removal of redundant information. The working principle is as follows:
Let each column in the sample be x i , the sample set is X = x 1 , x 2 , , x N . Now use a nonlinear map ϕ of vector x i in X to a higher dimensional space τ (recorded as the D dimension), obtain the D × N new matrix for A ϕ X = φ ( x 1 ) , φ ( x 2 ) , , φ ( x n ) deduces that the covariance matrix in τ against ϕ X is as follows:
C τ = 1 N ϕ ( X ) [ ϕ ( X ) ] T = 1 N i = 1 N φ ( x i ) [ φ ( x i ) ] T
The eigenvalues for solving the covariance matrix are as follows:
C τ p = λ p
where the D -dimensional column vector p is the weight vector of the feature space, which can be expressed as a linear combination of φ ( x i ) , namely
p = i = 1 N a i φ ( x i ) =   ϕ ( X ) a
By defining the matrix K = ϕ ( X ) T ϕ ( X ) , you can solve for non-zero eigenvalues:
K a = λ a
While the KPCA algorithm demonstrates advantages in handling non-linear relationships and complex data structures, it also has certain limitations. The algorithm’s kernel function parameters need to be adjusted according to the data’s characteristics, and different parameter choices can result in varying dimensionality reduction outcomes. To address this, we integrate the Bald Eagle Search (BES) optimization algorithm [34], which effectively explores the solution space, reduces the reliance on initial conditions, and completes parameter optimization for KPCA. The utilization of the BES algorithm for optimizing the KPCA involves the following six steps:
(1) Initialize the algorithm parameters, and initialize the number of condor population n p o p , the number of algorithm iterations M a x l t , and the fitness function f o b j .
B e s t S o l . cos t = inf
(2) Objective function evaluation to calculate the fitness of each individual’s current position.
p o p . cos t ( i ) = f o b j ( p o p . p o s ( i , : ) )
(3) Select the search space, randomly select the search area, and determine the optimal search position as P i , n e w .
P i , n e w = P b e s t α r a n d ( P m e a n P i )
(4) Search for space prey, find the best dive position, update the condor position.
P i , n e w = P i + x ( i ) ( P i P m e a n ) + y ( i ) ( P i P i + 1 )
(5) Diving to capture prey, a rapid dive from the best position in the search space to the target prey, the rest of the population also moves to the best position and attacks the prey. rand is a random number between 0 and 1.
P i , n e w = r a n d P b e s t + P i + x ( i ) ( P i c 1 P m e a n ) + y ( i ) ( P i c 2 P b e s t )
(6) Determine whether the end condition is reached. If so, output the optimal result; otherwise, repeat step 2–step 6.
When using the BES optimization algorithm to improve the KPCA algorithm, the fitness function setting is the key point. According to the application scenario analysis of intrusion detection, we want the projected samples to be clustered as much as possible in the low-dimensional space, and the samples of different categories are far away from each other. The fitness function is constructed by calculating the inter-class distance and intra-class distance. The calculation process is as follows:
By taking samples of two different categories in the original data set ϕ ( x 1 ) and ϕ ( x 2 ) , we can see that the mean vectors of the samples are ϕ ( x 1 ) =   1 N i = 1 N ϕ ( x i ) and ϕ ( x 2 ) =   1 M i = 1 M ϕ ( x j ) respectively, and the overall mean value of the samples can be calculated:
ϕ =   1 N + M i = 1 N + M φ ( x i )
The intra-class divergence matrix S x and inter-class divergence matrix S y can be obtained:
S x = i = 1 2 n i ( ϕ i ϕ ) ( ϕ i ϕ ) T S y = i = 1 2 x c l a s s i n i ( ϕ i φ ( x k ) ) ( ϕ i φ ( x k ) ) T
Therefore, when the distance between samples of different categories is larger and the distance between samples of the same category is smaller, the separability of data samples is better. Therefore, the fitness function of the BES is set as follows:
f o b j = S x S y
When fitness takes the minimum value, the kernel parameter of the KPCA gets the optimal value, and the samples have the best separation in the feature space.

3.2. Algorithmic Enhancement

In the face of class imbalance within intrusion-detection datasets, traditional Random Forest algorithms employ decision trees as base classifiers, with node splits based on randomly selected attributes. Typically, the chosen splitting criterion involves calculating the minimal impurity of child nodes after the split. For imbalanced datasets, the class distribution tends to concentrate within the category with lower impurity, leading to misclassification of the minority class. In the realm of intrusion detection, malicious attacks represent the minority class, while normal behavior constitutes the majority class. In the context of network traffic detection, conventional Random Forest models tend to detect normal behavior while overlooking malicious attacks. The inability to effectively detect malicious behavior in the minority class could pose significant security threats to computer systems.
Therefore, improving the generation process of each base classifier is pivotal in classification work. By considering the cost associated with different classes and embedding cost-sensitive thinking into the training process of each base classifier, we utilize class weights to calculate the weighted minimum Gini coefficient for selecting the optimal split point. Such a cost-sensitive approach better accounts for cost disparities between different classes, resulting in more accurate classification outcomes. This transformation of the expression ensures a focus on the integration of cost sensitivity into the training process of each base classifier, ultimately leading to improved classification accuracy. The expression of G i n i ( t ) is transformed into the following:
G i n i cos t ( t ) = 1 i = 1 c [ p ( i | t ) cot s ( i , j ) ] 2
where, i and j represent categories; C represents the number of categories.

3.3. Decision-Level Enhancement

To address the issue of imbalanced classification, it is not only essential to set splitting criteria within each base classifier at the algorithmic level but also to incorporate cost-sensitive information into the voting process at the decision-tree leaf nodes at the decision level. In intrusion-detection data, the minority class (N) represents malicious access behavior, while the majority class comprises regular access behavior (P). In the model’s decision voting phase, traditional methods fail to adequately consider sample weights. They treat each sample equally through majority voting, without accounting for the differing costs associated with different types of errors. In reality, the consequences of misclassifying malicious behavior as normal behavior involve various losses that differ from the cost of misclassifying normal access behavior.
The introduction of cost-sensitive methods in the Random Forest algorithm primarily revolves around defining an appropriate cost matrix. This cost matrix allocates different error-classification costs to different classes, considering the costs associated with false positives and false negatives, with the aim of minimizing the total cost. Currently, cost matrices are typically obtained in two ways: through domain experts providing their expertise or by validating different cost matrices during the classifier training phase. However, in practical imbalanced classification scenarios, it may not be feasible to rely on expert knowledge alone to obtain a reliable cost matrix, especially when expert experience is limited. Therefore, employing different methods to validate the cost matrix is more practical.
As the intersection point of sensitivity and specificity curves represents high sensitivity and specificity simultaneously, this paper determines the classification threshold by selecting the intersection point of the sensitivity and specificity curves. This threshold can be derived by using the sensitivity and specificity curve intersection method based on the validation set, allowing us to obtain the corresponding cost matrix:
c o s t ( P , P ) = 0 c o s t ( P , N ) = t h r e s h o l d c u r v e c r o s s c o s t ( N , P ) = t h r e s h o l d c u r v e c r o s s c o s t ( N , N ) = 0
The cost matrix is incorporated into the classification decision-making process of the Random Forest algorithm, and the weighted voting of minority class samples is used to improve the minority class’s voice in the final decision and reduce the excessive bias to the majority class. Therefore, in the decision-making process, the probability of leaf node t voting for a minority class is improved to the following:
p N | t c o s t N , P > p ( P | t ) c o s t ( P , N )
p N | t c o s t ( N , P ) > ( 1 p ( N | t ) ) c o s t ( P , N )
p ( N | t ) > c o s t ( P , N ) c o s t ( N , P ) + c o s t ( P , N )
The final category prediction result of Random Forest is obtained through the weighted majority voting of all trees, and the decision tree with higher weight is more sensitive to the unbalanced classification problem, and its majority voting decision stage has a greater decision weight.

3.4. Enhanced Intrusion-Detection Algorithm Workflow

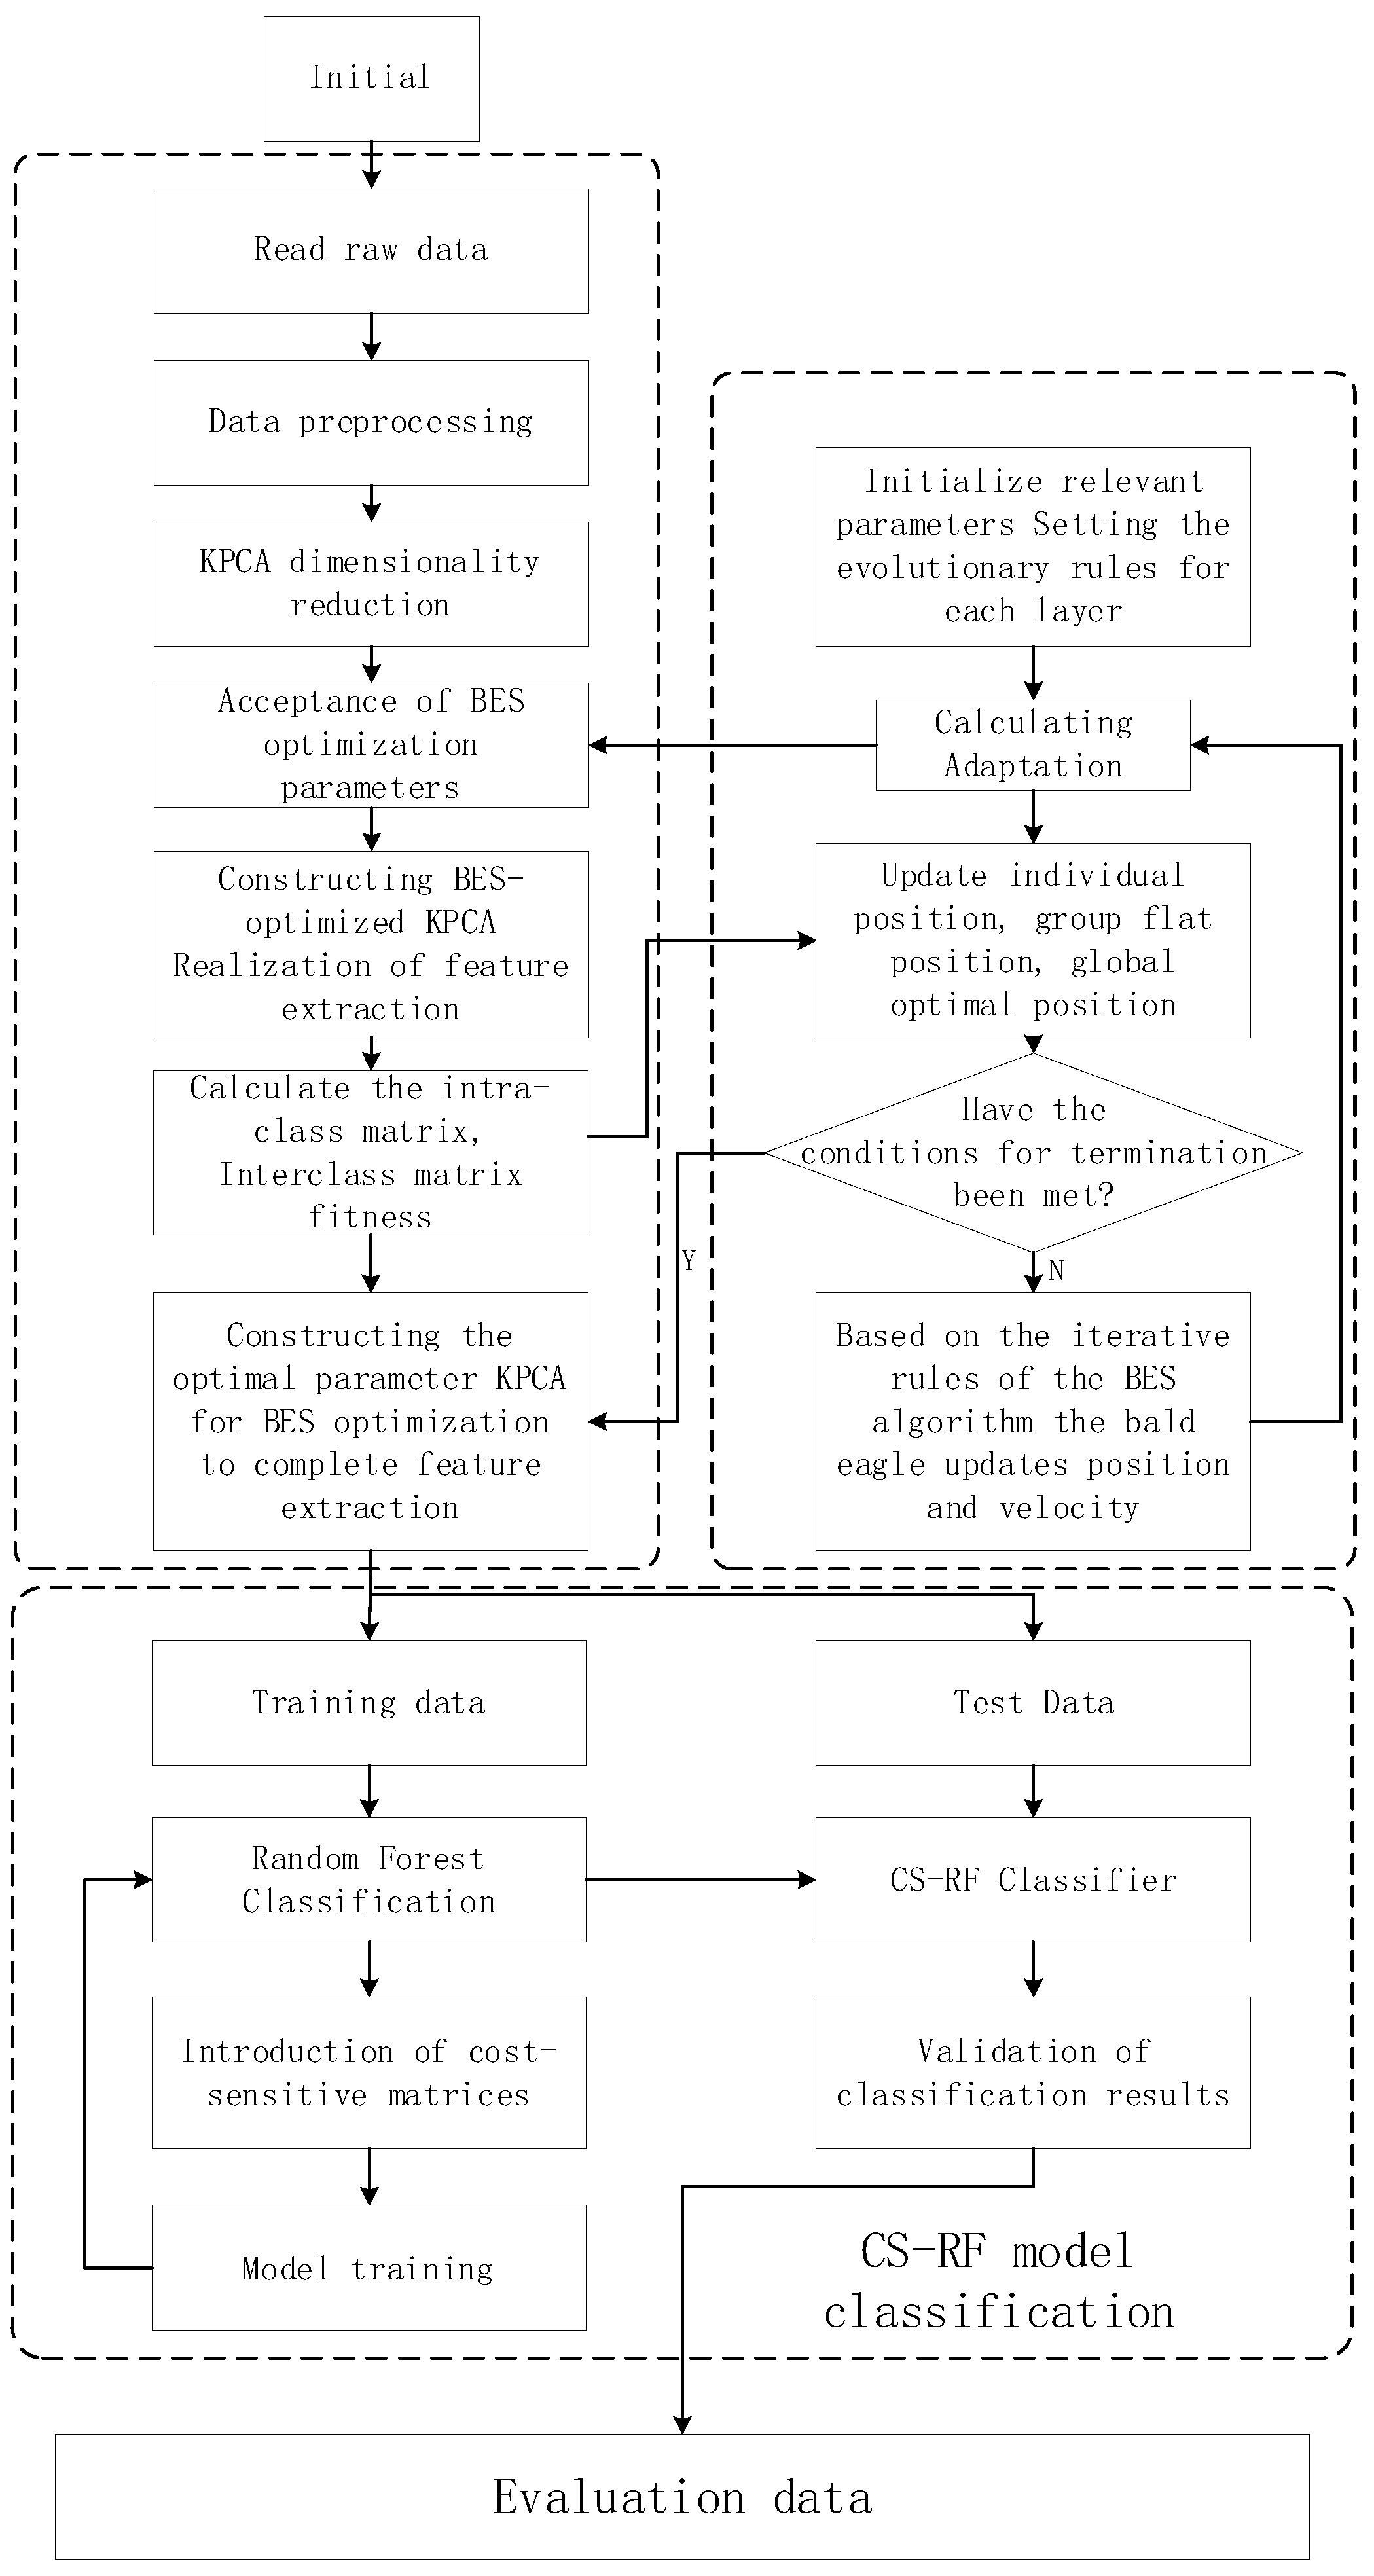
The algorithm workflow in this paper consists of four phases, as depicted in Figure 2:
(1)
Data Preprocessing: This phase involves preprocessing the original dataset. Categorical features are one-hot encoded, transforming unmanageable categorical features into numerical ones. Additionally, to mitigate significant differences in feature values, the dataset is normalized.
(2)
Data Dimensionality Reduction: In this phase, the algorithm calculates distances between categories and within categories to construct a fitness function. The Bald Eagle Search (BES) algorithm is employed for optimizing KPCA parameters. The optimal parameters are then used in the B-KPCA algorithm to reduce dimensionality in the intrusion-detection dataset, creating a new feature subset.
(3)
Construction of Cost-Sensitive Random Forest Model: Cost matrices are introduced and applied to both the Gini function of base classifiers and the prediction in the decision tree classification voting. The model is trained with these considerations.
(4)
Model Validation: The final phase involves testing the trained model using a testing dataset. Multiple metrics are employed to evaluate and validate the classification performance of the model.

4. Experimental Verification and Result Analysis

4.1. Experimental Setup

(1)
Experimental environment setting
The experimental hardware environment is Windows 10 (American Transnational Technologies, Redmond, WA, USA), Intel Core [email protected] GHz CPU (Intel Corporation, Santa Clara, CA, USA), GeForce GTX1050Ti GPU (NVIDIA, Santa Clara, CA, USA), and 16 GB RAM (Lenovo, Tianjin, China). The software environment uses VScode1.80 and Python 3.7.9.
(2)
Dataset selection
Classic intrusion-detection datasets, such as KDD Cup 1999, NSL-KDD, and DARPA [35], are well-known, but they often suffer from high redundancy and duplicate samples and may not fully represent modern network environments with emerging attack behaviors. The UNSW-NB15 dataset [36], developed by the University of New South Wales, stands out as a network-intrusion-detection dataset with diversity and authenticity. It provides real and complex intrusion-detection scenarios, offering insights into network attacks and threats in real-world environments. The dataset has been used extensively and has been introduced into a different class of network traffic classification system based on multiple artificial intelligence techniques to study network traffic to ensure network security using artificial intelligence [37] and into a Machine Learning Based Ensemble Intrusion Detection (MLEID) methodology to minimize malicious behaviors in botnet attacks related to the Message Queuing Telemetry Transport (MQTT) and Hyper-Text Transfer Protocol (HTTP) protocols by minimizing the use of artificial intelligence in the detection of network intrusions. Protocol (HTTP) functions by minimizing malicious behavior in botnet attacks related to message queue telemetry transfer (MQTT) and the Hyper-Text Transfer Protocol (HTTP) [38], all of which demonstrate the dataset’s ability to improve and increase the accuracy and reliability of network intrusion detection systems.
Hence, utilizing the UNSW-NB15 dataset enables the evaluation of classifiers in realistic and intricate network environments. Detailed distribution information for this dataset is presented in Table 1.
To address the challenges of high dimensionality and class imbalance in the dataset, this paper takes a two-pronged approach. Firstly, it introduces the Bald Eagle Search (BES) algorithm to optimize multiple parameters of the Kernel Principal Component Analysis (KPCA) algorithm. This optimization process results in an enhanced version of KPCA (B-KPCA), which effectively eliminates redundant data, reduces dimensionality, and improves dataset usability.
Secondly, the paper integrates the concept of cost sensitivity with the Random Forest algorithm, enhancing sensitivity towards minority classes. This combination not only reduces the training time of the detection model but also enhances the accuracy of detecting intrusion behavior within the minority class. By adopting these two strategies, the paper aims to create a more efficient and effective intrusion detection system, capable of handling the challenges posed by high-dimensional and imbalanced datasets.
(3)
Selection of Evaluation Metrics
In the context of classification problems, classification outcomes can be categorized into two main results: correct or incorrect. These outcomes can be further classified into four distinct scenarios, as outlined in Table 2:
TPs (True Positives): The model correctly detects attack traffic.
FNs (False Negatives): The model fails to detect attack traffic, misclassifying it as normal traffic.
TNs (True Negatives): The model correctly identifies normal traffic.
FPs (False Positives): The model incorrectly identifies normal traffic as an attack.
FPs and FNs are typically referred to as “false alarms”.
Based on these four parameters, one can derive four key metrics to assess the practical performance of a model.
Accuracy indicates the ratio of the sum of samples correctly predicted by the model to the sum of all samples.
a c c u r a c y = ( T P + T N ) ( T P + T N + F P + F N )
Sensitivity refers to the model’s ability to correctly identify positive example samples.
s e n s i t i v i t y = T P ( T P + F N )
Specificity refers to the ability of the model to correctly identify negative example samples.
s p e c i f i c i t y = T N ( F P + T N )
G-mean is an assessment metric that combines sensitivity and specificity, taking into account the classification accuracy of both positive and negative examples, which is more sensitive to the classification effect of a few classes, and it is the geometric mean of sensitivity and specificity.
G m e a n = s e n s i t i c i t y × s p e c i f i c i t y
In the selection of many evaluation indicators, the object measured based on the precision rate indicator is relatively easy to calculate, and the acquisition cost of the indicator is low. And it is not easy to produce dichotomy, which will not cause people to have many different understandings of the meaning of the indicator itself. The indicator is applicable in most scenarios; however, this paper chooses the G-mean value of the indicator because it is more applicable to the data imbalance scenario and better reflects the algorithm in the imbalance of the data in the good or bad situations.
Similarly, the false alarm rate indicator is the ratio of the number of normal applications judged as malicious applications (FPs) to the number of all normal applications, which is characterized by low cost, high efficiency, and strong analytical ability for related problems in related experimental studies and models, which makes many scholars choose it as an evaluation indicator when writing their papers. However, due to the imbalance of the data selected in this paper, the number of positive and negative cases differs greatly, and the reference value and contribution of the false alarm rate to this paper is relatively lower than that of the G-mean index, so this paper selects a more comprehensive evaluation index, the G-mean.

4.2. Dataset Preprocessing

(1)
Unique Thermal Encoding of Character-based Features:
This is used to convert non-numeric character-based features into a numeric form that can be processed by a computer. The discrete feature values are extended into Euclidean space for data feature encoding, such that each possible feature value corresponds to a new binary variable. The UNSW_NB15 dataset is uniquely hot coded, where the features in columns 3, 4, 5 are character-based (corresponding to “proto” “service” “state”), “proto” “service” “state” and “state”. The features in columns 3, 4, 5 are character-based (corresponding to “proto”, “service”, “state”), and “proto” is mapped to 131-dimensional features, “service” is mapped to 12-dimensional features, “state” is mapped to 7-dimensional features, and the feature data are mapped to 7-dimensional features. It is mapped to 7 dimensions; “scrip” and “dstip” columns in the feature dataset represent the IP address, and since determining whether the data is abnormal has nothing to do with the IP address, the first column ID is only an identifier. In order to simplify the removal of these three columns, the dimension is increased from 43 dimensions to 185 dimensions after the preprocessing. The dimension is increased from 43 to 187 dimensions.
(2)
Feature data normalization:
This is a technique that converts the entire range of values of a set of features into a predetermined range. Usually, there is a huge difference in the range of data values between different features, which can cause the training process of machine learning algorithms to be affected, and features with a larger range of values will be given more weight in the training of the algorithm. Therefore, min-max normalization is introduced to map all the data to the interval [0, 1], thus speeding up the convergence of the model and improving the accuracy of the classification results, which is given by the following formula:
X = X M i n M a x M i n
where M i n is the minimum value of the feature, M a x is the maximum value of the feature, and X is the feature value after normalization.

4.3. Dimension Reduction of Feature Data

Figure 3 is a load matrix heatmap, which can analyze the importance of hidden variables in each principal component. The darker the color of the heatmap, the greater the correlation. The correlation between principal components and variables, such as the bald eagle population size, number of iterations, kernel function parameters, and cumulative contribution rate of features is relatively high. The scale below shows the corresponding degree of different correlation coefficients. The analysis in the Figure 3 shows that when the parameter is selected as 0.007, the correlation reaches its maximum and the display effect is the best.
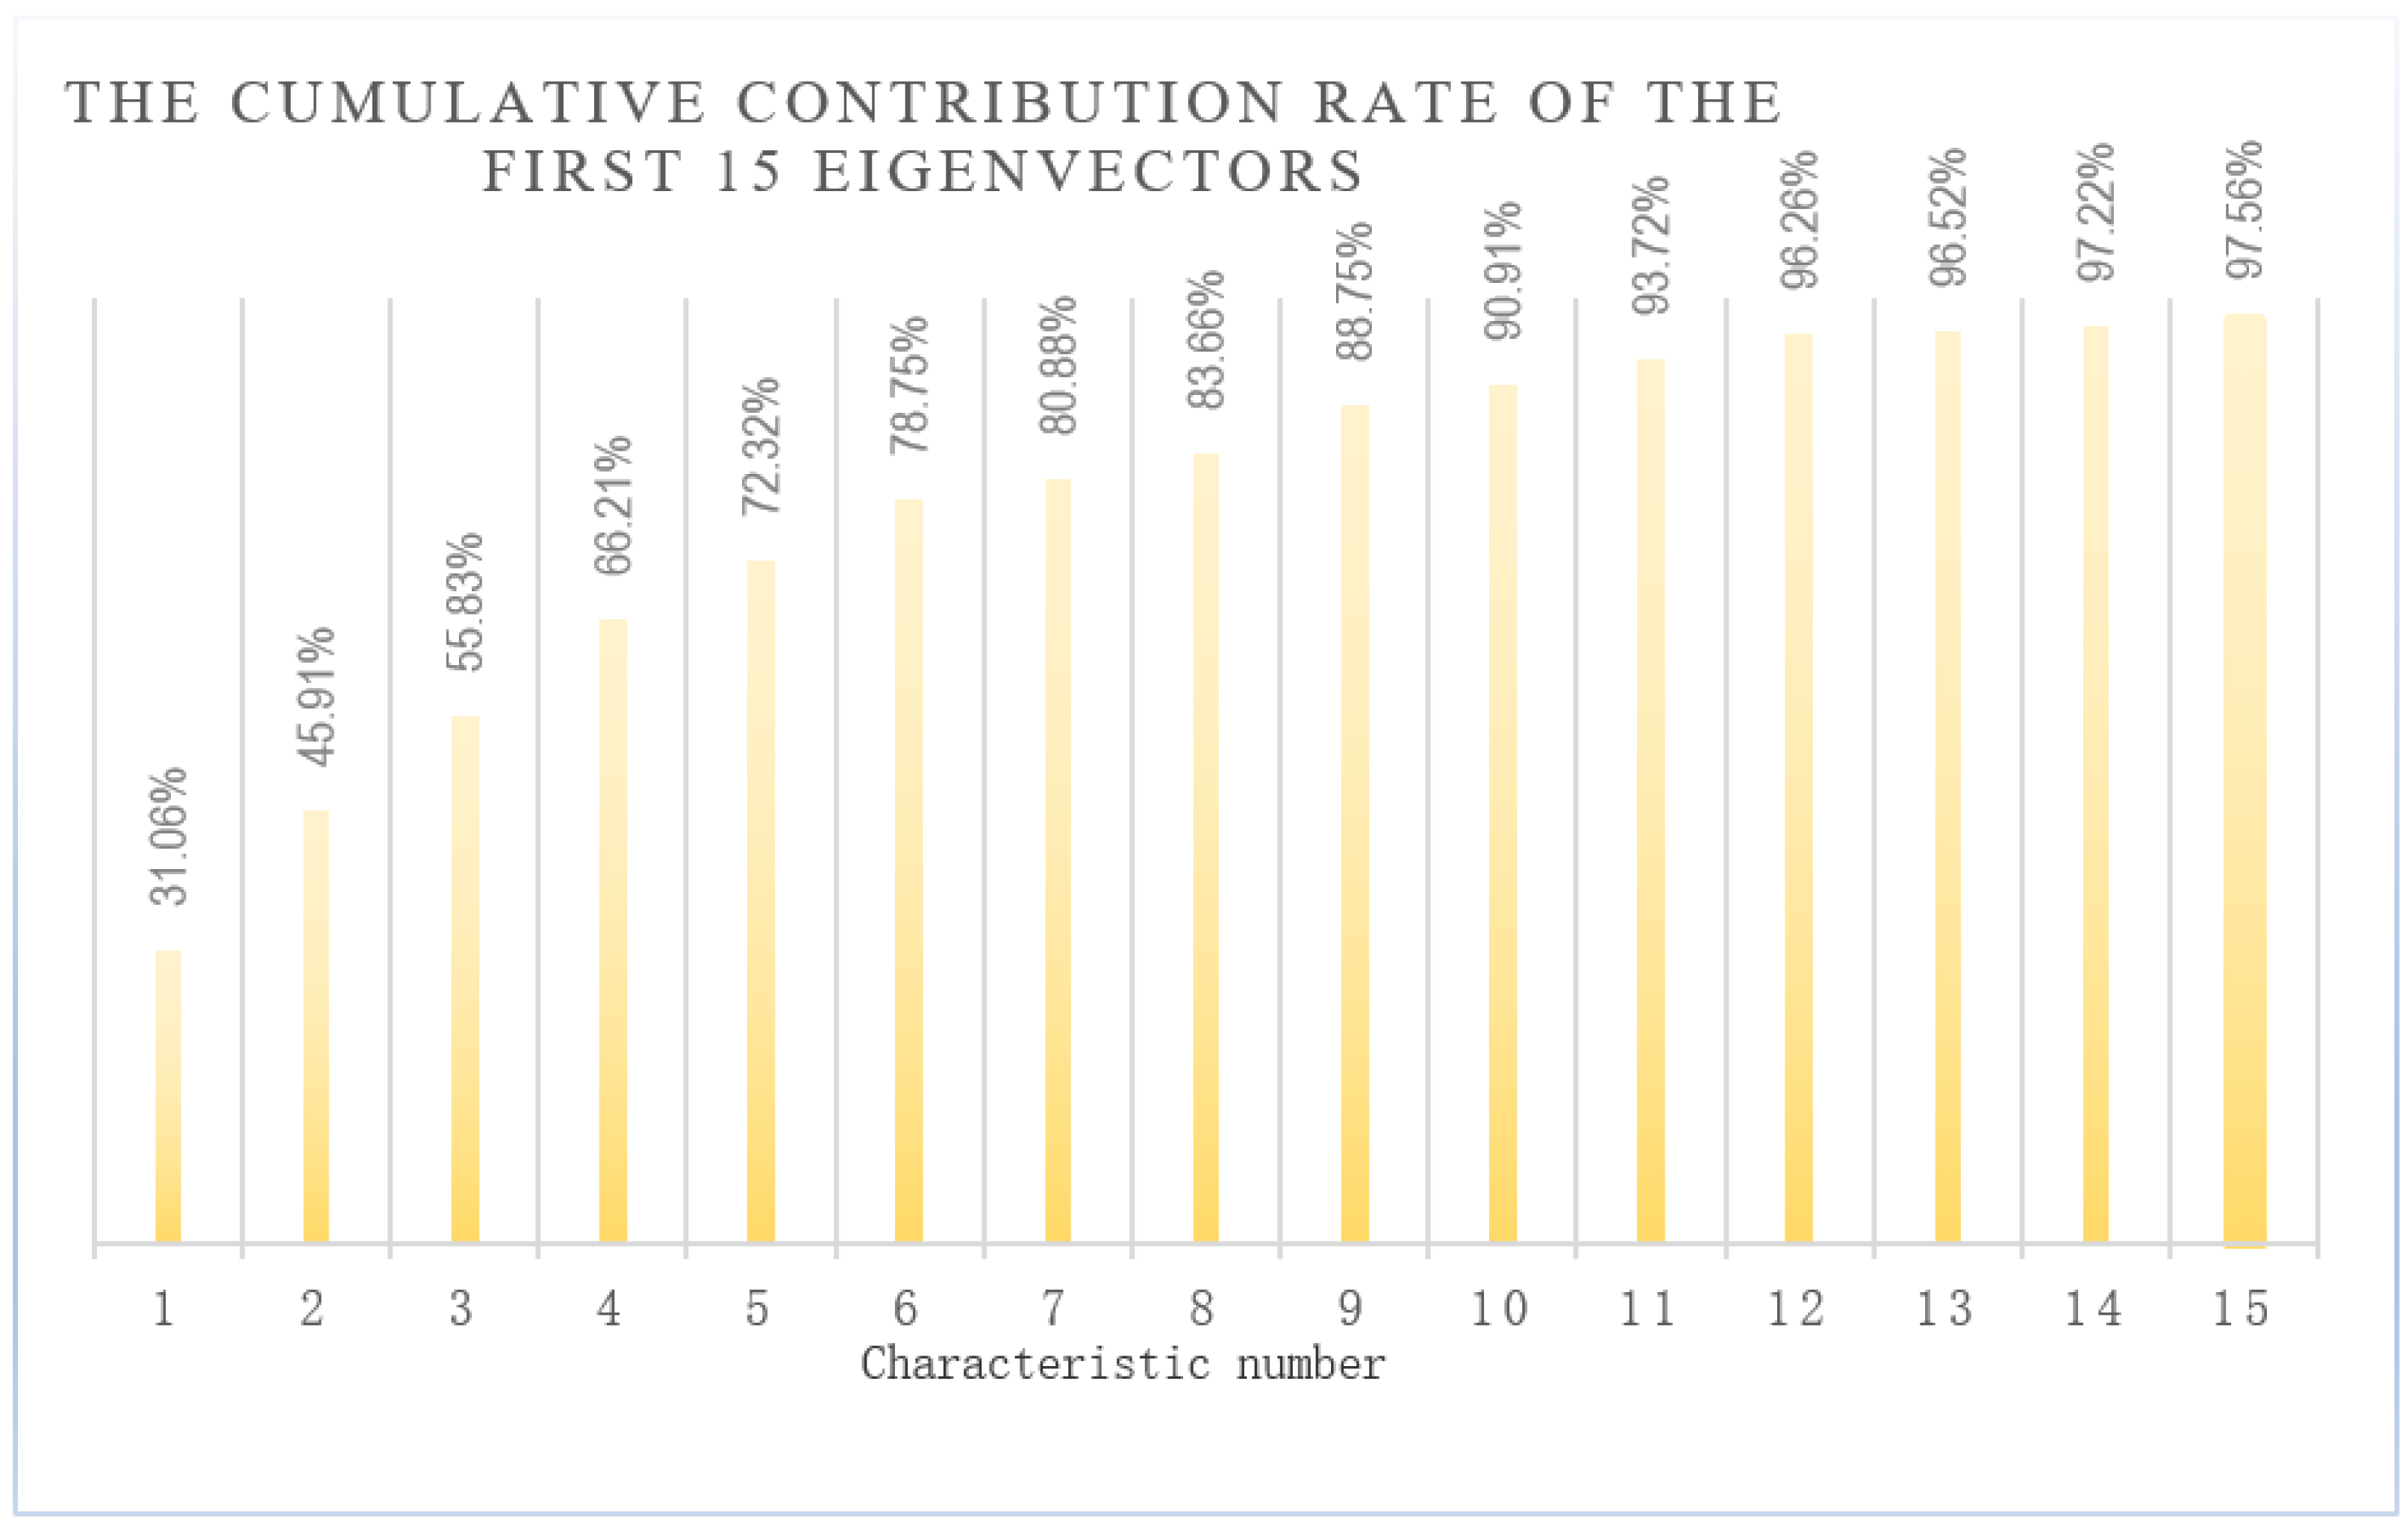
In this section, the KPCA optimized based on the Condor search algorithm is used to reduce the dimensionality of the preprocessed dataset. Firstly, the size of condor population n p o p is set to 50, and the number of iterations M a x l t is set to 200, and the kernel parameters in the KPCA algorithm are optimized. According to the fitness function f o b j , the type of kernel function is the Gaussian kernel function, and the optimal value of parameter γ is 0.007. Set the kernel parameter to the optimal value. The cumulative contribution rate of the feature for data dimensionality reduction is set to 95%. Figure 3 shows the cumulative contribution rate of the first 15 feature vectors after data dimensionality reduction.
According to the data in Figure 4, after the algorithm completed the dimensionality reduction of the experimental dataset, the cumulative contribution rate of the first 12 features reached 96.26%, meeting the threshold of a 95% contribution rate.
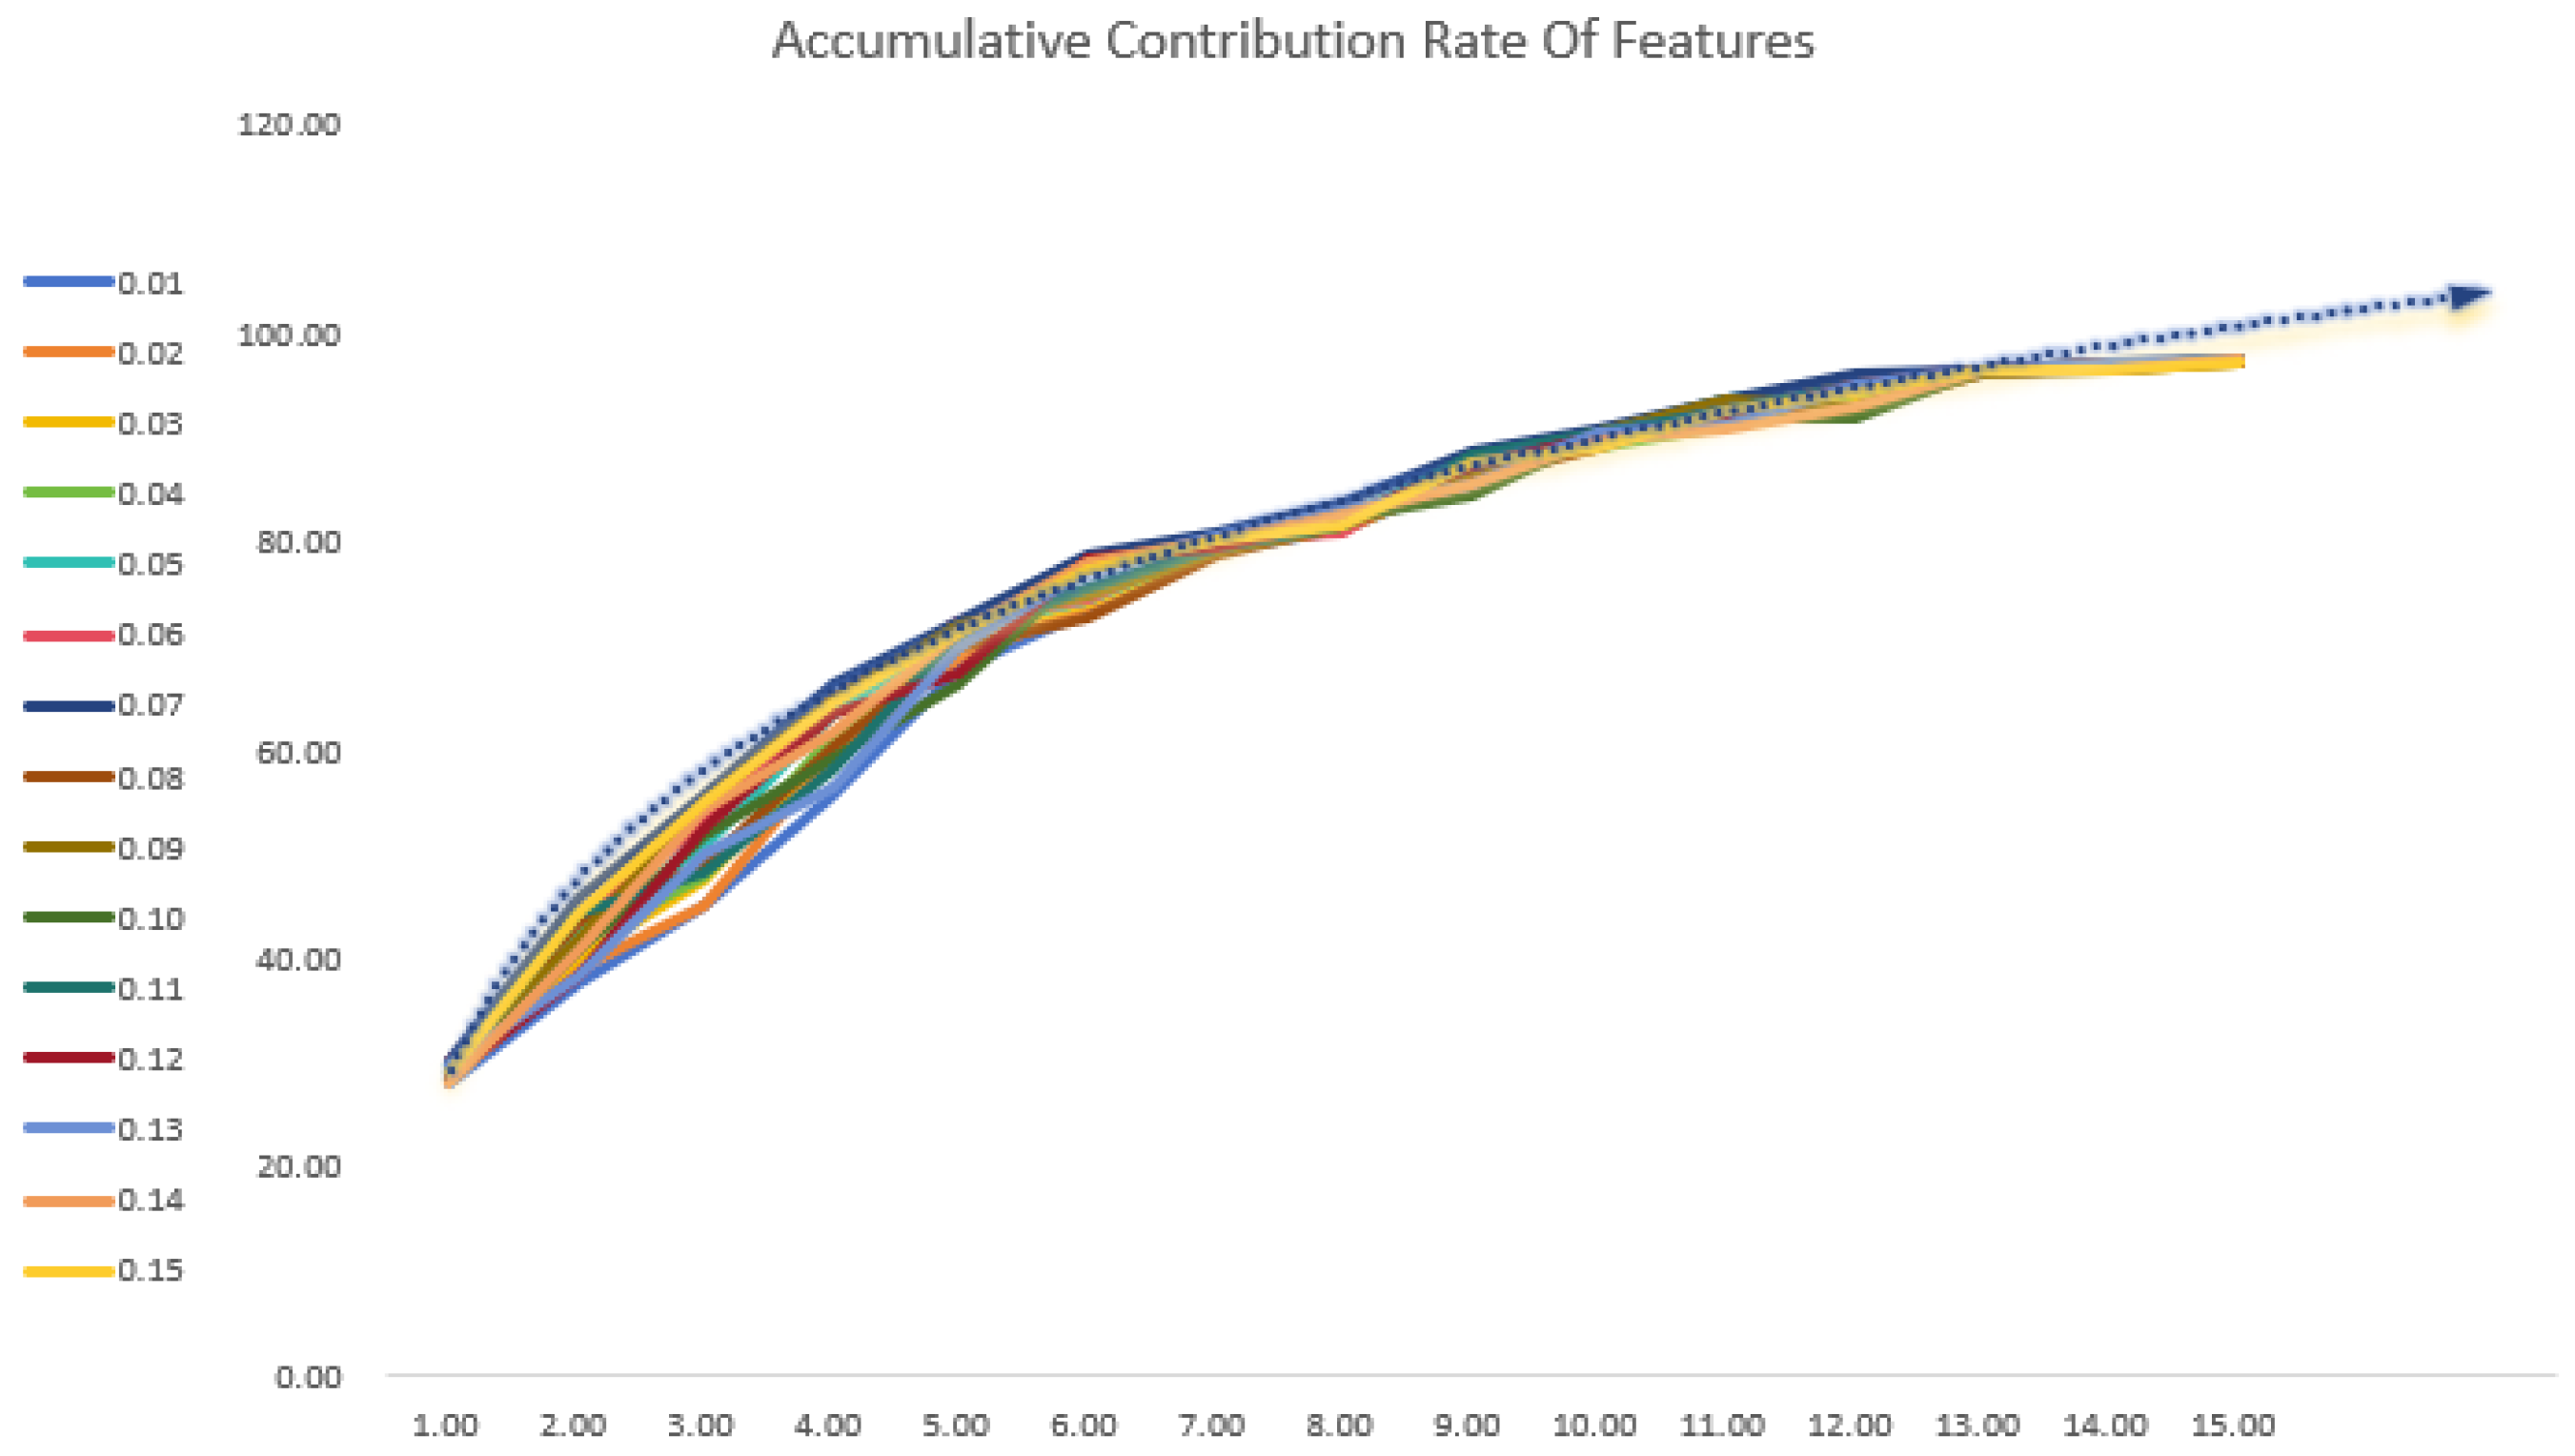
From Figure 5, it can be seen that the cumulative contribution rate of features increases smoothly along the trend line, with an overall trend of exponential growth. The contribution rates of the top 10 features show a significant growth trend, and changes in the trend line can be clearly observed. After accumulating 10 features, the cumulative contribution rate of feature vectors reaches 90%, and the trend line gradually becomes flat, consistent with the trend of the cumulative contribution rate of features.

4.4. Experiment and Result Analysis

In accordance with the data dimensionality reduction algorithm and cost-sensitive Random Forest algorithm proposed in this paper, experimental validation was carried out, and in order to more scientifically and accurately assess the performance of the algorithms based on high-dimensional and category-unbalanced data, validation was carried out based on the evaluation indexes of accuracy, sensitivity and specificity, and the G-mean value.
(1) First, in order to evaluate the performance of different data dimensionality reduction algorithms in intrusion detection, three commonly used algorithms, namely Principal Component Analysis algorithm (PCA), isometric feature mapping algorithm (ISOMAP) [39], and the local linear embedding algorithm (LLE) [40], were selected as the reference terms to be compared with the data dimensionality reduction algorithm improved in this paper (B-KPCA), and the four methods were used to evaluate the data dimensionality of the preprocessed UNSW- NB15 dataset’s data dimensionality down to 15 dimensions. The Random Forest algorithm was used to classify and identify tasks on the downgraded data, and the results are shown in Table 3.
Where Principal Component Analysis (PCA) is a linear dimensionality reduction algorithm that aims to measure the variability of the data in terms of variance and to represent the high dimensional data with high variability by projecting it into a low dimensional space, ISOMAP, on the other hand, makes the dimensionality reduction method applicable to streaming data by considering the use of an appropriate distance metric. Local Linear Embedding (LLE) is a nonlinear dimensionality reduction algorithm that maps high-dimensional data into a low-dimensional space while preserving the local structural information of the data. These three methods are used as a comparison to more accurately analyze the extent of the advantages and disadvantages of the dimensionality reduction of data in different situations.
From the data comparison results, it can be clearly observed that after the data dimensionality reduction using the B-KPCA algorithm, the accuracy of the classification test is significantly better than the other three algorithms. Analyzing on the dimension reduction time, compared with the PCA algorithm, the B-KPCA algorithm only takes 3.69 s more, but compared with the ISOMAP algorithm and LLE algorithm, it saves 20.68 s and 16.58 s of running time, respectively. Considering the accuracy and running time together, it can be concluded that the B-KPCA algorithm outperforms the other three compared algorithms in terms of performance.
(2) Secondly, in this paper, the original RF algorithm [37], the RF algorithm sensitive based on the unbalanced proportion method [41], the RF algorithm sensitive based on the Youden threshold method [42], and the RF algorithm sensitive based on the curve intersection [43] are selected for the comparative experiments to test the performance of the various cost-sensitive RF algorithms.
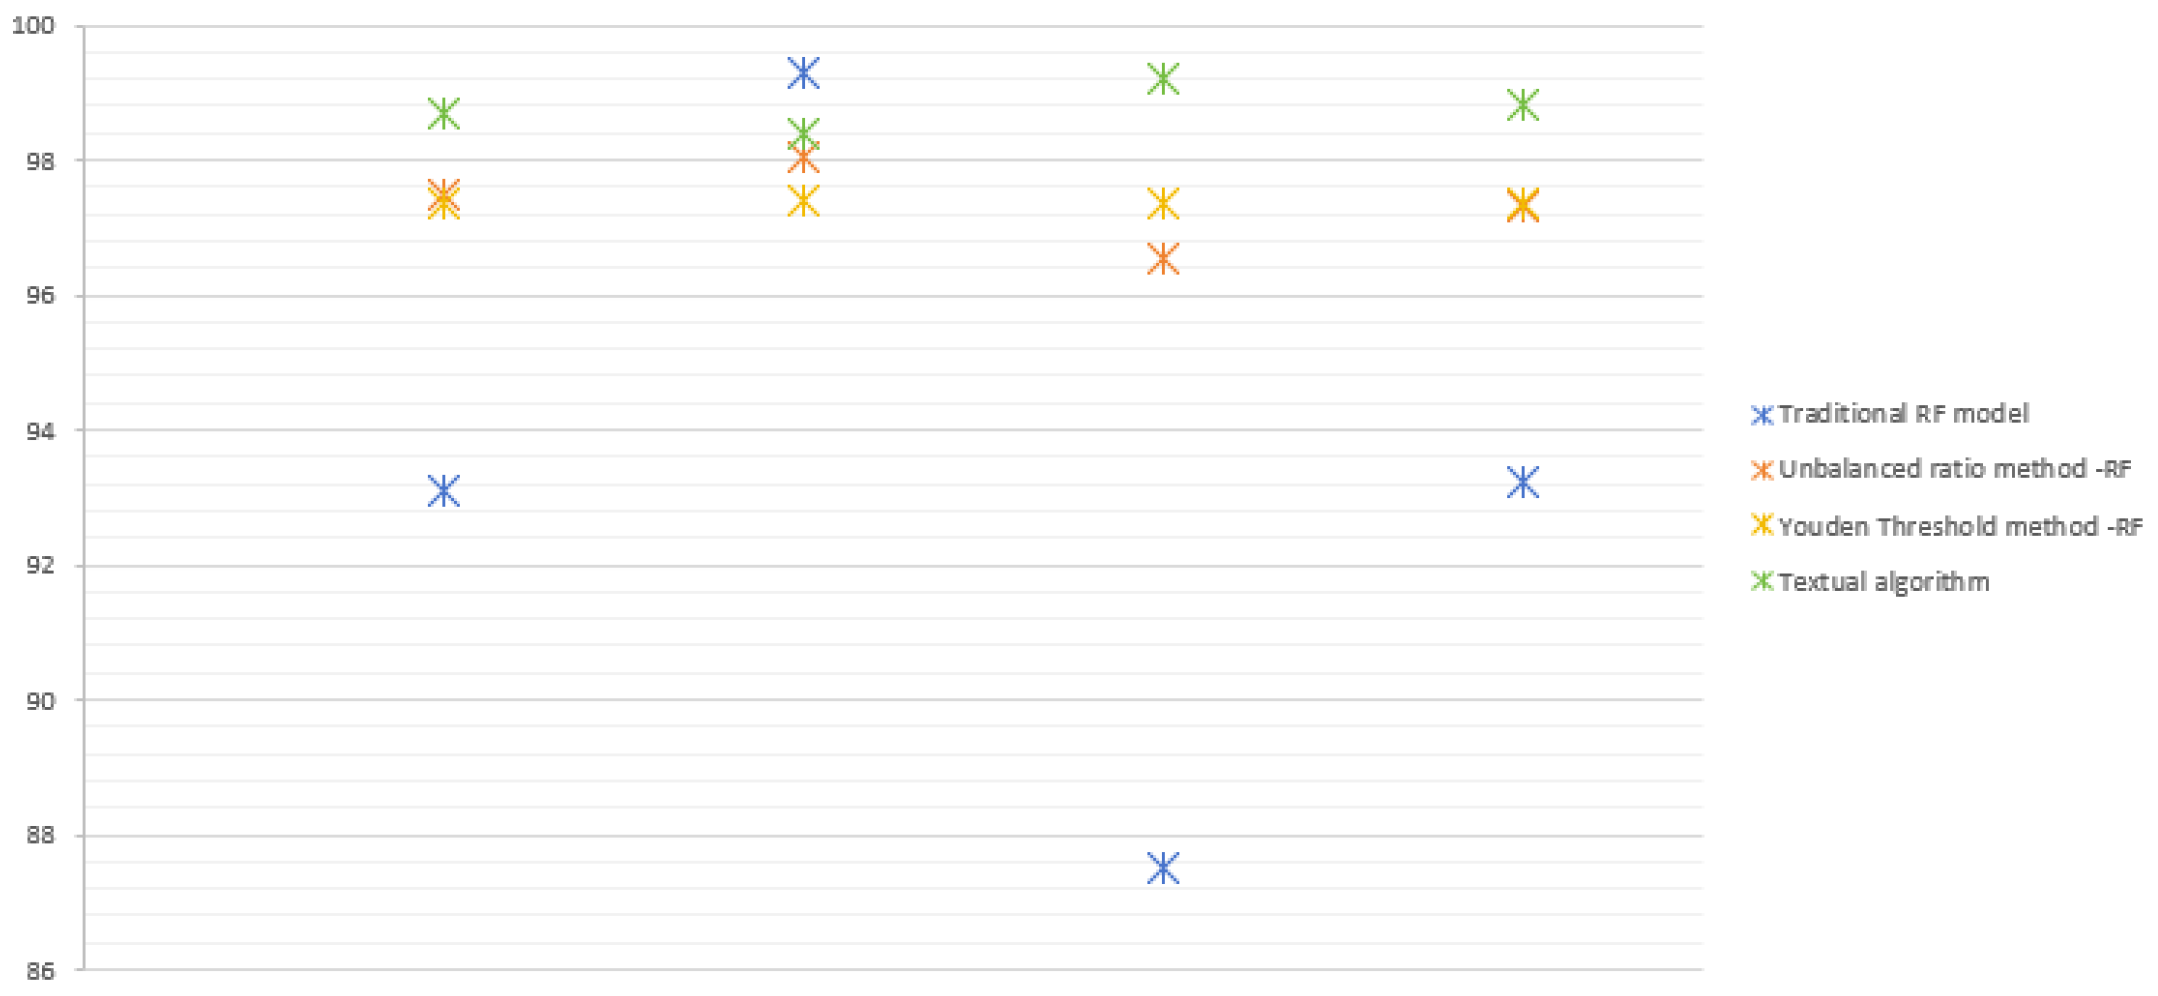
The algorithms of this paper are compared with the above three algorithms, and the visualization results of the algorithm comparison are obtained by calculating six parameters. The specific data are shown in Table 4, and the degree of visualization comparison is shown in Figure 6.
In the comparison with the unbalanced proportion method-RF, this paper’s model has a large advantage over the model, and all index data are better than the algorithm, but the unbalanced proportion method still does not consider the cost weight of the categories in most of the voting stages and does not differentiate between different categories.
Secondly, in the comparison with the Youden threshold method-RF, the model of this paper also achieves significant advantages, in which the maximum value of the Youden index (cutoff value) corresponds to the optimal diagnostic threshold of the method, and it is necessary to set the appropriate threshold according to the specific problem. Its selection may be affected by subjective factors, and it lacks a certain degree of objectivity.
Finally, compared with the traditional RF model, the accuracy, specificity, G-mean, training time, and testing time of this paper’s model are better, while the sensitivity is lower than the traditional algorithm by 0.91%, which is because the original model tends to categorize the majority of the categories, and the detection effect is low in targeting the unbalanced minority categories, which results in a large data difference between the sensitivity and the specificity. In contrast, the model in this paper can effectively and correctly identify the minority categories.
Therefore, the improvement in data degradation and the Random Forest can obtain a better misclassification cost of the prediction target model and can have more efficient classification performance when facing high latitude and class imbalanced data.

5. Conclusions

(1)
This paper proposes an improved intrusion-detection model based on the Random Forest algorithm, which solves the problem of the high computational complexity, high consumption of storage resources, and low classification accuracy of the traditional Random Forest caused by the characteristics of high data latitude and sample category imbalance in intrusion detection. Using the vulture search algorithm optimized KPCA to complete the data dimensionality reduction, the introduction of a cost-sensitive learning method to the Random Forest, through experiments, verified that the method proposed in this paper has a better performance compared with the traditional method and can be completed in a shorter period of time for a small number of categories of samples of high-efficiency detection under the premise of a higher accuracy rate.
(2)
It is experimentally verified that the method proposed in this paper has better performance compared with traditional methods. In terms of data dimensionality reduction, the B-KPCA algorithm takes only 3.69 s more compared to the PCA algorithm and saves 20.68 s and 16.58 s compared to the ISOMAP algorithm and the LLE algorithm, but the accuracy rate is improved by 7.04%, 9.83%, and 3.98%. Considering the accuracy rate and running time together, the B-KPCA algorithm is better in performance. Moreover, the model in this paper improves the accuracy by 5.59%, 1.23%, and 1.33%, the specificity by 11.7%, 2.66%, and 1.87%, the G-mean by 0.0558, 0.0150, and 0.0144, and the training time and testing time by more than half, compared with the traditional RF model, the imbalanced proportion method-RF, and the Youden threshold method-RF. Considering the above factors, the model in this paper more correctly recognizes the minority class samples.
(3)
However, during the experimental process, it was realized that the model still has some limitations. The evaluation of our study was based on publicly available datasets and was not tested in a real-world environment. Therefore, future work may focus on real-time environment testing, and on the basis of evaluating the model’s performance in a laboratory environment, the model will be tested and validated in an actual real-time environment, which will provide more realistic contexts and data to further validate the model’s reliability and practicality.

Author Contributions

Methodology, C.L.; Formal analysis, Z.W.; Writing—original draft, Y.C. All authors have read and agreed to the published version of the manuscript.

Funding

This research received no external funding.

Data Availability Statement

Publicly available datasets were analyzed for this study. These data can be found here: https://research.unsw.edu.au/projects/unsw-nb15-dataset (accessed on 22 December 2023).

Conflicts of Interest

The authors declare no conflict of interest.

References

  1. Florackis, C.; Louca, C. Cybersecurity Risk. Rev. Financ. Stud. 2022, 36, 351–407. [Google Scholar] [CrossRef]
  2. Insua, D.R.; Couce-Vieira, A.; Rubio, J.A. An Adversarial Risk Analysis Framework for Cybersecurity. Risk Anal. 2019, 41, 16–36. [Google Scholar] [CrossRef] [PubMed]
  3. Mills, R.; Marnerides, A.K. Practical Intrusion Detection of Emerging Threats. IEEE Trans. Netw. Serv. Manag. 2021, 19, 582–600. [Google Scholar] [CrossRef]
  4. Maseno, E.M.; Wang, Z. A Systematic Review on Hybrid Intrusion Detection System. Secur. Commun. Netw. 2022, 2022, 9663052. [Google Scholar] [CrossRef]
  5. Shaikha, H.K.; Abduallah, W.M. A Review of Intrusion Detection Systems. Acad. J. Nawroz Univ. 2017, 6, 101–105. [Google Scholar] [CrossRef]
  6. Om, H.; Kundu, A. A hybrid system for reducing the false alarm rate of anomaly intrusion detection system. In Proceedings of the 2012 1st International Conference on Recent Advances in Information Technology (RAIT), Dhanbad, India, 15–17 March 2012; pp. 131–136. [Google Scholar]
  7. Liu, Z.; Ning, W.; Fu, X.; Zhang, M.; Wang, Y. Fast Intra-Mode Decision Algorithm for Virtual Reality 360 Degree Video Based on Decision Tree and Texture Direction. In Proceedings of the Twelfth International Conference on Digital Image Processing (ICDIP 2020), Osaka, Japan, 19–22 May 2020; Volume 11519. [Google Scholar]
  8. Donald, R.; Joseph, C.; Daniel, L.T.; Farah, K.; Anthony, S. Radio Identity Verification-Based IoT Security Using RF-DNA Fingerprints and SVM. IEEE Internet Things J. 2021, 8, 8356–8371. [Google Scholar]
  9. Han, Q.; Liu, J.; Shen, Z.; Liu, J.; Gong, F. Vector partitioning quantization utilizing K-means clustering for physical layer secret key generation. Inf. Sci. 2020, 512, 137–160. [Google Scholar] [CrossRef]
  10. Al-Abadi, A.A.J.; Mohamed, M.B.; Fakhfakh, A. Enhanced Random Forest Classifier with K-MeansClustering (ERF-KMC) for Detecting and Preventing Distributed-Denial of-Service and Man-in-the-Middle Attacks in Internet-of-Medical-Things Networks. Computers 2023, 12, 262. [Google Scholar] [CrossRef]
  11. Zhou, M.; Zhang, Y.; Wang, J.; Xue, T.; Dong, Z.; Zhai, W. Fault Detection of Wastewater Treatment Plants Based on an Improved Kernel Extreme Learning Machine Method. Water 2023, 15, 2079. [Google Scholar] [CrossRef]
  12. Tidrea, A.; Korodi, A.; Silea, I. Elliptic Curve Cryptography Considerations for Securing Automation and SCADA Systems. Sensors 2023, 23, 2686. [Google Scholar] [CrossRef]
  13. Hsu, C.-Y.; Wang, S. Intrusion detection by machine learning for multimedia platform. Multimed. Tools Appl. 2021, 80, 29643–29656. [Google Scholar] [CrossRef]
  14. Zhang, C.; Jia, D. Comparative research on network intrusion detection methods based on machine learning. Comput. Secur. 2022, 121, 102861. [Google Scholar] [CrossRef]
  15. Ring, M.; Wunderlich, S. A survey of network-based intrusion detection data sets. J. Big Data 2019, 86, 147–167. [Google Scholar] [CrossRef]
  16. Bagui, S.; Bagui, S. Resampling imbalanced data for network intrusion detection datasets. Rev. Financ. Stud. 2021, 8, 351–407. [Google Scholar] [CrossRef]
  17. Yang, Z.; Liu, X.; Li, T.; Wu, D.; Wang, J.; Zhao, Y.; Han, H. A systematic literature review of methods and datasets for anomaly-based network intrusion detection. Comput. Secur. 2022, 116, 102675. [Google Scholar] [CrossRef]
  18. Yousefnezhad, M.; Hamidzadeh, J.; Aliannejadi, M. Ensemble classification for intrusion detection via feature extraction based on deep Learning. Soft Comput. 2021, 25, 12667–12683. [Google Scholar] [CrossRef]
  19. Laber, E.; Murtinho, L. Minimization of Gini Impurity: NP-completeness and Approximation Algorithm via Connections with the k-means Problem. Electron. Notes Theor. Comput. Sci. 2019, 346, 567–576. [Google Scholar] [CrossRef]
  20. Hoang, U.N.; Mojdeh Mirmomen, S.; Meirelles, O.; Yao, J.; Merino, M.; Metwalli, A.; Marston Linehan, W.; Malayeri, A.A. Assessment of multiphasic contrast-enhanced MR textures in differentiating small renal mass subtypes. Abdom. Radiol. 2018, 43, 3400–3409. [Google Scholar] [CrossRef]
  21. Chutia, D.; Bhattacharyya, D.K.; Sarma, J.; Raju, P.N. An effective ensemble classification framework using random forests and a correlation based feature selection technique. Trans. GIS 2017, 21, 1165–1178. [Google Scholar] [CrossRef]
  22. Mishra, A.K.; Paliwal, S. Mitigating cyber threats through integration of feature selection and stacking ensemble learning: The LGBM and random forest intrusion detection perspective. Clust. Comput. 2023, 26, 2339–2350. [Google Scholar] [CrossRef]
  23. Li, J.; Cheng, K. Feature Selection: A Data Perspective. ACM Comput. Surv. 2017, 50, 1–45. [Google Scholar] [CrossRef]
  24. Gao, W.; Hu, L.; Zhang, P.; He, J. Feature selection considering the composition of feature relevancy. Pattern Recognit. Lett. 2018, 112, 70–74. [Google Scholar] [CrossRef]
  25. Reddy, G.T.; Reddy, M.P.; Lakshmanna, K.; Kaluri, R.; Rajput, D.S.; Srivastava, G.; Baker, T. Analysis of Dimensionality Reduction Techniques on Big Data. J. Mag. 2020, 8, 54776–54788. [Google Scholar] [CrossRef]
  26. Zhang, H.; Huang, L. An Effective Convolutional Neural Network Based on SMOTE and Gaussian Mixture Model for Intrusion Detection in Imbalanced Dataset. Comput. Netw. 2020, 177, 107315. [Google Scholar] [CrossRef]
  27. Li, Y.; Qin, T. HDFEF: A hierarchical and dynamic feature extraction framework for intrusion detection systems. Comput. Secur. 2022, 121, 102842. [Google Scholar] [CrossRef]
  28. Wang, Y.-C.; Cheng, C.-H. A multiple combined method for rebalancing medical data with class imbalances. Comput. Biol. Med. 2021, 134, 104527. [Google Scholar] [CrossRef] [PubMed]
  29. Herrera-Semenets, V.; Bustio-Martínez, L.; Hernández-León, R.; van den Berg, J. A multi-measure feature selection algorithm for efficacious intrusion detection. Knowl. Based Syst. 2021, 227, 107264. [Google Scholar] [CrossRef]
  30. Han, G.; Li, X.; Jiang, J.; Shu, L.; Lloret, J. Intrusion Detection Algorithm Based on Neighbor Information Against Sinkhole Attack in Wireless Sensor Networks. Comput. J. 2015, 58, 1280–1292. [Google Scholar] [CrossRef]
  31. Lei, L.; Shao, S.; Liang, L. An evolutionary deep learning model based on EWKM, random forest algorithm, SSA and BiLSTM for building energy consumption prediction. Energy 2024, 288, 129795. [Google Scholar] [CrossRef]
  32. Maidamwar, P.R.; Lokulwar, P.P.; Kumar, K. Ensemble Learning Approach for Classification of Network Intrusion Detection in IoT Environment. Int. J. Comput. Netw. Inf. Secur. 2023, 15, 30–36. [Google Scholar] [CrossRef]
  33. Li, D.; He, X.; Dai, X. Improved kernel principal component analysis algorithm for network intrusion detection. ICIC Express Lett. 2016, 10, 971–975. [Google Scholar]
  34. Zaky, A.A.; Ghoniem, R.M.; Selim, F. Precise Modeling of Proton Exchange Membrane Fuel Cell Using the Modified Bald Eagle Optimization Algorithm. Sustainability 2023, 15, 10590. [Google Scholar] [CrossRef]
  35. Serinelli, B.M.; Collen, A.; Nijdam, N.A. Training Guidance with KDD Cup 1999 and NSL-KDD Data Sets of ANIDINR: Anomaly-Based Network Intrusion Detection System. Procedia Comput. Sci. 2020, 175, 560–565. [Google Scholar] [CrossRef]
  36. Jain, S.; Kotsampasakou, E.; Ecker, G.F. Comparing the performance of meta-classifiers—A case study on selected imbalanced data sets relevant for prediction of liver toxicity. J. Comput.-Aided Mol. Design. 2018, 32, 583–590. [Google Scholar] [CrossRef] [PubMed]
  37. Óscar, M.G.; Sancho, N.J.C.; Ávila, V.M.; Caro, L.A. A Novel Ensemble Learning System for Cyberattack Classification. Intell. Autom. Soft Comput. 2023, 37, 1691–1709. [Google Scholar]
  38. Vanitha, S.; Balasubramanie, P. Improved Ant Colony Optimization and Machine Learning Based Ensemble Intrusion Detection Model. Intell. Autom. Soft Comput. 2022, 36, 849–864. [Google Scholar] [CrossRef]
  39. Huang, Z.; Xu, X.; Zuo, L. Reinforcement learning with automatic basis construction based on isometric feature mapping. Inf. Sci. 2014, 286, 209–227. [Google Scholar] [CrossRef]
  40. Li, M.; Luo, X.; Yang, J.; Sun, Y. Applying a Locally Linear Embedding Algorithm for Feature Extraction and Visualization of MI-EEG. J. Sens. 2016, 2016, 7481946:1–7481946:9. [Google Scholar] [CrossRef]
  41. Fang, X.; Zhang, H.; Gao, S.; Tan, Y. Imbalanced web spam classification based on nested rotation forest. ICIC Express Lett. 2015, 9, 937–944. [Google Scholar]
  42. Coolen-Maturi, T.; Coolen, F.P.A.; Alabdulhadi, M. Nonparametric predictive inference for diagnostic test thresholds. Commun. Stat. Theory Methods 2020, 49, 697–725. [Google Scholar] [CrossRef]
  43. Pradhan, B.; Sameen, M.I.; Al-Najjar, H.A.; Sheng, D.; Alamri, A.M.; Park, H.J. A Meta-Learning Approach of Optimisation for Spatial Prediction of Landslides. Remote Sens. 2021, 13, 4521. [Google Scholar] [CrossRef]
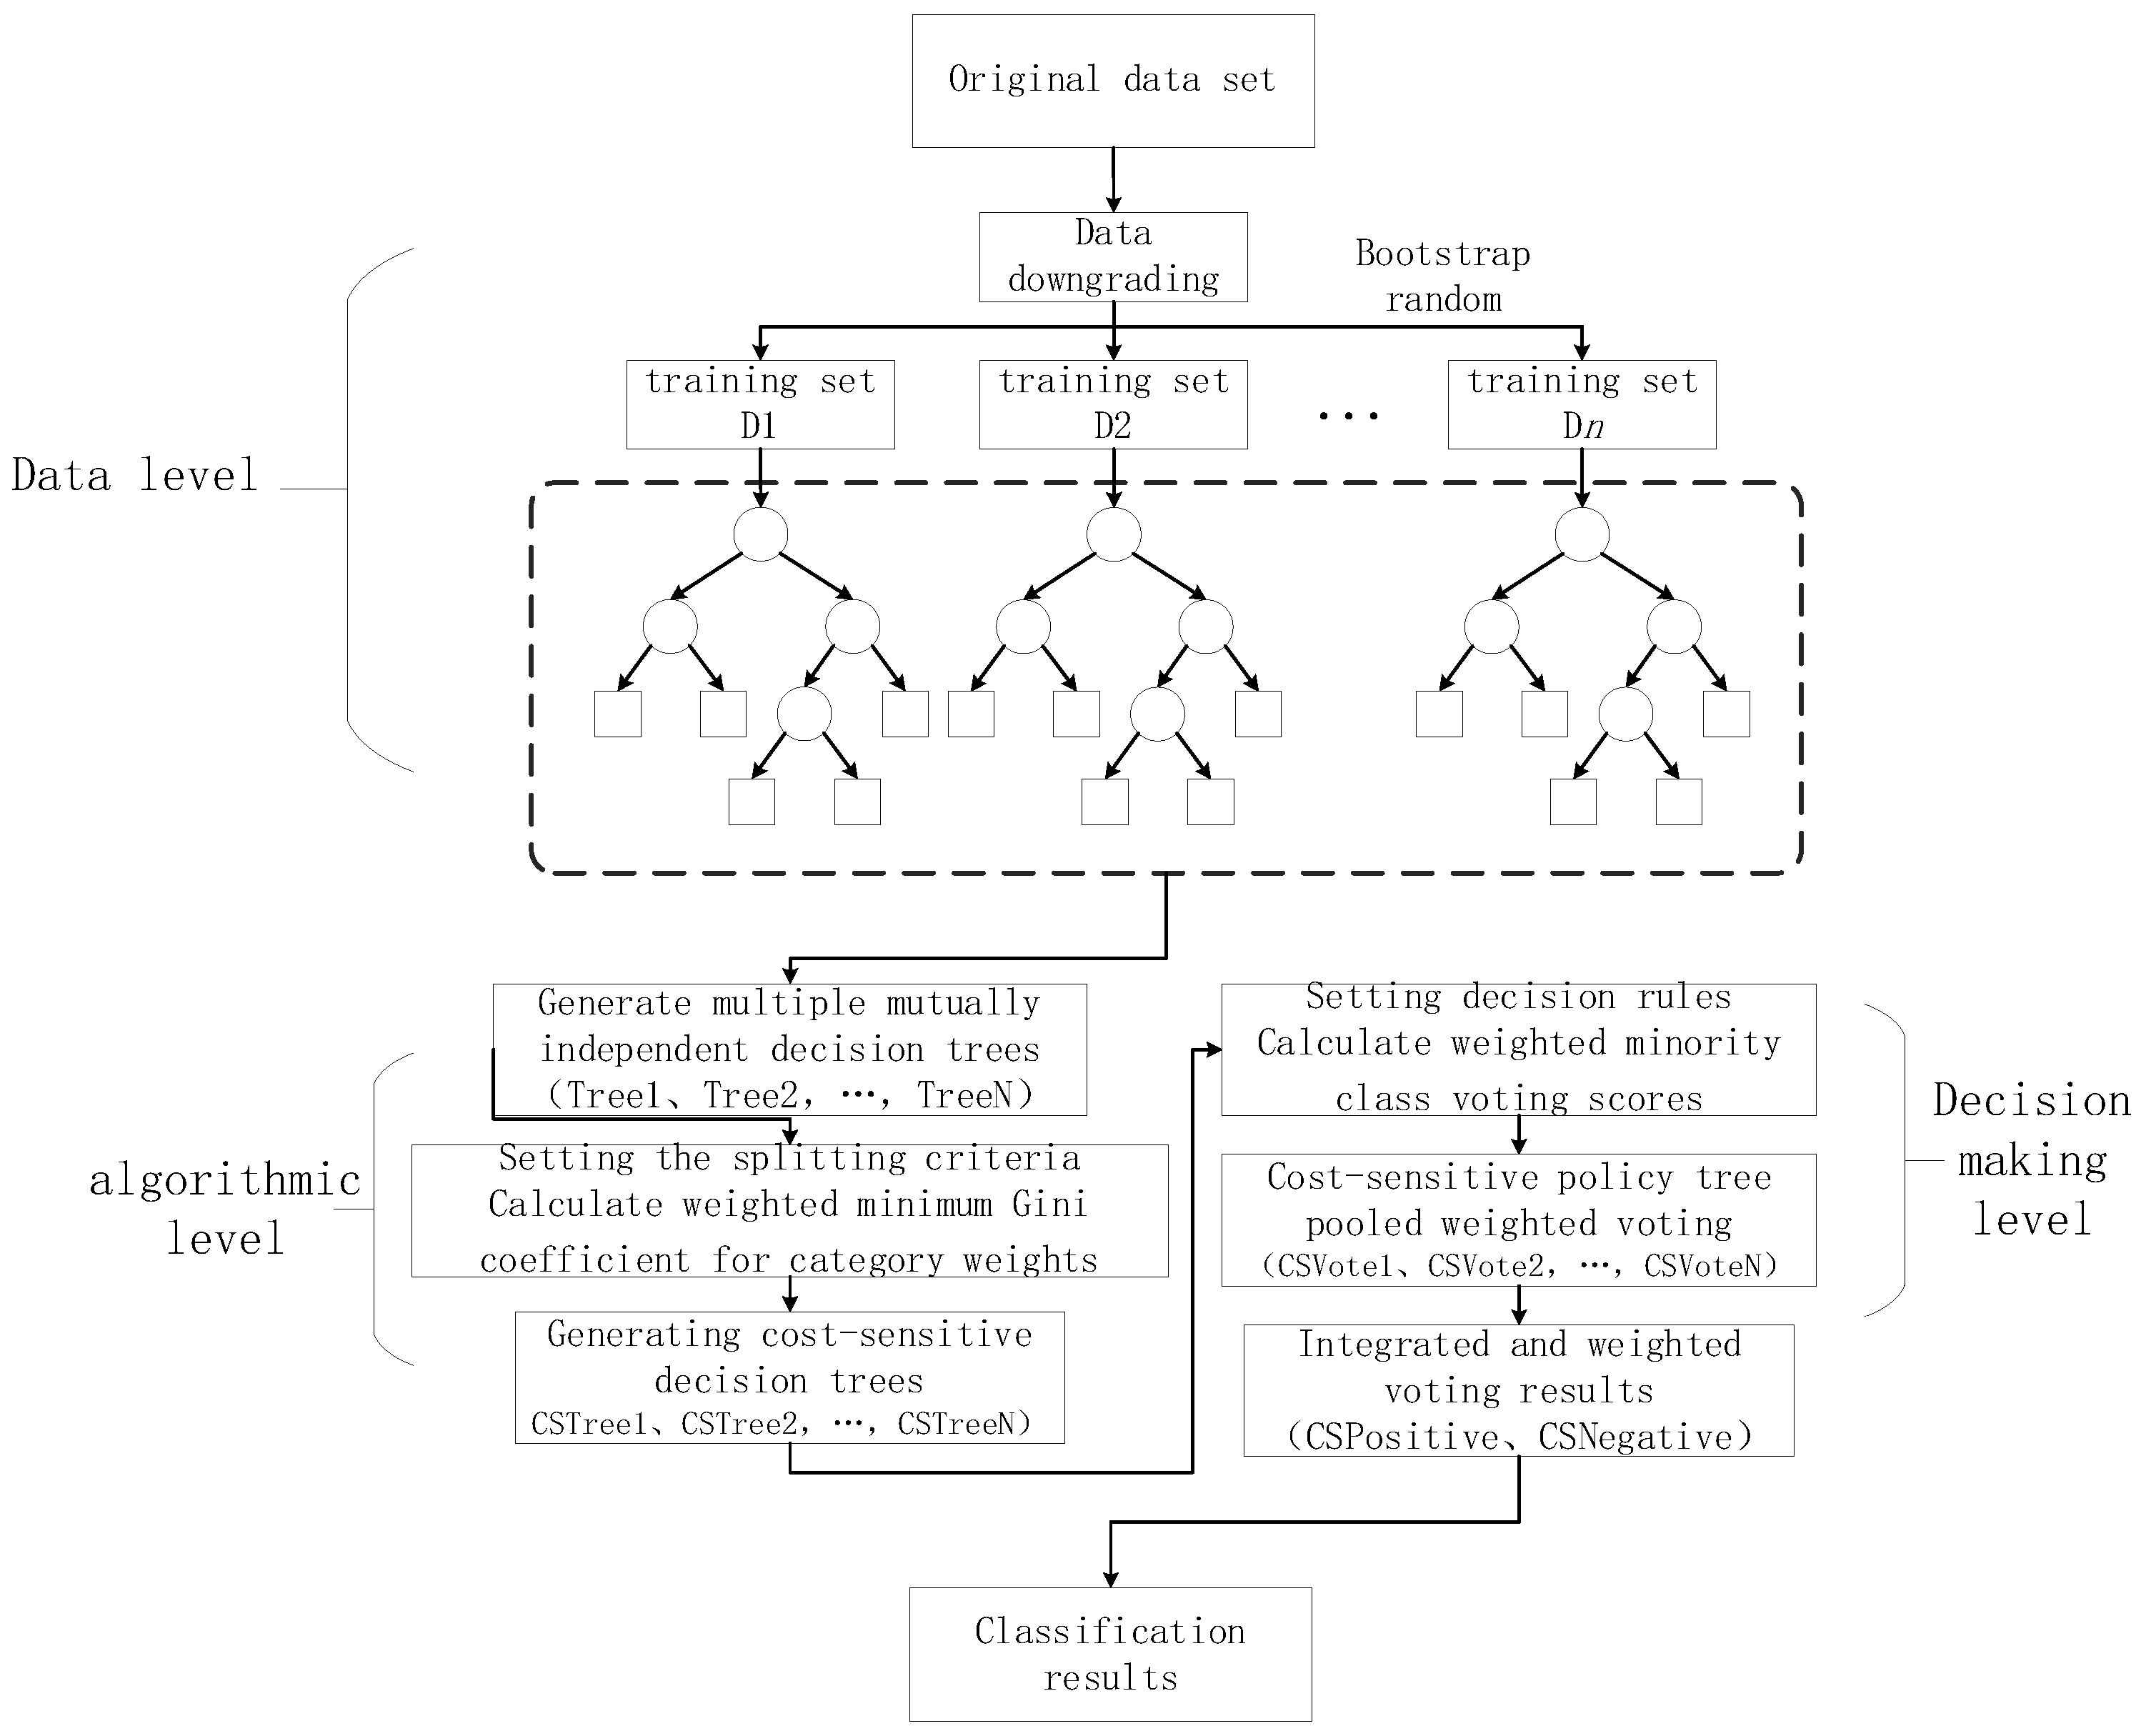
Figure 1. Key steps and improvement ideas.
Applsci 14 00714 g001
Figure 2. Intrusion-detection algorithm process.
Applsci 14 00714 g002
Figure 3. Heat map related to cumulative contribution rate of features.
Applsci 14 00714 g003
Figure 4. Feature cumulative contribution rate.
Applsci 14 00714 g004
Figure 5. Trend chart of the cumulative contribution rate of features.
Applsci 14 00714 g005
Figure 6. Classification and comparison of multiple algorithms.
Applsci 14 00714 g006
Table 1. Information in UNSW-NB15 training and testing.
UNSW-NB15
Testing and Training Sets
Training SetTesting Set
Normal56,00037,000
Anallysis2000677
Backdoor1746583
Dos12,2644089
Exploits33,39311,132
Fuzzers18,1846062
Generic40,00018,871
Reconnaissance10,4913496
Shellcode1133378
Worms13044
Total175,34182,332
Table 2. Confusion Matrix.
StatusJudged as an AttackJudged as a Norm
Attack trafficTPFP
Normal flowFNTN
Table 3. Dimensionality reduction algorithm comparison results.
B-KPCAPCAISOMAPLLE
Accuracy after
dimensionality reduction/%
97.2590.2187.4293.27
Dimensionality reduction time/s9.165.4729.8425.74
Table 4. Classification and comparison of multiple algorithms.
AlgorithmAcc/%Sen/%Spe/% G-Mean Training TimeTest Time
Traditional RF model93.1199.3087.510.932223.89 s0.87 s
Unbalanced ratio method -RF97.4798.0596.550.973027.46 s1.24 s
Youden Threshold method -RF97.3797.3997.340.973625.92 s1.28 s
Textual algorithm98.7098.3999.210.988012.57 s0.25 s
Disclaimer/Publisher’s Note: The statements, opinions and data contained in all publications are solely those of the individual author(s) and contributor(s) and not of MDPI and/or the editor(s). MDPI and/or the editor(s) disclaim responsibility for any injury to people or property resulting from any ideas, methods, instructions or products referred to in the content.