Article

Hybrid Clustering Algorithm Based on Improved Density Peak Clustering

Faculty of Information Technology, Beljing University of Technology, Beijing 100124, China
*
Author to whom correspondence should be addressed.
These authors contributed equally to this work.
Appl. Sci. 2024, 14(2), 715; https://doi.org/10.3390/app14020715
Submission received: 28 November 2023 / Revised: 4 January 2024 / Accepted: 5 January 2024 / Published: 15 January 2024

Abstract

:
In the era of big data, unsupervised learning algorithms such as clustering are particularly prominent. In recent years, there have been significant advancements in clustering algorithm research. The Clustering by Density Peaks algorithm is known as Clustering by Fast Search and Find of Density Peaks (density peak clustering). This clustering algorithm, proposed in Science in 2014, automatically finds cluster centers. It is simple, efficient, does not require iterative computation, and is suitable for large-scale and high-dimensional data. However, DPC and most of its refinements have several drawbacks. The method primarily considers the overall structure of the data, often resulting in the oversight of many clusters. The choice of truncation distance affects the calculation of local density values, and varying dataset sizes may necessitate different computational methods, impacting the quality of clustering results. In addition, the initial assignment of labels can cause a ‘chain reaction’, i.e., if one data point is incorrectly labeled, it may lead to more subsequent data points being incorrectly labeled. In this paper, we propose an improved density peak clustering method, DPC-MS, which uses the mean-shift algorithm to find local density extremes, making the accuracy of the algorithm independent of the parameter dc. After finding the local density extreme points, the allocation strategy of the DPC algorithm is employed to assign the remaining points to appropriate local density extreme points, forming the final clusters. The robustness of this method in handling uncertain dataset sizes adds some application value, and several experiments were conducted on synthetic and real datasets to evaluate the performance of the proposed method. The results show that the proposed method outperforms some of the more recent methods in most cases.

1. Introduction

Clustering algorithms, as a category of unsupervised learning techniques, are employed to partition objects within a dataset into clusters based on shared characteristics. The primary objective is to increase the similarity among objects within the same cluster while decreasing the similarity between objects in different clusters. This is achieved by maximizing intra-cluster similarity and minimizing inter-cluster similarity. The fundamental concept underlying clustering algorithms is to uncover inherent structures and patterns within the dataset without relying on pre-defined category labels. These algorithms determine whether objects should be grouped into the same cluster by evaluating their similarity or distance from each other.
Clustering algorithms find extensive applications across diverse domains. These include data mining, as demonstrated by“density-based algorithms for discovering clusters in noisy large spatial databases” [1], image processing, as illustrated in “efficient clustering methods for color segmentation of spatial images” [2], and bioinformatics, for tasks such as protein clustering for structural prediction [3]. They are also used in social network analysis, encompassing the identification of critical nodes through graph entropy [4], and market analysis, which includes customer segmentation using clustering techniques and social network analysis  [5].
Notably, recent work by Lotfi, Seyedi, and Moradi in 2017 introduced a method called IDPC (improved density peak clustering)  [6], which aimed at enhancing DPC-KNN by employing specific label propagation techniques based on voting strategies and local object density. In a similar vein, their work in 2019 introduced the DPC-DLP method, incorporating the concept of k-nearest neighbors to compute both global cutoff parameters and the local density of each data point. Subsequently, they applied a graph-based label propagation technique to assign labels to the remaining points, ultimately forming the final clusters. Nonetheless, both of these methods can encounter issues related to unstable and fluctuating cluster numbers when selecting density peak points for clustering. To address this limitation, a novel approach known as the hybrid clustering algorithm based on improved density peak clustering has been proposed. This algorithm, combining density peak clustering and mean-shift (DPC-MS), primarily comprises three key steps. First, in the initial stage, the mean-shift algorithm, augmented with kernel functions and adaptive bandwidth, is employed for iterative shifts to identify all local density extremum points. Following this, the second step calculates the adaptive distance from each data point to its nearest local density extremum point, following the principles of the DPC algorithm, thereby assigning the point to the closest local density extremum point. Finally, in the third step, a distance metric is devised. If the distance metric between two local density extremum points falls below a predefined threshold, they are grouped together to form a cluster.
This study introduces an improved density peak clustering algorithm that combines DPC (density peak clustering) with mean-shift, named DPC-MS. Through iterative experimentation and enhancements on classic benchmark datasets, the superiority of the DPC-MS algorithm in terms of clustering accuracy and robustness compared to other clustering algorithms is demonstrated. The DPC-MS algorithm demonstrates significant advantages in precision and robustness compared to other clustering algorithms. It not only overcomes the challenges faced by the DPC algorithm in effectively handling manifold data but also addresses the limitations of mean-shift in potentially misclassifying non-local density peak points. In contrast to existing approaches, the proposed method offers the following contributions:
  • In many of the existing DPC-related literature studies, such as the work by Rodriguez and Laio (2014) [7], as well as by Du and Wang (2021) [8], density estimation is typically performed using a fixed cut-off distance approach. However, this method raises concerns regarding the reliability of density estimation, particularly when dealing with small-scale datasets. Hence, in this study, we depart from relying on the parameter dc within the DPC algorithm and instead employ the mean-shift algorithm to locate local density peaks. This strategic shift ensures that our algorithm is no longer influenced by the parameter dc, thus facilitating more accurate identification of core objects. By utilizing this approach to locate density peaks, we can precisely and efficiently identify cluster cores and even define the number of clusters as needed. This method significantly enhances the reliability and applicability of the clustering algorithm.
  • The DPC algorithm is sensitive to parameter selection, requiring users to specify a neighborhood distance threshold. This threshold is crucial in determining both the number of peak density points and the quality of clustering results. In many existing DPC methods, such as those described by Lotfi et al. (2019) [9], commonly used distance metrics like the Euclidean distance are typically employed to assign labels to each data instance based on their proximity to the nearest cluster core. However, this label propagation method is often limited to spherical clusters.  This paper introduces a novel adaptive distance metric approach aimed at identifying not only spherical clusters but also clusters of various shapes and densities. The core concept of this adaptive distance measurement involves automatically adjusting distances based on the data’s density. It accomplishes this by expanding distances between sparse points and contracting distances between dense points, enabling more precise identification of density peaks. Moreover, this approach allows us to discover clusters with complex non-spherical shapes. It enables our algorithm to adapt to clusters of different densities and shapes, thereby enhancing its practical applicability in practical scenarios.

2. Related Works

The primary objective of clustering is to group a set of data objects into distinct clusters, achieving high intra-cluster similarity and low inter-cluster similarity. Data clustering methods have found widespread application in fields such as machine learning, pattern recognition, and video image analysis. Over the past few decades, numerous clustering algorithms have been developed, addressing this challenge from various perspectives successfully. Density peak clustering (DPC) is a relatively recent addition to the family of clustering methods. Its core idea revolves around placing cluster centers in regions of higher density compared to their neighbors while maintaining a distance from lower-density points. This concept allows us to intuitively determine the number of clusters and automatically identify and exclude outliers, irrespective of their shapes. This capability enables DPC to form non-spherical clusters. Additionally, DPC operates without the need for an iterative process and swiftly identifies the final clusters, exhibiting numerous advantages.
However, a significant limitation of the DPC method lies in its sensitivity to the manual selection of cluster centers and their parameters. To address this limitation, various improvements have been proposed. These enhancements encompass methods for more efficient density value measurements  [10], strategies for automatic cluster number determinations  [11], effective label assignment mechanisms  [12], and extensions of DPC to diverse application domains, including mixed data, high-spectral-band selection, and large-scale data analysis. This paper’s focus is on enhancing the automated determination of cluster centers within the DPC method, with contributions such as the approach proposed by Bie et al. (2016)  [13]. These improvements make the DPC method more versatile and robust.

2.1. Improved Density Peak Clustering Algorithm

In pursuit of this goal, the initial step involves the selection of a substantial number of centers to establish sub-clusters, which are subsequently merged using heuristic techniques based on pattern similarity. However, this approach exclusively takes into account the inter-cluster distance during merging, neglecting other cluster attributes, which diminishes its effectiveness when dealing with intricate data structures. Luo and Deng (2017)  [14] introduced a semi-supervised density peak clustering (DPC) algorithm known as SSDPC. This algorithm leverages labeled data to enhance clustering performance both on labeled and unlabeled data. Nevertheless, when dealing with extensive datasets, substantial volumes of labeled data are essential to furnish adequate supervisory information, and the precision of the labeled data significantly influences the outcomes.  Liang and Chen (2016)  [15] sought to enhance the DPC method through the implementation of a divide-and-conquer strategy. This method autonomously identifies the number of clusters without relying on expert knowledge. However, it primarily takes into account the global data structure and, in comparison to the original DPC, leads to a loss of numerous clusters, resulting in reduced performance. In a different approach, Xu et al. (2016)  [16] proposed a hierarchical density peak method (DenPEHC) by introducing a grid granularity framework. DenPEHC demonstrates the ability to cluster high-dimensional and large-scale data effectively. It automatically identifies all potential centers and constructs a hierarchical representation if the dataset inherently exhibits a hierarchical structure.
One notable drawback shared among these methods lies in their ineffective label allocation strategy. When computing density values, they exclusively consider the global data structure, overlooking the local structure, which can lead to the omission of certain clusters.  In pursuit of improving the automatic determination of cluster centers, our approach adopts a hybrid clustering methodology, which combines various clustering techniques or models to enhance clustering performance on intricate datasets. This approach leverages the principles of diverse clustering algorithms to bolster the DPC algorithm’s capability to autonomously determine unstable cluster centers.

2.2. Hybrid Clustering Algorithm

A hybrid clustering algorithm is a methodology that combines multiple clustering algorithms to improve the quality of clustering outcomes. The following are notable works in the domain of hybrid clustering algorithms: Pacifico and Ludermir (2021) [17] introduced a hybrid clustering algorithm that integrates K-means with particle swarm optimization techniques. This approach harnesses the combined strengths of K-means and particle swarm optimization to achieve enhanced clustering performance. Drias et al. (2017)  [18] presented a hybrid clustering algorithm that amalgamates deep learning technology for feature extraction with K-Means for clustering. This fusion of methodologies serves to elevate clustering performance. Shu Wang (2019)  [19] introduced an innovative approach to tackle the clustering challenge posed by mixed-type data. The method initially employs density peak clustering to identify potential data clusters. Subsequently, for discrete variables within mixed-type data, it utilizes partition-based techniques to enhance cluster partitioning. This combination of density peak clustering and partition-based methods aims to improve clustering performance. Feng et al. (2022) [20] introduced an enhanced Grey Wolf Optimizer (GWO) algorithm combined with the K-harmonic means (KHM) clustering algorithm into a hybrid clustering algorithm. The enhanced GWO algorithm initiates the clustering centers, followed by the KHM clustering algorithm to fine-tune the outcomes. This hybrid algorithm aims to enhance clustering performance, particularly when dealing with intricate datasets.
Hybrid clustering algorithms combine clustering techniques with hybrid models, effectively addressing challenges such as noise, uncertainty, and uneven data distribution in the clustering process. Recent research in this area has predominantly focused on proposing novel hybrid clustering algorithms and applying them to data analysis across diverse fields.

3. Theoretical Basis

In this section, we introduced two basic algorithms: the density peak clustering algorithm and the mean-shift algorithm.

3.1. Density Peak Clustering Algorithm

The full name of the clustering algorithm for density peaks is Clustering by Fast Search and Find of Density Peaks (DPC). This algorithm, proposed in Science in 2014  [7], can automatically discover cluster centers and is noted for its simplicity and efficiency, requiring no iterative calculations. It is particularly suitable for processing large-scale and high-dimensional data.
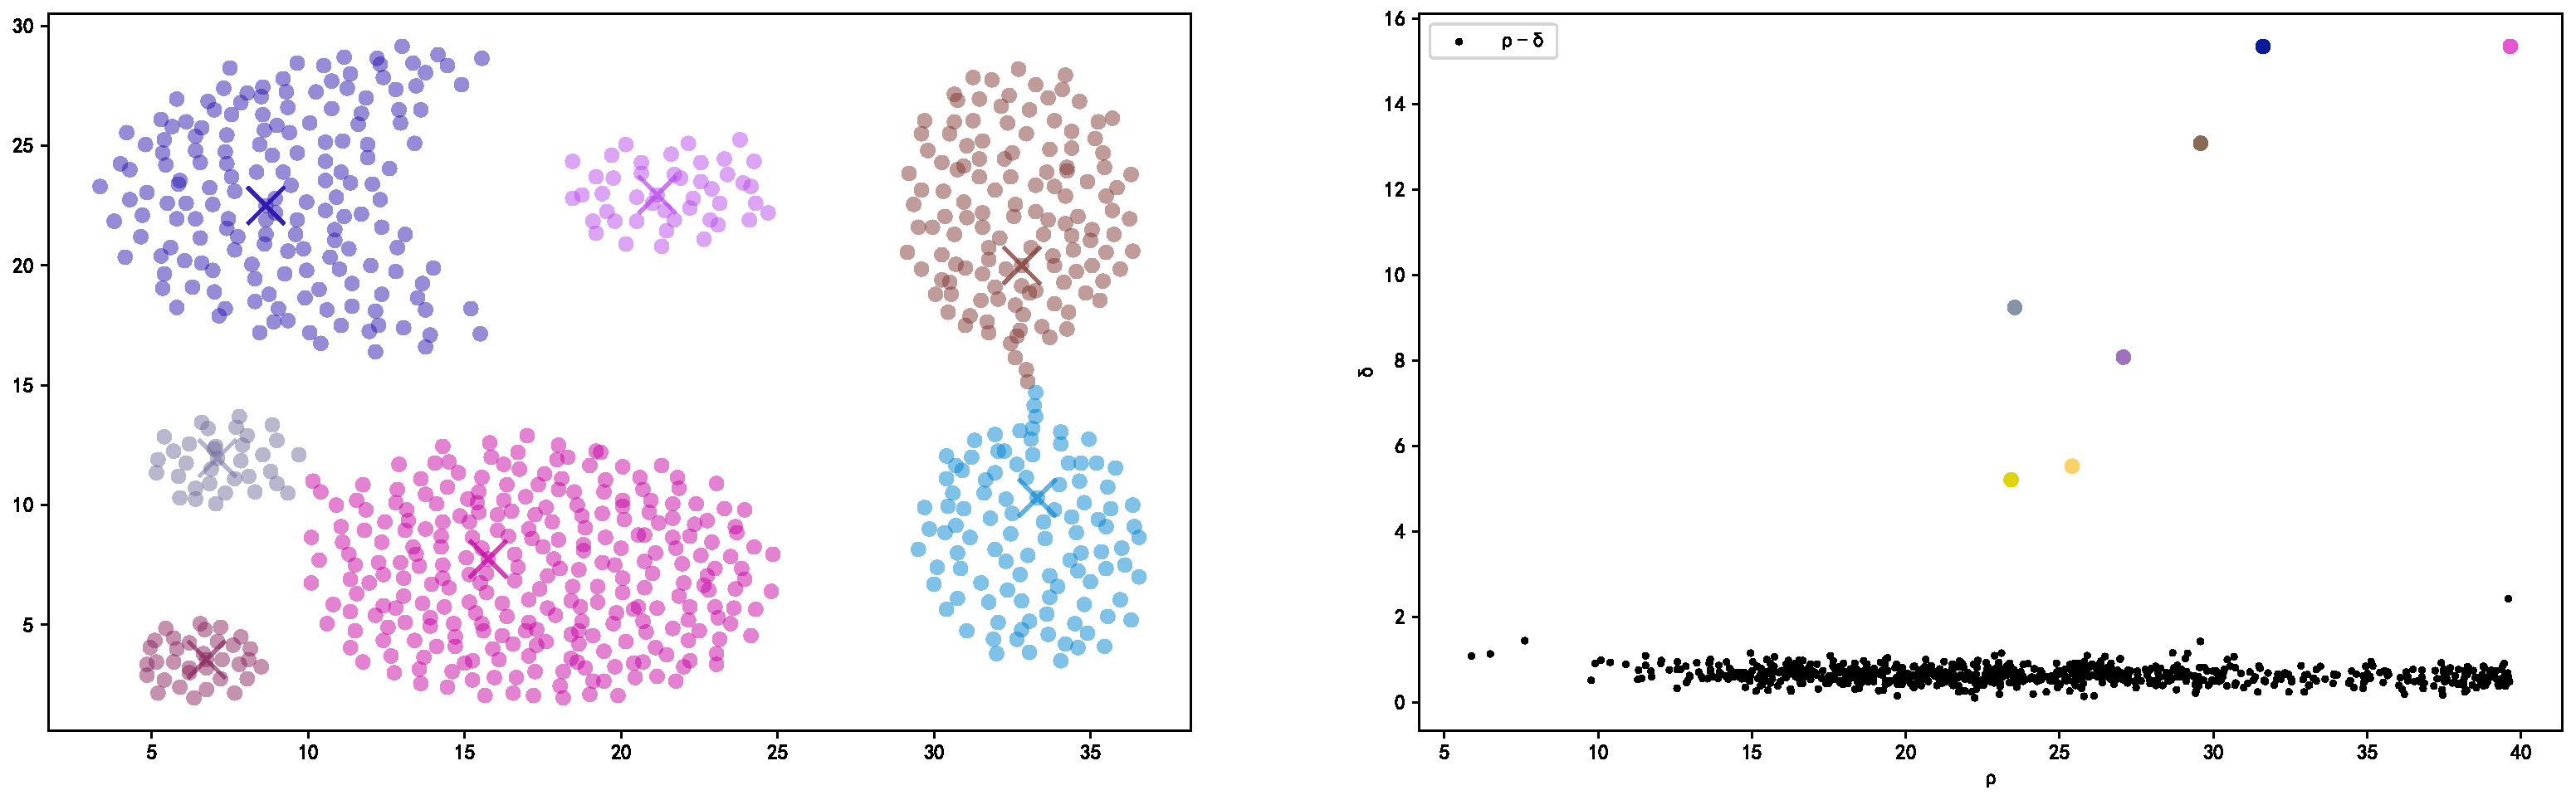
  • The algorithm operates based on two underlying assumptions: (1) The local density of the cluster center (density peak point) exceeds that of its neighboring data points within a defined locality. (2) The distance separating the cluster center from other cluster centers is notably substantial. Two critical parameters play a pivotal role in this algorithm: local density ( ρ ) and the distance ( δ ) between data points and their respective local density extreme points. The definitions are as follows:
    ρ i = i j χ ( d i j d c )
    χ ( x ) = 1 , x < = 0 0 , x = > 0
In this context, χ ( x ) represents a logical decision function, d i j signifies the Euclidean distance between data points x i and x j , and d c denotes the truncation distance, used to calculate δ i , which is chosen as the 1% to 2% quantile value of the sorted d i j distances. The meaning of ρ ( i ) is as follows: with x i as the center and d c as the radius, it determines whether x j lies within the circle, where the local density of x j is defined as the count of points within this circle. When there are data points with a higher density around a given data point, the minimum distance from each data point to other points with a higher local density than itself is denoted as δ i . For data points with the highest local density, δ i values are determined as follows:
δ i = min j : ρ j > ρ i d i j , i f j s . t . ρ j > ρ i m a x j d i j , o t h e r w i s e
The DPC algorithm sorts instances by their ρ value and δ , and then identifies the top c instances as cluster centers. The decision function is as follows:
s c o r e ( χ i ) = δ i ρ i
The data source for Figure 1 is referenced in [7]. The left image shows the shape distribution of the data, and the right image shows the decision graph of the data. The labels “1”, “2”, and “3” on the points in the right image indicate the data points with the top three scores according to Equation (4).

3.2. Mean-Shift Algorithm

The mean-shift algorithm, a density-based clustering technique proposed relatively early, has progressively gained popularity due to continuous refinement by researchers. It finds extensive applications in the realm of computer vision, including video tracking, trajectory tracking, image segmentation, and various other domains.
  • For n sample points in R d within a d-dimensional space, represented as i = 1, …, n, and any point x within this space, the mean-shift vector of that point is defined as follows:
    M h = 1 K x i S k ( x i x )
Among these components, S k represents a two-dimensional circular region or a high-dimensional spherical region with a radius of h. K denotes the count of sample points falling within the S k region, which can also be expressed as the density of the sample point x i . M h represents the initial position of the sample point x i , and k points within the S k region are connected to form k vectors. The sum of these k vectors is computed and normalized by dividing it by k, resulting in the mean-shift vector of the sample point x i .
Starting with the mean-shift vector of the sample point x i , a circular or spherical region is delineated. The aforementioned steps are then iteratively performed to obtain a new mean-shift vector. Through successive iterations, under specific conditions, the mean-shift algorithm converges to the densest point, corresponding to the highest density point. This point of convergence is termed the local density extremum. Each iteration is recorded, along with the sample points involved in the calculation. After an iteration, an unreferenced sample point is randomly selected as the starting point x i , and the aforementioned iterative process is repeated until all points have been accounted for, as illustrated in Figure 2.
The local density extremum points derived from each iteration process serve as pseudo-cluster centers. Points documented throughout this procedure are allocated to these pseudo-cluster centers, with the possibility of multiple iterations yielding the same pseudo-cluster center. Consequently, all points recorded during the process are designated as pseudo-cluster centers. In instances where the distance between two pseudo-cluster centers falls below a specific threshold, they are merged into a single cluster. The dense pseudo-cluster centers thus become the true cluster centers, resulting in the final clustering outcome.
Presently, the enhanced mean-shift algorithm has integrated kernel functions to improve the precision of sample density estimation. The Gaussian kernel function is the most commonly used one. It operates by applying a kernel function at each sample point in the dataset, followed by the summation of all kernel functions to derive the kernel density estimation of the dataset. The mean-shift vector representation that includes a kernel function is as follows:
M h ( x ) = i = 1 n G ( x i x h i ) ( x i x ) i = 1 n G ( x i x h i )
Among them, G ( x i x h i ) is the kernel function. When considering the influence of distance, it is possible to incorporate a weight function for all data points to reflect their varying levels of significance. The weight function adopted in this article is the weighted Euclidean distance, and the formula is as follows:
d ( x i , y i ) = i = 1 n ( x i y i s i ) 2
s i is the standard deviation of the component, and the weighted Euclidean distance is taken into Equation (6) to obtain the following formula.
M h ( x ) = i = 1 n G ( d ( x i , x ) h i ) d ( x i , x ) i = 1 n G ( d ( x i , x ) h i )

3.3. DPC-MS Clustering Algorithm

In the DPC algorithm (Algorithm 1), the parameter setting for the cutoff distance, often denoted as d c , significantly impacts the algorithm’s accuracy. Currently, the selection of the parameter d c largely relies on empirical values, typically falling within a range of 1% to 2% of the dataset size, lacking a scientific foundation or formulaic derivation. The mean-shift algorithm’s advantage lies in its capacity to identify all existing local extreme points and its underlying theoretical knowledge. This article deviates from the DPC algorithm’s reliance on the d c parameter for locating density extremum points. Instead, it enhances the mean-shift algorithm’s concept to find all local density extremum points. The stepwise procedure is as follows:
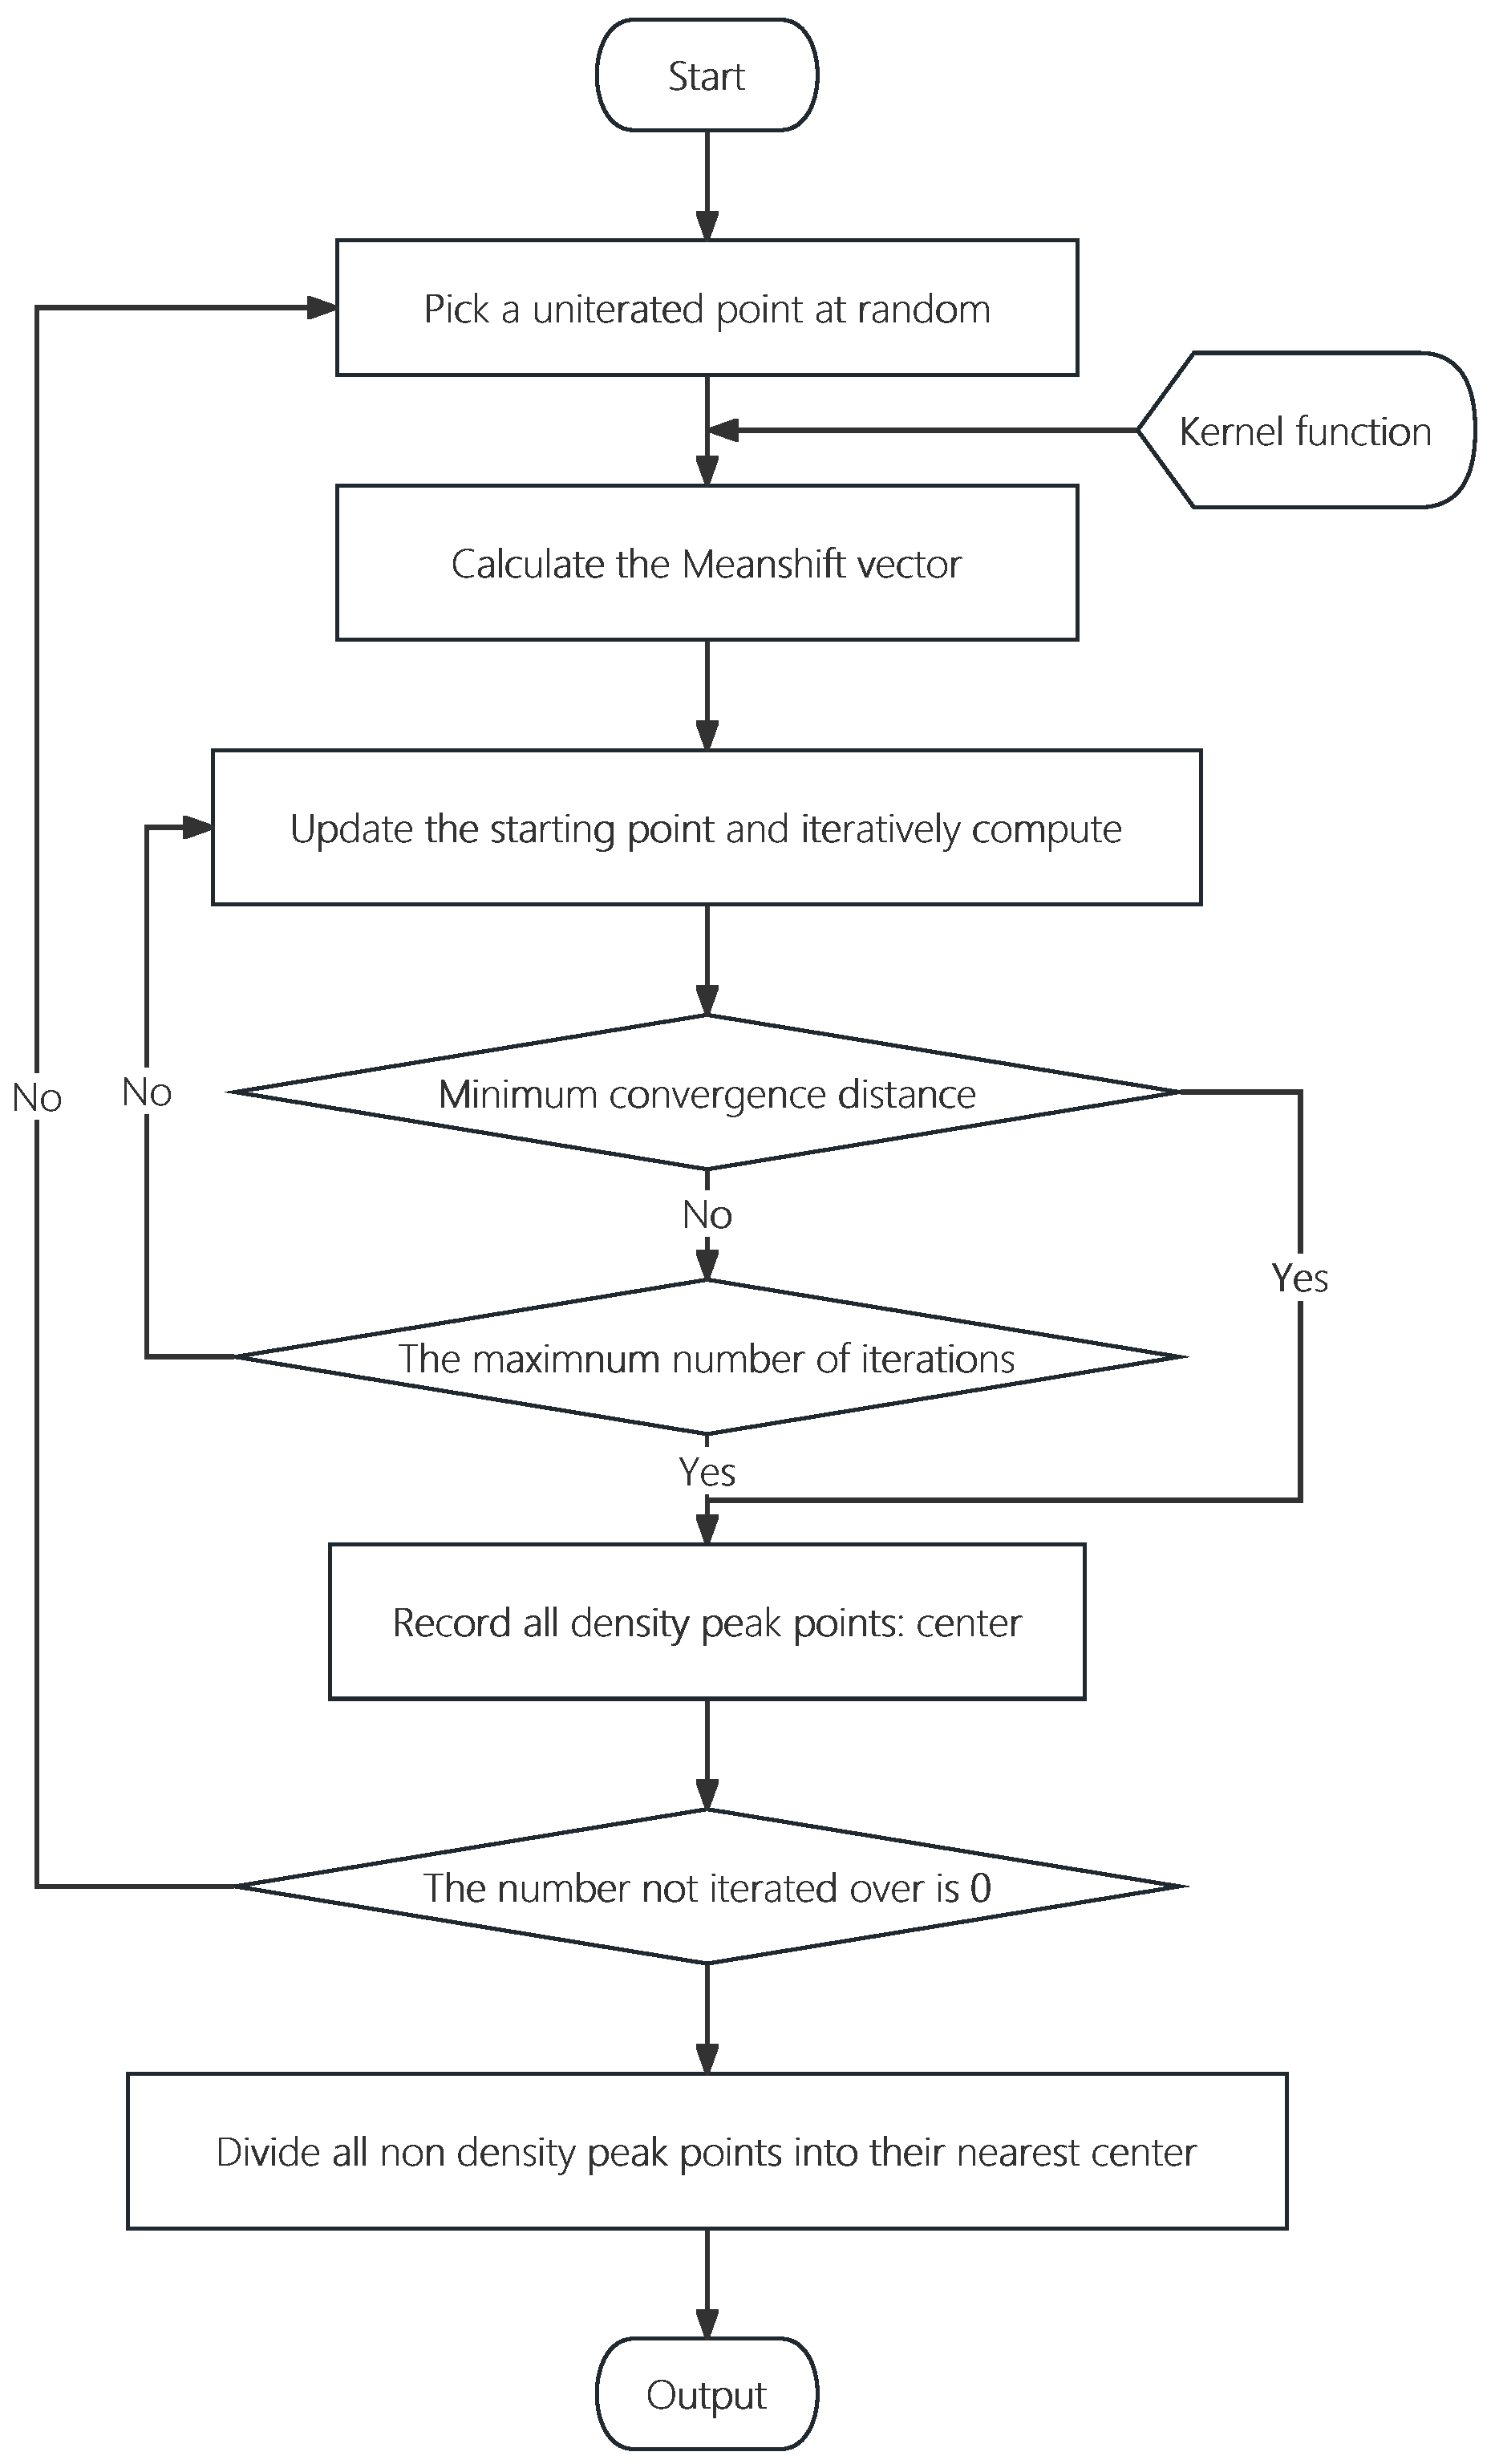
  • Randomly select an unmarked data point as the initial center point.
  • Utilize a Gaussian kernel function with a dynamic bandwidth: With an initial bandwidth of h = 2, calculate the number of data points with weights exceeding 10% within the range of the kernel function centered on the current point, denoted as n.
  • Compute the weight vectors for all data points falling within the range of the Gaussian kernel function centered on the current point. Aggregate these weight vectors to obtain the shift vector s h i f t and label the corresponding data points.
  • Update the center position by moving it in the direction of the shift vector | | s h i f t | | by an amount proportional to its magnitude: C e n t e r = C e n t e r + s h i f t .
  • Repeat steps 2, 3, and 4 until the magnitude of the shift vector | | s h i f t | | becomes very small (indicating convergence), and mark the current c e n t e r as a c o r e point.
  • Iterate steps 1 through 5 until all data points have been marked as accessed, and record all c o r e points.
  • Calculate the adaptive distance from each data point to each c o r e point and assign it to the closest c o r e ’s class.
  • Compute the weighted Euclidean distance between each pair of c o r e points. If this distance is less than a predefined threshold, merge the two c o r e classes, and merge the data points within these classes. The class of the current point set is determined based on which c o r e class has a larger number of n in its neighborhood.
Algorithm 1 Algorithm of DPC-MS.
Input: 
A dataset containing n objects.
Output: 
Cluster center points, the final clustering results.
1:
Pick a uniterater n i at random
2:
while  A ! = n u l l  do
3:
   Calculate( n i , n j )
4:
   while  d ( x i , y i ) < M i n D i s t a n c e  do
5:
     if  i t e r a t e d < M a x I t e r a t i o n s  then
6:
         n i = n j
7:
        Calculate( n i , n j )
8:
     else
9:
        write result set: center
10:
     end if
11:
   end while
12:
end while
13:
Divide all non-density peak points into their nearest center
14:
return Outputs
To address the limitations of the DPC algorithm, including the absence of a theoretical foundation for the parameter d c setting and its propensity to trigger cascading effects, as well as to mitigate the potential misallocation issues associated with the mean-shift algorithm during the shifting process, this paper introduces the DPC-MS algorithm. The DPC-MS algorithm is developed by integrating the initial phase of the mean-shift algorithm with the latter portion of the DPC algorithm, thereby harnessing the strengths of both approaches. Additionally, the concept of weighted Euclidean distance is introduced to quantify the separation between two points, facilitating an iterative process. Figure 2 illustrates the iterative flowchart of the DPC-MS algorithm.

4. Experiments

In this section, a series of experiments were carried out to assess the effectiveness of the proposed DPC-MS method. A comparative analysis was performed by benchmarking it against some of the most advanced clustering techniques currently available, including SNN-DPC, as introduced by Liu et al. in 2018 [21], and DPC-KNN, as proposed by Du et al. in 2021 [22]. The experiments were conducted on a personal computer equipped with an Intel i5-2520 M CPU, 16GB of RAM, running on a Windows 10 64-bit operating system, utilizing the PYTHON 3.9 programming environment.

4.1. Datasets

The experimental evaluation was carried out using a total of nine datasets, consisting of four synthetic datasets and eight real-world datasets gathered from the UCI machine learning repository [23].

4.2. Evaluation Metrics

To effectively gauge and compare the outcomes, we employed several established evaluation metrics to assess the performance of the clustering methodology. These metrics include accuracy (ACC), the Rand index (RI), and the adjusted Rand index (ARI). Accuracy serves as an indicator for measuring the correspondence between the clustering results generated by algorithms and the ground truth clusters. The formulation of this metric is as follows:
A C C ( Y , C ) = i = 1 n δ ( y i , c i ) / n
where n denotes the number of samples, y i and c i are the true label and the predicted label of a sample x i , and the δ function represents whether y i and c i are the same. If they are the same, it is 1, and if they are not the same, it is 0. The adjusted Rand index (ARI) is a metric used to assess clustering results by assuming a generalized hypergeometric distribution as the randomness model. This measure is defined as follows:
A R I ( Y , C ) = i , j n i j 2 i n i 2 j n j 2 / n 2 1 / 2 [ i n i 2 + j n j 2 ] i n i 2 j n j 2 / n 2
Among these equations, Y represents the clustering result, and C represents the true clustering labels. n i j denotes the number of samples that are in both clusters c i and y j , while n i and n j represent the total number of samples in clusters c i and y j , respectively. It is important to note that ARI is an adjusted version of RI and is used as an external standard for comparing clustering results. The RI value falls within the range 0 , 1 , whereas the ARI value falls within the range 1 , 1 .
R a n d I n d e x ( Y , C ) = ( a + b ) n 2
In the formula, n represents the total number of samples, Y and C denote two distinct clustering sets, a signifies the logarithm of samples belonging to the same cluster in Y and C, and b represents the logarithm of samples belonging to different groups (non-similar groups) in Y and C. It is important to note that the Rand index (RI) falls within the range of 0 to 1. When two sets of clustering results are identical, RI assumes a value of 1, and when the two sets of clustering results are entirely dissimilar, it equals 0.

4.3. Results

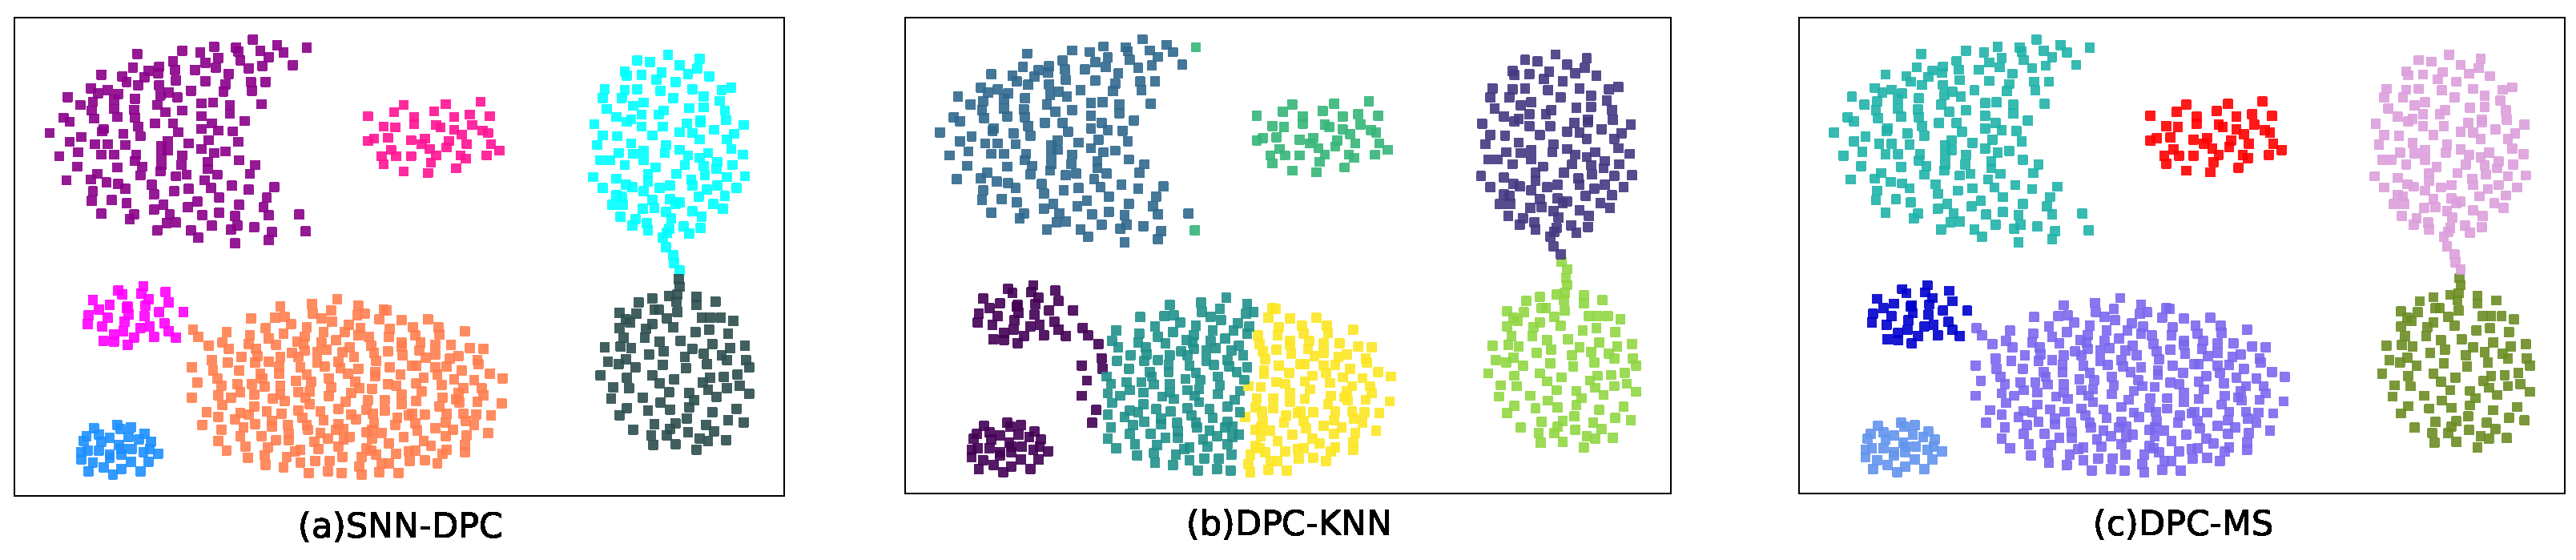
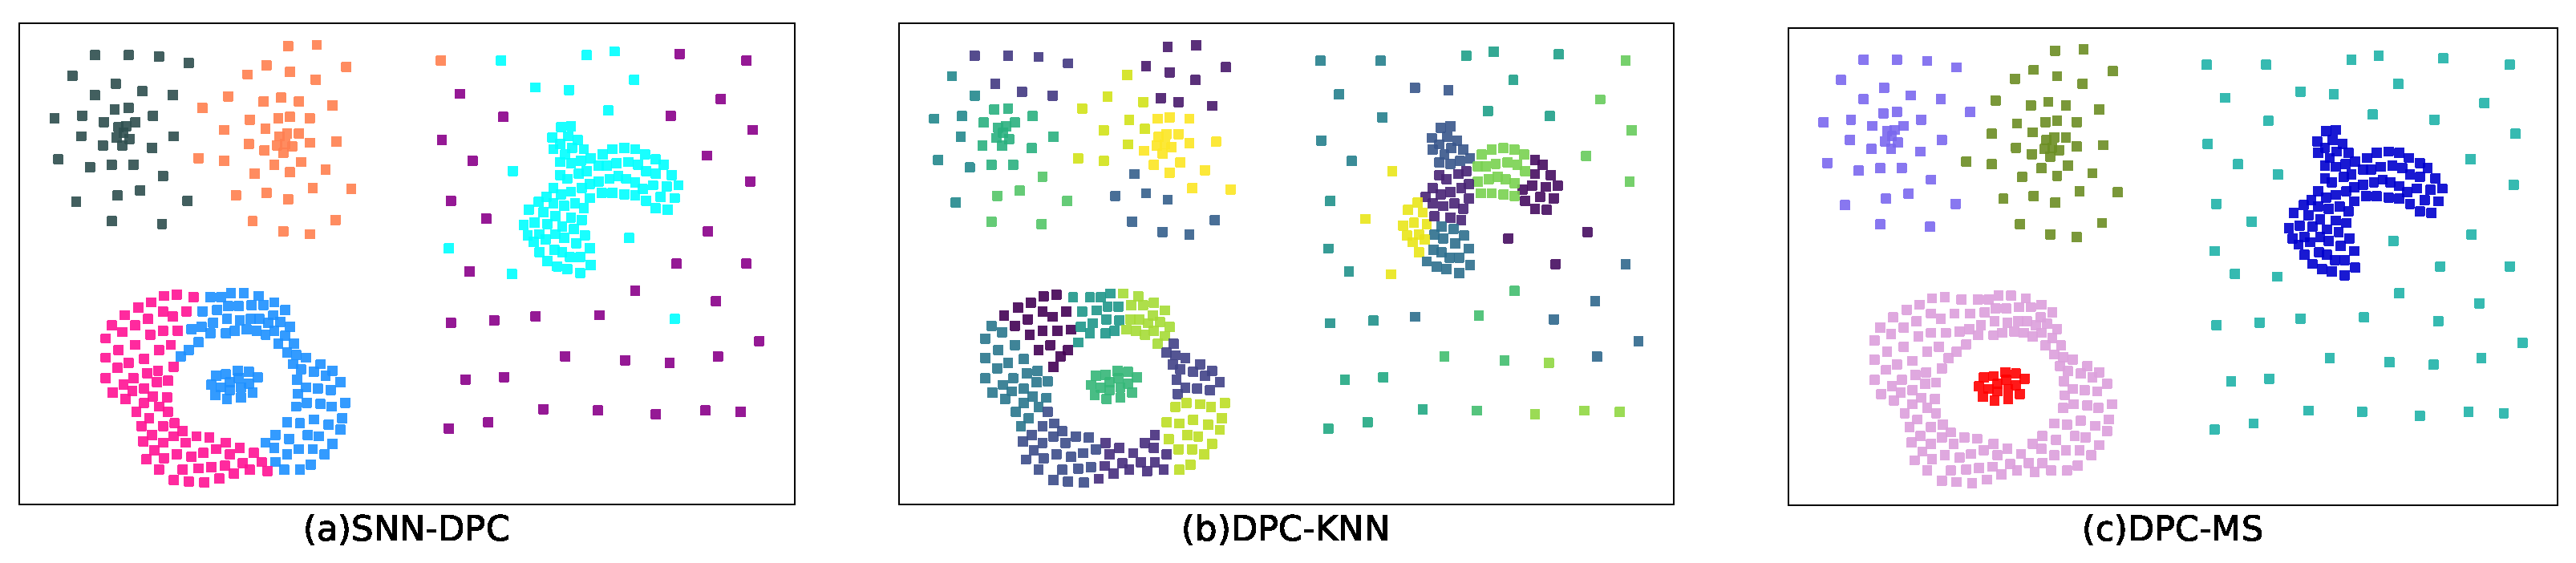
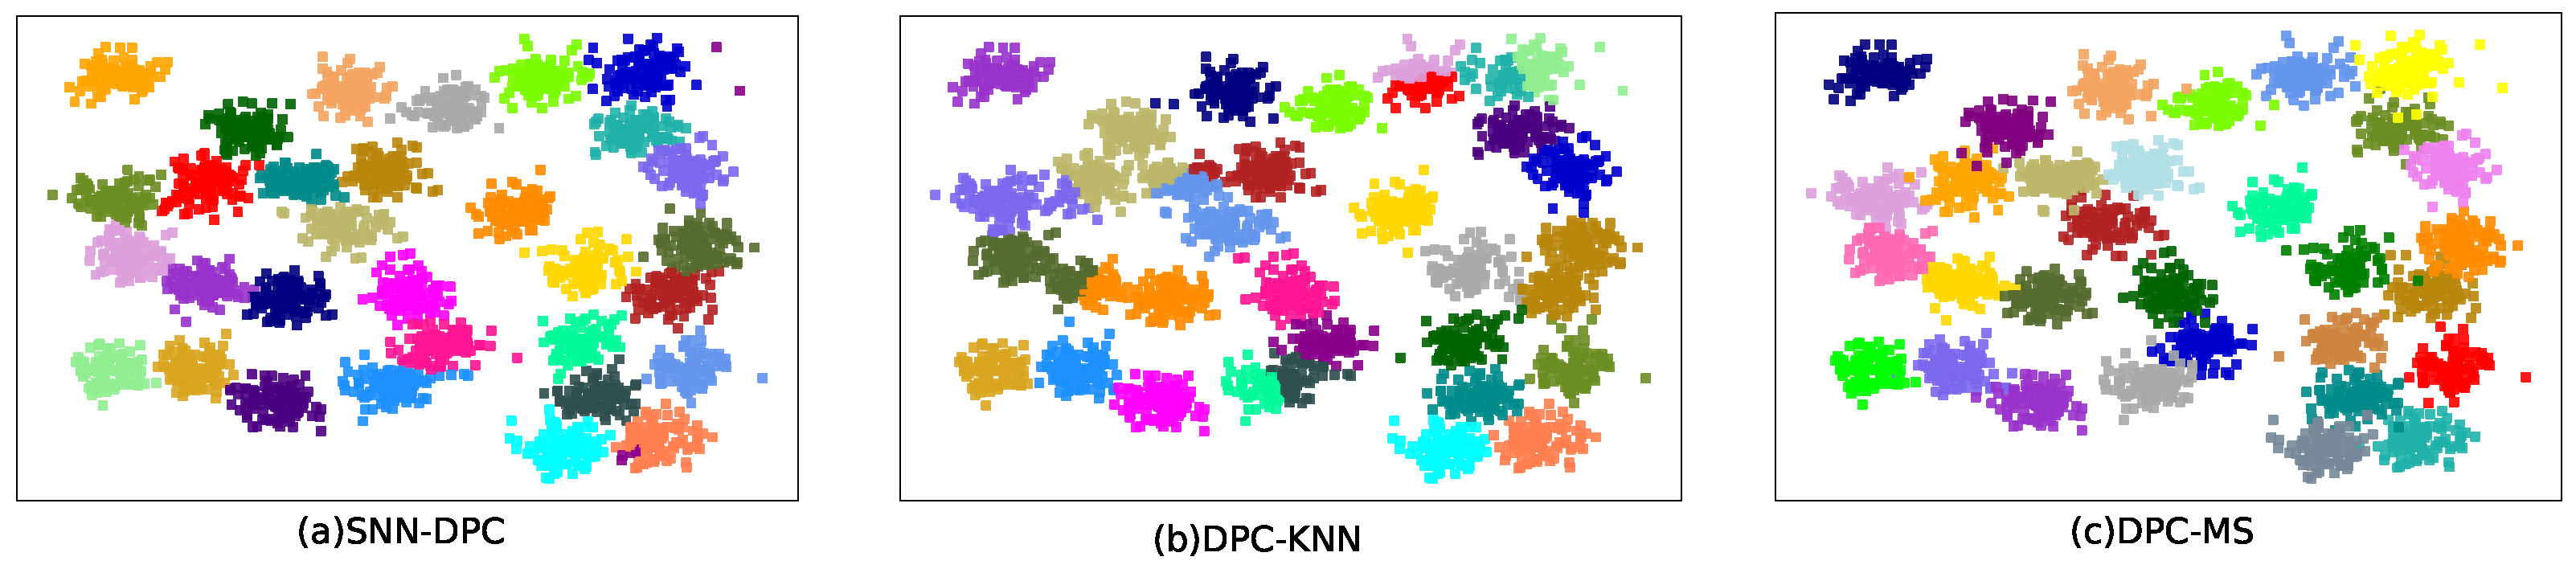
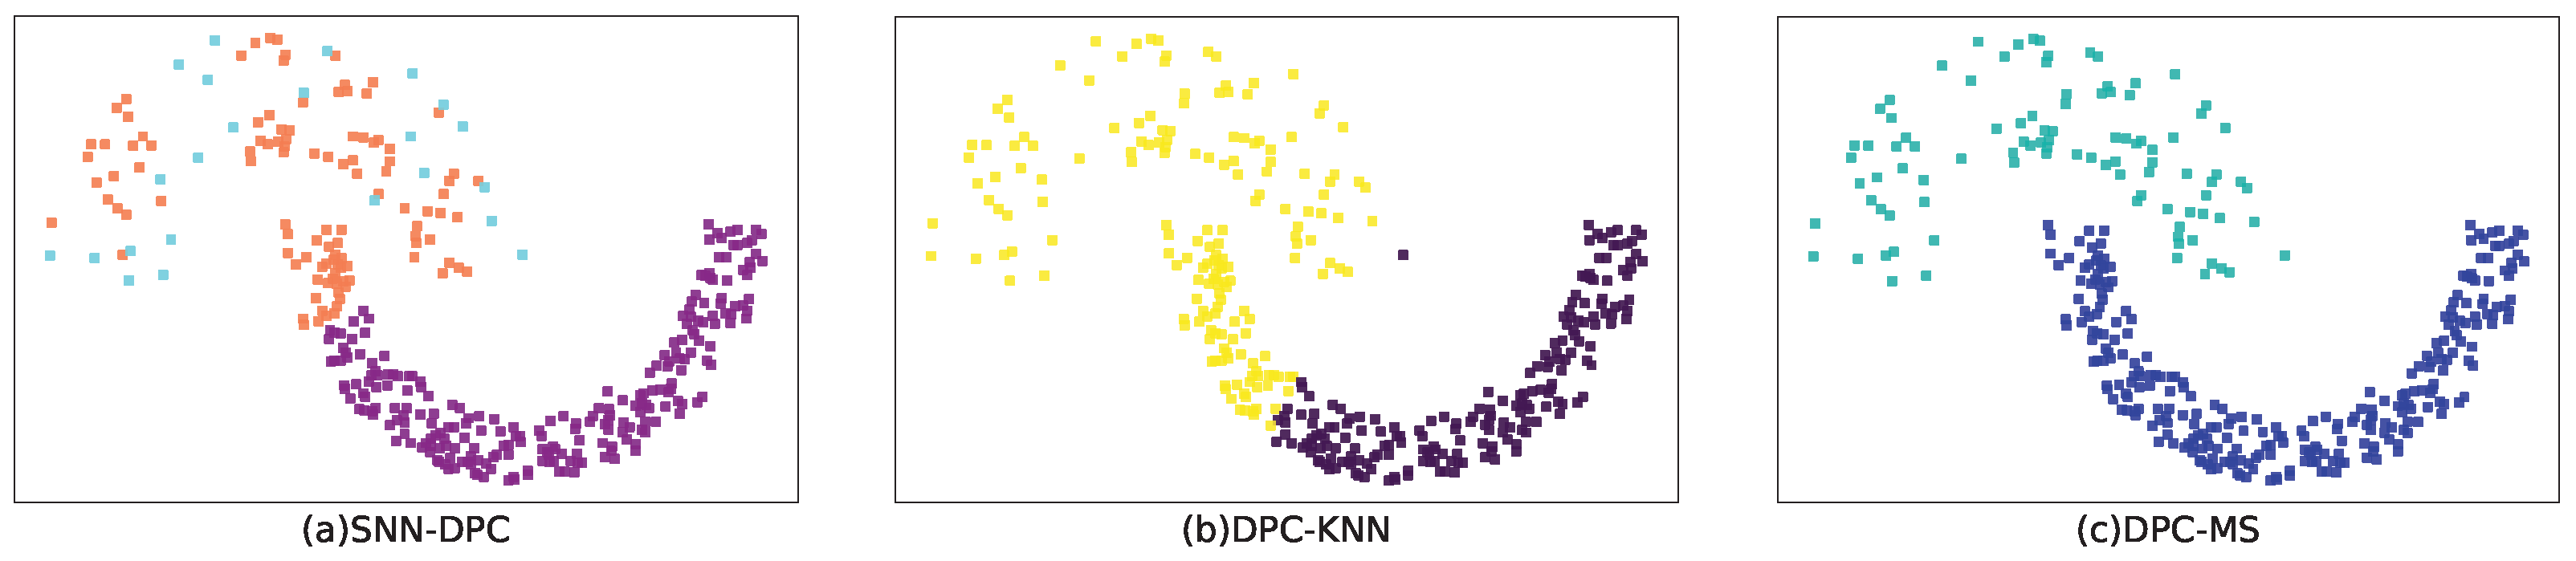
Results on Public Datasets

The objective of this section is to conduct a comparative analysis of clustering algorithms on four composite datasets.
Figure 3 presents a comparison of the results achieved by our method against those obtained by the SNN-DPC and DPC-KNN clustering algorithms. The findings demonstrate the effectiveness of the approach outlined in this section, as it successfully assigns true labels to data instances. However, it is noteworthy that DPC-KNN, when the correct number of clusters is selected, may still encounter challenges related to the truncation distance ( d c ) parameter in the DPC algorithm. Specifically, Figure 3b illustrates an instance where DPC-KNN erroneously clustered 116 data points. In contrast, owing to the optimization of local density and relative distance calculations utilizing shared nearest neighbors, SNN-DPC exhibits strong performance, particularly on datasets characterized by full convexity. Repeated experiments were conducted on the Compound dataset, the D31 dataset, and the Jain dataset, with the results presented in Figure 4, Figure 5 and Figure 6, respectively.
In Figure 4a, the points located on the right-hand side of the graph form a U-shaped cluster, often referred to as noise points. In such cases, neither the DPC-KNN method nor the SNN-DPC method can accurately classify these noise points. Furthermore, as observed in the results depicted in Figure 4, both the DPC-KNN and SNN-DPC methods struggle to classify circular clusters. In contrast, the DPC-MS method employs adaptive distance calculations during the classification process, leveraging local structures to preserve the primary cluster structure.
In Figure 5a, SNN-DPC is found to be highly sensitive to noise points and poses challenges in parameter selection. In Figure 5b, even when setting the parameter k of DPC-KNN to match the number of clusters in the real dataset, some allocation errors persist. The reliance on local density leads to a limited ability to differentiate between closely related clusters. However, the DPC-MS method, as shown in Figure 5a while also sensitive to noise, demonstrates fewer erroneous allocation points compared to the previous two methods.
Figure 6b reveals that both the SNN-DPC and DPC-KNN methods struggle to accurately classify connectivity or boundary points. The results in Figure 6b show that the DPC-KNN method fails to accurately classify multiple points (88 samples) located in the boundary region and other regions. Similarly, the SNN-DPC method also struggles to correctly classify multiple points (64 samples) located in the boundary region and other regions. In contrast, the method proposed in this article successfully classifies all points in this dataset.
Based on the observations from Figure 3, Figure 4, Figure 5 and Figure 6, it can be inferred that our method outperforms the SNN-DPC and DPC-KNN methods. Specifically, our method demonstrates superior performance in correctly classifying complex clusters, including connected points (located in the boundary region) and circular clusters. However, it is important to note that it may not achieve 100% accuracy in classifying the noisy sample.
We conducted multiple experiments to assess the performance of the proposed methodology on various datasets and the outcomes are presented in Table 1, Table 2 and Table 3. Table 1 compares the ACC evaluation metrics of SNN-DPC, DPC-KNN, and DPC-MS. The table highlights the best results in bold, indicating that our approach outperformed others in all instances except for the E. coli dataset. The reason why the DPC-MS algorithm performs poorly on the E. coli dataset is that there is a large density difference in the E. coli dataset. When the DPC-MS algorithm searches for the true number of clusters by calculating density, it is affected by the M i n D i s t a n c e parameter, resulting in a discrepancy between the calculated results and the actual results.
Table 2 presents a comparison of the Rand Index (RI) evaluation metrics. The results demonstrate that, in the majority of cases, our proposed approach yields the most favorable outcomes. Additionally, the experiments compared methods that adjust the Rand Index (ARI). Based on these results, it is evident that the performance of the DPC-MS algorithm significantly surpasses that of other contemporary clustering techniques. The reason for the particular RI and ARI evaluation metrics of the DPC-MS algorithm in the Thyroid dataset is the high degree of crossover between the various clusters in the Thyroid dataset, and there are many mutually inclusive situations between the clusters, which leads to them being mistaken by DPC-MS for noise or being misclassified.

5. Conclusions

This article presents a novel density peak clustering method, DPC-MS, which is grounded in hybrid clustering. This approach amalgamates the strengths of the mean-shift algorithm and the DPC algorithm while mitigating their respective weaknesses. DPC-MS comprises three pivotal steps. Firstly, during the initial phase, iterative shifts are performed utilizing kernel functions and an adaptive bandwidth-enhanced mean-shift algorithm to identify all local density extremum points. Subsequently, in the second step, the adaptive distance from each data point to its closest local density extremum point is computed, based on the principles of the DPC algorithm, thereby assigning the point to its nearest local density extremum point. Finally, in the third step, the method employs a weighted Euclidean distance for distance weight calculation to improve the performance of the DPC-MS algorithm in clustering non-convex shapes. This method not only overcomes the challenges faced by the DPC algorithm in efficiently handling manifold data but also addresses the limitations of the mean-shift algorithm in potentially misclassifying non-local density peaks, thus averting the El Niño effect induced by misclassification. To gauge the effectiveness of the proposed method, extensive experiments were conducted on both synthetic and real datasets, with the results underscoring the efficacy and robustness of the proposed approach.

Author Contributions

Conceptualization, L.G. and W.Q.; methodology, Z.C.; software, X.S.; validation, W.Q.; investigation, L.G.; writing—original draft preparation, W.Q.; writing—review and editing, L.G.; visualization, X.S. All authors have read and agreed to the published version of the manuscript.

Funding

This research received no external funding.

Institutional Review Board Statement

Not applicable.

Informed Consent Statement

Not applicable.

Data Availability Statement

The data presented in this study are available on request from the corresponding author. The data are not publicly available due to restrictions.

Conflicts of Interest

The authors declare no conflict of interest.

References

  1. Ester, M.; Kriegel, H.P.; Sander, J.; Xu, X. A density-based algorithm for discovering clusters in large spatial databases with noise. kdd 1996, 96, 226–231. [Google Scholar]
  2. Chen, T.Q.; Murphey, Y.L.; Karlsen, R.; Gerhart, G. Color Image Segmentation in Color and Spatial Domain. In Proceedings of the Developments in Applied Artificial Intelligence: 16th International Conference on Industrial and Engineering Applications of Artificial Intelligence and Expert Systems, IEA/AIE 2003, Loughborough, UK, 23–26 June 2003; pp. 72–82. [Google Scholar]
  3. Huang, L.; Wang, G.; Wang, Y.; Pang, W.; Ma, Q. A link density clustering algorithm based on automatically selecting density peaks for overlapping community detection. Int. J. Mod. Phys. B 2016, 30, 1650167. [Google Scholar] [CrossRef]
  4. Mehmood, R.; Zhang, G.; Bie, R.; Dawood, H.; Ahmad, H. Clustering by fast search and find of density peaks via heat diffusion. Neurocomputing 2016, 208, 210–217. [Google Scholar] [CrossRef]
  5. Saini, A.; Saraswat, S.; Faujdar, N. Clustering Based Stock Market Analysis. Int. J. Control. Theory Appl. 2017, 10. [Google Scholar]
  6. Seyedi, S.A.; Lotfi, A.; Moradi, P.; Qader, N.N. Dynamic graph-based label spread for Density Peaks Clustering. Expert Syst. Appl. 2019, 115, 314–328. [Google Scholar] [CrossRef]
  7. Rodriguez, A.; Laio, A. Clustering by fast search and find of density peaks. Science 2014, 344, 1492–1496. [Google Scholar] [CrossRef] [PubMed]
  8. Du, H.; Ni, Y.; Wang, Z. An Improved Algorithm Based on Fast Search and Find of Density Peak Clustering for High-Dimensional Data. Wirel. Commun. Mob. Comput. 2021, 2021, 9977884. [Google Scholar] [CrossRef]
  9. Lotfi, A.; Seyedi, S.A.; Moradi, P. An improved density peaks method for data clustering. In Proceedings of the International Conference on Computer & Knowledge Engineering, Mashhad, Iran, 20–20 October 2016. [Google Scholar]
  10. Wang, Z.; Wang, Y. A New Density Peak Clustering Algorithm for Automatically Determining Clustering Centers. In Proceedings of the 2020 International Workshop on Electronic Communication and Artificial Intelligence (IWECAI), Shanghai, China, 12–14 June 2020; pp. 128–134. [Google Scholar]
  11. Wang, J.; Zhang, Y.; Lan, X. Automatic cluster number selection by finding density peaks. In Proceedings of the 2016 2nd IEEE International Conference on Computer and Communications (ICCC), Chengdu, China, 14–17 October 2016; pp. 13–18. [Google Scholar]
  12. Hou, J.; Zhang, A. Enhancing Density Peak Clustering via Density Normalization. IEEE Trans. Ind. Inform. 2020, 16, 2477–2485. [Google Scholar] [CrossRef]
  13. Bie, R.; Mehmood, R.; Ruan, S.; Sun, Y.; Dawood, H. Adaptive fuzzy clustering by fast search and find of density peaks. Pers. Ubiquitous Comput. 2016, 20, 785–793. [Google Scholar] [CrossRef]
  14. Dan, L.; Cheng, M.X.; Hao, D. A Semi-supervised Density Peak Clustering Algorithm. Geogr. Geo-Inf. Sci. 2017, 32, 69–74. [Google Scholar]
  15. Liang, Z.; Chen, P. Delta-density based clustering with a divide-and-conquer strategy: 3DC clustering. Pattern Recognit. Lett. 2016, 73, 52–59. [Google Scholar] [CrossRef]
  16. Xu, J.; Wang, G.; Deng, W. DenPEHC. Inf. Sci. 2016, 373, 200–218. [Google Scholar] [CrossRef]
  17. Pacifico, L.D.S.; Ludermir, T.B. Hybrid K-Means and Improved Self-Adaptive Particle Swarm Optimization for Data Clustering. In Proceedings of the 2019 International Joint Conference on Neural Networks (IJCNN), Budapest, Hungary, 14–19 July 2019; pp. 1–7. [Google Scholar]
  18. Drias, H.; Cherif, N.F.; Kechid, A. k-MM: A Hybrid Clustering Algorithm Based on k-Means and k-Medoids. In Advances in Nature and Biologically Inspired Computing. Advances in Intelligent Systems and Computing; Pillay, N., Engelbrecht, A., Abraham, A., du Plessis, M., Snášel, V., Muda, A., Eds.; Springer: Cham, Switzerland, 2016; Volume 419. [Google Scholar]
  19. Wang, S.; Yabes, J.G.; Chang, C.C.H. Hybrid Density- and Partition-based Clustering Algorithm for Data with Mixed-type Variables. J. Data Sci. 2019, 19, 15–36. [Google Scholar] [CrossRef]
  20. Xu, L.; Zhao, J.; Yao, Z.; Shi, A.; Chen, Z. Density Peak Clustering Based on Cumulative Nearest Neighbors Degree and Micro Cluster Merging. J. Signal Process. Syst. 2019, 91, 1219–1236. [Google Scholar] [CrossRef]
  21. Xue, F.; Liu, Y.; Ma, X.; Pathak, B.; Liang, P. A hybrid clustering algorithm based on improved GWO and KHM clustering. J. Intell. Fuzzy Syst. 2022, 42, 3227–3240. [Google Scholar] [CrossRef]
  22. Liu, R.; Wang, H.; Yu, X. Shared-nearest-neighbor-based clustering by fast search and find of density peaks. Inf. Sci. 2018, 450, 200–226. [Google Scholar] [CrossRef]
  23. Lichman, M. UCI Machine Learning Repository. University of California, School of Information and Computer Science. 2013. Available online: http://archive.ics.uci.edu/ml (accessed on 6 January 2024).
Figure 1. Sample data instances and the corresponding decision graph.
Applsci 14 00715 g001
Figure 2. DPC-MS algorithm iteration flowchart.
Applsci 14 00715 g002
Figure 3. (a) The clustering results of SNN-DPC, (b) DPC-KNN, and (c) the proposed method (DPC-MS) on the Aggregation dataset.
Applsci 14 00715 g003
Figure 4. (a) The clustering results of SNN-DPC, (b) DPC-KNN, and (c) the proposed method (DPC-MS) on the Compound dataset.
Applsci 14 00715 g004
Figure 5. (a) The clustering results of SNN-DPC, (b) DPC-KNN, and (c) the proposed method (DPC-MS) on the D31 dataset.
Applsci 14 00715 g005
Figure 6. (a) The clustering results of SNN-DPC, (b) DPC-KNN, and (c) the proposed method (DPC-MS) on the Jain dataset.
Applsci 14 00715 g006
Table 1. Comparison of the results using ACC. The best results are presented in bold.
DatasetsSNN-DPCDPC-KNNDPC-MS
Seeds0.81170.81770.8469
Thyroid0.73950.63690.7566
Iris0.85430.86680.9234
Parkinson0.74920.64950.7844
Spiral0.50030.52790.5643
Diabetes0.61270.60160.6573
E. coli0.72560.78580.7814
Path-based0.75810.66530.8356
Table 2. Comparison of the results using RI. The best results are presented in bold.
DatasetsSNN-DPCDPC-KNNDPC-MS
Seeds0.87930.87950.8932
Thyroid0.76920.60640.7383
Iris0.89670.91240.9542
Parkinson0.62690.59290.6940
Spiral0.53760.52220.5674
Diabetes0.54980.58300.5923
E. coli0.84620.86810.8683
Path-based0.74780.65070.8175
Table 3. Comparison of the results using ARI. The best results are presented in bold.
DatasetsSNN-DPCDPC-KNNDPC-MS
Seeds0.71090.72770.7646
Thyroid0.57900.20770.4582
Iris0.77460.80150.9133
Parkinson0.22480.17130.2586
Spiral0.00640.04430.5643
Diabetes0.08040.16590.1795
E. coli0.50590.69250.6961
Path-based0.46920.30030.6308
Disclaimer/Publisher’s Note: The statements, opinions and data contained in all publications are solely those of the individual author(s) and contributor(s) and not of MDPI and/or the editor(s). MDPI and/or the editor(s) disclaim responsibility for any injury to people or property resulting from any ideas, methods, instructions or products referred to in the content.

