
Synthesis and Electrochemical Properties of Fe3O4/C Nanocomposites for Symmetric Supercapacitors


Abstract
1. Introduction
2. Sample Preparation and Testing Techniques
3. Results and Discussions
4. Conclusions
Author Contributions
Funding
Institutional Review Board Statement
Informed Consent Statement
Data Availability Statement
Conflicts of Interest
References
- Barsukov, I.V.; Johnson, C.S.; Doninger, J.E.; Barsukov, V.Z. (Eds.) New Carbon Based Materials for Electrochemical Energy Storage Systems: Batteries, Supercapacitors and Fuel Cells; Springer: Dordrecht, The Netherlands, 2006; Volume 229, 523p, ISBN 978-1-4020-4812-8. [Google Scholar]
- Smith, S.C.; Sen, P.K.; Kroposki, B. Advancement of energy storage devices and applications in electrical power systems. In Proceedings of the 2008 IEEE Power and Energy Society General Meeting-Conversion and Delivery of Electrical Energy in the 21st Century, Pittsburgh, PA, USA, 20–24 July 2008; pp. 1–8. [Google Scholar] [CrossRef]
- Novas, N.; Alcayde, A.; Robalo, I.; Manzano-Agugliaro, F.; Montoya, F.G. Energies and Its Worldwide Research. Energies 2020, 13, 6700. [Google Scholar] [CrossRef]
- Burke, A.F.; Zhao, J. Development, Performance, and Vehicle Applications of High Energy Density Electrochemical Capacitors. Appl. Sci. 2022, 12, 1726. [Google Scholar] [CrossRef]
- Panhwar, I.H.; Ahmed, K.; Seyedmahmoudian, M.; Stojcevski, A.; Horan, B.; Mekhilef, S.; Aslam, A.; Asghar, M. Mitigating Power Fluctuations for Energy Storage in Wind Energy Conversion System Using Supercapacitors. IEEE Access 2020, 8, 189747–189760. [Google Scholar] [CrossRef]
- Cabrane, Z.; Kim, J.; Yoo, K.; Ouassaid, M. HESS-based photovoltaic/batteries/supercapacitors: Energy management strategy and DC bus voltage stabilization. Sol. Energy 2021, 216, 551–563. [Google Scholar] [CrossRef]
- Plebankiewicz, I.; Przybył, W. Solar Energy Storage—Solution based on commercial silicon solar cells and supercapacitors. Przegląd Elektrotechniczny 2022, 1, 139–142. [Google Scholar] [CrossRef]
- Jefimowski, W.; Nikitenko, A.; Drążek, Z.; Wieczorek, M. Stationary supercapacitor energy storage operation algorithm based on neural network learning system. Bull. Pol. Acad. Sci. Tech. Sci. 2020, 68, 733–738. [Google Scholar] [CrossRef]
- Zhang, L.; Hu, X.; Wang, Z.; Sun, F.; Dorrell, D.G. A review of supercapacitor modeling, estimation, and applications: A control/management perspective. Renew. Sustain. Energy Rev. 2018, 81, 1868–1878. [Google Scholar] [CrossRef]
- Navarro, G.; Torres, J.; Blanco, M.; Nájera, J.; Santos-Herran, M.; Lafoz, M. Present and Future of Supercapacitor Technology Applied to Powertrains, Renewable Generation and Grid Connection Applications. Energies 2021, 14, 3060. [Google Scholar] [CrossRef]
- Wieczorek, M.; Lewandowski, M.; Jefimowski, W. Cost comparison of different configurations of a hybrid energy storage system with battery-only and supercapacitor-only storage in an electric city bus. Bull. Pol. Acad. Sci. Tech. Sci. 2019, 67, 1095–1106. [Google Scholar] [CrossRef]
- Sahin, M.E.; Blaabjerg, F.; Sangwongwanich, A.A. Comprehensive Review on Supercapacitor Applications and Developments. Energies 2022, 15, 674. [Google Scholar] [CrossRef]
- Ko, R.; Carlen, M. Principles and applications of electrochemical capacitors. Electrochem. Acta 2000, 45, 2483–2498. [Google Scholar] [CrossRef]
- Libich, J.; Máca, J.; Vondrák, J.; Čech, O.; Sedlaříková, M. Supercapacitors: Properties and applications. J. Energy Storage 2018, 17, 224–227. [Google Scholar] [CrossRef]
- González, A.; Goikolea, E.; Barrena, J.A.; Mysyk, R. Review on supercapacitors: Technologies and materials. Renew. Sustain. Energy Rev. 2016, 58, 1189–1206. [Google Scholar] [CrossRef]
- Winter, M.; Brodd, R.J. What Are Batteries, Fuel Cells, and Supercapacitors? Chem. Rev. 2004, 104, 4245–4270. [Google Scholar] [CrossRef]
- Alkire, R.C.; Bartlett, P.N.; Lipkowski, J. (Eds.) Electrochemistry of Carbon Electrodes; Wiley-VCH: Weinheim, Germany, 2015; Volume 16, 474p, ISBN 978-3-527-69751-9. [Google Scholar]
- Chen, Y.; Zhu, Y.C.; Wang, Z.C.; Li, Y.; Wang, L.L.; Ding, L.L.; Gao, X.Y.; Ma, Y.J.; Guo, Y.P. Application studies of activated carbon derived from rice husks produced by chemical-thermal process—A review. Adv. Colloid Interface Sci. 2011, 163, 39–52. [Google Scholar] [CrossRef]
- Yahya, M.A.; Al-Qodah, Z.; Ngah, C.Z. Agricultural bio-waste materials as potential sustainable precursors used for activated carbon production: A review. Renew. Sustain. Energy Rev. 2015, 46, 218–235. [Google Scholar] [CrossRef]
- Mensah-Darkwa, K.; Zequine, C.; Kahol, P.; Gupta, R. Supercapacitor Energy Storage Device Using Biowastes: A Sustainable Approach to Green Energy. Sustainability 2019, 11, 414. [Google Scholar] [CrossRef]
- Sahin, M.E.; Blaabjerg, F.; Sangwongwanich, A. A review on supercapacitor materials and developments. Turk. J. Mater. 2020, 5, 10–24. [Google Scholar]
- Liu, W.J.; Jiang, H.; Yu, H.Q. Development of biochar-based functional materials: Toward a sustainable platform carbon material. Chem. Rev. 2015, 115, 12251–12285. [Google Scholar] [CrossRef]
- Xie, A.; Tao, F.; Li, T.; Wang, L.; Chen, S.; Luo, S.; Yao, C. Graphene-cerium oxide/porous polyaniline composite as a novel electrode material for supercapacitor. Electrochim. Acta 2018, 261, 314–322. [Google Scholar] [CrossRef]
- Zhou, Y.; Jin, P.; Zhou, Y.; Zhu, Y. High-performance symmetric supercapacitors based on carbon nanotube/graphite nanofiber nanocomposites. Sci. Rep. 2018, 8, 9005. [Google Scholar] [CrossRef]
- Kim, H.; Sohail, M.; Wang, C.; Rosillo-Lopez, M.; Baek, K.; Koo, J.; Seo, M.W.; Kim, S.; Foord, J.S.; Han, S.O. Facile One-Pot Synthesis of Bimetallic Co/Mn-MOFs@Rice Husks, and its Carbonization for Supercapacitor Electrodes. Sci. Rep. 2019, 9, 8984. [Google Scholar] [CrossRef]
- Luan, Y.; Nie, G.; Zhao, X.; Qiao, N.; Liu, X.; Wang, H.; Zhang, X.; Chen, Y.; Long, Y.-Z. The integration of SnO2 dots and porous carbon nanofibers for flexible supercapacitors. Electrochim. Acta 2019, 308, 121–130. [Google Scholar] [CrossRef]
- Zhang, P.; O’Connor, D.; Wang, Y.; Jiang, L.; Xia, T.; Wang, L.; Tsang, D.C.; Ok, Y.S.; Hou, D. A green biochar/iron oxide composite for methylene blue removal. J. Hazard. Mater. 2020, 384, 121286. [Google Scholar] [CrossRef]
- Ajmal, Z.; Muhmood, A.; Dong, R.; Wu, S. Probing the efficiency of magnetically modified biomass-derived biochar for effective phosphate removal. J. Environ. Manag. 2020, 253, 109730. [Google Scholar] [CrossRef]
- Sen, T.K. Application of Synthesized Biomass Bamboo Charcoal–Iron Oxide “BC/Fe” Nanocomposite Adsorbents in the Removal of Cationic Methylene Blue Dye Contaminants from Wastewater by Adsorption. Sustainability 2023, 15, 8841. [Google Scholar] [CrossRef]
- Rufford, T.E.; Hulikova-Jurcakova, D.; Zhu, Z.; Lu, G.Q. A comparative study of chemical treatment by FeCl3, MgCl2, and ZnCl2 on microstructure, surface chemistry, and double-layer capacitance of carbons from waste biomass. J. Mater. Res. 2010, 25, 1451–1459. [Google Scholar] [CrossRef]
- Wang, M.; Cheng, S.; Dang, G.; Min, F.; Li, H.; Zhang, Q.; Xie, J. Solvothermal Synthesized γ-Fe2O3/graphite Composite for Supercapacitor. Int. J. Electrochem. Sci. 2017, 12, 6292–6303. [Google Scholar] [CrossRef]
- Samar, K.T.; Muthanna, J.A. Optimization of preparation conditions for activated carbons from date stones using response surface methodology. Powder Technol. 2012, 224, 101–108. [Google Scholar] [CrossRef]
- Sun, K.; Yang, Q.; Zheng, Y.; Zhao, G.; Zhu, Y.; Zheng, X.; Ma, G. High Performance Symmetric Supercapacitor Based on Sunflower Marrow Electrode Material. Int. J. Electrochem. Sci. 2017, 12, 2606–2617. [Google Scholar] [CrossRef]
- Vervikishko, D.E.; Yanilkin, I.V.; Dobele, G.V.; Volperts, A.; Atamanyuk, I.N.; Sametov, A.A.; Shkol’nikov, E.I. Activated carbon for supercapacitor electrodes with an aqueous electrolyte. High Temp. 2015, 53, 758–764. [Google Scholar] [CrossRef]
- Duryagina, Z.A.; Holyaka, R.L.; Borysyuk, A.K. The Automated Wide-Range Magnetometer for the Magnetic Phase Analysis of Alloys: Development and Application. Usp. Fiz. Met. 2013, 14, 33–66. [Google Scholar] [CrossRef]
- Liu, T.; Luo, R.; Qiao, W.; Yoon, S.-H.; Mochida, I. Microstructure of carbon derived from mangrove charcoal and its application in Li-ion batteries. Electrochim. Acta 2010, 55, 1696–1700. [Google Scholar] [CrossRef]
- Fey, G.T.K.; Cho, Y.D.; Chen, C.L.; Huang, K.P.; Lin, Y.C.; Kumar, T.P.; Chan, S.H. Pyrolytic Carbons from Porogen-treated Rice Husk as Lithium-insertion Anode Materials. J. Chem. Eng. Appl. 2011, 2, 20–25. [Google Scholar] [CrossRef]
- Smith, J.W.H.; Mcdonald, M.; Romero, J.V.; MacDonald, L.; Lee, J.R.; Dahn, J.R. Small and wide angle X-ray studies of impregnated activated carbons. Carbon 2014, 75, 420–431. [Google Scholar] [CrossRef]
- Ptashnyk, V.V.; Bordun, I.M.; Malovanyy, M.S.; Chumakevych, V.O.; Borysiuk, A.K.; Bilen’ka, O.B. The structural, magnetic and adsorption properties of ferromagnetic biocarbon materials. Environ. Sci. 2020, 182, 38–47. [Google Scholar] [CrossRef]
- Liu, W.-J.; Tian, K.; He, Y.-R.; Jiang, H.; Yu, H.-Q. High-Yield Harvest of Nanofibers/Mesoporous Carbon Composite by Pyrolysis of Waste Biomass and Its Application for High Durability Electrochemical Energy Storage. Environ. Sci. Technol. 2014, 48, 13951–13959. [Google Scholar] [CrossRef]
- Zhu, X.; Qian, F.; Liu, Y.; Matera, D.; Wu, G.; Zhang, S.; Chen, J. Controllable synthesis of magnetic carbon composites with high porosity and strong acid resistance from hydrochar for efficient removal of organic pollutants: An overlooked influence. Carbon 2016, 99, 338–347. [Google Scholar] [CrossRef]
- Theydan, S.K.; Ahmed, M.J. Adsorption of methylene blue onto biomass-based activated carbon by FeCl3 activation: Equilibrium, kinetics, and thermodynamic studies. J. Anal. Appl. Pyrolysis 2012, 97, 116–122. [Google Scholar] [CrossRef]
- Oliveira, L.C.A.; Pereira, E.; Guimaraes, I.R.; Vallone, A.; Pereira, M.; Mesquita, J.P.; Sapag, K. Preparation of activated carbons from coffee husks utilizing FeCl3 and ZnCl2 as activating agents. J. Hazard. Mater. 2009, 165, 87–94. [Google Scholar] [CrossRef]
- Thommes, M.; Kaneko, K.; Neimark, A.; Olivier, J.; Rodriguez-Reinoso, F.; Rouquerol, J.; Sing, K. Physisorption of gases, with special reference to the evaluation of surface area and pore size distribution (IUPAC Technical Report). Pure Appl. Chem. 2015, 87, 1051–1069. [Google Scholar] [CrossRef]
- Medina-Rodriguez, B.X.; Alvarado, V. Use of Gas Adsorption and Inversion Methods for Shale Pore Structure Characterization. Energies 2021, 14, 2880. [Google Scholar] [CrossRef]
- Coey, J.M.D. Magnetism and Magnetic Materials; Cambridge University Press: Cambridge, UK, 2010; 625p, ISBN 978-0-521-81614-4. [Google Scholar]
- Gubin, S.P.; Koksharov, Y.A.; Khomutov, G.B.; Yurkov, G.Y. Magnetic nanoparticles: Preparation, structure and properties. Russ. Chem. Rev. 2005, 74, 489–520. [Google Scholar] [CrossRef]
- Yang, H.; Ogawa, T.; Hasegawa, D.; Takahashi, M. Synthesis and magnetic properties of monodisperse magnetite nanocubes. J. Appl. Phys. 2008, 103, 07D526. [Google Scholar] [CrossRef]
- Goya, G.F.; Berquó, T.S.; Fonseca, F.C.; Morales, M.P. Static and dynamic magnetic properties of spherical magnetite nanoparticles. J. Appl. Phys. 2003, 94, 3520–3528. [Google Scholar] [CrossRef]
- Zhang, S.; Pan, N. Supercapacitors Performance Evaluation. Adv. Energy Mater. 2015, 5, 1401401. [Google Scholar] [CrossRef]
- Ue, M. Review of the electrolyte materials for double layer capacitors. In Proceedings of the 8th International Seminar on Double Layer Capacitors and Similar Energy Storage Devices, Deerfield Beach, FL, USA, 7–9 December 1998; pp. 18–20. [Google Scholar]
- Sun, G.; Song, W.; Liu, X.; Long, D.; Qiao, W.; Ling, L. Capacitive matching of pore size and ion size in the negative and positive electrodes for supercapacitors. Electrochim. Acta 2011, 56, 9248–9256. [Google Scholar] [CrossRef]
- Yu, A.; Chabot, V.; Zhang, J. Electrochemical Supercapacitors for Energy Storage and Delivery: Fundamentals and Applications, 1st ed.; CRC Press: Boca Raton, FL, USA, 2013; 373p, ISBN 978-1-3152-1694-2. [Google Scholar]
- Taberna, P.; Simon, P.; Fauvarque, J. Electrochemical characteristics and impedance spectroscopy studies of carbon-carbon supercapacitors. J. Electrochemic. Soc. 2003, 150, 292–300. [Google Scholar] [CrossRef]
- Barcia, O.; D’Elia, E.; Frateur, I.; Mattos, O.; Pébère, N.; Tribollet, B. Application of the impedance model of de Levie for the characterization of porous electrodes. Electrochim. Acta 2002, 47, 2109–2116. [Google Scholar] [CrossRef]
- Tipsawat, P.; Wongpratat, U.; Phumying, S.; Chanlek, N.; Chokprasombat, K.; Maensiri, S. Magnetite (Fe3O4) nanoparticles: Synthesis, characterization and electrochemical properties. Appl. Surf. Sci. 2018, 446, 287–292. [Google Scholar] [CrossRef]
- Conway, B.E. Electrochemical Supercapacitors. Scientific Fundamentals and Technological Applications; Kluwer Academic/Plenum Publishers: New York, NY, USA, 1999; 698p, ISBN 978-1-4757-3058-6. [Google Scholar]
- Frackowiak, E.; Beguin, F. Carbon Materials for the Electrochemical Storage of Energy in Capacitors. Carbon 2001, 39, 937–950. [Google Scholar] [CrossRef]
- Ptashnyk, V.; Bordun, I.; Pohrebennyk, V.; Takosoglu, J.; Sadova, M. Impedance investigation of activated carbon material modified by ultrasound treatment. Przegląd Elektrotechniczny 2018, 5, 186–189. [Google Scholar] [CrossRef]
- Bordun, I.; Chabecki, P.; Malovanyy, M.; Pieshkov, T.; Chwastek, K. Changes in the Electrical Charge Accumulation Ability of Nanoporous Activated Carbon under Ultrasonic Radiation Exposure. Isr. J. Chem. 2020, 60, 615–623. [Google Scholar] [CrossRef]
- Barsukov, E.; Macdonald, J.R. (Eds.) Impedance Spectroscopy: Theory, Experiment and Applications, 2nd ed.; John Wiley & Sons, Inc.: Hoboken, NJ, USA, 2005; 606p, ISBN 0-471-64749-7. [Google Scholar]
- Bakhmatyuk, B.P.; Vengrin, B.Y.; Grigorchak, I.I.; Mitsov, M.M.; Kulik, Y.O. Criteria and mechanism of capacity and pseudocapacity charge accumulation in activated carbon in view of its nanoporous structure and electronic structure. Electrochem. Energ. 2007, 7, 78–83. [Google Scholar]


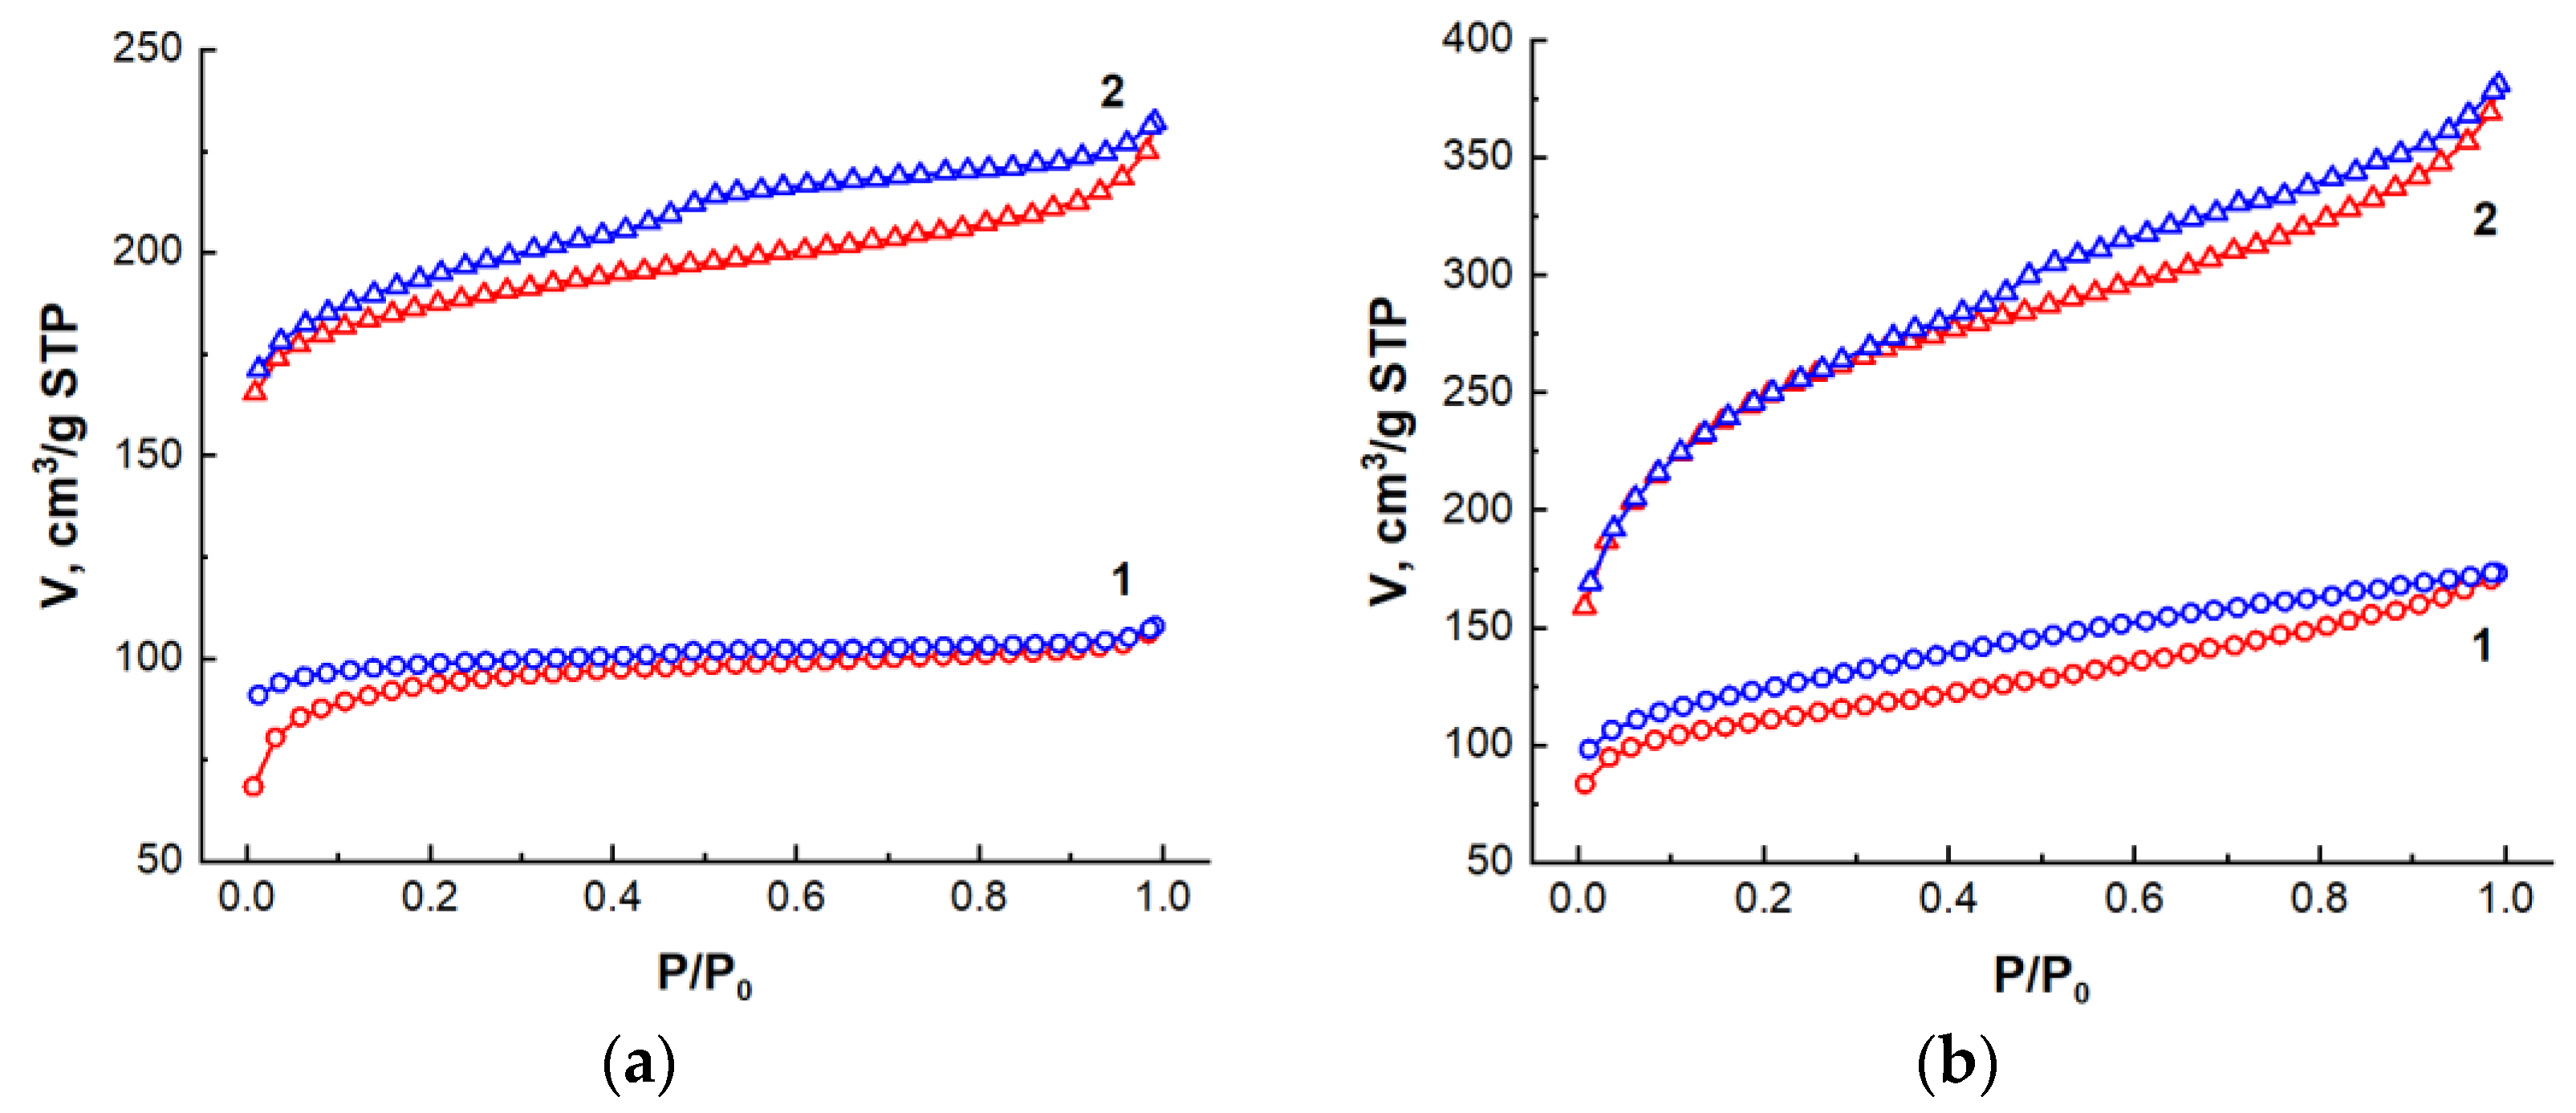
| Type of Nanocomposite | S, m2/g | V, cm3/g | <d>, nm |
|---|---|---|---|
| AC from beet pulp, 1-step synthesis | 359.6 | 0.167 | 1.86 |
| AC from beet pulp, 2-step synthesis | 738.2 | 0.361 | 1.96 |
| AC from corn, 1-step synthesis | 413.1 | 0.269 | 2.6 |
| AC from corn, 2-step synthesis | 889.8 | 0.591 | 2.66 |
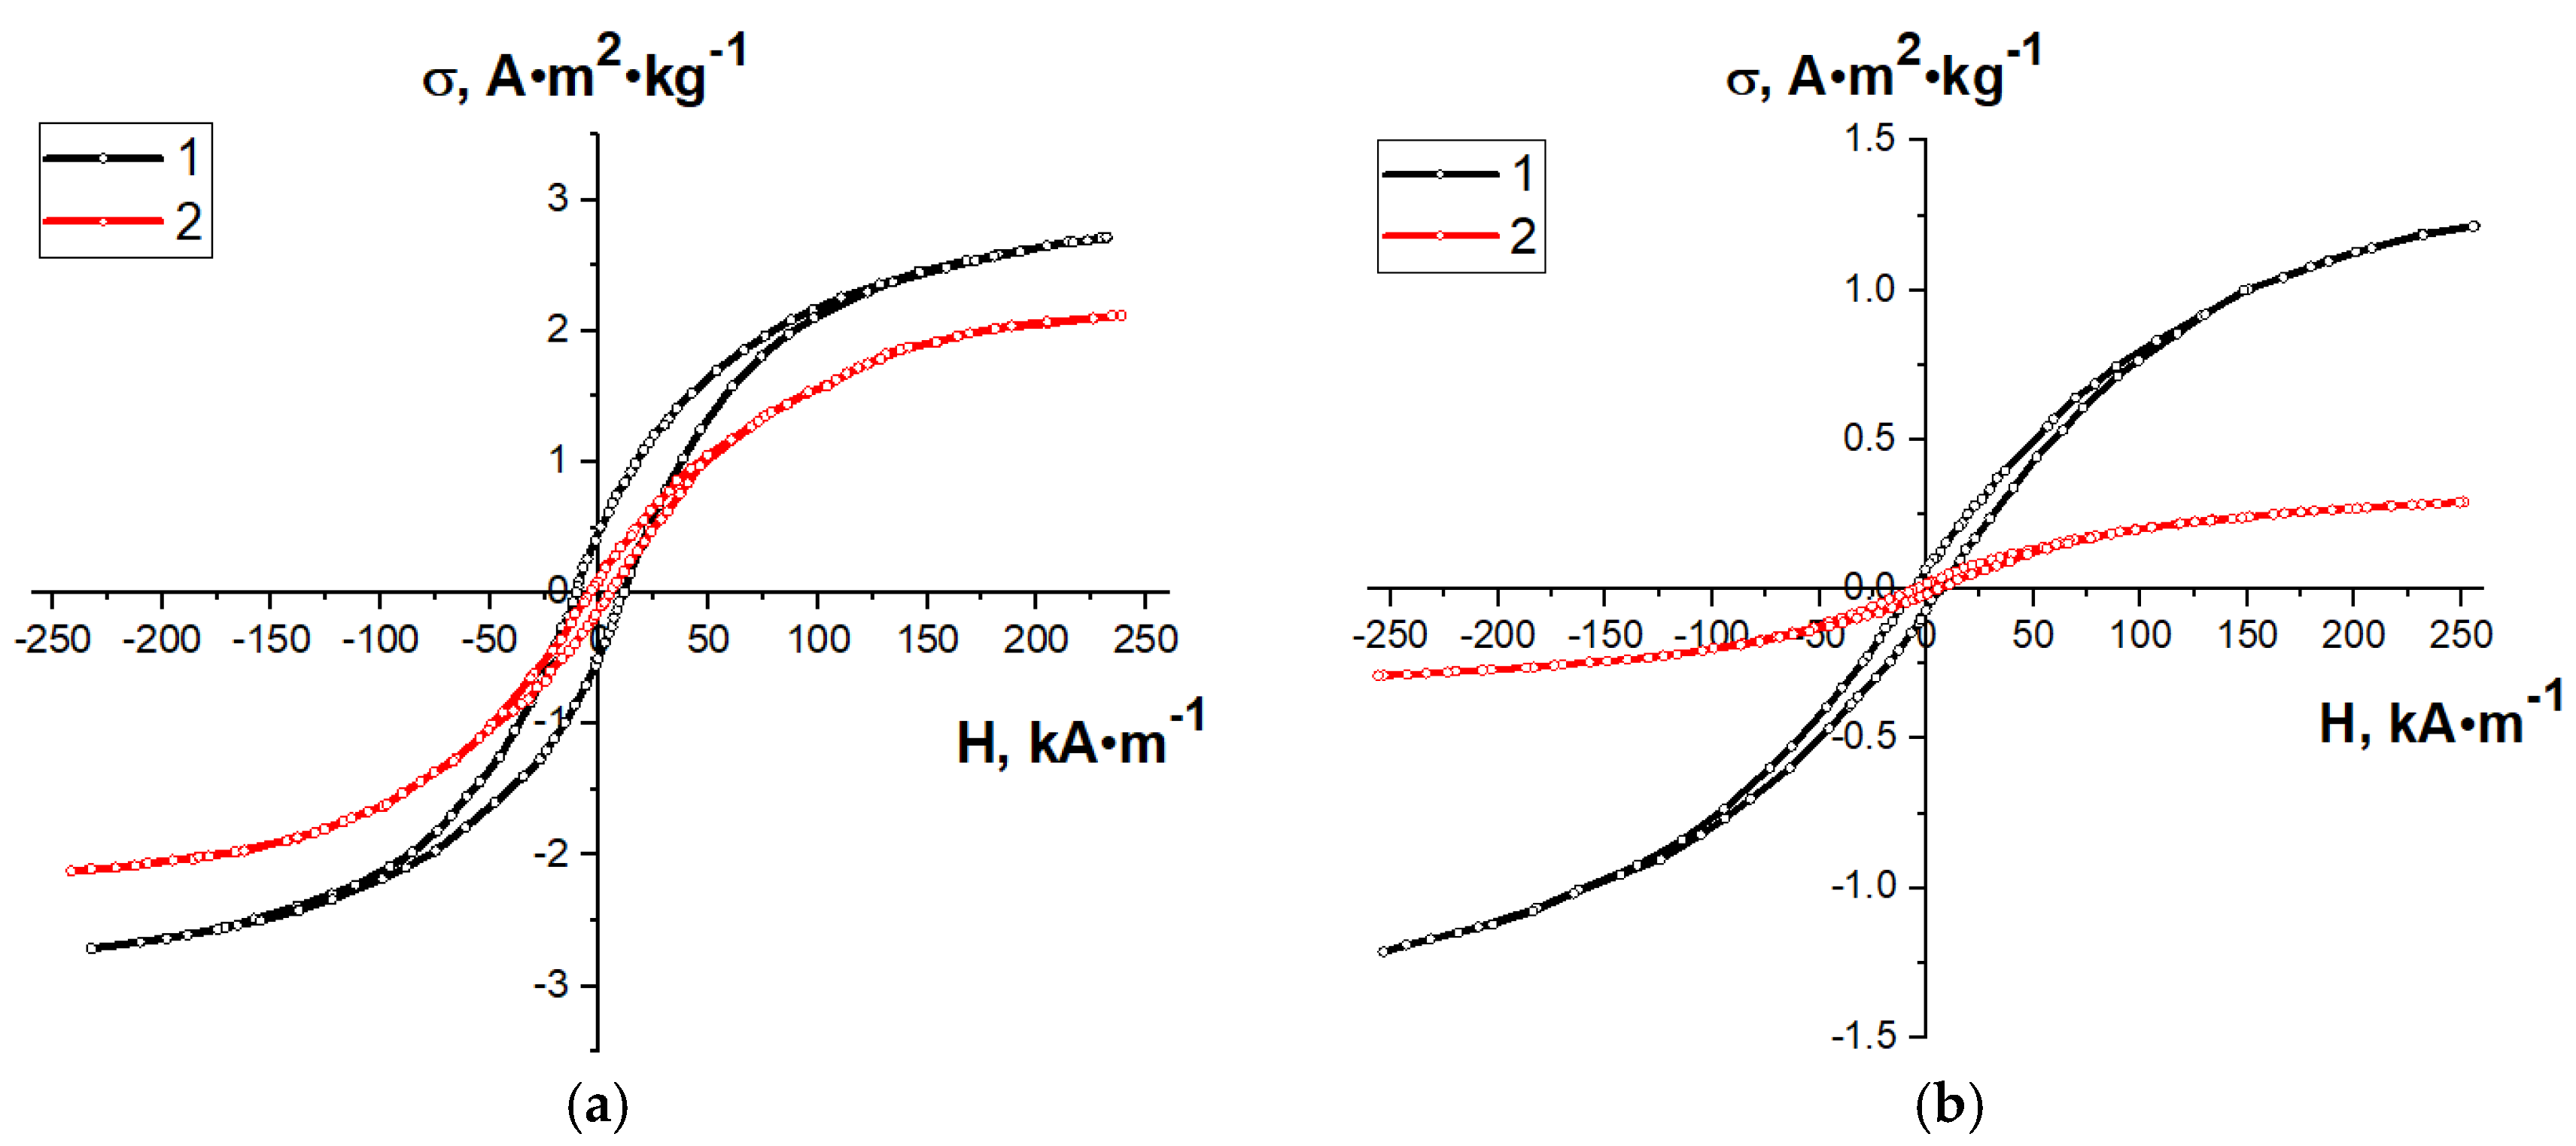
| Type of Nanocomposite | σs, A·m2·kg−1 | Hc, kA/m | Fe3O4 Content, Mass % |
|---|---|---|---|
| AC from beet pulp, 1-step synthesis | 3.03 | 11.3 | 3.79 |
| AC from beet pulp, 2-step synthesis | 2.39 | 5.5 | 2.99 |
| AC from corn, 1-step synthesis | 1.42 | 6.6 | 1.78 |
| AC from corn, 2-step synthesis | 0.42 | 5.3 | 0.53 |
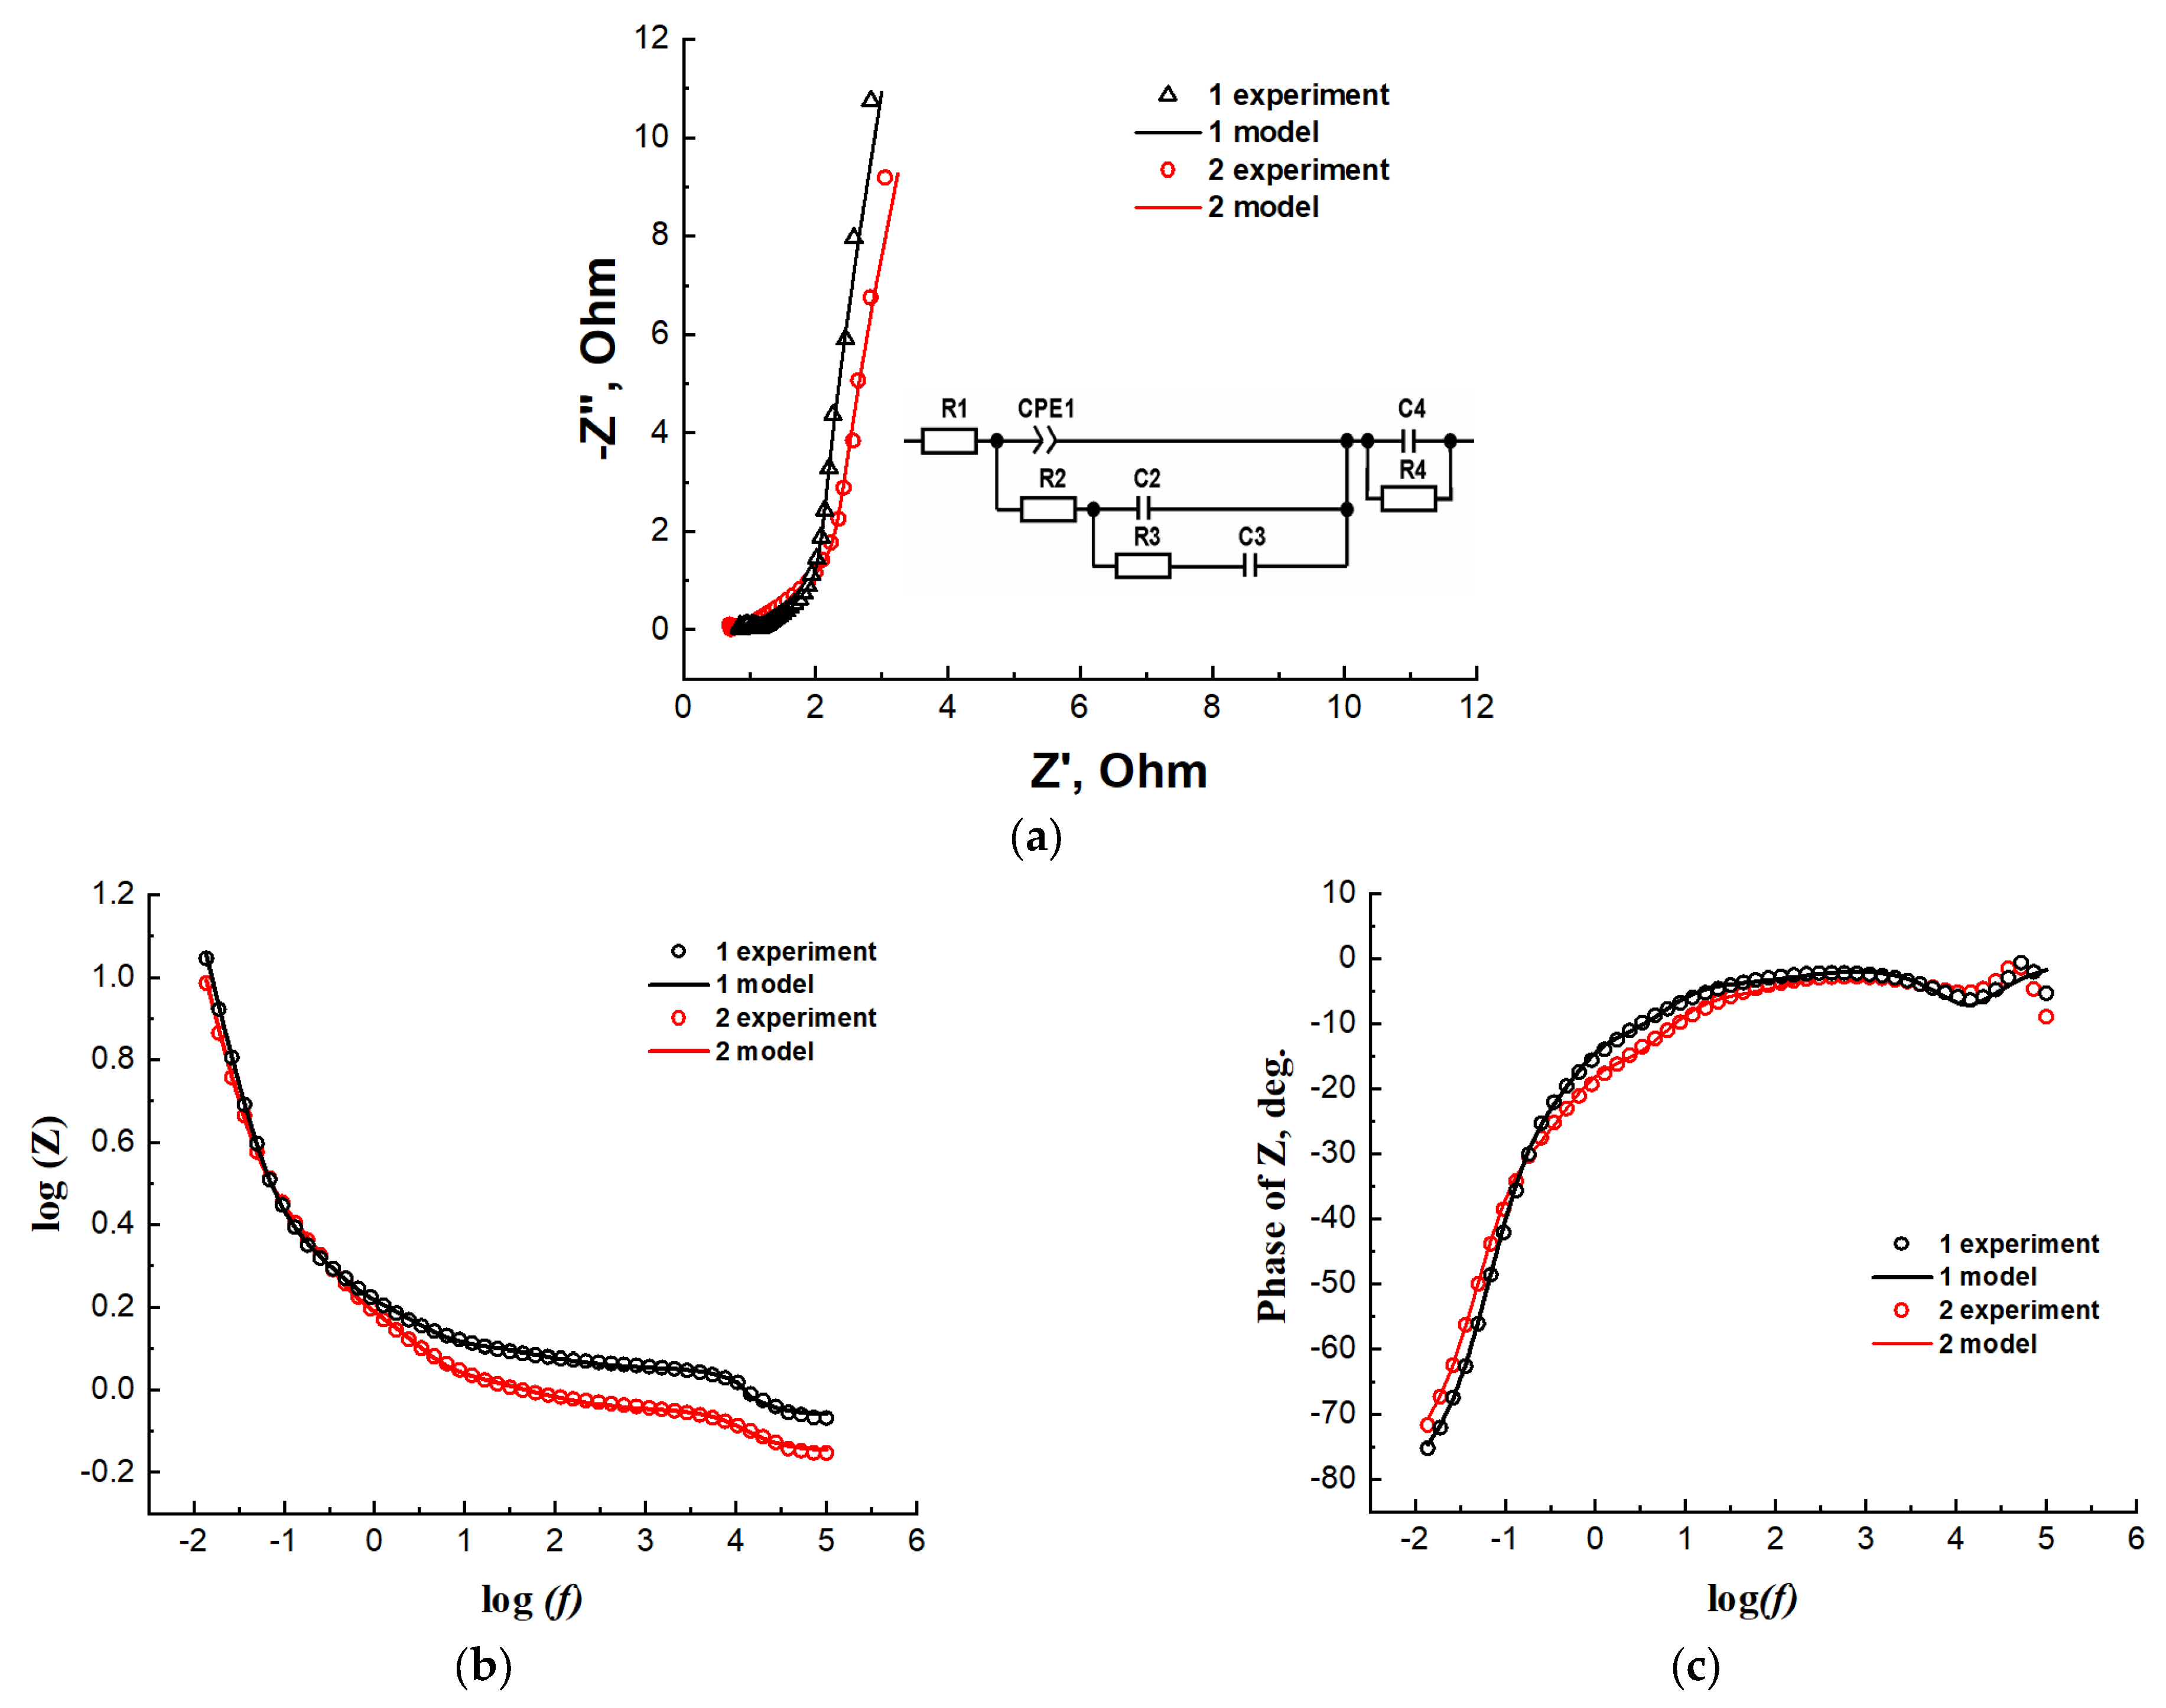
| Type of Nanocomposite | R1, Ohm | CPE1-T | CPE1-P | R2, Ohm | C2, F | R3, Ohm | C3, F | R4, Ohm | C4, F |
|---|---|---|---|---|---|---|---|---|---|
| AC from beet pulp, 2-step synthesis | 0.87 | 0.19 | 0.71 | 0.49 | 0.31 | 1.38 | 0.73 | 0.27 | 6.48 × 10⁻⁵ |
| AC from corn stalks, 2-step synthesis | 0.72 | 0.19 | 0.67 | 0.94 | 0.26 | 2.26 | 0.56 | 0.19 | 8.78 × 10⁻⁵ |
| Type of Nanocomposite | Relaxation Time for Mesopores, τ = C2∙R2 | Relaxation Time for Micropores, τ = C3∙R3 |
|---|---|---|
| AC from beet pulp, 2-step synthesis | 0.15 | 1.01 |
| AC from corn stalks, 2-step synthesis | 0.24 | 1.27 |
Disclaimer/Publisher’s Note: The statements, opinions and data contained in all publications are solely those of the individual author(s) and contributor(s) and not of MDPI and/or the editor(s). MDPI and/or the editor(s) disclaim responsibility for any injury to people or property resulting from any ideas, methods, instructions or products referred to in the content. |
© 2024 by the authors. Licensee MDPI, Basel, Switzerland. This article is an open access article distributed under the terms and conditions of the Creative Commons Attribution (CC BY) license (https://creativecommons.org/licenses/by/4.0/).
Share and Cite
Bordun, I.; Szymczykiewicz, E. Synthesis and Electrochemical Properties of Fe3O4/C Nanocomposites for Symmetric Supercapacitors. Appl. Sci. 2024, 14, 677. https://doi.org/10.3390/app14020677
Bordun I, Szymczykiewicz E. Synthesis and Electrochemical Properties of Fe3O4/C Nanocomposites for Symmetric Supercapacitors. Applied Sciences. 2024; 14(2):677. https://doi.org/10.3390/app14020677
Chicago/Turabian StyleBordun, Ihor, and Ewelina Szymczykiewicz. 2024. "Synthesis and Electrochemical Properties of Fe3O4/C Nanocomposites for Symmetric Supercapacitors" Applied Sciences 14, no. 2: 677. https://doi.org/10.3390/app14020677
APA StyleBordun, I., & Szymczykiewicz, E. (2024). Synthesis and Electrochemical Properties of Fe3O4/C Nanocomposites for Symmetric Supercapacitors. Applied Sciences, 14(2), 677. https://doi.org/10.3390/app14020677