Article

Comparison of Quality of Porous Structure Specimens Produced by Different Additive Technologies and from Different Materials

1
Faculty of Manufacturing Technologies, Technical University of Košice with a Seat in Prešov, Bayerova 1, 080 01 Prešov, Slovakia
2
Faculty of Mechanical Engineering, Technical University of Kosice, Letna 9, 042 00 Kosice, Slovakia
3
Faculty of Mechanical Engineering, VSB-Technical University of Ostrava, 17. Listopadu 2172/15, 80700 Ostrava-Poruba, Czech Republic
4
Faculty of Mining, Ecology, Process Control and Geotechnology, Technical University of Kosice, Park Komenskeho 14, 042 00 Kosice, Slovakia
*
Author to whom correspondence should be addressed.
Appl. Sci. 2024, 14(2), 648; https://doi.org/10.3390/app14020648
Submission received: 1 December 2023 / Revised: 21 December 2023 / Accepted: 9 January 2024 / Published: 12 January 2024

Abstract

:
Lattice and gyroid structures are often subjected to additive technologies to produce various types of products, and the current market has a number of 3D printers that can be used for their production. The quality of the products produced in this way can be assessed on the basis of technical parameters and the filament used. Such an approach, however, is insufficient. In terms of quality, other product parameters need to be assessed, such as the surface texture and the internal structure’s porosity. For such an assessment, we can use the industrial tomography method and the method of roughness measurement via an optical microscope. The paper presents research on the assessment of the surface texture and porosity in lattice and gyroid structures. For the research, two types of test specimens—a specimen with a lattice structure and a specimen with a gyroid structure—were prepared. The obtained results proved that the 3D printing technology directly impacted the surface texture and porosity. For experimental specimens produced by SLS technology, we found that it was very important to carefully remove the excess powder, as unremoved powder can significantly affect the porosity results. For specimens produced by FDM technology, the research confirmed that some “gaps” between the layers were not pores but defects created during specimen production. When analyzing the surface using the Alicon Infinite G5 optical microscope, we found that the measured roughness results were directly impacted by the specimen’s surface color, the structure’s geometry, and the ambient light, which was confirmed by a red lattice experimental specimen, the surface of which could not be scanned. Based on the above, it can be stated that the selection of 3D technology for additive production needs must be given adequate attention regarding the quality of the created structures and textures.

1. Introduction

Additive manufacturing (AM) currently makes it possible to manufacture highly accurate and optimized components. However, there is still not enough information on the quality of such parts.
The comparison of certain parameters of the surface texture, geometry, and internal porous structure of additive products requires the use of computerized measurement technologies with a high resolution and accuracy. This issue has been investigated by several authors. Zakharchenko et al. [1] dealt with the minimization of surface texture functional parameter selection. For this purpose, they determined a linear correlation between the parameters. Four surfaces of IX15 steel products were used as samples after grinding, round grinding, superfinishing, and polishing. It was found that in 16–18 cases out of 26, there was a significant correlation, with a Pearson coefficient of more than 0.8. Random surface topography modeling methods were summarized in the paper of Pawlus et al. [2]. Methods for the generation of surface topographies with a Gaussian and non-Gaussian height probability distribution were presented. Particular attention was paid to the modeling of two-process random surfaces. The selection of a suitable method for the random modeling of different types of surface topographies to obtain the dependence of the surface characteristics, production process, and surface function was discussed by Jiang et al. [3]. In their conclusions, the authors stated that further research needs to focus on the development of a generalized feature-based technology tool-kit (an interdisciplinary subject, involving computer vision, image processing, and geometric modeling) with robustness for universal application, including fast algorithms, soft gauges, and uncertainty, to guarantee computational fidelity. Lou et al. [4] characterized, in detail, the X-ray computed tomography method, which enables complex geometry assessment, and they researched the unique properties of additive manufacturing components’ surfaces. An improved understanding of the impacts of these features will assist in efforts to predict the performance of additive manufacturing parts, e.g., fatigue, heat exchange, and osseointegration. The use of an in situ sensor and cameras to obtain process data for the real-time monitoring and quality analysis of 3D-printed parts was discussed in detail by Kim et al. [5]. They presented a review of quality control in seven different techniques in AM technology and provided detailed discussions of each quality process stage. Their research was limited to the review of only seven techniques of AM technology, which included photopolymer vat processes, material jetting processes, binder jetting processes, extrusion-based processes, powder bed fusion processes, direct energy deposition processes, and sheet lamination processes. Reiher et al. [6] presented a holistic approach to help a designer in developing and manufacturing a product for additive manufacturing. The methodology itself was discussed and explained based on a real sample metal part. The general methodology was discussed on the basis of the space industry.
By using computer measurement technologies with a high resolution and accuracy, images of the unique surface textures of irregular surfaces, accurate images of the complex geometry, and the internal structural variability of various materials can be obtained. Several authors should be mentioned in this area. Angel [7], in his dissertation, dealt with the verification of scanning systems and the determination of conformance to specifications in order to achieve the best performance—usually corresponding to the manufacturer’s specifications. Various methods and reference objects were developed in this project to establish the metrological traceability of the measurements. Moreover, investigations as well as international comparisons in the application of the two different areas were carried out. Bauza et al. [8] researched selected precision parameters of components realized by additive manufacturing. They discussed the accuracy and uncertainty of parts produced with additive manufacturing processes. Slotwinski and Moylan [9] summarized the key metrology-based technical challenges that limit the wider use of metal-based additive manufacturing processes. There are significant technical hurdles, many of which requiring metrology-based solutions, that prevent the full exploitation of additive manufacturing today. Additionally, in many cases, existing standards can be used as the basis for AM-specific standards, either as currently written or with some minor adjustments. This already-existing base of standards will greatly accelerate the development of additive manufacturing-specific standards. The issue of comparing the dual combined approach used in the traditional coordinate measurement of surfaces by touch systems and computer tomography was elaborated by du Plessis et al. [10]. This dual combined approach uses traditional surface coordinate measurements on exterior accessible surfaces, which is followed by internal lattice measurements. The results show a clear method and workflow for the combination of these technologies for a holistic dimensional inspection.
The imaging of the surface textures of complex shapes and geometries with a variability in the internal structures of different materials can be achieved by various methods. The method’s selection depends on the specific requirements of the application, the material type, and the desired quality. Computer-aided design (CAD) softwares provide a virtual environment for the design and visualization of complex geometries. Virtual reality (VR) and augmented reality (AR) offer possibilities for visualization and interaction with complex structures in a virtual environment. Moreover, 3D scanning captures the actual surface geometries of physical objects. High-resolution imaging and photography can capture surface textures and details with high precision. A computed tomography (CT) scan shows the internal structures. Microscopy and nanoscopy provide high-resolution imaging of surface textures and internal structures at the microscopic and nanoscopic levels for small-sized specimens. Scientific articles by various authors deal with the research of these imaging methods. Javaid et al. [11] identified the potential of 3D scanning for industry and its utility for reverse engineering, the design and measurement of complex curved surfaces, education, architecture, surveying, healthcare, quality monitoring, prototyping, and the development of industrial tools and equipment. These technologies are widely used in areas where high accuracy and a superior resolution are required, to verify that a physical object has been manufactured according to the accuracy specifications in production drawings. Thompson et al. [12] researched the use of X-ray computed tomography (XCT), identifying a prerequisite for volumetric dimensional measurements in the industrial verification of physical objects manufactured by additive technologies (AM). There are two primary requirements when measuring the porosity of manufactured components (AM). The first relates to the increased resolution needed for the detection of small pores to allow for greater accuracy and precision in pore measurement. The second concerns the correlation of porosity and pore distribution measurements with more cost-effective measurement techniques to reduce the verification costs. Du Plessis et al. [13], using newly developed X-ray micro-computed tomography (micro-CT) methods, implemented the testing and analysis of additively manufactured parts with an emphasis on accurate dimensional measurement and porosity analysis. MicroCT can be used not only for the high-quality, detailed analysis of individual components, but also for the cost-effective inspection of major defects using fast scans with minimal post-processing. The research on newly developed methods makes it clear that the micro-CT method is crucial to the holistic quality analysis and improvement of AM components. Kruth et al. [14] presented an actual status and application examples that demonstrated CT metrology’s ability to control internal dimensions that cannot be measured by traditional coordinate measuring machines, and to combine dimensional quality control with material quality control to achieve a single quality control paradigm. CT metrology has great potential for the dimensional quality control of components with internal cavities that are not accessible by other measuring devices. It also enables the holistic measurement of mechanical components, i.e., the full assessment of the internal and external surfaces of the part, instead of a limited set of points. CT is the only control process that allows for a combination of dimensional and material quality control. De Chiffre et al. [15] provided an overview of the state of the art and upcoming CT technologies, including CT system types, scanning capabilities, and technological advances. The paper provides an overview of application examples from the manufacturing industry, as well as other industries and activities in industrial computed tomography. The authors also identified the limitations and problems of the current CT in industrial applications.
The mechanical and geometric properties of specimens produced by the selected laser sintering (SLS) of thermoplastic powders largely depend on the interactions between the following process and material parameters: powder coating, exposure geometry, and material behavior in the solid and molten states [16]. Critical processes’ repeatability in serial production can only be improved by the study of the aforementioned interactions [17]. Kudelski et al. [18] compared the costs, material, and printing time using FDM and SLS, based on the production batch size. In conclusion, the authors stated that FDM is the best choice to print one simple component (it is quicker, cheaper, and has a good result; the only disadvantage is the poor strength, especially in the Z direction). However, in the case of a larger production batch size for the same component, the use of SLS is more advantageous. Research on the mechanical properties of components (dimensional accuracy, tensile properties, and Shore hardness) produced by different AM methods (PolyJet, SLA, FDM, SLS) was performed by, e.g., Shilpa et al. [19]. Each additive manufacturing process and its process parameters were studied in detail, along with a comparison of the mechanical properties of the final components. The order of the dimensional accuracy was PolyJet > SLS > FDM > SLA. The order of the tensile properties (tensile strength) was PolyJet > SLS > FDM > SLA. The order of the Shore hardness was PolyJet > SLA > FDM > SLS.
Tagliaferri et al. [20] investigated the geometry of a proposed product, which significantly affects the optimal choice of AM technology, both technologically and economically. The results imply that FDM technology shows the greatest restrictions, preventing mass production due to manufacturing time and costs but also environmental impacts.
A frequently encountered problem is the aging of the source material. This factor can unfavorably affect the geometric and mechanical properties of manufactured components. Wegner et al. [21] researched the processes of polyamide 12 aging (Laurinlactam) in SLS, comparing two different machines, with the objective of analyzing the correlation of the material quality, process parameters, and specimen properties. It was found that, aside from the surface quality, the mechanical properties in the direction of the build, especially the elongation at break and tensile strength, are the most sensitive characteristics to effects caused by material aging. In addition, Wudi and Drummer [22] researched the impact of the processing time and temperature on the molecular changes and thermal properties of particle polyamide material 12 in SLS. The aging state showed high reproducibility. The post-condensation reaction during the aging of the polyamide 12 part cake material in SLS could be proven by GPC analysis.
The measurement of SLS-based specimens is also a widely discussed issue. One important area is the method of three-dimensional surface parameter measurement. Grimm et al. [23] researched this issue via a new measurement method, using a confocal microscope and emphasizing the classification of various spatial orientations, and they highlighted a particular issue in laser sintering: the significance of orange crusts. Within this study, it was proven that an optical three-dimensional topography measurement, realized with a confocal microscope, offers the opportunity for higher statistical significance compared to state-of-the-art tactile profilometry. In particular, the surfaces of laser beam-melted parts showed strong correlations between the surface orientation and the areal parameters or analysis techniques, respectively.
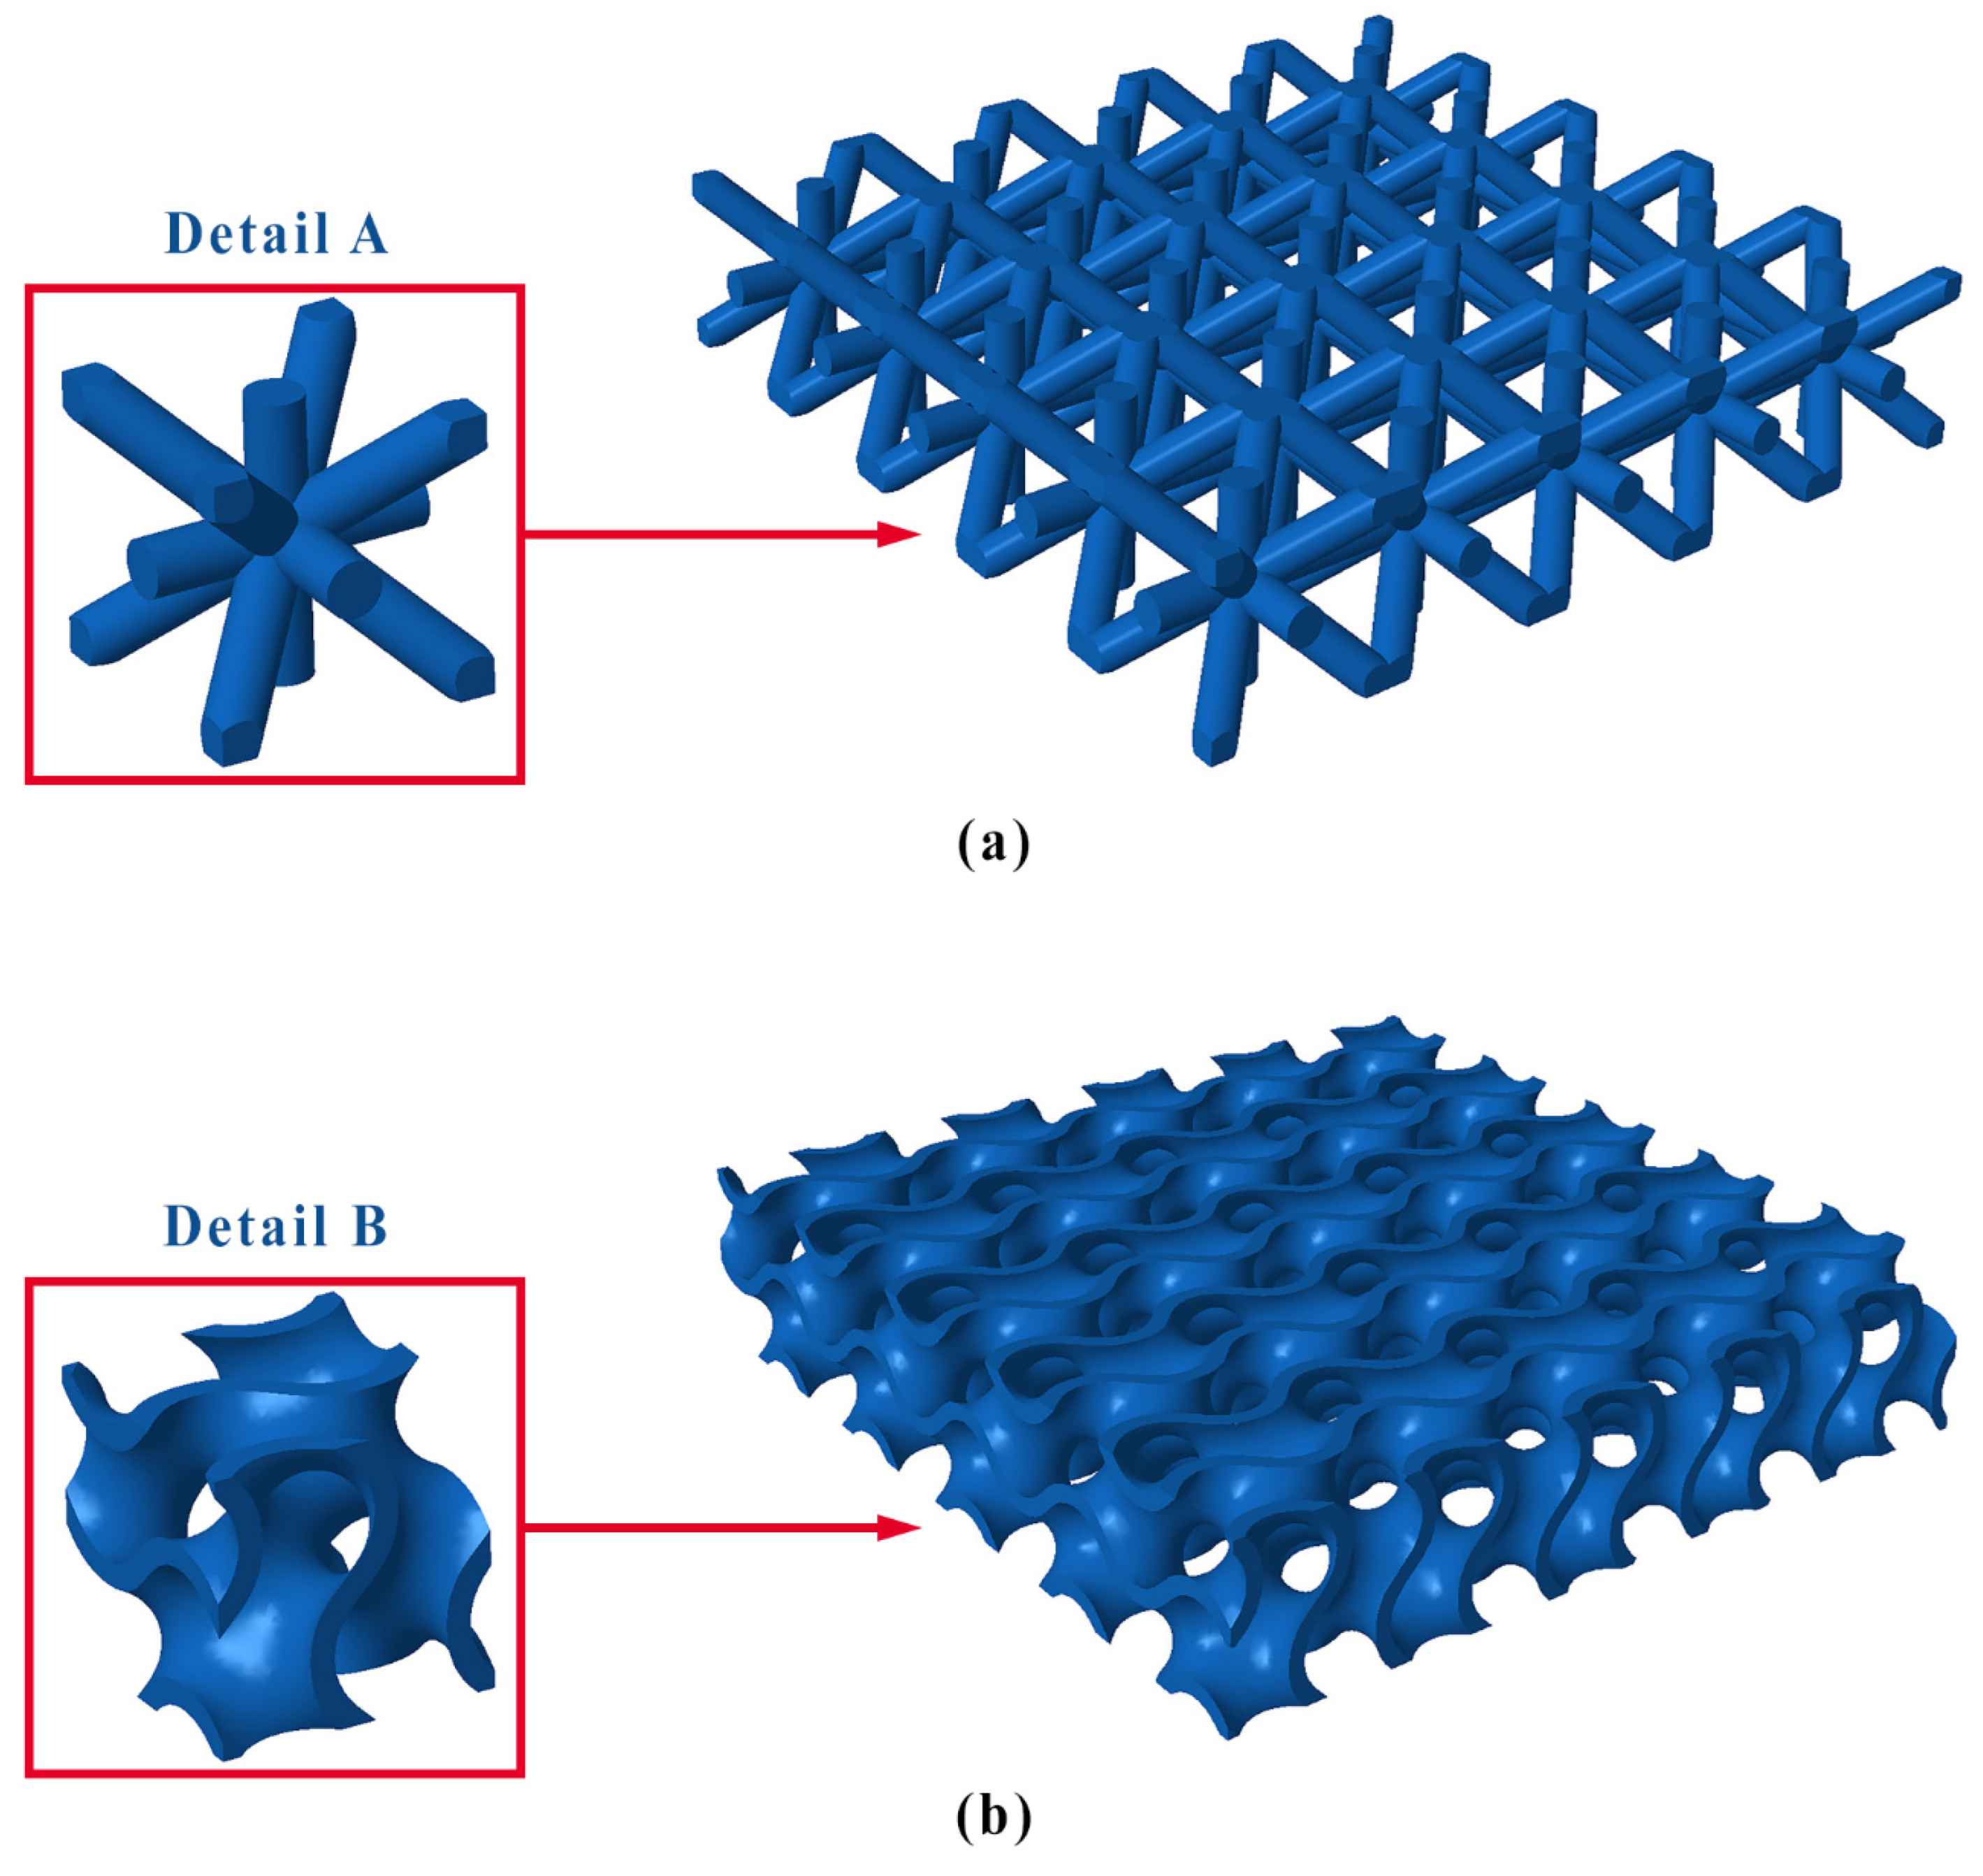
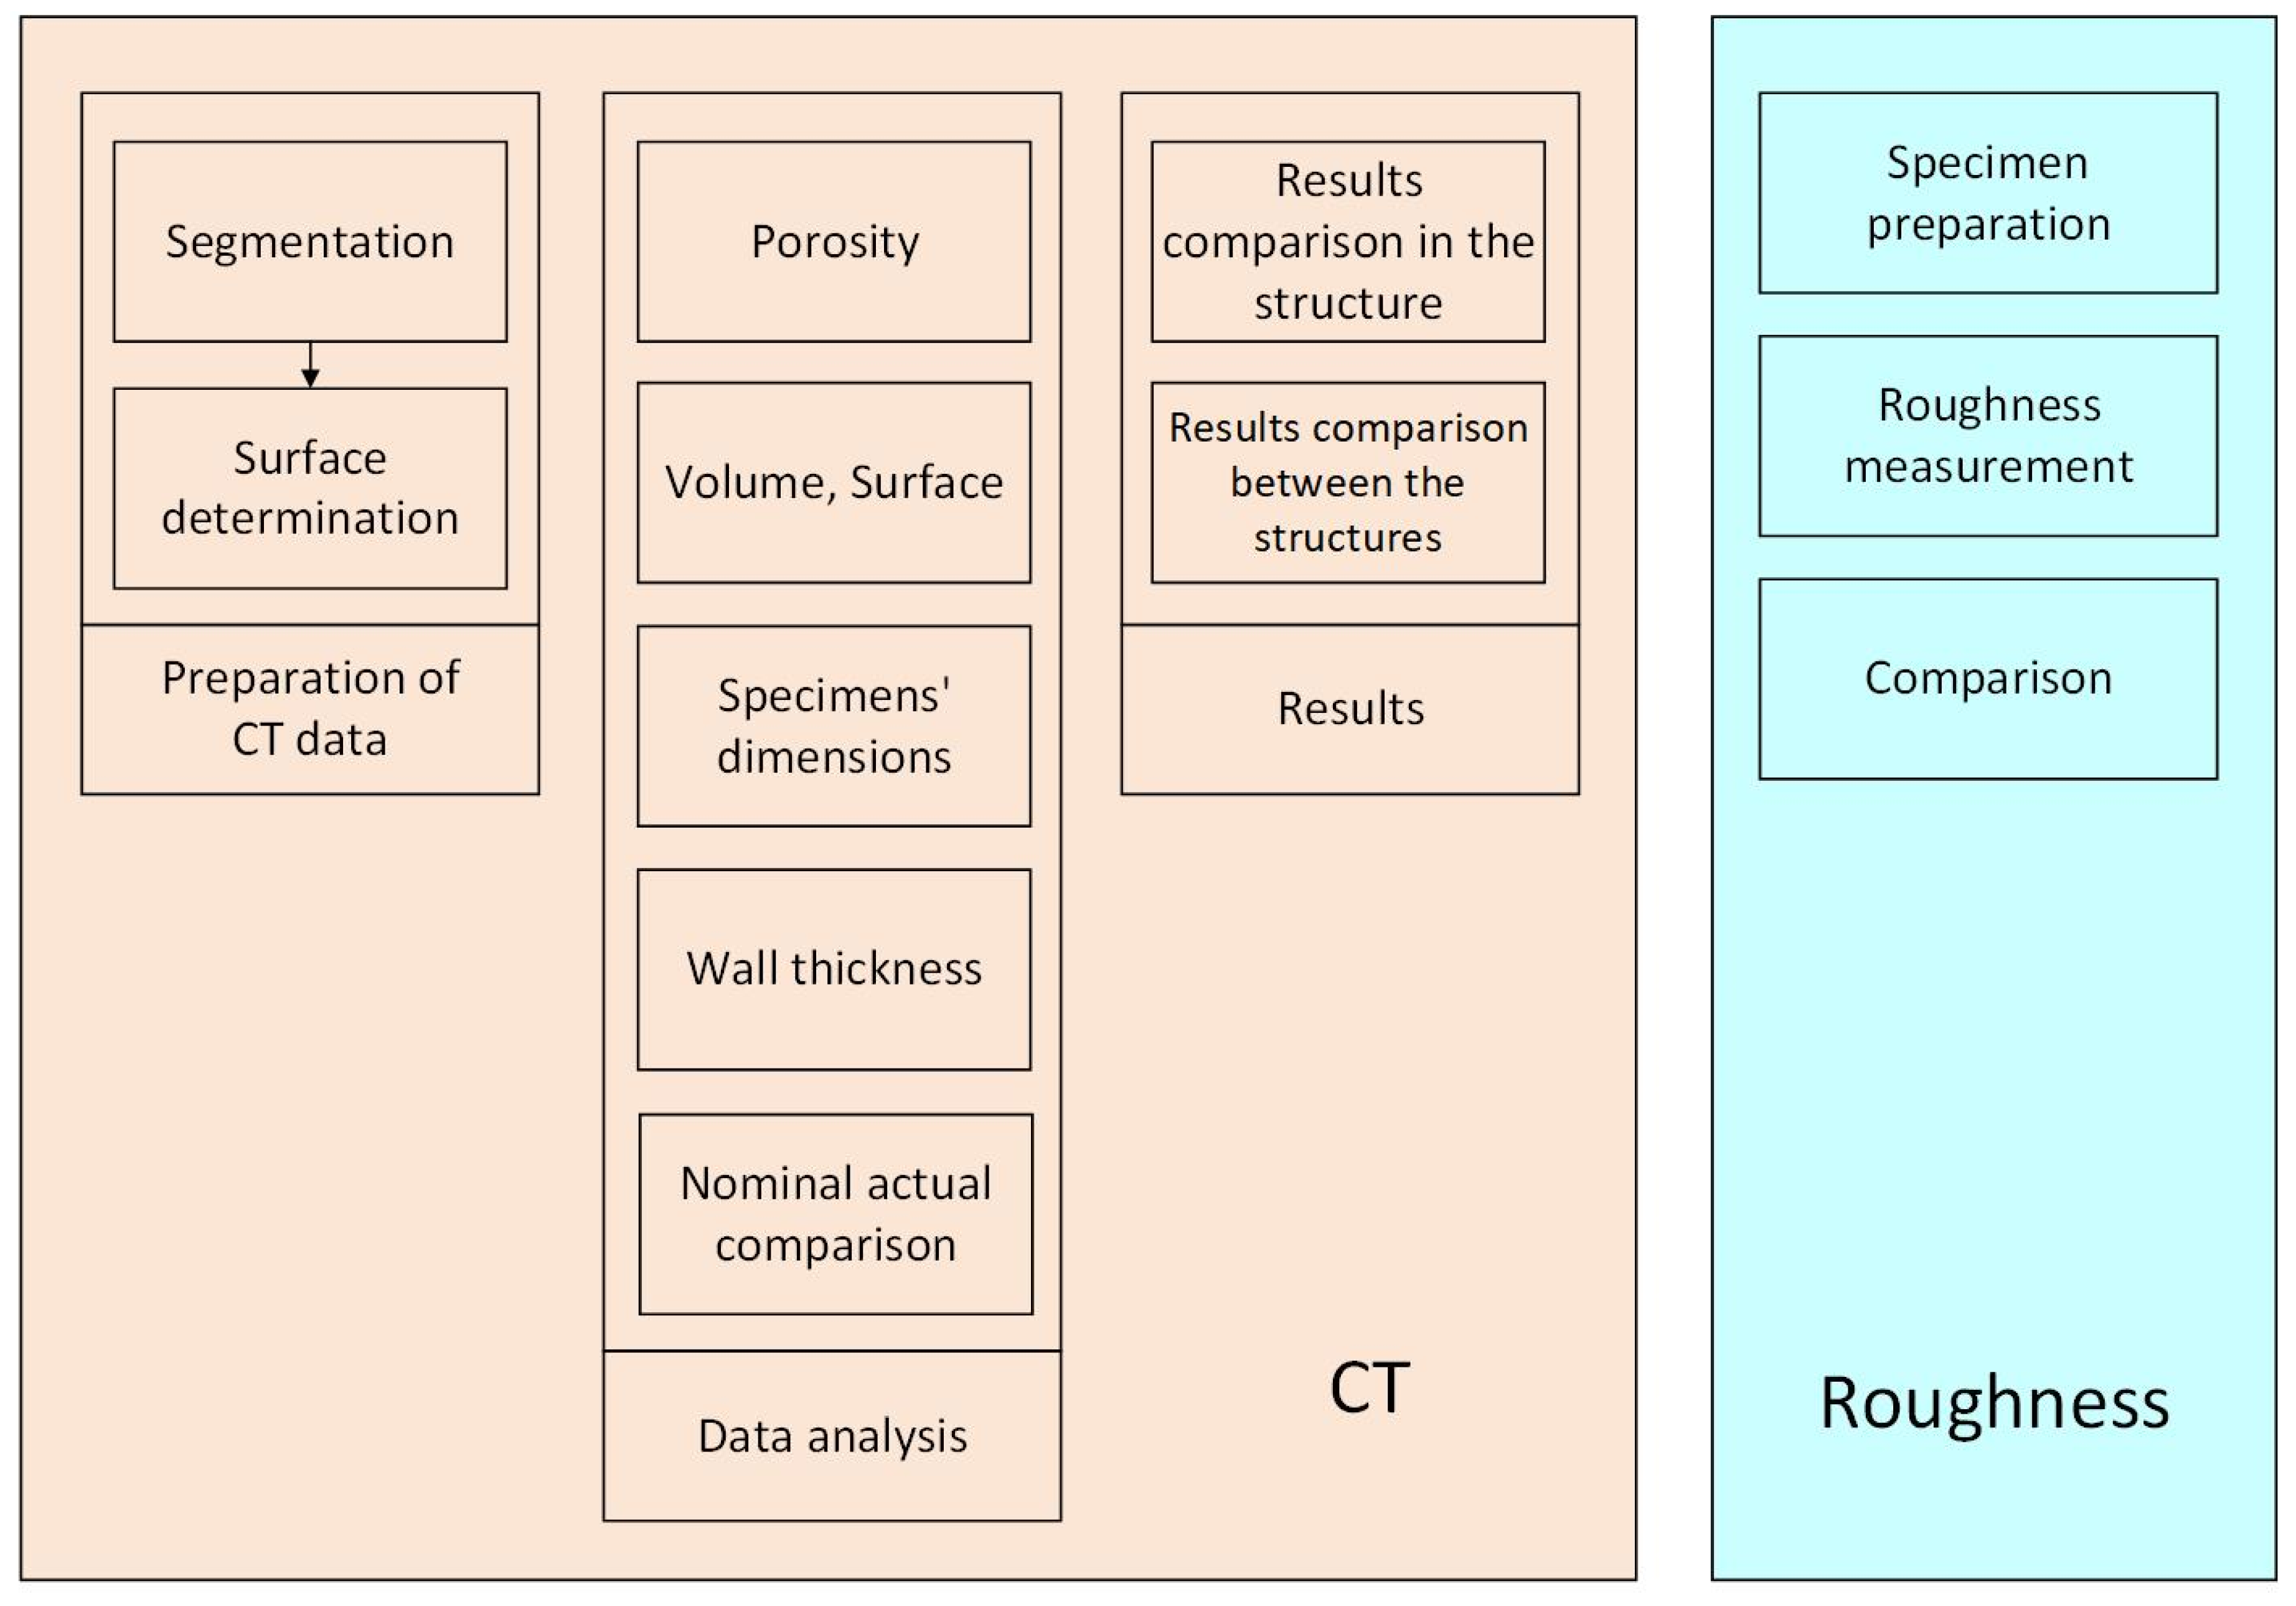
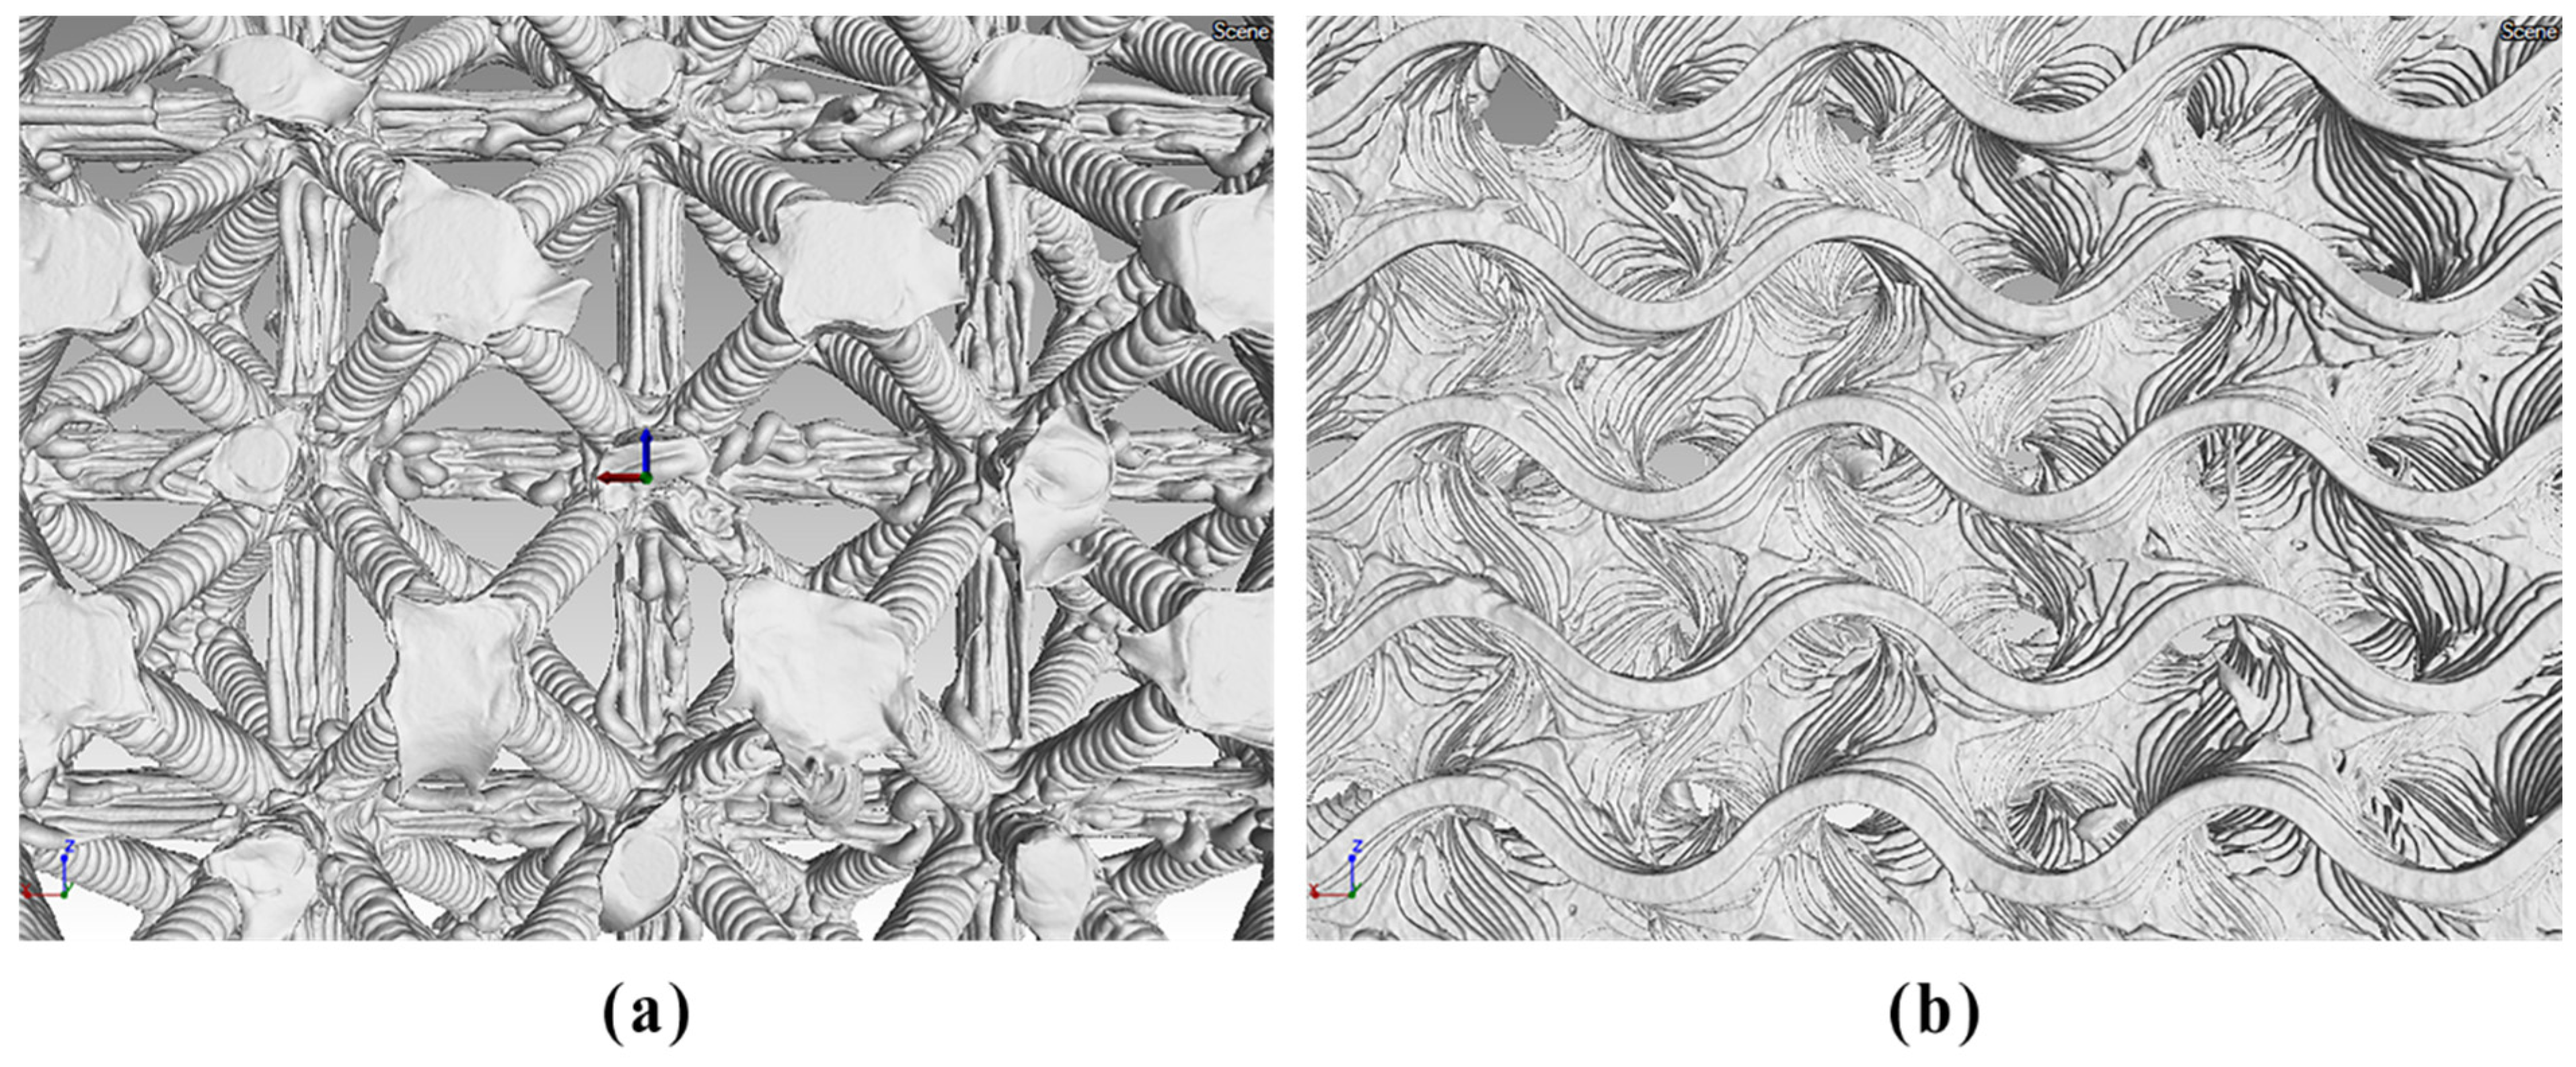
The present paper provides a quality comparison of selected surface texture parameters, the complex geometry, and the internal porous structures of additive products (lattice structure and gyroid structure).

2. Material and Methods

In this research, the quality and accuracy assessment of gyroid and lattice specimens’ production is divided into the specimens’ design, the specimens’ CT scanning and assessment, and roughness measurement and assessment.

2.1. Methodology of Test Specimens’ Design

First, 3D models of the test specimens were created using the software PTC Creo Parametric 9.0.1.0. The basis of creating 3D models of the test specimens was a block of 35 × 35 × 7 mm. The cuboid’s volume was filled with a lattice and a gyroid structure. In both specimens, and in all three directions of the X, Y, and Z axes, the unit cell size was 7 mm. The basic cell’s position was identical for both experimental specimens, i.e., the whole cell was multiplied and patterned in all coordinate systems’ directions. The 3D models of the test specimens and detailed views of the porous structures’ basic cells are shown in Figure 1.
The printing parameters of the 3D model test specimens are shown in Table 1.
Two types of specimens were produced for our research: a lattice structure specimen and a gyroid structure specimen. The technological parameters of the experimental specimens can be seen in Table 2.
A total of 6 experimental specimens were assessed and compared, as shown in Figure 2.

2.2. CT Data Assessment Methodology

The test specimens were scanned as 2 pieces (one material) by an industrial computed tomography instrument, the Phoenix V|tome|x L 240 (GE), with a resolution of 0.035 mm. After individual specimens’ segmentation, their surfaces were determined, and the printout’s internal cavities were eliminated. Within the research, the printing quality (surface and joining of individual print layers) was visually assessed, as it could not be assessed with the available software tools. The dimensional parameters of printouts, the material volume in the manufactured specimen, and the specimens’ surfaces, wall thickness, and porosity were assessed using the VGStudio MAX 2.2 software tools and compared with reference values. To identify geometric differences between the specimens and the reference models, nominal and actual analyses were performed in the VGStudio MAX 2.2 software. The data processing methodology, individual analyses performed, and results assessment are shown in Figure 3.

2.3. Roughness Measurement Methodology

The Alicon Infinite G5 is an optical three-dimensional microscope for complete 3D surface analysis, with micro, macro, and nano resolutions, and it allows for the assessment of thermographic color maps according to the applicable standards of EN ISO 21920 [24]. This optical microscope can analyze larger areas using XY table movement and a problem-free image-joining functionality. It can also assess and analyze the results of 2D and 3D roughness profiles, cylindricity, or profile parameter P. Its vertical resolution is up to 10 nm, while the lateral resolution is 400 nm. For each option, there are statistical functions to statistically define the experiment [25].
The measurement took place according to the standards EN ISO 4287 [26] and EN ISO 4288 [27]. An Lc filter was used for a random profile of 8 mm and a profile length of 40 mm. For the random profile, the values were chosen according to the roughness parameter Ra. In our case, Ra ranged from 10 to 80 µm.

Principle of Roughness Measurement

The Alicona Infinite G5 microscope works on the principle of structured light vertical scanning and the layering of individual images (focus variation method) using coaxial white light, precisely adjusted through the mirrors into the objective and to the specimen’s surface. Light reflection off the specimen is scanned back by the sensor. Each pixel in the image has its own record of the given position in Cartesian data coordinates. In the flat plane, the size of local contrast (blurring) of algorithmic combinations is obtained, as well as information on the adjacent surroundings of the given region and information on the pixel brightness. These calculations were repeated for the same pixel vertically, across all images. After completing the algorithm calculation, a contrast curve was formed (each “x” in the plane has many contrast values; the same is true for the “y” axis) [28]. Measurement principle using the Alicona Infinite G5 optical microscope is shown in Figure 4.

3. Results and Discussion

The results of test specimens’ measurements were evaluated in each structure and between individual structures according to the methodology shown in Figure 3.

3.1. CT Tomography Assessment

All analyses were performed in the VGStudio MAX 2.2 software. The results of 3D printing were assessed based on visual inspection and dimensional and structure analyses.

3.1.1. Visual Assessment of 3D Printing in Individual Structures

In the case of the gray lattice structure, a significant amount of unremoved sintered powder (red arrow) is visible, which, to some extent, invalidates the result of manufacturing. As seen in Figure 5a,b, impurities were found in the powder (blue arrow) and pores (yellow arrow) in the specimen’s material. In Figure 5 on the left, the specimens’ structure zoomed by 40% can be seen, on the right, a 70% zoom can be seen.
In the case of the gray gyroid structure, differing from the gray lattice structure, only a small amount of excess powder remains on the surface, as seen in Figure 5c,d.
Both gray specimens contain a significant number of pores and a certain number of impurities (inclusions), characterized by a significantly higher material density. The presence of excess powder and pores is also visible on the reconstructed surface, which has significantly higher roughness (Figure 6).
In the case of red experimental specimens, the shortcomings of the FDM technology can be seen in terms of high porosity, shape inaccuracies, and material layering. This deficiency manifests itself both in the lattice and the gyroid structure (Figure 7). In Figure 7 on the left, the specimens’ structure zoomed by 40% can be seen, on the right, a 70% zoom can be seen.
Figure 8 shows a 3D reconstruction of the red specimens’ surface, including errors created during manufacturing.
In the case of black experimental specimens, as well as in the case of red experimental specimens, the shortcomings of FDM manufacturing can be seen. Compared to the red specimens, however, the structure is finer and more homogeneous, and the continuity of the layers is visibly better (Figure 9). In Figure 9 on the left, the specimens’ structure zoomed by 40% can be seen, on the right, a 70% zoom can be seen.
Figure 10 shows a 3D reconstruction of the black specimen’s surface, where individual fibers are not as visible as in the red experimental specimens.

3.1.2. Assessment of Test Specimens’ Porosity

The porosity was assessed in all researched specimens. In the case of gray specimens, according to the analyses, the porosity is several times (approximately right times) greater than in specimens manufactured by FDM technology (black and red). The porosity results in specimens manufactured by FDM technology are affected by the lack of an appropriate algorithm to calculate the porosity. Several pores are connected or emerge to the surface; thus, the algorithm cannot identify them. Figure 11 shows an example of the porosity analysis for lattice red and gray structures.
The results of the porosity analysis are presented in Table 3.

3.1.3. Assessment of Surface and Volume of Test Specimens

As part of the basic analysis, the volume and surfaces of test specimens were assessed and we calculated the percentage change, in comparison to a theoretical value obtained from the CAD model, based on Formula (1):
= ( V R V T ) V T · 100   [ % ] .
The results show that all test specimens have a smaller volume of material than in the theoretical one. The analysis does not account for the material pores; it only reflects the material itself. In the lattice structure, the difference is approximately two times compared to the gyroid structure, while the gray specimens have a volume change percentage of approximately half compared to the rest (Table 4).
Table 5 shows the values of the theoretical and obtained surface and the percentage surface change compared to a theoretical value from Formula (2):
A = ( A R   A T ) A T · 100   [ % ] .
The surface in all specimens is larger than the theoretical one. In specimens manufactured by FDM technology, this is due to visible material layering. In Section 3.1, it was concluded that the black specimens were manufactured better, as also confirmed by the surface value, which, compared with the red specimens, was approximately halved in both the lattice and gyroid structures. The surfaces of gray specimens are affected by the unremoved material and higher surface porosity. In the case of gray specimens, the percentage surface change is 60%, which is six times the percentage surface change in the lattice structure and three times that in the gyroid structure when compared with the black specimens.

3.1.4. Assessment of Test Specimens’ Dimensions

The production accuracy is assessed by the external dimensions of specimens and by comparing them with reference CAD models. The results show the gray specimens having the smallest deviation, followed by red specimens, while the black specimens feature the highest deviation. This result is in contrast with the visual assessment of specimens, where the red ones were of the worst quality (Table 6).

3.1.5. Assessment of the Test Specimens’ Wall Thickness

The VGStudio MAX 2.2 software enables the assessment of specimens’ wall thickness, or its measurement locally, in selected points. As part of the assessment, a wall thickness analysis was performed with the analyzed thickness set to 2 mm. Due to the significant surface irregularities and analysis algorithms, the use of the given module to measure the strut diameter is limited. On the surface, several areas can be seen, the resulting thickness of which is smaller than that of the produced one. The analysis result is shown in Figure 12.
The second choice is to measure the wall’s diameter/thickness in a selected cross-section. To prove the impact of the fit method setting, the gray lattice structure’s diameter was assessed using a Gaussian feature, minimum circumscribed feature, and maximum inscribed feature. The results imply a difference between the methods of 0.120 mm in the radius, which is due to the cross-section’s shape and surface roughness. Figure 13 shows the creation of individual features.
Figure 14 shows the cross-section of a red and black lattice structure. The significant deformation of the cross-section’s shape is visible, and no single cross-section measurement methodology provides “quality” data.
The same analyses were performed for gyroid experimental specimens. Figure 15 shows the measurement of the wall thickness at a selected point in all gyroid specimens. In all specimens, the effect of manufacturing is obvious; in the case of the gray specimen, shown in Figure 15a, it is the effect of surface “roughness”, and in the case of red and black ones, it is the effect of the manufacturing technology (material layering), with significant differences between the two measurements (see Figure 15b,c).

3.1.6. Actual and Nominal Comparison

All manufactured specimens were compared with the reference geometry (CAD model) to analyze the manufacturing accuracy. Due to the specimens’ “structure”, the best-fit method was used for alignment. Figure 16 shows the surface deviations in gray specimens, while the color coding of the deviations is shown in the color bar to the left of both structures. The deviations are uniformly distributed and most of the surface has a deviation smaller than ±0.100 mm.
Figure 17 shows the deviations on the red specimens’ surfaces. The distribution of deviations in the lattice structure in Figure 17a is not uniform, the sample is slightly “bent” in the center, and most of the surface has a deviation of less than ±0.500 mm. The distribution of the deviations in the gyroid in Figure 17b is difficult to assess due to the “profile” shape and the number of visible layers.
Figure 18 shows deviations on the black specimens’ surfaces. The distribution of the deviations implies the deformation of the manufactured specimens, which is also visible in the side view, due to which the manufacturing accuracy is difficult to assess. This is also why some deviations are greater than ±0.500 mm.
Table 7 shows the cumulative deviations for 90% of the surface, i.e., 90% of the surface has a deviation equal to or smaller than the value in Table 7. Gray samples show the smallest deviation. Samples produced by the FDM technology have a greater deviation, while the surface deformations due to manufacturing need to be accounted for. Gyroid structures show smaller deviations from the CAD model than the lattice structures.

3.2. Assessment of Surface Roughness Measurement in Test Specimens

All analyses were performed in the MeasureSuite 5.3.4 software using the Alicona device. The goal was to analyze and assess the possibility of surface roughness scanning in 3D-printed specimens with lattice filling and a gyroid structure. The specimen’s ground plan was square, with a size 35 mm × 35 mm. The process of roughness measurement in the experimental specimens is described in Section 2.3, and we used a data processing and assessment methodology, as shown in Figure 3. Before starting the measurement, it was necessary to remove supports, unwanted strings, and brims. Samples produced by FDM technology presented problems with regard to detailed scanning due to a large amount of unwanted strings, which affected the surface roughness calculations. This is why the roughness parameters Ra, Rz, Rv, Rp were determined. Table 1, Table 2, Table 3, Table 4 and Table 5 show selective averages listed from a statistical file of measured data. The measurement was conducted on the edges of the specimen’s surface. It was impossible to perform measurements in the specimen’s center due to the string. The whole measurement was set to 10x optical zoom, while the brightness and contrast changed depending on the specimen’s reflection and the geometry of the measured point. Brightness and contrast are the primary settings for the scanning of a specimen’s surface. This information cannot be found in a table, as the experience and expertise of the researcher has a great influence. Each specimen’s measurement was performed five times to enable statistical analyses of the measurements. Figure 19, Figure 20, Figure 21, Figure 22 and Figure 23 show the scans of the individual gyroid and lattice experimental specimens’ surfaces. The measured roughness parameters can be seen in Table 8.
The specimen in Figure 19 features a particularly high roughness parameter Ra, while Table 8 demonstrates that the Rz parameter (red gyroid specimen), with the arithmetic average value = 137.190 µm, has the largest voids against the central straight line of all measurements’ arithmetic average.
The experimental red lattice specimen could not be scanned to measure surface roughness parameter R due to the large amount of string and poor printing quality, with reflections causing a set of points not to be scanned with suitable quality to be assessed. The Alicona creates a scanned model by stacking individual images in the “Z” axis. In this case, it was difficult to create this model because the surface contained a large number of thin strings.
The gray lattice and gyroid specimens, manufactured by the SLS method, have more than two-times better surfaces in terms of measured roughness parameter R, and the string does not trigger problems as it does in other specimens manufactured by the FDM method. Moreover, their surfaces present the best appearance, even by subjective observation with the eye. This method was created to compare the two most common methods used to manufacture 3D-printed plastic specimens.
In the black lattice specimen (Figure 23), scanning was difficult due to molten material and string forming, which complicated the measurement process. The specimens had to be measured vertically due to the good accessibility to individual layers. This specimen featured the largest values of the roughness parameters. We do not recommend this type of specimen for the testing of roughness parameter R or surface parameter S. For surface parameters, according to standards, the surface size is not appropriate. Figure 22 and Figure 23 demonstrate that the structure of printing and the assessment of the roughness parameter R are performed perpendicularly to the layering, while complying with such a standard is very difficult.

4. Conclusions

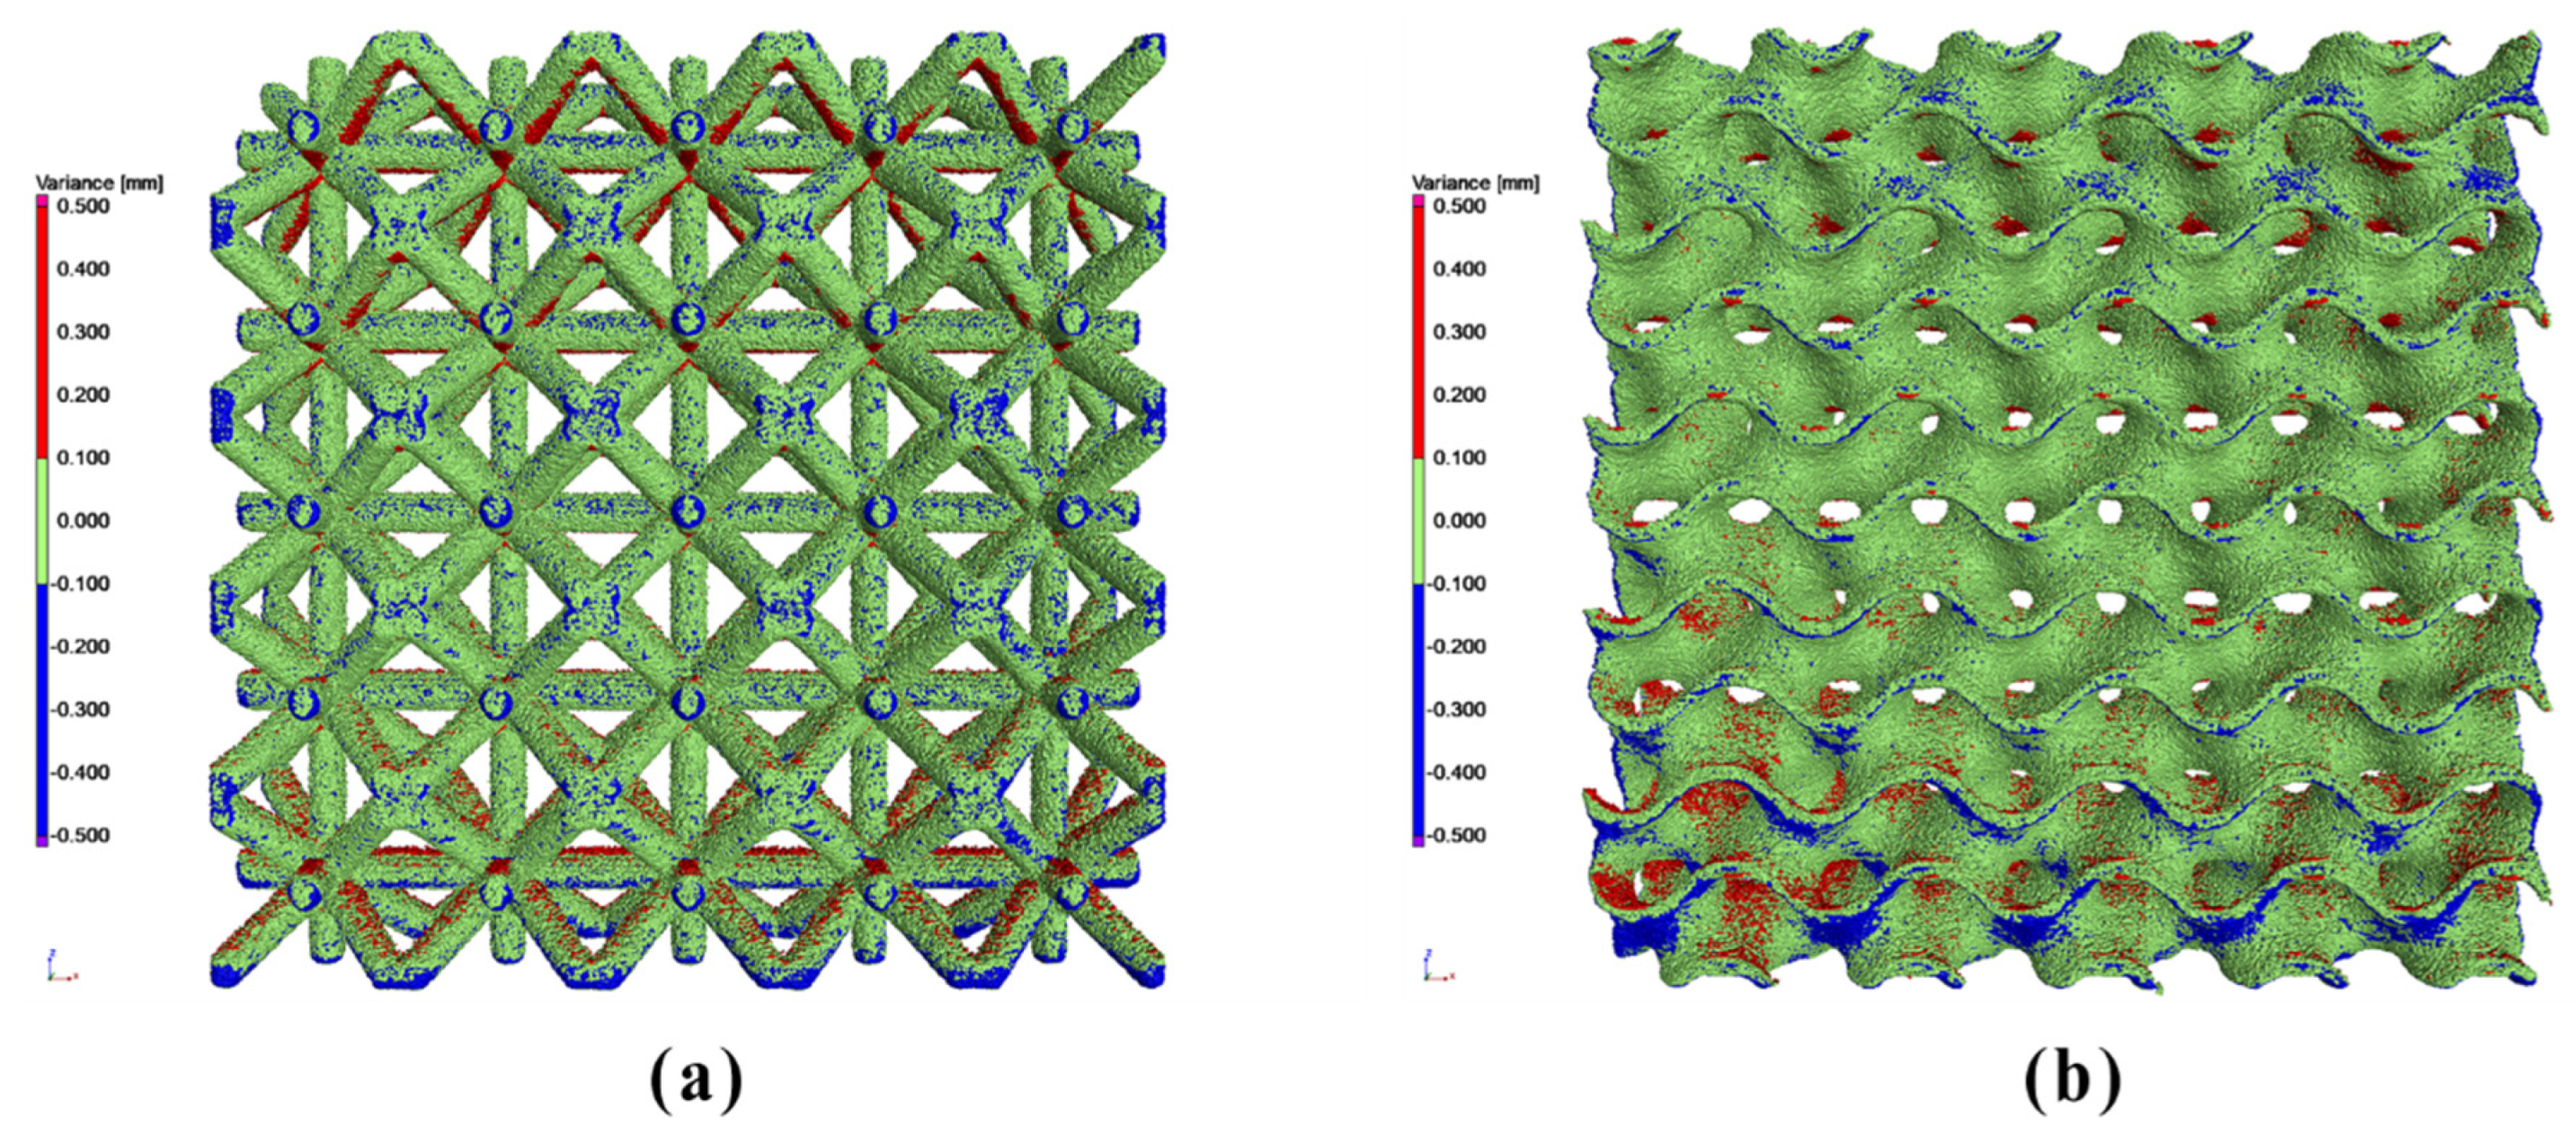
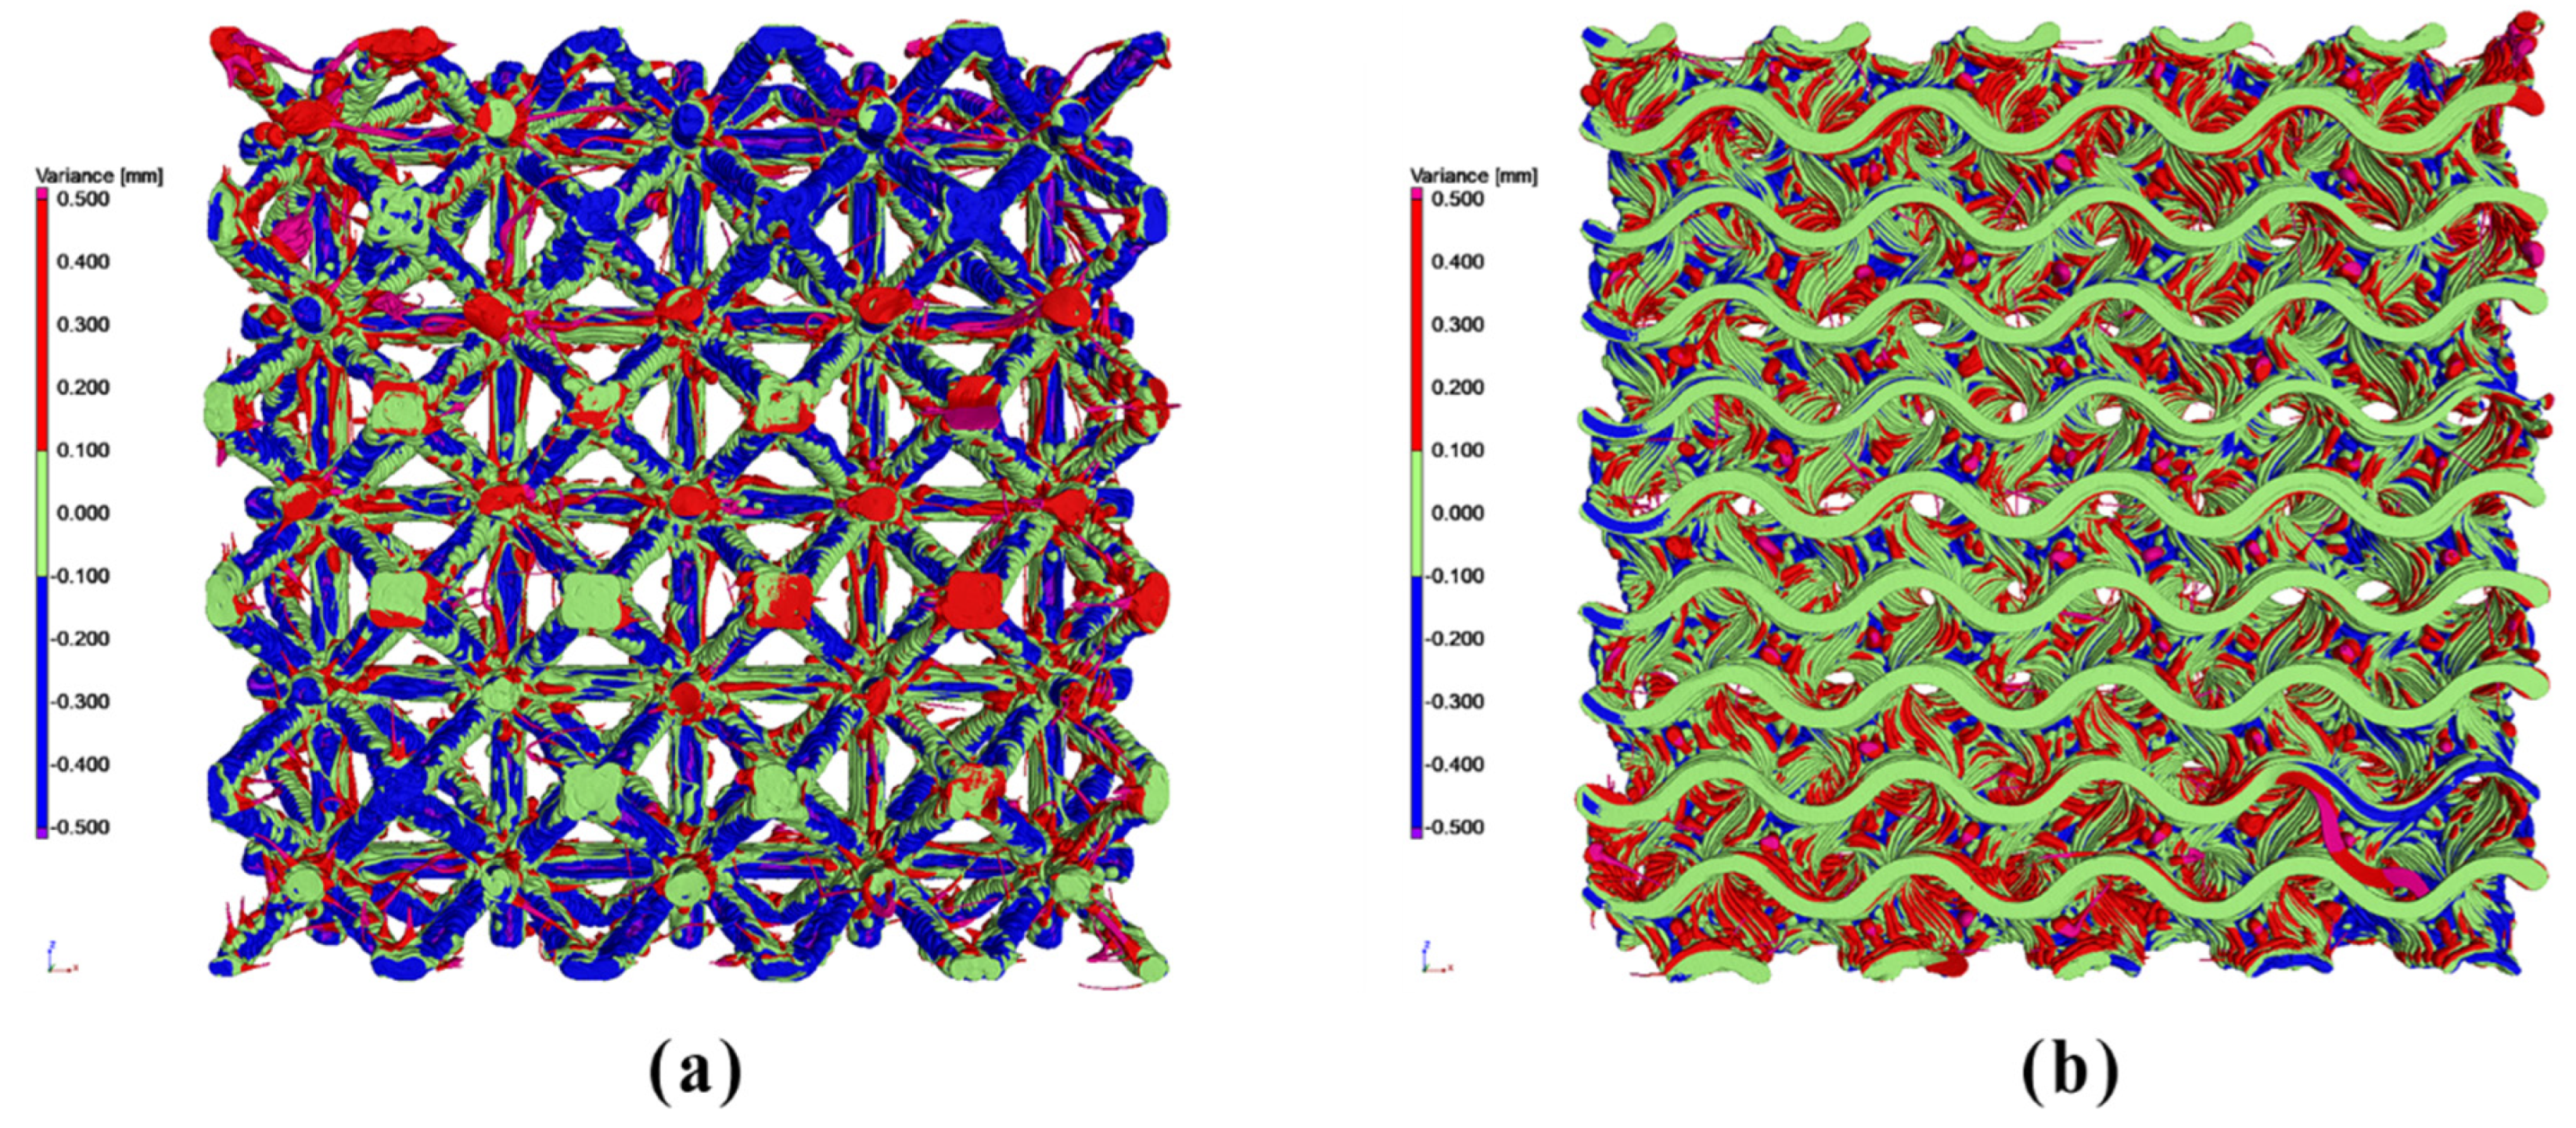
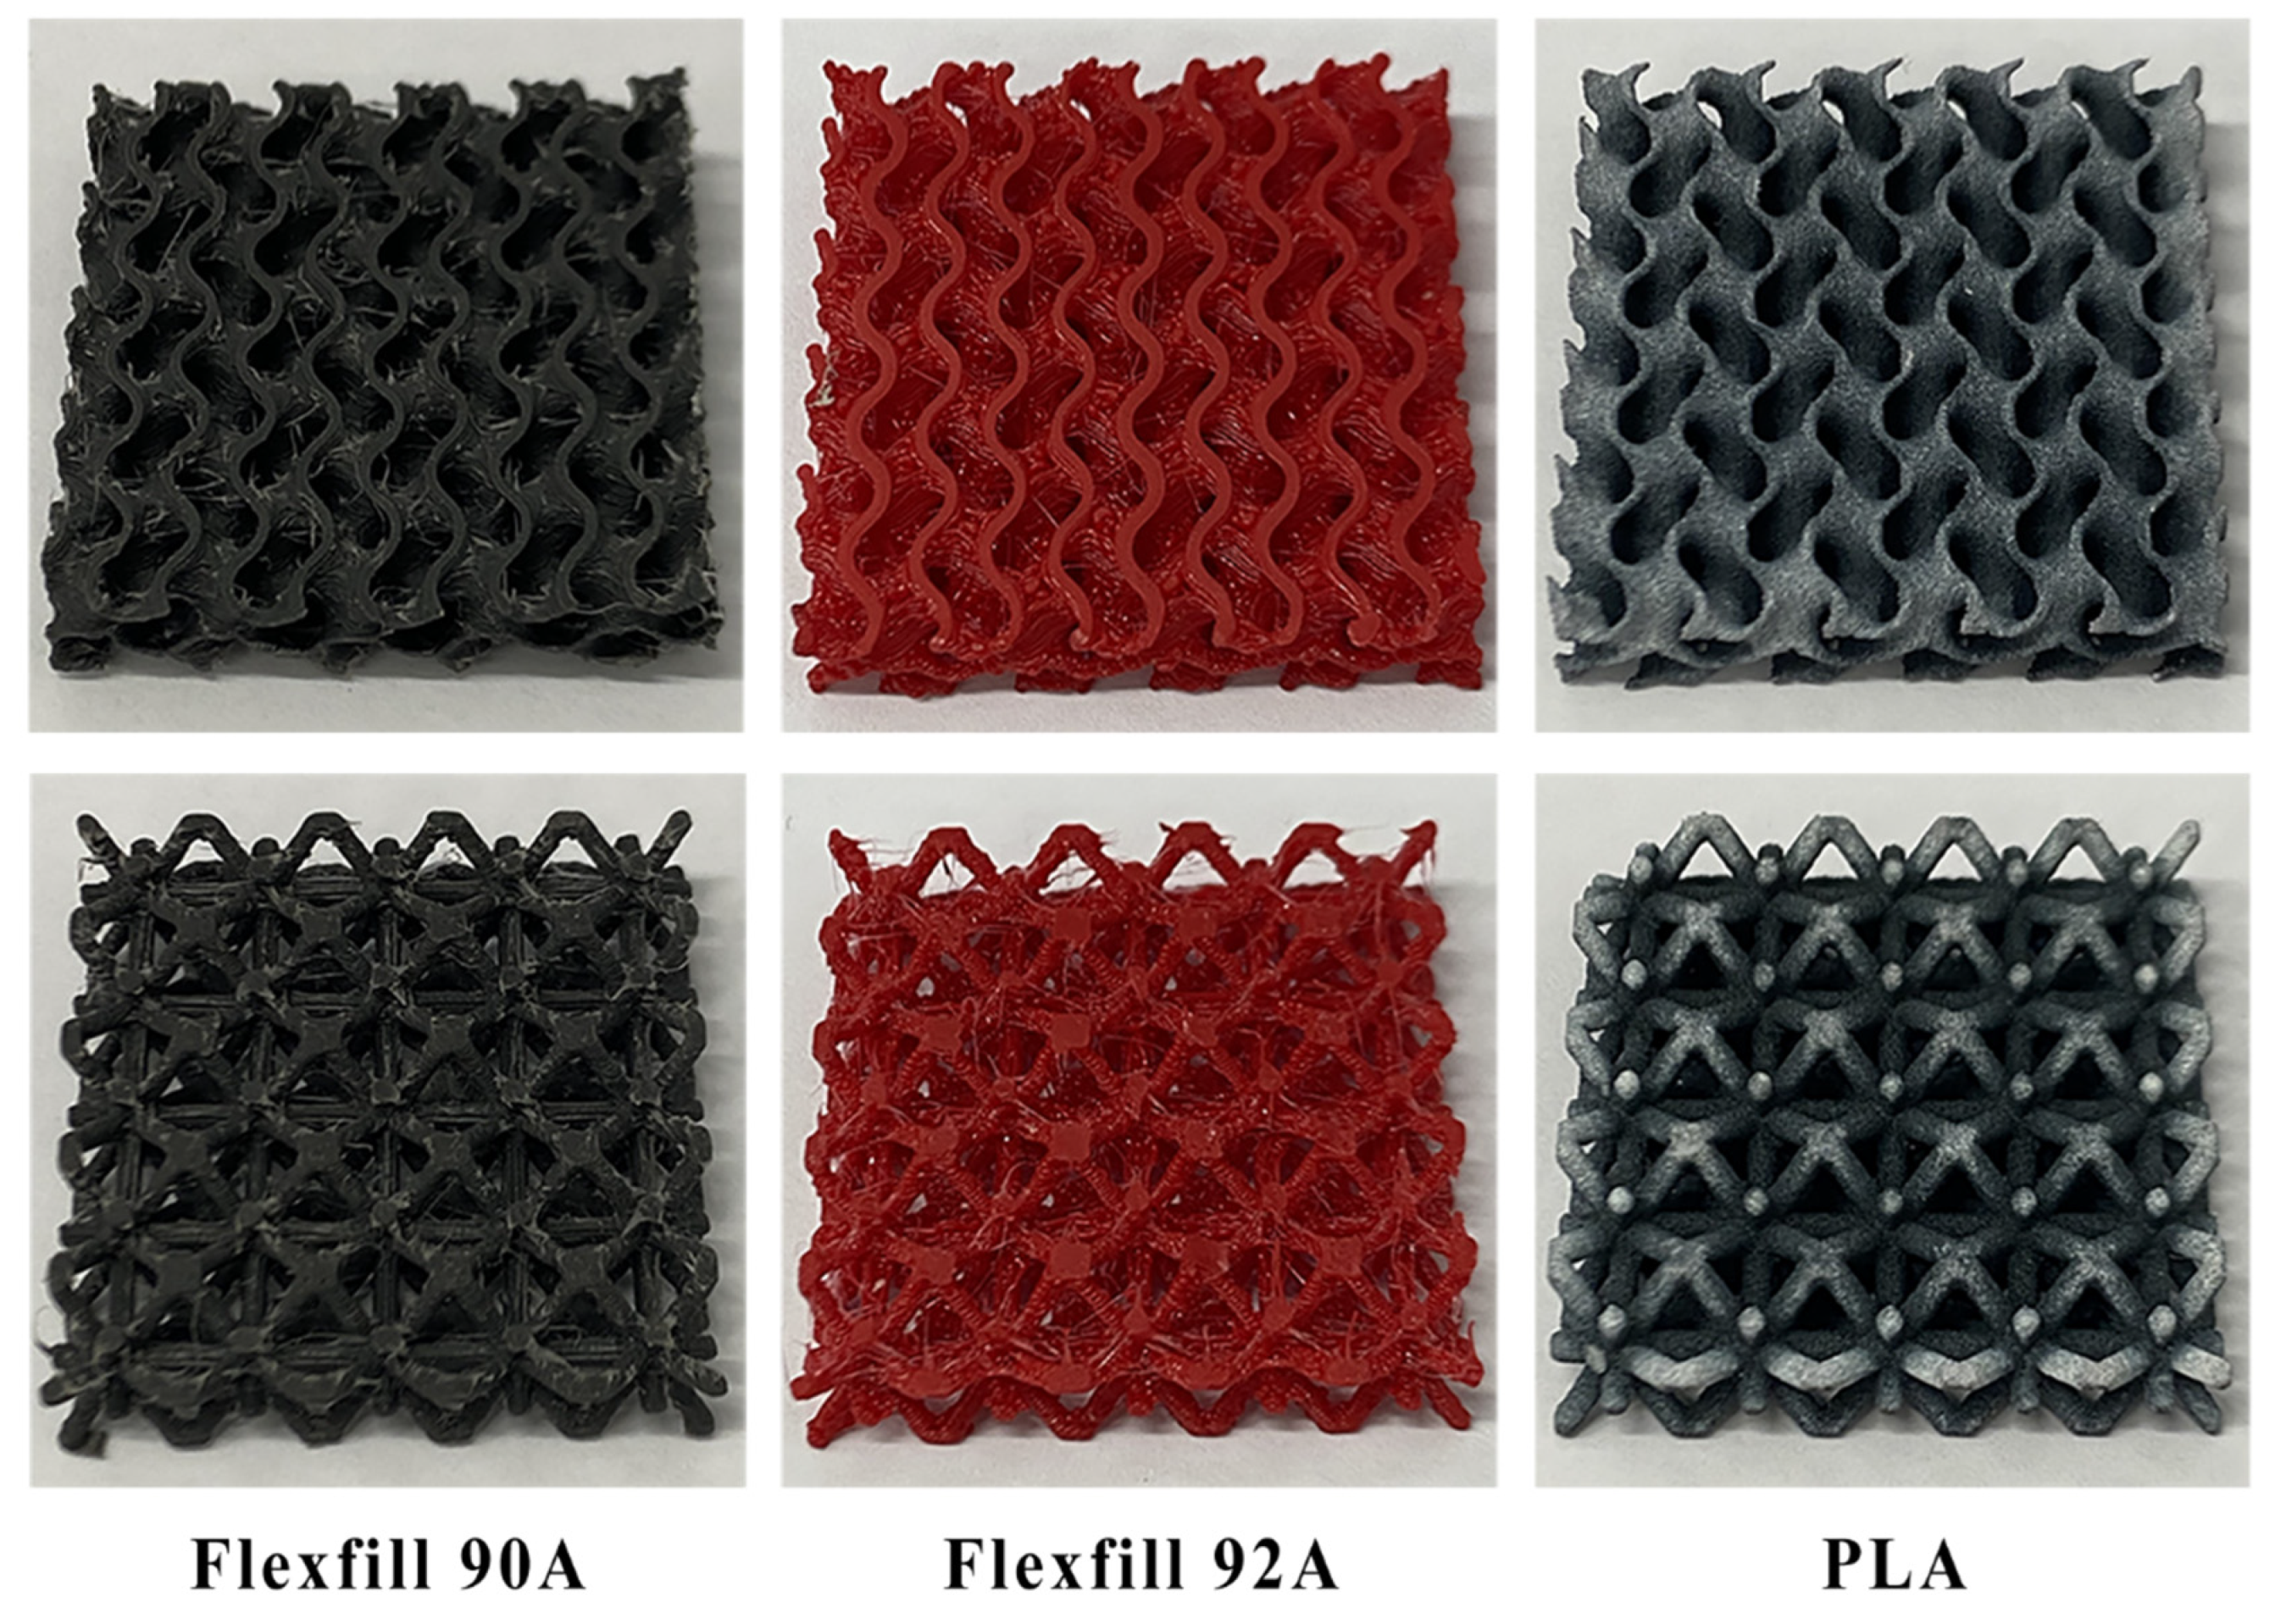
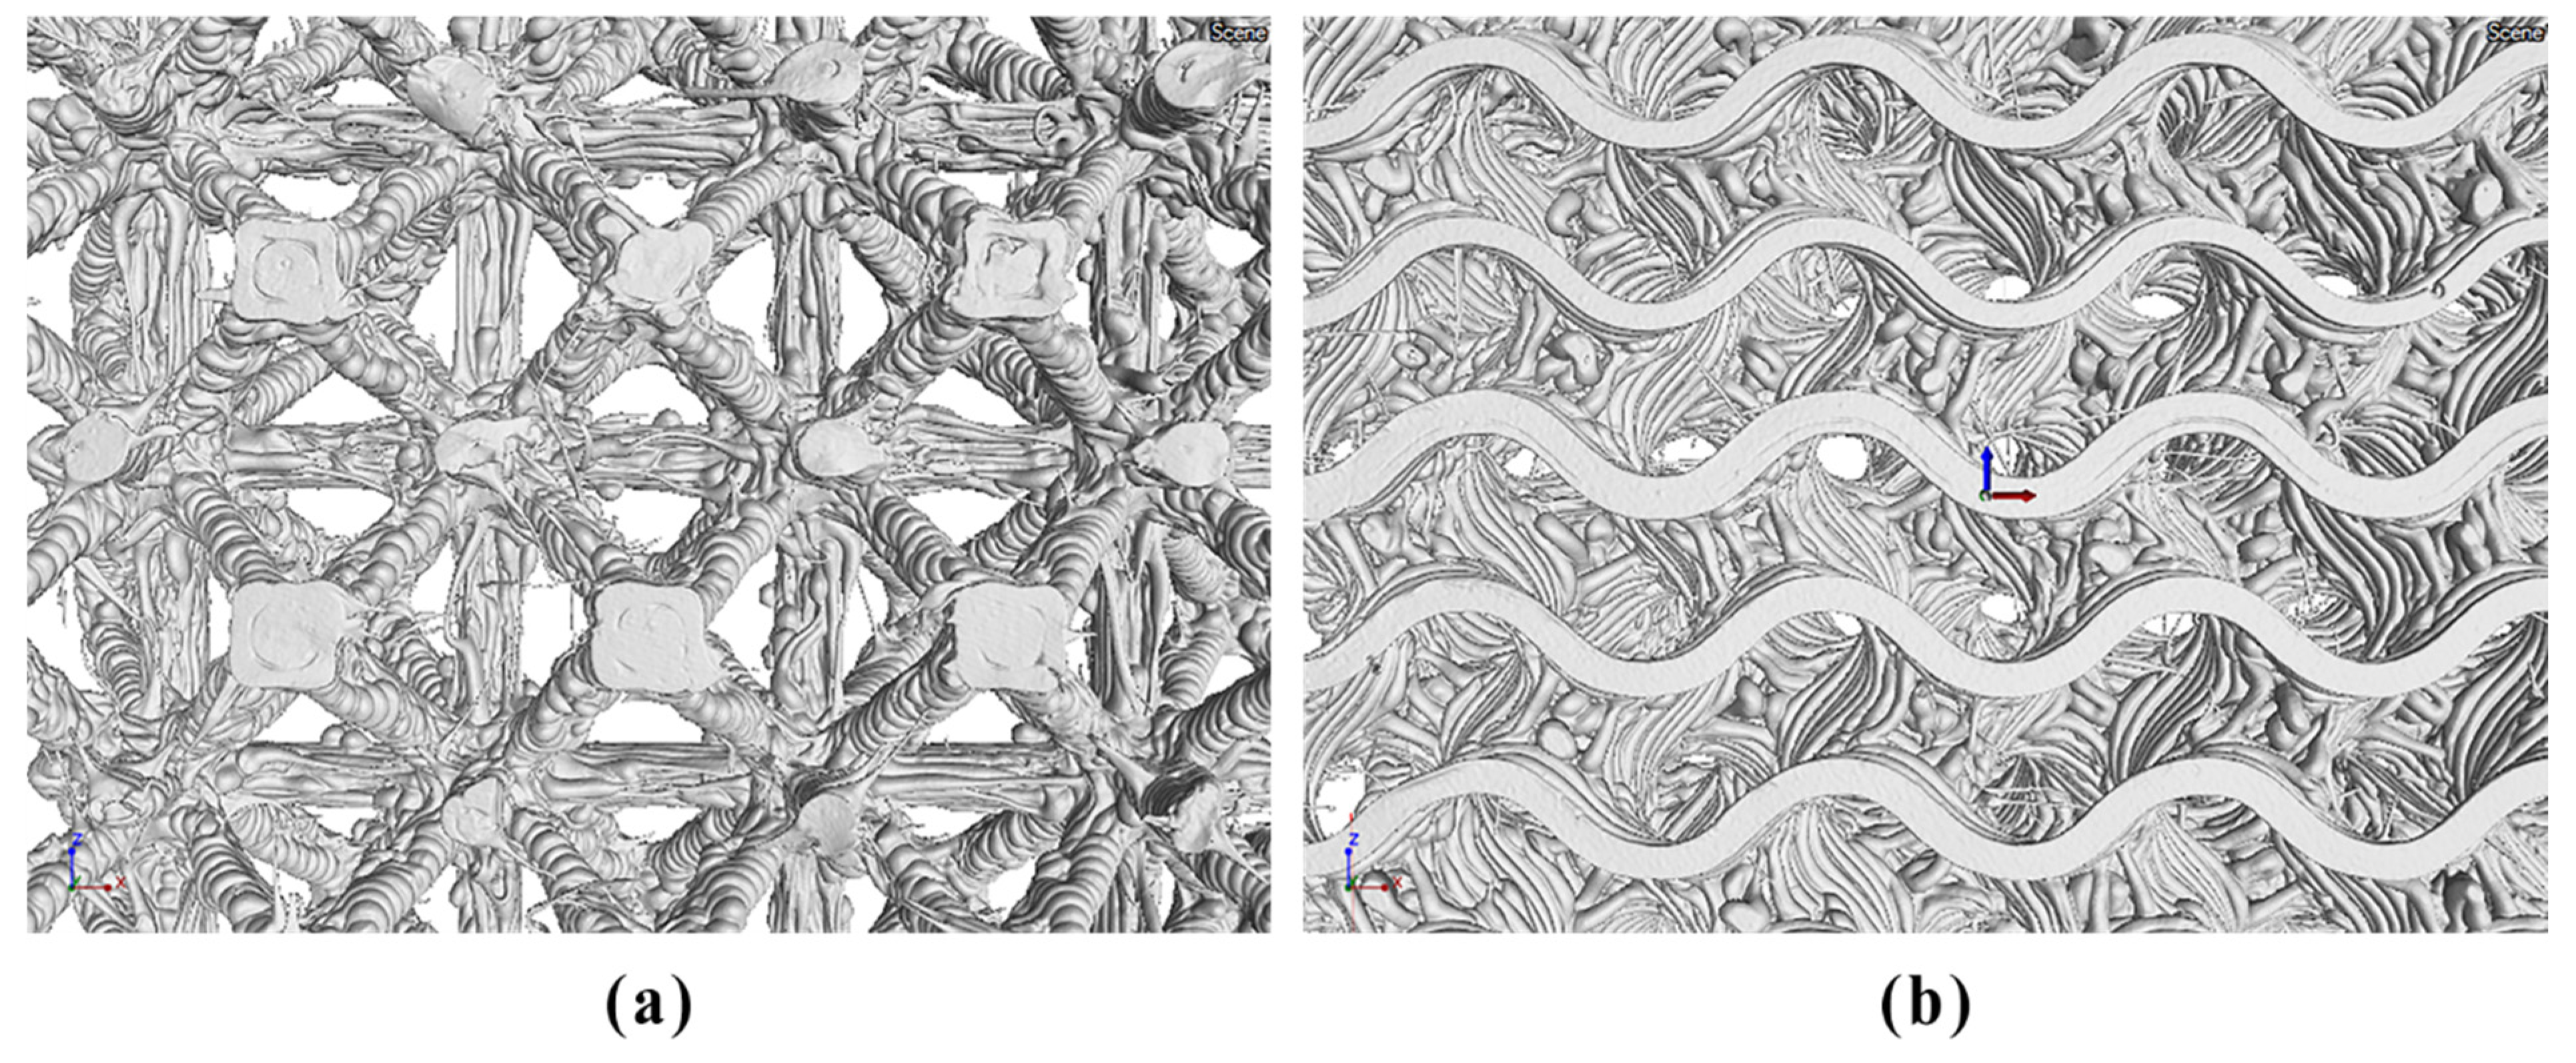
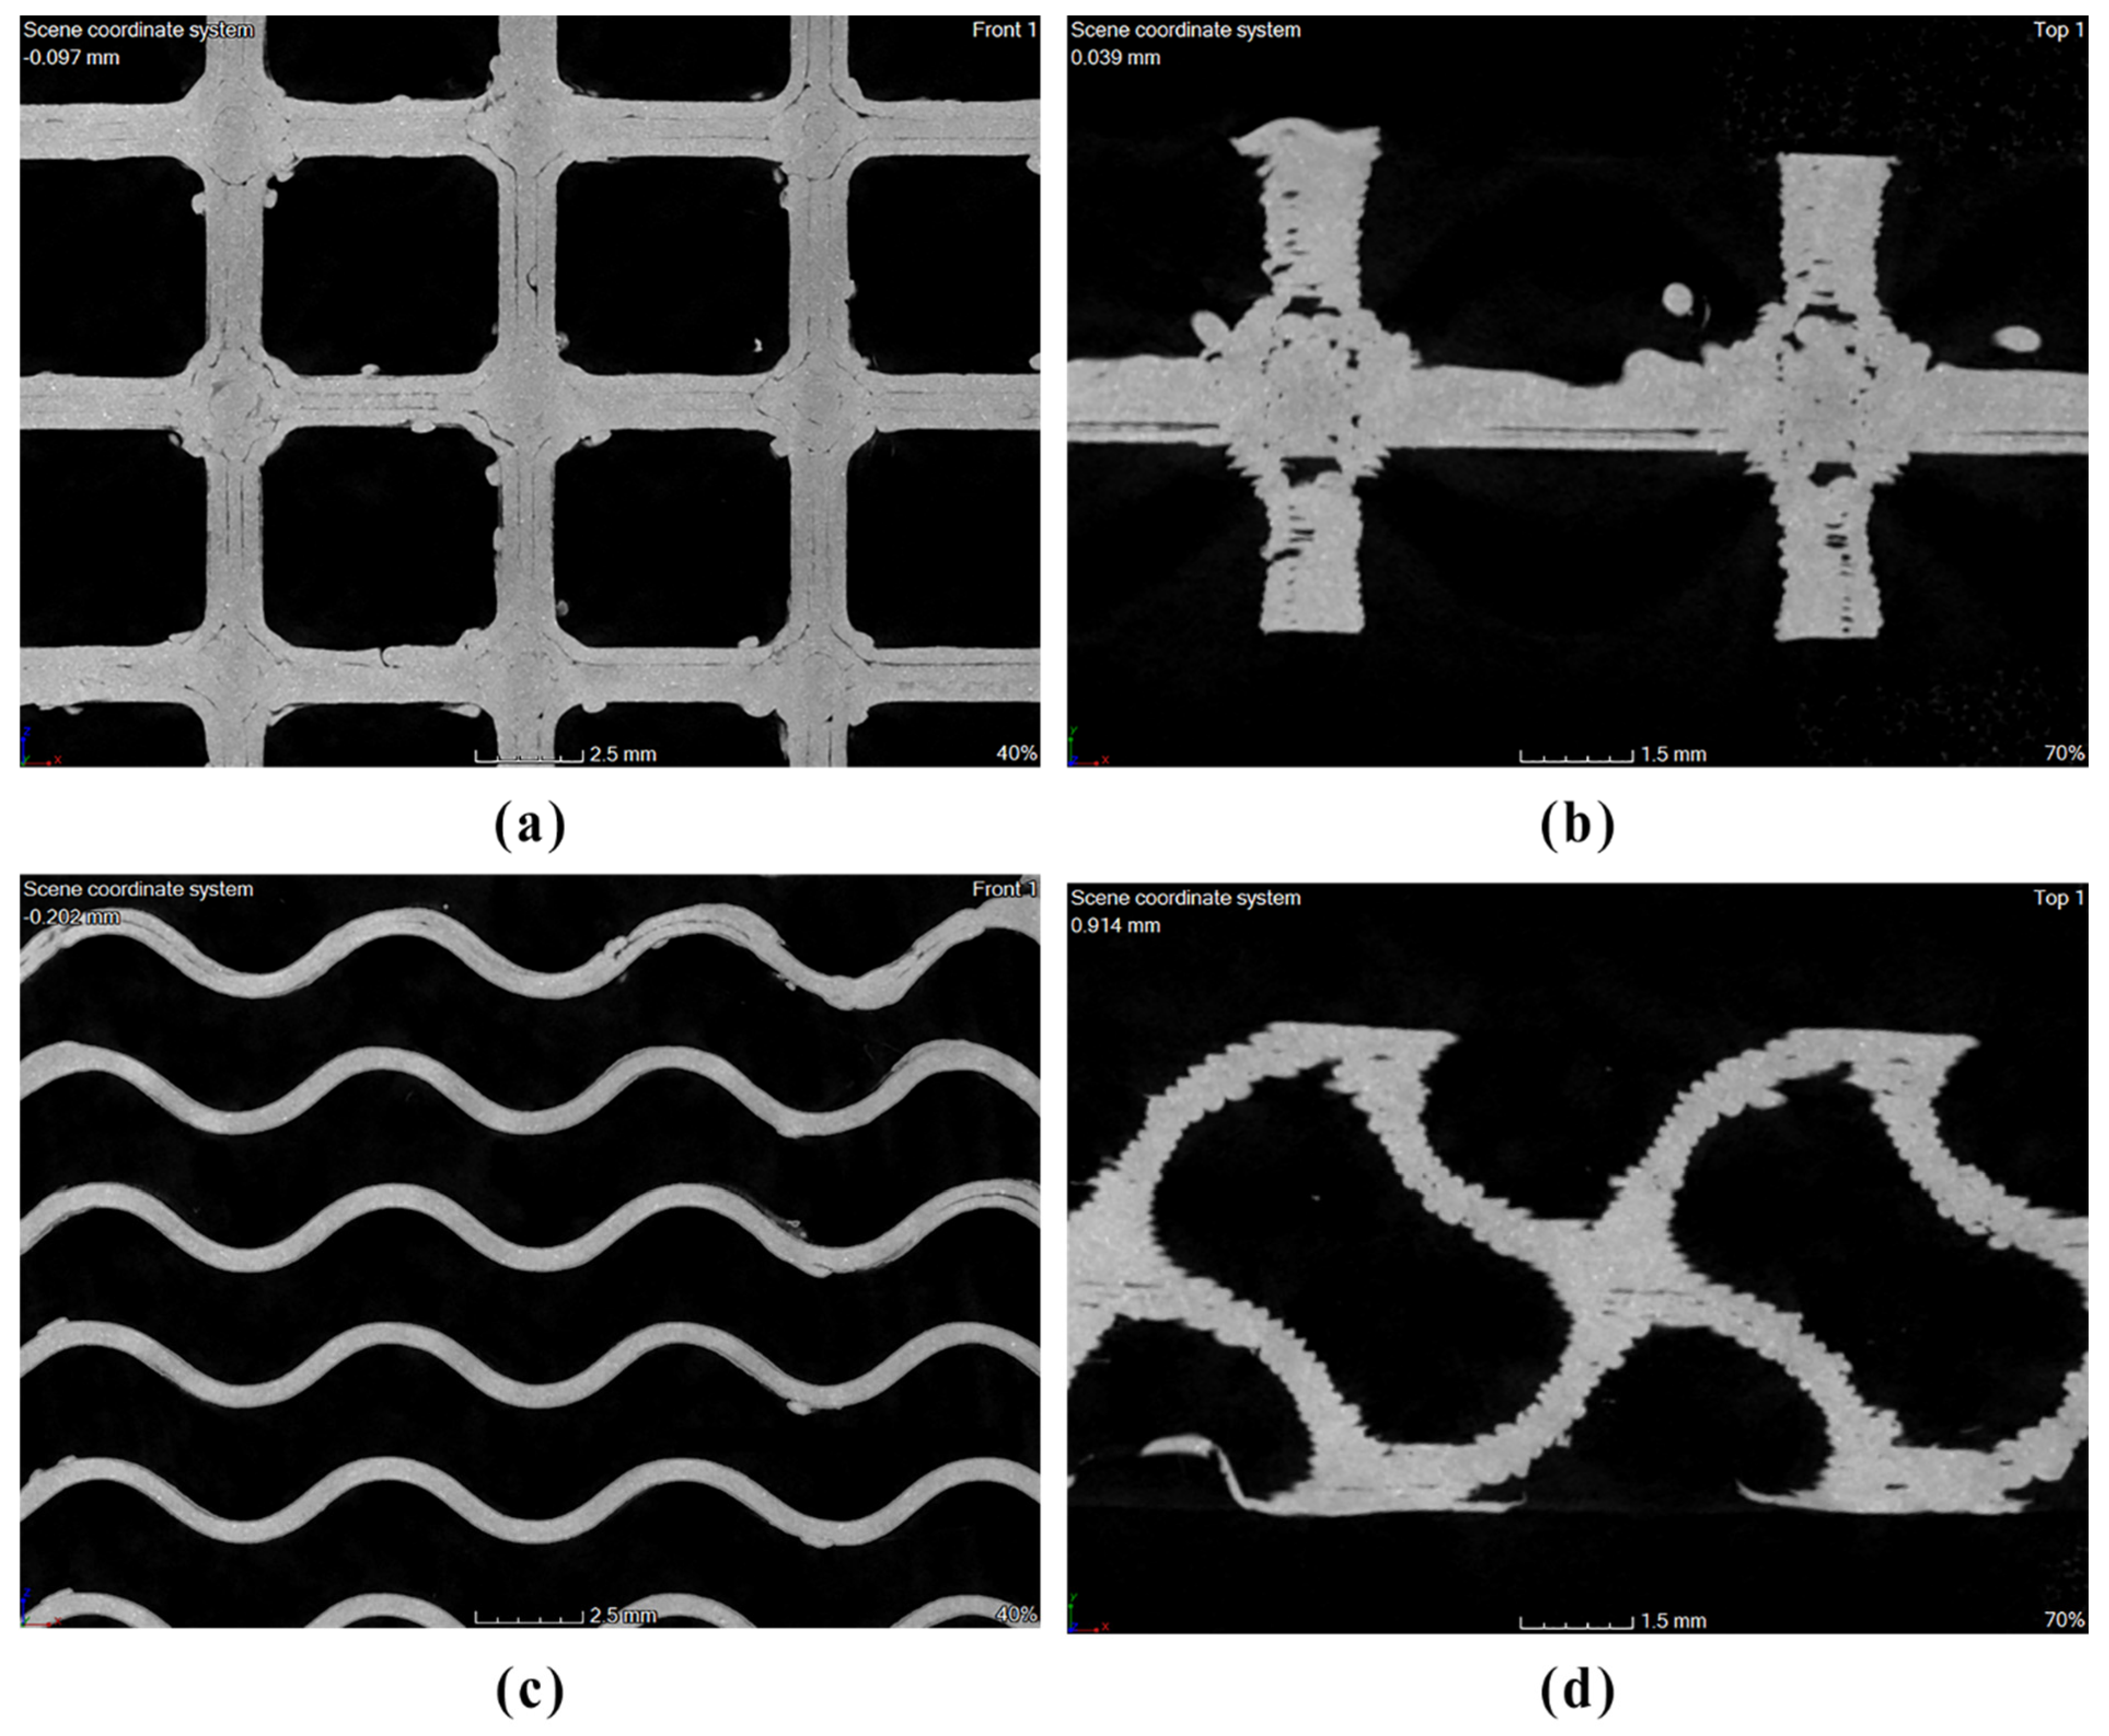
Additive technologies have the potential to be used in the manufacturing of many product categories. They are a prerequisite with regard to changing the current concept of supply chains, enabling the manufacturing of products with a complex internal structure, and they can effectively replace the conventional technologies used so far in some products’ manufacturing. When deciding on their application, however, whether the technology used is suitable for a given product and how it affects its final quality needs to be assessed. At the same time, a suitable structure needs to be selected to be used for the product’s manufacturing. When planning, a decision is often made between a lattice and gyroid structure. Based on the mentioned facts, the present research was carried out, aiming to compare the impact of the materials and technologies used on the quality of porous structures, represented by lattice and gyroid structures. The research was carried out on two types of test specimens: one with a lattice structure and the other with a gyroid structure. Then, the individual specimens were assessed using the industrial tomography method.
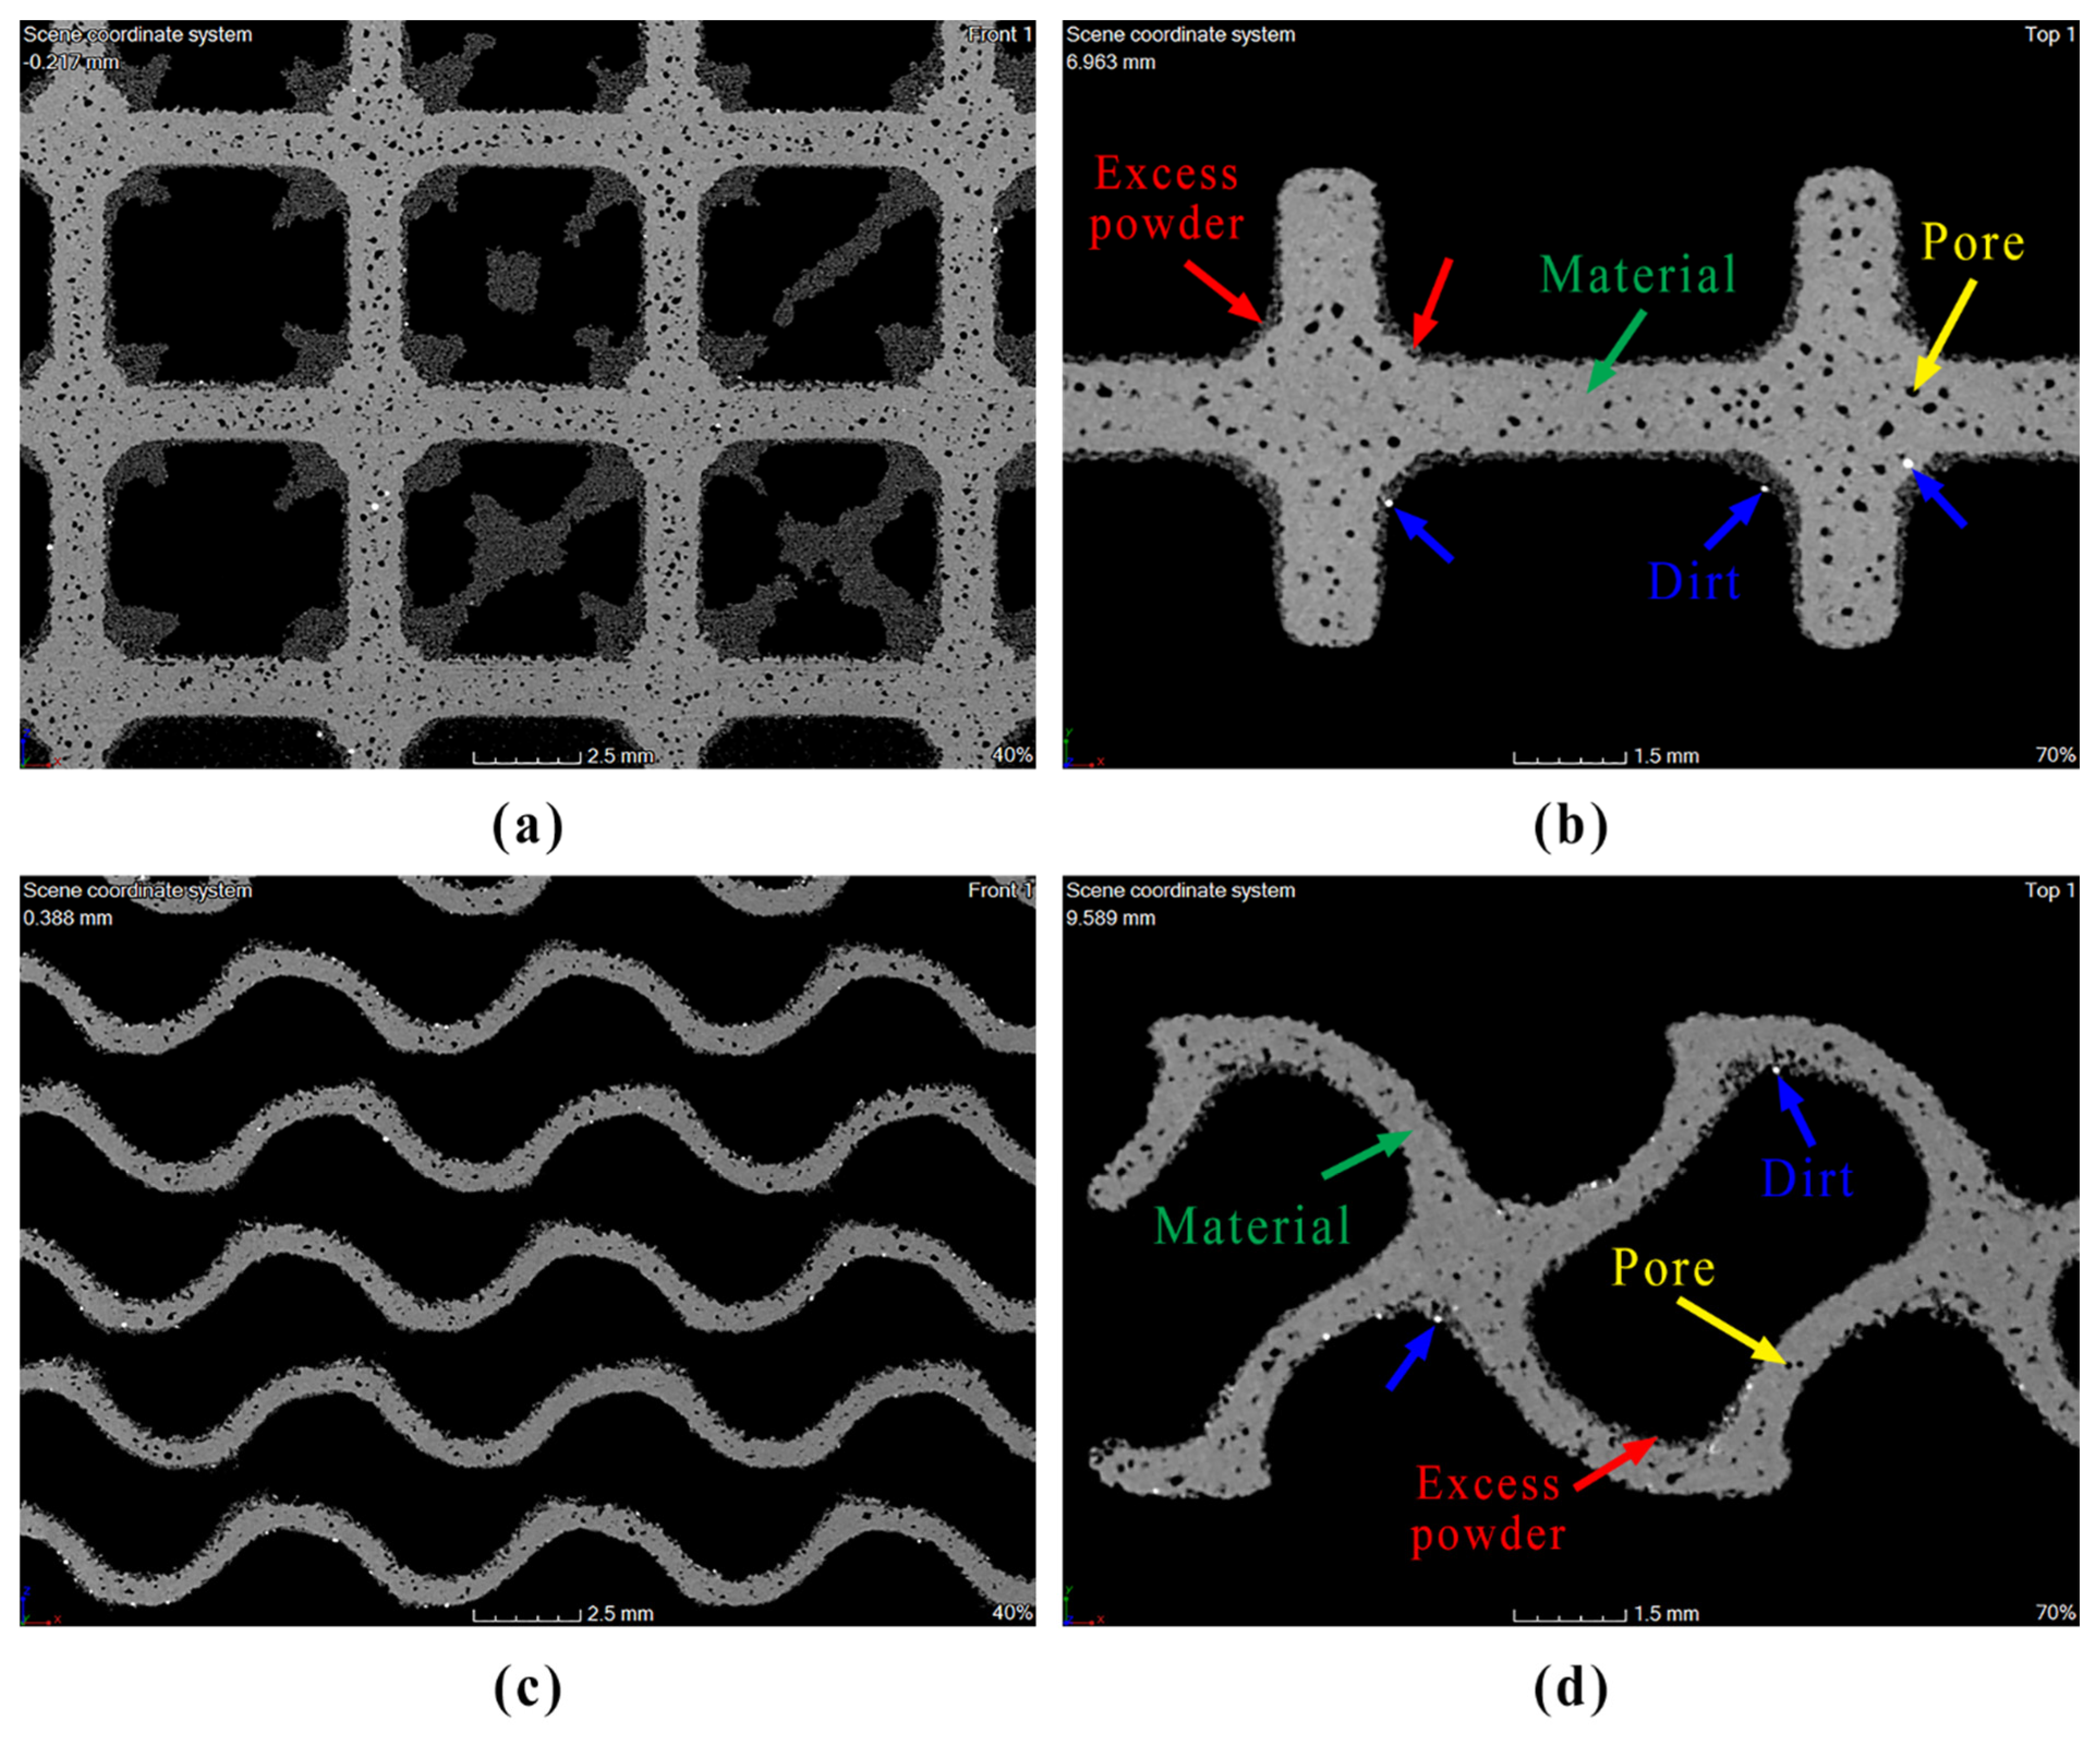
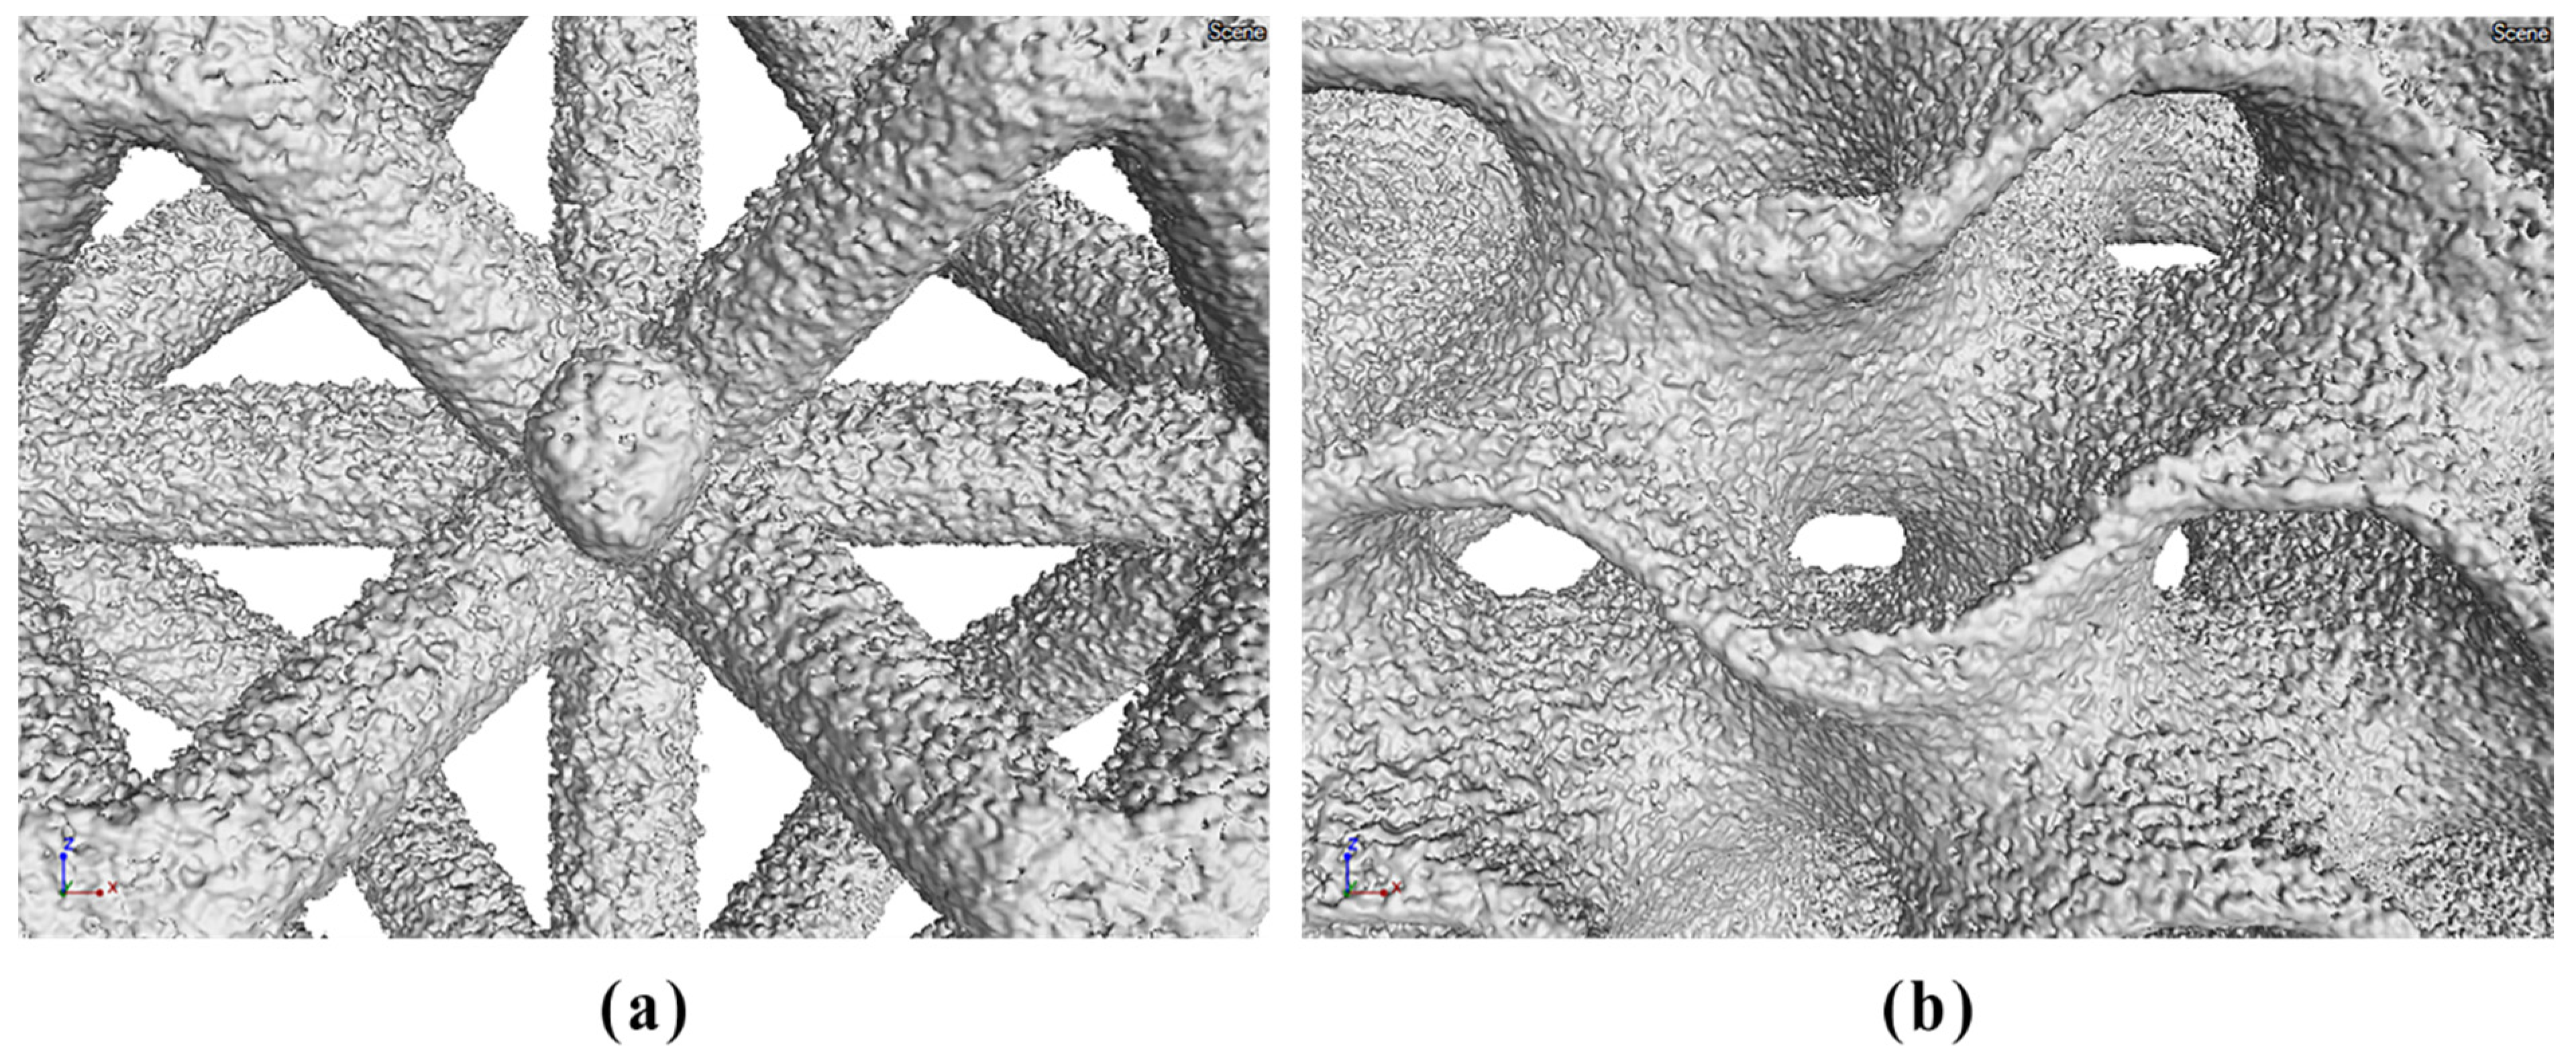
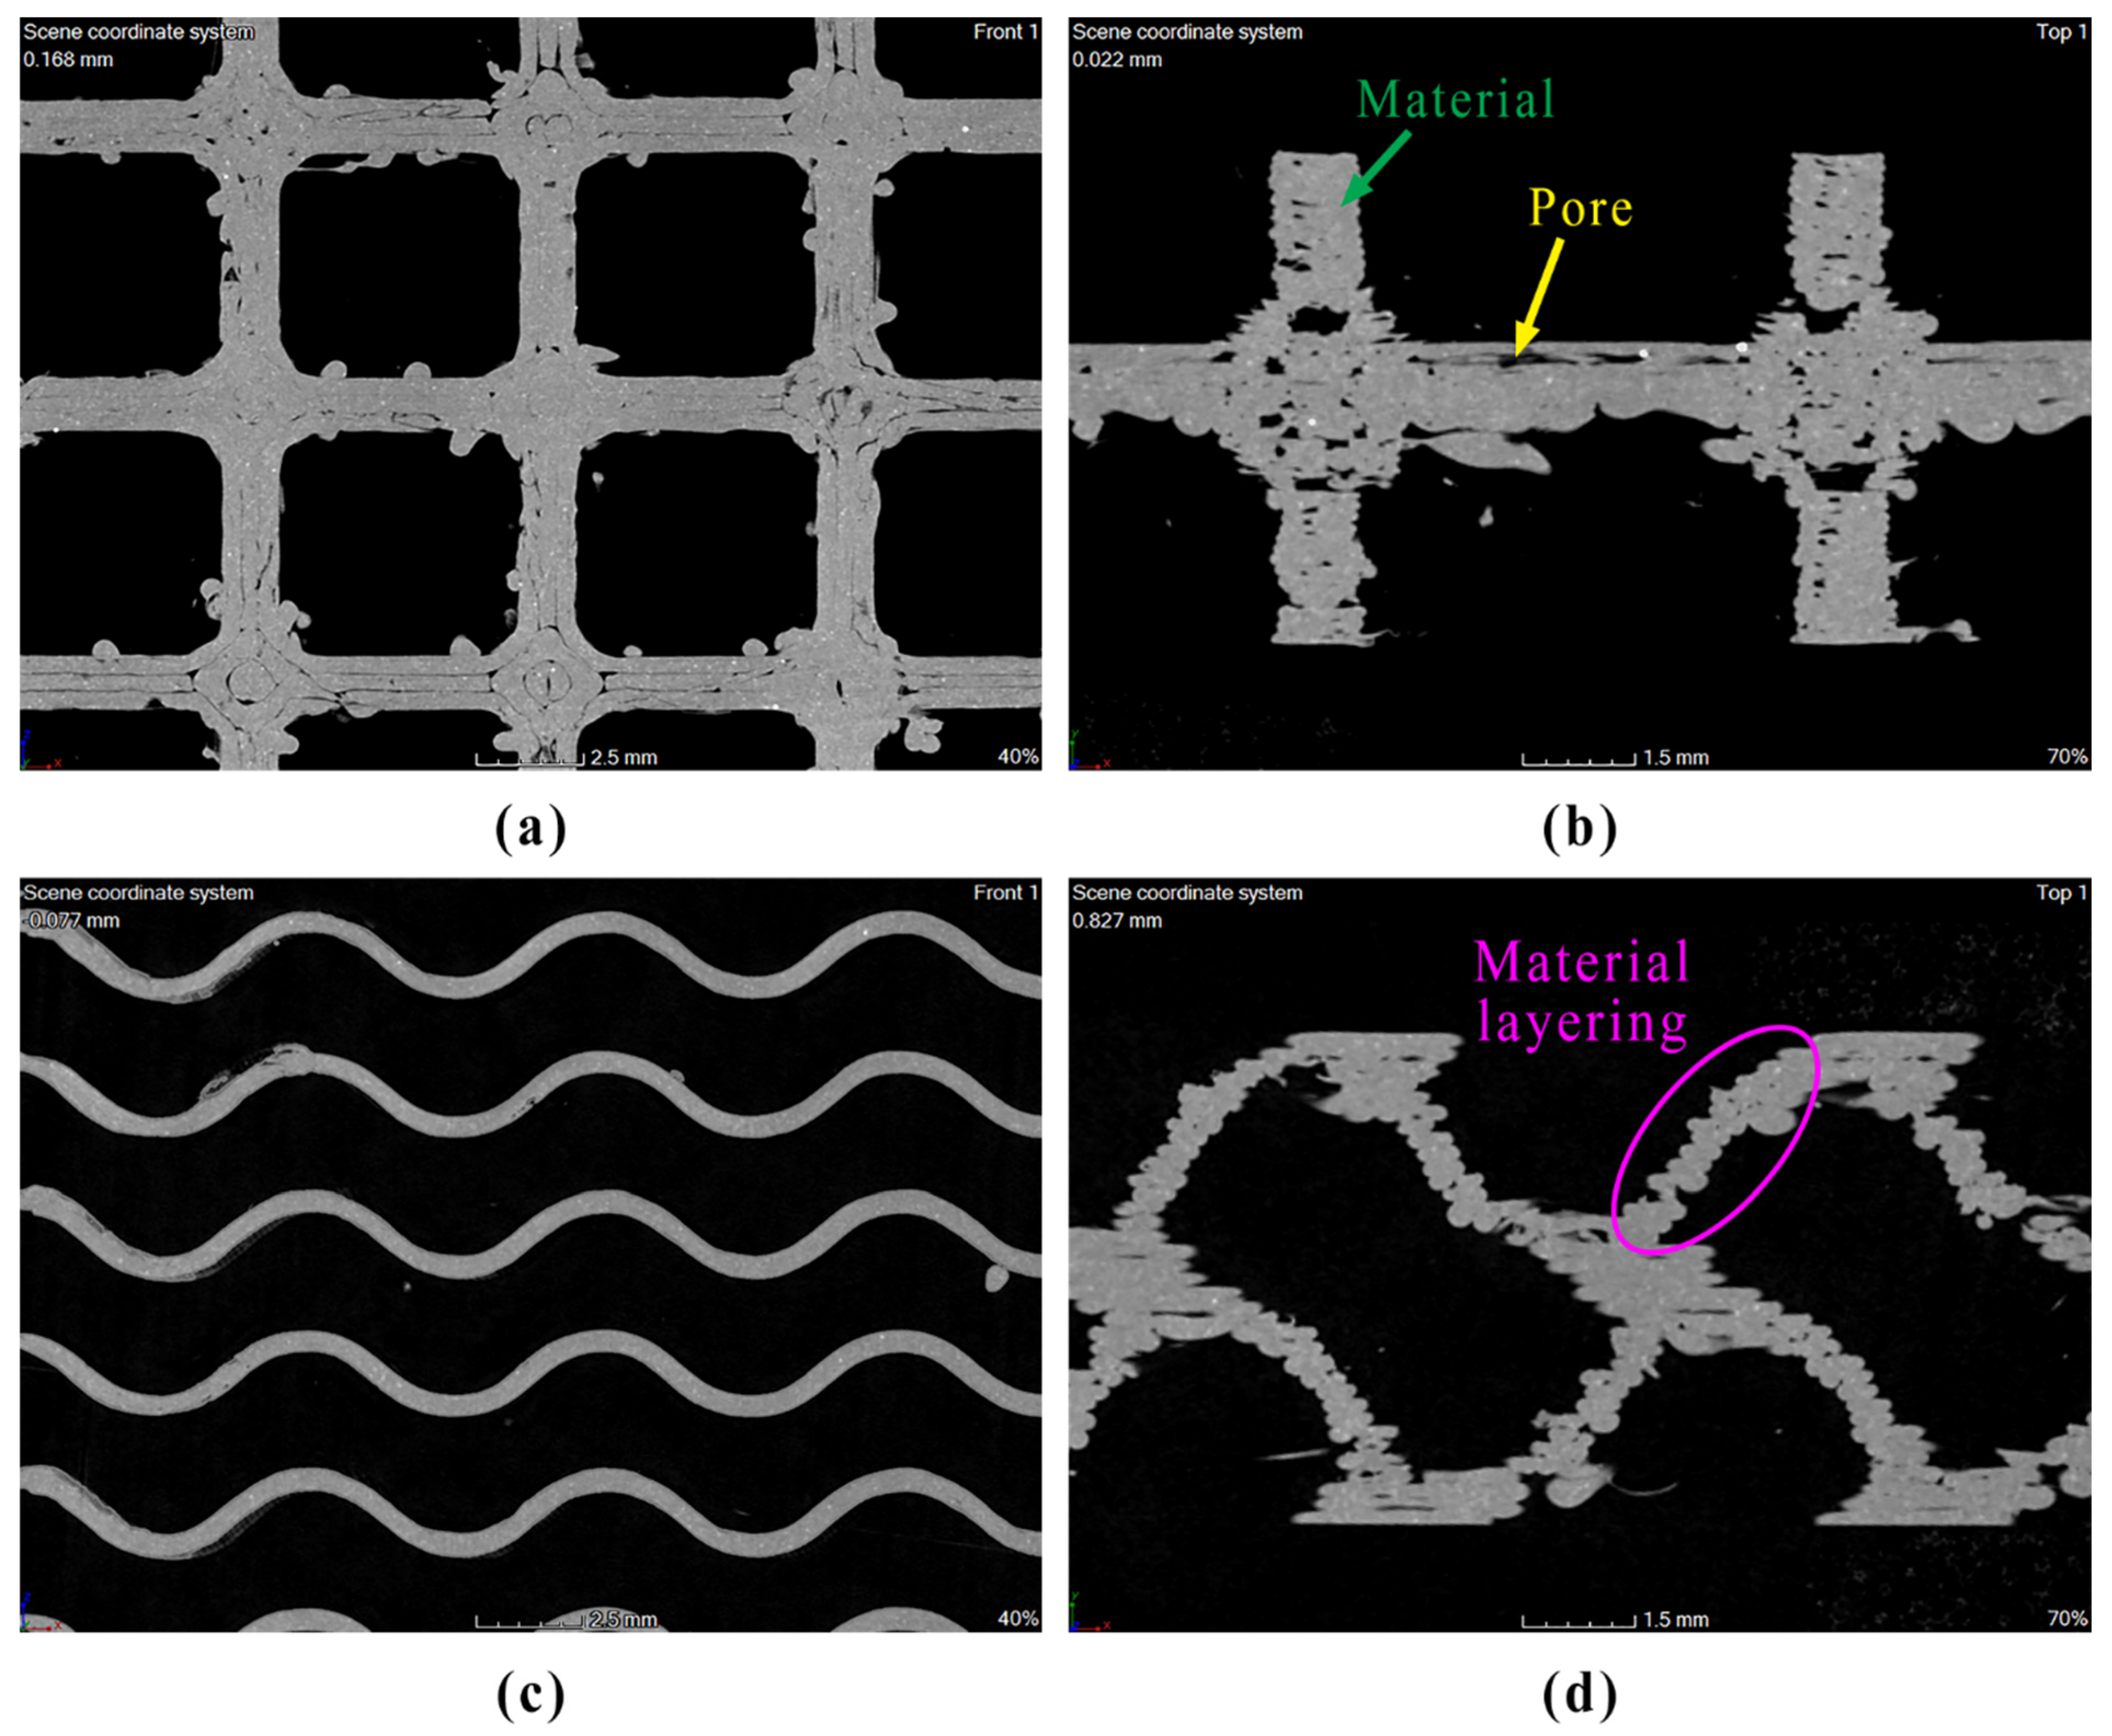
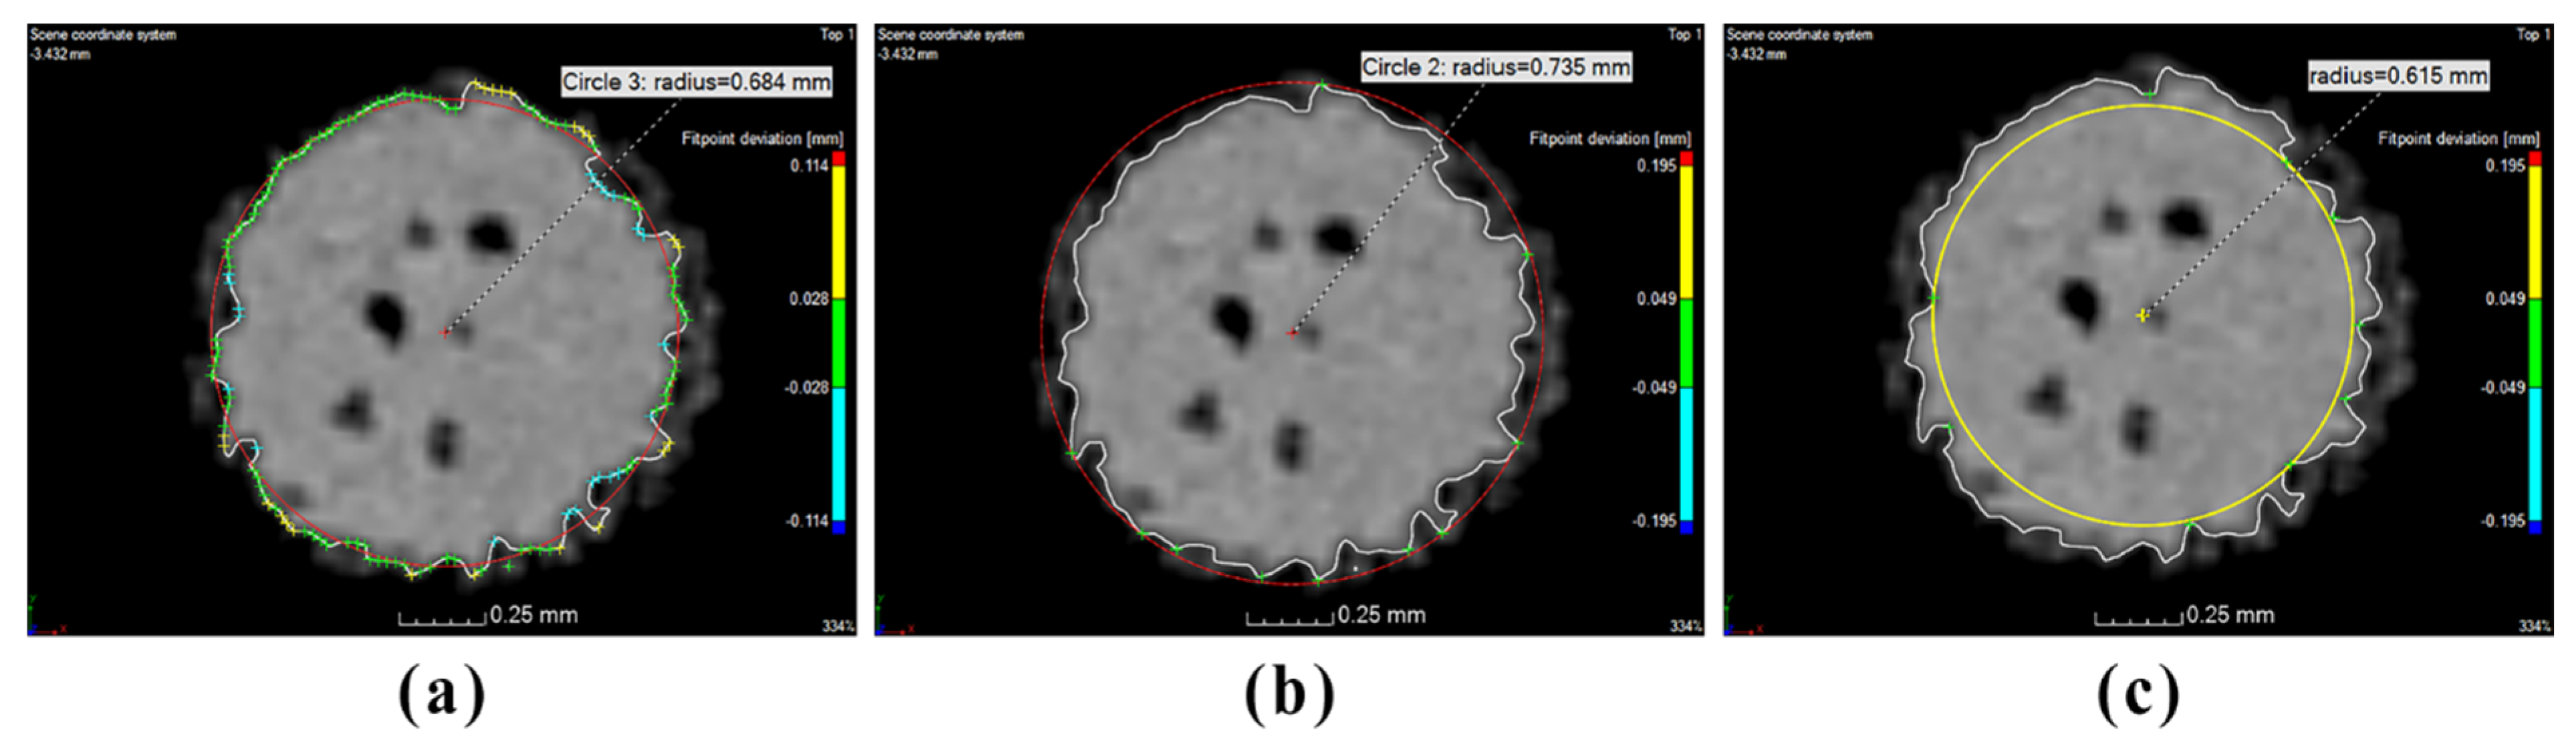
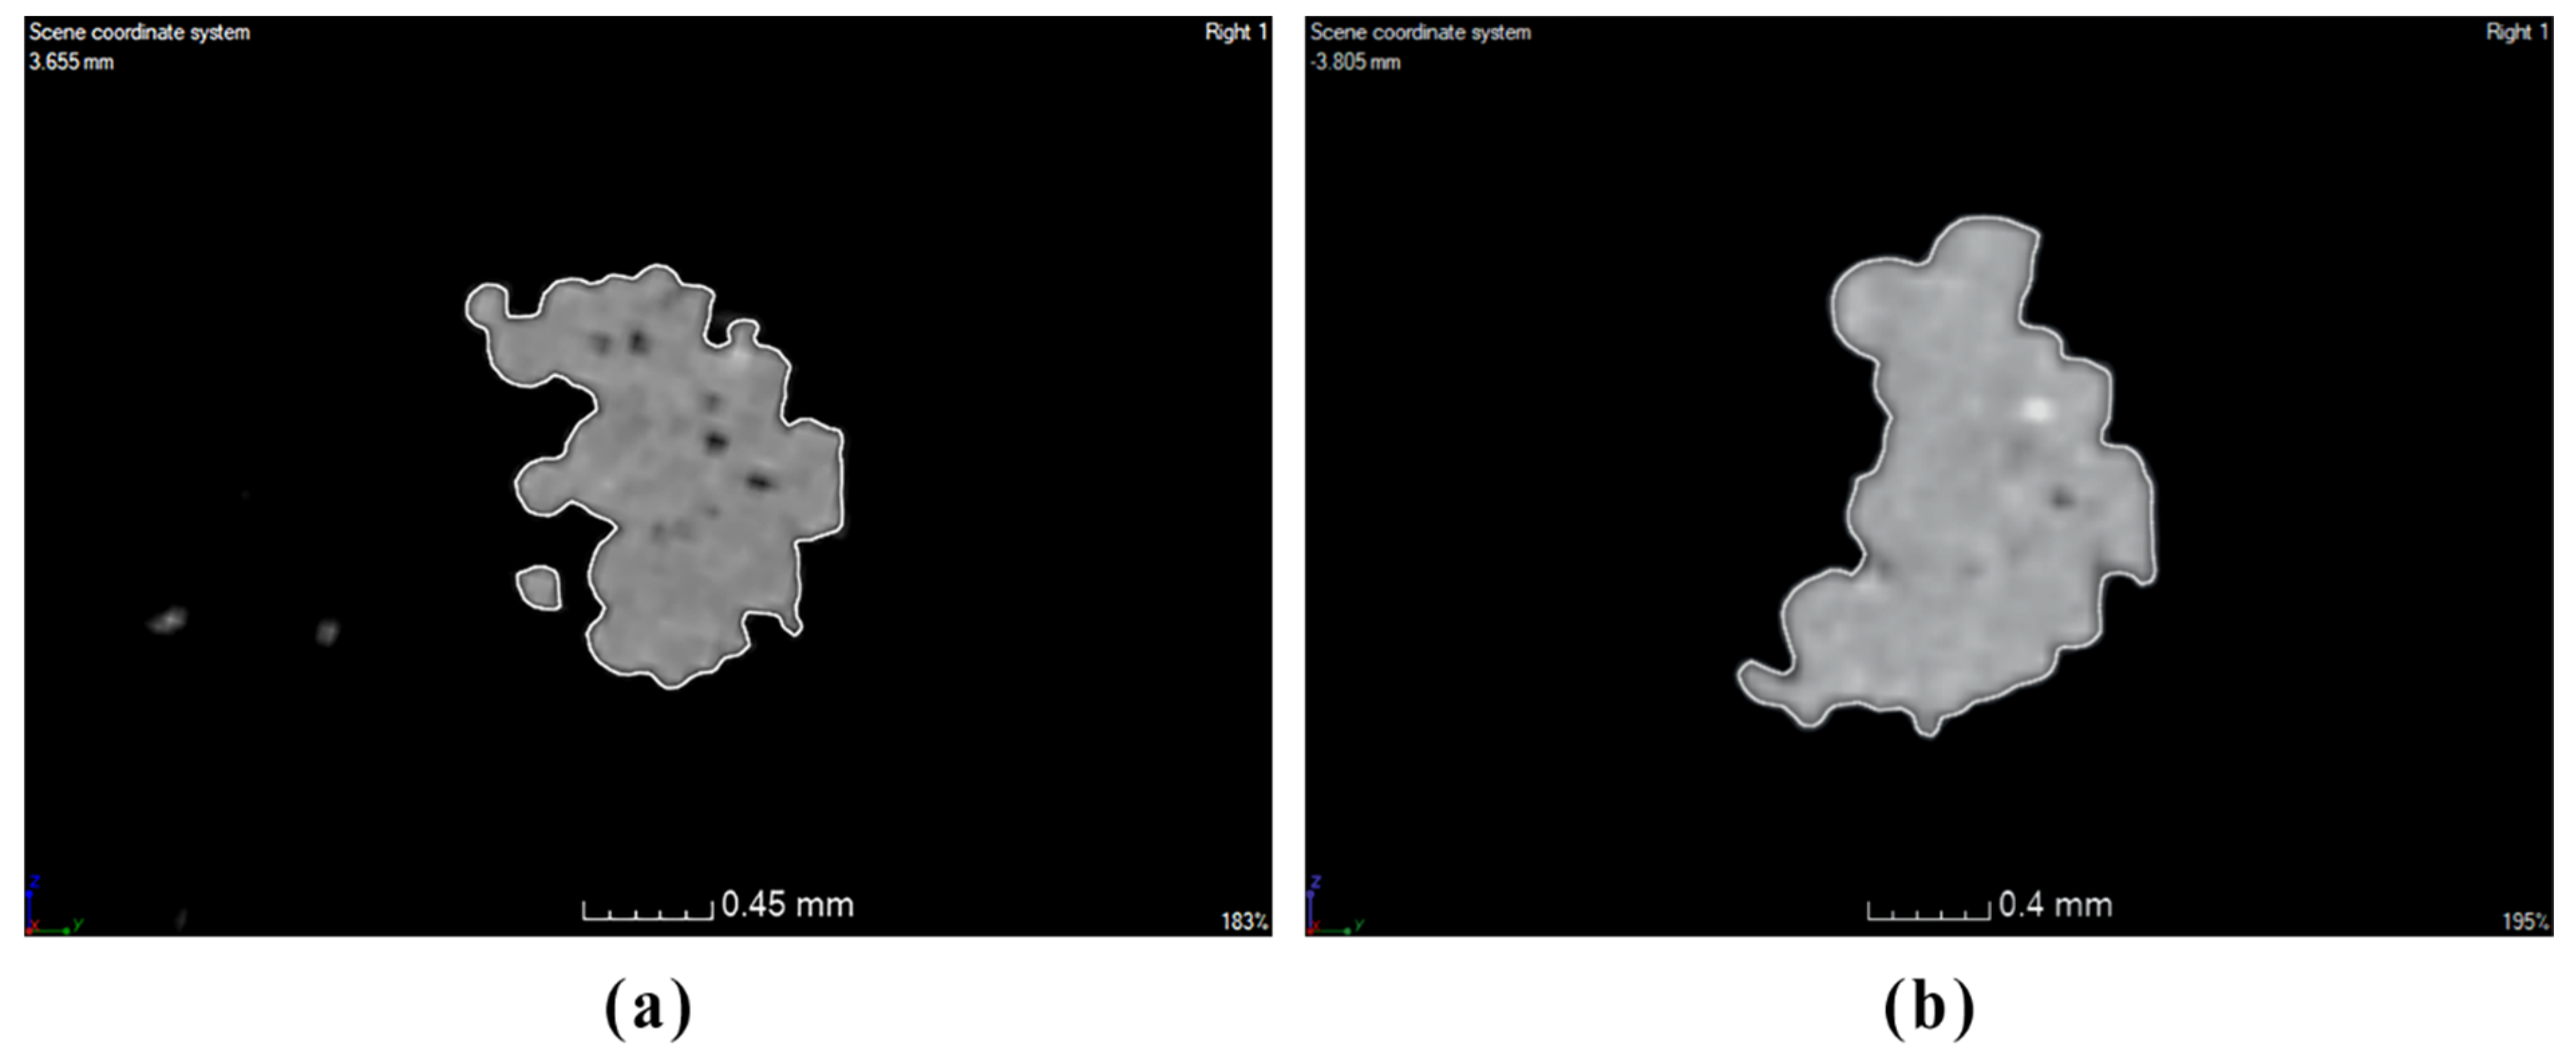
The results of computed tomography allow us to conclude that with SLS technology, care must be taken to remove excess powder, which may not be easy in complex structures. With the specimens manufactured by the FDM technology, the difference in the visual assessment of the printing quality is obvious. Black specimens are visually of better quality than red ones, and they deviate less from the reference values for specimens’ surfaces and the actual and nominal comparison. Red specimens are more accurately manufactured, and their external dimensions deviate less from the reference dimensions. Given the volume of the specimens, it is impossible to unequivocally state which samples are better manufactured; the differences between them are small. The porosity assessment of specimens manufactured by the FDM technology, i.e., the red and black ones, does not provide the desired results, as a significant number of pores emerge on the surface and the “gaps” between the layers cannot be considered as standardized pore shapes; thus, their software assessment is problematic, and the results are only informative. The result cannot be generalized to the entirety of FDM technology manufacturing; it only concerns the specimens tested by us. This is due to the technology, the specimens’ shapes, and the material used. The comparison of SLS and FDM manufacturing implies that SLS specimens yield better results in terms of the material volume, the specimen’s external dimensions, and the nominal and actual comparison to the reference models. The result is worse in the surface assessment, which is caused by the excess powder on the surface. The gray specimens’ porosity is higher than expected, which may be due to the specimens’ thin walls and their overall design. For the above reasons, the porosity results of SLS and FDM manufacturing cannot be compared. We observe a discrepancy between the visual specimens’ assessment and the measurement of roughness. With the FDM technology, in red and black specimens, we obtain contrasting results. Visually, the black specimen is better than the red one, but its porosity indicates the opposite. When comparing the printing of Flexfill 92A specimens, the result obviously depends on several parameters, such as the specific printer, the product’s design, and, finally, the operator’s experience, with a significant impact on manufacturing.
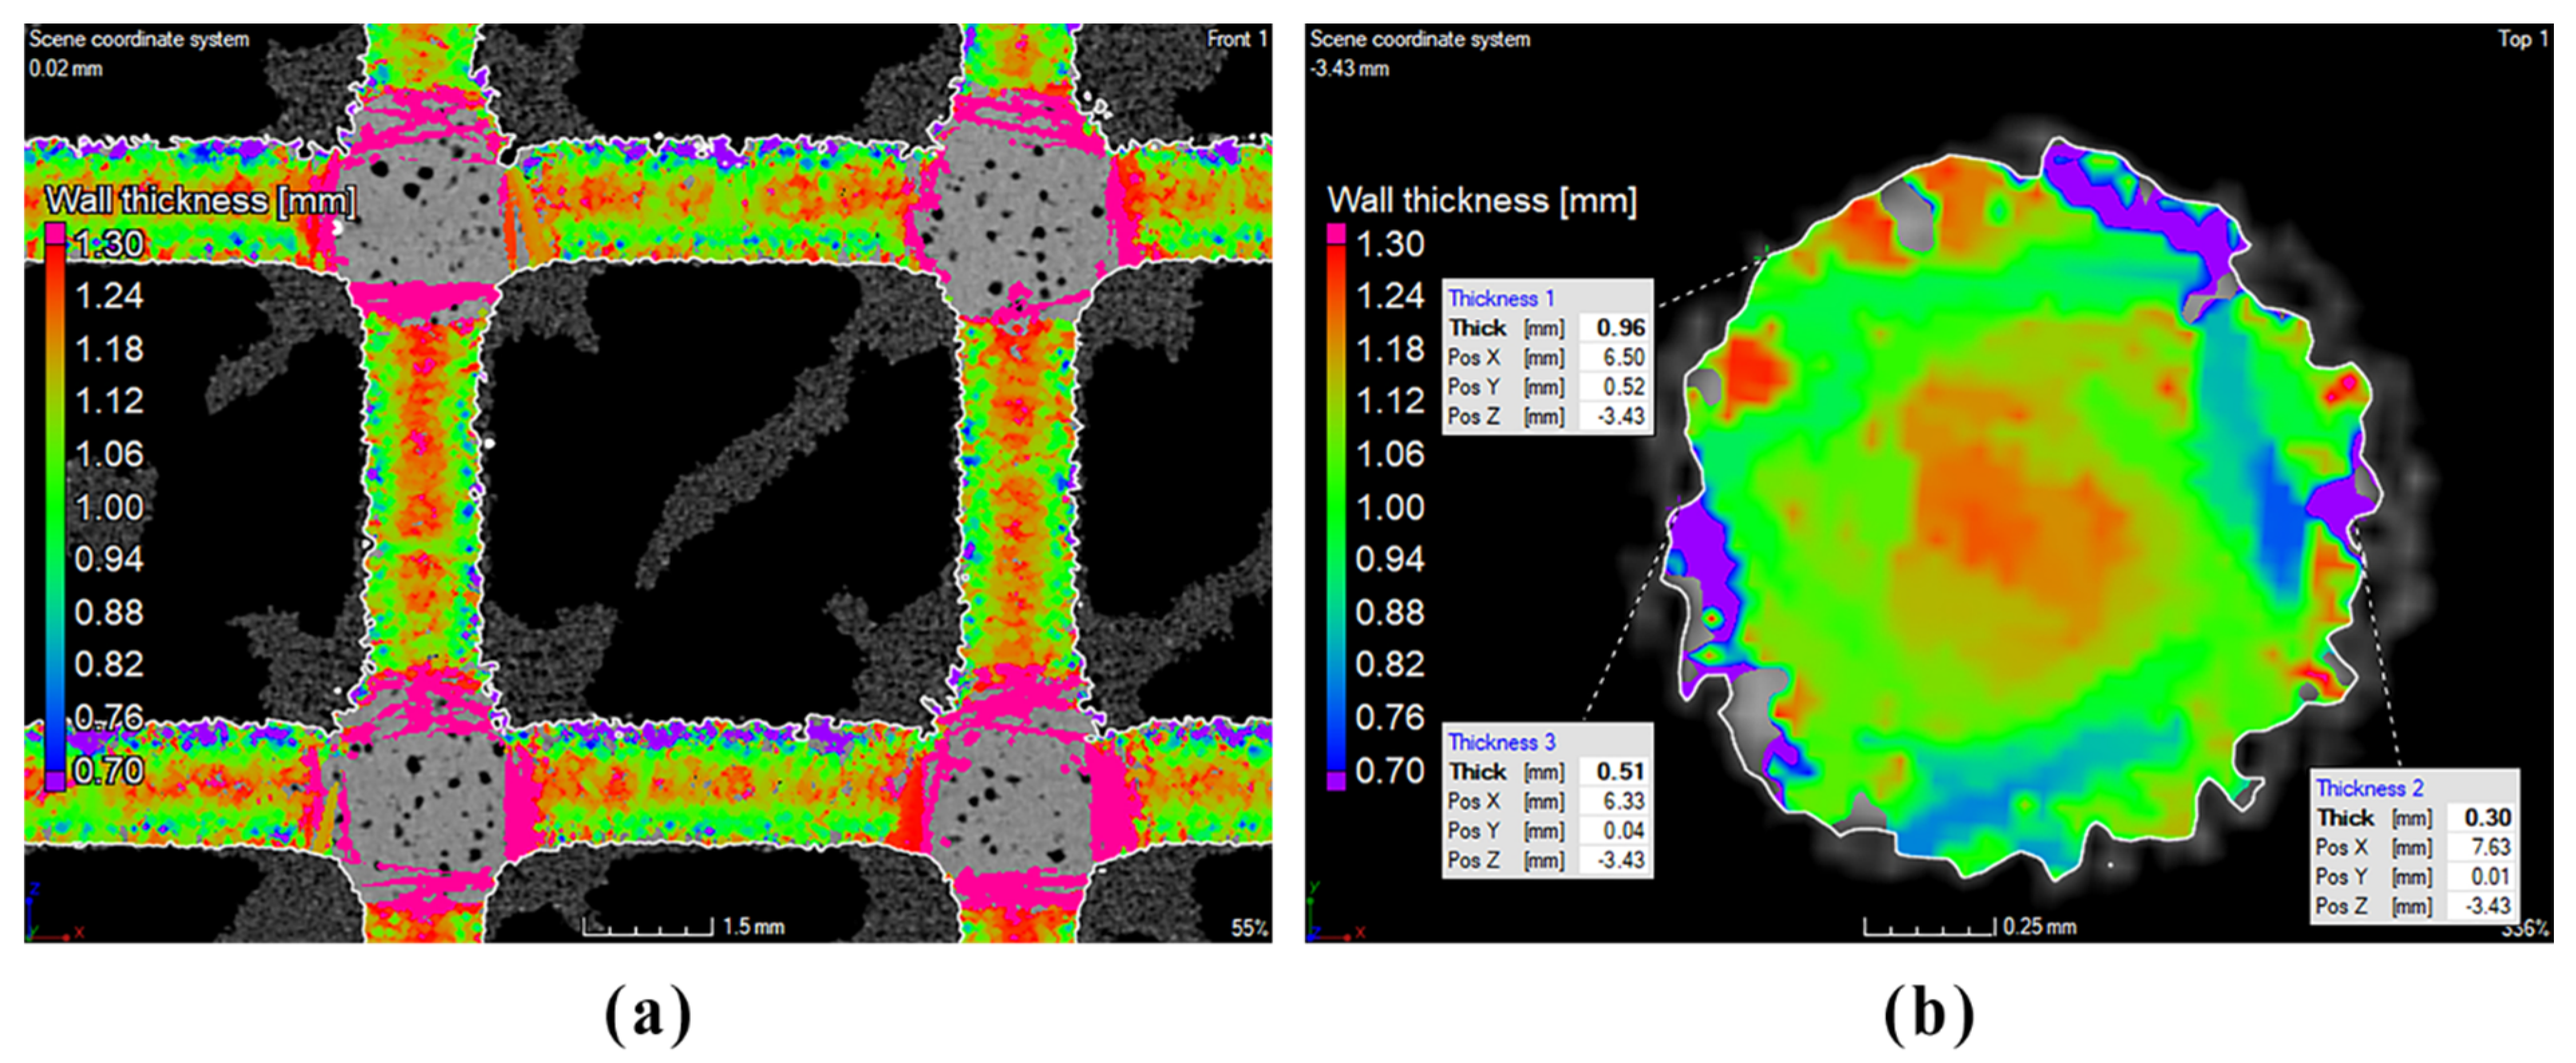
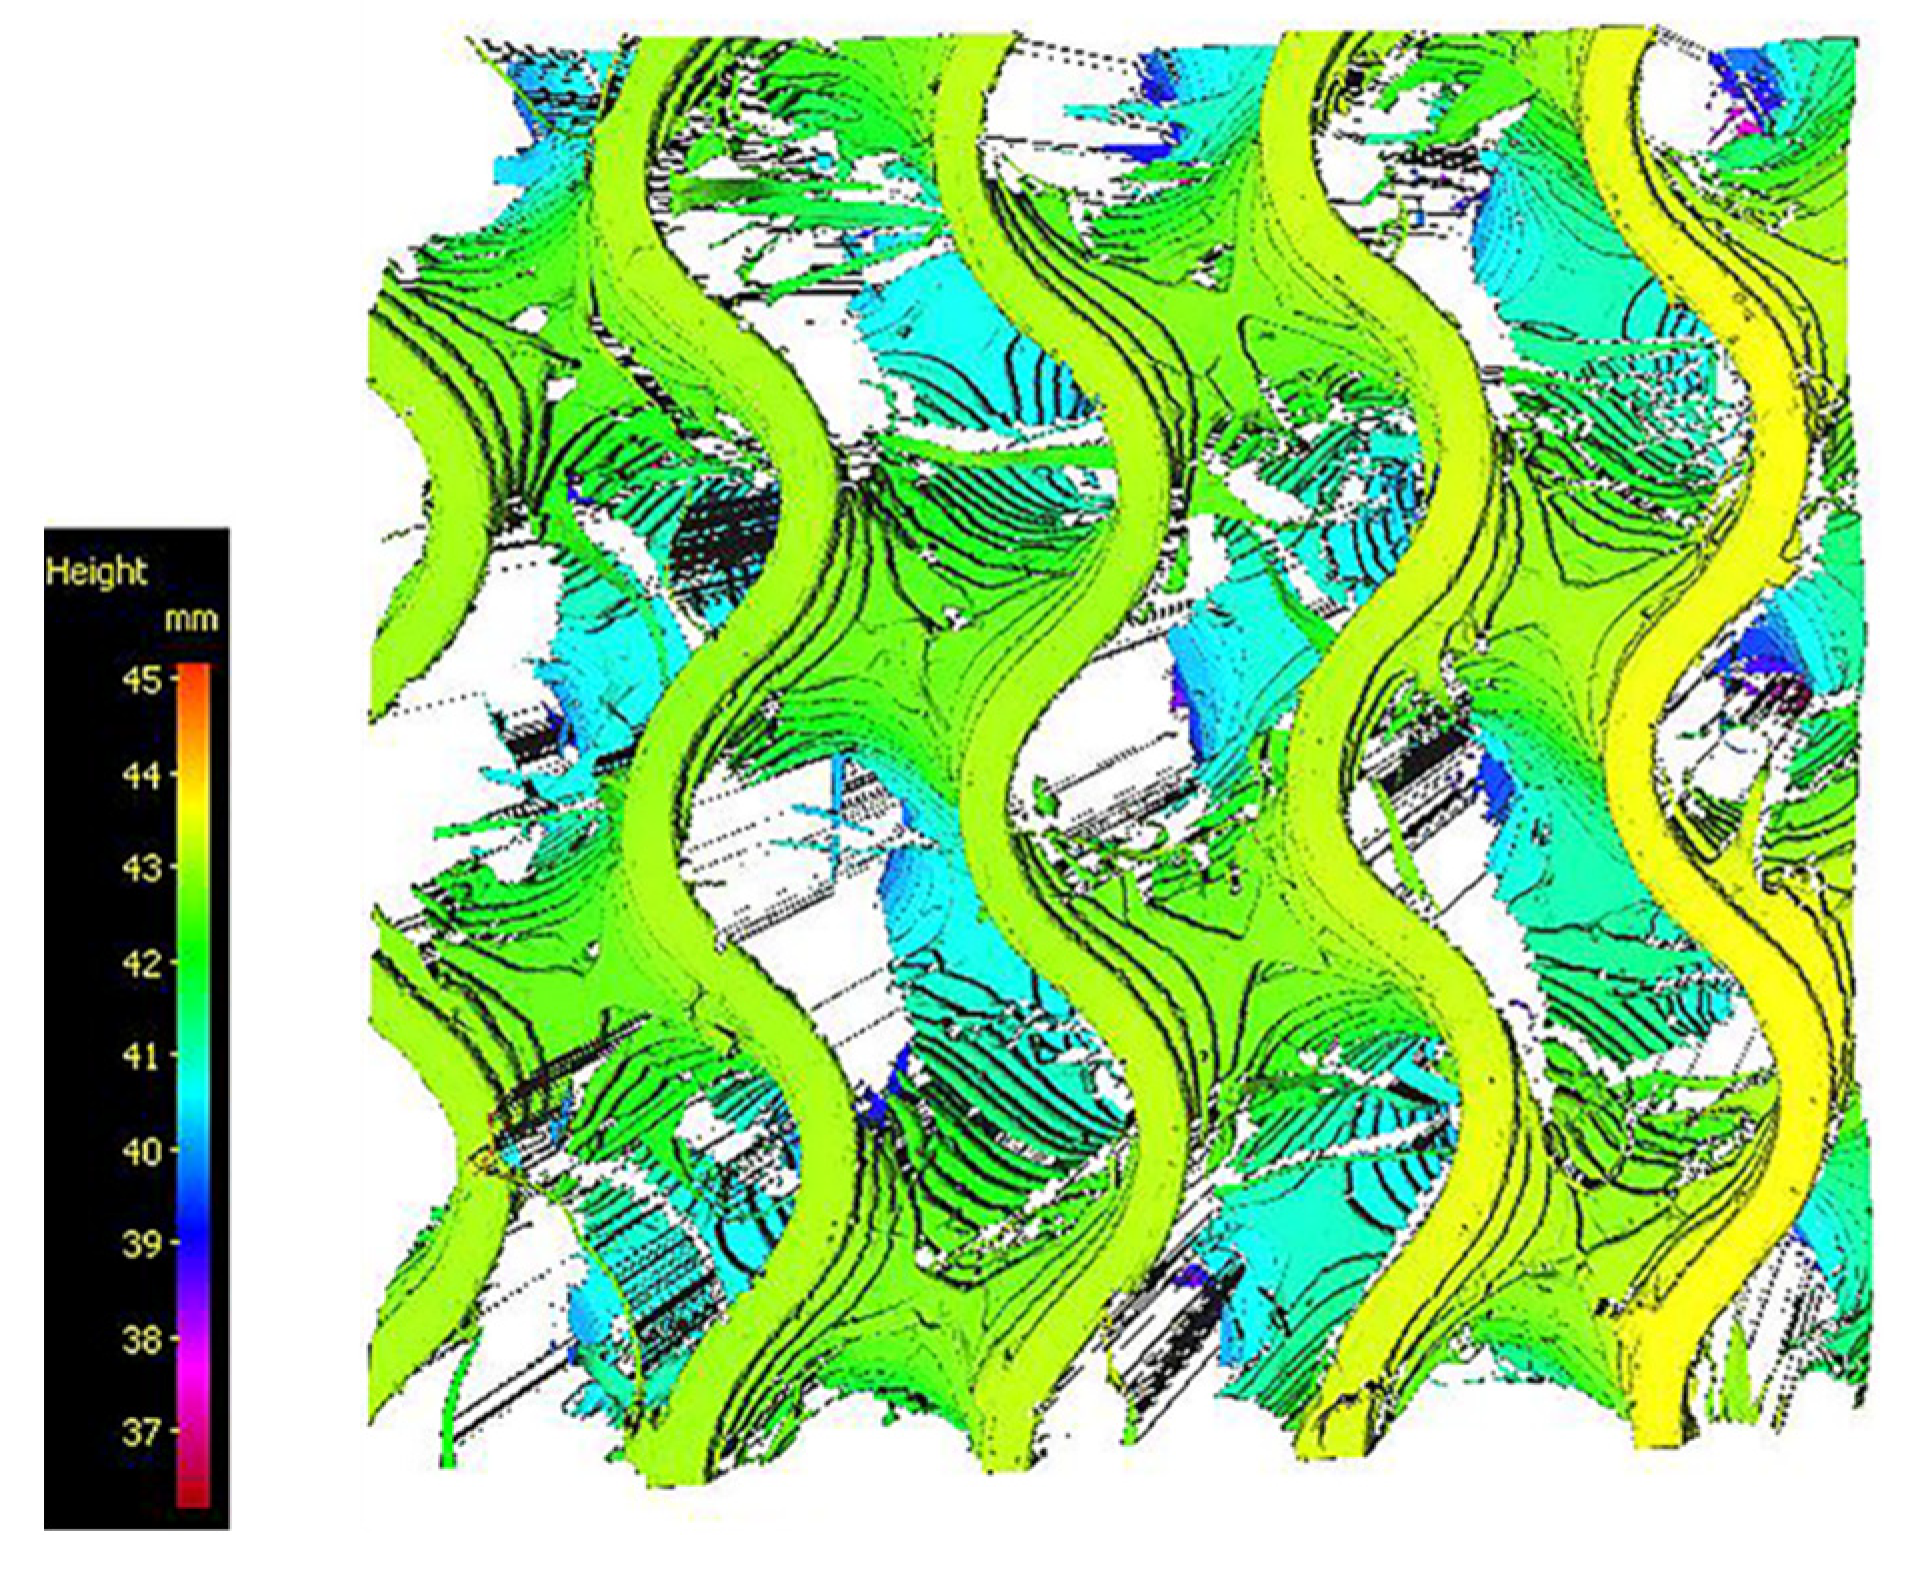
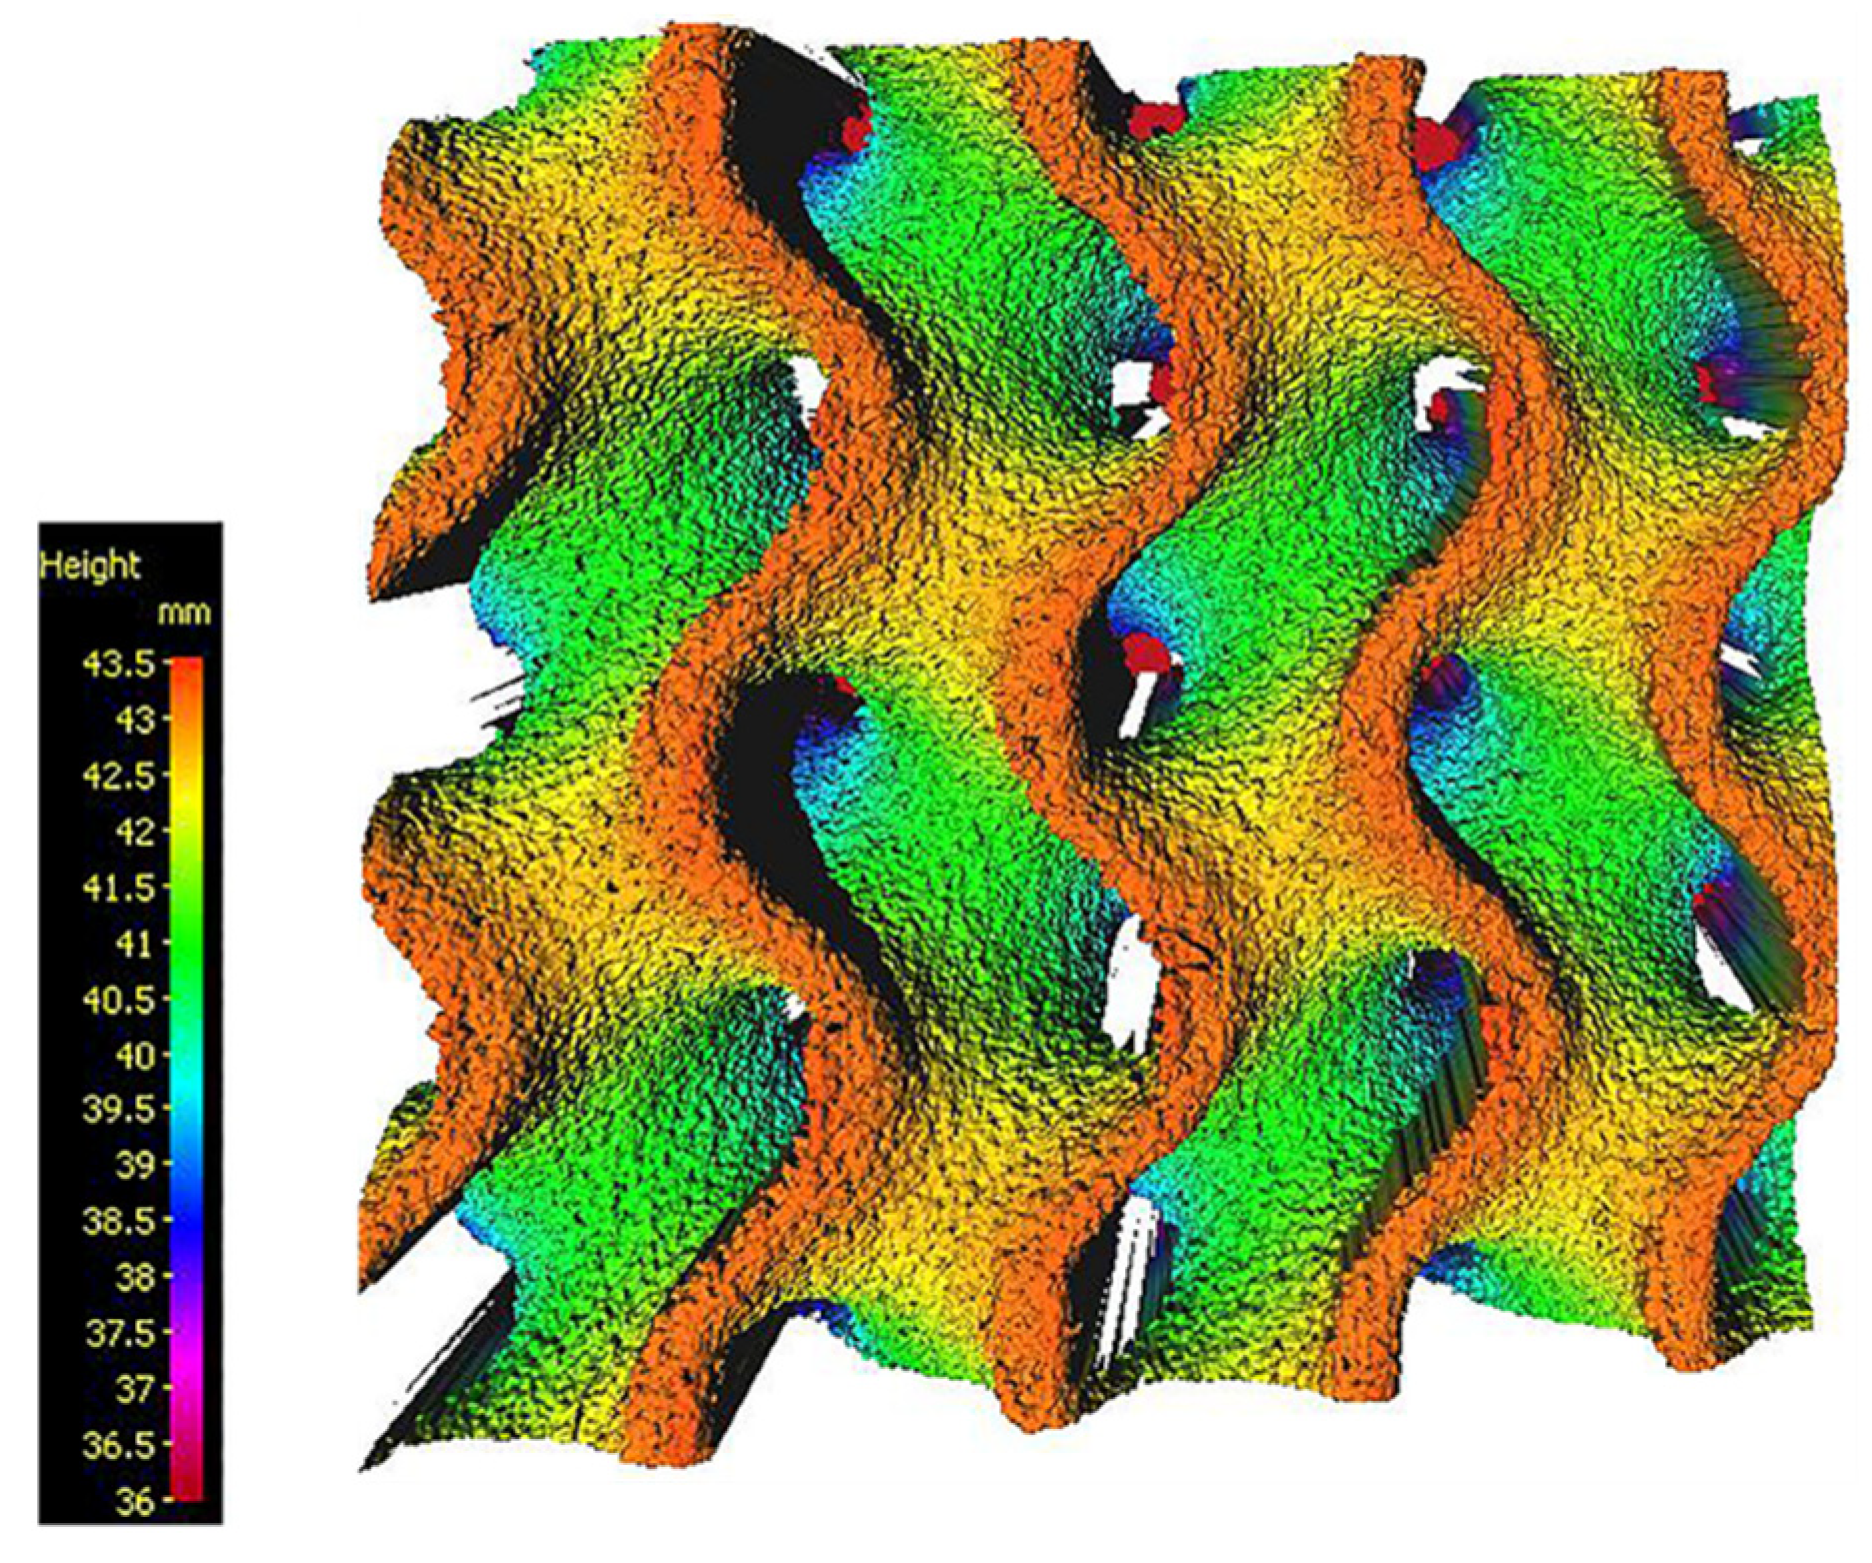
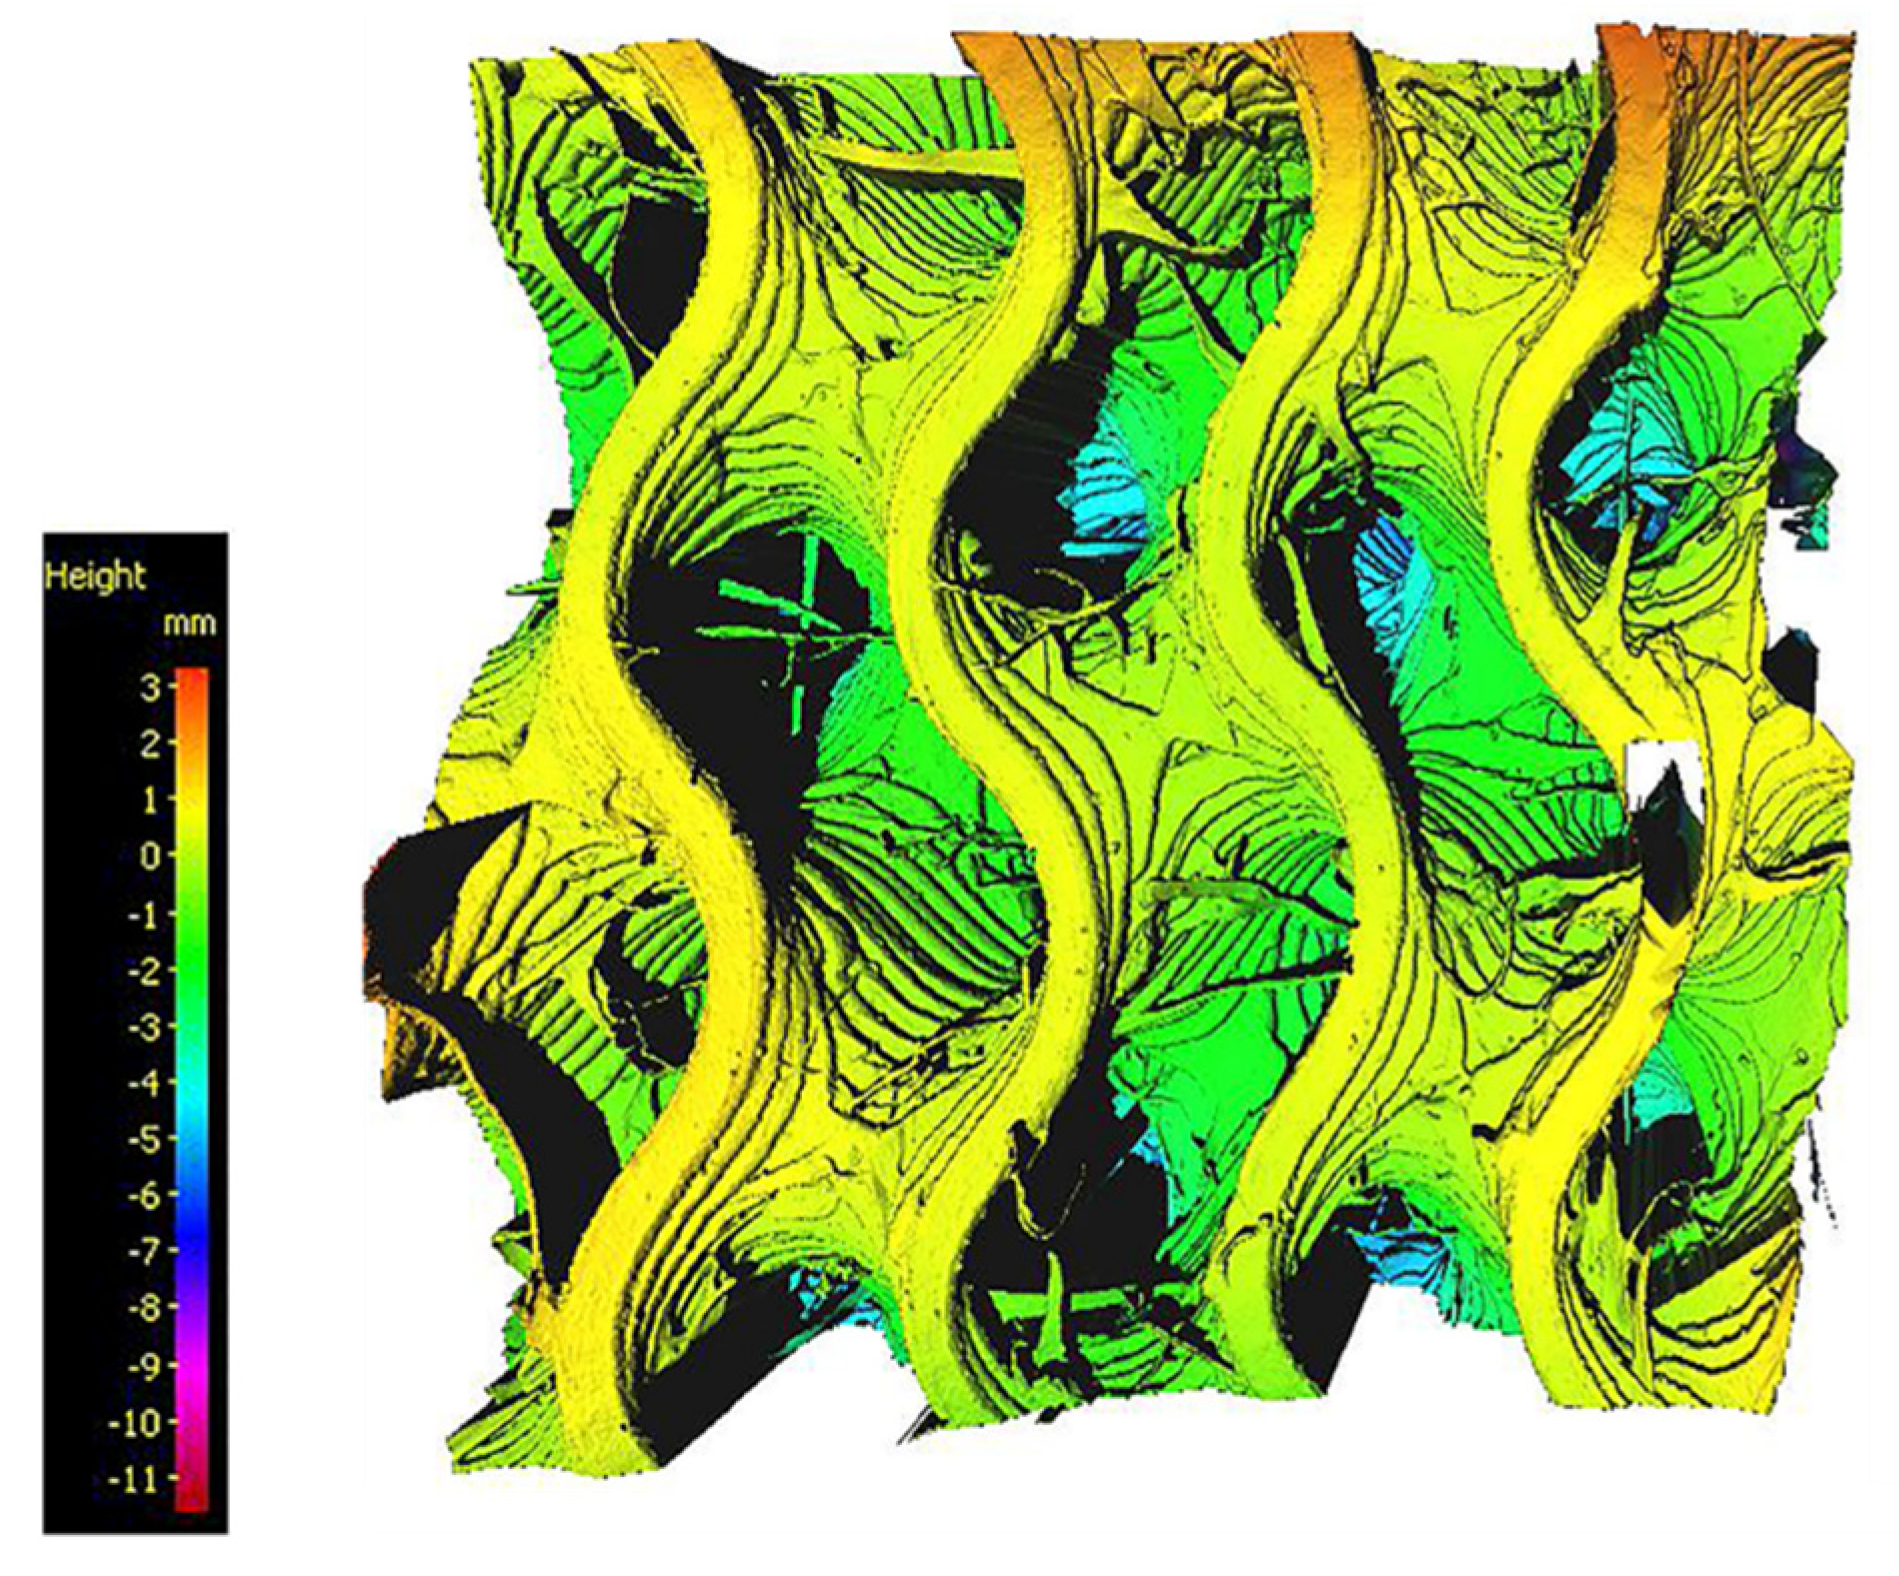
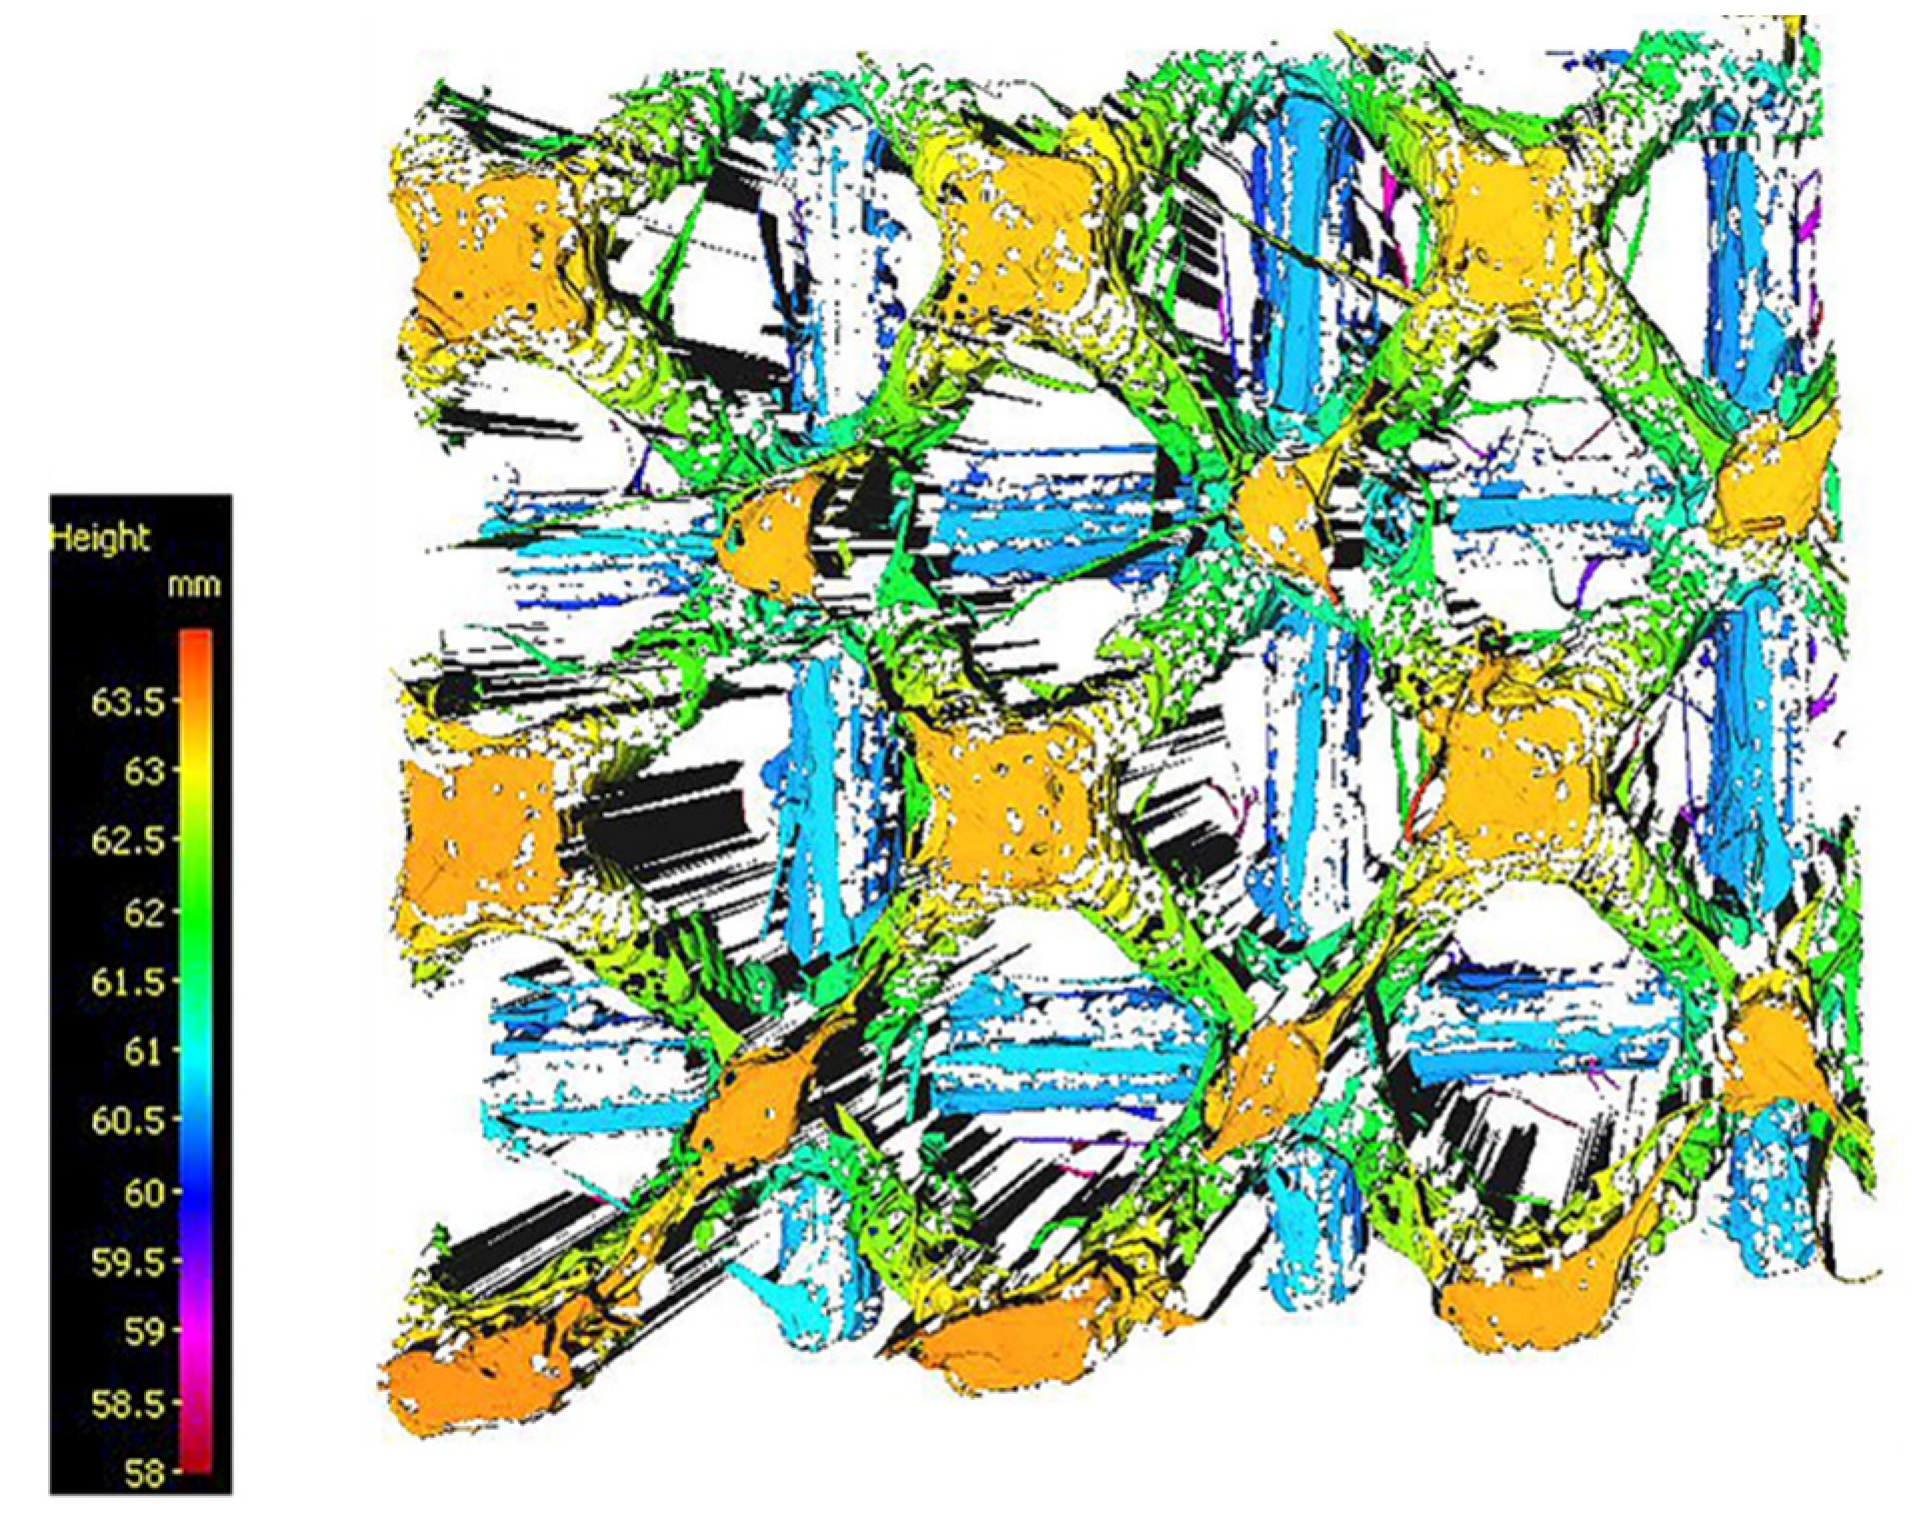
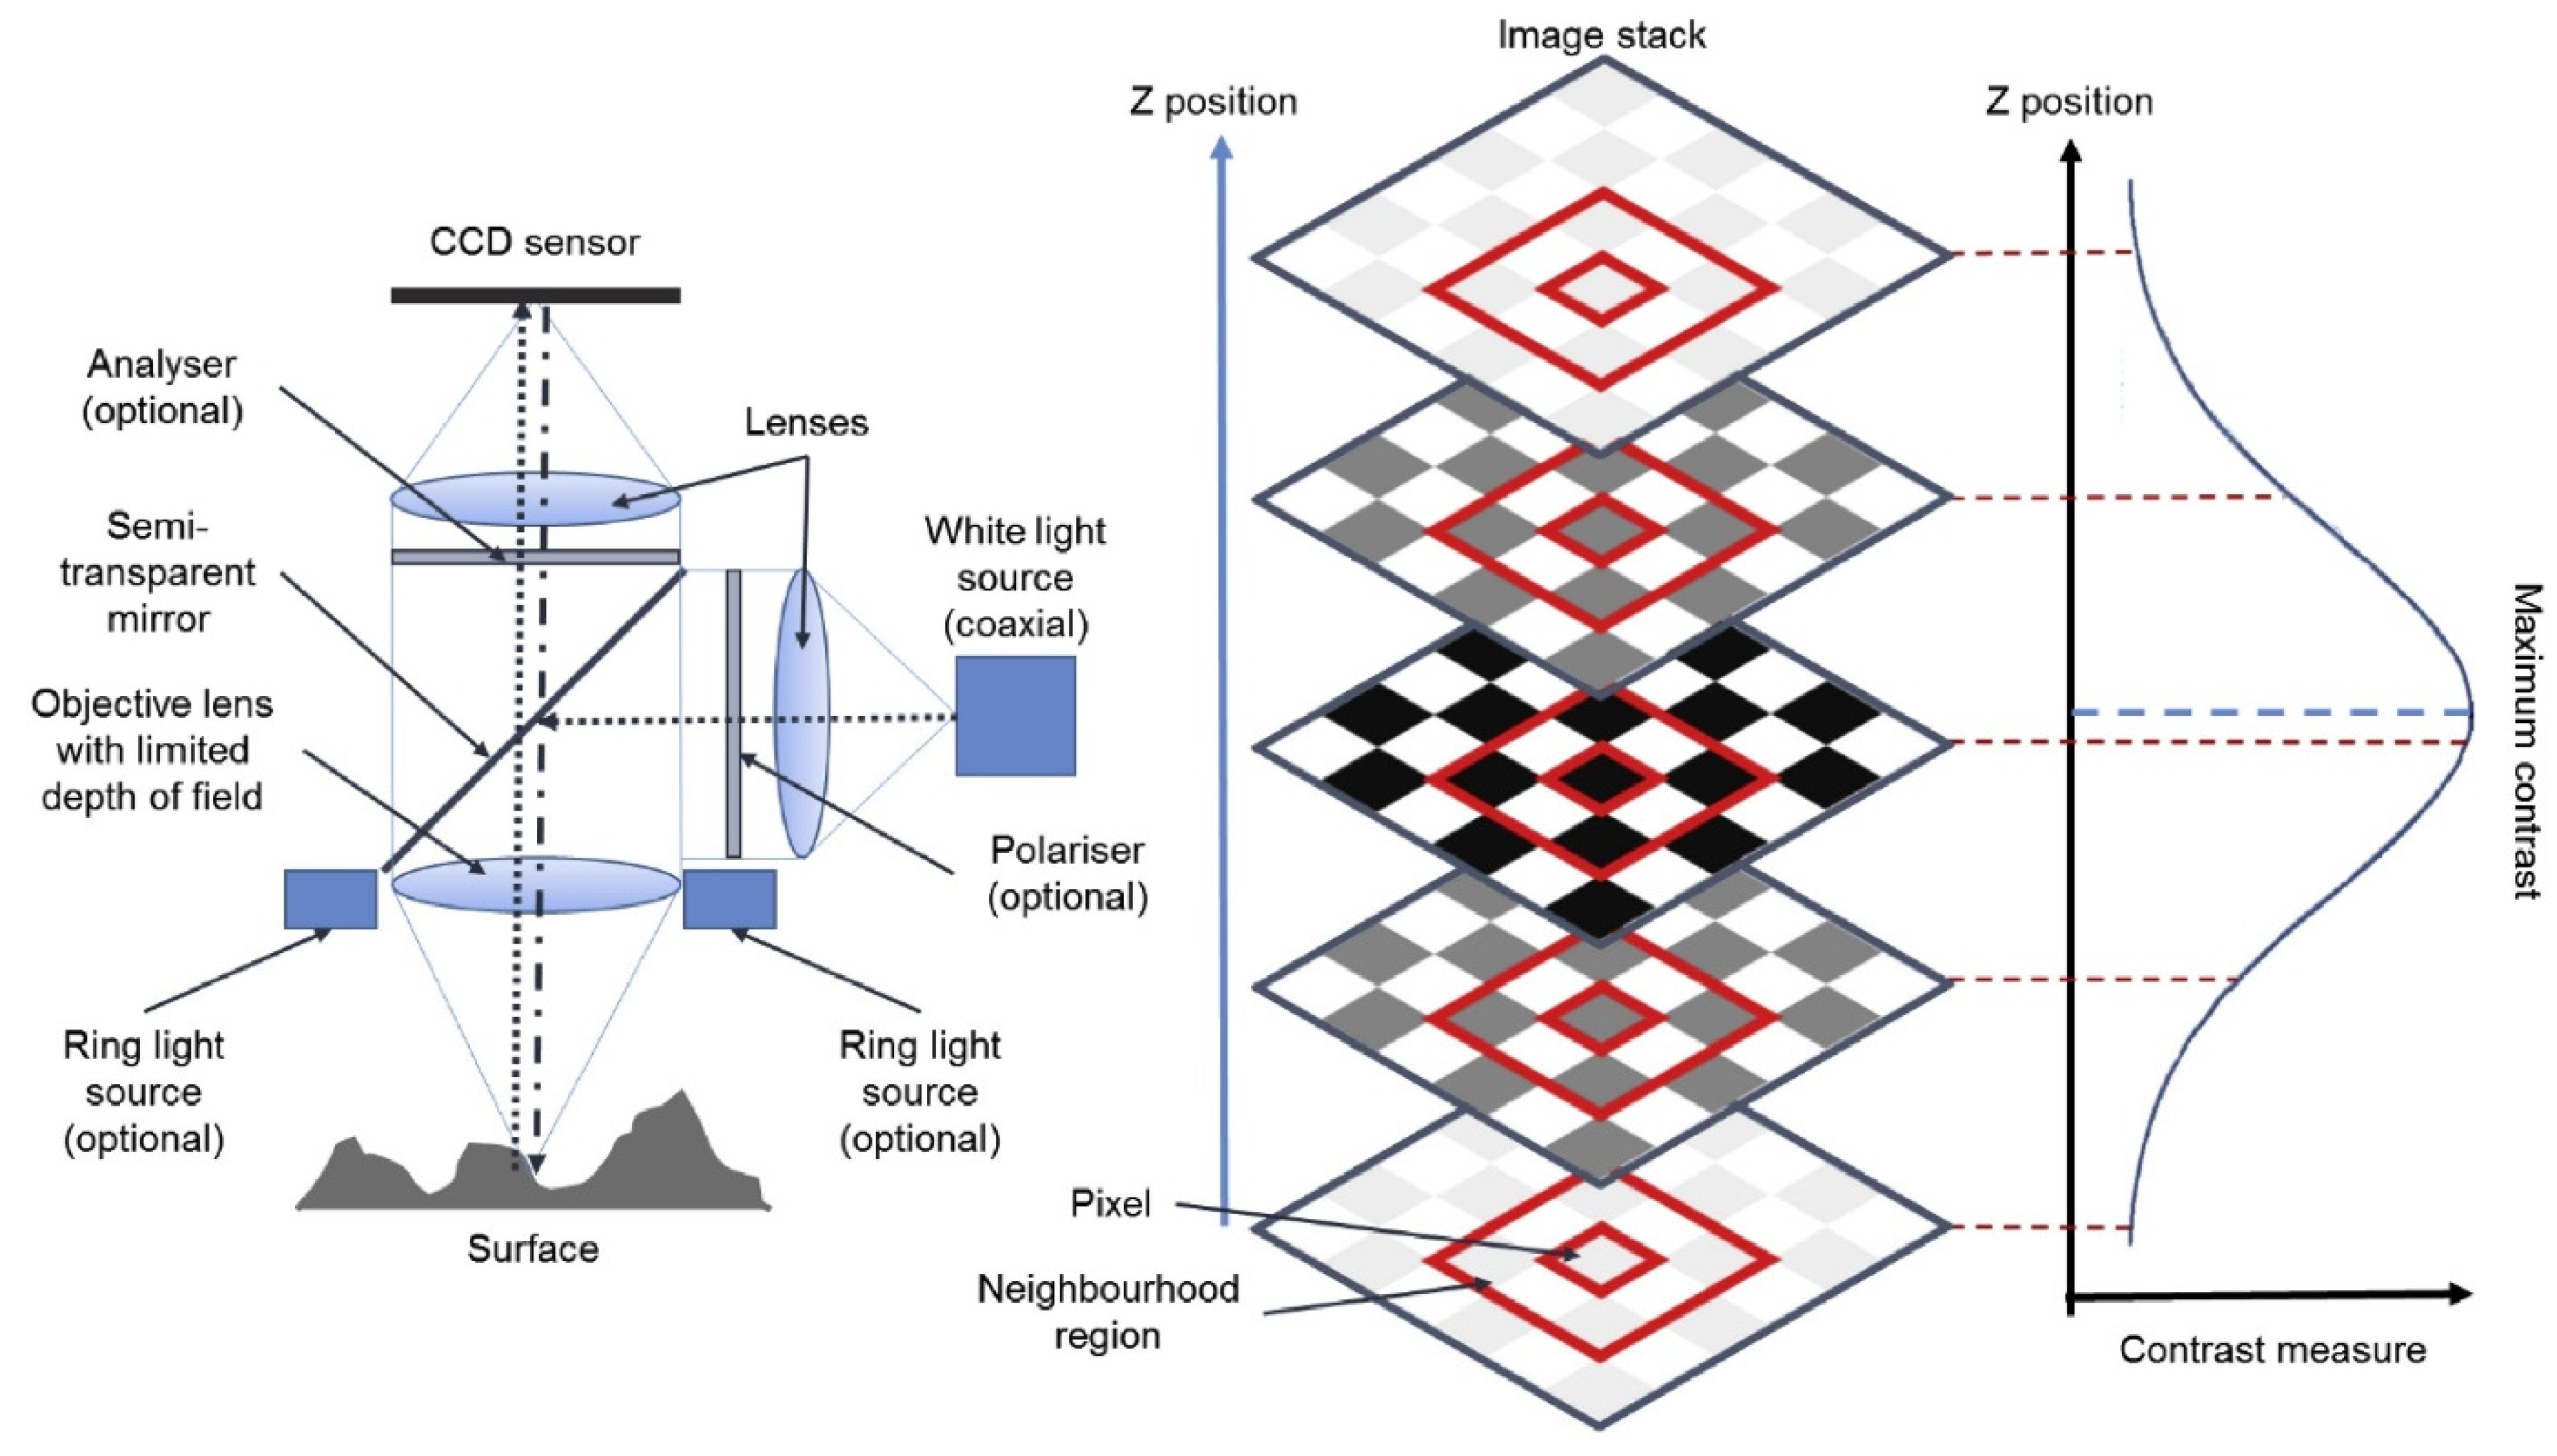
Roughness measurement with an optical microscope, based on the principle of image layering, is the most suitable method by which to analyze the experimental specimens’ surface structure. The color material differentiation is a disadvantage in terms of reflection for the red Flexfill 92A material, and despite the use of various options for the exposure time and brightness, the lattice structure could not be scanned. Other factors leading to the poor-quality scan were the effect of the surface color, the material roughness, the geometry of the structures, and ambient light. Regarding the creation of individual images of models to compare, the lattice structure was more complex due to its geometry. In the FDM technology-manufactured specimens, the lattice structure showed a roughness value of Rz = 316 µm, which was 2.5 times greater than in the second gyroid structure, where the values were around 137 µm. The specimens produced by the SLS method had parameters of Ra = 20 µm and Rz = 166 µm for the lattice structure. Smaller values of the height profile parameter Rz were noted in specimens manufactured with the use of the FDM method (for the case of the red gyroid specimen, see Table 8).
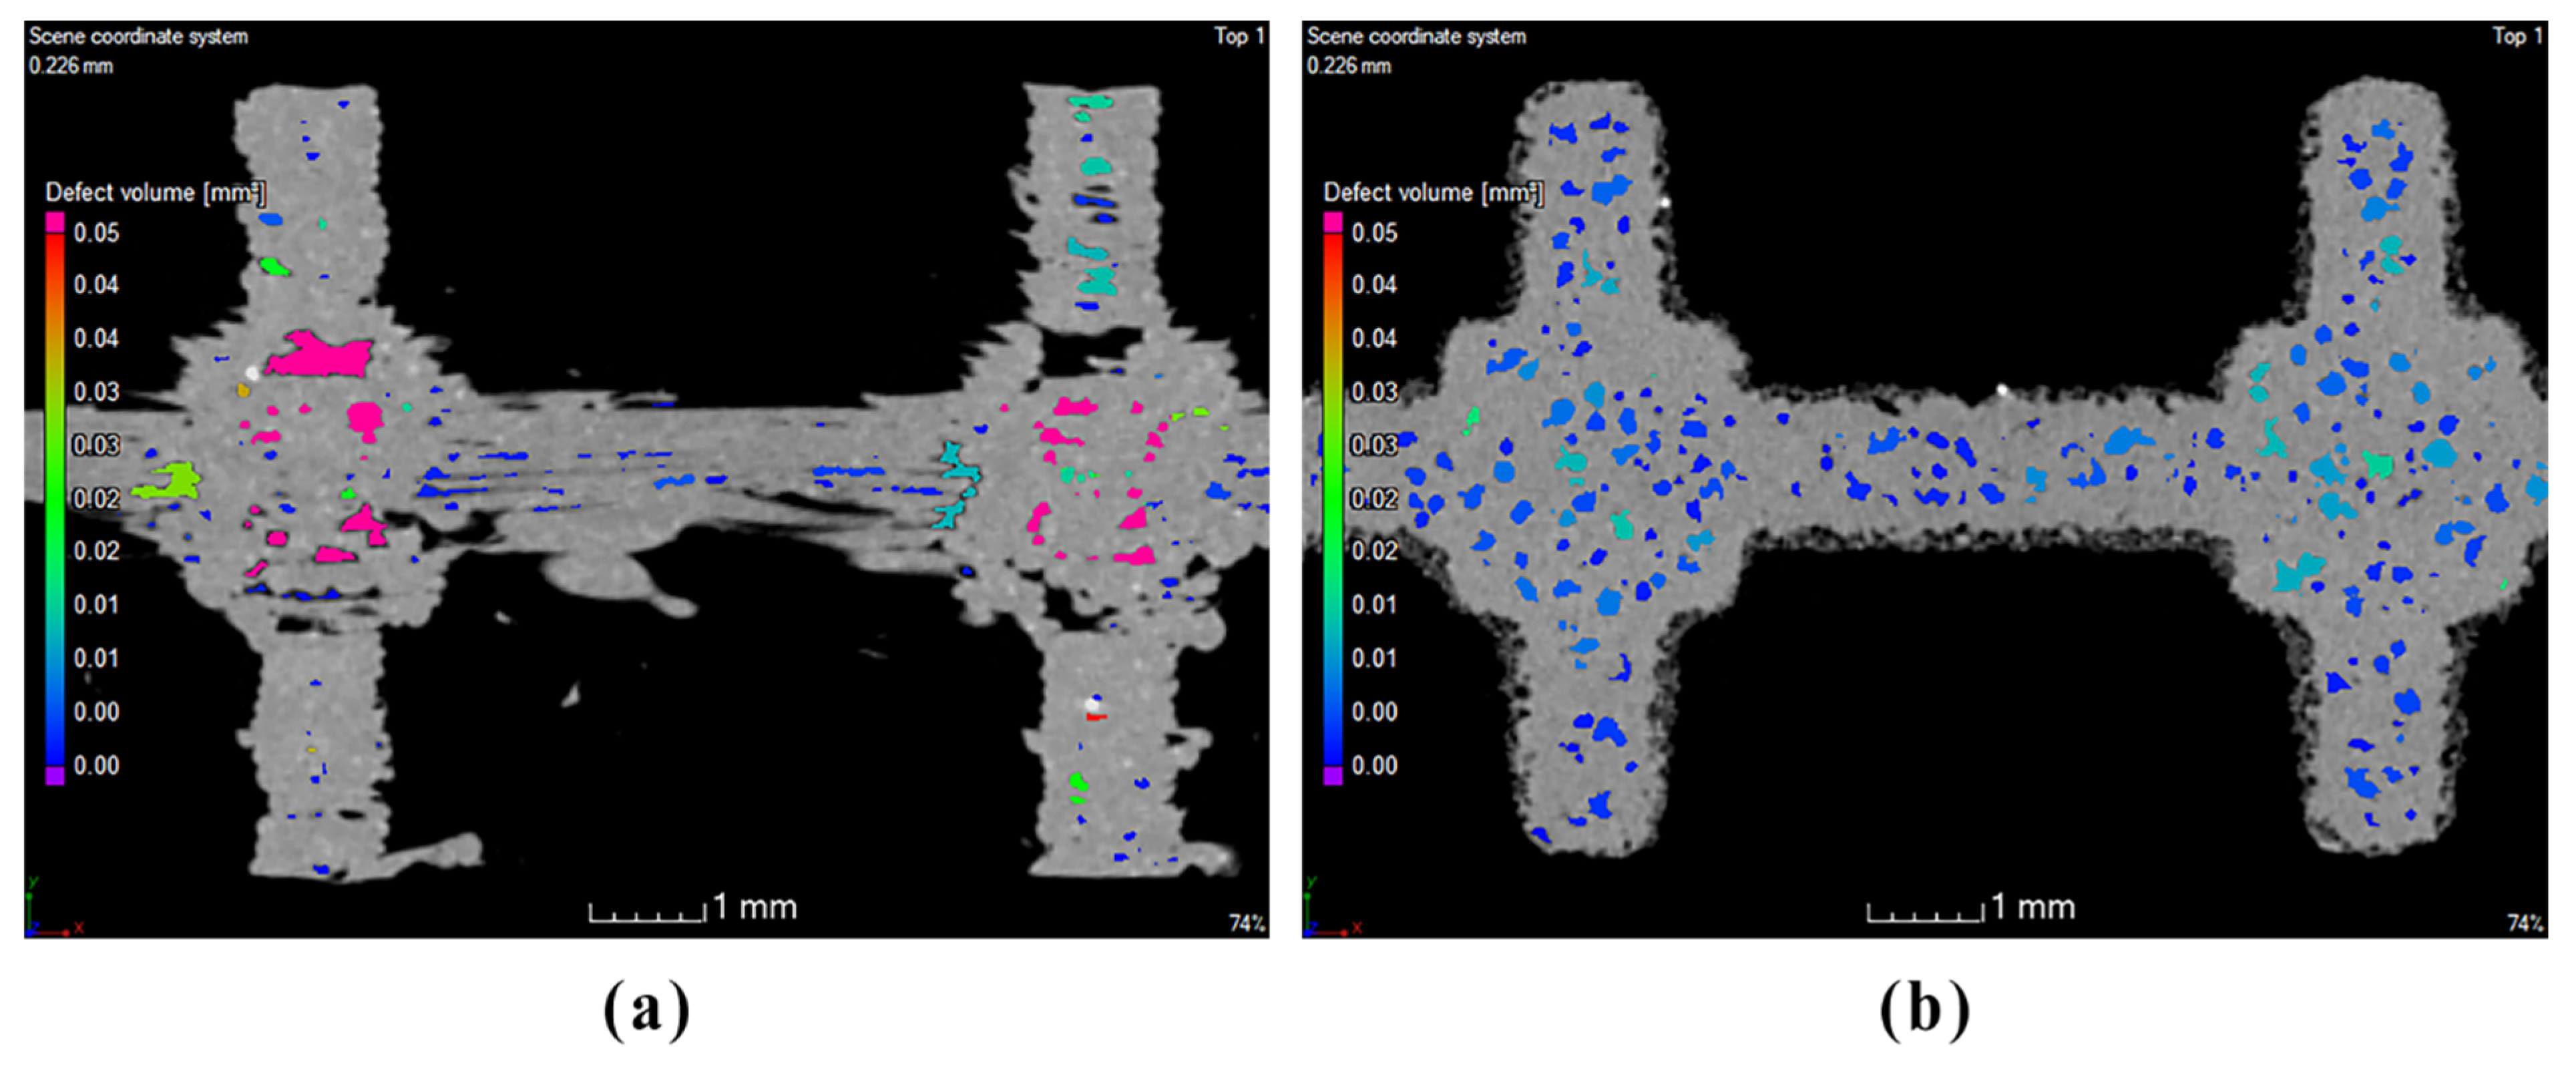
The VGStudio MAX 2.2 software, in the version, used has several algorithms for pore detection. However, none of them could be set so that “perfect” results could be obtained. The analyzed samples had a small wall thickness and significant material layering, and the pores created during FDM printing did not have a standard shape (sphere or crack), which made their identification difficult. One possibility is to use a different software program that does not assume that the surfaces are created equally, but the performed analyses may not have the same results. Another option is to scan a selected region of interest (ROI), which will increase the scan’s resolution (smaller voxel) and allow a more accurate evaluation of the selected ROI’s porosity. Subsequently, a correlation of the pore analysis results of this work with the results from imaging (ROI) could be performed. In the future, both approaches will be tested, and their advantages and disadvantages will be analyzed.

Author Contributions

Conceptualization, J.T. and T.T.; methodology, O.M.; software, T.T.; validation, V.M., G.F. and M.D.; formal analysis, J.T.; investigation, O.M.; resources, T.T.; data curation, V.M.; writing—original draft preparation, J.T.; writing—review and editing, G.F.; visualization, J.T.; supervision, M.D.; project administration, O.M.; funding acquisition, V.M. All authors have read and agreed to the published version of the manuscript.

Funding

This work is a part of the projects KEGA 005TUKE-4/2022, KEGA 018TUKE-4/2022, KEGA 021TUKE-4/2022, KEGA 004TUKE-4/2024, VEGA 1/0101/22, VEGA 1/0191/24, VEGA 1/0674/24, SP2023/088, and APVV- 21-0195.

Institutional Review Board Statement

Not applicable.

Informed Consent Statement

Not applicable.

Data Availability Statement

Data are contained within the article.

Conflicts of Interest

The authors declare no conflict of interest.

References

  1. Zakharchenko, M.Y.; Kochetkov, A.V.; Salov, P.M.; Zakharov, O.V. New system of functional parameters for surface texture analysis. Mater. Today Proc. 2021, 38, 1866–1870. [Google Scholar] [CrossRef]
  2. Pawlus, P.; Reizer, R.; Wieczorowski, M. A review of methods of random surface topography modeling. Tribol. Int. 2020, 152, 106530. [Google Scholar] [CrossRef]
  3. Jiang, X.; Senin, N.; Scott, P.J.; Blateyron, F. Feature-based characterisation of surface topography and its application. CIRP Ann. 2021, 70, 681–702. [Google Scholar] [CrossRef]
  4. Lou, S.; Zeng, W.; Scott, P.; Jiang, J. 3D Surface Texture Characterisation Techniques for Additive Manufacturing Components. In Proceedings of the 2022 ASPE and euspen Summer Topical Meeting on Advancing Precision in Additive Manufacturing, Knoxville, TN, USA, 11–14 July 2022; American Society for Precision Engineering, ASPE. pp. 212–216. [Google Scholar]
  5. Kim, H.; Lin, Y.; Tseng, T.-L.B. A review on quality control in additive manufacturing. Rapid Prototyp. J. 2018, 24, 645–669. [Google Scholar] [CrossRef]
  6. Reiher, T.; Lindemann, C.; Jahnke, U.; Deppe, G.; Koch, R. Holistic approach for industrializing AM technology: From part selection to test and verification. Prog. Addit. Manuf. 2017, 2, 43–55. [Google Scholar] [CrossRef]
  7. Angel, J.A.B. Quality Assurance of CT Scanning for Industrial Applications; Technical University of Denmark: Kongens Lyngby, Denmark, 2014. [Google Scholar]
  8. Bauza, M.B.; Moylan, S.P.; Panas, R.M.; Burke, S.C.; Martz, H.E.; Taylor, J.S.; Alexander, P.; Knebel, R.H.; Bhogaraju, R.; O’Connell, M.T.; et al. Study of accuracy of parts produced using additive manufacturing. In Proceedings of the ASPE 2014 Spring Topical Meeting: Dimensional Accuracy and Surface Finish in Additive Manufacturing, Berkeley, CA, USA, 13–16 April 2014; Volume 57, pp. 86–91. [Google Scholar]
  9. Slotwinski, J.A.; Moylan, S.P. Metals-based additive manufacturing: Metrology needs and standardization efforts. In Proceedings of the ASPE 2014 Spring Topical Meeting: Dimensional Accuracy and Surface Finish in Additive Manufacturing, Berkeley, CA, USA, 13–16 April 2014; pp. 11–12. [Google Scholar]
  10. du Plessis, A.; Schwaderer, G.; Cristofolini, I.; Zago, M.; Benedetti, M. Dimensional metrology of additively manufactured lattice structures by combined tactile probe and X-ray tomography. Mater. Des. Process. Commun. 2021, 3, e216. [Google Scholar] [CrossRef]
  11. Javaid, M.; Haleem, A.; Pratap Singh, R.; Suman, R. Industrial perspectives of 3D scanning: Features, roles and it’s analytical applications. Sens. Int. 2021, 2, 100114. [Google Scholar] [CrossRef]
  12. Thompson, A.; Maskery, I.; Leach, R.K. X-ray computed tomography for additive manufacturing: A review. Meas. Sci. Technol. 2016, 27, 072001. [Google Scholar] [CrossRef]
  13. du Plessis, A.; Yadroitsev, I.; Yadroitsava, I.; Le Roux, S.G. X-Ray Microcomputed Tomography in Additive Manufacturing: A Review of the Current Technology and Applications. 3D Print. Addit. Manuf. 2018, 5, 227–247. [Google Scholar] [CrossRef]
  14. Kruth, J.P.; Bartscher, M.; Carmignato, S.; Schmitt, R.; De Chiffre, L.; Weckenmann, A. Computed tomography for dimensional metrology. CIRP Ann.-Manuf. Technol. 2011, 60, 821–842. [Google Scholar] [CrossRef]
  15. De Chiffre, L.; Carmignato, S.; Kruth, J.P.; Schmitt, R.; Weckenmann, A. Industrial applications of computed tomography. CIRP Ann.-Manuf. Technol. 2014, 63, 655–677. [Google Scholar] [CrossRef]
  16. Münstedt, H.; Schwarzl, F.R. Deformation and Flow of Polymeric Materials; Springer: Berlin/Heidelberg, Germany, 2014; Volume 9783642554, ISBN 9783642554094. [Google Scholar]
  17. Drummer, D.; Drexler, M.; Wudy, K. Density of laser molten polymer parts as function of powder coating process during additive manufacturing. Procedia Eng. 2015, 102, 1908–1917. [Google Scholar] [CrossRef]
  18. Kudelski, R.; Cieslik, J.; Kulpa, M.; Dudek, P.; Zagorski, K.; Rumin, R. Comparison of cost, material and time usage in FDM and SLS 3D printing methods. In Proceedings of the 2017 13th International Conference Perspective Technologies and Methods in MEMS Design, MEMSTECH 2017—Proceedings, Lviv, Ukraine, 20–23 April 2017; pp. 12–14. [Google Scholar] [CrossRef]
  19. Shilpa, K.; Paleshwar, D.V.; Kasuba, S. Comparative Study on Mechanical Properties of Various Additive Manufacturing Methods. Mater. Today Proc. 2018, 46, 9270–9274. [Google Scholar]
  20. Tagliaferri, V.; Trovalusci, F.; Guarino, S.; Venettacci, S. Environmental and economic analysis of FDM, SLS and MJF additive manufacturing technologies. Materials 2019, 12, 4161. [Google Scholar] [CrossRef] [PubMed]
  21. Wegner, A.; Mielicki, C.; Grimm, T.; Gronhoff, B.; Witt, G.; Wortberg, J. Determination of Robust Material Qualities and Processing Conditions for Laser Sintering of Polyamide 12. Polym. Eng. Sci. 2014, 54, 1540–1554. [Google Scholar] [CrossRef]
  22. Wudy, K.; Drummer, D. Aging effects of polyamide 12 in selective laser sintering: Molecular weight distribution and thermal properties. Addit. Manuf. 2019, 25, 1–9. [Google Scholar] [CrossRef]
  23. Grimm, T.; Wiora, G.; Witt, G. Characterization of typical surface effects in additive manufacturing with confocal microscopy. Surf. Topogr. Metrol. Prop. 2015, 3, 014001. [Google Scholar] [CrossRef]
  24. EN ISO 21920-1; Geometrical Product Specifications (GPS)—Surface Texture: Profile—Part 1: Indication of Surface Texture. CEN-CENELEC Management Centre: Brussels, Belgium, 2022.
  25. InfiniteFocus G6. Available online: https://www.alicona.com/products/infinitefocus/ (accessed on 1 December 2023).
  26. EN ISO 4287; Geometrical Product Specifications (GPS)—Surface Texture: Profile Method—Terms, Definitions and Surface Texture Parameters. Central Secretariat: Brussels, Belgium, 1998.
  27. EN ISO 4288; Geometrical Product Specifications (GPS)—Surface Texture: Profile Method—Rules and Procedures for the Assessment of Surface Texture. Central Secretariat: Brussels, Belgium, 1997.
  28. Newton, L.; Senin, N.; Gomez, C.; Danzl, R.; Helmli, F.; Blunt, L.; Leach, R. Areal topography measurement of metal additive surfaces using focus variation microscopy. Addit. Manuf. 2019, 25, 365–389. [Google Scholar] [CrossRef]
Figure 1. Dimension and shape of porous structure 3D model filled with (a) lattice structure and (b) gyroid structure.
Applsci 14 00648 g001
Figure 2. Types of experimental specimens.
Applsci 14 00648 g002
Figure 3. Data processing and assessment methodology.
Applsci 14 00648 g003
Figure 4. Measurement principle using the Alicona Infinite G5 optical microscope [28].
Applsci 14 00648 g004
Figure 5. Gray lattice specimen (SLS method)—representation of unremoved excess powder, impurities, and pores on CT in sections. (a) Lattice specimen FRONT plane; (b) lattice specimen TOP plane; (c) gyroid specimen FRONT plane; (d) Gyroid specimen TOP plane.
Applsci 14 00648 g005
Figure 6. Gray specimens (SLS method)—representation of reconstructed surface: (a) lattice, (b) gyroid.
Applsci 14 00648 g006
Figure 7. Red specimens (FDM method)—representation of material and pore layering on CT in sections. (a) Lattice FRONT plane; (b) lattice TOP plane; (c) gyroid FRONT plane; (d) gyroid TOP plane.
Applsci 14 00648 g007
Figure 8. Red specimens (FDM method)—representation of reconstructed surface: (a) lattice; (b) gyroid.
Applsci 14 00648 g008
Figure 9. Black specimens (FDM method)—representation of material and pore layering on CT in sections. (a) Lattice FRONT plane; (b) lattice TOP plane; (c) gyroid FRONT plane; (d) gyroid TOP plane.
Applsci 14 00648 g009
Figure 10. Black specimens (FDM method)—representation of reconstructed surface: (a) lattice; (b) gyroid.
Applsci 14 00648 g010
Figure 11. Assessment of lattice structures’ porosity: (a) red sample (FDM method); (b) gray sample (SLS method).
Applsci 14 00648 g011
Figure 12. Assessment of the wall thickness of the lattice gray specimen (SLS method) using the wall thickness analysis module: (a) FRONT plane; (b) TOP plane.
Applsci 14 00648 g012
Figure 13. Measurement of the diameter in gray lattice specimen (SLS method): (a) Gaussian feature; (b) minimum circumscribed feature; (c) maximum inscribed feature.
Applsci 14 00648 g013
Figure 14. View of the strut cross-section in the lattice structure (FDM method): (a) red; (b) black.
Applsci 14 00648 g014
Figure 15. Measurement of the gyroid structure’s wall thickness: (a) gray (SLS method); (b) red (FDM method); (c) black (FDM method).
Applsci 14 00648 g015
Figure 16. Illustration of deviations when comparing manufactured gray specimens (SLS method) to the CAD model: (a) lattice; (b) gyroid.
Applsci 14 00648 g016
Figure 17. Illustration of deviations when comparing manufactured red specimens (FDM method) to the CAD model: (a) lattice; (b) gyroid.
Applsci 14 00648 g017
Figure 18. Illustration of deviations when comparing manufactured black specimens (FDM method) to the CAD model: (a) lattice; (b) gyroid.
Applsci 14 00648 g018
Figure 19. Red gyroid specimen (FDM method)—scan from the upper side.
Applsci 14 00648 g019
Figure 20. Gray gyroid specimen (SLS method)—scan from the upper side.
Applsci 14 00648 g020
Figure 21. Gray lattice specimen (SLS method)—scan from the upper side.
Applsci 14 00648 g021
Figure 22. Black gyroid specimen (FDM method)—scan from the upper side.
Applsci 14 00648 g022
Figure 23. Black lattice specimen (FDM method)—scan from the upper side.
Applsci 14 00648 g023
Table 1. Printing parameters of 3D model test specimens.
Filled Specimen Volume [mm3]Sample Designation Cell Size [mm]Created Volume Share [%]Wall Thickness [mm]Strut Diameter [mm]Specimen Volume [mm3]
8575.000lattice_25725.170-14302158.370
gyroid_2525,0800.500-2150.770
Table 2. Technology/material parameters and designation of test specimens.
TechnologyFDMSLS
Designation of the Test SpecimenBlackRedGray
MaterialFlexfill 90AFlexfill 92APLA
Lattice structure
Gyroid structure
Table 3. Results of porosity assessment.
SamplePorosity [%]
Gray lattice7.550
Red lattice4.090
Black lattice4.290
Gray gyroid4.570
Red gyroid0.900
Black gyroid0.540
Table 4. Volume and percentage volume change in individual specimens.
Specimen DesignationCreated Volume Share [%]Theoretical Specimen Volume VT [mm3]Actual Specimen Volume VR [mm3]Percentage Change in Volume [%]
Gray lattice25.1702158.3701971.000−8.681
Red lattice25.1702158.3701801.000−16.557
Black lattice25.1702158.3701816.930−15.819
Gray gyroid25.0802150.7702064.590−4.007
Red gyroid25.0802150.7701995.000−7.243
Black gyroid25.0802150.7701975.830−8.134
Table 5. Surface and surface change percentage in individual specimens.
Specimen DesignationTheoretical Specimen Surface AT [mm2]Actual Specimen Surface AR [mm2]Percentage Change of Surface [%]
Gray lattice5525.0388889.73060.899
Red lattice5525.0386646.07220.290
Black lattice5525.0386055.2809.597
Gray gyroid8090.08313,476.74066.583
Red gyroid8090.08311,318.74539.909
Black gyroid8090.0839865.77921.949
Table 6. Assessment of external dimensions of specimens.
Specimen Designation A [mm]B [mm]C [mm]Area A × B [mm2]Percentage Change in Area A × B [%]
CAD model35.00035.0007.0001225.000-
Gray lattice34.78334.8586.8501212.660−1.023
Red lattice34.68734.5067.0511196.910−2.293
Black lattice34.36334.4686.9941184.240−3.312
Gray gyroid34.76034.7616.9351208.292−1.364
Red gyroid34.56334.6626.9901198.023−2.202
Black gyroid34.49634.3376.6371184.489−3.307
Table 7. Cumulative deviations for 90% of test specimens’ surfaces.
Test specimen DesignationCumulative Deviation at 90% [mm]
Gray lattice0.133
Red lattice0.308
Black lattice0.418
Gray gyroid0.126
Red gyroid0.227
Black gyroid0.383
Table 8. Measured parameters of roughness.
Measured   Value   x ¯ [μm]
ParameterRaRzRvRp
Red gyroid specimen31.674137.190103.81173.956
Gray gyroid specimen26.125192.579139.540128.952
Gray lattice specimen20.990166.473110.23787.113
Black gyroid specimen33.546136.88474.99875.569
Black lattice specimen45.861316.255242.218132.539
Disclaimer/Publisher’s Note: The statements, opinions and data contained in all publications are solely those of the individual author(s) and contributor(s) and not of MDPI and/or the editor(s). MDPI and/or the editor(s) disclaim responsibility for any injury to people or property resulting from any ideas, methods, instructions or products referred to in the content.

