
Transmission Tower Re-Identification Algorithm Based on Machine Vision


Abstract
Featured Application
Abstract
1. Introduction
- Defect inspection in electrical power systems, which is vital, tends to favor the use of single-stage identification algorithms from the YOLO series. These algorithms not only excel in terms of accuracy but also demonstrate a remarkable recognition speed, meeting the practical demands and standards of electrical inspections;
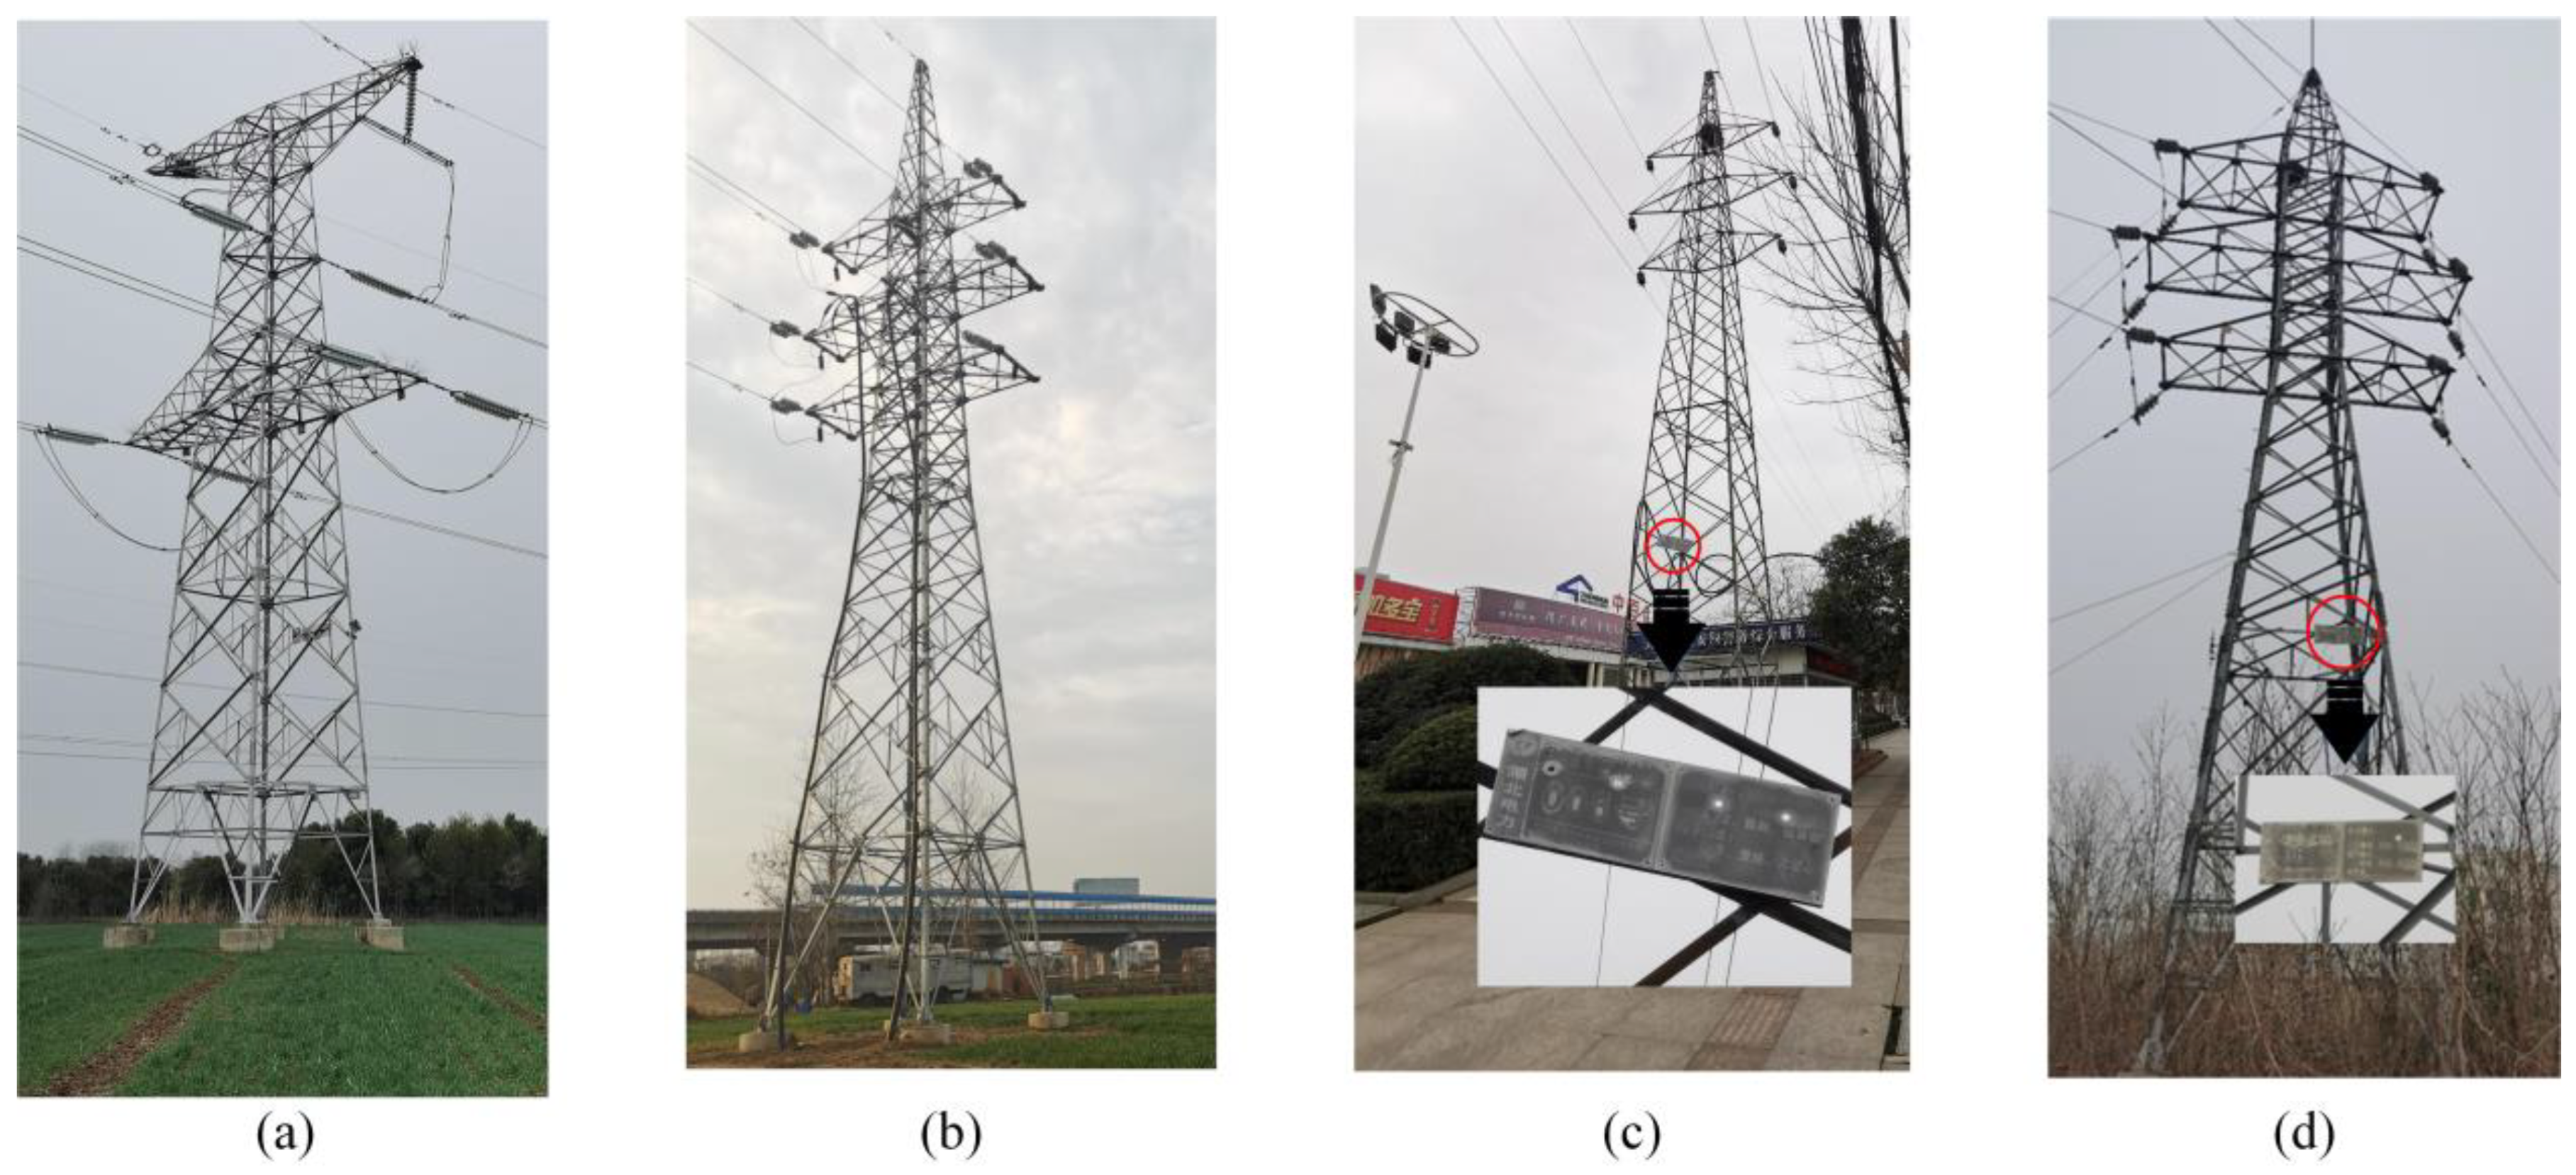
- The identification matching of transmission towers is crucial, facilitating the maintenance of the towers and their components. Manual comparison methods are time-consuming and can potentially be influenced by human factors; nameplate recognition and POS positioning represent effective and mature methods for matching transmission towers in the automated inspections. However, nameplate recognition is incapable of handling situations where images lack nameplates. Additionally, POS have high installation and maintenance costs, and their matching effectiveness diminishes when GPS data are unavailable.
- Local feature matching algorithms have limitations, as models tend to match similar features but often overlook unmatched critical features;
- Convolutional Neural Networks (CNNs) can extract and integrate global image features. When combined with different head networks, they have been applied in pedestrian re-identification and face matching.
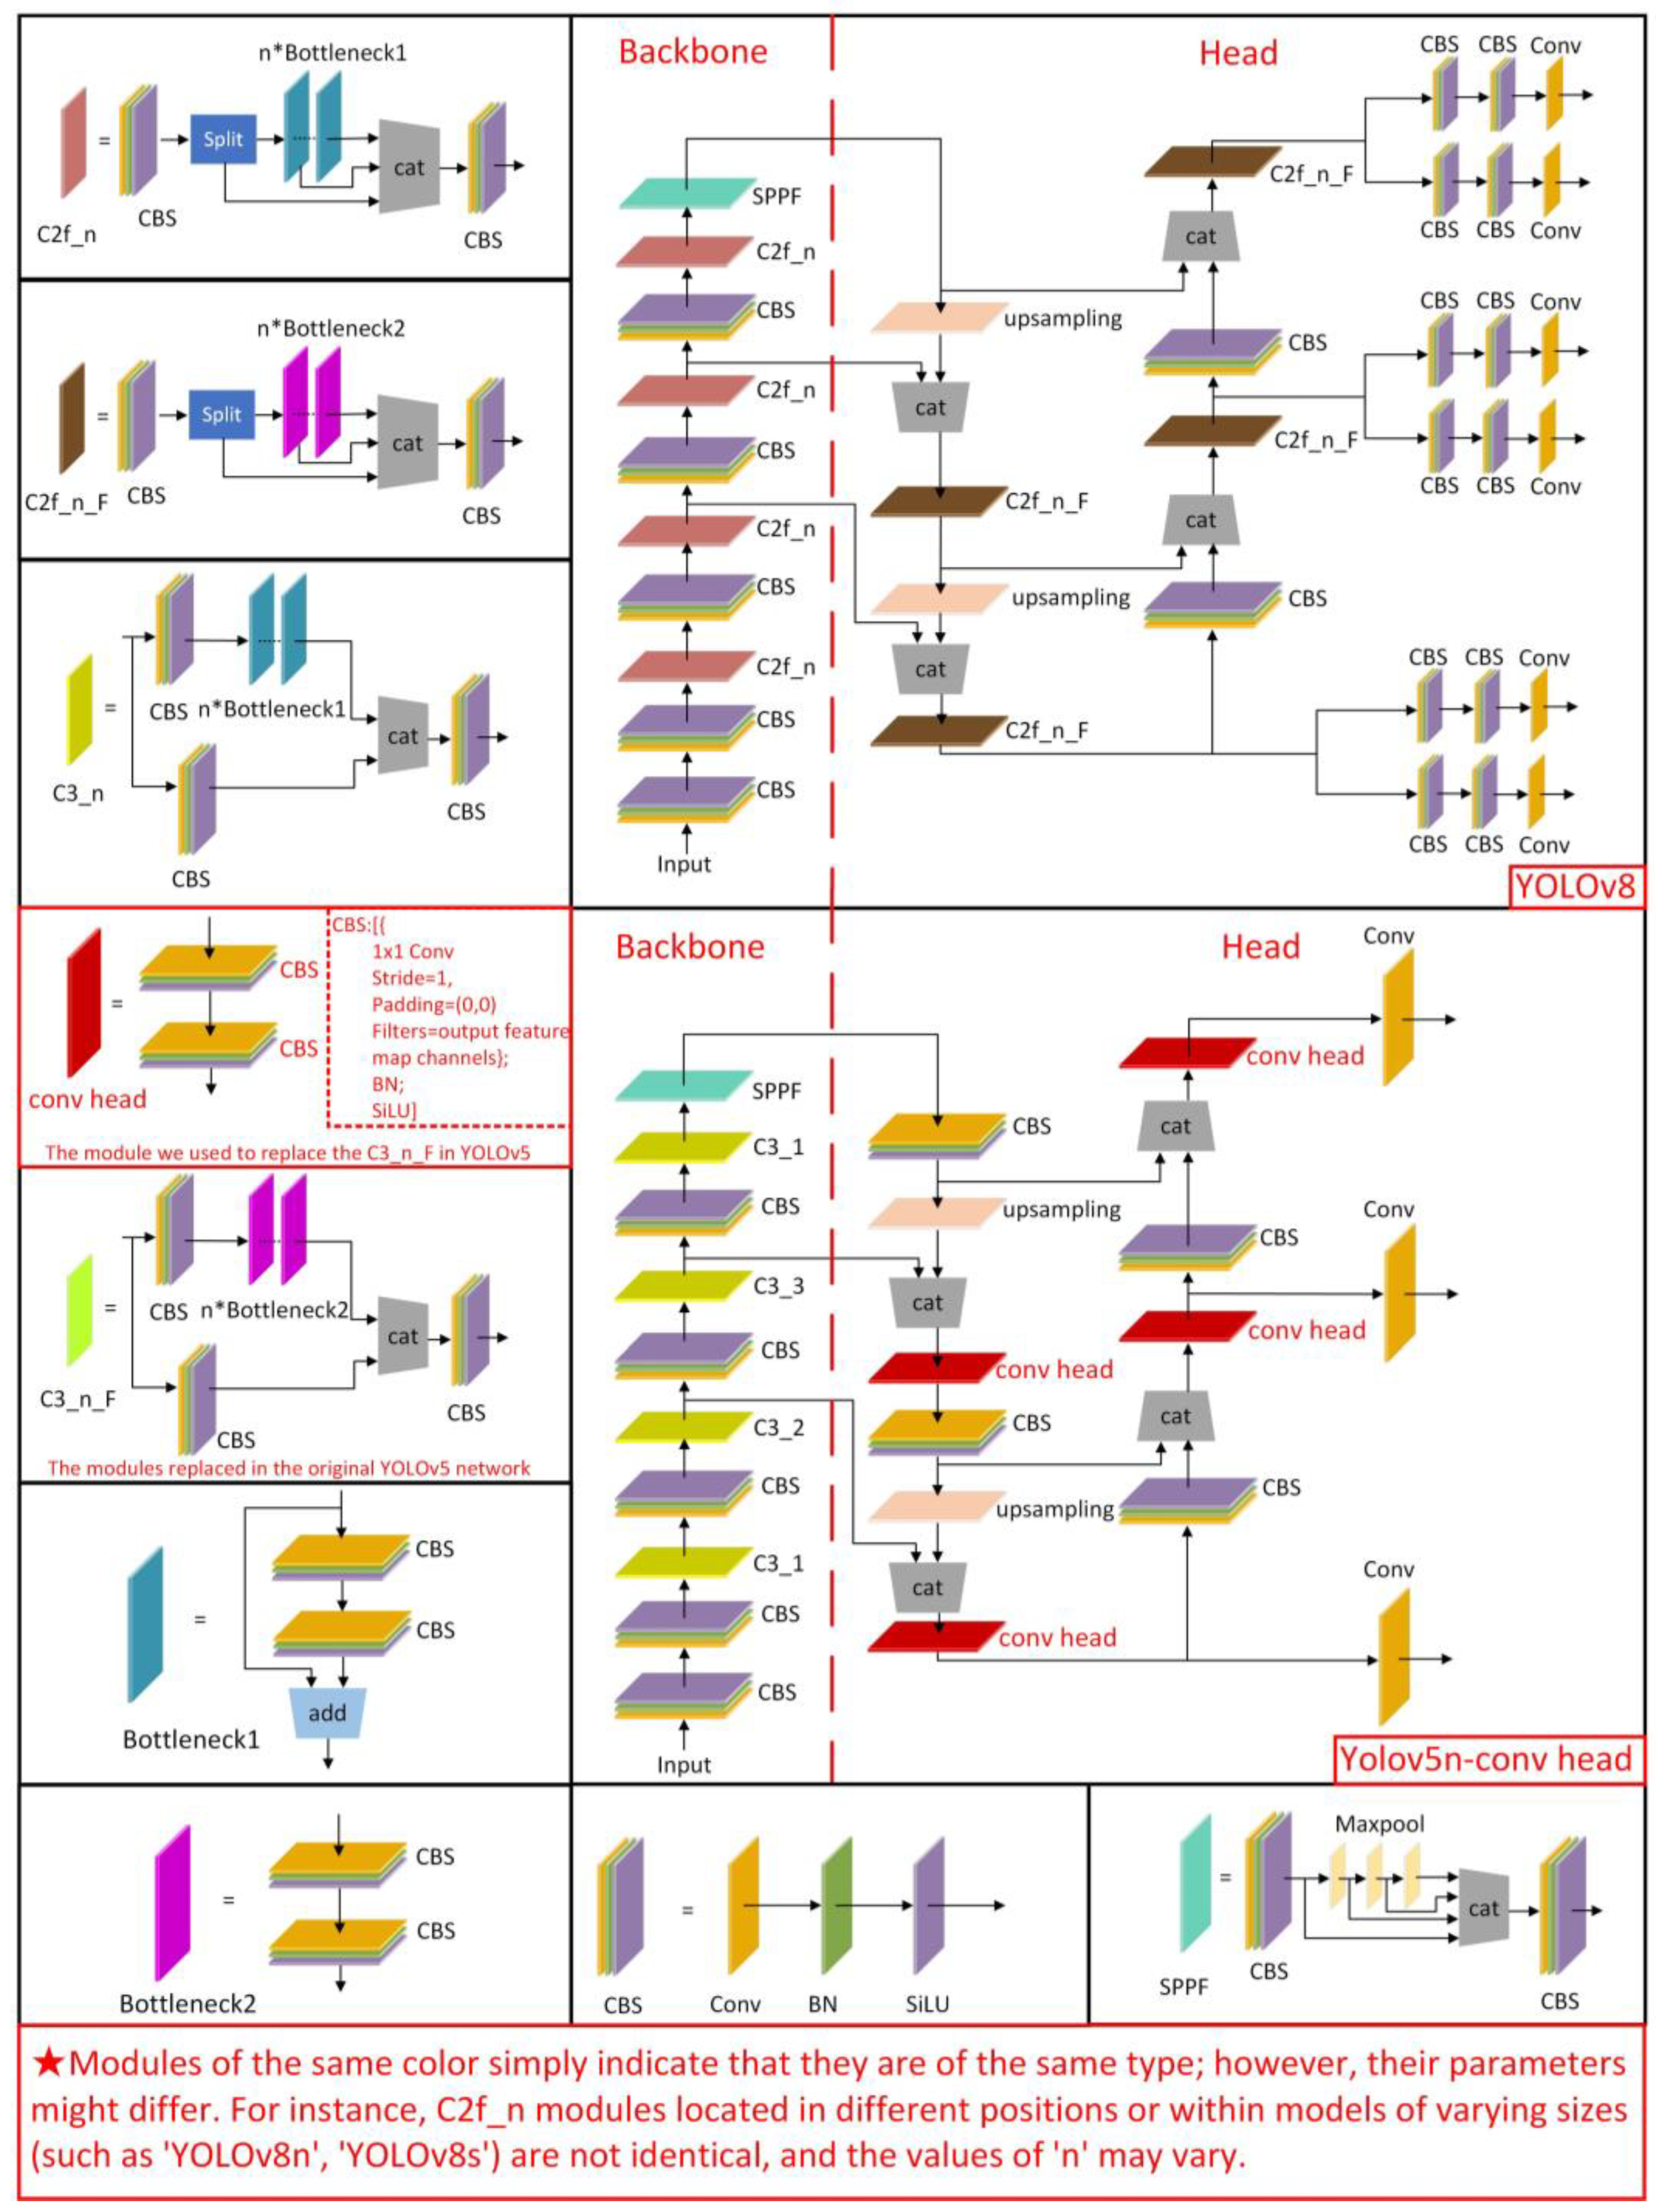
- During the identity matching stage, we propose using the YOLOv5-conv head network to detect transmission towers. While maintaining detection accuracy, the speed of transmission tower detection is enhanced;
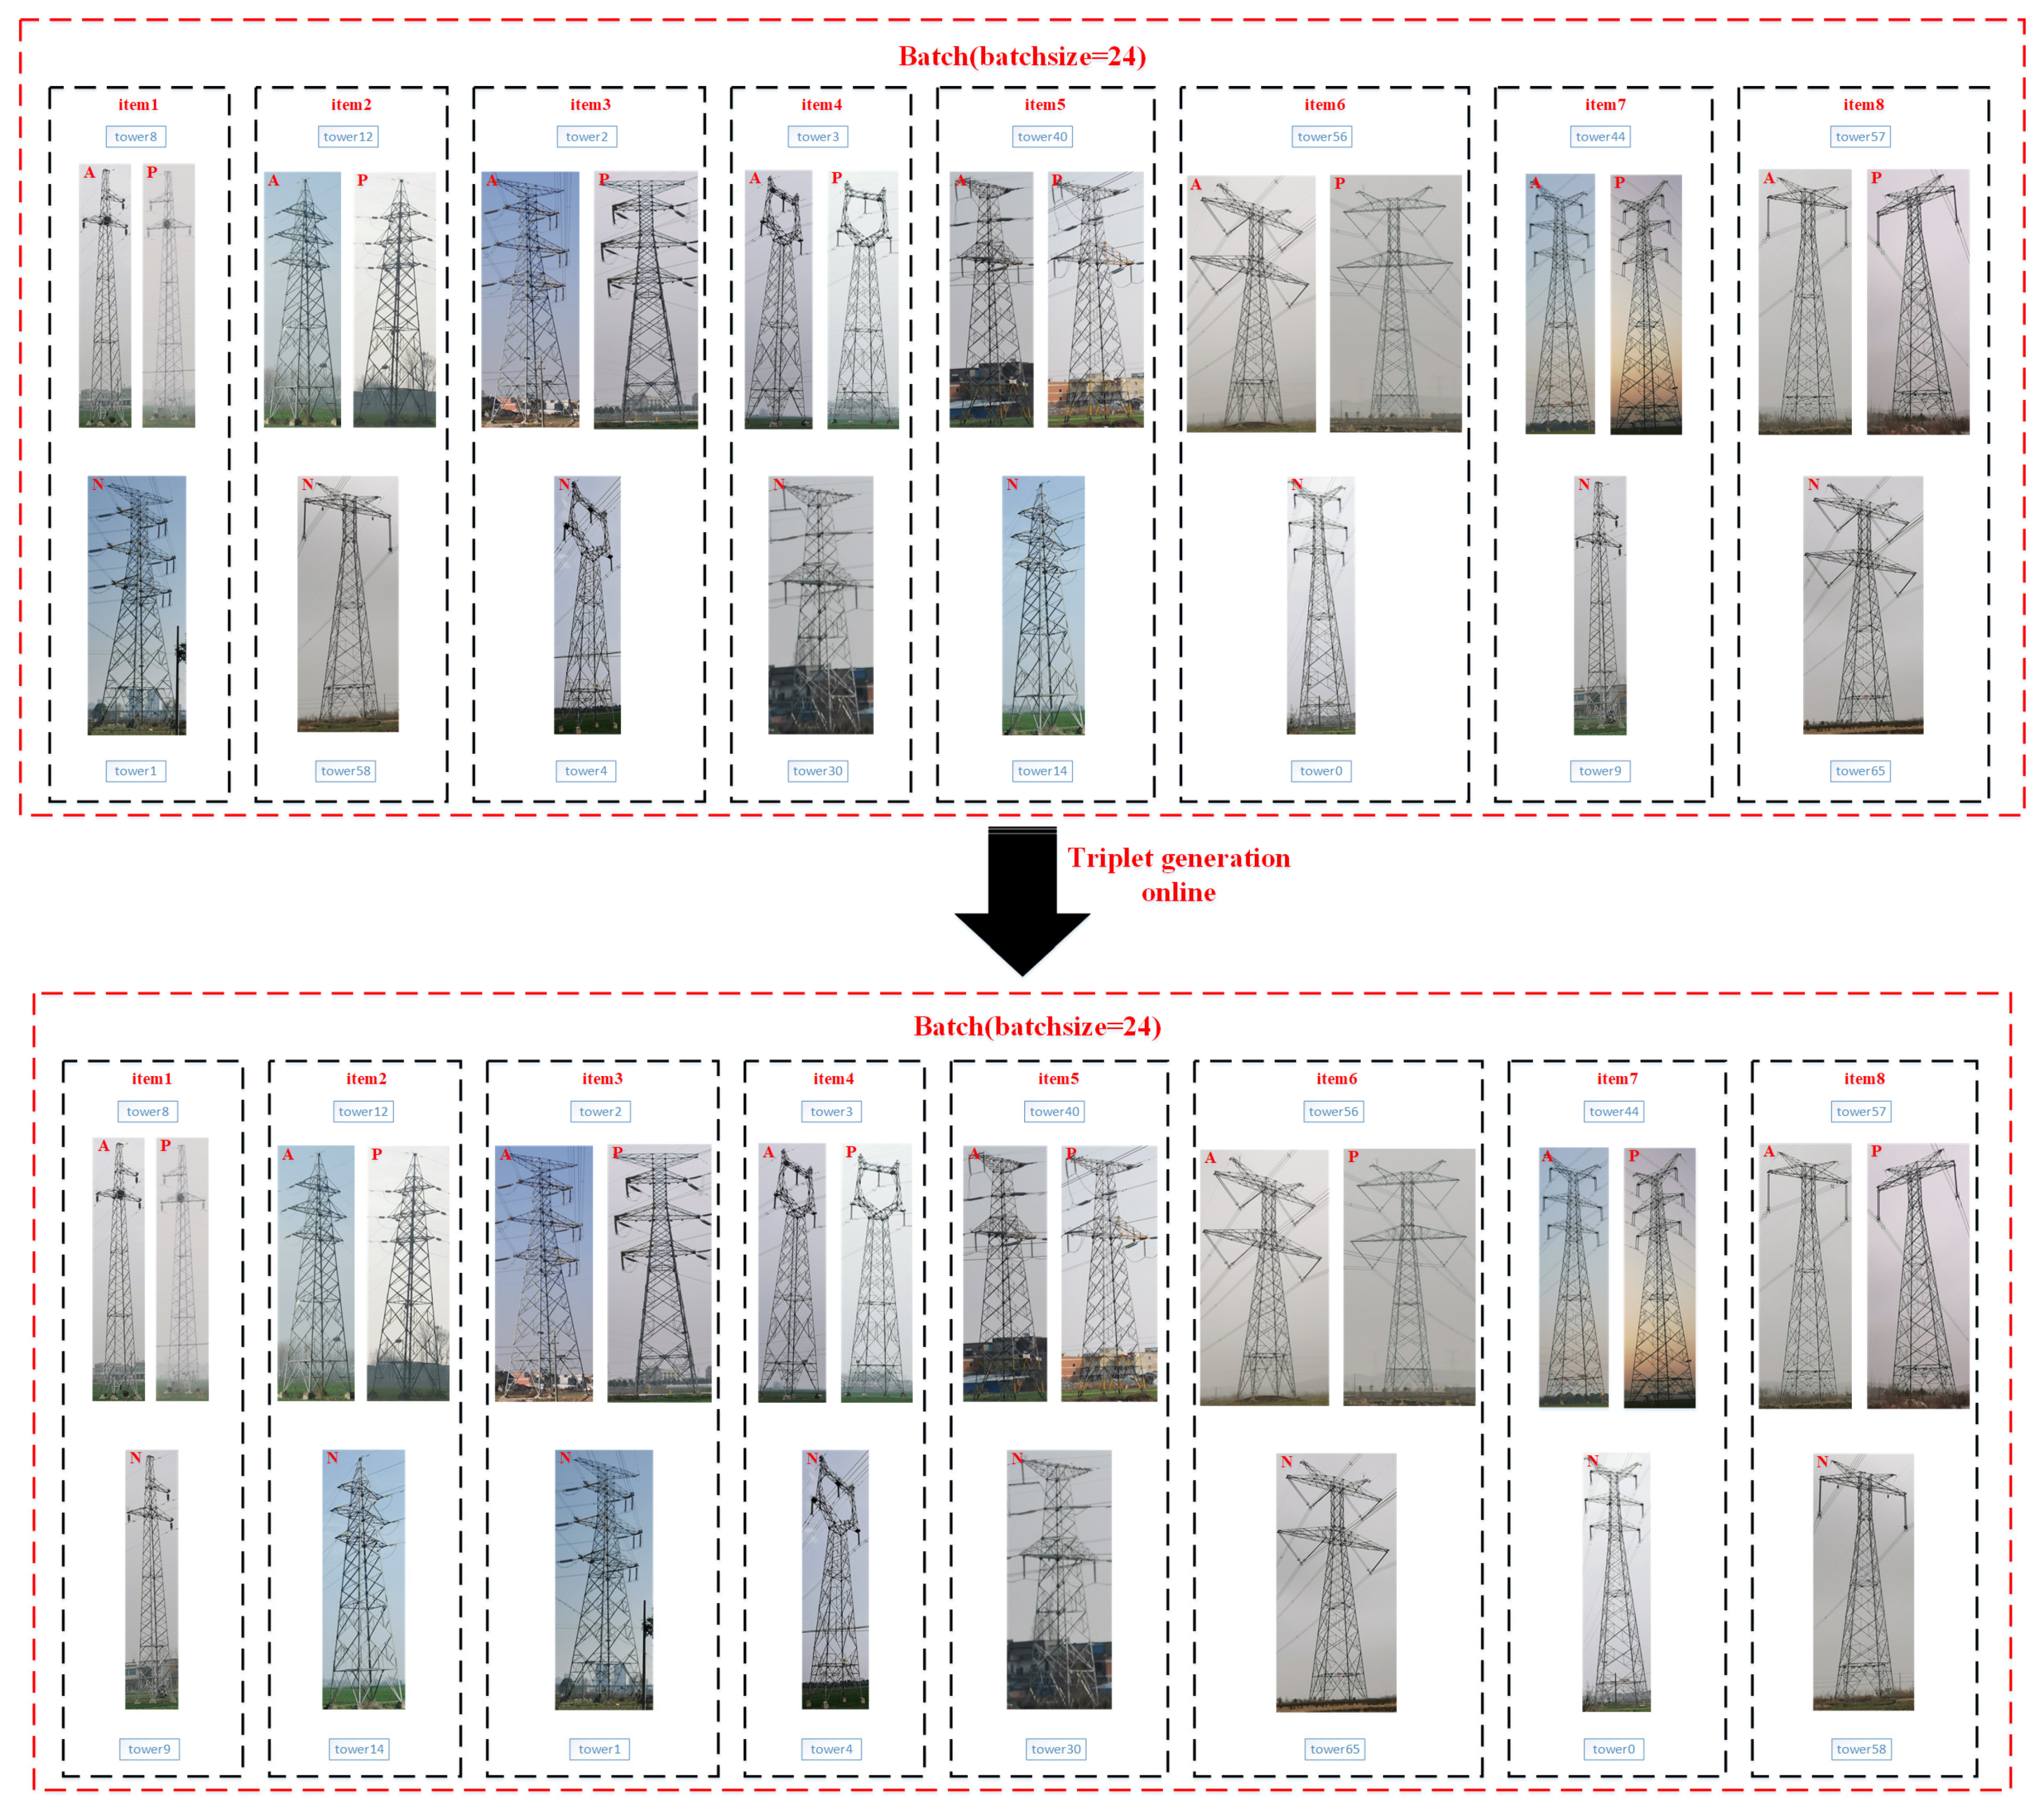
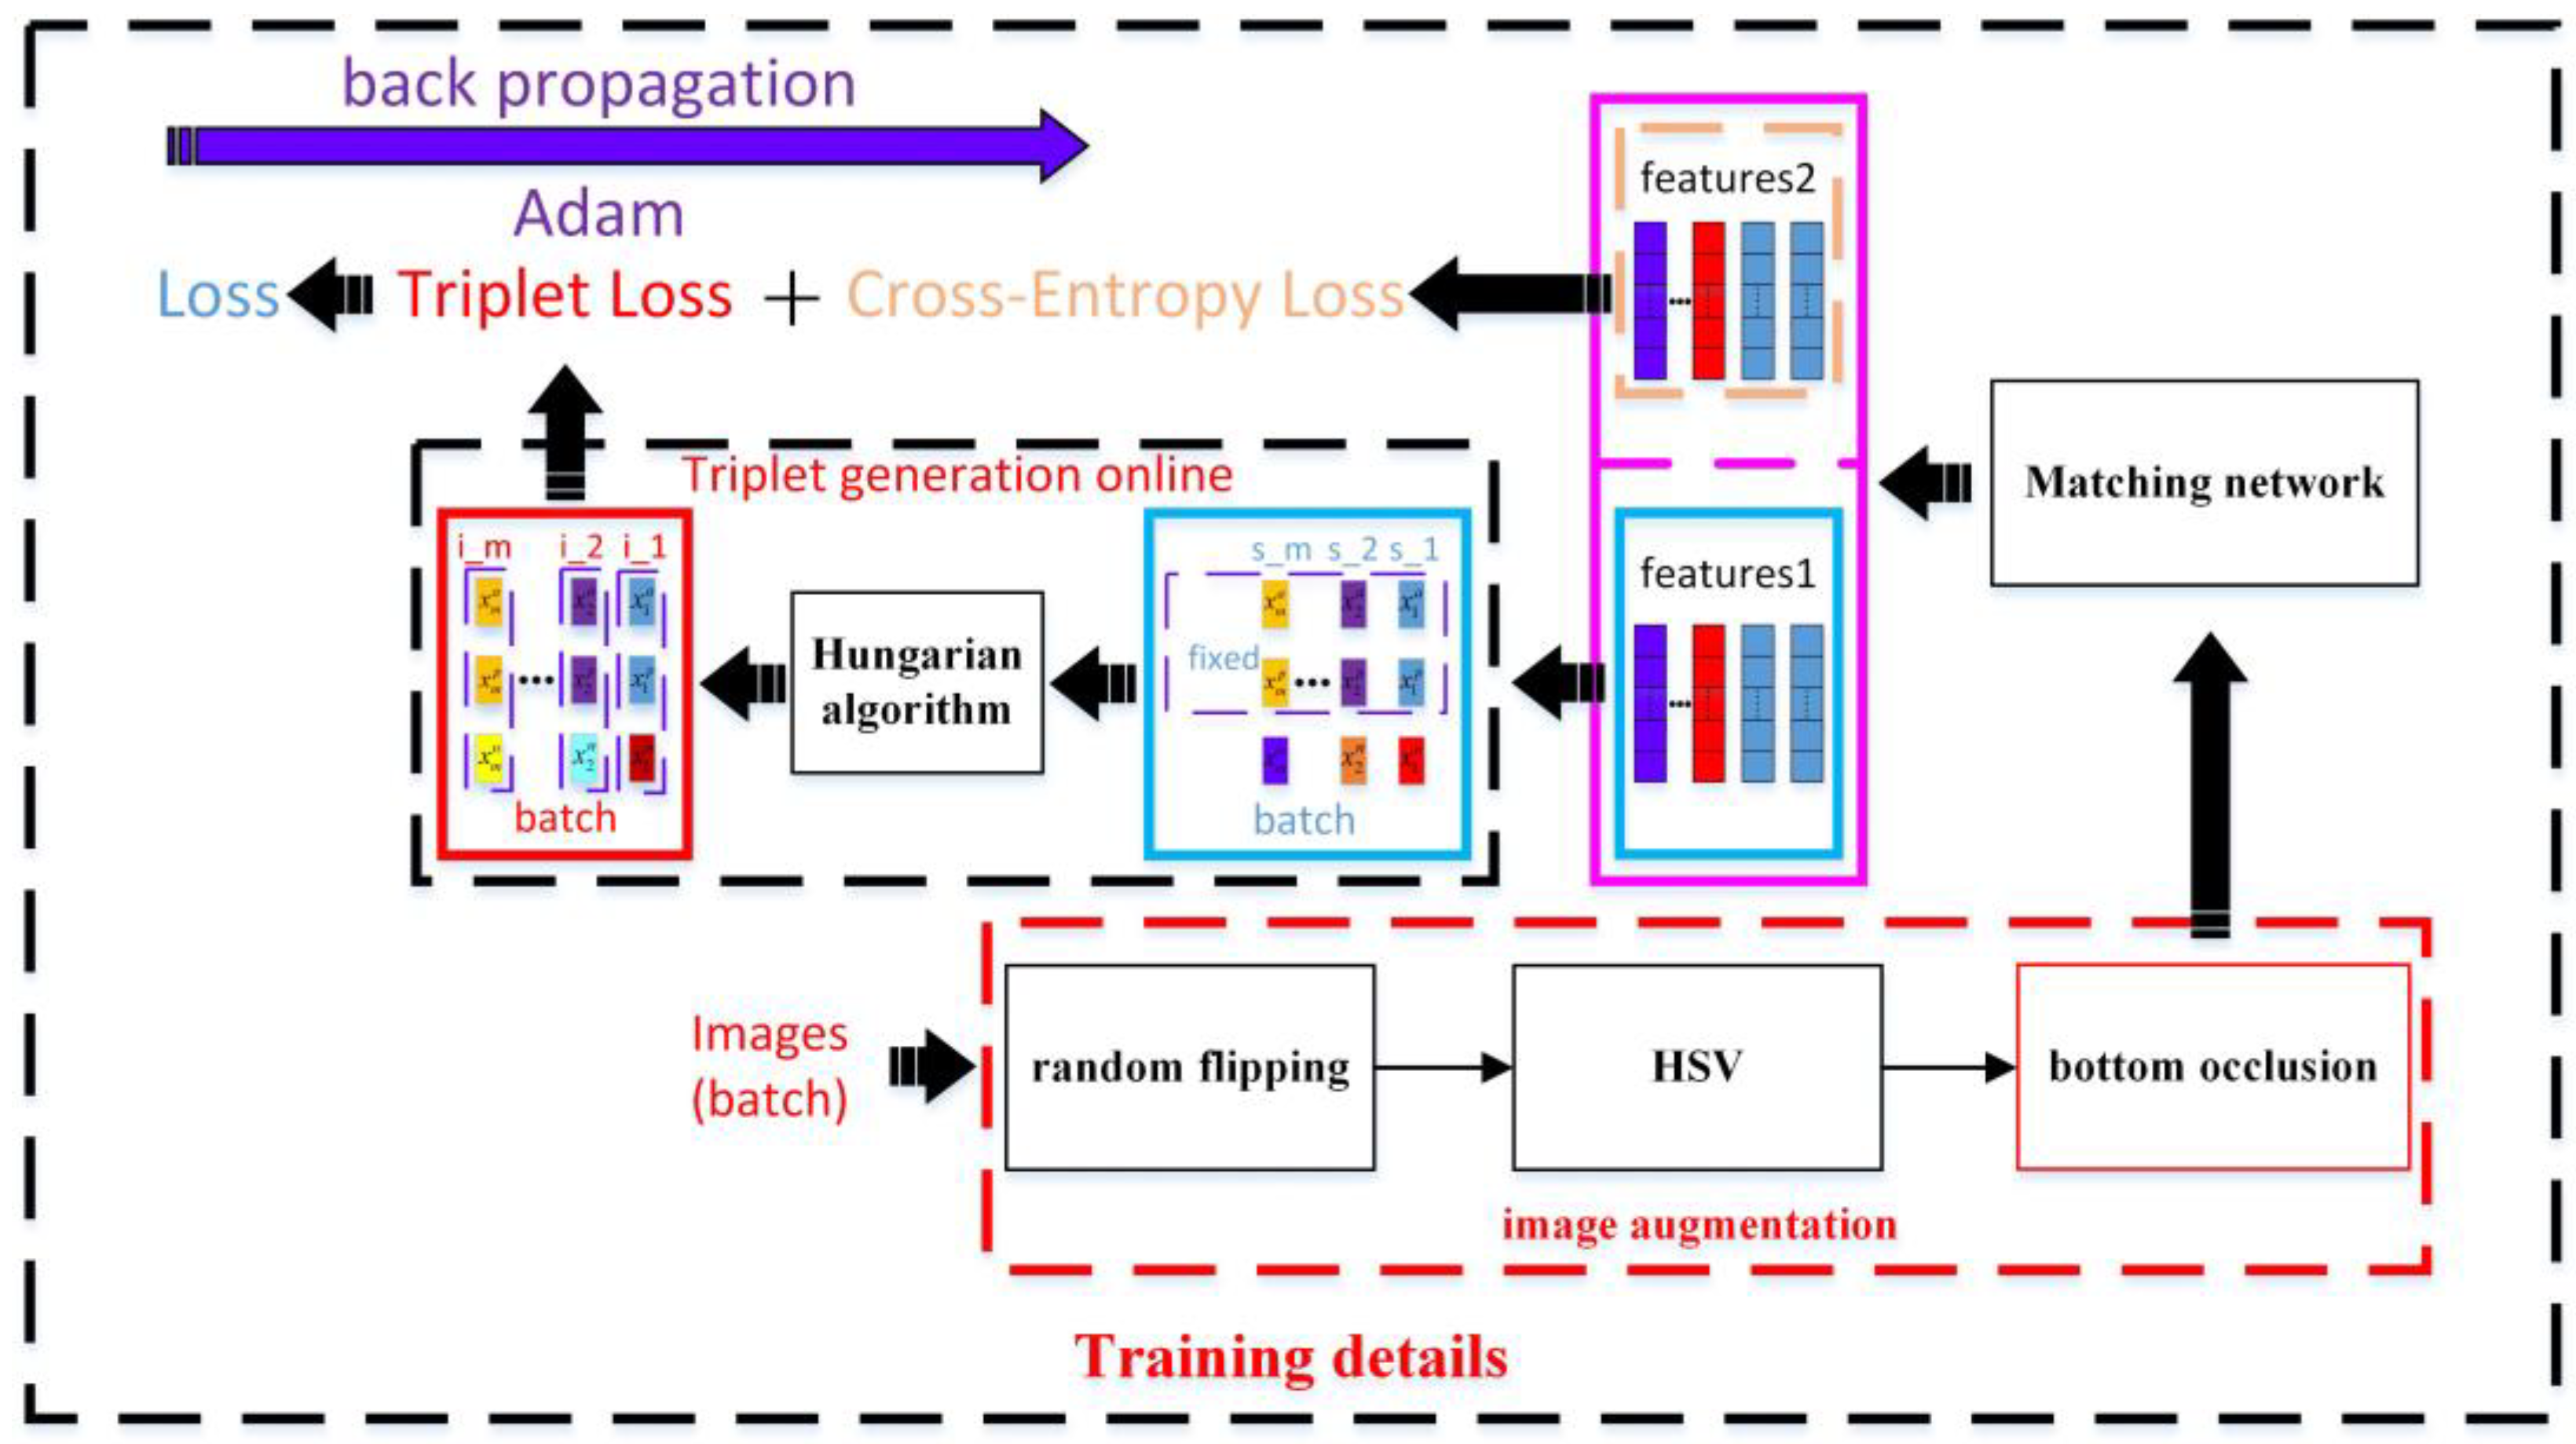
- During the training of the transmission tower matching network, we introduce an online triplet sample generation strategy. During the training process, we fix the anchor and positive samples in the triplet and employ the Hungarian algorithm to optimize the selection of negative samples in all triplets. The online triplet generation for triplet sampling strengthened model convergence stability, accelerated the convergence speed, and improved the rank-1 accuracy of transmission tower identity matching.
- We propose a method to establish a transmission tower identity matching template library. The matching template library for transmission towers is constructed based on the feature vectors generated from transmission tower images. Additionally, GPS information can be included in the database, which can be neglected in the absence of GPS signals.
- Our proposed method does not rely on GPS information. During the process of matching transmission towers, on the one hand, if the input image is equipped with GPS information, the matching accuracy and speed can be improved by narrowing the template library. On the other hand, the method is still capable of performing transmission tower identity matching even in the absence of GPS information in the input images.
2. The Proposed Method
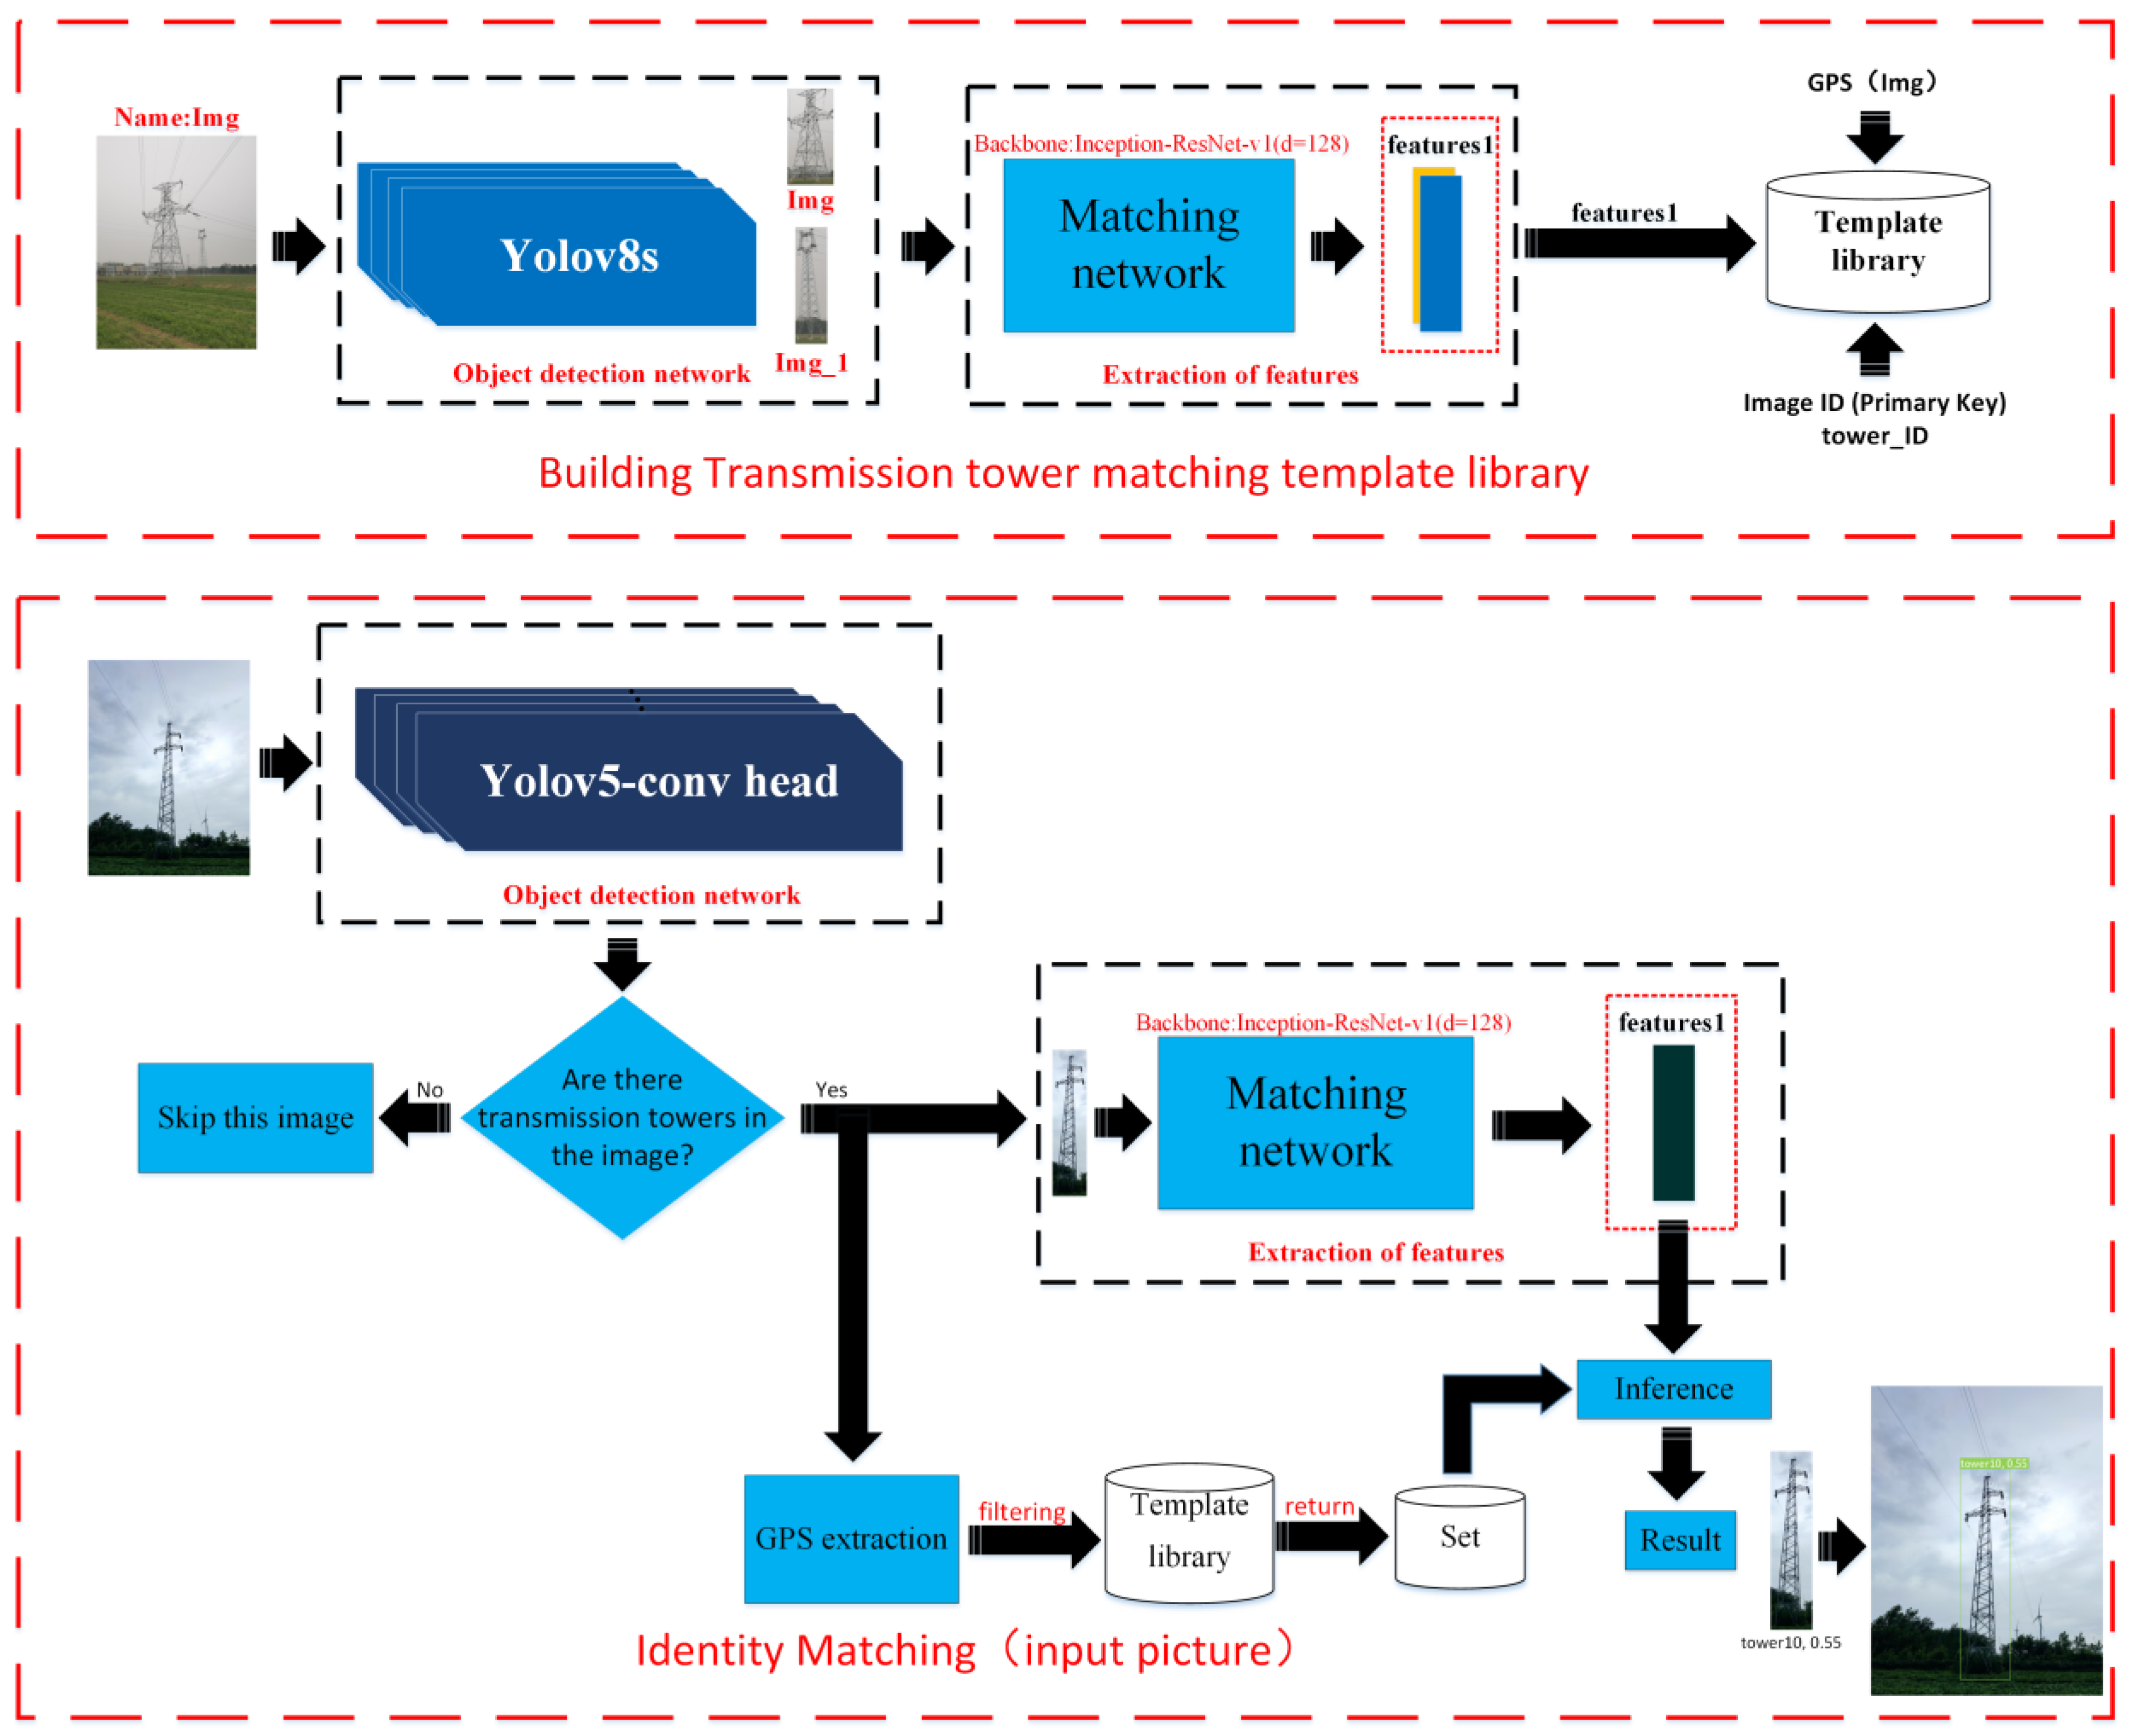
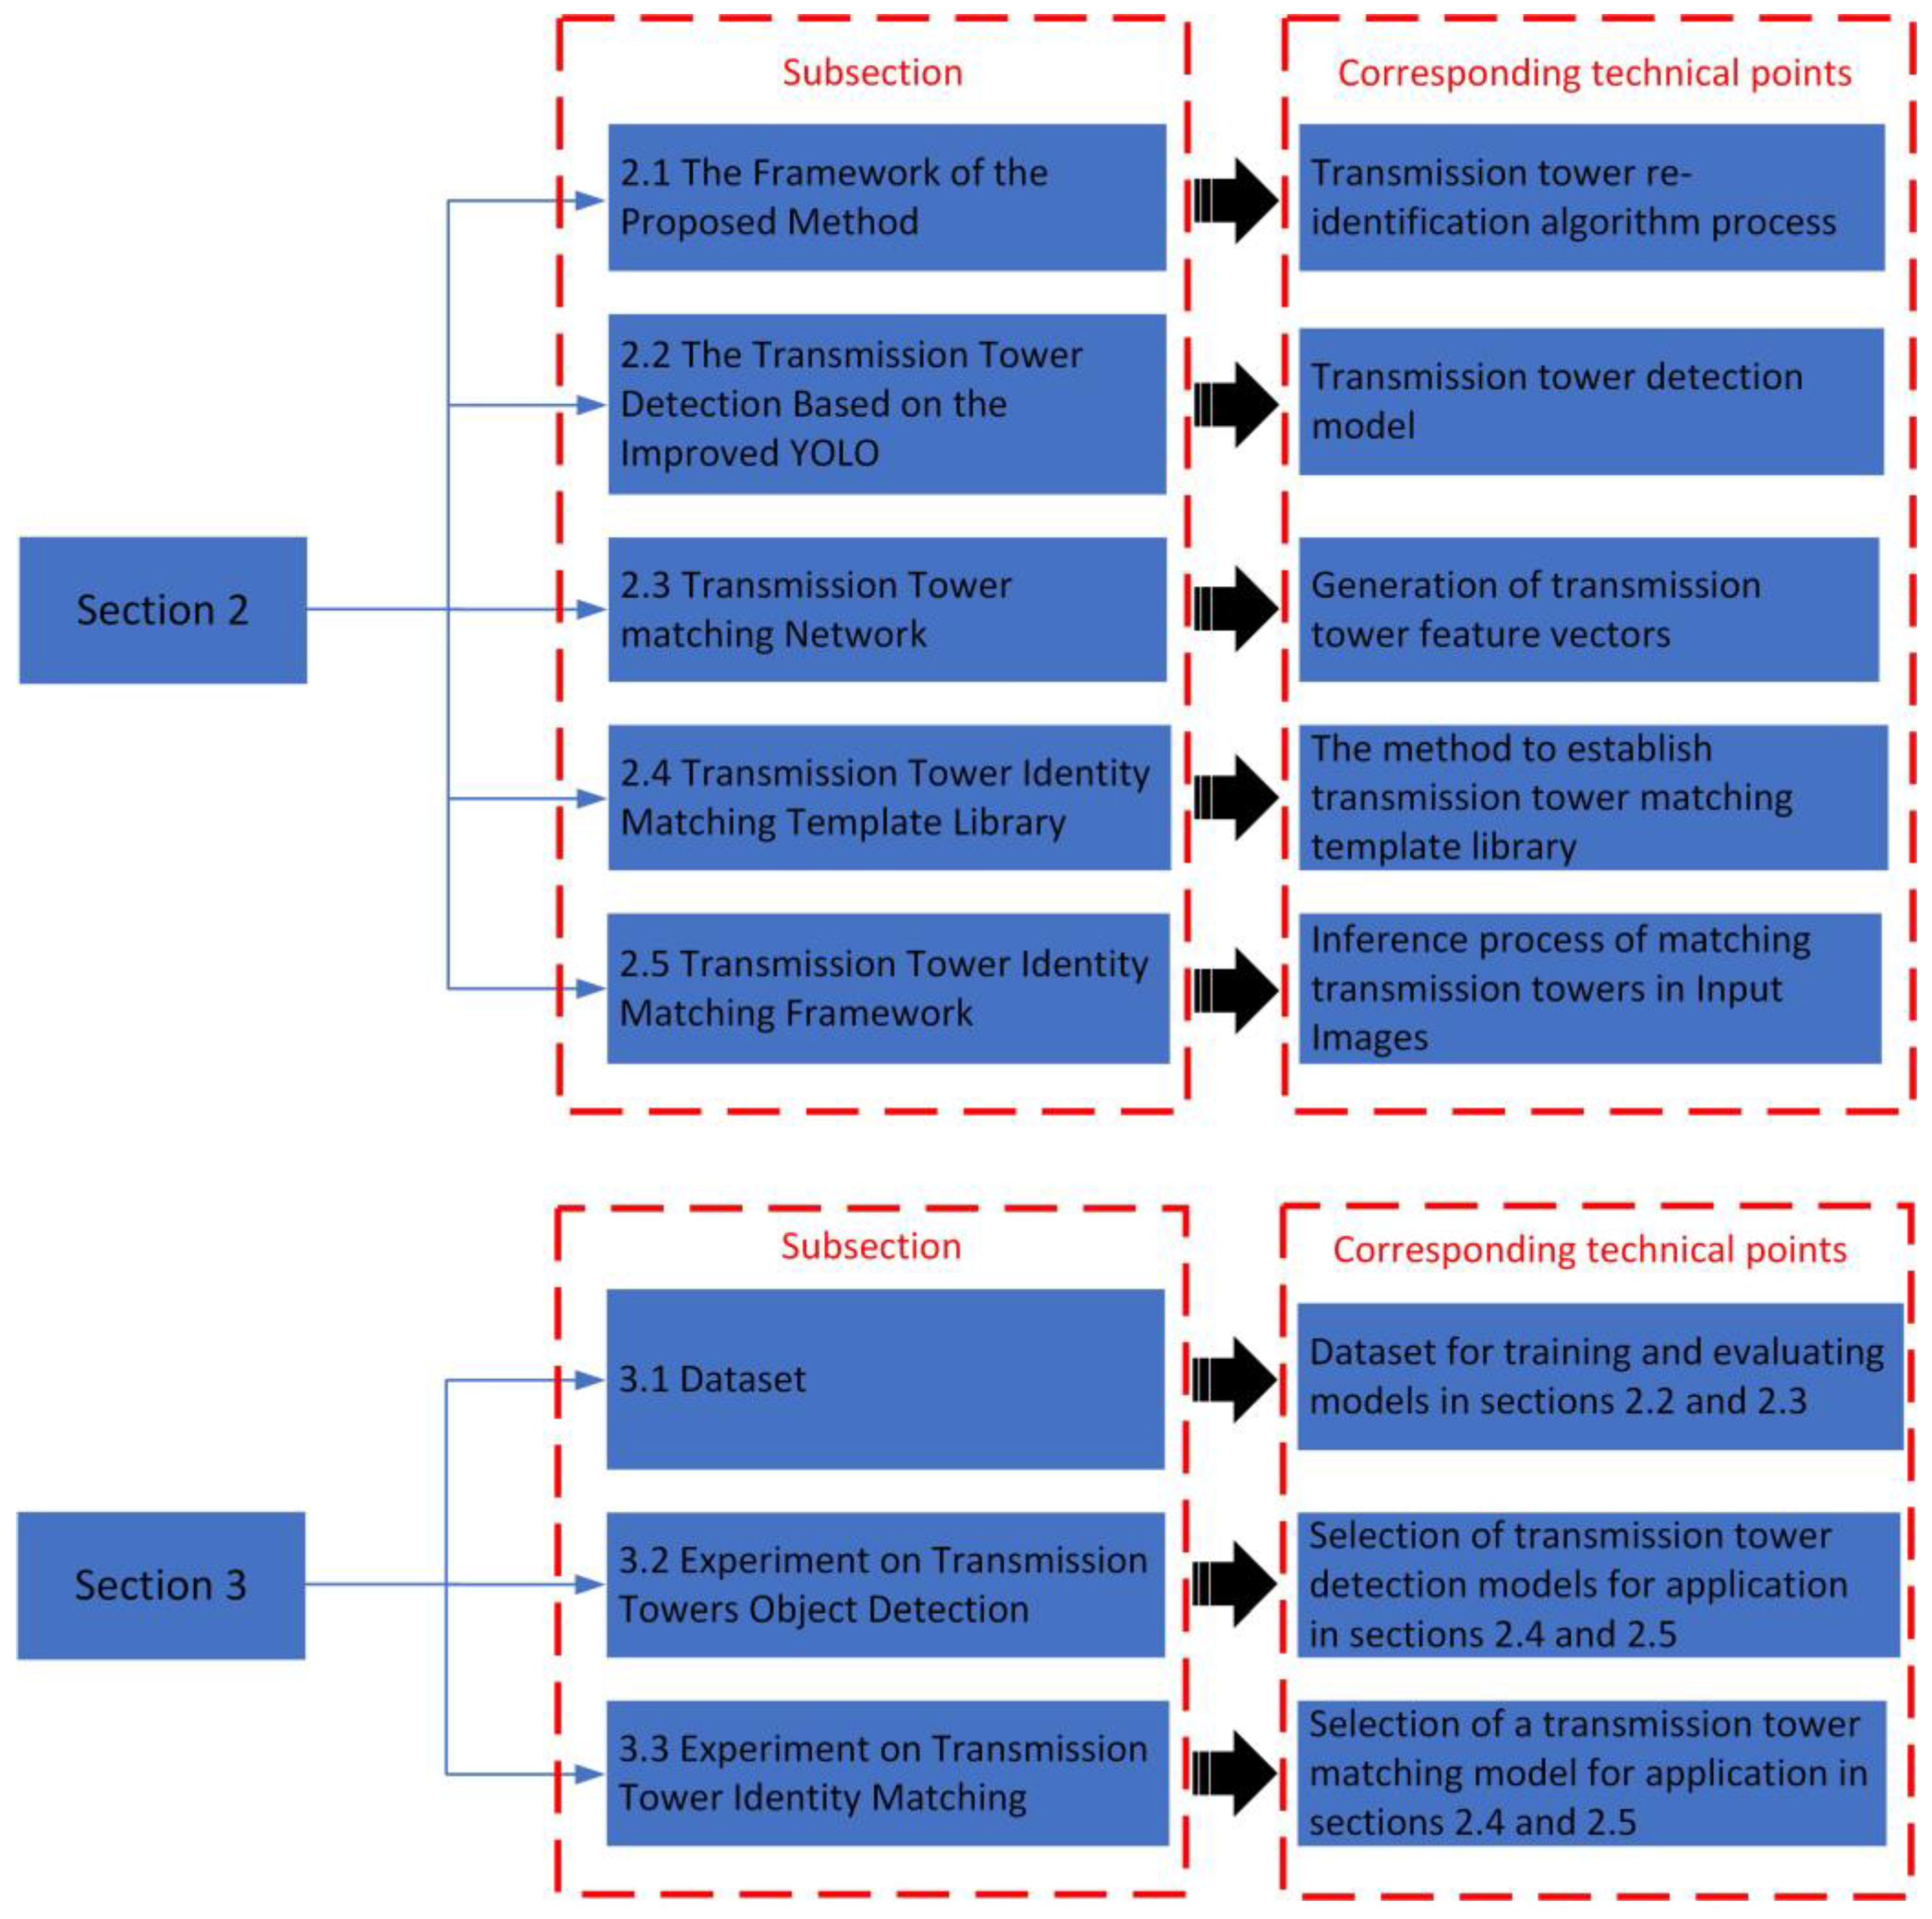
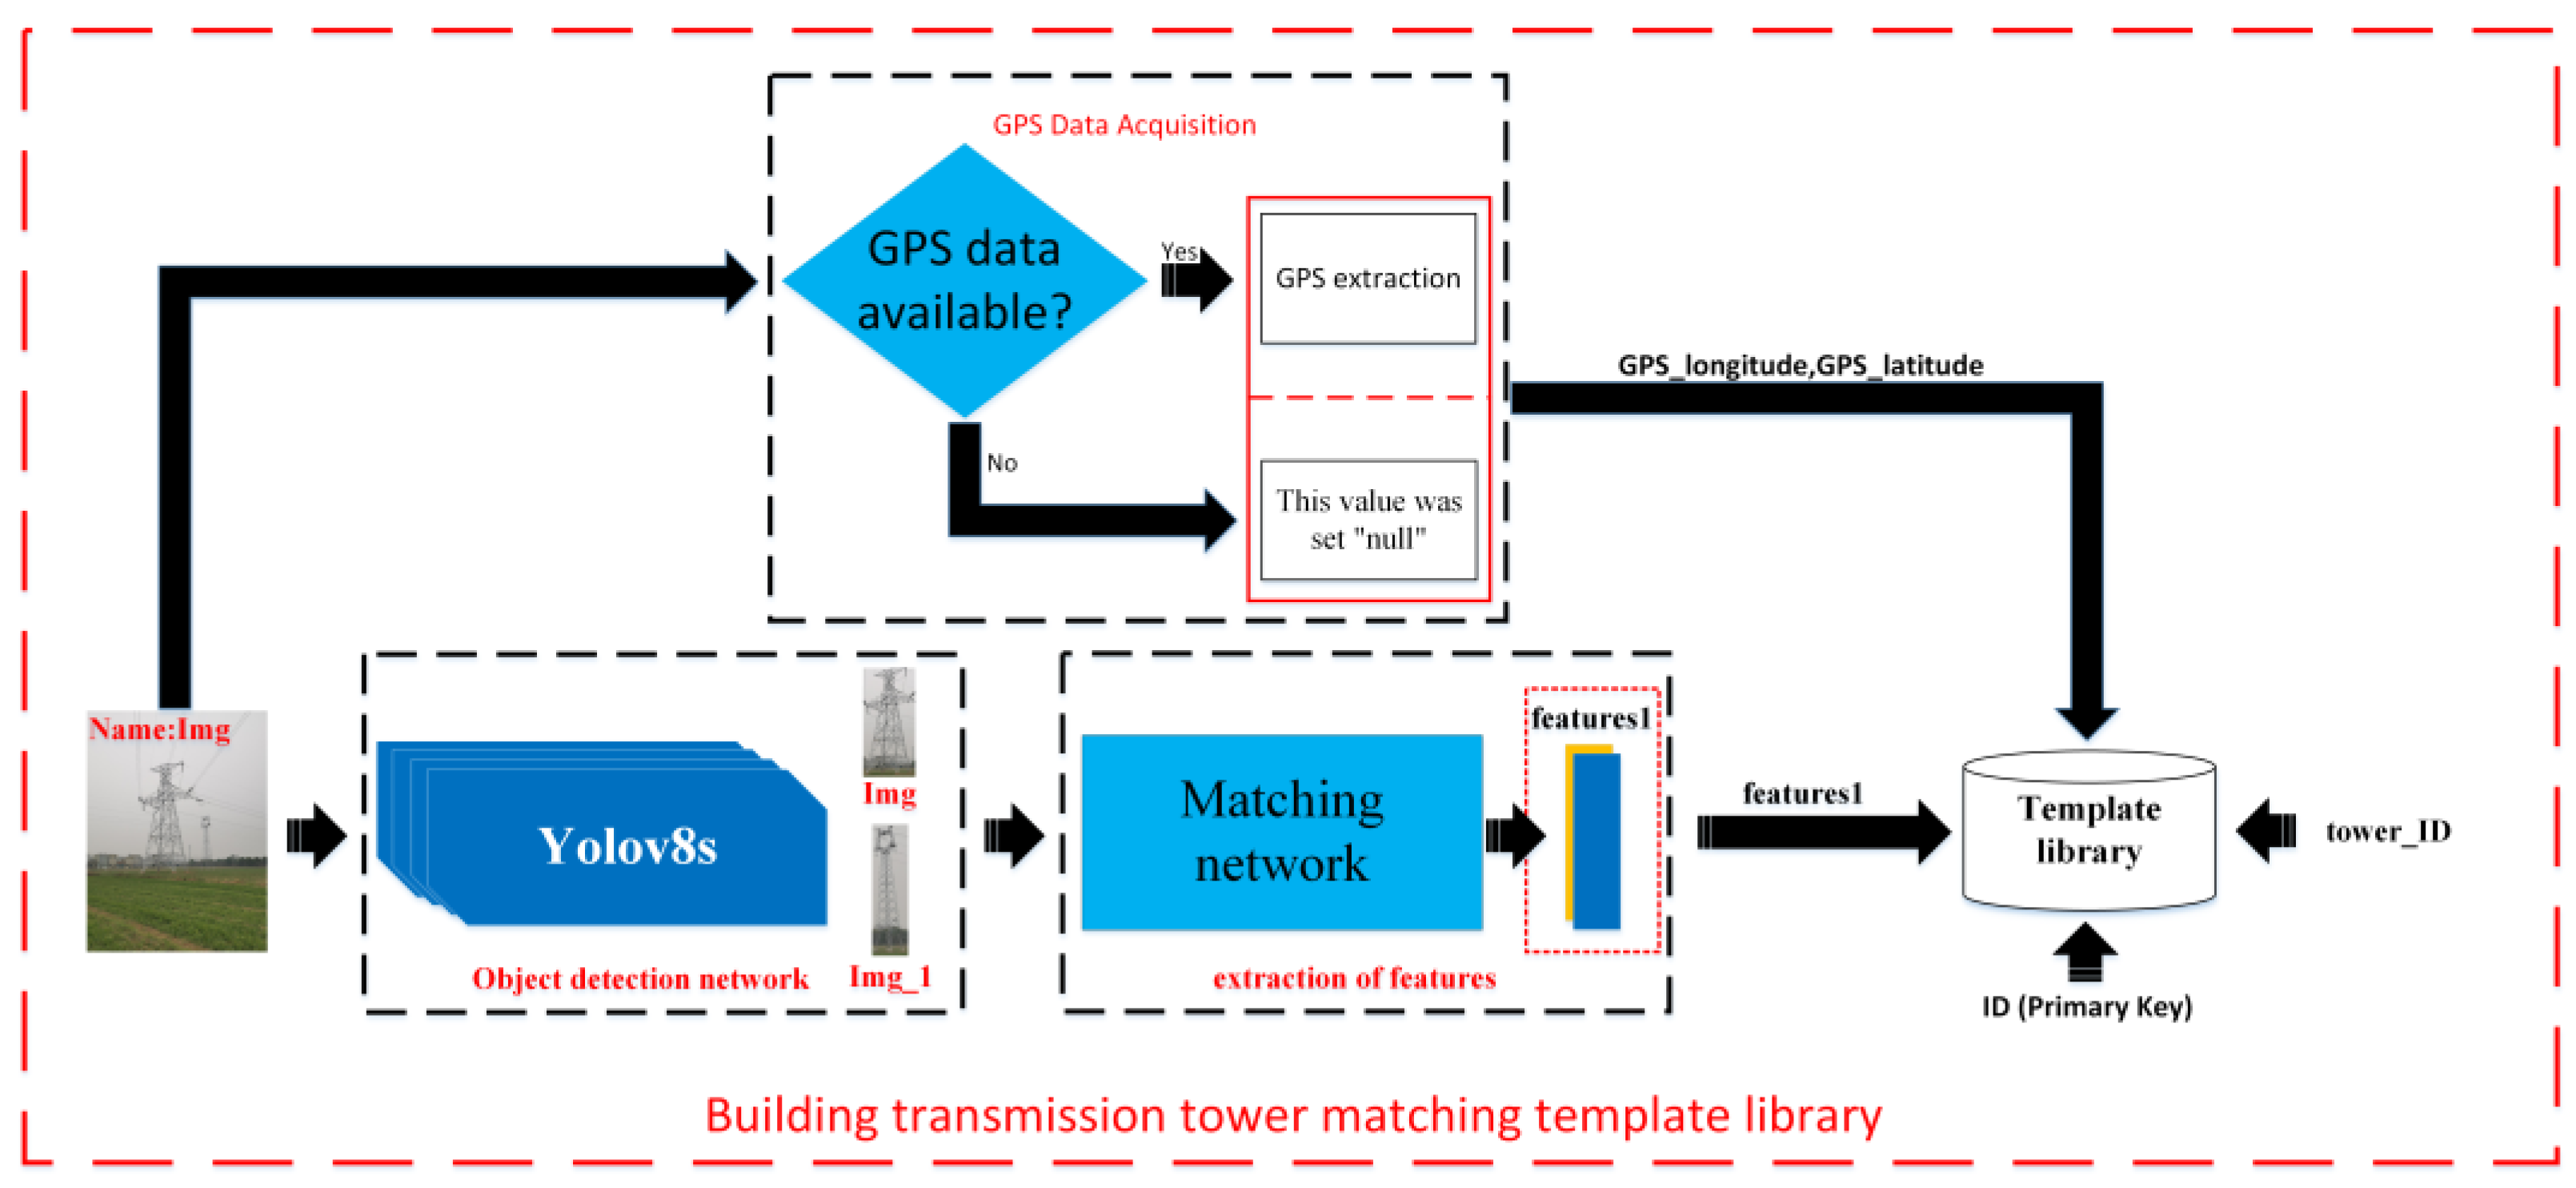
2.1. The Framework of the Proposed Method
- The YOLOv8s target detection network is used to crop the transmission tower from the images;
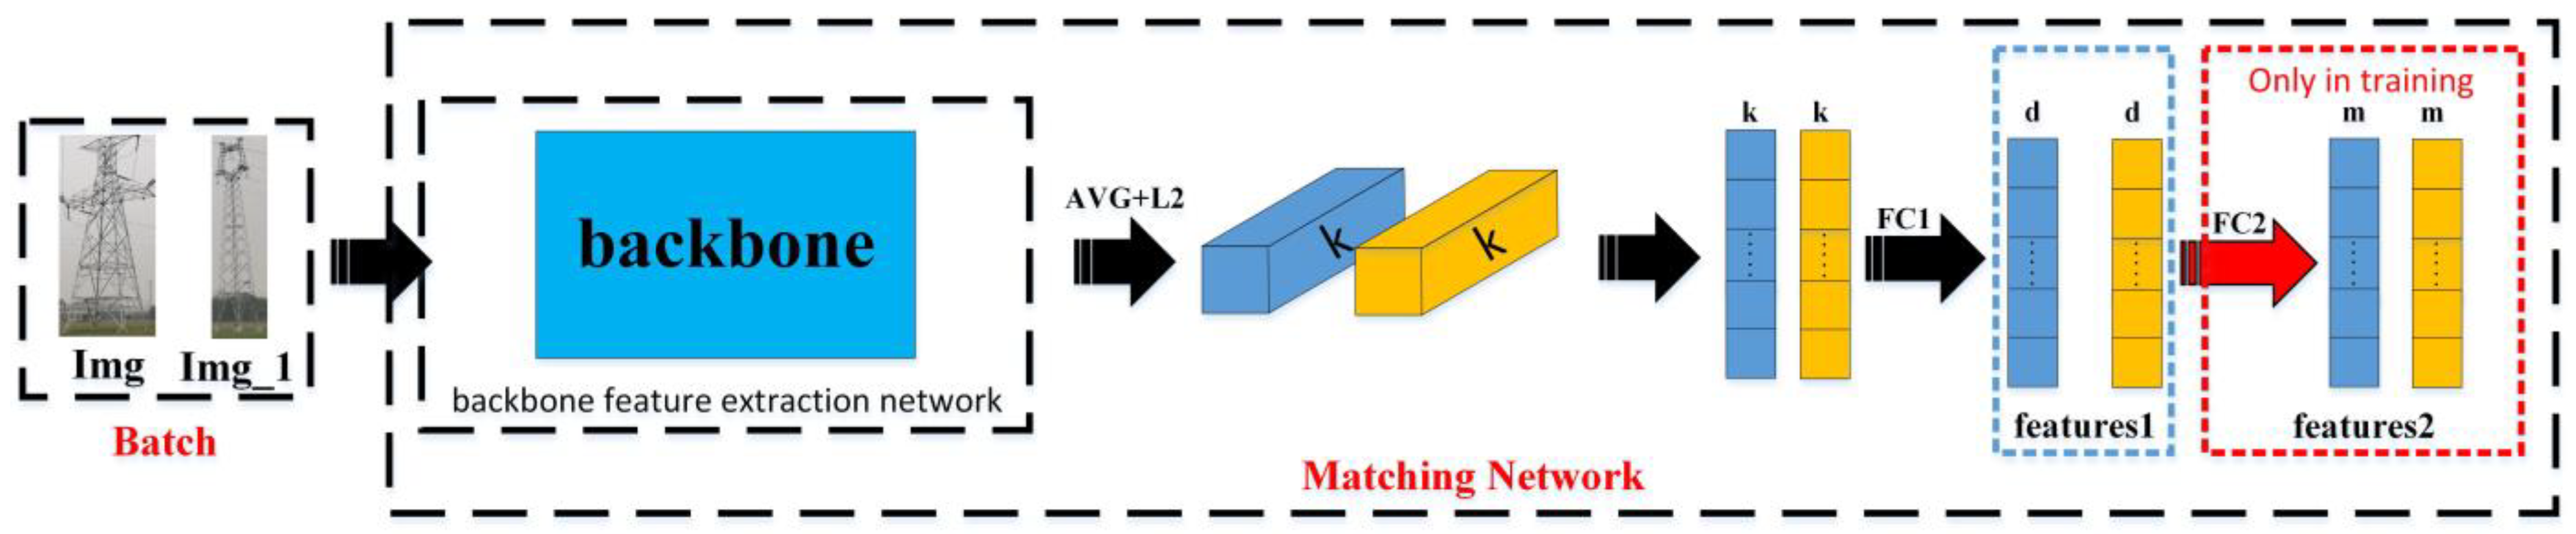
- The matching network, utilizing Inception-ResNet-v1 (d = 128) as its backbone, is employed to obtain the feature vector of the cropped transmission tower image;
- Positional information (GPS) is added to the transmission tower image; this item can be set to “null” in the absence of GPS;
- Based on the above information, a transmission tower identity matching template library is established.
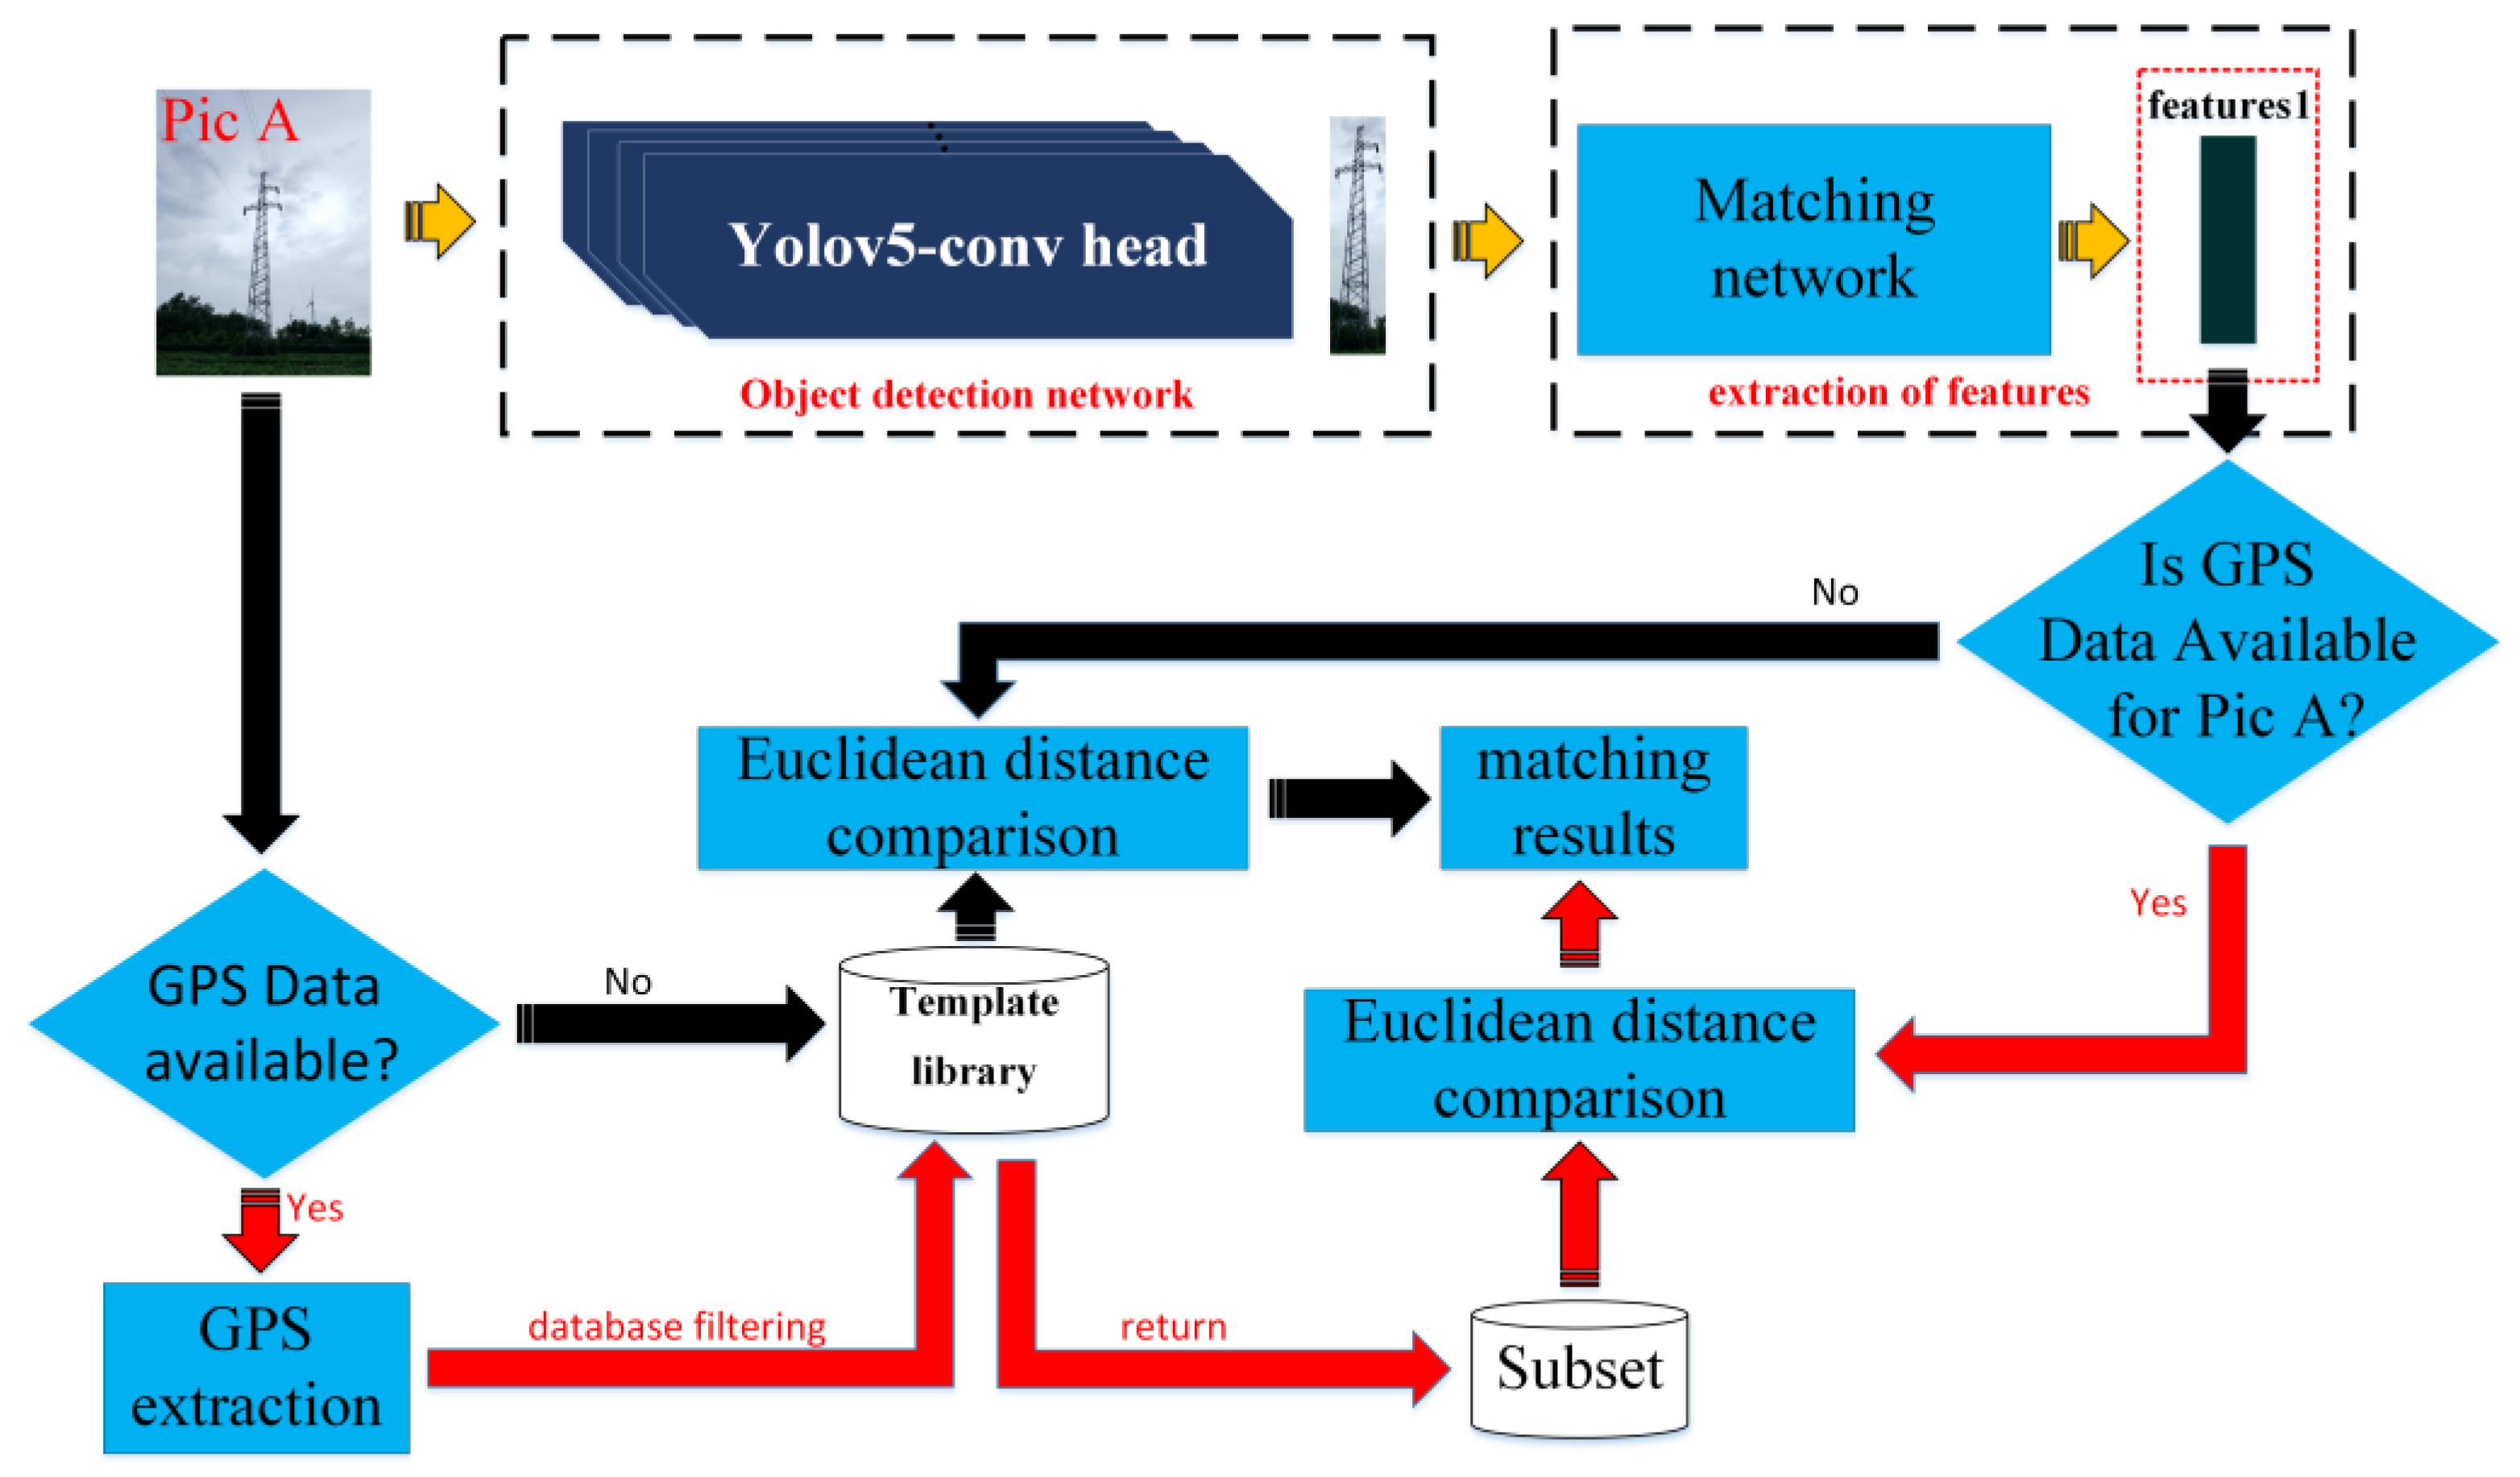
- The YOLOv5n-conv head network is employed to identify whether there is a transmission tower in the input images. If the input image contains transmission towers, the transmission towers are cropped from the image and processed through steps 2 and 3. If there is no tower, the image is skipped;
- The cropped transmission tower image is processed through the matching network, which employs Inception-ResNet-v1 (d = 128) as its backbone, to obtain the feature vector for matching;
- If the image designated for matching contains GPS data, images are filtered from the template library based on the GPS latitude and longitude. The feature vector awaiting matching is then matched with the images in this collection. If the original image lacks GPS information, the feature vector for matching is compared with all images in the template library for identity matching.
2.2. The Transmission Tower Detection Based on the Improved YOLO
2.2.1. Improvement of YOLOv5n
2.2.2. YOLOv8
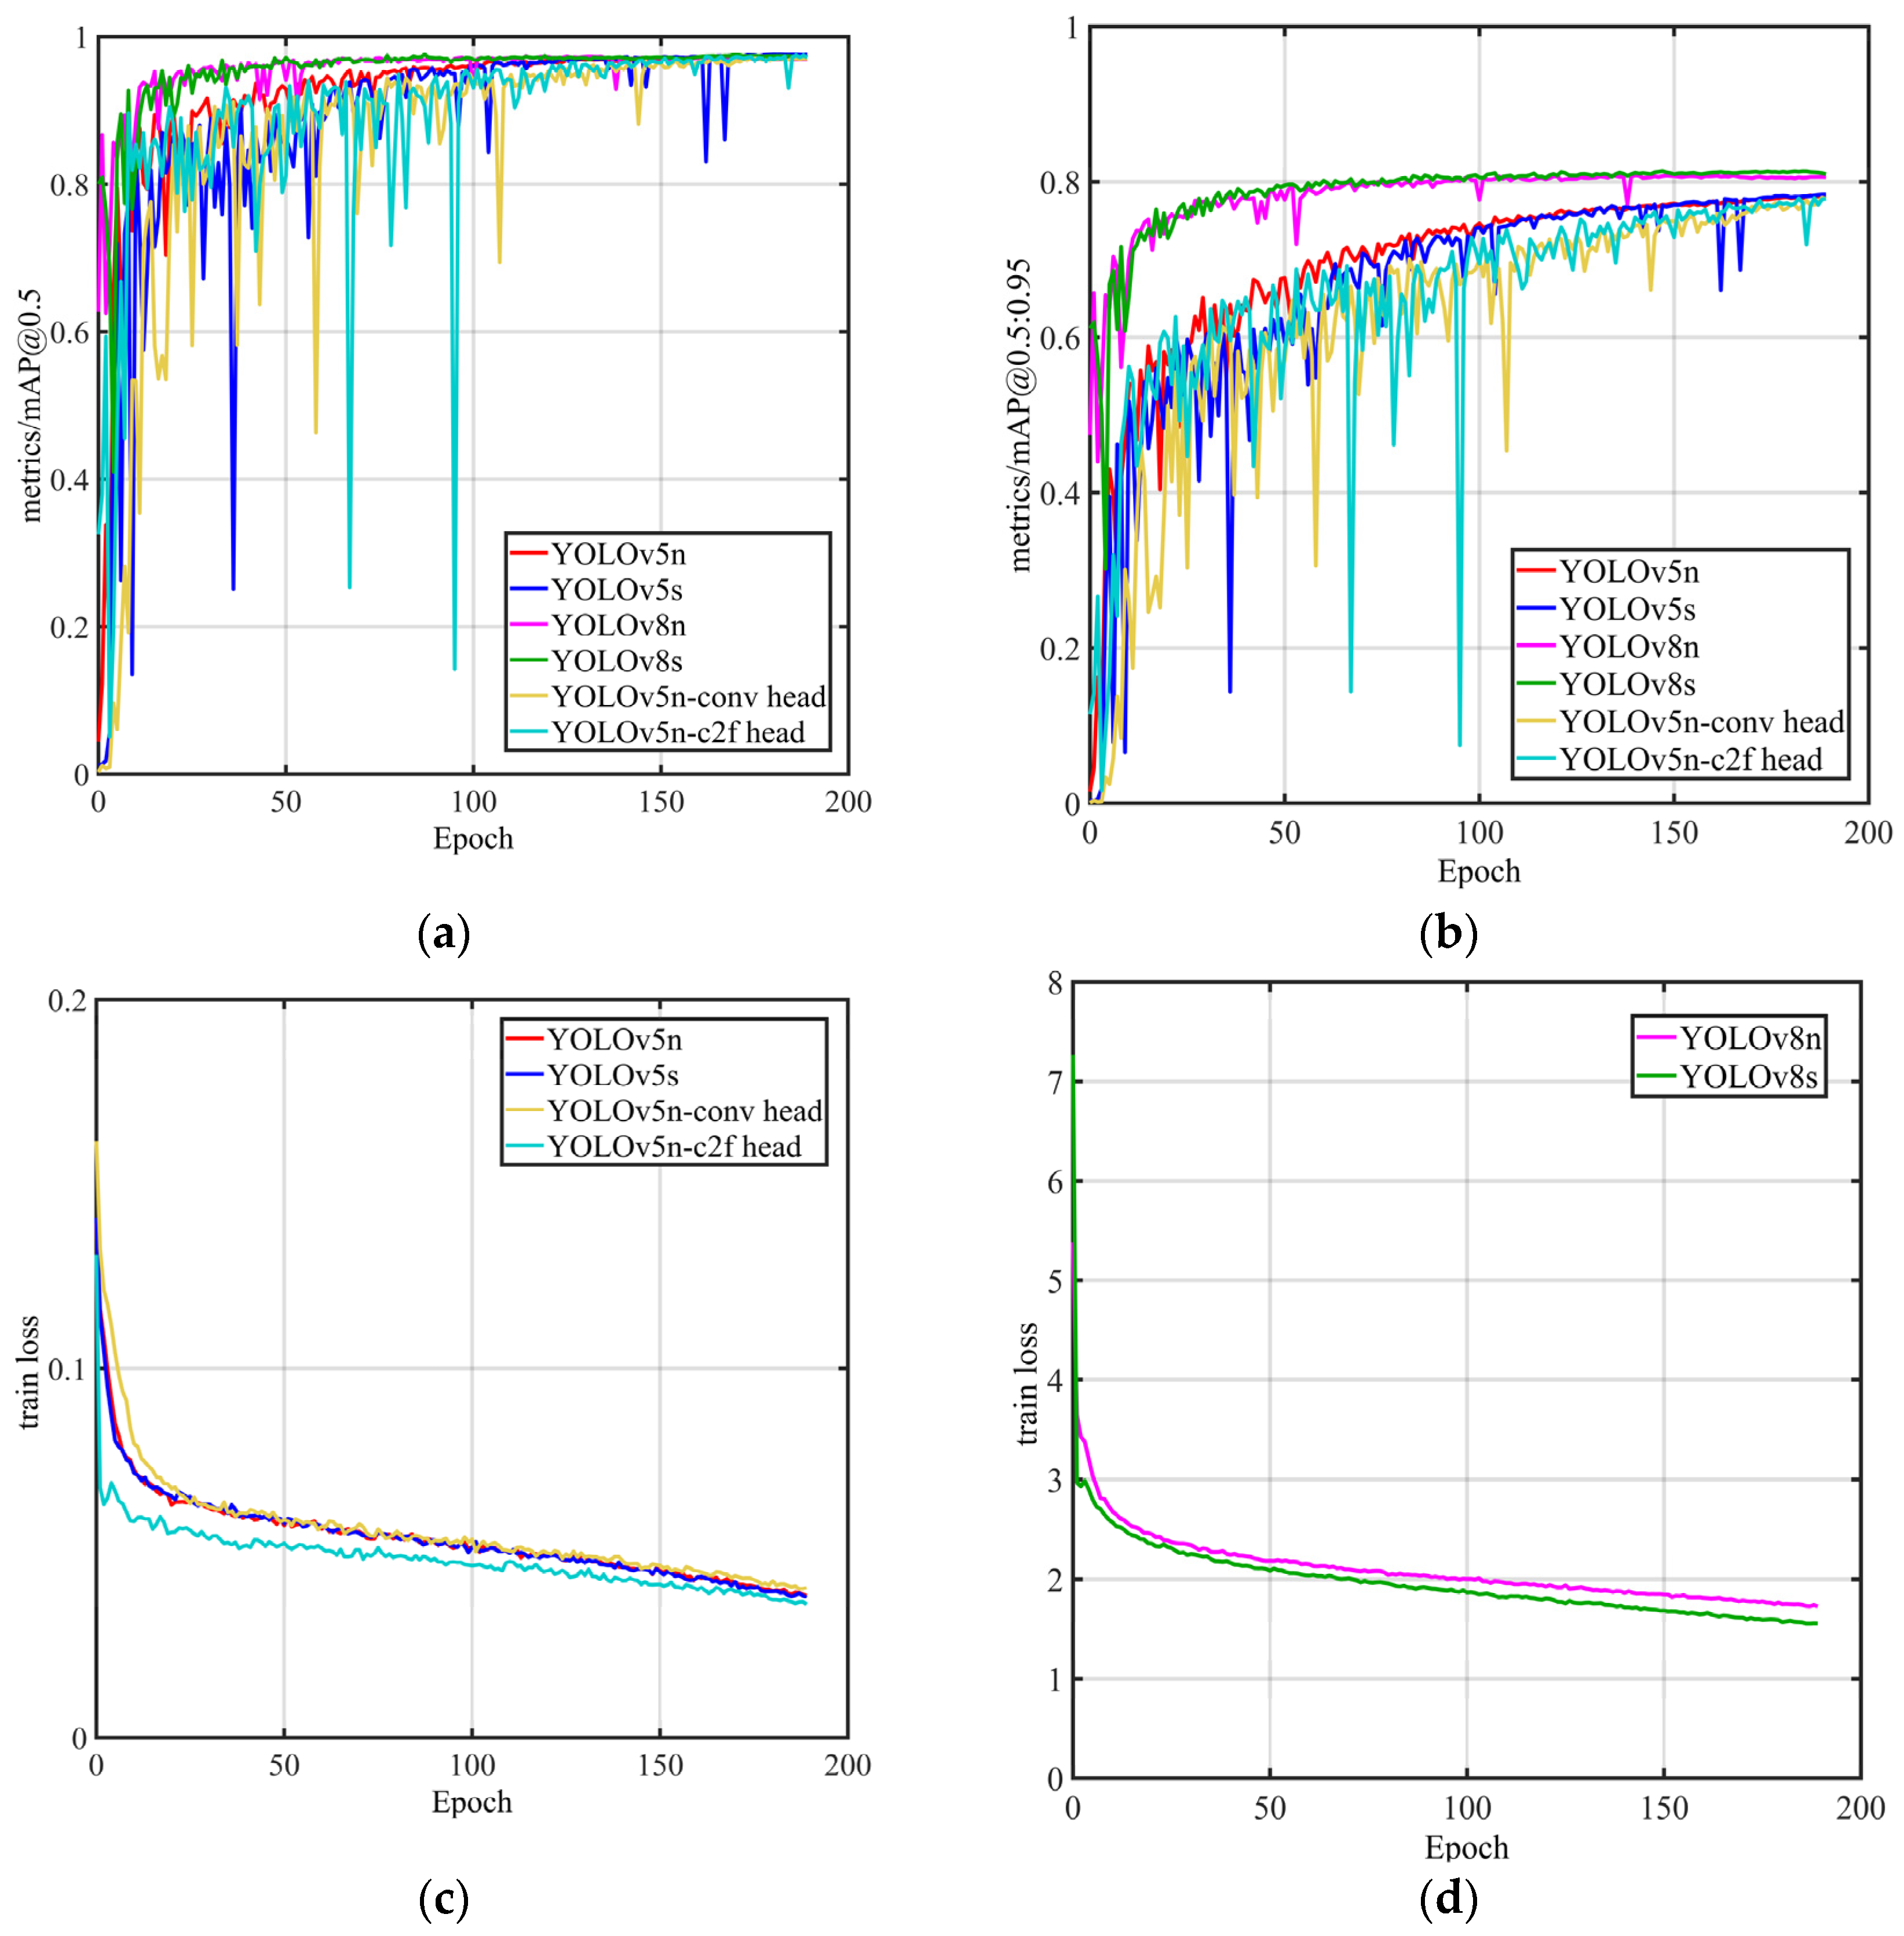
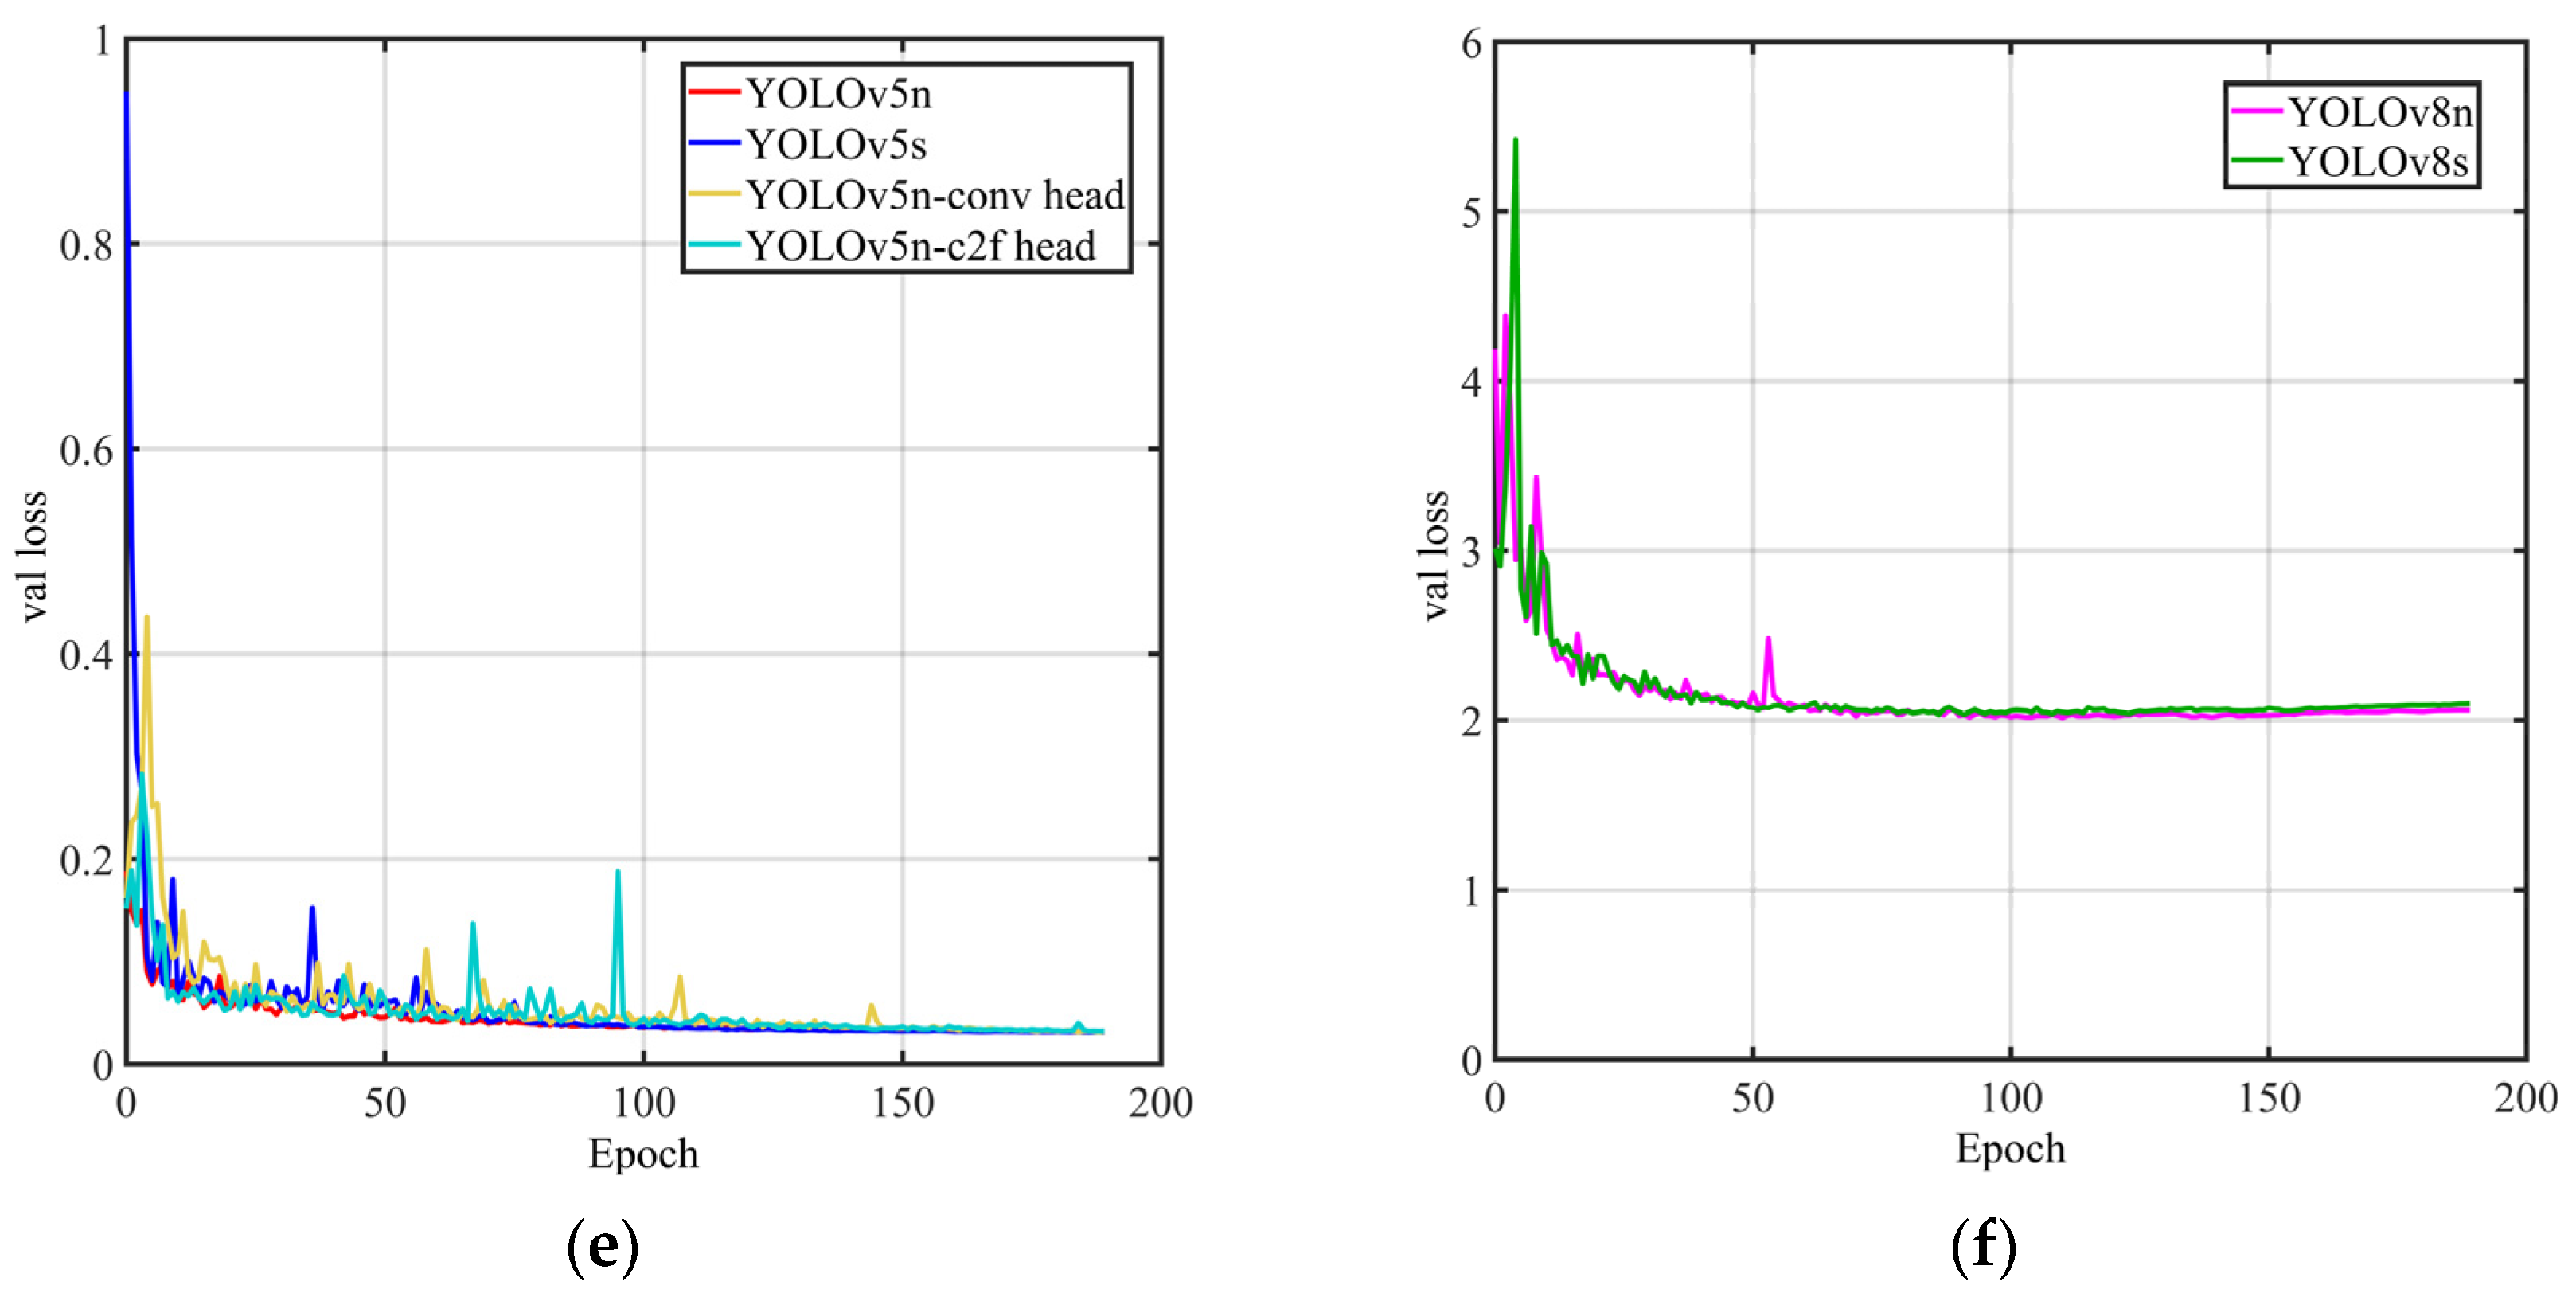
2.2.3. Transmission Tower Detection Model Evaluation
2.3. Transmission Tower matching Network
2.3.1. Matching Network Architecture
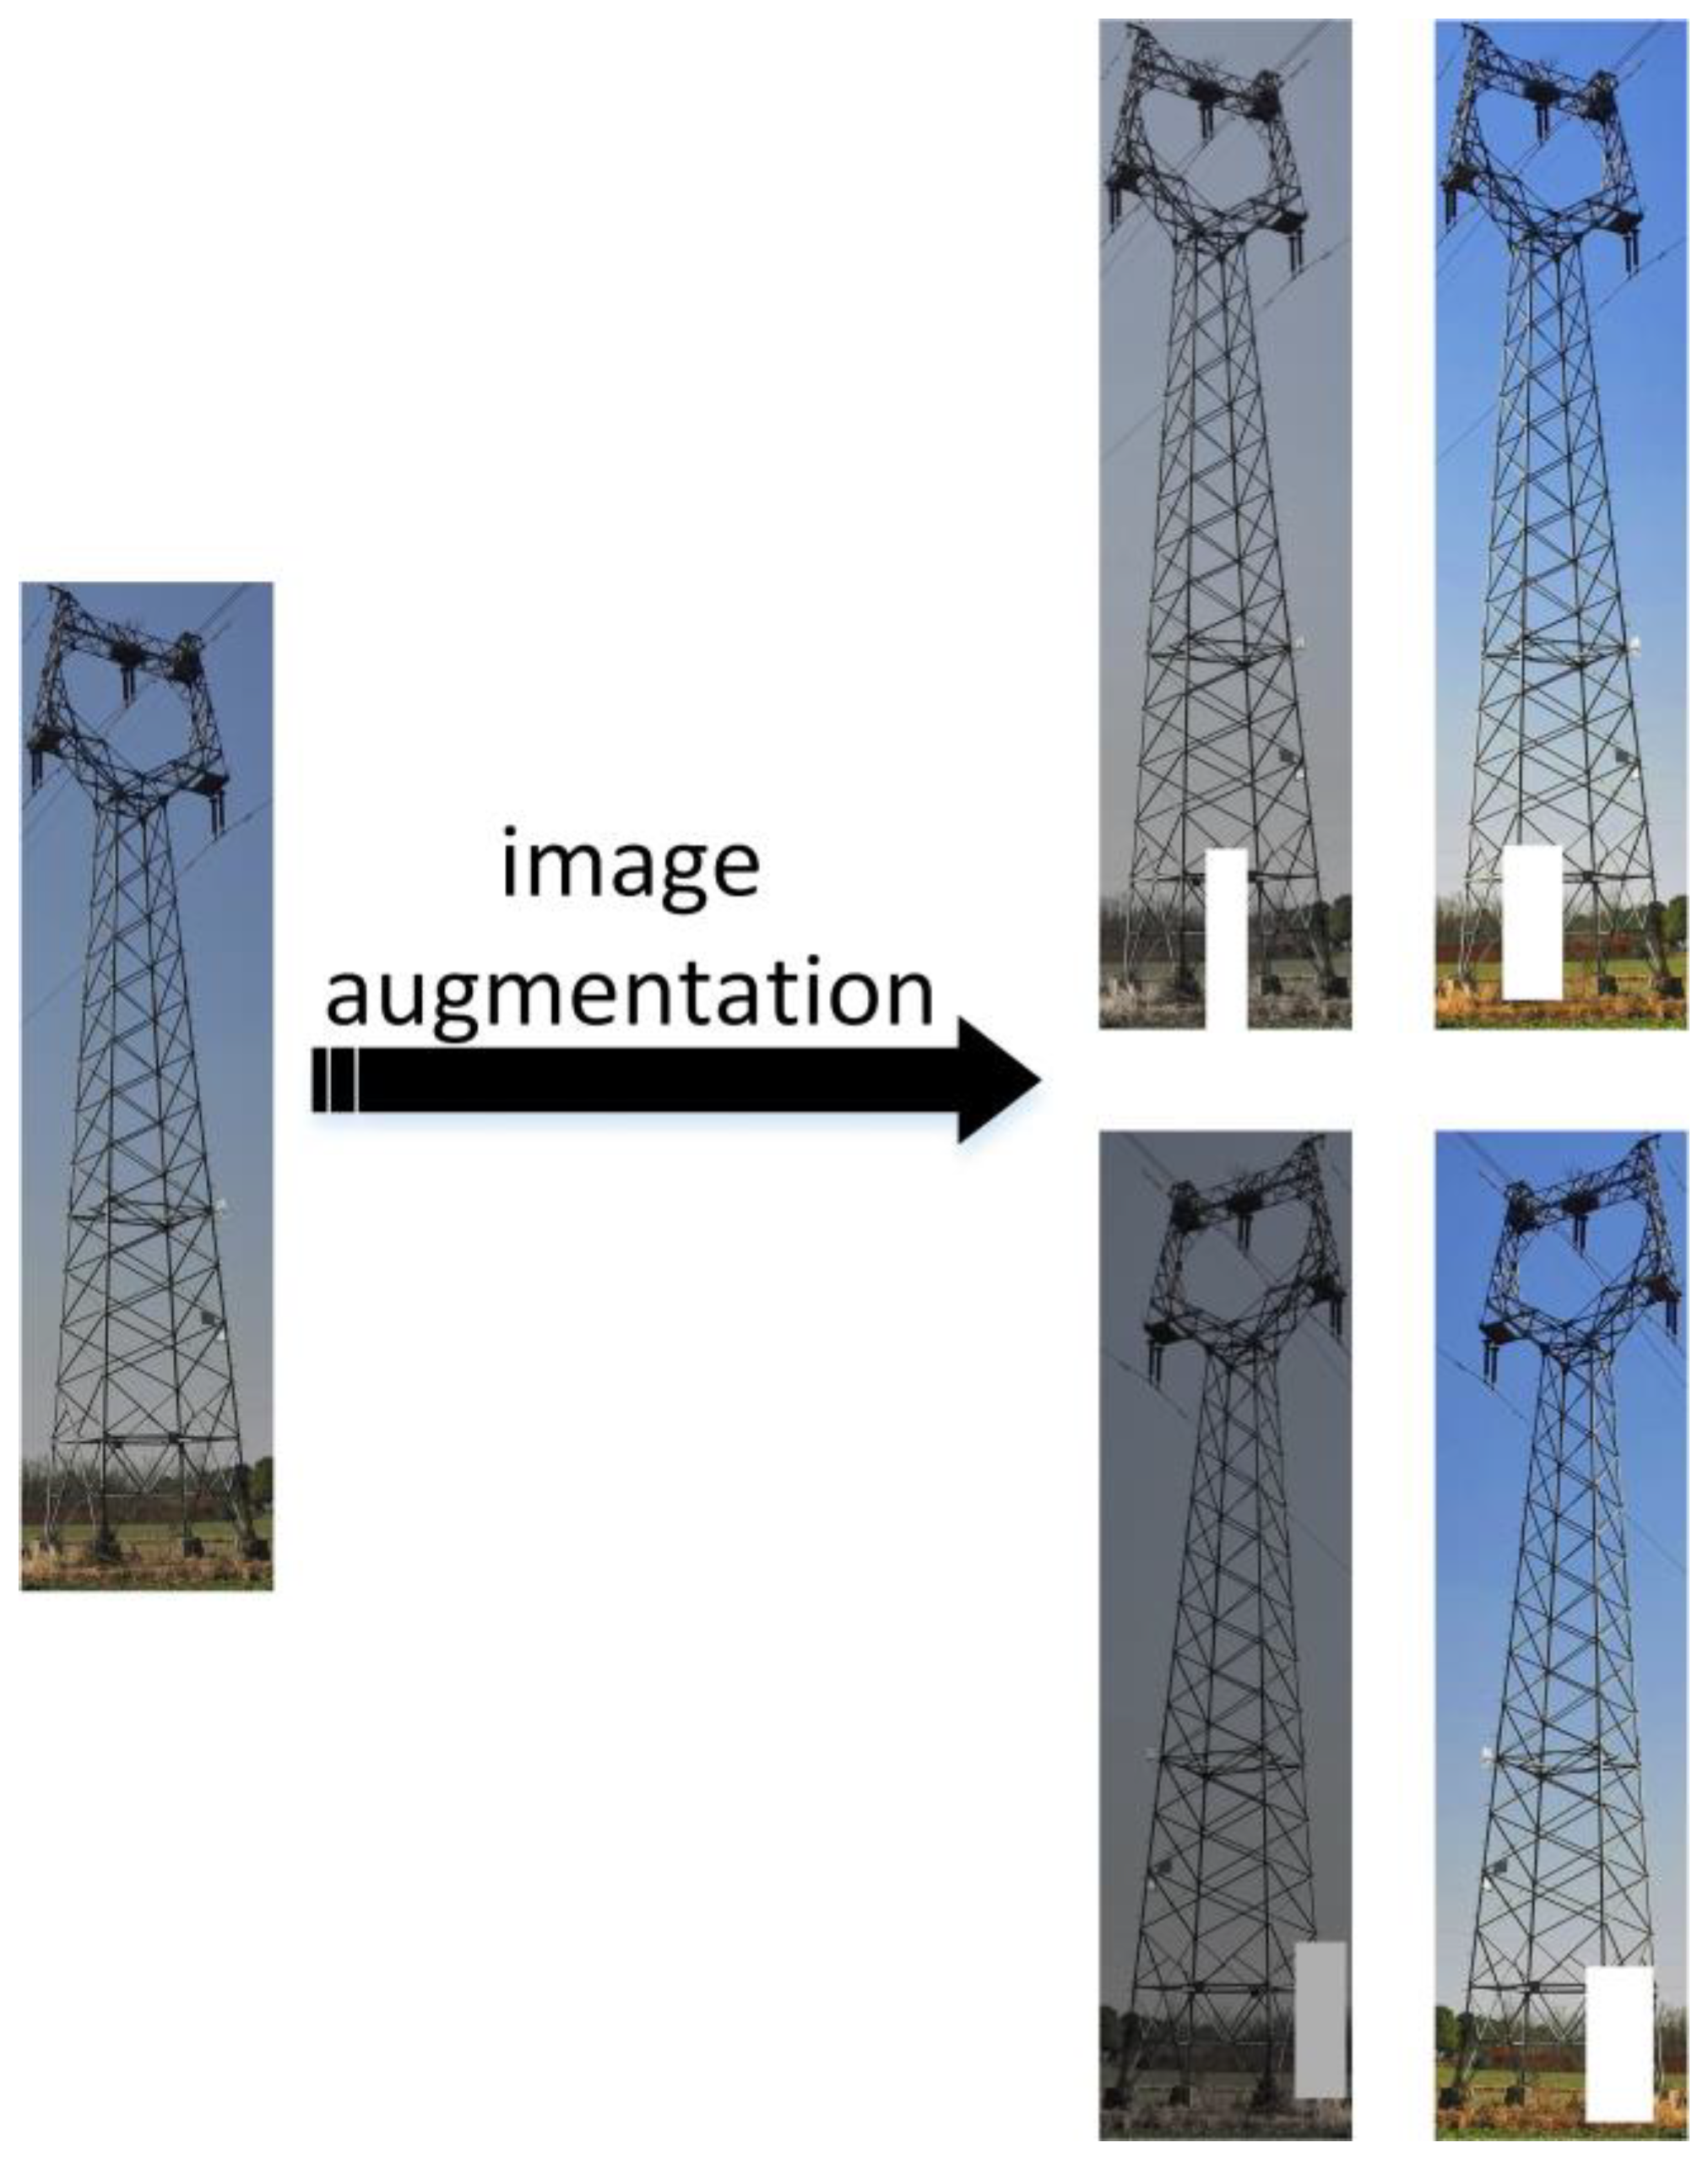
2.3.2. Training Dataset Image Augmentation
2.3.3. Triplets Generation Strategy Based on Dynamic Negative Allocation
2.3.4. Matching Network Loss Function
2.3.5. Matching Network Training Method
2.3.6. Matching Similarity Evaluation
2.3.7. Matching Accuracy Evaluation
2.4. Transmission Tower Identity Matching Template Library
2.5. Transmission Tower Identity Matching Framework
| Algorithm 1 Identifying the transmission tower in the input image |
| input: input_image(A) output: result # Step 1: Detect and Crop the input image to get transmission tower instances tower_instances=YOLOv5_conv_head(input_image) if tower_instances=[]: return “null” # Step 2: Extract feature vector using matching network input_features1= Matching_Network(tower_instances) # Step 3: Check if input image has GPS information if input_image. GPS(): # Use GPS information to filter template library candidate_set = FilterDatabaseUsingGPS(input_image.GPS_data) else: #Use the entire template library candidate_set = EntireTemplateLibrary result=[] # Step 4: Compare feature vector with candidate set using Euclidean distance For tower_feature in input_features1: min_distance = INFINITY best_match = NULL for template in candidate_set: distance = EuclideanDistance(tower_feature, template. features1) if distance < min_distance: min_distance = distance best_match = template.tower_ID # Step 5: Determine if the transmission tower is in the template library or not if min_distance > 1: answer=“null” else: answers= best_match result.append(answer) return result |
3. Experiment and Analysis
3.1. Dataset
3.1.1. Object Detection Dataset
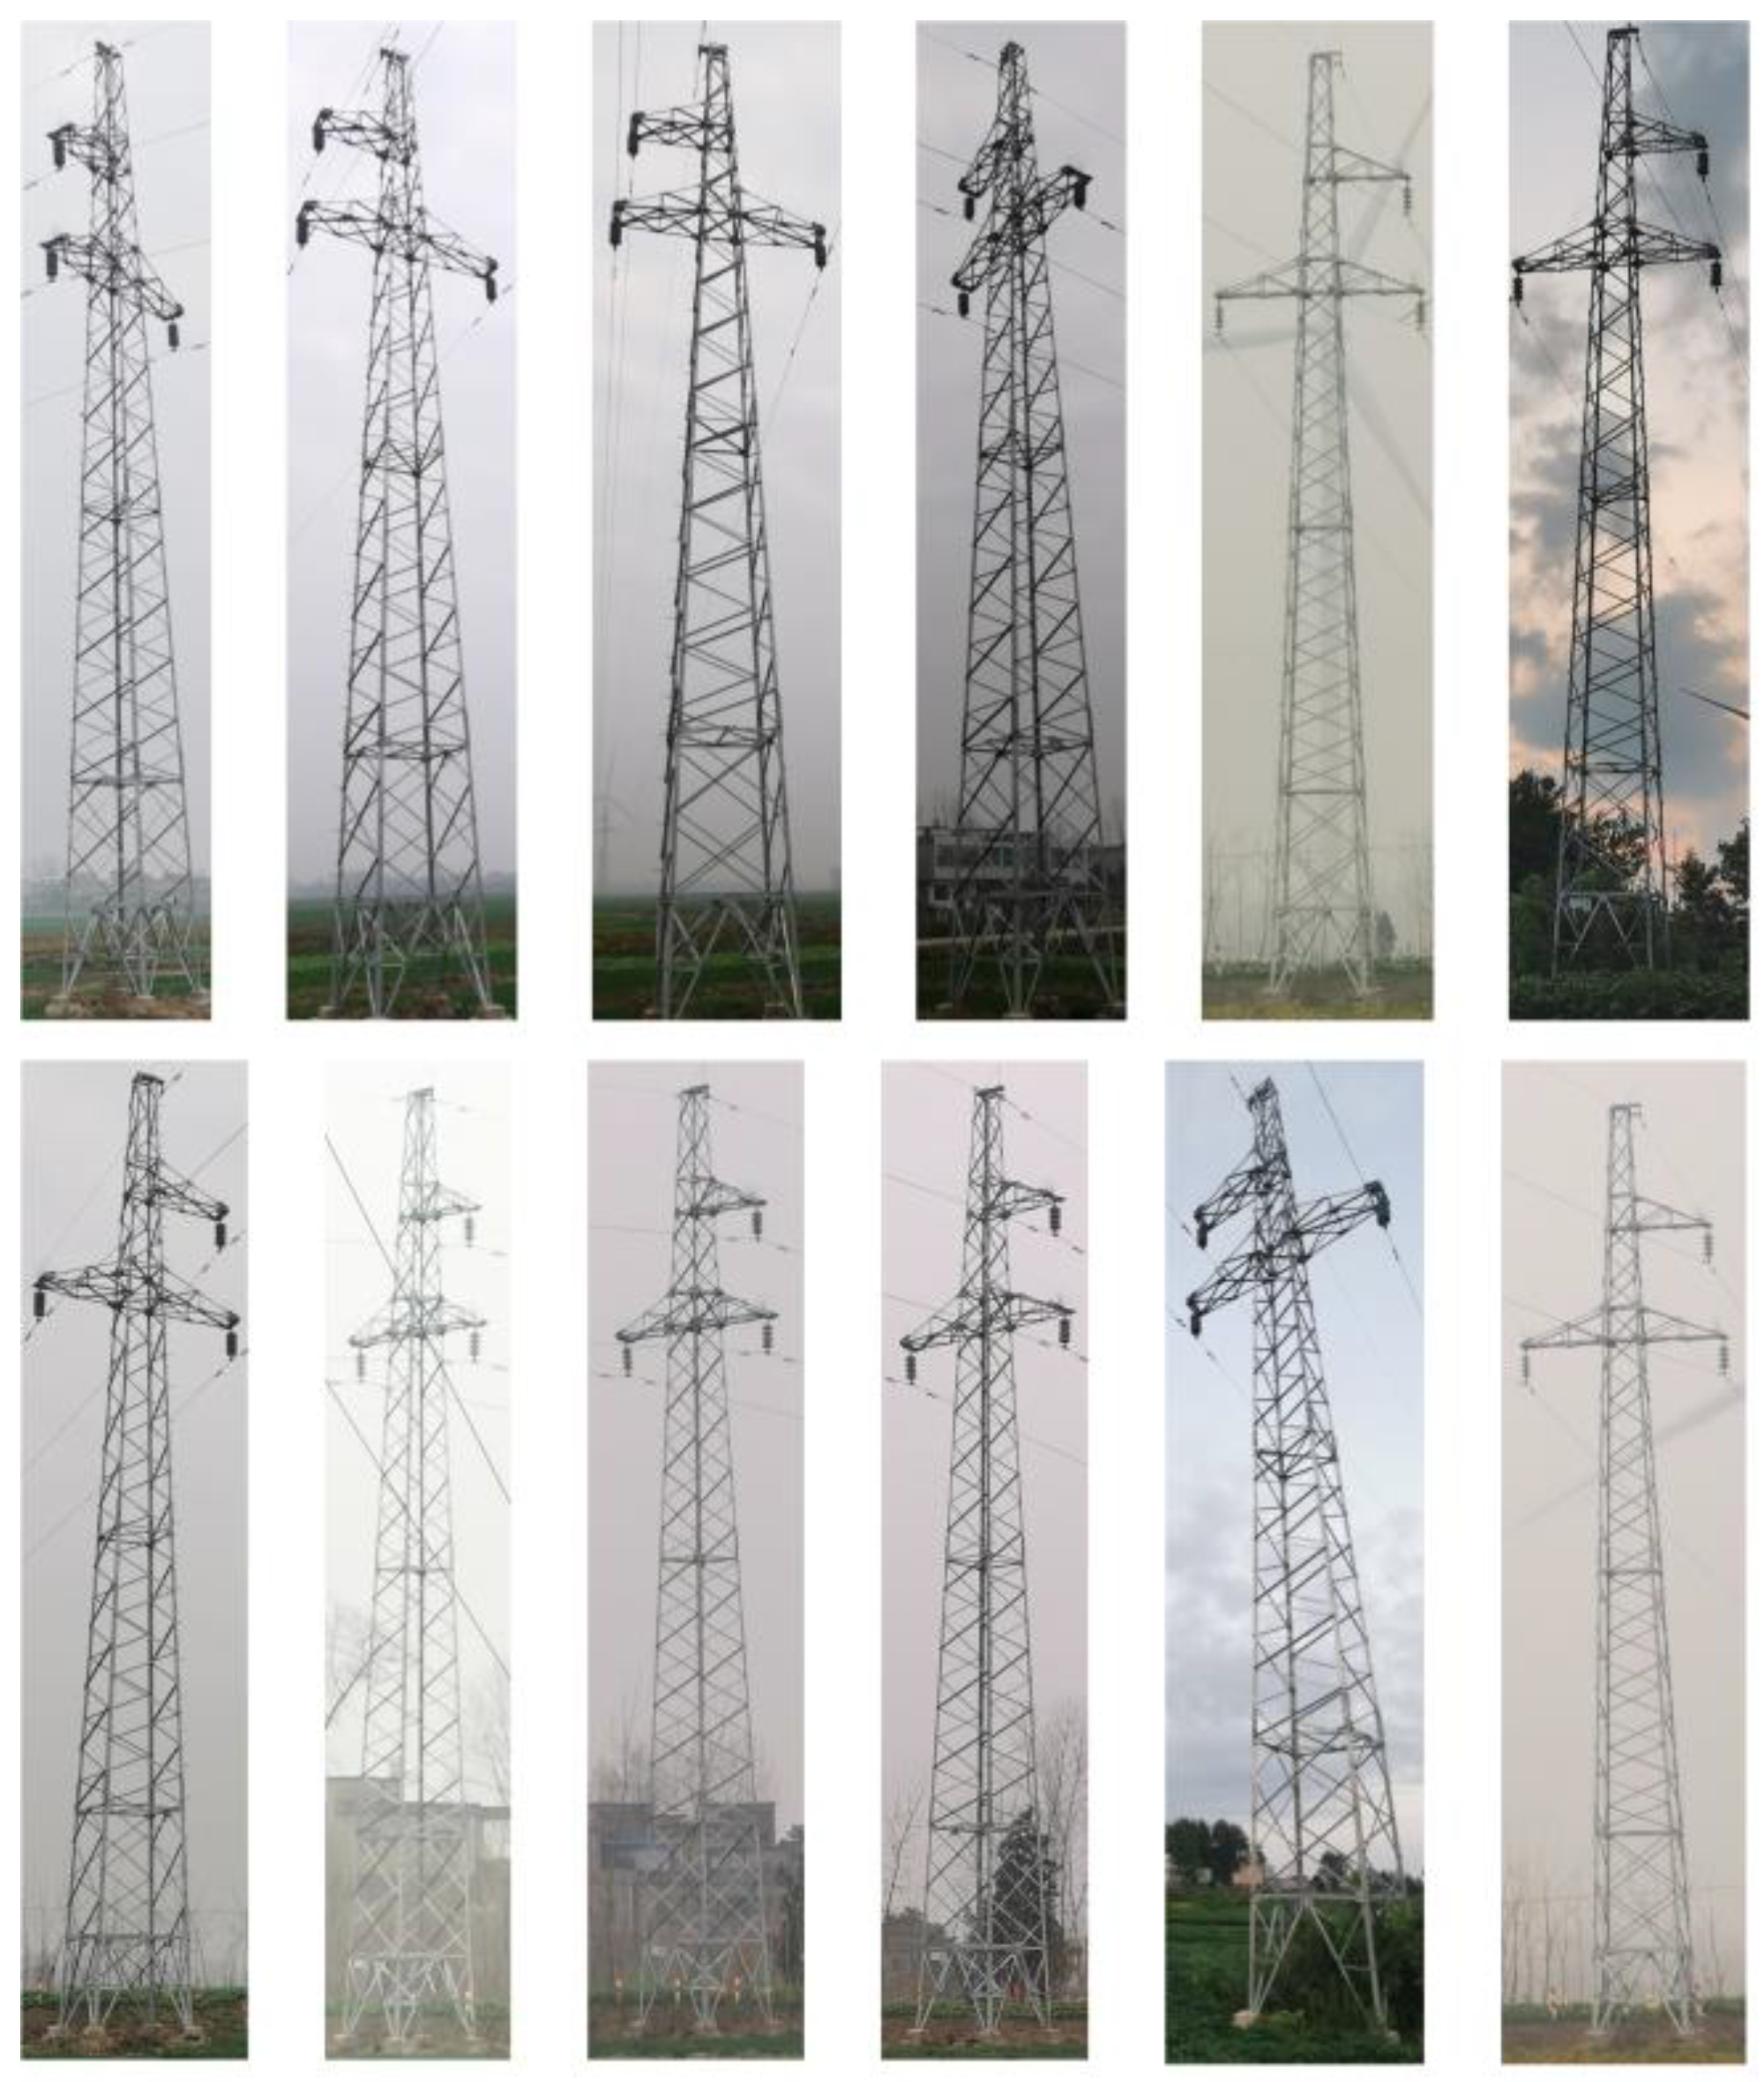
3.1.2. Matching Dataset
3.2. Experiment on Transmission Tower Object Detection
3.2.1. Model Training
3.2.2. Model Evaluation and Result Analysis
3.3. Experiment on Transmission Tower Identity Matching
3.3.1. Model Training
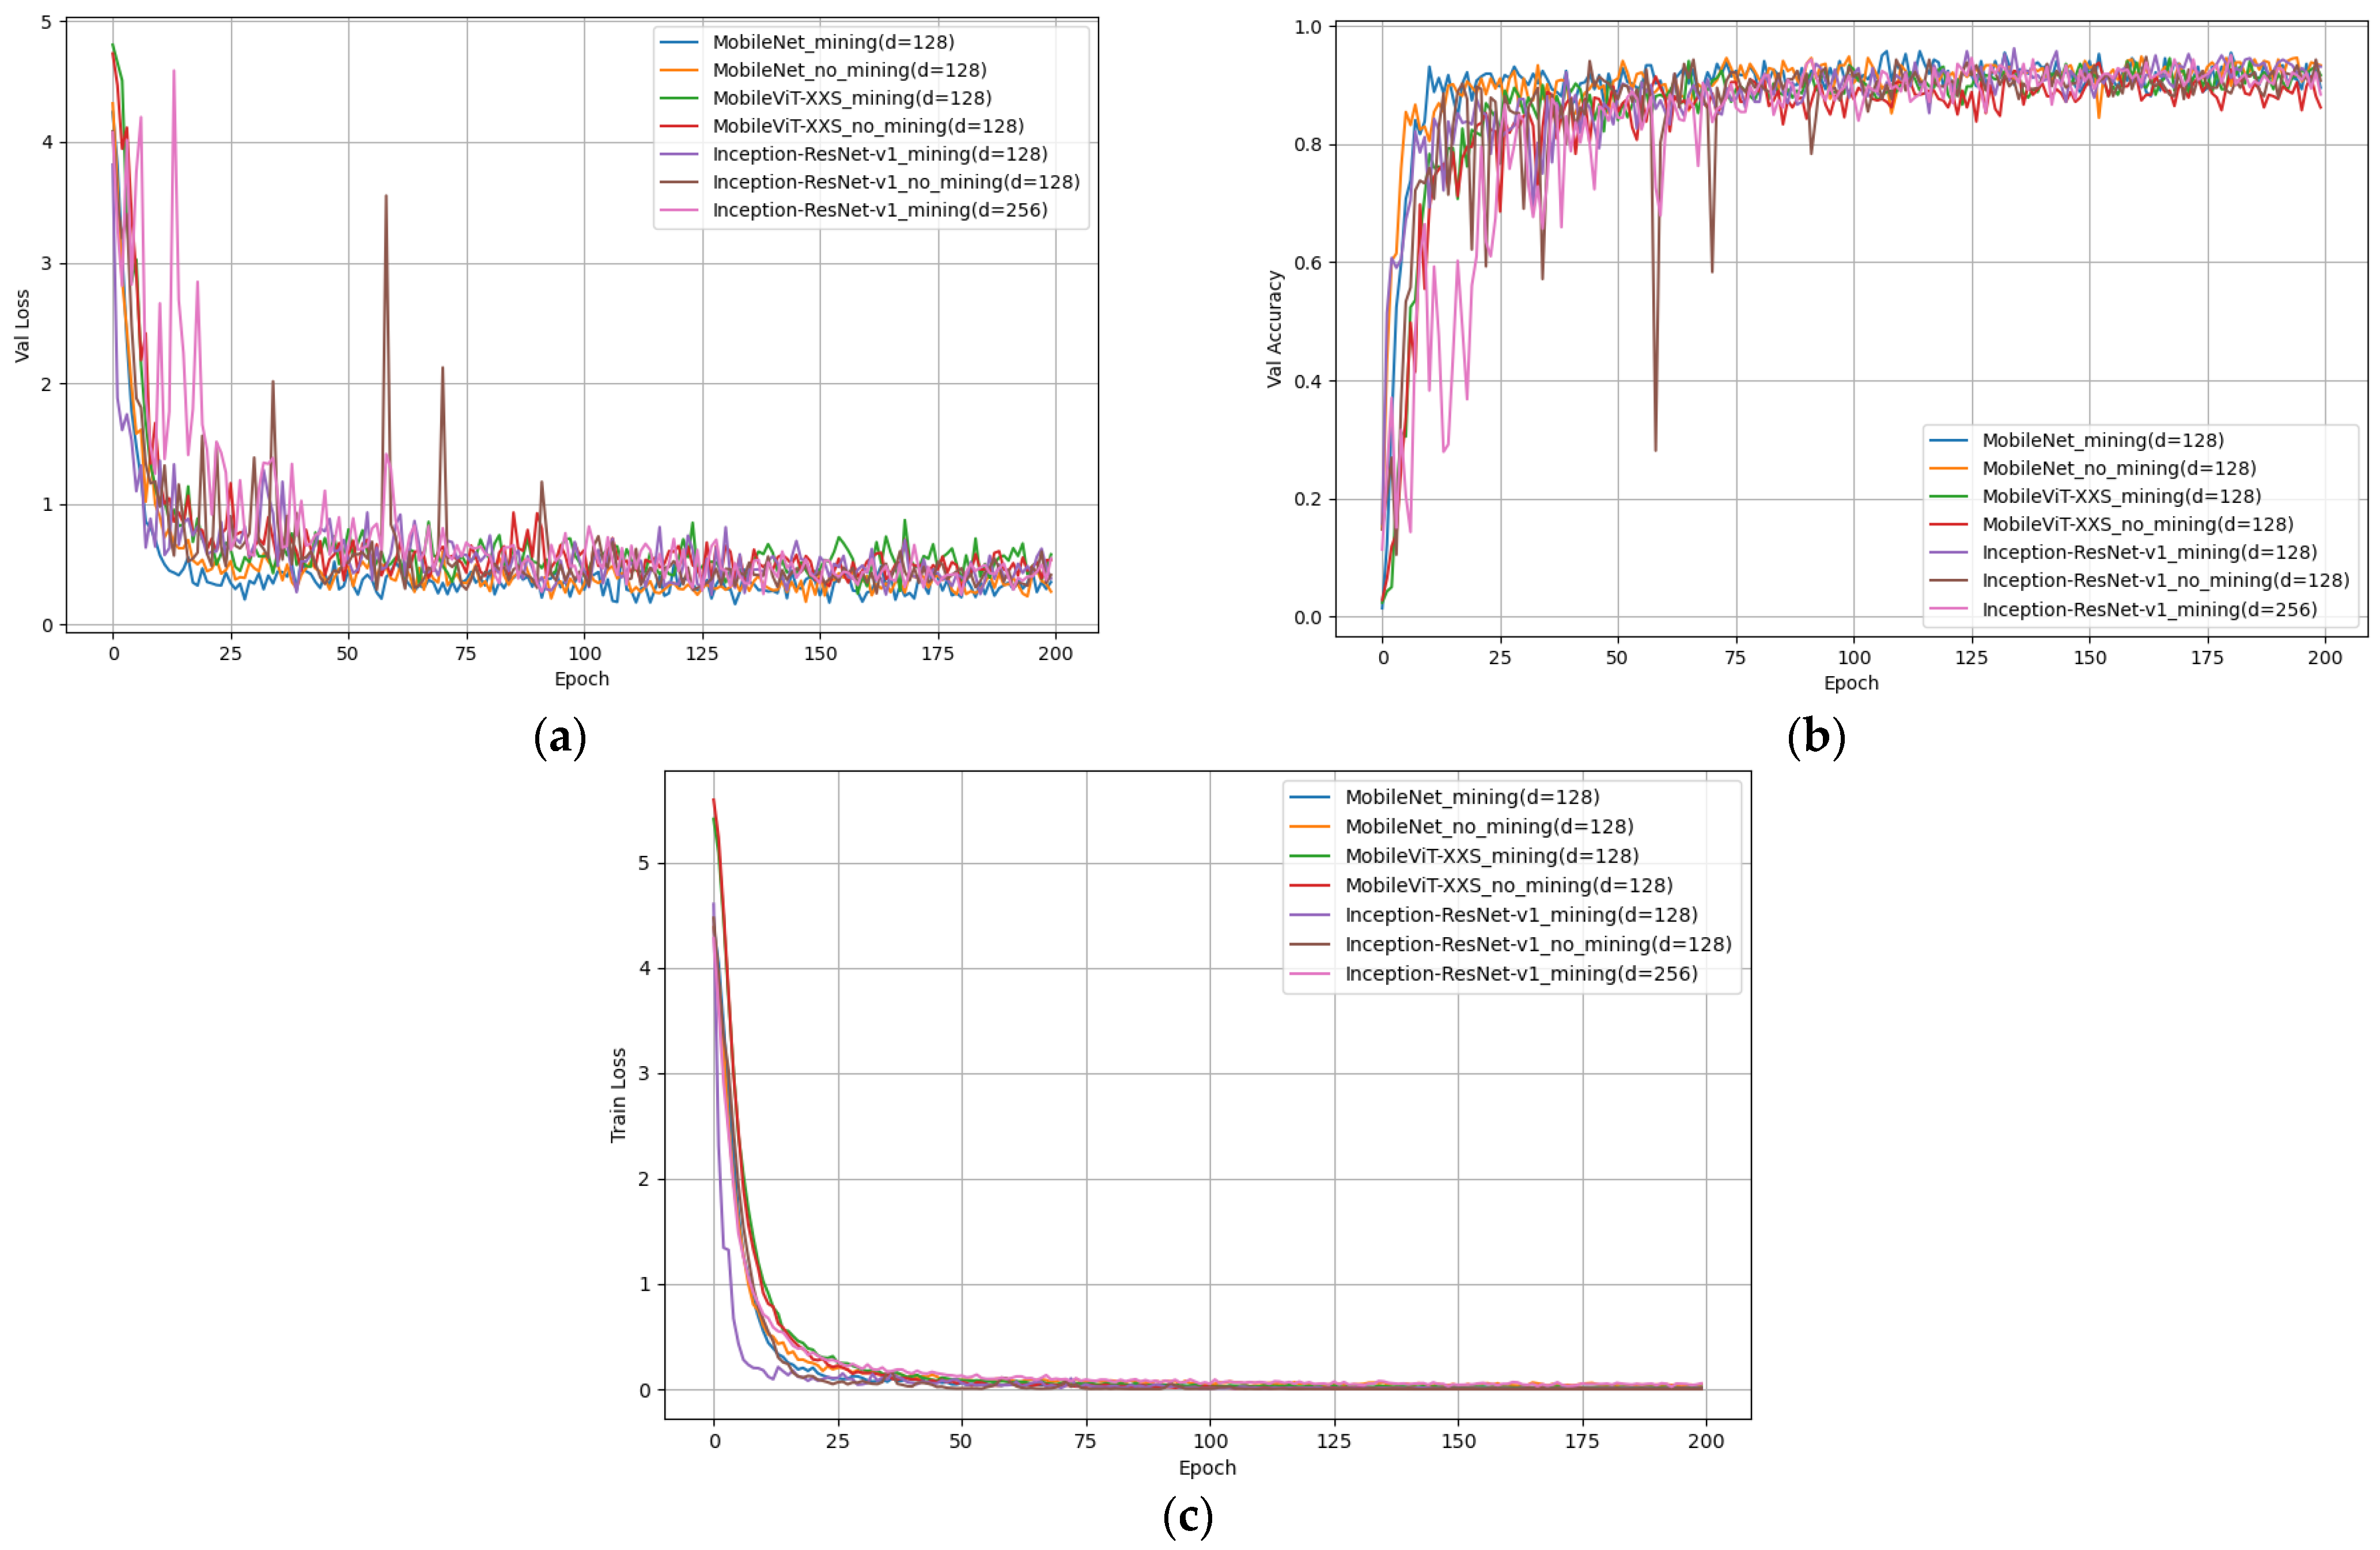
3.3.2. Model Evaluation and Result Analysis
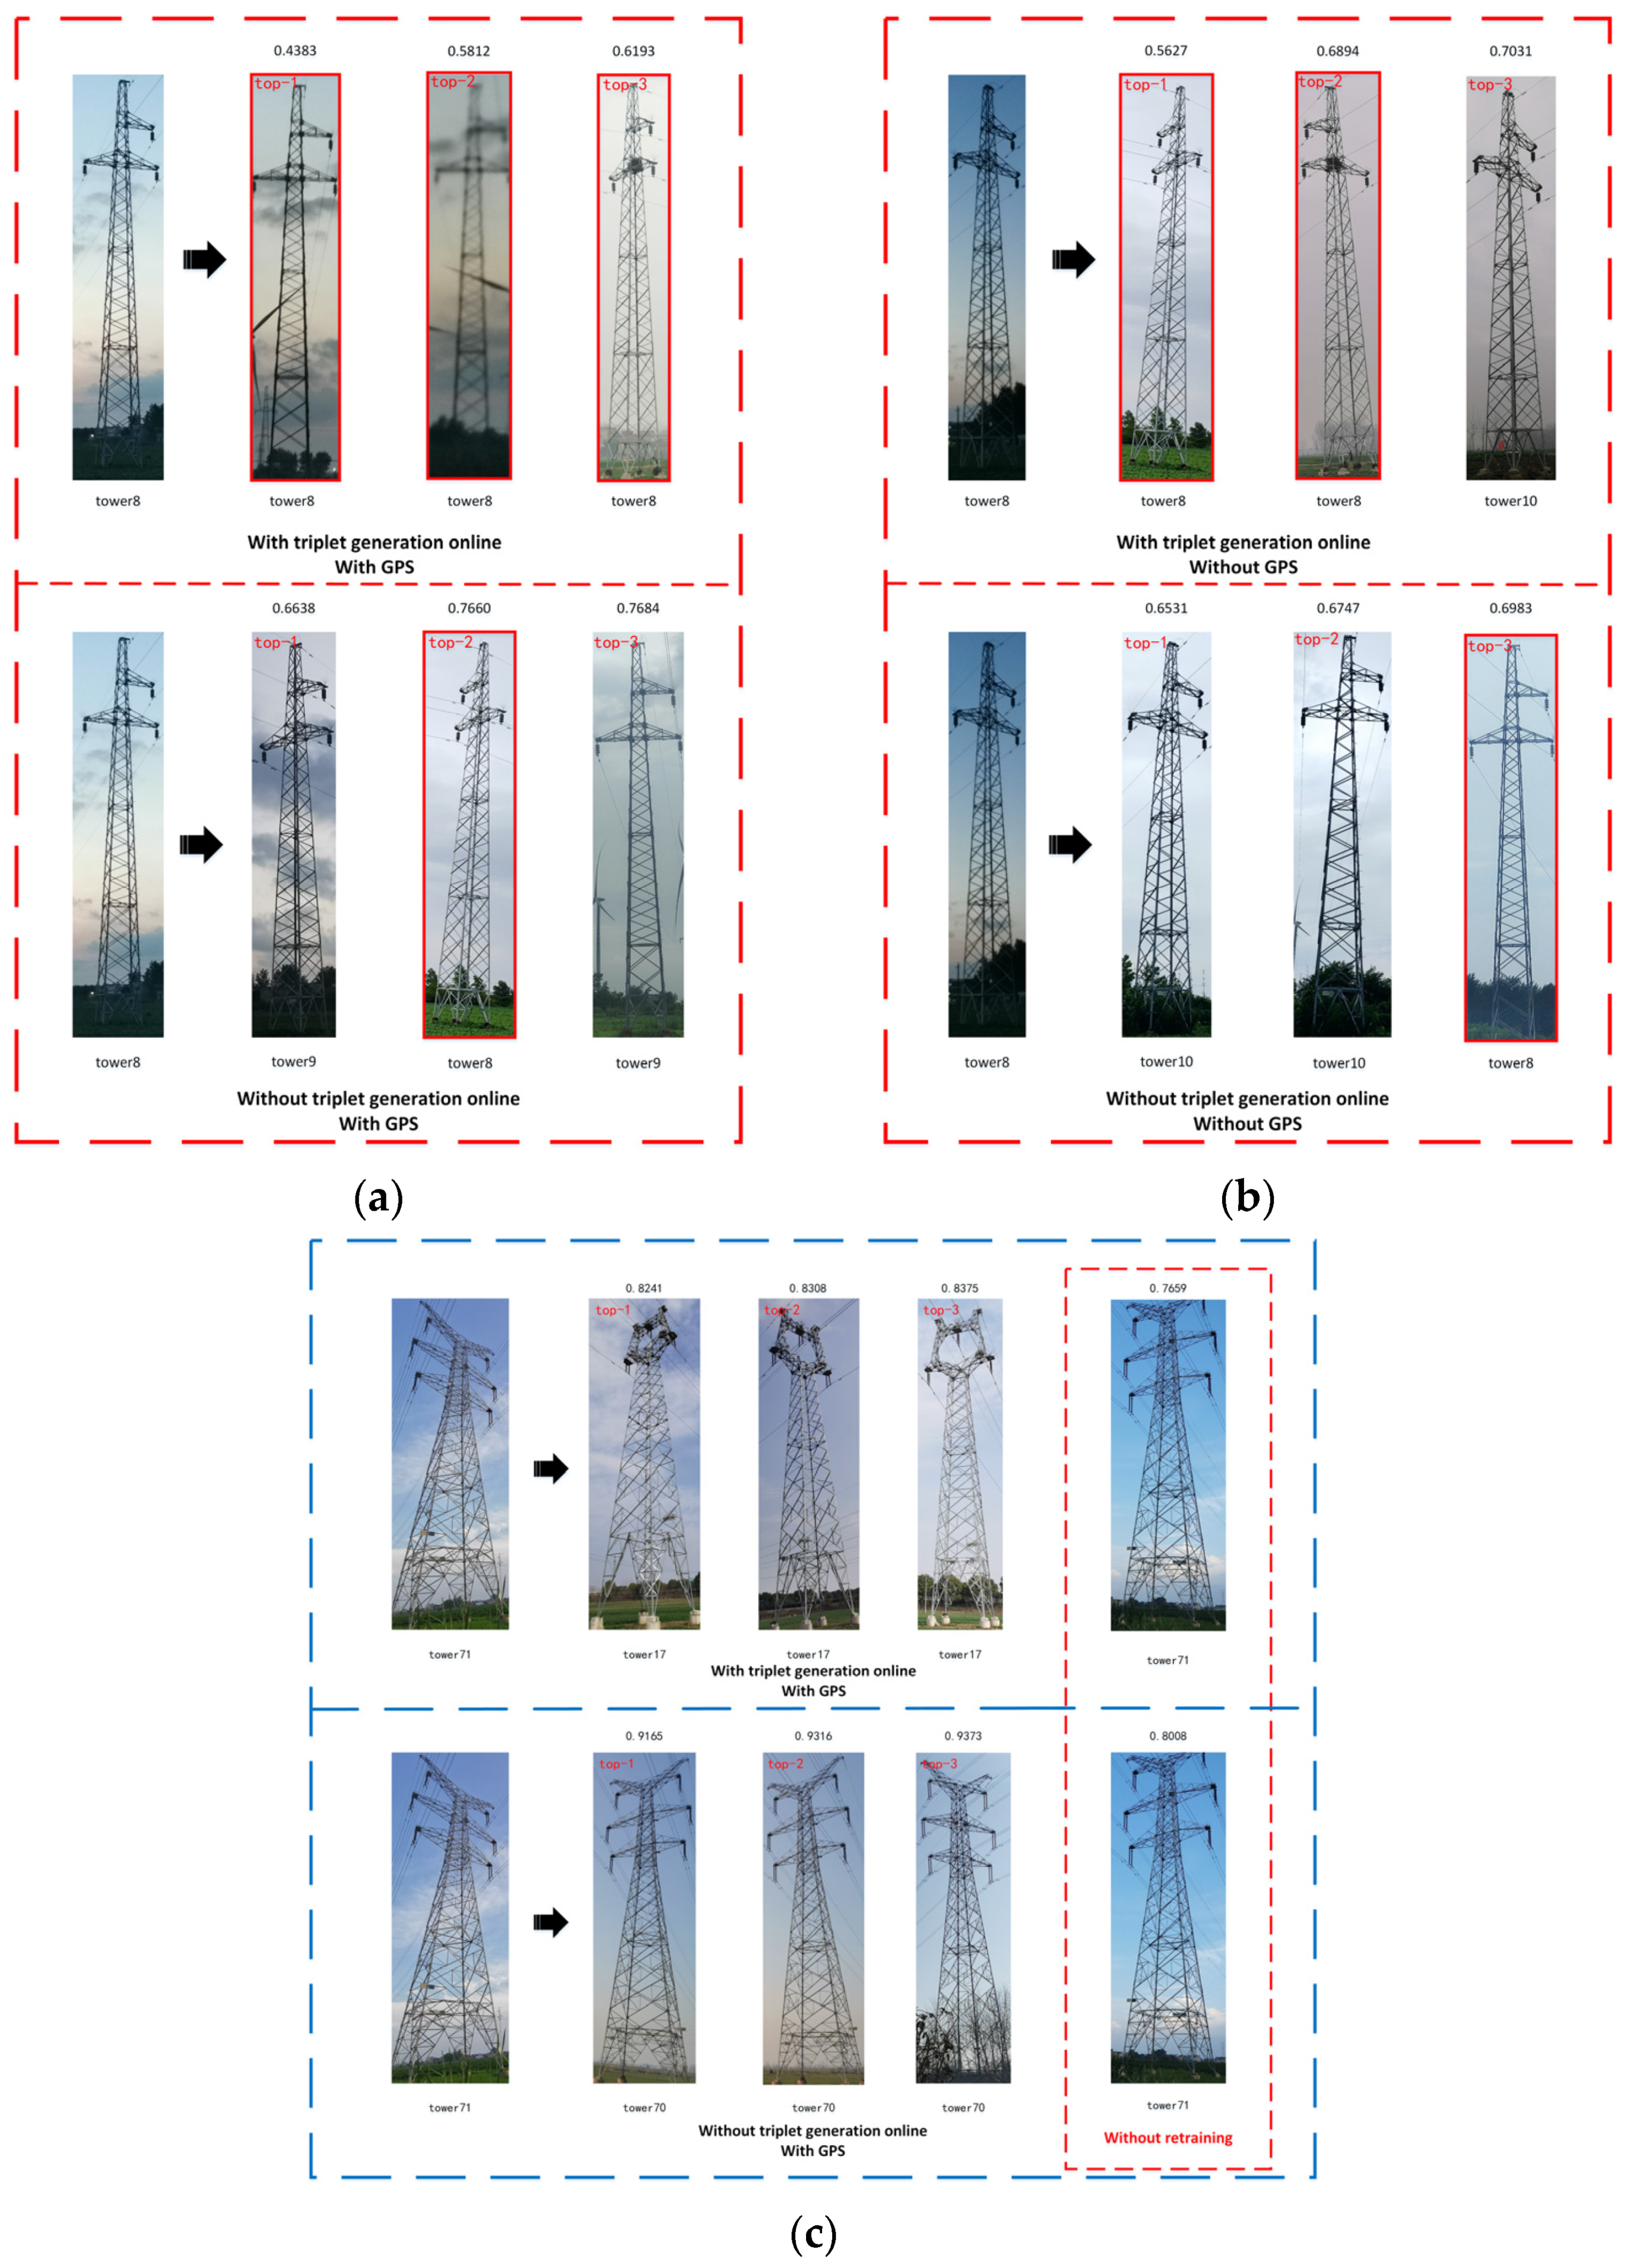
3.3.3. Visualization of Matching Network Results
4. Conclusions
- For transmission tower detection, we devised two derivative architectures grounded on YOLOv5n: YOLOv5n-C2f head and YOLOv5n-conv head. Empirical evidence underscores the superior efficacy of YOLOv5n-conv head, achieving a 1.7 ms reduction in detection time compared to YOLOv5n on Server 1;
- Within the matching network, three disparate backbone architectures—MobileNet (d = 128), MobileViT (d = 128), and Inception-Resnet-v1 (d = 128)—witnessed enhancements in both convergence velocity and rank-1 matching precision upon the assimilation of an online triplet sample generation strategy. Notably, leveraging Inception-Resnet-v1 (d = 128) as the backbone culminated in a pinnacle rank-1 matching precision of 89.32%;
- Harnessing GPS to constrict the matching ambit augments both matching accuracy and efficiency. Instituting a GPS preliminary filtering scope of [−0.05, +0.05] yields a superior outcome. Employing Inception-Resnet-v1 (d = 128) as the backbone elevates matching precision, yet trims the matching time by approximately 37 ms;
- In the absence of GPS signals, this matching network can also achieve identity matching for transmission towers with a success rate of 89.32%, but the matching time will increase by 37 ms.
- The datasets leveraged for object detection and matching in this study are constrained in size. Amassing a dataset could fortify the model’s adaptive capacity;
- The system’s matching accuracy falls below that of nameplate recognition and POS localization. Furthermore, its inference time is longer compared to POS localization;
- Without GPS data, the model experiences an increase in inference time. Additionally, the inference speed of the model proportionally increases with the number of images in the template database. For mobile applications, reducing the system’s inference time during the inference phase is crucial.
Author Contributions
Funding
Institutional Review Board Statement
Informed Consent Statement
Data Availability Statement
Conflicts of Interest
References
- Liu, Z.Y.; Wu, G.P.; He, W.S.; Fan, F.; Ye, X.H. Key target and defect detection of high-voltage power transmission lines with deep learning. Int. J. Electr. Power Energy Syst. 2022, 142, 14. [Google Scholar] [CrossRef]
- Graditi, G.; Buonanno, A.; Caliano, M.; Di Somma, M.; Valenti, M. Machine Learning Applications for Renewable-Based Energy Systems. In Advances in Artificial Intelligence for Renewable Energy Systems and Energy Autonomy; Manshahia, M.S., Kharchenko, V., Weber, G.-W., Vasant, P., Eds.; Springer International Publishing: Cham, Switzerland, 2023; pp. 177–198. [Google Scholar]
- Markus, S. Machine Learning for Energy Transmission. Available online: https://www.datarevenue.com/en-blog/machine-learning-for-energy-transmission (accessed on 30 November 2023).
- Atrigna, M.; Buonanno, A.; Carli, R.; Cavone, G.; Scarabaggio, P.; Valenti, M.; Graditi, G.; Dotoli, M. A Machine Learning Approach to Fault Prediction of Power Distribution Grids Under Heatwaves. IEEE Trans. Ind. Appl. 2023, 59, 4835–4845. [Google Scholar] [CrossRef]
- Khan, M.A.; Asad, B.; Vaimann, T.; Kallaste, A.; Pomarnacki, R.; Hyunh, V. Improved Fault Classification and Localization in Power Transmission Networks Using VAE-Generated Synthetic Data and Machine Learning Algorithms. Machines 2023, 11, 963. [Google Scholar] [CrossRef]
- Luo, Y.; Yu, X.; Yang, D.; Zhou, B. A survey of intelligent transmission line inspection based on unmanned aerial vehicle. Artif. Intell. Rev. 2023, 56, 173–201. [Google Scholar] [CrossRef]
- Wang, H.; Yang, G.; Li, E.; Tian, Y.; Zhao, M.; Liang, Z. High-Voltage Power Transmission Tower Detection Based on Faster R-CNN and YOLO-V3. In Proceedings of the 2019 Chinese Control Conference (CCC), Guangzhou, China, 27–30 July 2019; pp. 8750–8755. [Google Scholar]
- Liao, J.; Xu, H.; Fang, X.; Zhang, D.; Zhu, G. Quantitative Assessment Framework for Non-Structural Bird’s Nest Risk Information of Transmission Tower in High-Resolution UAV Panoramic Images. In Proceedings of the 2023 IEEE International Conference on Power Science and Technology (ICPST), Kunming, China, 5–7 May 2023; pp. 974–979. [Google Scholar]
- Tang, C.; Dong, H.; Huang, Y.; Han, T.; Fang, M.; Fu, J. Foreign object detection for transmission lines based on Swin Transformer V2 and YOLOX. In The Visual Computer; Springer: Berlin/Heidelberg, Germany, 2023. [Google Scholar] [CrossRef]
- Souza, B.J.; Stefenon, S.F.; Singh, G.; Freire, R.Z. Hybrid-YOLO for classification of insulators defects in transmission lines based on UAV. Int. J. Electr. Power Energy Syst. 2023, 148, 108982. [Google Scholar] [CrossRef]
- Wang, B.; Dong, M.; Ren, M.; Wu, Z.; Guo, C.; Zhuang, T.; Pischler, O.; Xie, J. Automatic Fault Diagnosis of Infrared Insulator Images Based on Image Instance Segmentation and Temperature Analysis. IEEE Trans. Instrum. Meas. 2020, 69, 5345–5355. [Google Scholar] [CrossRef]
- Yang, Y.; Wang, M.; Wang, X.; Li, C.; Shang, Z.; Zhao, L. A Novel Monocular Vision Technique for the Detection of Electric Transmission Tower Tilting Trend. Appl. Sci. 2023, 13, 407. [Google Scholar] [CrossRef]
- Girshick, R. Fast R-CNN. In Proceedings of the 2015 IEEE International Conference on Computer Vision (ICCV), Santiago, Chile, 7–13 December 2015; pp. 1440–1448. [Google Scholar]
- Ren, S.; He, K.; Girshick, R.; Sun, J. Faster R-CNN: Towards Real-Time Object Detection with Region Proposal Networks. IEEE Trans. Pattern Anal. Mach. Intell. 2017, 39, 1137–1149. [Google Scholar] [CrossRef]
- Ultralytics.YOLOv5. Available online: https://github.com/ultralytics/yolov5 (accessed on 27 November 2023).
- Wang, C.Y.; Bochkovskiy, A.; Liao, H.Y.M. YOLOv7: Trainable Bag-of-Freebies Sets New State-of-the-Art for Real-Time Object Detectors. In Proceedings of the 2023 IEEE/CVF Conference on Computer Vision and Pattern Recognition (CVPR), Vancouver, BC, Canada, 17–24 June 2023; pp. 7464–7475. [Google Scholar]
- Ultralytics. YOLOv8. Available online: https://github.com/ultralytics/ultralytics (accessed on 18 April 2023).
- Tan, M.; Pang, R.; Le, Q.V. EfficientDet: Scalable and Efficient Object Detection. In Proceedings of the 2020 IEEE/CVF Conference on Computer Vision and Pattern Recognition (CVPR), Seattle, WA, USA, 13–19 June 2020; pp. 10778–10787. [Google Scholar]
- Zhang, Z.; Xie, X.; Song, C.; Dai, D.; Bu, L. Transmission Tower Detection Algorithm Based on Feature-Enhanced Convolutional Network in Remote Sensing Image. In Proceedings of the Pattern Recognition and Computer Vision, Cham, Switzerland, 18 June 2022; pp. 551–564. [Google Scholar]
- Bian, J.; Hui, X.; Zhao, X.; Tan, M. A monocular vision–based perception approach for unmanned aerial vehicle close proximity transmission tower inspection. Int. J. Adv. Robot. Syst. 2019, 16, 172988141882022. [Google Scholar] [CrossRef]
- Sheng, Y.; Dai, Y.; Luo, Z.; Jin, C.; Jiang, C.; Xue, L.; Cui, H. A YOLOX-Based Detection Method of Triple-Cascade Feature Level Fusion for Power System External Defects. In Proceedings of the 2022 7th International Conference on Communication, Image and Signal Processing (CCISP), Chengdu, China, 18–20 November 2022; pp. 452–456. [Google Scholar]
- Zhao, Z.; Guo, G.; Zhang, L.; Li, Y. A new anti-vibration hammer rust detection algorithm based on improved YOLOv7. Energy Rep. 2023, 9, 345–351. [Google Scholar] [CrossRef]
- Zhang, J.; Lei, J.; Qin, X.; Li, B.; Li, Z.; Li, H.; Zeng, Y.; Song, J. A Fitting Recognition Approach Combining Depth-Attention YOLOv5 and Prior Synthetic Dataset. Appl. Sci. 2022, 12, 11122. [Google Scholar] [CrossRef]
- Kong, L.; Zhu, X.; Wang, G. Context Semantics for Small Target Detection in Large-Field Images with Two Cascaded Faster R-CNNs. J. Phys. Conf. Ser. 2018, 1069, 012138. [Google Scholar] [CrossRef]
- Xia, Y.; Wang, G.; Wang, R.; Zhou, F. A cascaded method for transmission tower number recognition in large scenes. In Proceedings of the International Symposium on Multispectral Image Processing and Pattern Recognition, Abu Dhabi, United Arab Emirates, 25 October 2020. [Google Scholar]
- Li, B.; Li, Y.; Zhu, X.; Qu, L.; Wang, S.; Tian, Y.; Xu, D. Substation rotational object detection based on multi-scale feature fusion and refinement. Energy AI 2023, 14, 100294. [Google Scholar] [CrossRef]
- Gang, W.; Qingmin, C.; Lin, Y.I.; Wenqing, P.; Jinju, Q.; Feng, Z. Location technology of transmission line tower based on image. J. Terahertz Sci. Electron. Inf. Technol. 2018, 16, 796–801. [Google Scholar]
- Qin, X.Y.; Wu, G.P.; Lei, J.; Fan, F.; Ye, X.H.; Mei, Q.J. A Novel Method of Autonomous Inspection for Transmission Line based on Cable Inspection Robot LiDAR Data. Sensors 2018, 18, 22. [Google Scholar] [CrossRef]
- Rublee, E.; Rabaud, V.; Konolige, K.; Bradski, G. ORB: An efficient alternative to SIFT or SURF. In Proceedings of the 2011 International Conference on Computer Vision, Barcelona, Spain, 6–13 November 2011; pp. 2564–2571. [Google Scholar]
- Zhang, L.; Koch, R. An efficient and robust line segment matching approach based on LBD descriptor and pairwise geometric consistency. J. Vis. Commun. Image Represent. 2013, 24, 794–805. [Google Scholar] [CrossRef]
- Guo, K.; Cao, R.; Wan, N.; Wang, X.; Yin, Y.; Tang, X.; Xiong, J. Image matching algorithm based on transmission tower area extraction. J. Comput. Appl. 2022, 42, 1591–1597. [Google Scholar] [CrossRef]
- Jérémie, G.G.; Morel, J.-M.; Gregory, R. LSD: A Line Segment Detector. Image Process. Line 2012, 2, 35–55. [Google Scholar] [CrossRef]
- DeTone, D.; Malisiewicz, T.; Rabinovich, A. SuperPoint: Self-Supervised Interest Point Detection and Description. In Proceedings of the 2018 IEEE/CVF Conference on Computer Vision and Pattern Recognition Workshops (CVPRW), Salt Lake City, UT, USA, 18–22 June 2018; pp. 337–33712. [Google Scholar]
- Sarlin, P.E.; DeTone, D.; Malisiewicz, T.; Rabinovich, A. SuperGlue: Learning Feature Matching With Graph Neural Networks. In Proceedings of the 2020 IEEE/CVF Conference on Computer Vision and Pattern Recognition (CVPR), Seattle, WA, USA, 13–19 June 2020; pp. 4937–4946. [Google Scholar]
- Schroff, F.; Kalenichenko, D.; Philbin, J. FaceNet: A unified embedding for face recognition and clustering. In Proceedings of the 2015 IEEE Conference on Computer Vision and Pattern Recognition (CVPR), Boston, MA, USA, 7–12 June 2015; pp. 815–823. [Google Scholar]
- Chen, H.; Wang, Y.; Shi, Y.; Yan, K.; Geng, M.; Tian, Y.; Xiang, T. Deep Transfer Learning for Person Re-Identification. In Proceedings of the 2018 IEEE Fourth International Conference on Multimedia Big Data (BigMM), Xi’an, China, 13–16 September 2018; pp. 1–5. [Google Scholar]
- Deng, J.; Guo, J.; Xue, N.; Zafeiriou, S. ArcFace: Additive Angular Margin Loss for Deep Face Recognition. In Proceedings of the 2019 IEEE/CVF Conference on Computer Vision and Pattern Recognition (CVPR), Long Beach, CA, USA, 15–20 June 2019; pp. 4685–4694. [Google Scholar]
- Zhang, H.; Liu, M.; Li, Y.; Yan, M.; Gao, Z.; Chang, X.; Nie, L. Attribute-Guided Collaborative Learning for Partial Person Re-Identification. IEEE Trans. Pattern Anal. Mach. Intell. 2023, 45, 14144–14160. [Google Scholar] [CrossRef]
- Yang, J.R.; Zhang, J.W.; Yu, F.F.; Jiang, X.Y.; Zhang, M.D.; Sun, X.; Chen, Y.C.; Zheng, W.S. Learning to Know Where to See: A Visibility-Aware Approach for Occluded Person Re-identification. In Proceedings of the 18th IEEE/CVF International Conference on Computer Vision (ICCV), Electr Network, Montreal, BC, Canada, 11–17 October 2021; pp. 11865–11874. [Google Scholar]
- Diwan, T.; Anirudh, G.; Tembhurne, J.V. Object detection using YOLO: Challenges, architectural successors, datasets and applications. Multimed. Tools Appl. 2023, 82, 9243–9275. [Google Scholar] [CrossRef]
- Howard, A.G.; Zhu, M.; Chen, B.; Kalenichenko, D.; Wang, W.; Weyand, T.; Andreetto, M.; Adam, H. MobileNets: Efficient Convolutional Neural Networks for Mobile Vision Applications. arXiv 2017, arXiv:abs/1704.04861. [Google Scholar]
- Mehta, S.; Rastegari, M. MobileViT: Light-weight, General-purpose, and Mobile-friendly Vision Transformer. arXiv 2021, arXiv:abs/2110.02178. [Google Scholar]
- Szegedy, C.; Ioffe, S.; Vanhoucke, V.; Alemi, A. Inception-v4, Inception-ResNet and the Impact of Residual Connections on Learning. In Proceedings of the AAAI Conference on Artificial Intelligence, Phoenix, AZ, USA, 12–17 February 2016; Volume 31. [Google Scholar] [CrossRef]
- Li, W.; Qi, K.; Chen, W.; Zhou, Y. Unified Batch All Triplet Loss for Visible-Infrared Person Re-identification. In Proceedings of the 2021 International Joint Conference on Neural Networks (IJCNN), Shenzhen, China, 18–22 July 2021; pp. 1–8. [Google Scholar]
- Wu, F.; Smith, J.S.; Lu, W.; Pang, C.; Zhang, B. Attentive Prototype Few-Shot Learning with Capsule Network-Based Embedding. In Proceedings of the 16th European Conference on Computer Vision, ECCV 2020, Glasgow, UK, 23–28 August 2020; pp. 237–253. [Google Scholar]


| Reference | Method Category | Advantages | Disadvantages |
|---|---|---|---|
| - | Manual comparison | High reliability | High labor intensity and low work efficiency |
| [24,25,26] | Nameplate detection and recognition | High precision | The nameplate may fall off and become invisible |
| [27,28] | POS | High precision and real-time positioning | High setup and maintenance costs; positioning failure under weak GPS signals. |
| Reference | Dataset | Task | Utilized Item | Result |
|---|---|---|---|---|
| [24] | Their own | Nameplate detection | Nameplate | AP: 73.2% |
| [25] | Their own | Nameplate recognition | Nameplate | Accuracy: 96.4% |
| [26] | Their own | Nameplate detection | Nameplate | AP: 90.1% |
| [27] | - | Positioning transmission line tower | POS | Positioning accuracy within 5 m |
| [28] | - | Point cloud positioning | POS | Build up the cable inspection robot motion trajectory model |
| Field | Data Type | Description | Source |
|---|---|---|---|
| ID | int | Primary key | Auto-increment |
| features1 | varchar(4000) | Image feature vector | Matching network result |
| tower_ID | int | Transmission tower identifier | Manual entry |
| GPS_longitude | float(20,10) | Image longitude info | Image info or “null” |
| GPS_latitude | float(20,10) | Image latitude info | Image info or “null” |
| Category | Train | Test | Val | Total |
|---|---|---|---|---|
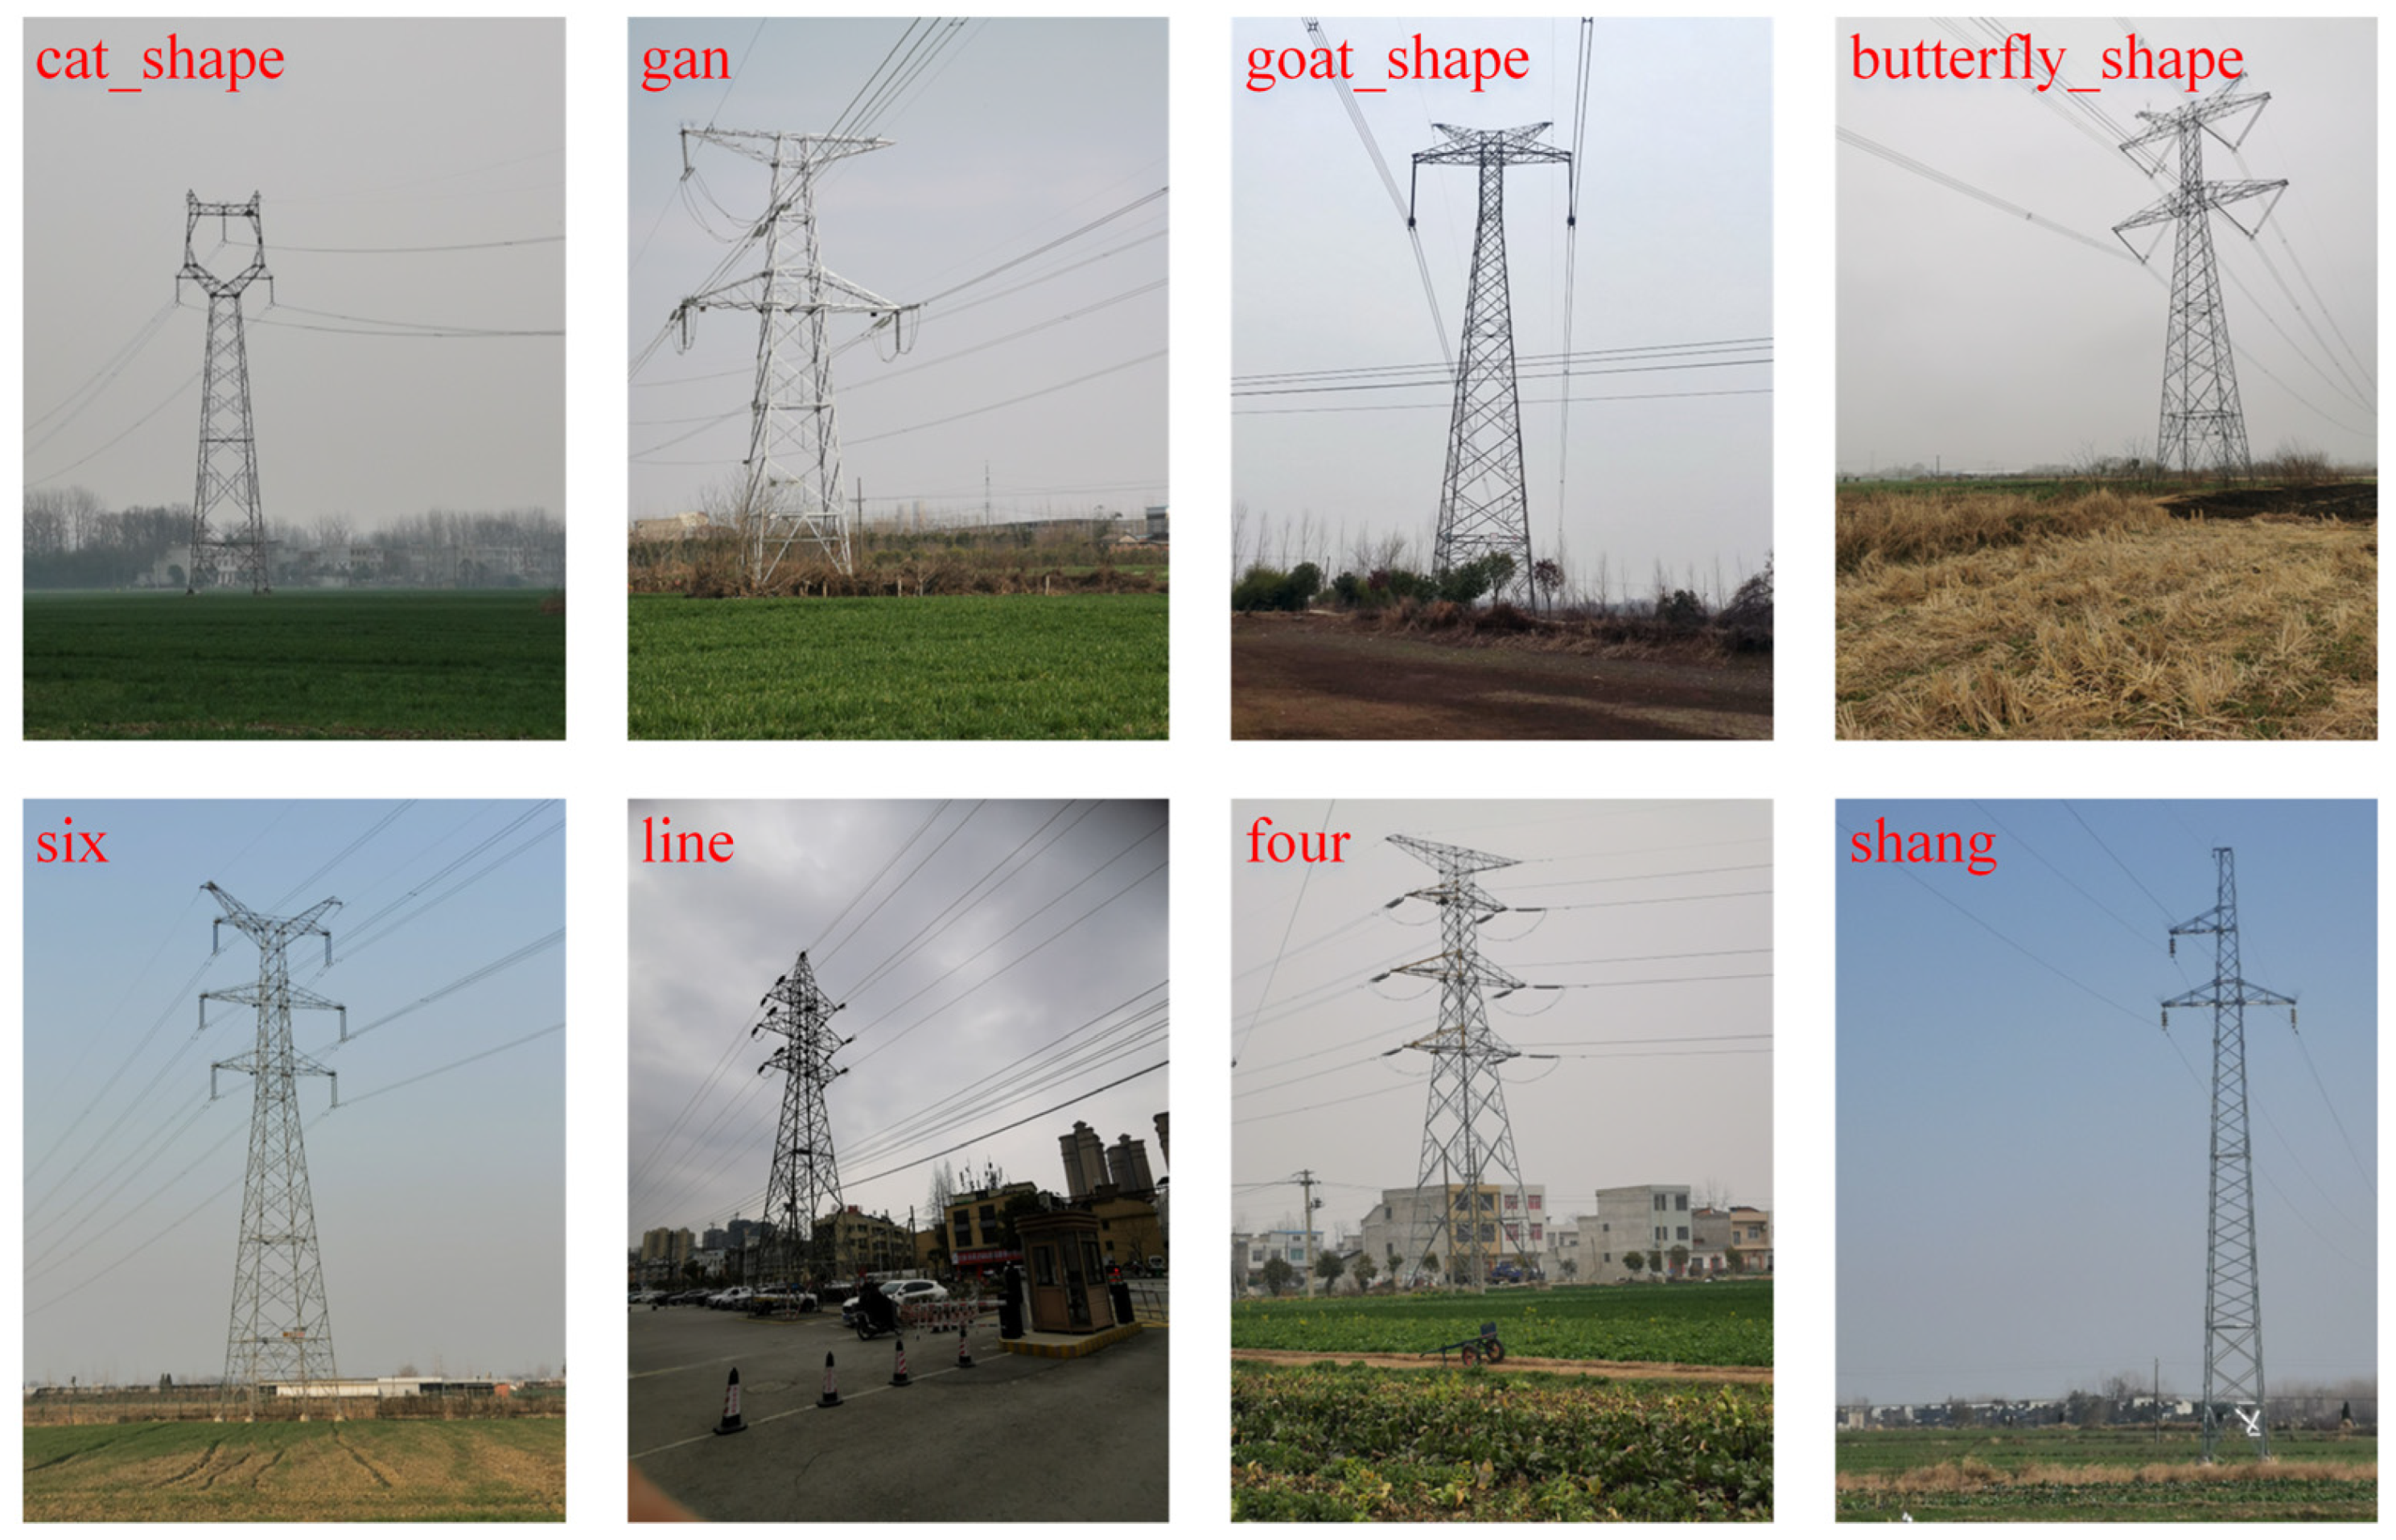
| butterfly_shape | 520 | 156 | 76 | 752 |
| cat_shape | 911 | 291 | 131 | 1333 |
| four | 716 | 181 | 94 | 991 |
| gan | 752 | 205 | 108 | 1065 |
| goat_shape | 619 | 148 | 75 | 842 |
| line | 567 | 154 | 78 | 799 |
| shang | 654 | 183 | 101 | 938 |
| six | 958 | 223 | 117 | 1298 |
| total | 5697 | 1541 | 780 | 8018 |
| Model | mAP@0.5 | mAP@0.5:0.95 | FLOPs/G | Inference (Batchsize = 1 A4000 Ubuntu)/ms | Inference (Batchsize = 1 3060 Windows)/ms |
|---|---|---|---|---|---|
| YOLOv5n-conv head (ours) | 0.974 | 0.791 | 3.6 | 8.1 | 20.5 |
| YOLOv5n-c2f head (ours) | 0.974 | 0.792 | 4.8 | 10.5 | 24.6 |
| YOLOv5n [15] (in 2022) | 0.977 | 0.792 | 4.3 | 9.8 | 23.8 |
| YOLOv5s [15] (in 2022) | 0.975 | 0.789 | 15.8 | 10 | 51.8 |
| YOLOv8n [17] (in 2023) | 0.977 | 0.819 | 8.2 | 10.1 | 35.2 |
| YOLOv8s [17] (in 2023) | 0.98 | 0.821 | 28.7 | 10.9 | 43.5 |
| Backbone | Triplet Generation Online (Mining) | GPS | Rank-1 (%) | mAP_Rank-3 (%) | Inference (Rank-1)/ms | mAPr (%) |
|---|---|---|---|---|---|---|
| MobileViT-XXS (d = 128) | √ | √ | 87.24 | 87.81 | 35.1 | 88.22 |
| √ | 86.65 | 87.36 | 71.2 | 87.59 | ||
| √ | 86.35 | 87.56 | 34.8 | 86.40 | ||
| 85.16 | 86.47 | 71.9 | 84.86 | |||
| MobileNet (d = 128) | √ | √ | 89.32 | 90.08 | 29.5 | 89.69 |
| √ | 88.43 | 89.14 | 68.0 | 88.89 | ||
| √ | 88.72 | 90.01 | 29.9 | 90.53 | ||
| 88.13 | 89.37 | 68.4 | 89.89 | |||
| Inception-Resnet-v1 (d = 128) | √ | √ | 89.32 | 90.31 | 33.3 | 85.98 |
| √ | 89.32 | 90.21 | 70.3 | 85.04 | ||
| √ | 86.35 | 87.66 | 34.5 | 88.24 | ||
| 85.46 | 86.92 | 69.6 | 87.37 |
| Backbone | Triplet Generation Online (Mining) | GPS | Rank-1 (%) | mAP_Rank-3 (%) | Inference (Rank-1)/ms | mAPr (%) |
|---|---|---|---|---|---|---|
| Inception-Resnet-v1 (d = 128) | √ | √ | 89.32 | 90.31 | 33.3 | 85.98 |
| √ | 89.32 | 90.21 | 70.3 | 85.04 | ||
| Inception-Resnet-v1 (d = 256) | √ | √ | 91.39 | 91.62 | 49.7 | 90.70 |
| √ | 90.50 | 91.15 | 110.8 | 89.98 |
Disclaimer/Publisher’s Note: The statements, opinions and data contained in all publications are solely those of the individual author(s) and contributor(s) and not of MDPI and/or the editor(s). MDPI and/or the editor(s) disclaim responsibility for any injury to people or property resulting from any ideas, methods, instructions or products referred to in the content. |
© 2024 by the authors. Licensee MDPI, Basel, Switzerland. This article is an open access article distributed under the terms and conditions of the Creative Commons Attribution (CC BY) license (https://creativecommons.org/licenses/by/4.0/).
Share and Cite
Chen, L.; Yang, Z.; Huang, F.; Dai, Y.; Liu, R.; Li, J. Transmission Tower Re-Identification Algorithm Based on Machine Vision. Appl. Sci. 2024, 14, 539. https://doi.org/10.3390/app14020539
Chen L, Yang Z, Huang F, Dai Y, Liu R, Li J. Transmission Tower Re-Identification Algorithm Based on Machine Vision. Applied Sciences. 2024; 14(2):539. https://doi.org/10.3390/app14020539
Chicago/Turabian StyleChen, Lei, Zuowei Yang, Fengyun Huang, Yiwei Dai, Rui Liu, and Jiajia Li. 2024. "Transmission Tower Re-Identification Algorithm Based on Machine Vision" Applied Sciences 14, no. 2: 539. https://doi.org/10.3390/app14020539
APA StyleChen, L., Yang, Z., Huang, F., Dai, Y., Liu, R., & Li, J. (2024). Transmission Tower Re-Identification Algorithm Based on Machine Vision. Applied Sciences, 14(2), 539. https://doi.org/10.3390/app14020539