Abstract
This article presents a vision method of identifying and measuring wood surface parameters to detect defects resulting from errors occurring during machining. The paper presents the method of recording a three–dimensional image of the wood surface using the laser triangulation method. It discusses parameters related to imaging resolution and the impact of vision system configuration parameters on the measurement resolution and image acquisition time. For the recorded image, proposed algorithms detect defects like wade and bark at the board edges. Algorithms for measuring characteristic parameters describing the surface of the wood are presented. Validation tests performed using the prepared system in industrial conditions are provided and discussed. The proposed solution makes it possible to detect board defects in flow mode on belt conveyors operating at a speed of up to 1000 mm/s.
Keywords:
wood defects; bark; laser triangulation method; 3D image resolution; industrial; quality control; plank; board 1. Introduction
The wood industry uses the material provided by sawmills. This material is often burdened with defects disqualifying it as a valuable material in production. Natural defects can be indicated among the defects occurring on the material, i.e., knots, resin ponds and other kinds of disturbances in the wood structure. Defects resulting from the method of processing wood can also be indicated, e.g., wade on the edges, bark on the surface or shaking and splitting resulting from the processing, transport or storage of wood.
However, the classification and definition of defects are flexible, as it depends on the type of product and the industry using wood as a material. Different requirements will apply in the furniture industry, where the highest-quality wood should go and others in construction, where the requirements are much lower. At the same time, it should be noted that the need to classify material defects is related to the level of automation of production. Analysing production without automation, e.g., the manual production of custom–made furniture, it can be assumed that the operators will check the material carefully based on their experience. On the other hand, producing wooden pallets with high efficiency makes it necessary to develop a product quality control system that performs control tasks at a frequency of up to several dozen elements per minute, transported on the production line at a speed often exceeding 1000 mm/s.
When analysing an increase in the efficiency of the production line in terms of the use of vision systems, the desired time of the control task should be considered. The increase in efficiency means, at the same time, an increase in the transport speed and a significant reduction in the technological operation’s cycle time. It also appears natural to shorten the times of the control and measurement operations. These conditions entail the need to build vision systems that allow image acquisition in a shorter time and simultaneously shorten the image analysis time. The trend towards a widening range of controlled parameters, their variability and increased efficiency hasten the search for novel solutions and technologies for product control. Choosing the control method according to the conditions prevailing on the production line and the product specifications is also necessary. Therefore, research is needed to develop and test new solutions allowing product quality control following the industry requirements. These requirements are constantly changing and increasing due to using new materials, manufacturing technologies and expanding the scope of production process control.
Sometimes the requirements for the product are defined in general terms. From the point of view of research and development, it is necessary to specify detailed parameters of its operation. For systems where it is possible to stop controlled products, the expected time of image acquisition and image analysis is defined in the range from 100 to 500 ms. The strict number depends on the industry and the level of automation. However, for systems where the material is transported at a speed of up to 1000 mm/s, it is only possible to stop the movement by reducing the line efficiency.
On the other hand, when designing measurement systems, the selection of devices should consider the required imaging resolution. Analysis of the applied sensor is crucial. The sensor’s parameters impact the system operation and may limit the maximal efficiency of a system. The sensor may have a minimum image acquisition time of 1 ms. For the assumed product transport speed of 1000 mm/s, in 1 ms, the product moves by 1 mm. Such movement during exposure may cause significant blur on the digital image. Blurred images disqualify the system because information about the edges and features of a scene is lost.
The solution described in the work was created as an answer to a specific demand of the industry. As a result, the operational parameters of the vision system were imposed. To manage requirements, selecting an imaging method is crucial to replicate the scene correctly. The vision system should analyse every product independently. This is only possible if the acquisition time is significantly shorter than the time between evaluating successive products. Designing such an efficient system requires sensors with higher parameters and computers with increased computing power.
The need to implement high–speed imaging methods is related to a global trend of the automation and digitalisation of production and the growing requirements for controlling the production process and the parameters of the tested product using vision systems [1].
Analysis of the literature indicates that vision methods are widely used to control product parameters. The development of vision-based quality control methods has been progressing for many years [2]. Most of them are based on analysing two–dimensional images recorded using various methods. For assessing wood parameters, monochrome and colour sensors are used [3,4]. Article [5] describes segmentation methods and compares segmentation algorithms to identify surface defects. Various algorithms were used, e.g., Hough transform and total variation algorithm, to estimate tree–ring increments. The measurement based on the intensity analysis of wood growth was also presented in the paper [6]. Articles [7,8] compared the differences between defective and undamaged images of bamboo surfaces based on the analysis of colour and texture using morphology algorithms. Wood surface analysis can be carried out on the material supplied for production in tree trunks, boards, and other machined products. It can also be implemented on the finished product [9]. However, the final product inspection method does not guarantee that defective boards were not used in production.
The selection of algorithms for inspecting the wood surface should consider the differences in the colour of the wood to the defect colour and the wood parameters [10,11]. In wood evaluation, two–dimensional images were recorded with thermographic imaging technology [12,13]. This method analyses differences in the absorption and emission of IR radiation on surfaces. Computed tomography can also be used for imaging. An example of the use of this technology is described in work [14]. However, this method has significant limitations due to the imaging time and the requirement to work in industrial conditions. In imaging internal defects, the ultrasonic method and frequency analyses have also been used [15,16]. It can be combined with classical imaging methods to obtain information about visible and hidden defects in wood. However, the effect of noise on the production line on the measurement results must be carefully considered.
The development of artificial intelligence (AI) and related methods of image analysis has started an exponential increase in work describing the use of, e.g., deep learning methods in assessing wood surfaces [17,18]. This type of algorithm has made it possible to teach the defect pattern and use the network trained in this way to search for defects. AI opens up great opportunities to identify defects. Attention should be paid to the results in articles on artificial neural networks. Conclusions indicate that the method’s effectiveness, depending on its network type and specific task, is in the range of 80–95% [17,19,20,21]. This limitation is due to the complexity of the CNN method and the disturbances in the imaging system in industrial systems. A few per cent losses caused by incorrect assessment may not be acceptable in serial production. An example is using AI methods to analyse images in the infrared range of 900–1800 nm [22]. The authors of the article state that the effectiveness of such a solution is only 92%. In classical production control methods, it is required that the efficiency should be over 99.9%. It is often encountered that incorrectly evaluated products should be at most three ppm (part per million). AI algorithms provide solutions for complex problems that are hard to parametrise. For example, a deep learning algorithm is used in an image to recognise different tree species [23]. The development of three–dimensional imaging methods and, simultaneously, the possibility of using both classical methods and AI algorithms for the analysis expands the possibilities of using this type of image in control tasks [24]. Three–dimensional imaging methods differ regarding possible imaging resolution, acquisition time and working conditions considering the industrial environment. A detailed description of the methods and possible resolutions can be found in the articles [25,26].
Some imaging methods allow high imaging resolutions of several tens of µm. However, these methods do not allow the image acquisition of a product in motion. In the article [27], the authors compared methods of assessing wood quality. Contact measurement was compared with the laser method. The authors show that it is possible to measure wood-surface quality parameters. However, this method cannot be used to measure the parameters of wood transported on the production line.
Work [28] presents a comparable system for the wood chips sorting problem. Authors apply 2D imaging with a laser illuminator. Measurements are made during product motion. The authors highlight that image processing time is crucial in the application. The resulting time to provide feedback to the sorting unit is 90 ms. The quality control of wooden boards is presented in [29]. The authors used a laser scanner to evaluate board parameters in-line. Configuration of the proposed prototype allows for imaging with a scanning speed of 83 mm/s. It is significantly lower than the 1000 mm/s considered in the project. It indicates the limitations resulting from the hardware configuration selected for surface imaging. The timber industry also uses laser triangulation to validate logs [30,31]. The authors state that acquiring a single profile takes 10 ms. The accuracy is 2.4 mm. In this case, the speed of movement is lower due to the weight of the transported product. Another application of vision-based systems in the timber industry is estimating log volume from a single image [32]. The method allows performing group measurements on the stack logs. The operator provides the length of a log manually.
In the proposed solution, the laser triangulation method was chosen to control the surface of wood transported at a speed of up to 1000 mm/s. It is based on the use of a laser light source and a camera allowing the recording of the image of the laser line on the controlled product. This method requires the movement of a tested object relative to the measuring system. In this way, it meets the requirement to control the wood surface directly on the transport line.
The paper discusses the solution of recording a three–dimensional image of the plank surface using laser triangulation at speeds of up to 1000 mm/s of the test object. At the same time, it is required to obtain a resolution and measurement that guarantees checking the board dimensions under the tolerance adopted in the technical documentation of the product.
The resultant imaging parameters like the field of view and resolution of surface imaging are presented. The measurement stand was proposed, and the results were presented. The research was carried out on wood selected together with the quality control department from planks supplied by sawmills. Planks containing machining defects in various forms on the surface were identified. The most significant part of the material contained bark and wade at the plank edges. Figure 1a,b presents exemplary defects. The bark can be visible simultaneously on larger wood areas, as shown in Figure 1c. In extreme cases, the bark is visible on the entire surface. Figure 1d shows the surface of the wood with bark removed at the edges. However, the thickness of the board on the edge means that this piece should also be classified as defective.
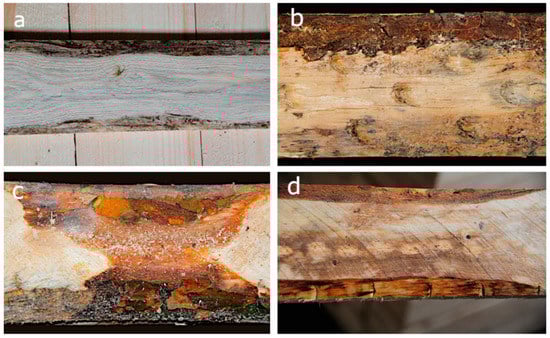
Figure 1.
Images of bark (b–d) and wade (a) on the surface of planks.
The presence of bark on the surface of the wood is due to erroneous mechanical processing. Identifying this type of defect at the initial step of the assembly aims to eliminate its processing cost. It is equally important to eliminate the cost of repairing the finished product resulting from using defective materials.
Research aimed to develop an automated control system to inspect every board entering production and remove defective ones. It was also assumed to validate the board surface inline on the conveyor moving at a speed range of 500–1000 mm/s. It was additionally assumed that the image analysis should allow the assessment of the material and detection of the bark and wade within 500 ms from image acquisition. Therefore, implementing the task required selecting a vision system configuration and preparing a fast algorithm for image analysis, allowing image acquisition and assessment of the wood surface in flow mode.
Laboratory and industrial tests were carried out on spruce and pine wood. The main advantage of the proposed method is the 3D imaging with high resolution. A sufficient number of points describing a surface allows the validation of material and the detection of even tiny defects. The accurate selection of laser power and image-acquisition parameters makes it possible to acquire an image of the surface of any wood. The control system construction is one of the issues described in the work. The presented imaging method can be used to evaluate the surface quality of various wood species.
The research problem involves a comprehensive approach to imaging and analysing the board surface. The main contributions of the proposed solution are:
- Imaging in motion with a speed up to 1000 mm/s;
- Obtaining spatial resolution of 0.1 mm;
- Detecting geometrical defects according to technical documentation;
- Determination of the impact of vision system alignment on spatial resolution;
- Considering the surface curvature in the detection algorithm;
- Evaluation of repeatability of the imaging method;
- Practical implementation of the station in industrial conditions.
2. Materials and Methods
At the stage of analysis and selection of the imaging method, both 2D and 3D imaging methods were considered. As guidelines, the assumption was that the tested surface would be moved at a speed of 500–1000 mm/s. It was necessary to choose a method in which the acquisition time would be short enough not to blur the characteristic features of the surface in the image.
The analysis of defects and their variability in the colour of bark and the colour of the wood of various species indicates that using 2D imaging methods in the visible light range will not allow the reproducible identification of defects. This is due to differences in the structure and colour of the bark for wood of the same species harvested in different areas. Even more significant differences in the structure and colour of the bark occur on different types of wood. As a result of such high variability, achieving reproducible imaging results of the controlled wood is impossible. The bark will be visible in various colours and at different intensities for RGB imaging. On the other hand, imaging using monochrome sensors will result in recording the image in greyscale and without any information about the colour of the surface. In the case of both types of sensors, the decisive factor is the time of acquisition of a single frame during the movement and the need to use additional high–power illuminators.
Analysis and preliminary research on the possibilities of imaging the surface of the wood using 3D methods were also carried out. Due to the requirement of imaging material during motion, it was necessary to eliminate methods requiring a product stop. The decision on the imaging method also included installation conditions on the production line. The laser triangulation method was selected. This method provides the possibility of recording an image containing information on the geometric structure of the surface, regardless of the colour of defects occurring on the surface. The three-dimensional image is built using monochromatic laser light. This kind of illumination eliminates the influence of the colour of the material. In addition, during the analysis, the coordinates of each point are used regardless of the material colour.
Laser triangulation is a three–dimensional image-acquisition method. The image is generated based on illuminating the selected surface part with a laser line and recording a 2D image of the line shape on the product. Then, based on the chosen configuration of the camera and the laser illuminator, the object height profile is calculated at the location of the projection. The three–dimensional image is built from consecutive height profiles determined after the object’s movement. The advantage of this method is that it allows the acquisition of height profiles during the movement of the tested object. Imaging with this method requires measuring the object displacement to define the imaging resolution (Figure 2). The task of the encoder is to provide a signal that triggers image acquisition to determine the following height profiles of the surface of the tested object. The position measurement guarantees the maintenance of a constant resolution marked as ΔY in the direction of the Y–axis, defined as the direction of movement of the tested object.
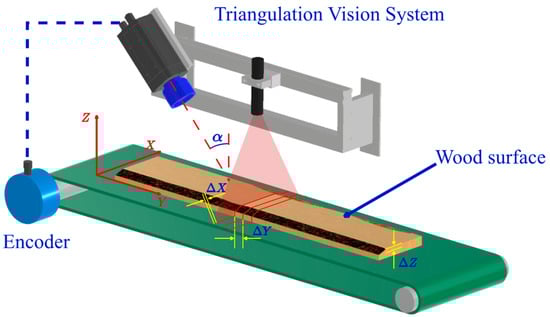
Figure 2.
Model of the laser triangulation imaging stand.
The X–axis was defined as parallel to the plane formed by the laser line. The resolution in this axis is marked as ΔX and is the distance between consecutive measuring points creating the height profile. The resolution of the Z–axis imaging is denoted as ΔZ and is determined from the equation:
where
- —resolution in the X direction,
- —the angle between the optical axis of the camera and the optical axis of the laser.
A detailed description of the method of building an imaging system using the laser triangulation method is presented in [25]. The article presents different configurations of the camera and laser alignment and the impact of the configuration on imaging resolution. It also offers various methods of implementing relative motion between the examined object and the camera–laser system. The structure presented in Figure 2 allows the determination of the height profile based on the laser line projected on the object. The 1536 × 512 sensor from SICK was used in this research. For the sensor, it was possible to record images with a maximum resolution of ΔX = ΔY = 0.1 mm. It was assumed that the width of the tested surface was 140 mm. Effectively, out of the 1536 pixels available on the sensor, 1400 pixels were used for surface imaging. A 658 nm laser with a 20 mW power was used in the study.
The camera–laser alignment was chosen based on the analysis of the available installation space for the measuring system on the production line. It was established that it is possible to set the angle of α from 30° to 70°. For such a range, the characteristic of Z–axis imaging resolution in the function of the α angle was determined (Figure 3).
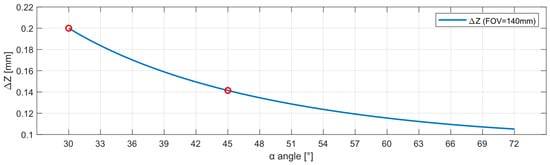
Figure 3.
Z–axis imaging resolution in the function of α angle. The red circles shows the considered alignment of 30° and 45°.
Considering the geometric structure of the wood surface, it was assumed that the resolution in the range of 30–45° is reliable for correct imaging of the bark. The number of measurement points was reduced to reduce the acquisition time for the in–motion imaging. The XY plane measurement resolutions equal to were considered. In the research and analysis of wood surface flaws, two kinds of defects were categorised: natural and mechanical. Mechanical defects are a result of machining. Both types of defects disqualify the material from the technological process. An image of a surface on which several types of defects are visible is presented in Figure 4. On the given surface, natural defects are visible as bark on the board edges. There are also visible defects resulting from mechanical processing on the board surface in the form of regular patterns on the right side of the plank.
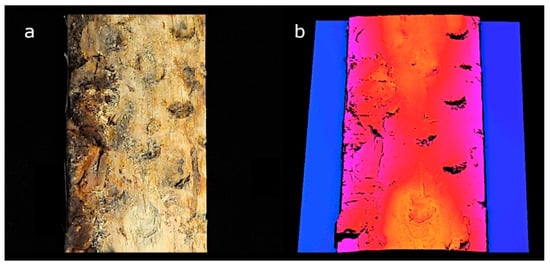
Figure 4.
Wood surface with damage visible at the edges and surfaces: (a)—2D image, (b)—3D image recorded using laser triangulation.
The three–dimensional image is described by measurement points, the number of which results from the adopted imaging resolution. It was decided that in the XY plane, the resolution in both axes would be the same. In the case discussed in this work, the surface with an area of 1 was described by 25 measurement points. The resulting imaging resolution is equal to ΔX = ΔY= 0.2 . Each measuring point represents the average height of a surface area of 0.04 . The colour visible in the three–dimensional image represents the scaled height of the measuring points forming the surface of the wood (Figure 4b).
Analysis of the height of each point of a three–dimensional image allows the validation of the geometry and control of quality parameters of the processed wood surface. The thickness of the wood was checked based on a comparison of the height of each image point with the tolerances from the technical documentation.
3. Results and Discussion
The paper proposes several algorithms for assessing material quality based on analysing a three–dimensional image. These algorithms are based on analysing the coordinates of the points that make up the surface.
The first algorithm utilises dimensional information and tolerances defined for the product in the technical documentation. Figure 5 shows the surface of the wood with a visible defect on the left edge. The flaw was caused by the machining of the plank in a sawmill. It is related to the remains of a bark removed by the tool during the processing. This kind of defect limits the usable area of a plank.
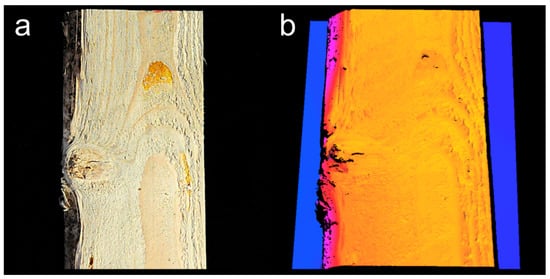
Figure 5.
Image of the sample with the remaining bark: (a) two–dimensional image, (b) three–dimensional image.
The material presented in Figure 5 has a tolerance of the thickness dimension specified in the technical documentation, defined as:
The height of each measuring point is marked as . The wood area with the correct thickness was calculated as a product of the number of valid points and the area related to a single point equal to 0.04 . Set was defined as points from the image meeting the height tolerance requirements from Equation (4).
where
- —number of elements of the set of points in defined tolerance,
- —set of all measurement points.
This approach makes it possible to separate all the points that make up a three–dimensional image into two sets of points. The first set of points indicates the surface of the correct thickness determined by analysing the height of each point. The second set shows the surface formed by points with heights outside the tolerance range. Surface area analysis based on the criterion of material thickness within the dimensional tolerance allows control of all defects and possible material damage. The image split into two sets of points is presented in Figure 6.
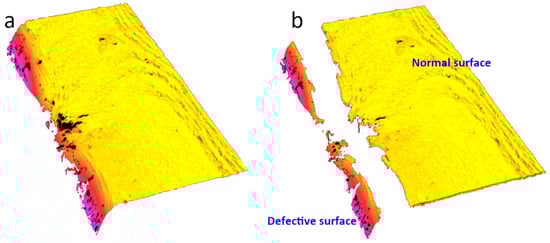
Figure 6.
Three–dimensional image of the plank: (a) board without background, (b) surface split into valid and flawed part.
Wood thickness analysis allows for indicating the surface within the tolerance defined by the quality assurance department. Removing the wood area outside the tolerance from the image generated a potentially usable plank surface (Figure 7). The remaining wood met the thickness requirements and was usable in the technological process.
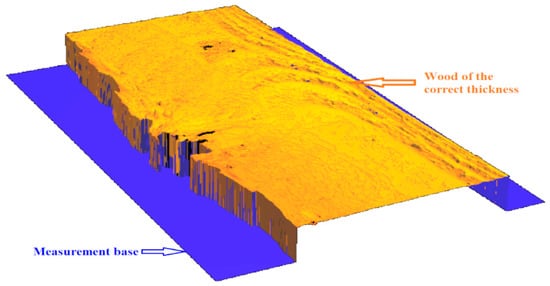
Figure 7.
Surface fragment. The material of the correct thickness extracted from the 3D image.
The presence of bark reduced the thickness of the material at the edge and, at the same time, reduced the usable width of the material within the thickness tolerance.
In the evaluation process, another algorithm was used. The task was to assess the width of the material with the correct thickness. For this purpose, cross-sections were defined on the valid surface, as shown in Figure 8. Each cross-section specified the position of the point describing the left edge and the right edge. These points were determined based on analysing each point coordinate position (x,y) in the considered cross-section plane. The points describing the left and right edges were determined independently along the segments defining the direction of searching for the edge. The direction of searching for the edge points is indicated in the figure with arrows and the description “Left Edge” and “Right Edge”. Based on the analysis of the position of the left and right edges, the width of the remaining material, meeting the width tolerance criterion, was determined. For each analysed cross-section, the width of the material was calculated (Figure 8). Knowing the width of the material with the correct thickness, it is possible to validate the product. Nominal width and tolerances were assumed from the technical documentation as follows:
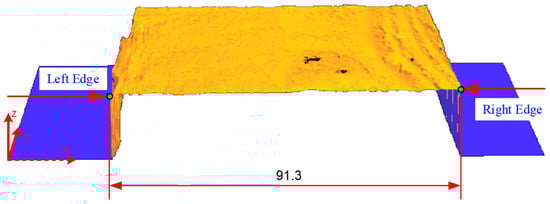
Figure 8.
Measurement of material width after thickness validation based on the position of the left and right edges.
As part of the implemented solution, it was assumed that subsequent cross-sections are set along the board, i.e., along the coordinate system Y–axis with a distance of 5 mm. The distance between the cross–sections can be changed according to indications from the quality assurance department. The selection of this parameter depends on the requirements of the measurement procedure and the approach adopted due to the effects of the technological process. This parameter should be selected based on typical defects of the supplied materials. At the same time, it should take the width measurement following the procedure developed in the production plant. However, reducing the distance between cross-sections causes an increase in the number of profiles. Increasing the number of analysed points affects the time needed to perform measurements. This method, however, allowed for evaluating the entire surface with reliable results. In this case, the limitation was the resolution of the 3D imaging system only, which was ΔX = ΔY = 0.2 mm. With a resolution of 0.2 mm, the entire three-dimensional image of the wood surface was analysed (Figure 9).
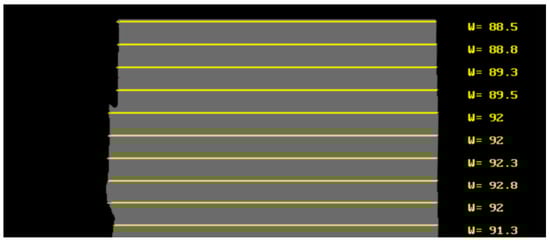
Figure 9.
The width measurement of material with valid thickness. Successive cross-sections are generated with a distance of 5 mm along the Y-axis.
In addition to that previously discussed, segmentation based on surface incline analysis was proposed. This approach allows the detection of bark and wade defects. This method does not guarantee the detection of thickness flaws. However, it allows detection when the material has dimensions within tolerances, but the surface is damaged. The damage can be either of natural origin or improper processing (Figure 4).
A segmentation method based on the measurement of surface inclination requires the preparation of a measurement base plane. The base plane must be parallel to the coordinate system. For this purpose, points can be projected onto the base plane. As a result of the transformation, the Z–coordinate of each point is altered into the distance of the point from the base plane. This allows for associating the low inclination as a valid area.
The vector normal to the surface is then determined for each point. The vector calculation is carried out in a 3 × 3 point neighbourhood. The 3 × 3 window size allows the normal vectors of the surface to be generated without dramatically increasing computational costs. The normal is generated as a unit vector with X, Y, and Z coordinates. Figure 10 shows the resulting normal vectors. The vector’s X, Y and Z components are encoded as an RGB image.
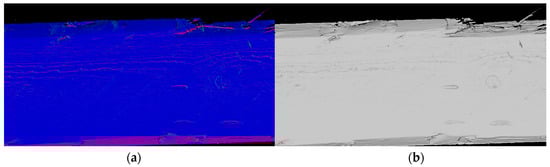
Figure 10.
Analysis of material surface structure based on local curvature: (a) normal vectors encoded as RGB image; (b) Z–coordinate of normal vectors.
It was decided to use the Z–coordinate of the normal vector to filter out the inclined parts of the material (Figure 10b). Any change in the inclination of the surface, regardless of its direction, causes the Z–coordinate of the normal vector to decrease. This allows the detection of damage to the board structure regardless of its thickness.
Filtering based on inclination allows the segmentation of defects in the form of bark and wade. Figure 11 shows the result of the operation. The blue colour indicates the correct part of the plank. The set of points marked in orange corresponds to the areas recognised as faults. Possible defects that could be detected using local curvature are wade, bark and structural damage on the plank surface.
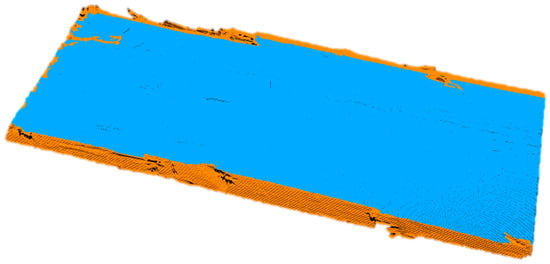
Figure 11.
Three-dimensional image of examined plank after filtration based on the normal vector.
The proposed algorithm for controlling the plank surface’s inclination allows the detection of defects within height tolerance limits. It thus completes the height thresholding algorithm. Using only the part of the algorithm involving inclination does not ensure dimensional compliance with the technical documentation.
The paper also presents an alternative algorithm for determining the board width using the height profile method. In this case, the operation of determining the surface area of the material of the correct thickness is not performed. The height profile is generated in the appointed positions directly in the raw 3D image. The height profile determined in this way contains information about points on a selected plane. This method reduces the time of 3D image analysis and makes it possible to increase the speed of material transport on conveyors. At the same time, it does not assure the assessment of the entire surface of the material. This assessment is carried out only in selected planes. Therefore, choosing the distance between the profiles determined on the 3D image is crucial. A wood surface assessed using height profiles is presented in Figure 12. Figure 12a presents a 2D image of the surface, and Figure 12b shows a three-dimensional image of the same surface. Figure 12c shows the position of the selected planes and the generated height profiles. It also shows the results of the measurement of the width of the plank. Three selected height profiles with width measurements were presented. However, the material between the profiles was not evaluated in this case. A height profile method can be defined as a statistical control because the entire material is evaluated based on measurements operating on the part of the dataset.
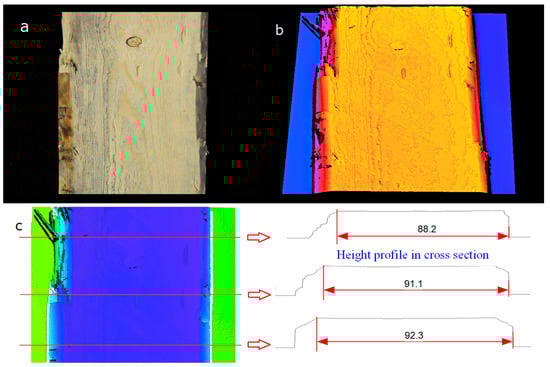
Figure 12.
Inspection of the wood surface using the height profile method: (a) 2D image of the surface, (b) 3D image of the surface, and (c) selected height profiles with measurement lines.
The surface area-based assessment requires the analysis of all points that make a three–dimensional image. The first algorithm could inspect dimensions in terms of tolerances like the material’s thickness, width and length. The construction of a full 3D image of the surface allows for determining the material length in the same way as in the case of determining its width. A material measurement with significant defects is presented in Figure 13.
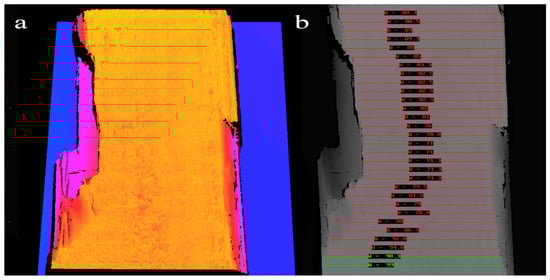
Figure 13.
Results of measurements of the width of the plank with severe damage on both edges: (a) three-dimensional image of the plank—the colour corresponds to the height of the point; (b) results of width measurement—a red line means a negative result, and a green line means valid width.
For the imaging system, the repeatability of the measurement was checked when determining the points of the altitude profile. At the time of the measure, the board did not move relative to the imaging system. In this mode, the registration of several measurement series of 1000 height profiles was forced. The measurements were made for a board with the correct surface and boards containing bark. Within each measurement, the heights of each profile point were determined. Then, for each point, a measure of measurement repeatability was proposed as a standard deviation. Figure 14 shows the standard deviation values determined for a non-defective wood surface and two selected surfaces containing bark. The standard deviation value describing the repeatability of a bark surface is more significant than for a surface without defects. However, it is lower than the assumed measurement resolution in both cases.
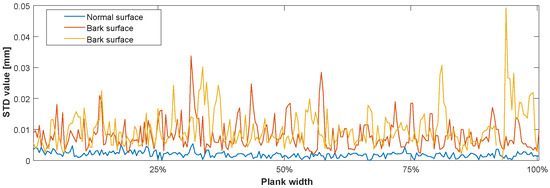
Figure 14.
Comparison of imaging repeatability for normal wood surface and surfaces with bark defects.
Statistical indicators can also be analysed while validating the cross-section represented as a height profile. Analysis of the values of the determined indicators can allow the detection of surface structure defects. Figure 15 shows one of the chosen board height profiles (gray). The figure shows the tolerance field (green) with the nominal value and the maximal permitted deviations acquired from the technical documentation. The red colour shows the measured dimensional error. The figure below shows the thickness error distribution for a single board height profile for the board shown in Figure 4. This board is made with a thickness error observed over its entire surface.
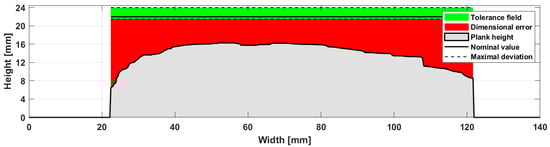
Figure 15.
Height of one chosen profile of the board (grey) with tolerance field (green area) and determined dimensional error (red).
For each of the analysed profiles, the following were determined: the maximum error value in a single profile, the average error value for the profile and the median error in a profile. Based on the analysis performed, statistics were obtained along the Y-axis (Figure 16). The distribution of error values for all 3D image profiles is shown below.
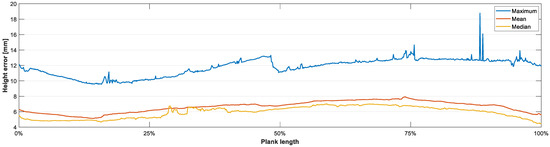
Figure 16.
Statistics of absolute error values for each profile of the three-dimensional image of the board.
The laser source generated a wavelength equal to 658 nm electromagnetic radiation with a power of 20 mW. Laser configuration allowed the construction of a wood surface image containing bark and wood surface. The quality of three-dimensional image acquired strongly depends on the wood moisture and the colour and species of wood. Research has proved that building an image for materials with different surface parameters is possible. The recommendation is to use a laser with a power above 10 mW with the ability to control the power value. Using a laser with lower power may cause scattering of the beam on the surface, and the inability to build a good-quality 3D image (Figure 17). The choice of laser for surface imaging also depends on the adopted configuration of the vision system and the manner the laser line interacts with the surface. Increasing the laser power allows you to shorten the acquisition time of a single profile, which allows imaging at higher board transport speeds. Images of the wood surface with the indication of the laser power value as a percentage of the maximum value of 20 mW are presented below. The figure indicates the power range for the beam scattering on the surface. The range for which changes in the colour of wood or its moisture do not affect the correct imaging of its surface is also marked. As a result of using too low laser power, the beam is scattered, which makes it impossible to determine all points describing surfaces.
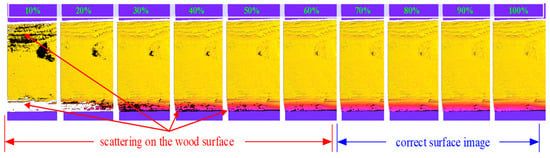
Figure 17.
Plank surface image recorded at different laser power.
Studies related to altering the imaging resolution were carried out in the research. The paper considers the impact of the changing number of points forming a three-dimensional image at the time of the control task. The adopted requirement in the project was the possibility of assessing wood defects carried out in flow mode on belt conveyors operating at a speed of up to 1000 mm/s. Obtained measurement resolution in the X–axis and Y–axis was equal to ΔX = ΔY = 0.2 mm. The proposed configuration makes it possible to reproduce the surface area of 1 using 25 measurement points in the three dimensional representation. With such operating parameters and the selected configuration of the vision system, it was possible to assess the surface of wood transported at a velocity of up to 1000 mm/s.
The question arises whether using a higher-power laser or a laser emitting electromagnetic radiation from 700 to 1200 nm could influence imaging. Could changing the wavelength or increasing the power allow for a significant reduction in the imaging time of a single profile, thus allowing the transport of materials at an even higher speed? The question also arises whether the electromagnetic radiation range of 700 to 1200 nm could allow the imaging of materials with different moisture, colour and geometric structure.
4. Conclusions
Two measurement methods have been proposed to assess the quality of raw wood as a material supplied to a production line, e.g., a line producing transport pallets. The first algorithm was based on the construction and analysis of the three-dimensional image of the surface of the controlled material. It involved imaging and constructing a three–dimensional image of the entire surface and then separating the areas of the correct thickness, width and length. Material parameters such as the plank thickness, width and length were controlled with the dimensional tolerances according to the technical documentation.
An algorithm was also proposed to inspect the local inclination of the material surface. It detected product flaws when the surface was still within the height tolerance. The algorithm complements height thresholding in terms of surface structure inspection.
The second control method was based on the statistical control approach. The measurement was carried on in selected planes only using height profiles. This method also allowed for assessing the thickness and width dimensions of the material. In this method, the distance between the analysed height profiles along the Y–axis was a limitation. Spaces between selected planes were skipped and omitted quality control.
In the case of using the first of the described methods, complete information about the material surface was analysed. It was used to check compliance with the technical documentation. However, this method required more computing power due to performing more computations on all points forming the three-dimensional image.
The second method provided only statistical evaluation of selected height profiles on the three-dimensional image. It is much faster due to processing just a subset of measurement points. Only the points that make up the selected height profiles were analysed. However, it did not offer the possibility of assessing the entire surface of the material.
Based on the completed research and industrial tests, the first image analysis method was chosen for the solution intended for implementation on the production line. It guaranteed a full assessment of the controlled surface of the material at a transport speed of 1000 m/s.
Author Contributions
Conceptualisation, M.C., A.S. and B.L.; methodology, A.S. and B.L.; investigation, M.C., A.S. and B.L.; writing—original draft preparation, A.S. and B.L.; writing—review and editing, A.S. and B.L.; supervision, A.S. All authors have read and agreed to the published version of the manuscript.
Funding
This research was co-funded by the National Centre for Research and Development of the Republic of Poland within the scope of the research program Smart Growth Operational Programme No. POIR.01.01.01–00–0165/21.
Institutional Review Board Statement
Not applicable.
Informed Consent Statement
Not applicable.
Data Availability Statement
Data available on request.
Conflicts of Interest
The authors declare no conflict of interest.
References
- Scimeca, D. Machine Vision’s Hottest Technologies and Most Popular Applications Vision System Design. Available online: https://www.vision-systems.com/vision-systems-design-25-year-anniversary/article/14197437/machine-vision-image-processing-survey-solutions-in-vision-2021-teaser (accessed on 20 November 2022).
- Ruz, G.A.; Estévez, P.A.; Ramírez, P.A. Automated Visual Inspection System for Wood Defect Classification Using Computational Intelligence Techniques. Int. J. Syst. Sci. 2009, 40, 163–172. [Google Scholar] [CrossRef]
- Funck, J.W.; Zhong, Y.; Butler, D.A.; Brunner, C.C.; Forrer, J.B. Image Segmentation Algorithms Applied to Wood Defect Detection. Comput. Electron. Agric. 2003, 41, 157–179. [Google Scholar] [CrossRef]
- Bucur, V. Techniques for High Resolution Imaging of Wood Structure: A Review. Meas. Sci. Technol. 2003, 14, R91–R98. [Google Scholar] [CrossRef]
- Du, W.; Xi, Y.; Harada, K.; Zhang, Y.; Nagashima, K.; Qiao, Z. Improved Hough Transform and Total Variation Algorithms for Features Extraction of Wood. Forests 2021, 12, 466. [Google Scholar] [CrossRef]
- Lenty, B. Tree-Ring Growth Measurements Automation Using Machine Vision. In Proceedings of the Photonics Applications in Astronomy, Communications, Industry, and High Energy Physics Experiments, Wilga, Poland, 31 August–2 September 2020; Romaniuk, R.S., Linczuk, M., Eds.; SPIE: Bellingham, WA, USA, 2020; p. 30. [Google Scholar] [CrossRef]
- Zeng, Q.; Lu, Q.; Yu, X.; Li, S.; Chen, N.; Li, W.; Zhang, F.; Chen, N.; Zhao, W. Identification of Defects on Bamboo Strip Surfaces Based on Comprehensive Features. Eur. J. Wood Wood Prod. 2023, 81, 315–328. [Google Scholar] [CrossRef]
- Jiang, Z.; Liang, Y.; Su, Z.; Chen, A.; Sun, J. Nondestructive Testing of Mechanical Properties of Bamboo–Wood Composite Container Floor by Image Processing. Forests 2021, 12, 1535. [Google Scholar] [CrossRef]
- Sioma, A. Quality Control System of Wooden Flanges Based on Vision Measurement System. Wood Res. 2019, 64, 637–646. [Google Scholar]
- Lin, L.; He, S.; Fu, F.; Wang, X. Detection of Wood Failure by Image Processing Method: Influence of Algorithm, Adhesive and Wood Species. Eur. J. Wood Wood Prod. 2015, 73, 485–491. [Google Scholar] [CrossRef]
- Wakaf, Z.; Jalab, H.A. Defect Detection Based on Extreme Edge of Defective Region Histogram. J. King Saud. Univ. Comput. Inf. Sci. 2018, 30, 33–40. [Google Scholar] [CrossRef]
- Meinlschmidt, P. Thermographic Detection of Defects in Wood and Wood Based Materials. In Proceedings of the 14th International Sumposium of Nondestructive Testing of Wood, Eberswalde, Germany, 2–4 May 2005; p. 6. [Google Scholar]
- Pitarma, R.; Crisóstomo, J.; Pereira, L. Detection of Wood Damages Using Infrared Thermography. Procedia Comput. Sci. 2019, 155, 480–486. [Google Scholar] [CrossRef]
- Wei, Q.; Chui, Y.H.; Leblon, B.; Zhang, S.Y. Identification of Selected Internal Wood Characteristics in Computed Tomography Images of Black Spruce: A Comparison Study. J. Wood Sci. 2009, 55, 175–180. [Google Scholar] [CrossRef]
- Tiitta, M.; Tiitta, V.; Gaal, M.; Heikkinen, J.; Lappalainen, R.; Tomppo, L. Air-Coupled Ultrasound Detection of Natural Defects in Wood Using Ferroelectret and Piezoelectric Sensors. Wood Sci. Technol. 2020, 54, 1051–1064. [Google Scholar] [CrossRef]
- Lemaster, R.L. The Use of Frequency and Wavelet Analysis for Monitoring Surface Quality of Wood Machining Applications. Scanning 2010, 32, 224–232. [Google Scholar] [CrossRef] [PubMed]
- He, T.; Liu, Y.; Yu, Y.; Zhao, Q.; Hu, Z. Application of Deep Convolutional Neural Network on Feature Extraction and Detection of Wood Defects. Measurement 2020, 152, 107357. [Google Scholar] [CrossRef]
- Haciefendioglu, K.; Başaga, H.B.; Bulut, M.C.; Kartal, M.E. Automatic Damage Detection on Traditional Wooden Structures with Deep Learning-Based Image Classification Method. Drv. Ind. 2022, 73, 163–176. [Google Scholar] [CrossRef]
- Yang, Y.; Wang, H.; Jiang, D.; Hu, Z. Surface Detection of Solid Wood Defects Based on SSD Improved with ResNet. Forests 2021, 12, 1419. [Google Scholar] [CrossRef]
- Hu, J.; Yu, X.; Zhao, Y.; Wang, K.; Lu, W. Research on Bamboo Defect Segmentation and Classification Based on Improved u-Net Network. Wood Res. 2022, 67, 109–122. [Google Scholar] [CrossRef]
- Yang, Y.; Zhou, X.; Liu, Y.; Hu, Z.; Ding, F. Wood Defect Detection Based on Depth Extreme Learning Machine. Appl. Sci. 2020, 10, 7488. [Google Scholar] [CrossRef]
- Yu, H.; Liang, Y.; Liang, H.; Zhang, Y. Recognition of Wood Surface Defects with near Infrared Spectroscopy and Machine Vision. J. Res. 2019, 30, 2379–2386. [Google Scholar] [CrossRef]
- Silva, J.L.; Bordalo, R.; Pissarra, J.; de Palacios, P. Computer Vision-Based Wood Identification: A Review. Forests 2022, 13, 2041. [Google Scholar] [CrossRef]
- Sioma, A. Assessment of Wood Surface Defects Based on 3D Image Analysis. Wood Res. 2015, 60, 339–350. [Google Scholar]
- Sioma, A. Geometry and Resolution in Triangulation Vision Systems. In Proceedings of the Photonics Applications in Astronomy, Communications, Industry, and High Energy Physics Experiments, Wilga, Poland, 31 August–2 September 2020; Romaniuk, R.S., Linczuk, M., Eds.; SPIE: Bellingham, WA, USA, 2020; p. 33. [Google Scholar] [CrossRef]
- Sioma, A. 3D Imaging Methods in Quality Inspection Systems. In Proceedings of the Photonics Applications in Astronomy, Communications, Industry, and High-Energy Physics Experiments, Wilga, Poland, 26 May–2 June 2019; Romaniuk, R.S., Linczuk, M., Eds.; SPIE: Bellingham, WA, USA, 2019; p. 91. [Google Scholar] [CrossRef]
- Razaei, F.; Gaff, M.; Sethy, A.K.; Niemz, P.; Kamboj, G.; Ditommaso, G.; Corleto, R.; Das, S.; Gašparík, M. Surface Quality Measurement by Contact and Laser Methods on Thermally Modified Spruce Wood after Plain Milling. Int. J. Adv. Manuf. Technol. 2020, 110, 1653–1663. [Google Scholar] [CrossRef]
- Grigorev, I.; Shadrin, A.; Katkov, S.; Borisov, V.; Druzyanova, V.; Gnatovskaya, I.; Diev, R.; Kaznacheeva, N.; Levushkin, D.; Akinin, D. Improving the Quality of Sorting Wood Chips by Scanning and Machine Vision Technology. J. Sci. 2021, 67, 212–218. [Google Scholar] [CrossRef]
- Sandak, J.; Orlowski, K.A.; Sandak, A.; Chuchala, D.; Taube, P. On-Line Measurement of Wood Surface Smoothness. Drv. Ind. 2020, 71, 193–200. [Google Scholar] [CrossRef]
- Siekański, P.; Magda, K.; Malowany, K.; Rutkiewicz, J.; Styk, A.; Krzesłowski, J.; Kowaluk, T.; Zagórski, A. On-Line Laser Triangulation Scanner for Wood Logs Surface Geometry Measurement. Sensors 2019, 19, 1074. [Google Scholar] [CrossRef]
- Zolotarev, F.; Eerola, T.; Lensu, L.; Kälviäinen, H.; Helin, T.; Haario, H.; Kauppi, T.; Heikkinen, J. Modelling Internal Knot Distribution Using External Log Features. Comput. Electron. Agric. 2020, 179, 105795. [Google Scholar] [CrossRef]
- Moskalik, T.; Tymendorf, Ł.; van der Saar, J.; Trzciński, G. Methods of Wood Volume Determining and Its Implications for Forest Transport. Sensors 2022, 22, 6028. [Google Scholar] [CrossRef]
Disclaimer/Publisher’s Note: The statements, opinions and data contained in all publications are solely those of the individual author(s) and contributor(s) and not of MDPI and/or the editor(s). MDPI and/or the editor(s) disclaim responsibility for any injury to people or property resulting from any ideas, methods, instructions or products referred to in the content. |
© 2023 by the authors. Licensee MDPI, Basel, Switzerland. This article is an open access article distributed under the terms and conditions of the Creative Commons Attribution (CC BY) license (https://creativecommons.org/licenses/by/4.0/).