Application of a Hybrid Model in Landslide Susceptibility Evaluation of the Western Tibet Plateau
Abstract
1. Introduction
2. Materials and Methods
2.1. Study Area
2.2. Data Source and Methodology
2.3. Conditioning Factors
2.3.1. DEM and Derivatives
2.3.2. Lithology
2.3.3. Distance to Faults
2.3.4. Distance to Roads
2.3.5. Distance to River
2.4. Multicollinearity Diagnosis
2.5. Landslide Susceptibility Modeling
2.5.1. Information Value Model (IVM)
2.5.2. Weight of Evidence Method (WoE)
2.5.3. Logistic Regression (LR)
2.5.4. Multi-Layer Perceptron (MLP)
3. Results
3.1. Landslide Susceptibility Mapping by the IVM Model
3.2. Landslide Susceptibility Mapping by the WoE Model
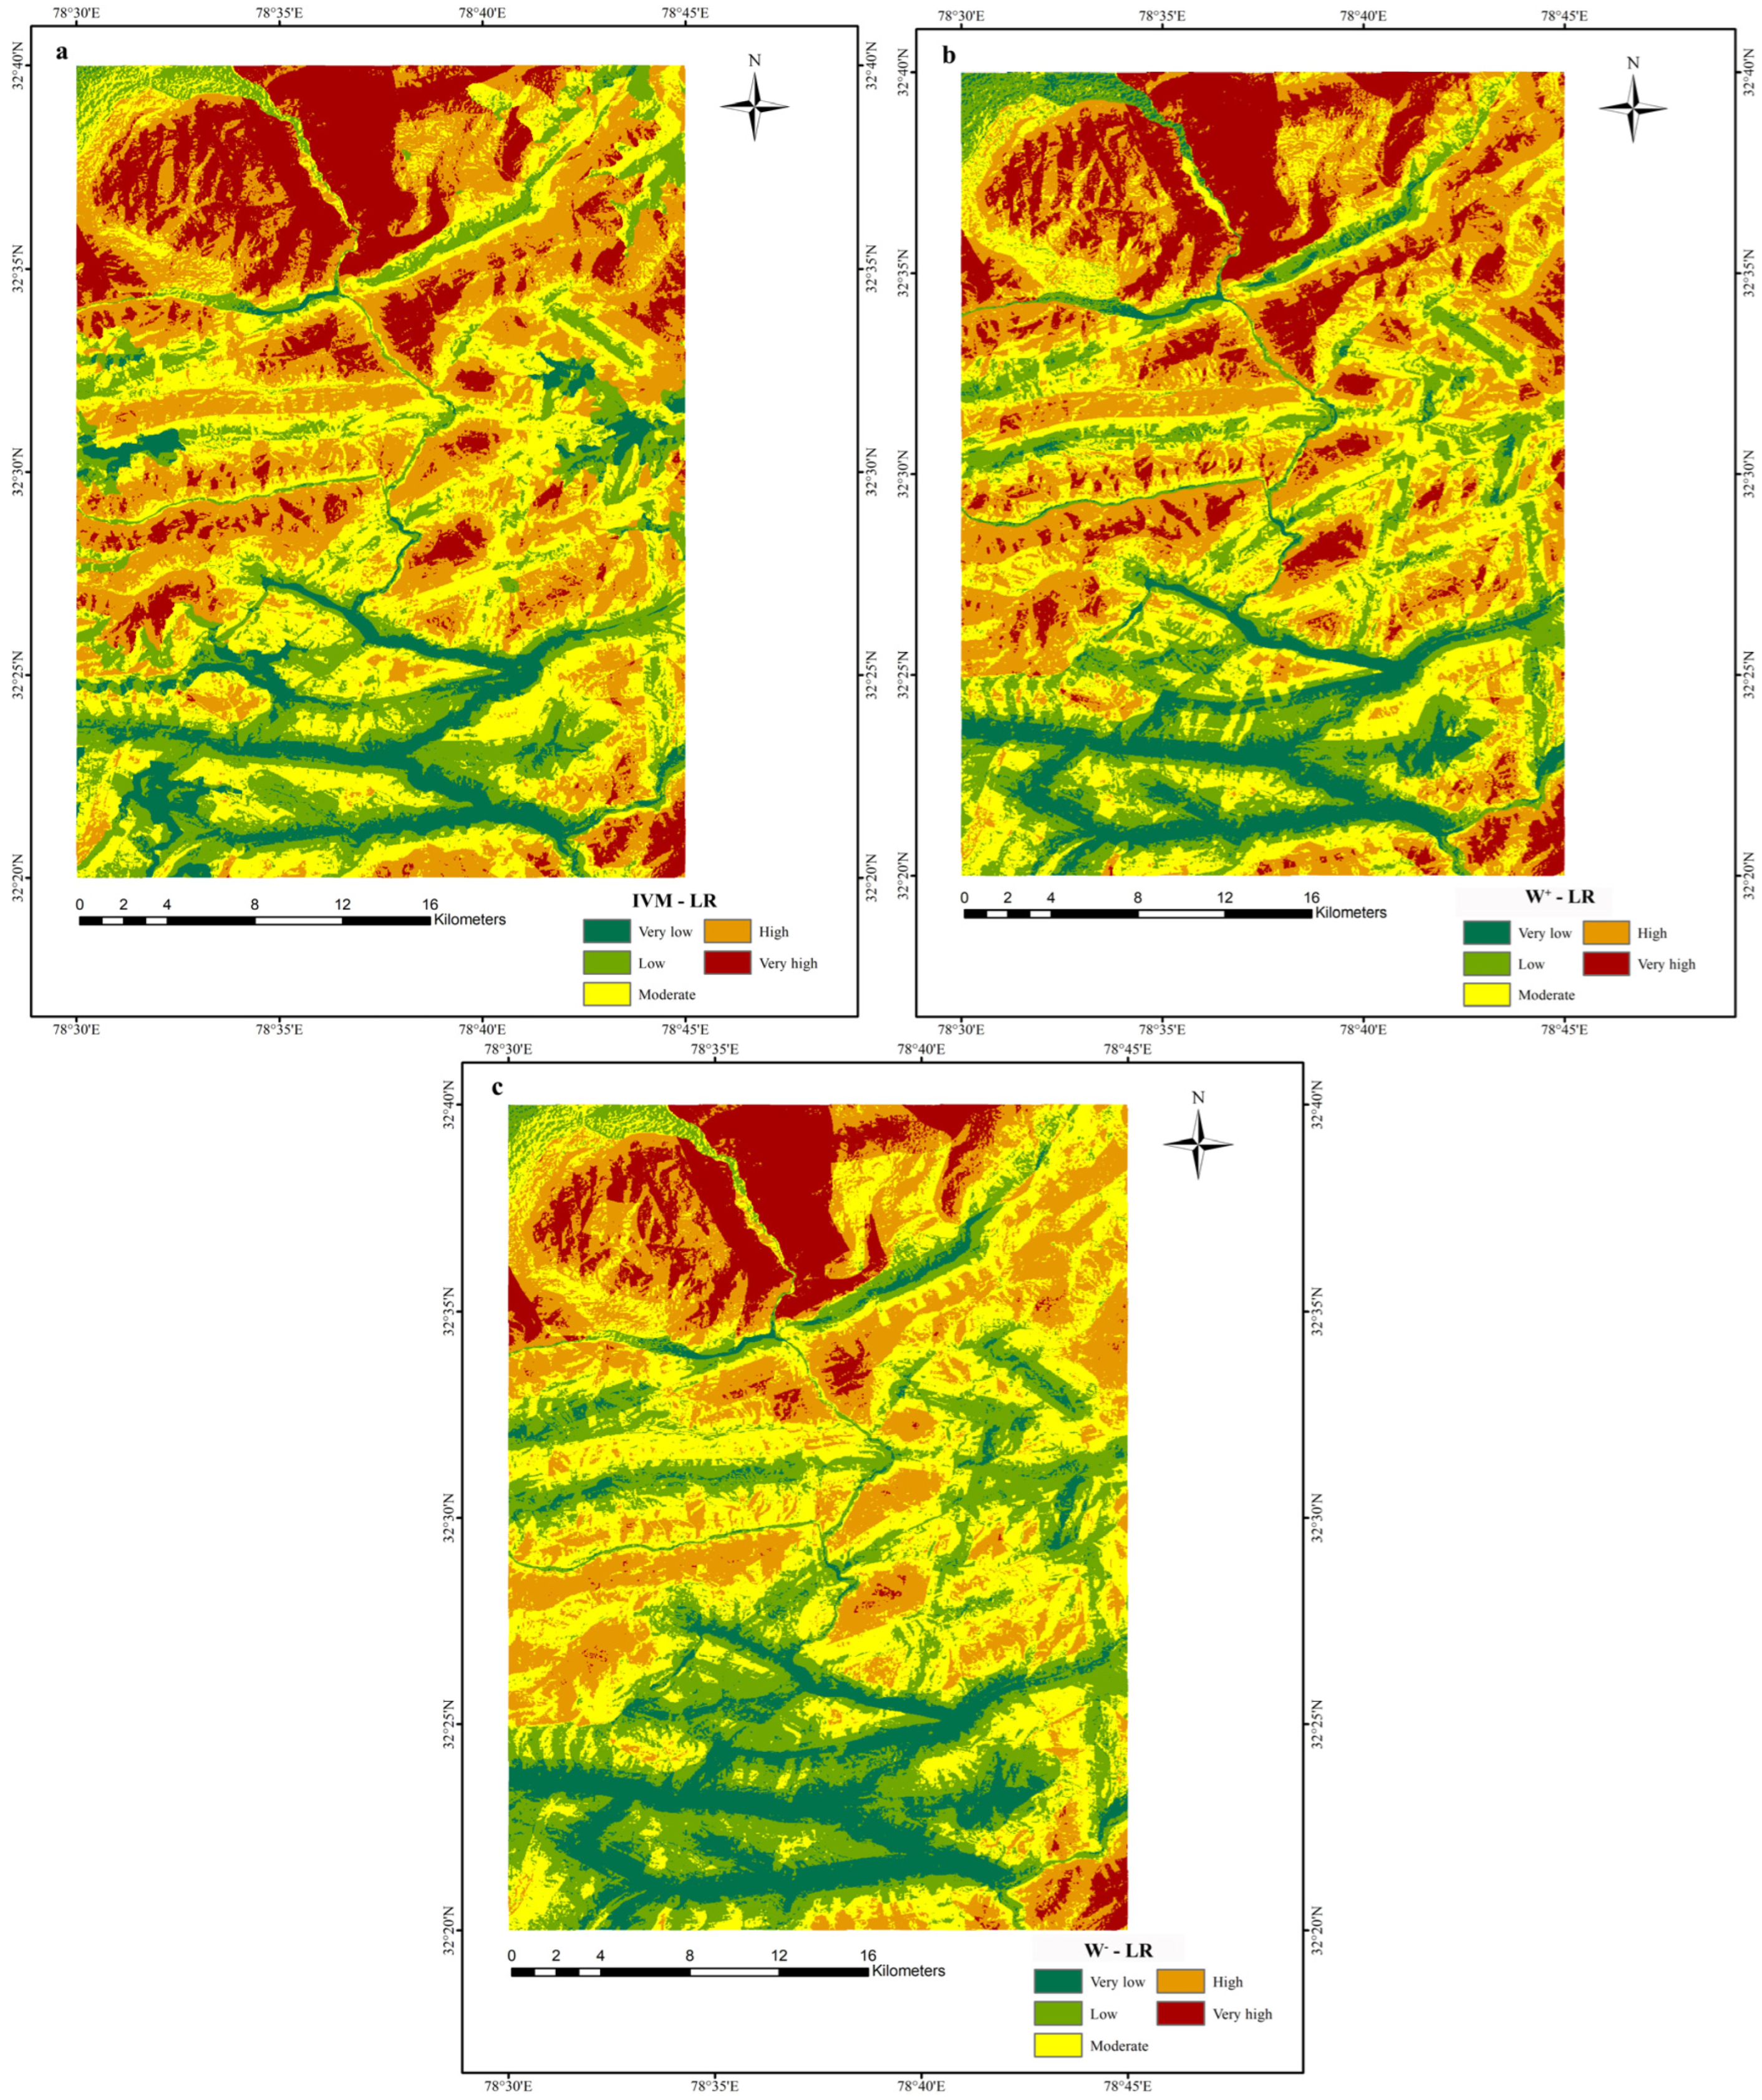
3.3. Landslide Susceptibility Mapping by IVM-LR and WoE-LR Models
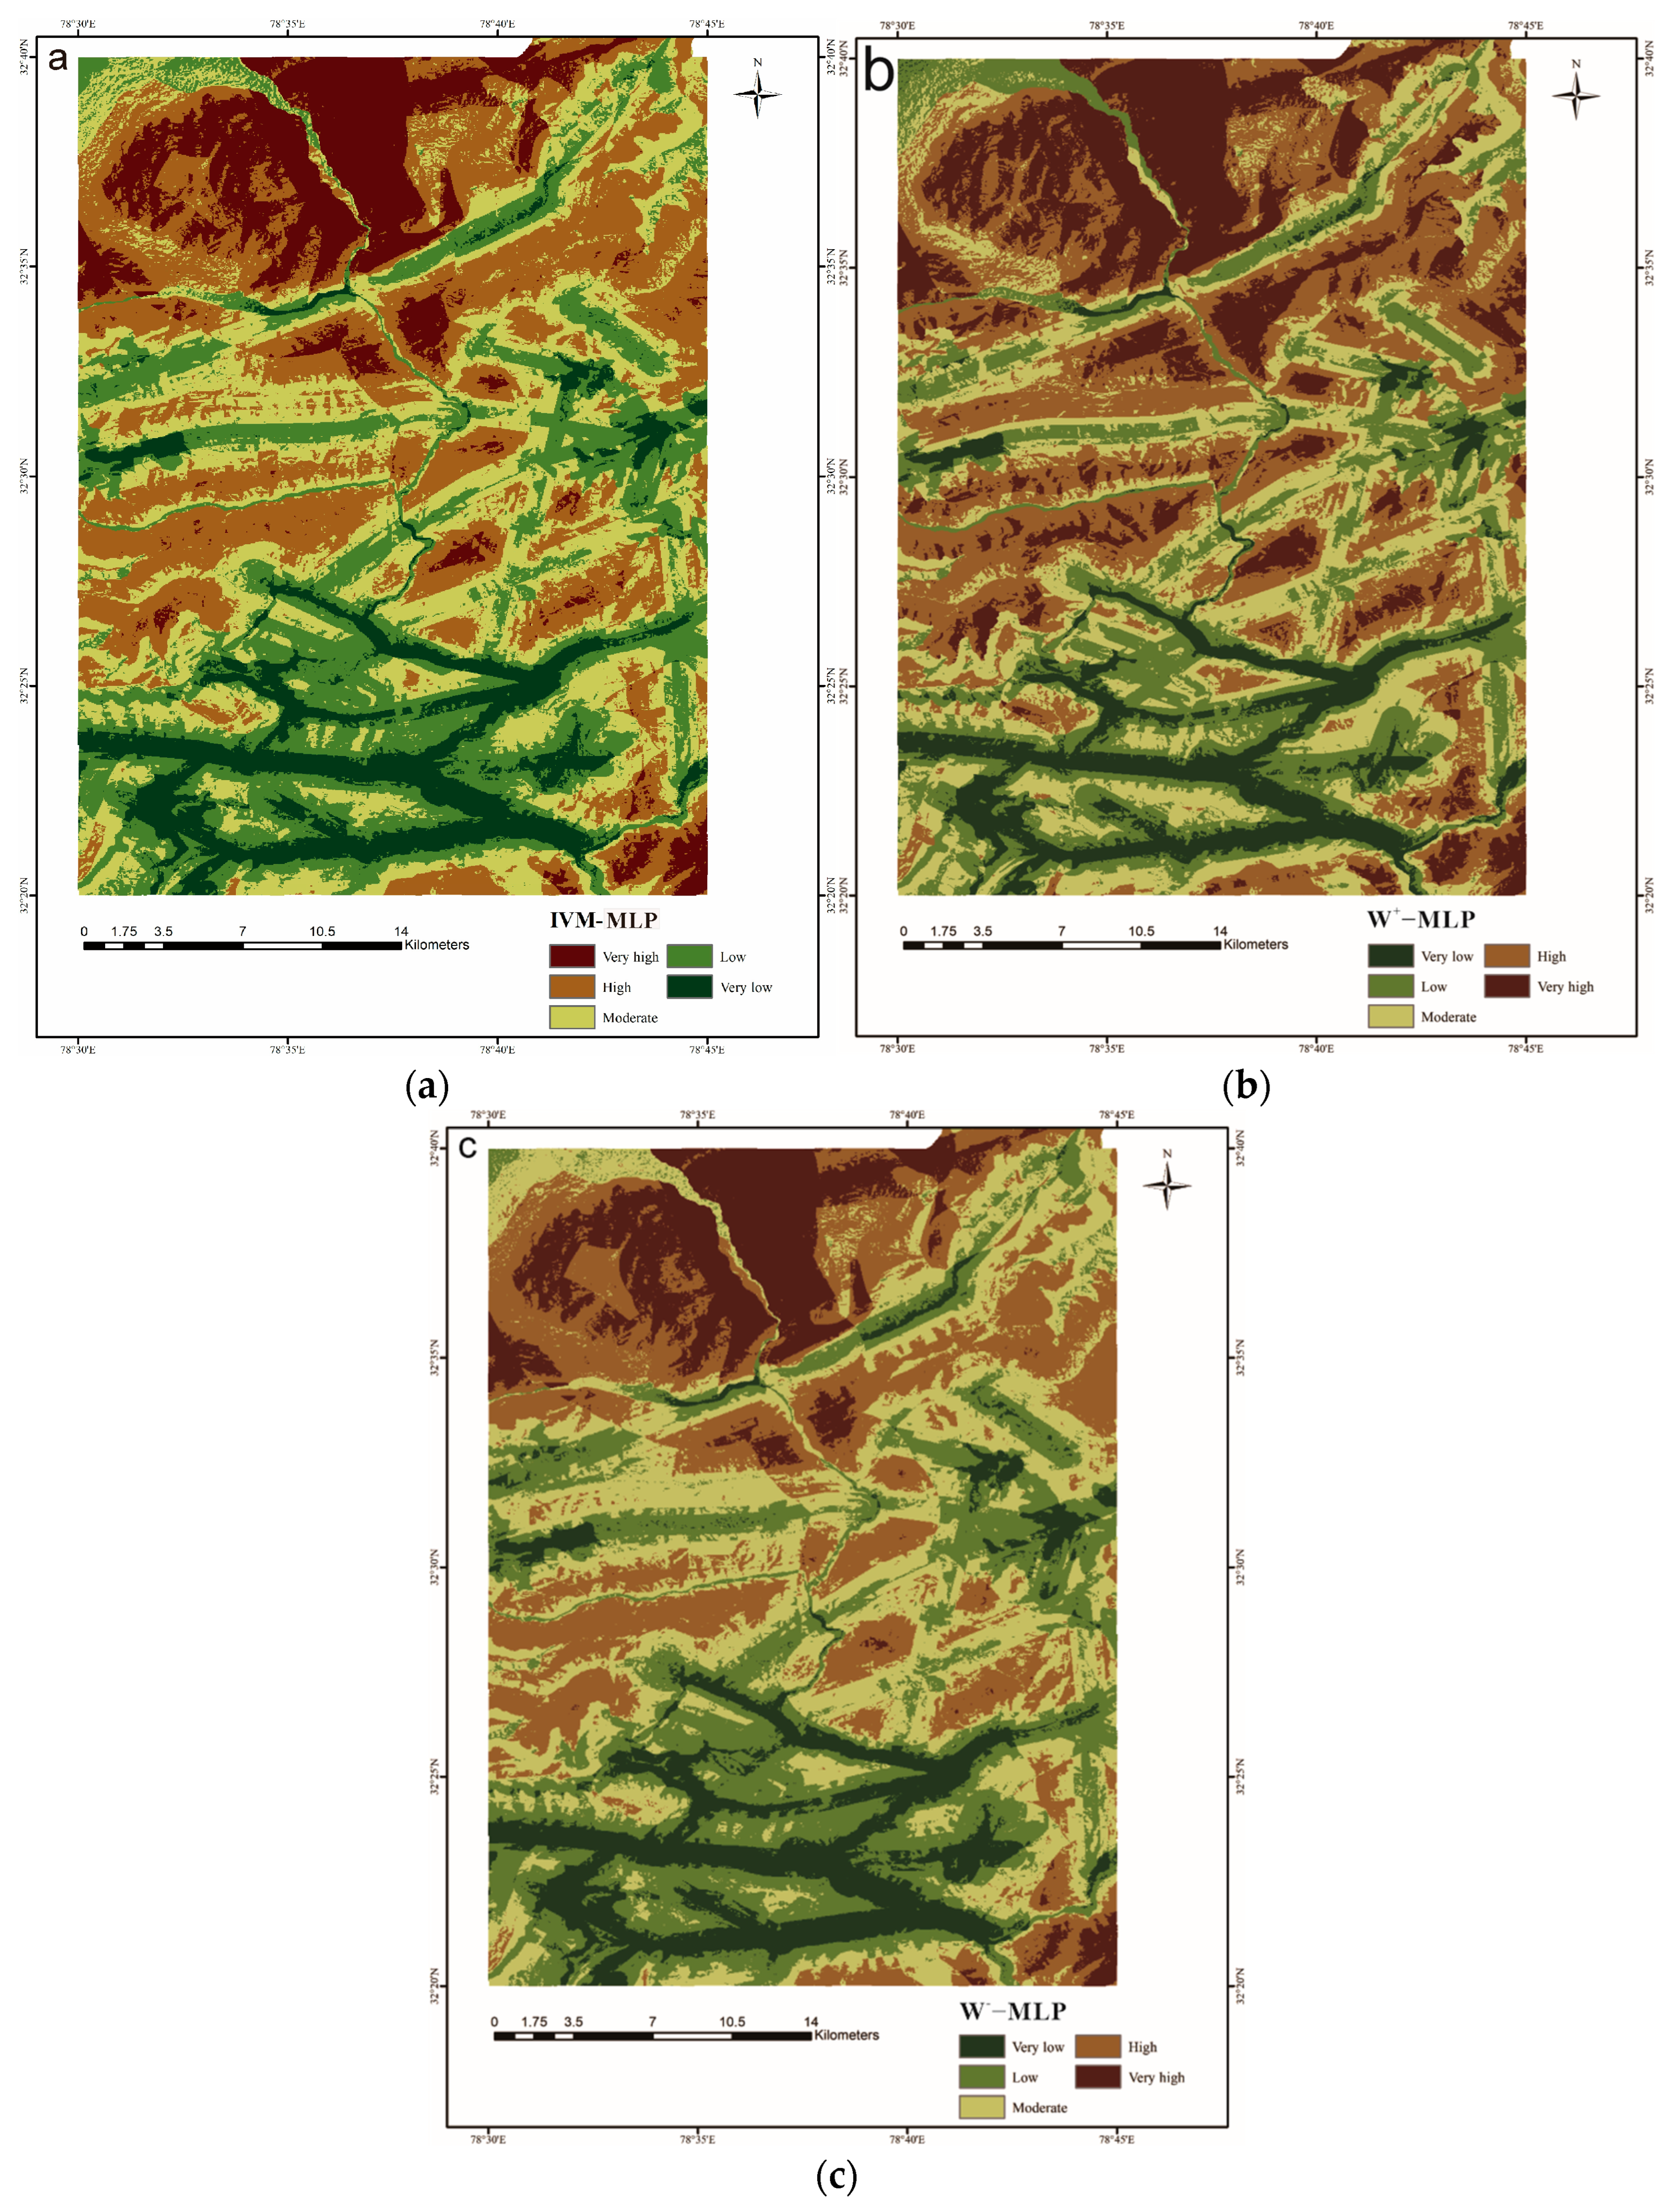
3.4. Landslide Susceptibility Mapping by IVM-MLP and WoE-MLP Models
3.5. ROC Curves
4. Discussion
5. Conclusions
Author Contributions
Funding
Institutional Review Board Statement
Informed Consent Statement
Data Availability Statement
Acknowledgments
Conflicts of Interest
References
- Van Westen, C.J.; Castellanos, E.; Kuriakose, S.L. Spatial data for landslide susceptibility, hazard, and vulnerability assessment: An overview. Eng. Geol. 2008, 102, 112–131. [Google Scholar] [CrossRef]
- Pradhan, B.; Lee, S. Delineation of landslide hazard areas on Penang Island, Malaysia, by using frequency ratio, logistic regression, and artificial neural network models. Environ. Earth Sci. 2010, 60, 1037–1054. [Google Scholar] [CrossRef]
- Gutiérrez, F.; Linares, R.; Roqué, C.; Zarroca, M.; Carbonel, D.; Rosell, J.; Gutiérrez, M. Large landslides associated with a diapiric fold in Canelles Reservoir (Spanish Pyrenees): Detailed geological–geomorphological mapping, trenching and electrical resistivity imaging. Geomorphology 2015, 241, 224–242. [Google Scholar] [CrossRef]
- Zahri, F.; Boukelloul, M.; Hadji, R.; Talhi, K. Slope Stability Analysis in Open Pit Mines of Jebel Gustar Career, Ne Algeria—A Multi-Steps Approach. Min. Sci. 2016, 23, 137–146. [Google Scholar]
- Manchar, N.; Benabbas, C.; Hadji, R.; Bouaicha, F.; Grecu, F. Landslide Susceptibility Assessment in Constantine Region Algeria by Means of Statistical Models. Stud. Geotech. Mech. 2018, 40, 208–219. [Google Scholar] [CrossRef]
- Karim, Z.; Hadji, R.; Hamed, Y. GIS-based approaches for the landslide susceptibility prediction in Setif Region (NE Algeria). Geotech. Geol. Eng. 2019, 37, 359–374. [Google Scholar] [CrossRef]
- Boubazine, L.; Boumazbeur, A.; Hadji, R.; Fares, K. Slope failure characterization: A joint multi-geophysical and geotechnical analysis, case study of Babor Mountains range, NE Algeria. Min. Miner. Depos. 2022, 16, 65–70. [Google Scholar] [CrossRef]
- Hong, H.; Liu, J.; Bui, D.T.; Pradhan, B.; Acharya, T.D.; Pham, B.T.; Zhu, A.-X.; Chen, W.; Ahmad, B.B. Landslide susceptibility mapping using J48 Decision Tree with AdaBoost, Bagging and Rotation Forest ensembles in the Guangchang area (China). Catena 2018, 163, 399–413. [Google Scholar] [CrossRef]
- Anis, Z.; Wissem, G.; Riheb, H.; Biswajeet, P.; Essghaier, G.M. Effects of clay properties in the landslides genesis in flysch massif: Case study of Aïn Draham, North Western Tunisia. J. Afr. Earth Sci. 2019, 151, 146–152. [Google Scholar] [CrossRef]
- Chen, W.; Li, Y. GIS-based evaluation of landslide susceptibility using hybrid computational intelligence models. Catena 2020, 195, 104777. [Google Scholar] [CrossRef]
- Chen, W.; Chen, X.; Peng, J.; Panahi, M.; Lee, S. Landslide susceptibility modeling based on ANFIS with teaching-learning-based optimization and Satin bowerbird optimizer. Geosci. Front. 2021, 12, 93–107. [Google Scholar] [CrossRef]
- Hadji, R.; Boumazbeur, A.; Limani, Y.; Baghem, M.; Chouabi, A. Geologic, topographic and climatic controls in landslide hazard assessment using GIS modeling: A case study of Souk Ahras region, NE Algeria. Quat. Int. 2013, 302, 224–237. [Google Scholar] [CrossRef]
- Hadji, R.; Limani, Y.; Demdoum, A. Using multivariate approach and GIS applications to predict slope instability hazard case study of Machrouha municipality, NE Algeria. In Proceedings of the 1st International Conference on Information and Communication Technologies for Disaster Management (ICT-DM), Algiers, Algeria, 24–25 March 2014; IEEE: Piscataway, NJ, USA, 2014. [Google Scholar]
- Hadji, R.; Chouabi, A.; Gadri, L.; Raïs, K.; Hamed, Y.; Boumazbeur, A. Application of linear indexing model and GIS techniques for the slope movement susceptibility modeling in Bousselam upstream basin, Northeast Algeria. Arab. J. Geosci. 2016, 9, 192. [Google Scholar] [CrossRef]
- Hadji, R.; Raïs, K.; Gadri, L.; Chouabi, A.; Hamed, Y. Slope failures characteristics and slope movement susceptibility assessment using GIS in a medium scale: A case study from Ouled Driss and Machroha municipalities, Northeastern of Algeria. Arab. J. Sci. Eng. 2017, 42, 281–300. [Google Scholar] [CrossRef]
- Hadji, R.; Achour, Y.; Hamed, Y. Using GIS and RS for Slope Movement Susceptibility Mapping: Comparing AHP, LI and LR Methods for the Oued Mellah Basin, NE Algeria. In Recent Advances in Environmental Science from the Euro-Mediterranean and Surrounding Regions. EMCEI 2017. Advances in Science, Technology & Innovation (IEREK Interdisciplinary Series for Sustainable Development); Kallel, A., Ksibi, M., Ben Dhia, H., Khélifi, N., Eds.; Springer: Cham, Switzerland, 2017. [Google Scholar]
- Hadji, R. La cartographie du risque glissements de terrain sur le flanc sud-est de l’atlas tellien, N.E. Algérie. In Gérer les Risques Naturels: Pratiques et Outils; Collection «Géorisques»; Léone, F., Vinet, F., Eds.; Presses Universitaires de la Méditerranée—PULM, University Paul Valéry: Montpellier, France, 2017; pp. 155–168. ISBN 978-2-36781-243-4. ISSN 1956-4252. [Google Scholar]
- Sengani, F.; Mashao, F.M.; Allopi, D. An integrated approach to develop a slope susceptibility map based on a GIS-based approach, soft computing technique and finite element formulation of the bound theorems. Transp. Geotech. 2022, 36, 1–16. [Google Scholar] [CrossRef]
- Basharat, M.; Shah, H.R.; Hameed, N. Landslide susceptibility mapping using GIS and weighted overlay method: A case study from NW Himalayas, Pakistan. Arab. J. Geosci. 2016, 9, 292. [Google Scholar] [CrossRef]
- Hussin, H.Y.; Zumpano, V.; Reichenbach, P.; Sterlacchini, S.; Micu, M.; van Westen, C.; Bălteanu, D. Different landslide sampling strategies in a grid-based bi-variate statistical susceptibility model. Geomorphology 2016, 253, 508–523. [Google Scholar] [CrossRef]
- Cui, K.; Lu, D.; Li, W. Comparison of landslide susceptibility mapping based on statistical index, certainty factors, weights of evidence and evidential belief function models. Geocarto Int. 2017, 32, 935–955. [Google Scholar] [CrossRef]
- Fan, W.; Wei, X.; Cao, Y.; Zheng, B. Landslide susceptibility assessment using the certainty factor and analytic hierarchy process. J. Mt. Sci. 2017, 14, 906–925. [Google Scholar] [CrossRef]
- Dahoua, L.; Savenko, V.Y.; Hadji, R. GIS-based technic for roadside-slope stability assessment: An bivariate approach for A1 East-west highway, North Algeria. Min. Sci. 2017, 24, 81–91. [Google Scholar]
- Medina, A.V.J. Fast physically-based model for rainfall-induced landslide susceptibility assessment at regional scale. Catena Interdiscip. J. Soil Sci. Hydrol.-Geomorphol. Focus. Geoecology Landsc. Evol. 2021, 201. [Google Scholar] [CrossRef]
- Kayastha, P.; Dhital, M.R.; De Smedt, F. Application of the analytical hierarchy process (AHP) for landslide susceptibility mapping: A case study from the Tinau watershed, west Nepal. Comput. Geosci. 2013, 52, 398–408. [Google Scholar] [CrossRef]
- Ozdemir, A.; Altural, T. A comparative study of frequency ratio, weights of evidence and logistic regression methods for landslide susceptibility mapping: Sultan Mountains, SW Turkey. J. Asian Earth Sci. 2013, 64, 180–197. [Google Scholar] [CrossRef]
- Sharma, L.P.; Patel, N.; Ghose, M.K.; Debnath, P. Development and application of Shannon’s entropy integrated information value model for landslide susceptibility assessment and zonation in Sikkim Himalayas in India. Nat. Hazards 2014, 75, 1555–1576. [Google Scholar] [CrossRef]
- Zhao, Z.; Liu, Z.Y.; Xu, C. Slope unit-based landslide susceptibility mapping using certainty factor (cf), support vector machine (svm), random forest (rf), cf-svm and cf-rf models. Front. Earth Sci. 2021, 9, 589630. [Google Scholar] [CrossRef]
- Chiang, S.H.; Chang, K.T.; Mondini, A.C.; Tsai, B.W.; Chen, C.Y. Simulation of event-based landslides and debris flows at watershed level. Geomorphology 2012, 138, 306–318. [Google Scholar] [CrossRef]
- Gomes, R.A.T.; Guimarães, R.F.; Carvalho Júnior, O.A.D.; Fernandes, N.F.; Amaral Júnior, E.V.D. Combining spatial models for shallow landslides and debris-flows prediction. Remote Sens. 2013, 5, 2219–2237. [Google Scholar] [CrossRef]
- Nourani, V.; Pradhan, B.; Ghaffari, H.; Sharifi, S.S. Landslide susceptibility mapping at Zonouz Plain, Iran using genetic programming and comparison with frequency ratio, logistic regression, and artificial neural network models. Nat. Hazards 2014, 71, 523–547. [Google Scholar] [CrossRef]
- Yusof, N.M.; Pradhan, B.; Shafri, H.Z.M.; Jebur, M.N.; Yusoff, Z. Spatial landslide hazard assessment along the Jelapang Corridor of the North-South Expressway in Malaysia using high resolution airborne LiDAR data. Arab. J. Geosci. 2015, 8, 9789–9800. [Google Scholar] [CrossRef]
- El Mekki, A.; Hadji, R.; Chemseddine, F. Use of slope failures inventory and climatic data for landslide susceptibility, vulnerability, and risk mapping in souk Ahras region. Min. Sci. 2017, 24, 237–249. [Google Scholar]
- Mahdadi, F.; Boumezbeur, A.; Hadji, R.; Kanungo, D.P.; Zahri, F. GIS-based landslide susceptibility assessment using statistical models: A case study from Souk Ahras province, N-E Algeria. Arab. J. Geosci. 2018, 11, 476. [Google Scholar] [CrossRef]
- Pham, B.T.; Prakash, I.; Khosravi, K.; Chapi, K.; Trinh, P.T.; Ngo, T.Q.; Hosseini, S.V.; Bui, D.T. A comparison of Support Vector Machines and Bayesian algorithms for landslide susceptibility modelling. Geocarto Int. 2019, 34, 1385–1407. [Google Scholar] [CrossRef]
- Balsubramani, K.; Kumaraswamy, K. Application of geospatial technology and information value technique in landslide hazard zonation mapping: A case study of Giri Valley, Himachal Pradesh. Disaster Adv. 2013, 6, 38–47. [Google Scholar] [CrossRef]
- Xu, C.; Dai, F.C.; Xu, X.; Lee, Y.H. GIS-based support vector machine modeling of earthquake-triggered landslide susceptibility in the Jianjiang River watershed, China. Geomorphology 2012, 145, 70–80. [Google Scholar] [CrossRef]
- Sujatha, E.R.; Kumaravel, P.; Rajamanickam, G.V. Assessing landslide susceptibility using Bayesian probability-based weight of evidence model. Bull. Eng. Geol. Environ. 2014, 73, 147–161. [Google Scholar] [CrossRef]
- Wang, Q.Q.; Li, W.P.; Xing, M.L.; Wu, Y.L.; Pei, Y.B.; Yang, D.D.; Bai, H.Y. Landslide susceptibility mapping at Gongliu county, China using artificial neural network and weight of evidence models. Geosci. J. 2016, 20, 705–718. [Google Scholar] [CrossRef]
- Chen, W.; Sun, Z.; Han, J. Landslide susceptibility modeling using integrated ensemble weights of evidence with logistic regression and random forest models. Appl. Sci. 2019, 9, 171. [Google Scholar] [CrossRef]
- Choi, J.W.; Oh, H.J.; Lee, H.J.; Lee, C.W.; Lee, S. Combining landslide susceptibility maps obtained from frequency ratio, logistic regression, and artificial neural network models using ASTER images and GIS. Eng. Geol. 2012, 124, 12–23. [Google Scholar] [CrossRef]
- Althuwaynee, O.F.; Pradha, B.; Park, H.J.; Lee, J.H. A novel ensemble bivariate statistical evidential belief function with knowledge-based analytical hierarchy process and multivariate statistical logistic regression for landslide susceptibility mapping. Catena 2014, 114, 21–36. [Google Scholar] [CrossRef]
- Hong, H.Y.; Pradhan, B.; Xu, C.; Dieu, T.B. Spatial prediction of landslide hazard at the Yihuang area (China) using two-class kernel logistic regression, alternating decision tree and support vector machines. Catena 2015, 133, 266–281. [Google Scholar] [CrossRef]
- Hong, H.; Chen, W.; Xu, C.; Youssef, A.M.; Pradhan, B.; Tien Bui, D. Rainfall-induced landslide susceptibility assessment at the Chongren area (China) using frequency ratio, certainty factor, and index of entropy. Geocarto Int. 2016, 32, 139–154. [Google Scholar] [CrossRef]
- Chen, W.; Pourghasemi, H.R.; Zhao, Z. A gis-based comparative study of dempster-shafer, logistic regression and artificial neural network models for landslide susceptibility mapping. Geocarto Int. 2017, 32, 367–385. [Google Scholar] [CrossRef]
- Meghanadh, D.; Maurya, V.K.; Tiwari, A.; Dwivedi, R. A multi-criteria landslide susceptibility mapping using deep multi-layer perceptron network: A case study of srinagar-rudraprayag region (India). Adv. Space Res. 2022, 69, 1883–1893. [Google Scholar] [CrossRef]
- Hong, H.; Tsangaratos, P.; Ilia, I.; Loupasakis, C.; Wang, Y. Introducing a novel multi-layer perceptron network based on stochastic gradient descent optimized by a meta-heuristic algorithm for landslide susceptibility mapping. Sci. Total Environ. 2020, 742, 140549. [Google Scholar] [CrossRef] [PubMed]
- Li, D.; Huang, F.; Yan, L.; Cao, Z.; Ye, Z. Landslide susceptibility prediction using particle-swarm-optimized multilayer perceptron: Comparisons with multilayer-perceptron-only, bp neural network, and information value models. Appl. Sci. 2019, 9, 3664. [Google Scholar] [CrossRef]
- Sara, F.; Silvia, B.; Sandro, M. Landslide inventory updating by means of Persistent Scatterer Interferometry (PSI): The Setta basin (Italy) case study. Geomat. Nat. Haz. Risk 2015, 6, 419–438. [Google Scholar] [CrossRef]
- Hong, H.; Ilia, I.; Tsangaratos, P.; Chen, W.; Xu, C. A hybrid fuzzy weight of evidence method in landslide susceptibility analysis on the Wuyuan area, China. Geomorphology 2017, 290, 1–16. [Google Scholar] [CrossRef]
- Pourghasemi, H.R.; Pradhan, B.; Gokceoglu, C. Application of fuzzy logic and analytical hierarchy process (AHP) to landslide susceptibility mapping at Haraz watershed, Iran. Nat. Hazards 2012, 63, 965–996. [Google Scholar] [CrossRef]
- Pourghasemi, H.R.; Teimoori Yansari, Z.; Panagos, P.; Pradhan, B. Analysis and evaluation of landslide susceptibility: A review on articles published during 2005–2016 (periods of 2005–2012 and 2013–2016). Arab. J. Geosci. 2018, 11, 193. [Google Scholar] [CrossRef]
- Chen, W.; Chai, H.; Sun, X.; Wang, Q.; Ding, X.; Hong, H. A GIS-based comparative study of frequency ratio, statistical index and weights-of-evidence models in landslide susceptibility mapping. Arab. J. Geosci. 2016, 9, 204. [Google Scholar] [CrossRef]
- Vakhshoori, V.; Zare, M. Landslide susceptibility mapping by comparing weight of evidence, fuzzy logic, and frequency ratio methods. Geomat. Nat. Hazards Risk 2016, 7, 1731–1752. [Google Scholar] [CrossRef]
- Chen, T.; Niu, R.; Jia, X. A comparison of information value and logistic regression models in landslide susceptibility mapping by using GIS. J. Environ. Earth Sci. 2016, 75, 867. [Google Scholar] [CrossRef]
- Bonham-Carter, G.F.; Agterberg, F.P.; Wright, D.F. Integration of geological datasets for gold exploration in Nova Scotia. Photogram Eng. Remote Sens. 1988, 54, 1585–1592. [Google Scholar] [CrossRef]
- Mohammady, M.; Pourghasemi, H.R.; Pradhan, B. Landslide susceptibility mapping at Golestan Province, Iran: A comparison between frequency ratio, Dempster–Shafer, and weights-of-evidence models. J. Asian Earth Sci. 2012, 61, 221–236. [Google Scholar] [CrossRef]
- Xu, C.; Xu, X.W.; Dai, F.C.; Saraf, A.K. Comparison of different models for susceptibility mapping of earthquake triggered landslides related with the 2008 Wenchuan earthquake in China. Comput. Geosci. 2012, 46, 317–329. [Google Scholar] [CrossRef]
- Guo, C.B.; Montgomery, D.R.; Zhang, Y.S.; Wang, K.; Yang, Z.H. Quantitative assessment of landslide susceptibility along the Xianshuihe fault zone, Tibetan plateau, China. Geomorphology 2015, 248, 93–110. [Google Scholar] [CrossRef]
- Ilia, I.; Tsangaratos, P. Applying weight of evidence method and sensitivity analysis to produce a landslide susceptibility map. Landslides 2016, 13, 379–397. [Google Scholar] [CrossRef]
- Van Westen, C.J. National scale landslide susceptibility assessment for Dominica. In Caribbean Handbook on Risk Information Management; University of Twente: Washington, DC, USA, 2016. [Google Scholar] [CrossRef]
- Wu, Z.; Wu, Y.; Yang, Y.; Chen, F.; Zhang, N.; Ke, Y.; Li, W. A comparative study on the landslide susceptibility mapping using logistic regression and statistical index models. Arab. J. Geosci. 2017, 10, 187. [Google Scholar] [CrossRef]
- Lombardo, L.; Mai, P.M. Presenting logistic regression-based landslide susceptibility results. Eng. Geol. 2018, 244, 14–24. [Google Scholar] [CrossRef]
- Yang, J.; Song, C.; Yang, Y.; Xu, C.; Guo, F.; Xie, L. New method for landslide susceptibility mapping supported by spatial logistic regression and GeoDetector: A case study of Duwen Highway Basin, Sichuan Province, China. Geomorphology 2019, 324, 62–71. [Google Scholar] [CrossRef]
- Daya, S.B.; Cheng, Q.; Agterberg, F. Handbook of Mathematical Geosciences; Springer International Publishing: Cham, Switzerland, 2018. [Google Scholar] [CrossRef]
- Pham, B.T.; Tien Bui, D.; Prakash, I.; Dholakia, M.B. Hybrid integration of multilayer perceptron neural networks and machine learning ensembles for landslide susceptibility assessment at Himalayan area (India) using GIS. Catena 2017, 149, 52–63. [Google Scholar] [CrossRef]
- Zhou, C.; Yin, K.; Cao, Y.; Ahmed, B.; Li, Y.; Catani, F.; Pourghasemi, H.R. Landslide susceptibility modeling applying machine learning methods: A case study from Longju in the three Gorges Reservoir area, China. Comput. Geosci. 2018, 112, 23–37. [Google Scholar] [CrossRef]
- Dou, J.; Chang, K.-T.; Chen, S.; Yunus, A.; Liu, J.-K.; Xia, H.; Zhu, Z. Automatic case-based reasoning approach for landslide detection: Integration of object-oriented image analysis and a genetic algorithm. Remote Sens. 2015, 7, 4318–4342. [Google Scholar] [CrossRef]
- Liang, Z.; Peng, W.; Liu, W.; Huang, H.; Huang, J.; Lou, K.; Liu, G.; Jiang, K. Exploration and comparison of the effect of conventional and advanced modeling algorithms on landslide susceptibility prediction: A case study from Yadong Country, Tibet. Appl. Sci. 2023, 13, 7276. [Google Scholar] [CrossRef]
- Park, S.; Choi, C.; Kim, B.; Kim, J. Landslide susceptibility mapping using frequency ratio, analytic hierarchy process, logistic regression, and artificial neural network methods at the Inje area, Korea. Environ. Earth Sci. 2013, 6, 1443–1464. [Google Scholar] [CrossRef]
- Zhao, C.; Chen, W.; Wang, Q.; Wu, Y.; Yang, B. A comparative study of statistical index and certainty factor models in landslide susceptibility mapping: A case study for the Shangzhou District, Shaanxi Province, China. Arab. J. Geosci. 2015, 8, 9079–9088. [Google Scholar] [CrossRef]
- Tien Bui, D.; Tuan, T.A.; Klempe, H.; Pradhan, B.; Revhaug, I. Spatial prediction models for shallow landslide hazards: A comparative assessment of the efficacy of support vector machines, artificial neural networks, kernel logistic regression, and logistic model tree. Landslides 2016, 13, 361–378. [Google Scholar] [CrossRef]
- Achour, Y.; Pourghasemi, H.R. How do machine learning techniques help in increasing accuracy of landslide susceptibility maps? Geosci. Front. 2019, 11, 871–883. [Google Scholar] [CrossRef]
- Hong, H.; Liu, J.; Zhu, A.-X.; Shahabi, H.; Pham, B.T.; Chen, W.; Pradhan, B.; Bui, D.T. A novel hybrid integration model using support vector machines and random subspace for weather-triggered landslide susceptibility assessment in the Wuning area (China). Environ. Earth Sci. 2017, 76, 652. [Google Scholar] [CrossRef]
- Xiao, T.; Yin, K.; Yao, T.; Liu, S. Spatial prediction of landslide susceptibility using GIS-based statistical and machine learning models in Wanzhou County, Three Gorges Reservoir, China. Acta Geochim. 2019, 38, 654–669. [Google Scholar] [CrossRef]
- Napoli, M.D.; Carotenuto, F.; Cevasco, A.; Confuorto, P.; Calcaterra, D. Machine learning ensemble modelling as a tool to improve landslide susceptibility mapping reliability. Landslides 2020, 17, 1897–1914. [Google Scholar] [CrossRef]

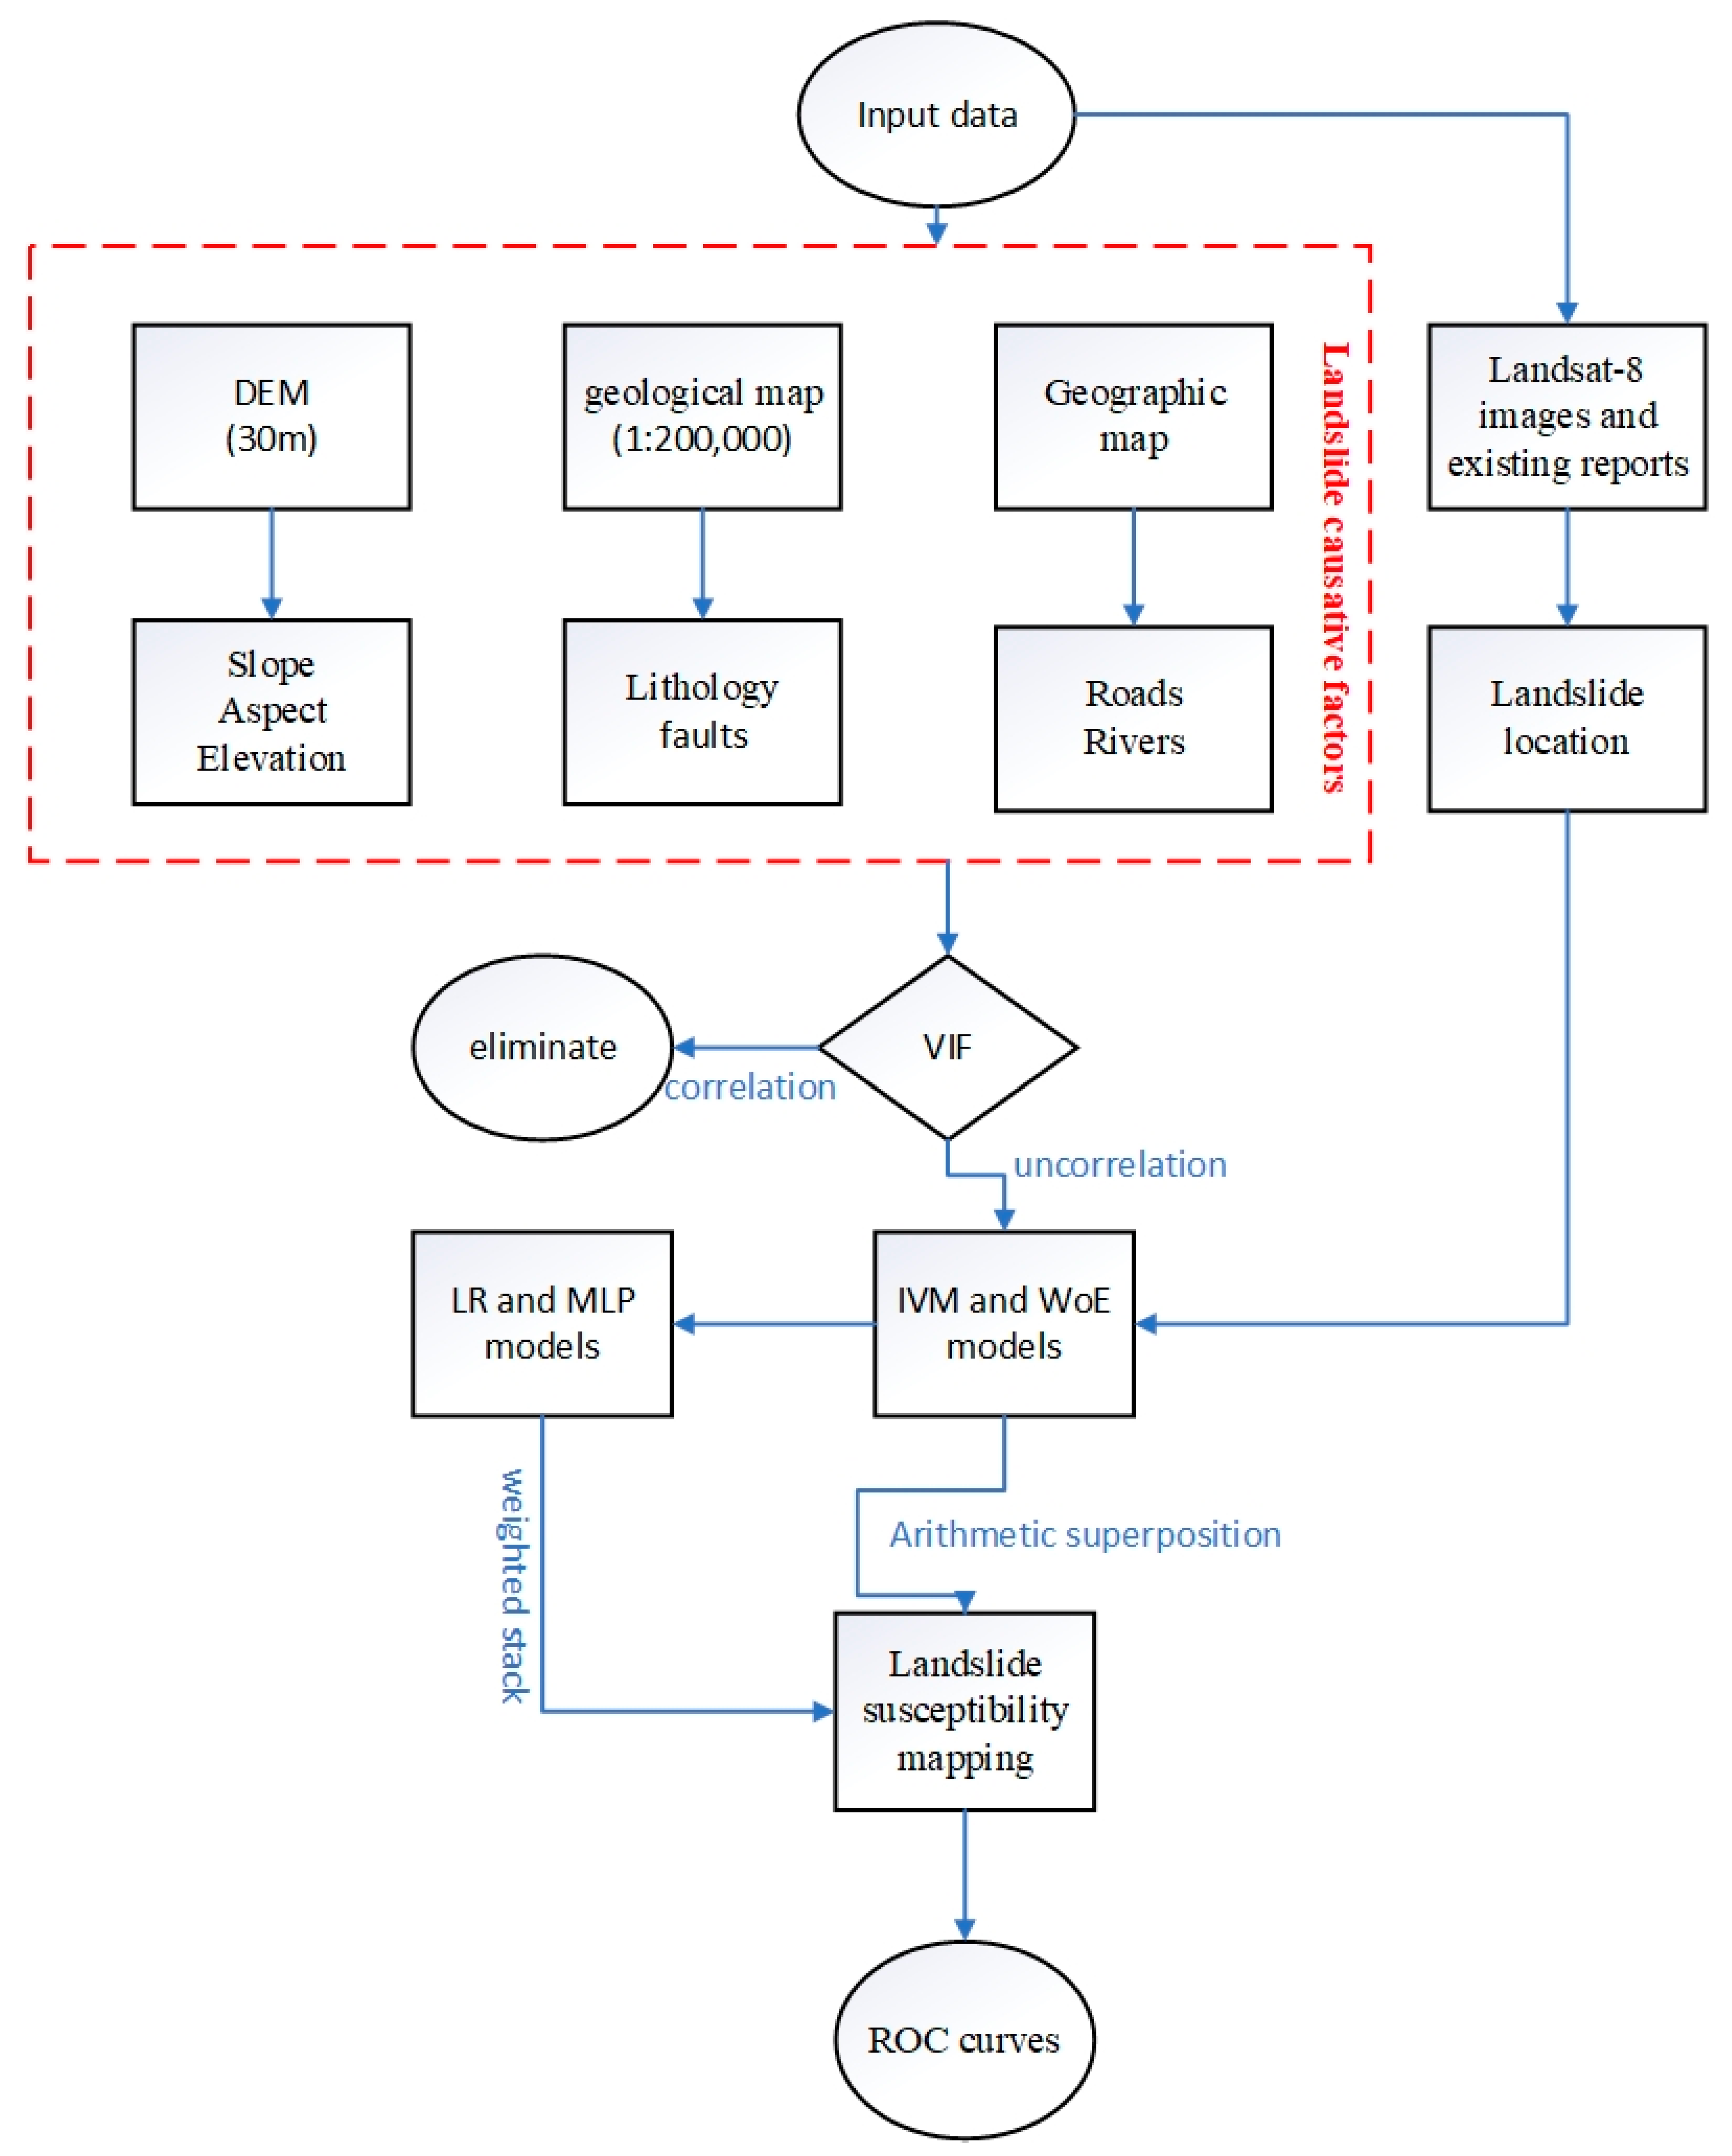
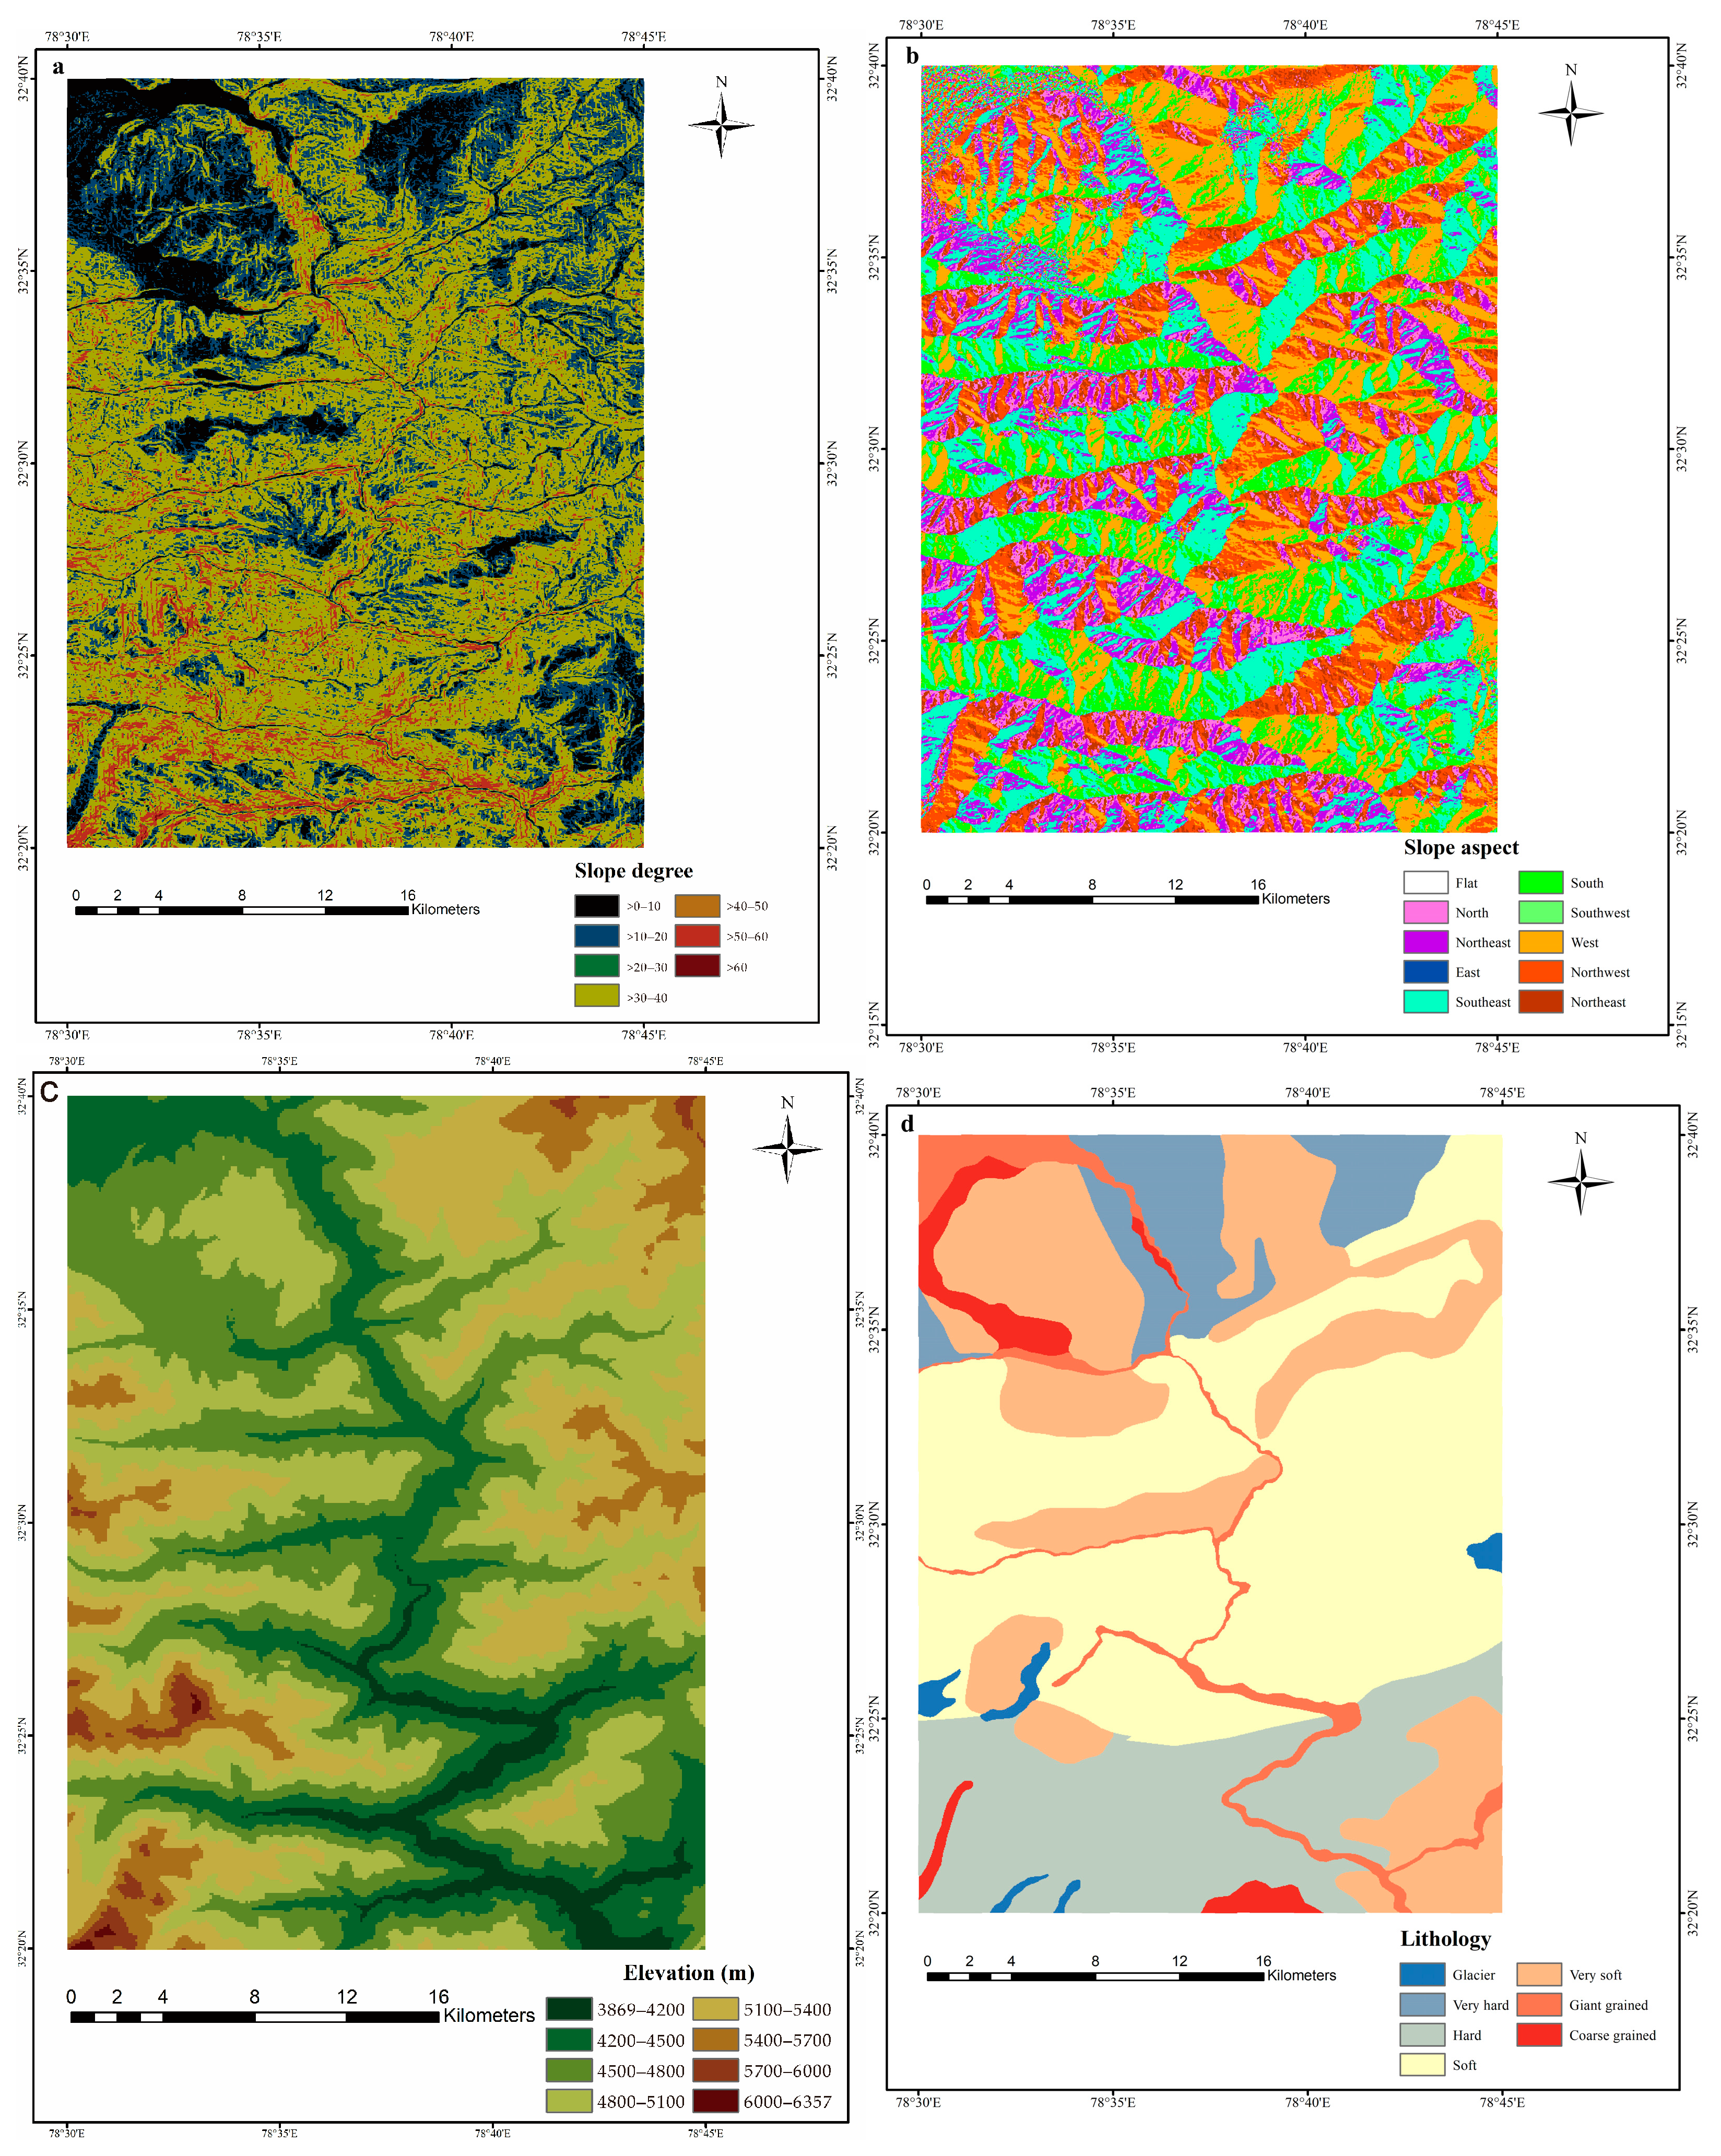
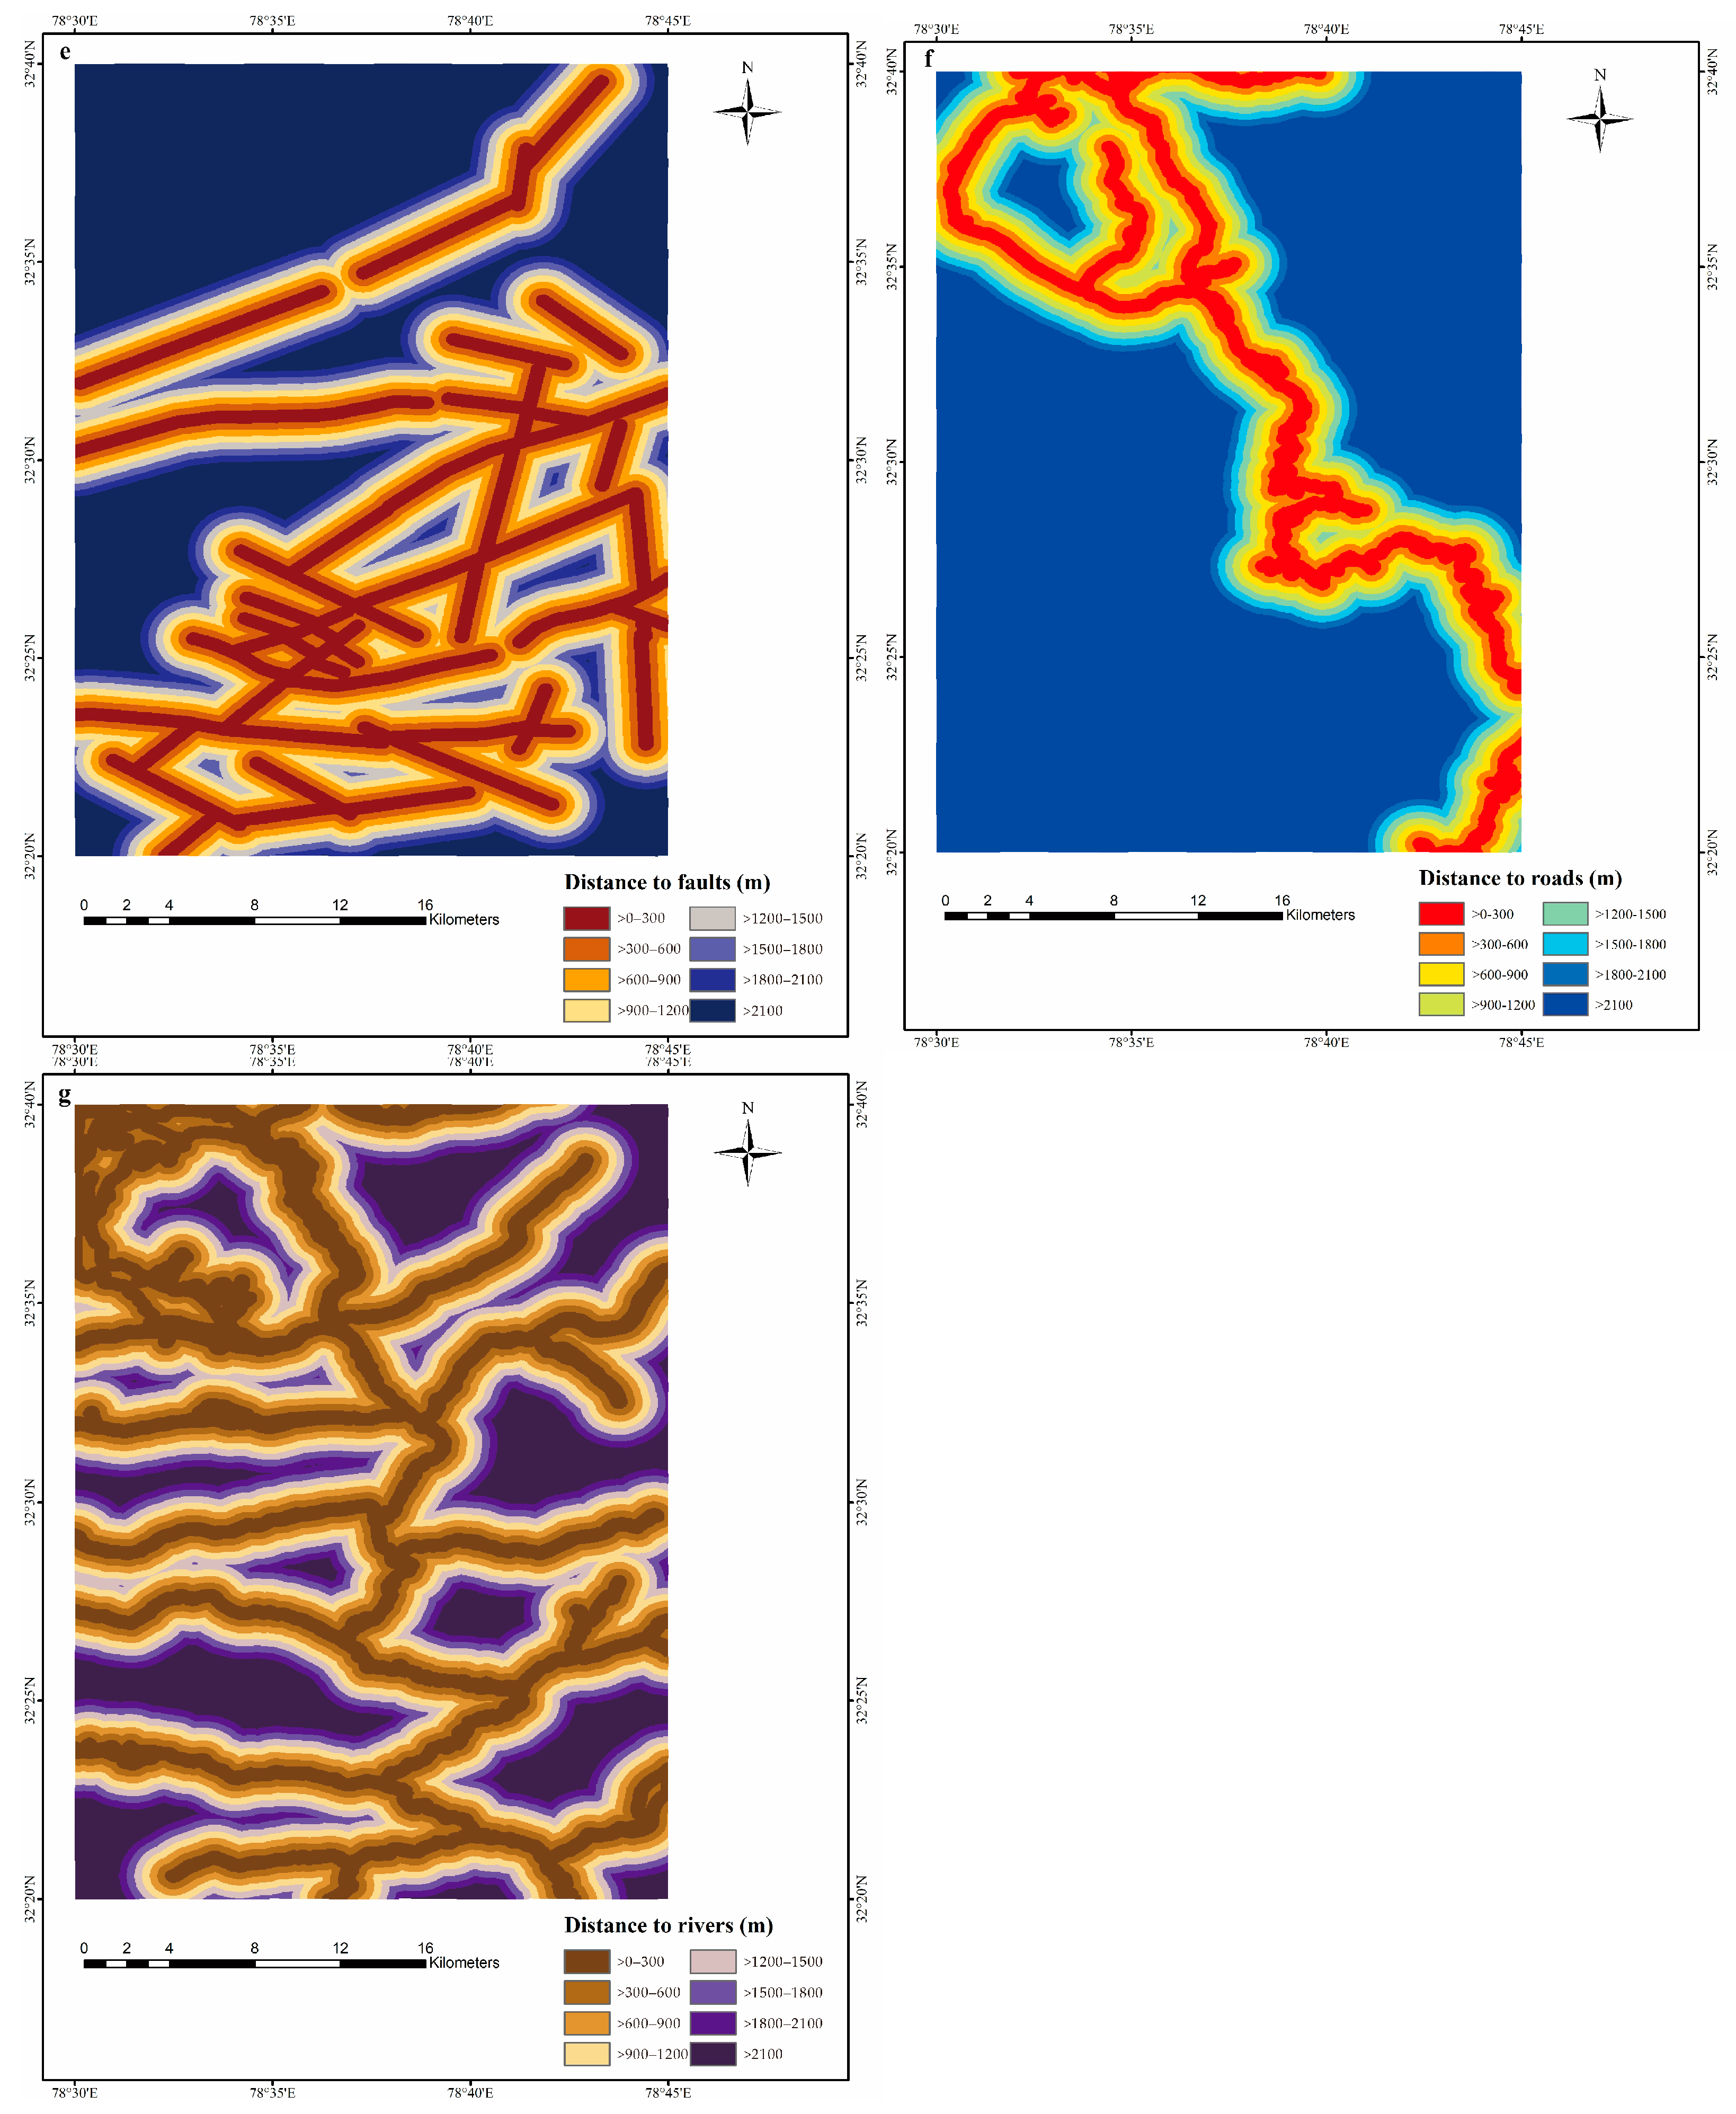


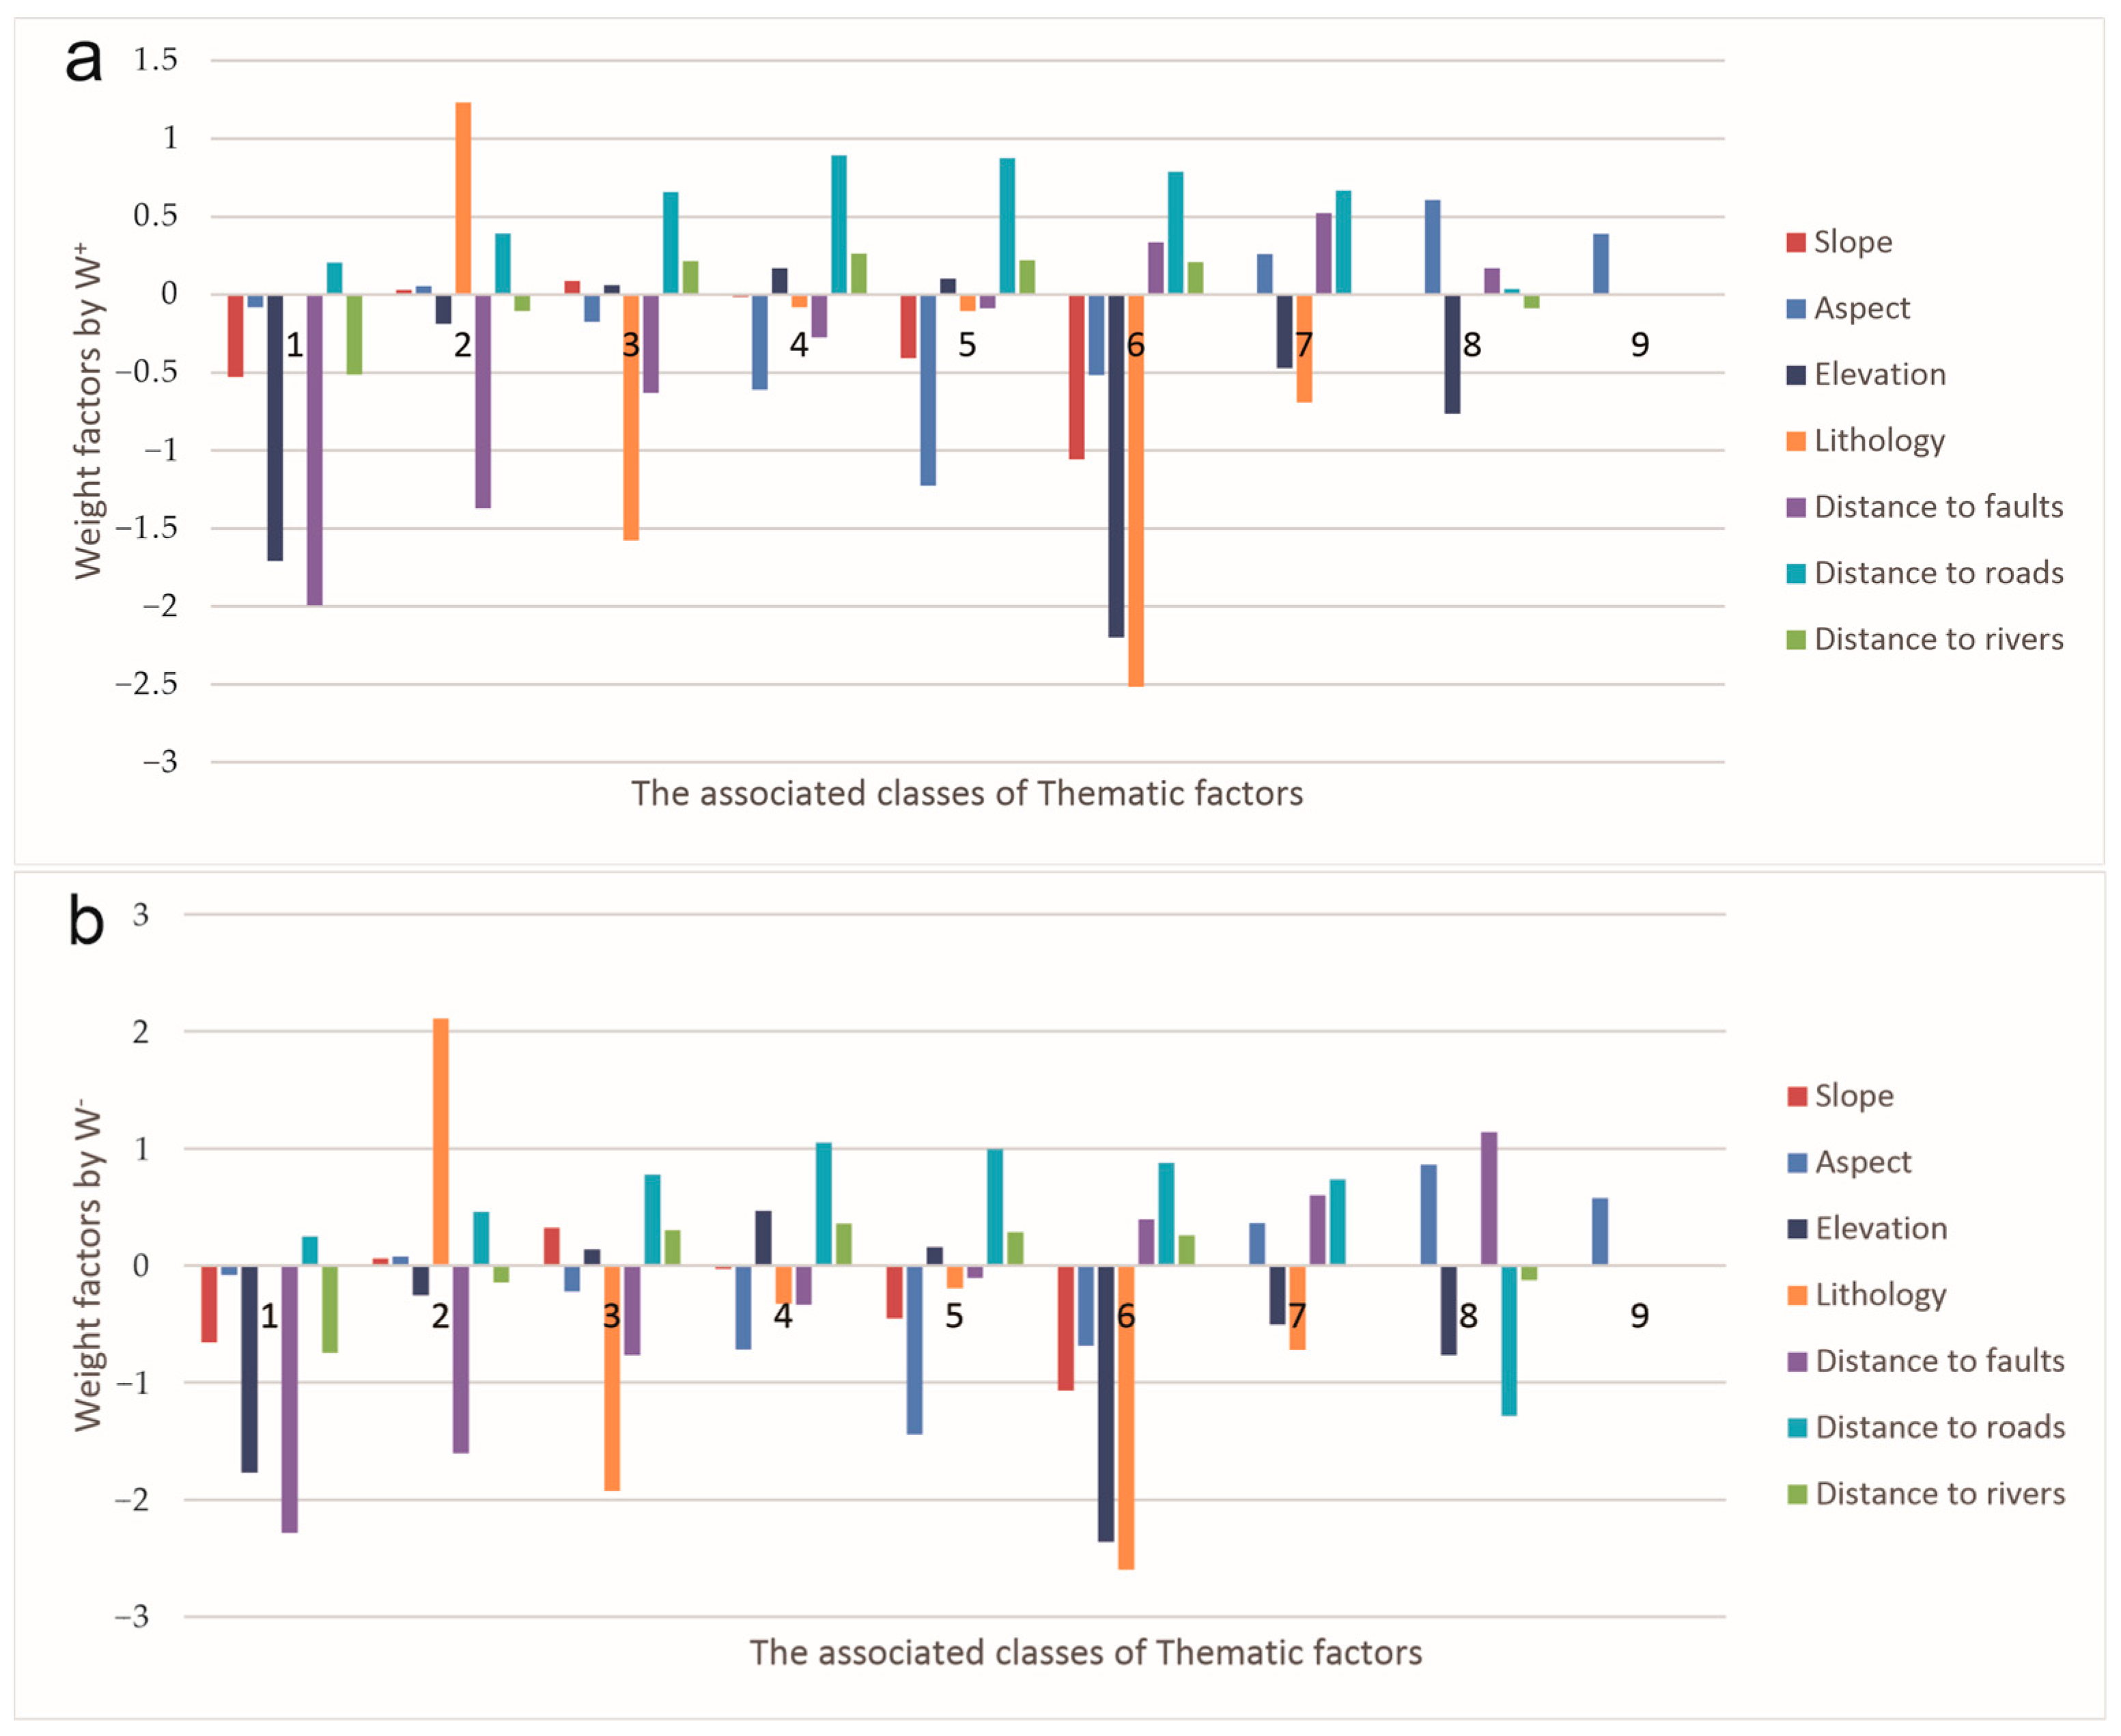


| Base Map | Thematic Factor | Source |
|---|---|---|
| DEM | Slope | ASTER DEM (30 m) |
| Aspect | ||
| Elevation | ||
| Geological map | Lithology | China National Archive 1:200,000 |
| Distance to faults | ||
| Geographic map | Distance to roads | National Geomatic Center of China |
| Distance to rivers |
| Factor | TOL | VIF |
|---|---|---|
| Slope degree | 0.937 | 1.077 |
| Slope aspect | 0.967 | 1.034 |
| Elevation | 0.929 | 1.077 |
| Lithology | 0.695 | 1.439 |
| Distance to faults | 0.867 | 1.154 |
| Distance to roads | 0.832 | 1.203 |
| Distance to rivers | 0.943 | 1.06 |
| Dimensionality | Eigenvalue | Condition Index | Variance Proportion | |||||||
|---|---|---|---|---|---|---|---|---|---|---|
| Slope | Aspect | Elevation | Lithology | Distance to Faults | Distance to Roads | Distance to Rivers | Slope Degree | |||
| 1 | 1.918 | 1 | 0 | 0.03 | 0.03 | 0.06 | 0.12 | 0.06 | 0.08 | 0.04 |
| 2 | 1.13 | 1.303 | 0.41 | 0.14 | 0 | 0 | 0 | 0.19 | 0.05 | 0.02 |
| 3 | 1.056 | 1.348 | 0.15 | 0.17 | 0.08 | 0.05 | 0.03 | 0.07 | 0.16 | 0.15 |
| 4 | 0.955 | 1.417 | 0 | 0 | 0.67 | 0.02 | 0 | 0.04 | 0.03 | 0.22 |
| 5 | 0.896 | 1.463 | 0.07 | 0.36 | 0.03 | 0.53 | 0.01 | 0.01 | 0.01 | 0.01 |
| 6 | 0.846 | 1.506 | 0.06 | 0.12 | 0.12 | 0.29 | 0.01 | 0.03 | 0 | 0.47 |
| 7 | 0.697 | 1.659 | 0.3 | 0.11 | 0.05 | 0 | 0 | 0.32 | 0.4 | 0.08 |
| 8 | 0.503 | 1.953 | 0 | 0.06 | 0.01 | 0.05 | 0.83 | 0.27 | 0.28 | 0 |
| Factors | Class | Class Pixel Counts | Class Pixel Counts % | Landslide Pixel Counts | Landslide Pixel Counts % | W+ | W− | IVM | ||
|---|---|---|---|---|---|---|---|---|---|---|
| Slope | 0–10 | 121,295 | 12.29 | 3699 | 6.97 | −0.592 | 0.062 | −0.529 | −0.654 | −0.819 |
| 10–20 | 255,220 | 25.85 | 14,338 | 27.00 | 0.046 | −0.017 | 0.030 | 0.063 | 0.063 | |
| 20–30 | 329,166 | 33.34 | 21,463 | 40.42 | 0.205 | −0.118 | 0.086 | 0.323 | 0.278 | |
| 30–40 | 216,075 | 21.89 | 11,389 | 21.45 | −0.021 | 0.006 | −0.015 | −0.027 | −0.029 | |
| 40–50 | 58,428 | 5.92 | 2084 | 3.92 | −0.430 | 0.022 | −0.408 | −0.452 | −0.593 | |
| 50–60 | 6637 | 0.67 | 128 | 0.24 | −1.061 | 0.005 | −1.057 | −1.066 | −1.480 | |
| >60 | 487 | 0.05 | 0 | 0.00 | 0.000 | 0.001 | 0.000 | 0.000 | 0.000 | |
| Aspect | Flat | 2630 | 0.27 | 131 | 0.25 | −0.081 | 0.000 | −0.081 | −0.081 | −0.111 |
| North | 143,044 | 14.49 | 8196 | 15.43 | 0.067 | −0.012 | 0.055 | 0.079 | 0.091 | |
| Northeast | 110,889 | 11.23 | 4947 | 9.32 | −0.197 | 0.023 | −0.174 | −0.219 | −0.270 | |
| East | 95,795 | 9.70 | 2725 | 5.13 | −0.663 | 0.052 | −0.611 | −0.716 | −0.919 | |
| Southeast | 126,716 | 12.83 | 1872 | 3.53 | −1.333 | 0.108 | −1.225 | −1.440 | −1.864 | |
| South | 155,703 | 15.77 | 4716 | 8.88 | −0.599 | 0.083 | −0.515 | −0.682 | −0.828 | |
| Southwest | 120,834 | 12.24 | 8712 | 16.41 | 0.313 | −0.051 | 0.261 | 0.364 | 0.423 | |
| West | 103,712 | 10.50 | 10,998 | 20.71 | 0.736 | −0.128 | 0.608 | 0.863 | 0.979 | |
| Northwest | 127,984 | 12.96 | 10,804 | 20.35 | 0.484 | −0.093 | 0.390 | 0.577 | 0.650 | |
| Elevation | 3869–4200 | 30,654 | 3.15 | 304 | 0.58 | −1.738 | 0.028 | −1.710 | −1.765 | −2.442 |
| 4200–4500 | 143,803 | 14.77 | 6284 | 11.98 | −0.220 | 0.034 | −0.186 | −0.254 | −0.302 | |
| 4500–4800 | 256,027 | 26.30 | 15,152 | 28.89 | 0.100 | −0.038 | 0.062 | 0.137 | 0.136 | |
| 4800–5100 | 266,770 | 27.40 | 19,377 | 36.94 | 0.319 | −0.148 | 0.170 | 0.467 | 0.431 | |
| 5100–5400 | 157,095 | 16.13 | 9563 | 18.23 | 0.130 | −0.027 | 0.103 | 0.156 | 0.176 | |
| 5400–5700 | 80,207 | 8.24 | 465 | 0.89 | −2.279 | 0.082 | −2.197 | −2.360 | −3.216 | |
| 5700–6000 | 37,286 | 3.83 | 1262 | 2.41 | −0.486 | 0.016 | −0.470 | −0.501 | −0.671 | |
| 6000–6357 | 1819 | 0.19 | 47 | 0.09 | −0.764 | 0.001 | −0.763 | −0.765 | −1.060 | |
| Lithology | Hard rock | 101,483 | 10.28 | 21,463 | 40.42 | 1.671 | −0.439 | 1.232 | 2.110 | 2.110 |
| Harder rock | 176,351 | 17.86 | 1726 | 3.25 | −1.749 | 0.174 | −1.575 | −1.923 | −2.458 | |
| Softer rock | 402,465 | 40.76 | 17,828 | 33.57 | −0.204 | 0.122 | −0.083 | −0.326 | −0.280 | |
| Soft rock | 239,235 | 24.23 | 11,185 | 21.06 | −0.148 | 0.043 | −0.104 | −0.191 | −0.202 | |
| extremely soft rock | 67,761 | 6.87 | 901 | 1.69 | 3.261 | 0.056 | 3.205 | −3.317 | −4.591 | |
| Distance to faults | 0–300 | 142,236 | 14.41 | 947 | 1.78 | −2.138 | 0.146 | −1.992 | −2.284 | −3.014 |
| 300–600 | 130,353 | 13.20 | 1655 | 3.12 | −1.486 | 0.117 | −1.370 | −1.603 | −2.083 | |
| 600–900 | 116,897 | 11.84 | 3214 | 6.05 | −0.698 | 0.067 | −0.631 | −0.766 | −0.968 | |
| 900–1200 | 99,413 | 10.07 | 4004 | 7.54 | −0.303 | 0.029 | −0.274 | −0.333 | −0.417 | |
| 1200–1500 | 81,447 | 8.25 | 3995 | 7.52 | −0.097 | 0.008 | −0.089 | −0.105 | −0.133 | |
| 1500–1800 | 62,792 | 6.36 | 4748 | 8.94 | 0.364 | −0.030 | 0.335 | 0.394 | 0.492 | |
| 1800–2100 | 49,558 | 5.02 | 4494 | 8.46 | 0.562 | −0.039 | 0.523 | 0.601 | 0.754 | |
| >2100 | 304,634 | 30.85 | 30,045 | 56.58 | 0.655 | −0.486 | 0.169 | 1.141 | 0.875 | |
| Distance to roads | 0–300 | 75,224 | 7.62 | 5010 | 9.43 | 0.227 | −0.021 | 0.206 | 0.248 | 0.308 |
| 300–600 | 60,303 | 6.11 | 4832 | 9.10 | 0.427 | −0.034 | 0.393 | 0.461 | 0.575 | |
| 600–900 | 54,734 | 5.54 | 5715 | 10.76 | 0.718 | −0.060 | 0.658 | 0.778 | 0.957 | |
| 900–1200 | 47,437 | 4.80 | 6196 | 11.67 | 0.972 | −0.079 | 0.893 | 1.051 | 1.280 | |
| 1200–1500 | 38,515 | 3.90 | 4871 | 9.17 | 0.935 | −0.060 | 0.875 | 0.994 | 1.234 | |
| 1500–1800 | 35,040 | 3.55 | 4053 | 7.63 | 0.833 | −0.046 | 0.788 | 0.879 | 1.105 | |
| 1800–2100 | 33,165 | 3.36 | 3413 | 6.43 | 0.702 | −0.034 | 0.668 | 0.736 | 0.936 | |
| >2100 | 642,874 | 65.11 | 19,012 | 35.80 | −0.623 | 0.659 | 0.035 | −1.282 | −0.863 | |
| Distance to river | 0–300 | 200,667 | 20.33 | 5901 | 11.11 | −0.629 | 0.116 | −0.513 | −0.745 | −0.871 |
| 300–600 | 141,756 | 14.36 | 6769 | 12.75 | −0.125 | 0.020 | −0.106 | −0.145 | −0.172 | |
| 600–900 | 125,416 | 12.70 | 8599 | 16.19 | 0.258 | −0.043 | 0.215 | 0.302 | 0.350 | |
| 900–1200 | 114,948 | 11.64 | 8283 | 15.60 | 0.312 | −0.048 | 0.264 | 0.360 | 0.422 | |
| 1200–1500 | 102,535 | 10.39 | 6996 | 13.17 | 0.253 | −0.033 | 0.220 | 0.287 | 0.343 | |
| 1500–1800 | 84,136 | 8.52 | 5642 | 10.63 | 0.235 | −0.025 | 0.210 | 0.259 | 0.318 | |
| 1800–2100 | 66,091 | 6.69 | 3535 | 6.66 | −0.006 | 0.000 | −0.005 | −0.006 | −0.008 | |
| >2100 | 151,738 | 15.37 | 7377 | 13.89 | −0.106 | 0.018 | −0.088 | −0.125 | −0.146 |
| Model | Very Low | Low | Moderate | High | Very High |
|---|---|---|---|---|---|
| IVM | 0.39% | 3.03% | 7.87% | 34.22% | 54.49% |
| W+ | 0.23% | 2.11% | 7.59% | 26.20% | 63.86% |
| W− | 0.55% | 3.93% | 10.36% | 33.40% | 51.76% |
| IVM-LR | 0.42% | 1.91% | 7.38% | 29.84% | 60.47% |
| W+-LR | 0.12% | 2.31% | 9.38% | 25.95% | 62.25% |
| W−-LR | 0.10% | 4.54% | 14.50% | 33.30% | 47.56% |
| IVM-MLP | 0.16% | 3.57% | 9.26% | 34.30% | 52.71% |
| W+-MLP | 0.11% | 2.65% | 8.41% | 25.19% | 63.63% |
| W−-MLP | 0.17% | 4.28% | 12.68% | 33.41% | 49.46% |
| Factors | Slope | Aspect | Elevation | Lithology | Distance to Faults | Distance to Roads | Distance to Rivers |
|---|---|---|---|---|---|---|---|
| LR | 0.480 | 0.716 | 0.150 | 0.614 | 0.702 | 0.367 | 0.633 |
| MLP | 0.053 | 0.135 | 0.144 | 0.164 | 0.217 | 0.131 | 0.157 |
Disclaimer/Publisher’s Note: The statements, opinions and data contained in all publications are solely those of the individual author(s) and contributor(s) and not of MDPI and/or the editor(s). MDPI and/or the editor(s) disclaim responsibility for any injury to people or property resulting from any ideas, methods, instructions or products referred to in the content. |
© 2024 by the authors. Licensee MDPI, Basel, Switzerland. This article is an open access article distributed under the terms and conditions of the Creative Commons Attribution (CC BY) license (https://creativecommons.org/licenses/by/4.0/).
Share and Cite
Yang, Y.; Guo, Y.; Chen, H.; Tang, H.; Li, M.; Sun, A.; Bian, Y. Application of a Hybrid Model in Landslide Susceptibility Evaluation of the Western Tibet Plateau. Appl. Sci. 2024, 14, 485. https://doi.org/10.3390/app14020485
Yang Y, Guo Y, Chen H, Tang H, Li M, Sun A, Bian Y. Application of a Hybrid Model in Landslide Susceptibility Evaluation of the Western Tibet Plateau. Applied Sciences. 2024; 14(2):485. https://doi.org/10.3390/app14020485
Chicago/Turabian StyleYang, Yongpeng, Ya Guo, Hao Chen, Hao Tang, Meng Li, Ang Sun, and Yu Bian. 2024. "Application of a Hybrid Model in Landslide Susceptibility Evaluation of the Western Tibet Plateau" Applied Sciences 14, no. 2: 485. https://doi.org/10.3390/app14020485
APA StyleYang, Y., Guo, Y., Chen, H., Tang, H., Li, M., Sun, A., & Bian, Y. (2024). Application of a Hybrid Model in Landslide Susceptibility Evaluation of the Western Tibet Plateau. Applied Sciences, 14(2), 485. https://doi.org/10.3390/app14020485


