Article

Characterizing Temporal Patterns of Intra-Urban Human Mobility in Bike-Sharing through Trip Analysis: A Case Study of Shanghai, China

1
School of Internet of Things, Nanjing University of Posts and Telecommunications, Wenyuan Road 9, Nanjing 210023, China
2
Smart Health Big Data Analysis and Location Services Engineering Research Center of Jiangsu Province, Nanjing University of Posts and Telecommunications, Wenyuan Road 9, Nanjing 210023, China
3
School of Hydrology and Water Resources, Nanjing University of Information Science & Technology, Ningliu Road 219, Nanjing 210044, China
*
Authors to whom correspondence should be addressed.
Appl. Sci. 2024, 14(19), 8583; https://doi.org/10.3390/app14198583
Submission received: 1 June 2024 / Revised: 23 August 2024 / Accepted: 12 September 2024 / Published: 24 September 2024

Abstract

:
Human mobility, encompassing the movement of individuals and/or groups across space and time, significantly impacts various aspects of society, with intra-urban mobility being a major research focus of scholars in diverse disciplines. Bike-sharing systems have become an alternatives in cities for achieving more sustainable transportation. Hence, bike-sharing-related data are considered an important data source to study intra-urban human mobility. To better understand human mobility in cities, it is essential to characterize the typical patterns involved in intra-urban human mobility. This paper mainly focuses on characterizing the temporal patterns of intra-urban human mobility on bike-sharing based on the trip information of the acquired bike-sharing data. To achieve this, on the one hand, we adopted an exploratory data analysis (EDA) method to describe the temporal patterns by performing exploratory analyses of bike-sharing trips. On the other hand, we used the continuous triangular model (CTM) to conduct multi-temporal-scale analysis of bike-sharing trips for further explorations of the temporal patterns where necessary. The data of bike-sharing trips in Shanghai, China, were adopted as the dataset for the case study. Generally, the study was conducted at two different levels: the trip level and the bike level. Specifically, at each level, the explorations were conducted from varying perspectives. According to the analyses, numerous meaningful temporal patterns were discovered, and several distinctive findings were acquired. The results of this study show the effectiveness of the EDA and CTM methods in characterizing temporal patterns of intra-urban human mobility, based on which potentially insightful information and suggestions can be provided to assist related actions.

1. Introduction

Human mobility is considered the movement of human beings (individuals and/or groups) across space and time, which has significant impacts on various fields in society, including economy, environment, and public health [1]. Urban human mobility refers to how citizens move within and between cities. Understanding this mobility is crucial for epidemic control, urban planning, traffic management, and so on [2,3,4]. Compared to human mobility between cities (i.e., inter-urban human mobility), human mobility within cities (i.e., intra-urban human mobility) is larger in proportion. This is because people typically move daily to earn their livelihood and engage in social and leisure activities. The temporal and spatial scales of trips corresponding to intra-urban human mobility are much shorter than those of inter-urban human mobility (e.g., migratory flows), and they are often characterized by the regularities and periodicities that mark human lives. In urban areas, daily movements of people (e.g., residents) inevitably involve interactions with various urban components in the built environment, such as roads, commercial areas, and public facilities [5].
While the study of human mobility currently spans several disciplines, geography was arguably the first to analyze mobility data and develop theories to describe travel patterns [6]. In recent years, extensive geo-located datasets related to human movement have become available, enabling researchers to quantitatively study individual and collective mobility patterns and to generate models that capture and reproduce the spatio-temporal structures and regularities in human trajectories. Nowadays, a variety of urban human mobility data have been gathered and published, benefiting from the proliferation of location-aware techniques such as the global navigation satellite system (GNSS), Bluetooth, radio frequency identification (RFID), and Wi-Fi [7]. These data contain rich information about locations and can help address many urban challenges such as traffic congestion, air pollution problems, estimating migratory flows, and public health. Therefore, characterizing intra-urban human mobility patterns is crucial for understanding and optimizing the travel of human beings.
Accompanied with the promulgation of the slogan “low-carbon life, green travel”, the strategy of “carbon neutrality”, and the consumption mode of “sharing economy” worldwide, environmentally friendly shared transit systems have been widely adopted by local citizens and advocated by governments in many countries. As a new form of urban transportation, bike-sharing has attracted many researchers to study human mobility due to its low cost for production and great convenience for uses [8]. Especially after the COVID-19 pandemic, bike-sharing has gradually become one of the most widespread and popular shared and sustainable mobility systems. The use of bikes positively impacts the environment, as they produce minimal air and noise pollution compared to motor vehicles [9,10]. Bikes can substitute cars on short-distance trips and have the potential of solving the “last mile” problem in urban traffic [11,12,13]. In addition, as a form of physical activity, cycling brings remarkable benefits to people’s health [14]. Given the above-mentioned advantages of bike-sharing, the trajectory data from bike-sharing systems have become an ideal source for analyzing intra-urban human mobility characteristics and identifying typical intra-urban human mobility patterns.
A comprehensive understanding of the spatio-temporal characteristics and patterns of bike-sharing usage is crucial for developing effective bike management and scheduling strategies. Such an understanding can provide a scientific basis for these strategies, thereby enhancing the development and service of bike-sharing systems. The low cost and convenience of bike-sharing offer an alternative transport mode for short-distance trips, influencing people’s travel behaviors and mobility [15,16,17]. Promoting bike-sharing services can help mitigate typical urban issues such as traffic congestion and automobile exhaust pollution. Therefore, studying bike-sharing has significant implications for understanding human behaviors and lifestyles as well as assessing city development.
Recently, bike-sharing has become a popular research topic, with bike-sharing systems being classified into two categories: docked bike-sharing and dockless bike-sharing. Dockless bike-sharing offers an advantage over docked bike-sharing by providing stationless rental services, allowing users to rent bikes via a GNSS-based smartphone app without needing to use fixed docking stations [3,18,19]. Consequently, dockless bike-sharing trajectory data are a valuable data source for many studies. Typical research topics related to the spatio-temporal analysis of dockless bike-sharing data include understanding the usage and patterns of shared bikes [18,20,21,22,23,24,25], identifying urban functional regions [26,27,28,29,30], evaluating spatial efficiency [31,32,33], optimizing bike resource allocation [34,35,36,37], planning bike lanes [38,39,40,41], and predicting bike usage based on various factors [37,42,43,44].
To facilitate the understanding of the formation mechanism of public bicycle networks, it is essential to characterize intra-urban human mobility patterns. This can be achieved through statistical analyses of human behavior characteristics in space and time, focusing on both the origin and destination of trips. For bike-sharing companies to provide better services and manage large volumes of shared bikes effectively, specific statistical analyses of individual bikes are crucial. Additionally, understanding the evolving mechanism of public bicycle network structures requires focusing on the behavior characteristics of cyclists (i.e., bike users). By summarizing existing studies, we found a lack of focused research on characterizing intra-urban human mobility patterns, particularly concerning the temporal aspects of trip information. Therefore, in this paper, we propose to characterize the temporal patterns of intra-urban human mobility through trip analysis to summarize typical intra-urban human mobility patterns regarding the temporal aspects. A trip is considered the intra-urban mobility of a bike user during a specific time period. The study was conducted at two different levels: the trip level and the bike level. At each level, corresponding analyses were conducted at varying temporal scales. The methods used for the analysis mainly include exploratory data analysis (EDA) and the continuous triangular model (CTM). Our aim was to conduct a detailed analysis of bike-sharing trips to characterize typical temporal patterns of intra-urban human mobilities. By enhancing the understanding of short-distance human mobility characteristics, we can provide potentially useful suggestions and insights to related governmental departments and bike-sharing companies.
The remainder of this paper is organized as follows. Section 2 introduces the study area, dataset, and the methods used. Section 3 presents the main results and related analysis. Section 4 gives a brief discussion of the results. Finally, Section 5 provides the conclusions of this research and recommendations for future work.

2. Study Area, Dataset, and Methods

2.1. Study Area

Shanghai is one of the world’s largest cities and serves as a major industrial and commercial hub of China. Covering a total area of approximately 6340 square kilometers, Shanghai boasts a population of around 25 million, resulting in a population density of 3.9 persons per square kilometers as of 2023. Notably, it is also one of the largest bike-sharing cities globally. The Huangpu River, Shanghai’s main waterway, divides the city into two regions: Puxi and Pudong. The seven districts (i.e., Jingan, Putuo, Changning, Xuhui, Yangpu, Hongkou, and Huangpu) in Puxi within the outer ring road constitute the core urban areas of Shanghai. The study area is shown in Figure 1.

2.2. Dataset

This original dataset was collected by Mobike company (Beijing, China) and includes 102,361 trips made by 16,887 bike users on 79,062 bikes in August 2016. This dataset was utilized because it has been the primary source for related analyses in previous research and is also publicly available [1]. Each trip in the dataset contains the same data fields: trip ID, bike ID, user ID, start time, end time, longitude and latitude for both origin and destination, and discrete movement points of the corresponding trajectory. The resolution of the movement points is approximately 100 m in space and 30 s in time.
Human beings may differ between weekdays and weekends, exhibiting periodic characteristics. Notably, 1 August 2016 was a Monday (the first day of the week), and 28 August 2016 was a Sunday (the last day of the week). For convenience in visualizing various results, we used only the data from the four complete weeks between 1 August and 28 August 2016 for our case study. Based on the selected dataset, we included 87,462 trips made by 16,189 bike users on 68,541 bikes.

2.3. Methods

2.3.1. Exploratory Data Analysis

Exploratory data analysis (EDA) is a technique used by data scientists to analyze and investigate datasets, summarizing their main characteristics often through data visualization methods [45]. EDA helps determine the best ways to manipulate data sources to obtain the necessary insights, enabling data scientists to discover patterns, spot anomalies, test hypotheses, and verify assumptions. Due to its effectiveness in summarizing key data characteristics and uncovering potential patterns, EDA is widely employed across various fields, including computer science, data science, and geographical information science.
In this study, EDA was one of the methods used to characterize the temporal patterns of intra-urban human mobility based on bike-sharing trips. The analysis was conducted at three levels: the trip level, the bike level, and the user level. At the trip level, we mainly focused on exploring trip numbers and trip durations at various scales using univariate and bivariate visualization methods. For trip numbers, we examined data per hour, per day, and per week, considering the origin and the destination and statistical measures (e.g., maximum, average, median, and minimum) as needed. For trip duration, we analyzed data per minute, per 5 min, per hour, and per day, also considering the origin and the destination and statistical measures as needed. At the bike level, we mainly explored the characteristics of bike usages and total service durations based on bike ID. This included analyzing the number of utilizations for each bike, the occurrences of each utilization number, and the frequency and cumulative frequency of these occurrences. Through the exploratory analysis of bike-sharing trips, we acquired numerous characteristics regarding intra-urban human mobilities. This allowed us to identify typical temporal patterns of intra-urban human mobility at various levels from different perspectives and scales.

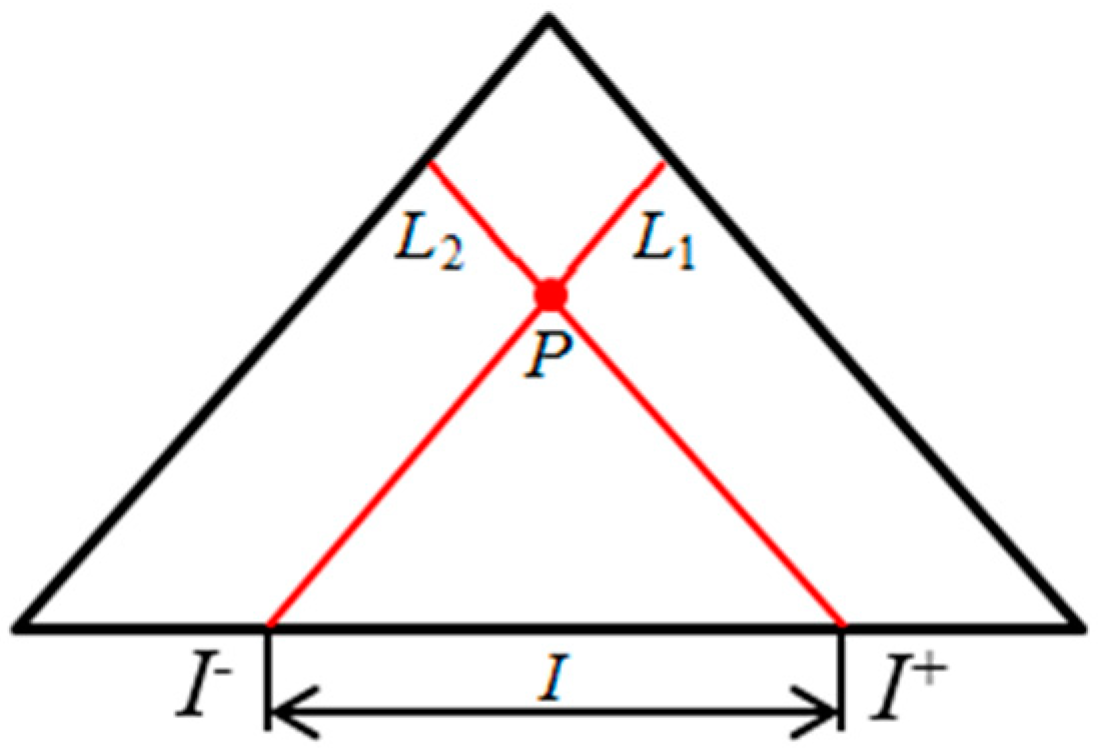
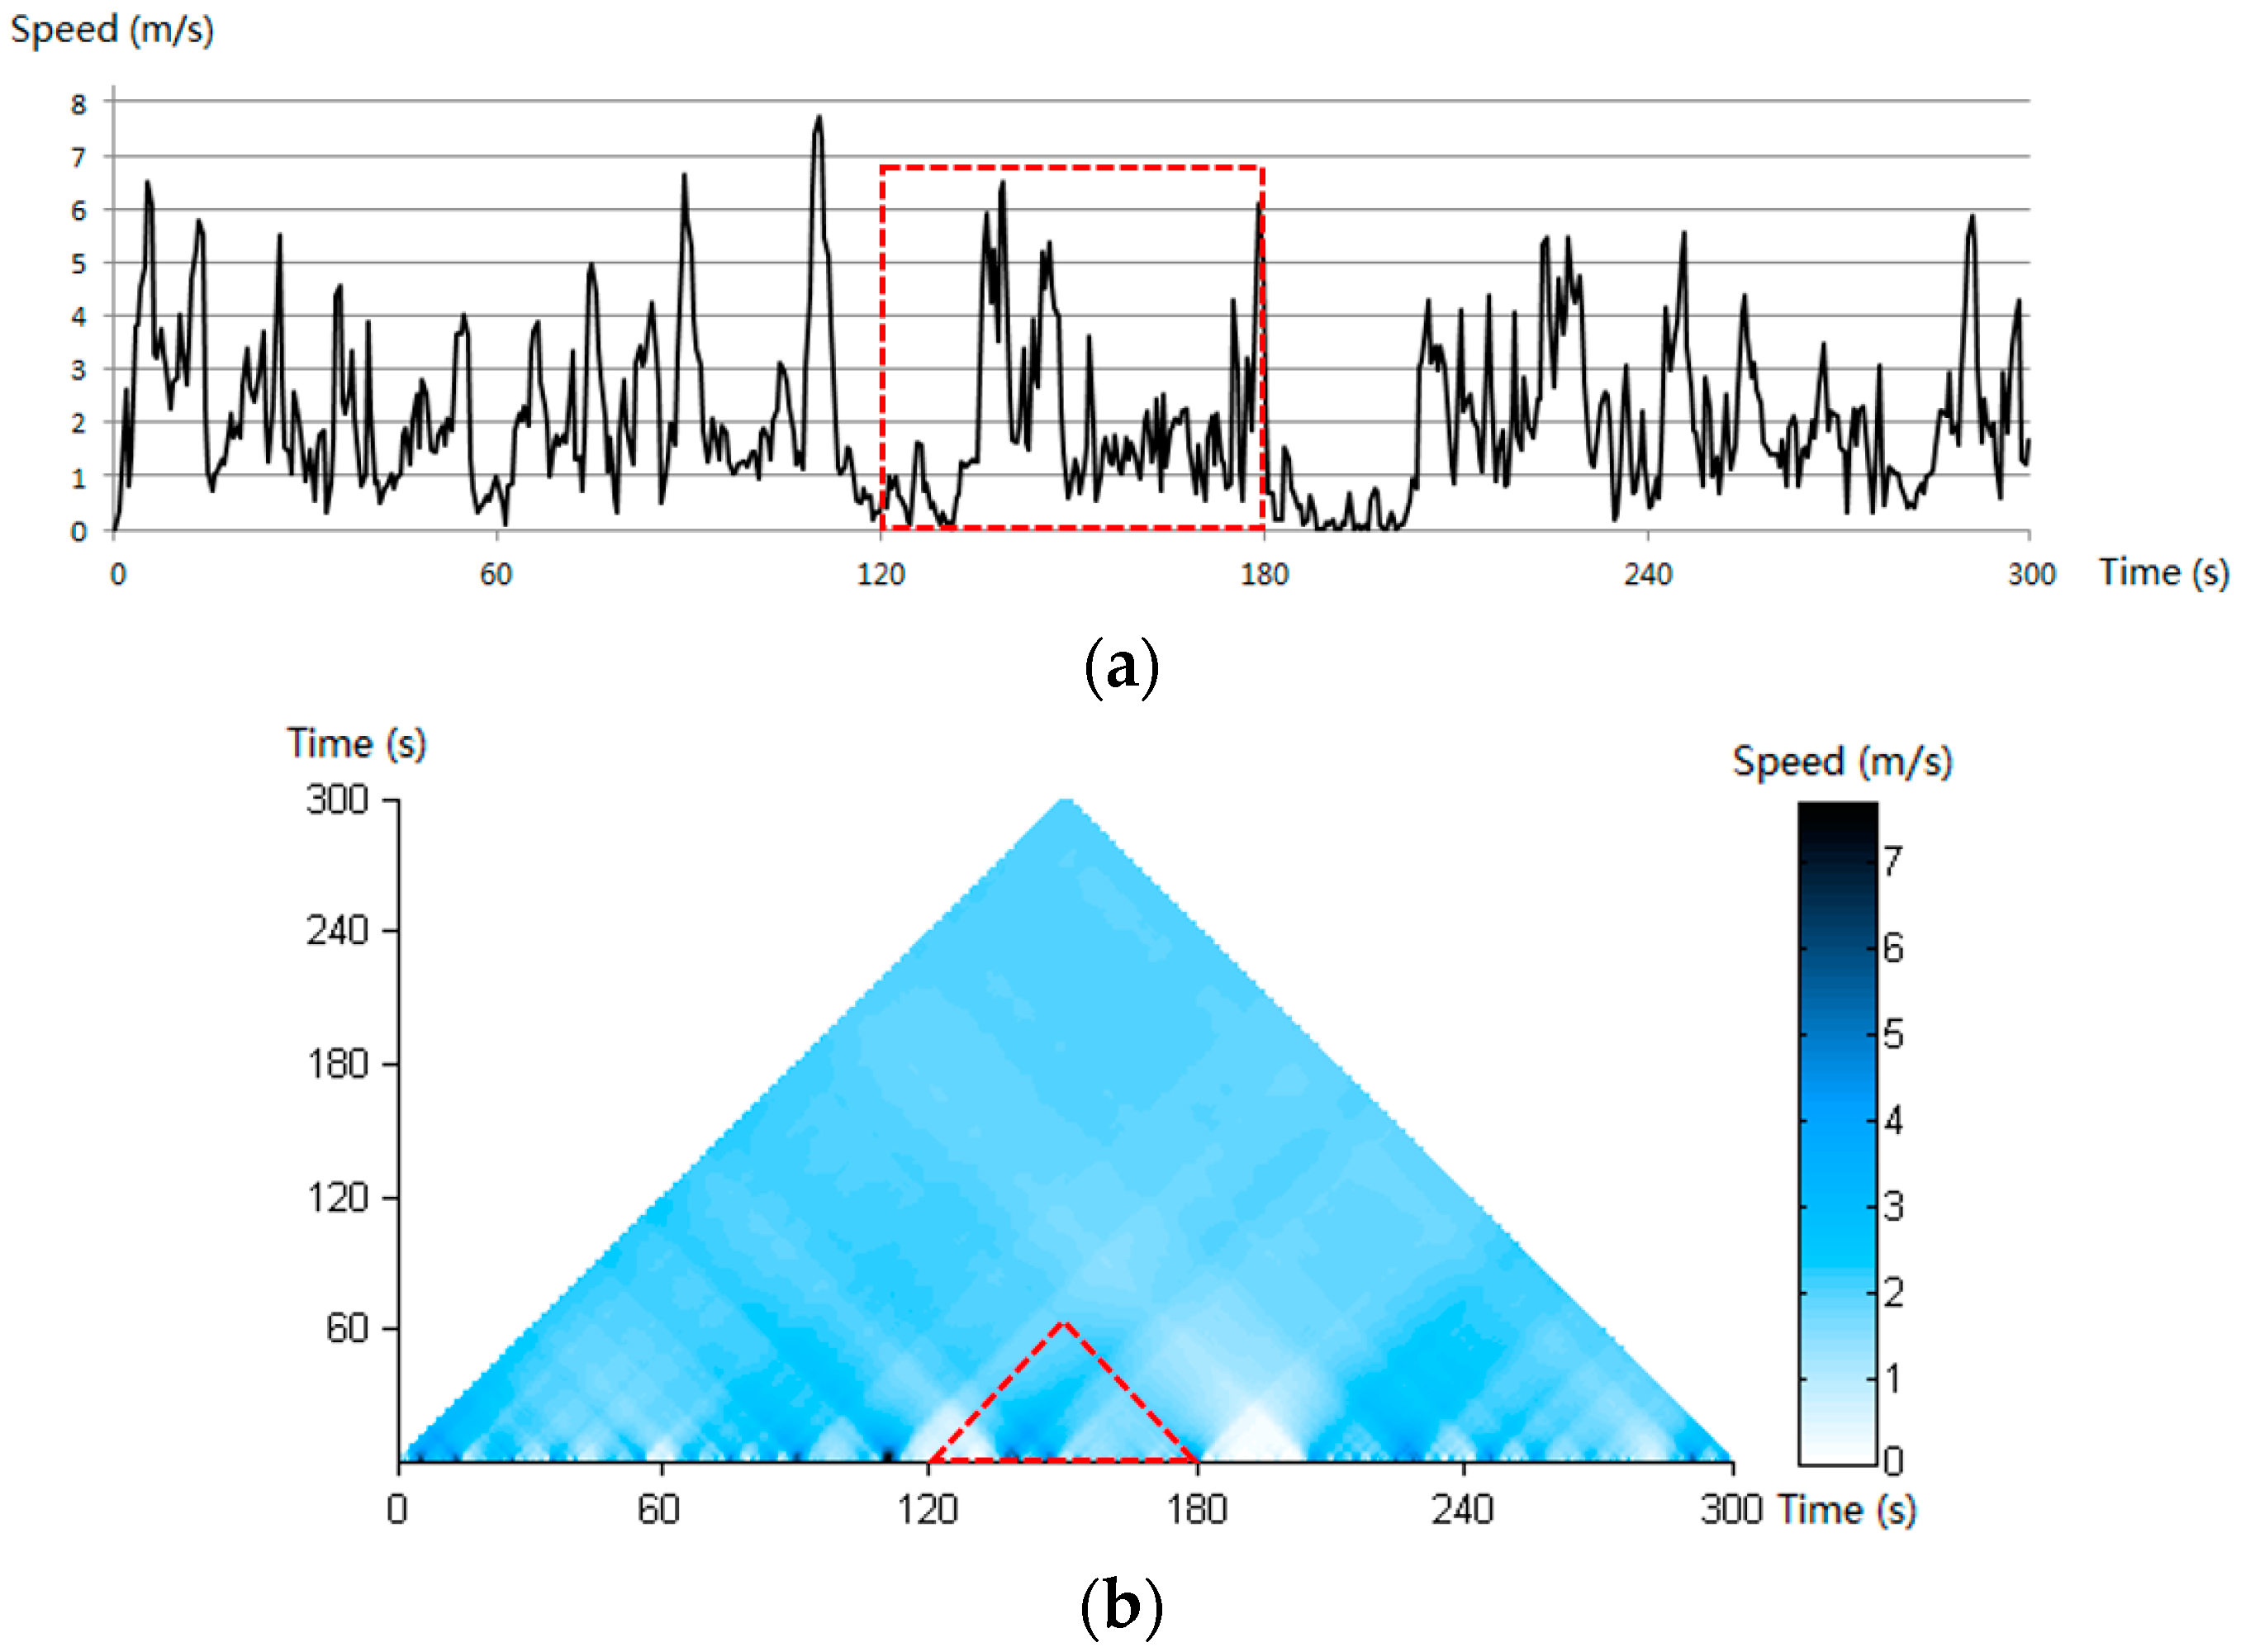
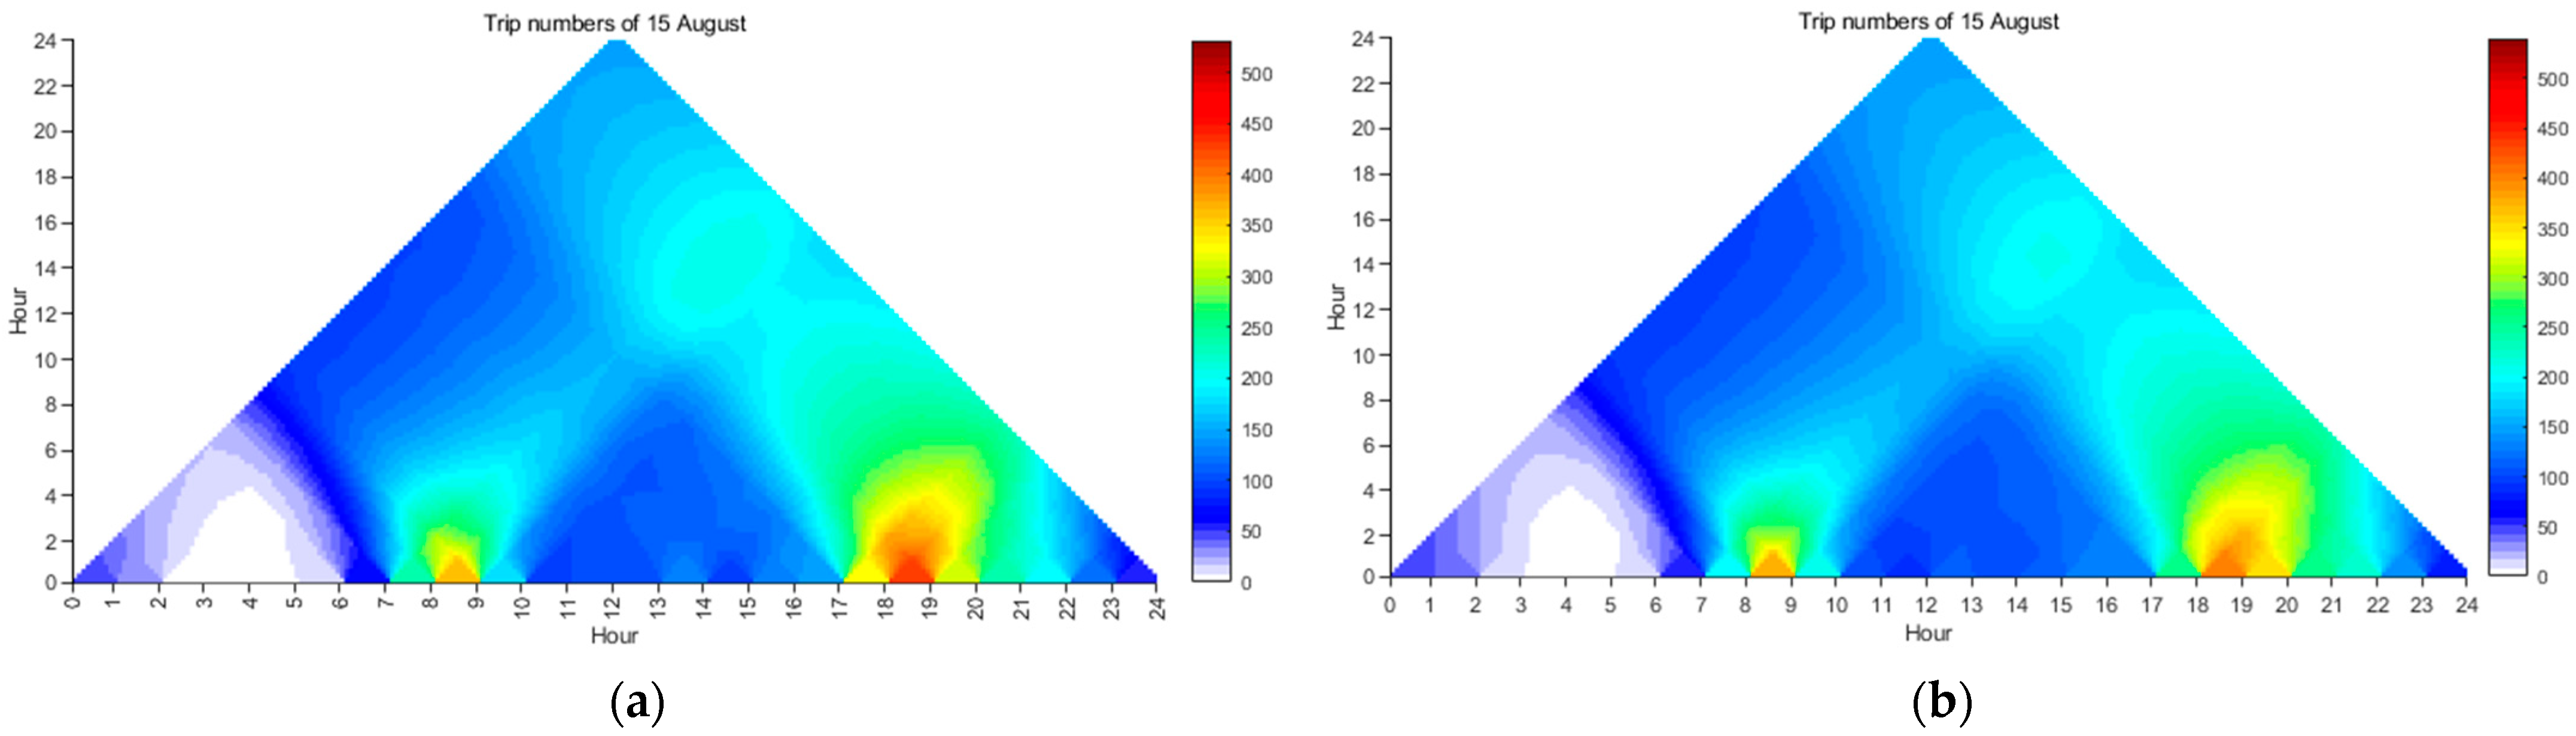
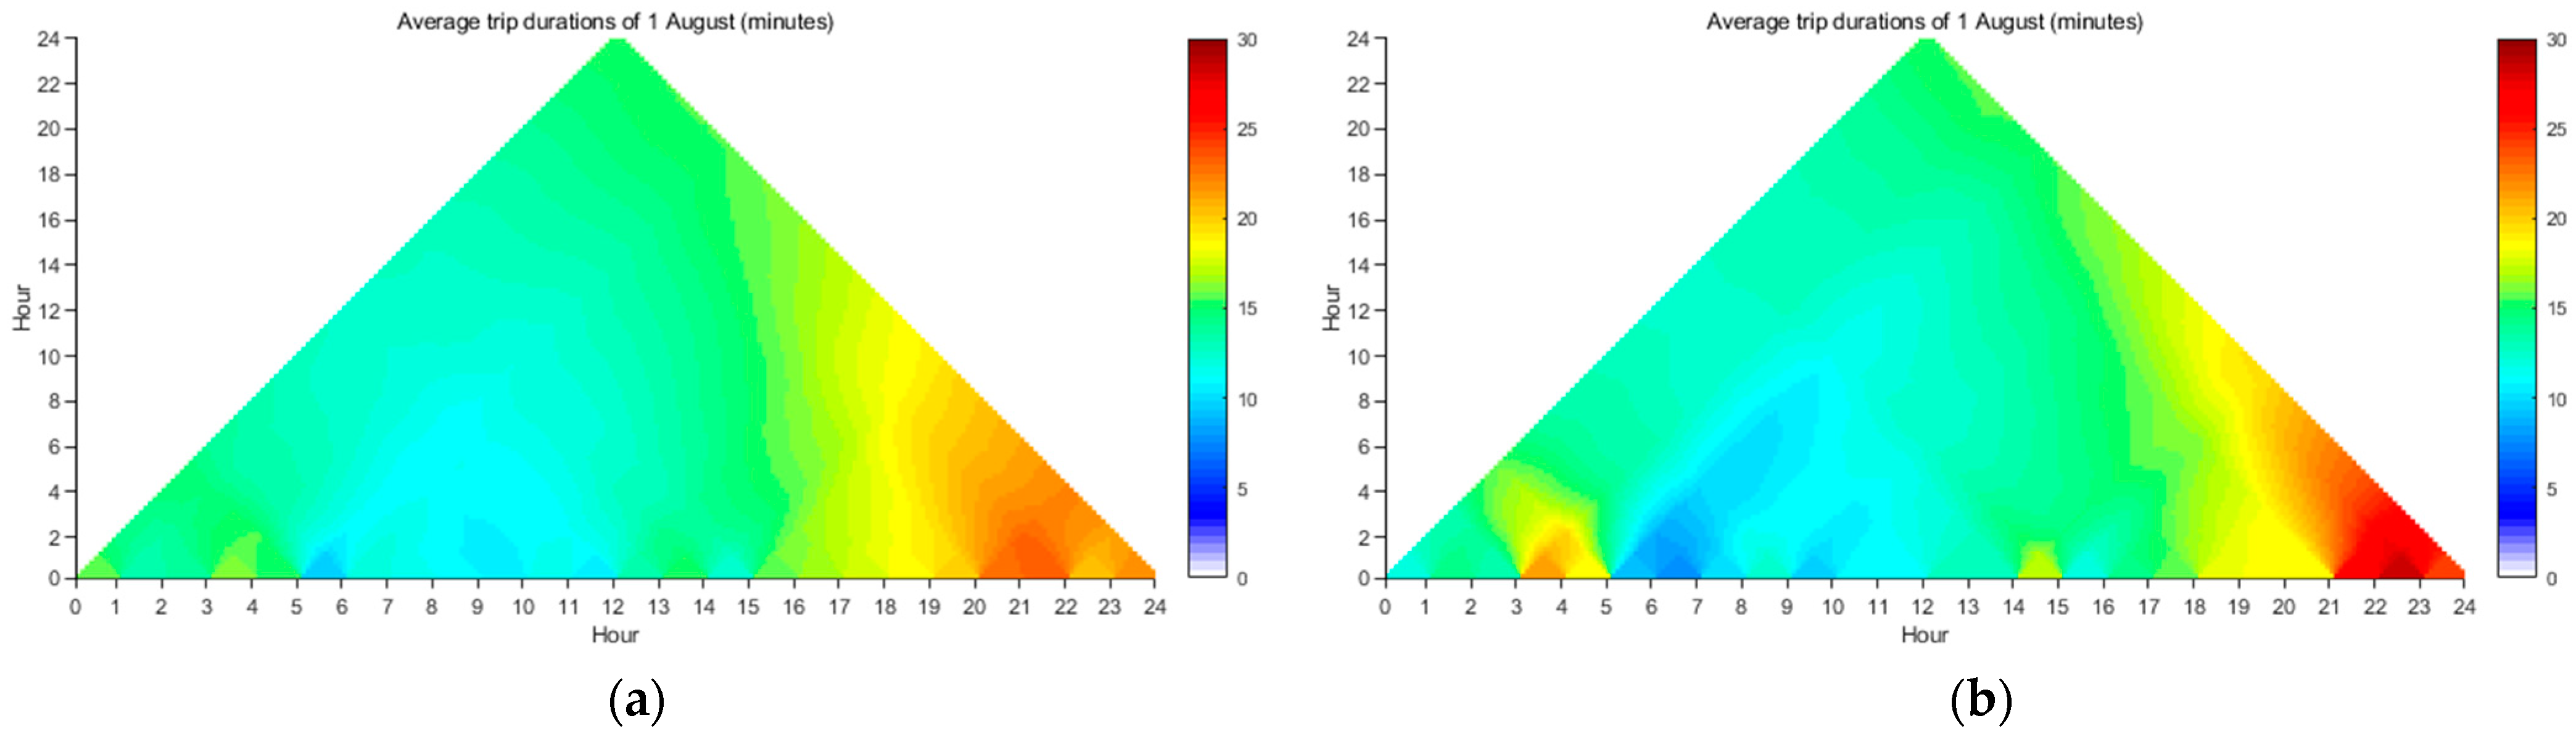
2.3.2. The Continuous Triangular Model

The continuous triangular model (CTM) is an extension of the triangular model (TM). The TM, initially introduced by Kulpa, is a 2D representation of time intervals [46]. In the TM, any time interval I, which starts from t1 and ends at t2, is represented by a corresponding point P, the intersection point of two straight lines L1 and L2, with L1 passing through t1 and L2 passing thought t2 (see Figure 2). However, the TM is limited in its ability to represent time intervals continuously. To overcome this limitation, the TM was extended to the CTM [47].
The CTM can represent continuous temporal data, e.g., attribute values during all time intervals. Attribute values during any time interval can be calculated using specific algebra operators (such as mean, maximum, and summation) based on the attribute values at the finest timestamps within the time interval. The attribute values between two neighboring timestamps can be calculated using interpolation [48,49]. As a result, the continuous field of the CTM can be displayed as an image through color coding, where each color denotes the attribute value during the corresponding time interval [48,49].
Figure 3 presents a simple example of representing temporal data (i.e., speed data) using the traditional linear method (Figure 3a) and the CTM method (Figure 3b). Note that the part of curve marked by the dotted red rectangle in Figure 3a is represented by the dotted red triangular in Figure 3b. In Figure 3b, one can observe that every single point in the CTM has a specific color corresponding to a speed value. Since each point in the CTM represents a specific time interval, the CTM has the unique property of simultaneously displaying the dataset at all temporal resolutions. Therefore, the CTM can exhibit more abundant information compared to the traditional linear representation, as it displays information at all temporal scales (from the minimum temporal scale to the maximum temporal scale) simultaneously in the same figure.
Given the advantage of the CTM, this paper uses the CTM to analyze trip data to reveal potentially interesting temporal patterns of intra-urban human mobility that might be difficult to uncover with other methods.
Figure 2. Illustration of the TM (from reference [49]).
Applsci 14 08583 g002
Figure 3. Illustration representing temporal data using the CTM: (a) the linear representation of temporal data and (b) the CTM representation of the temporal data (from reference [48]).
Applsci 14 08583 g003

3. Results and Analysis

The results of the case study were analyzed and are presented at two levels: the trip level and the bike level.

3.1. The Trip Level

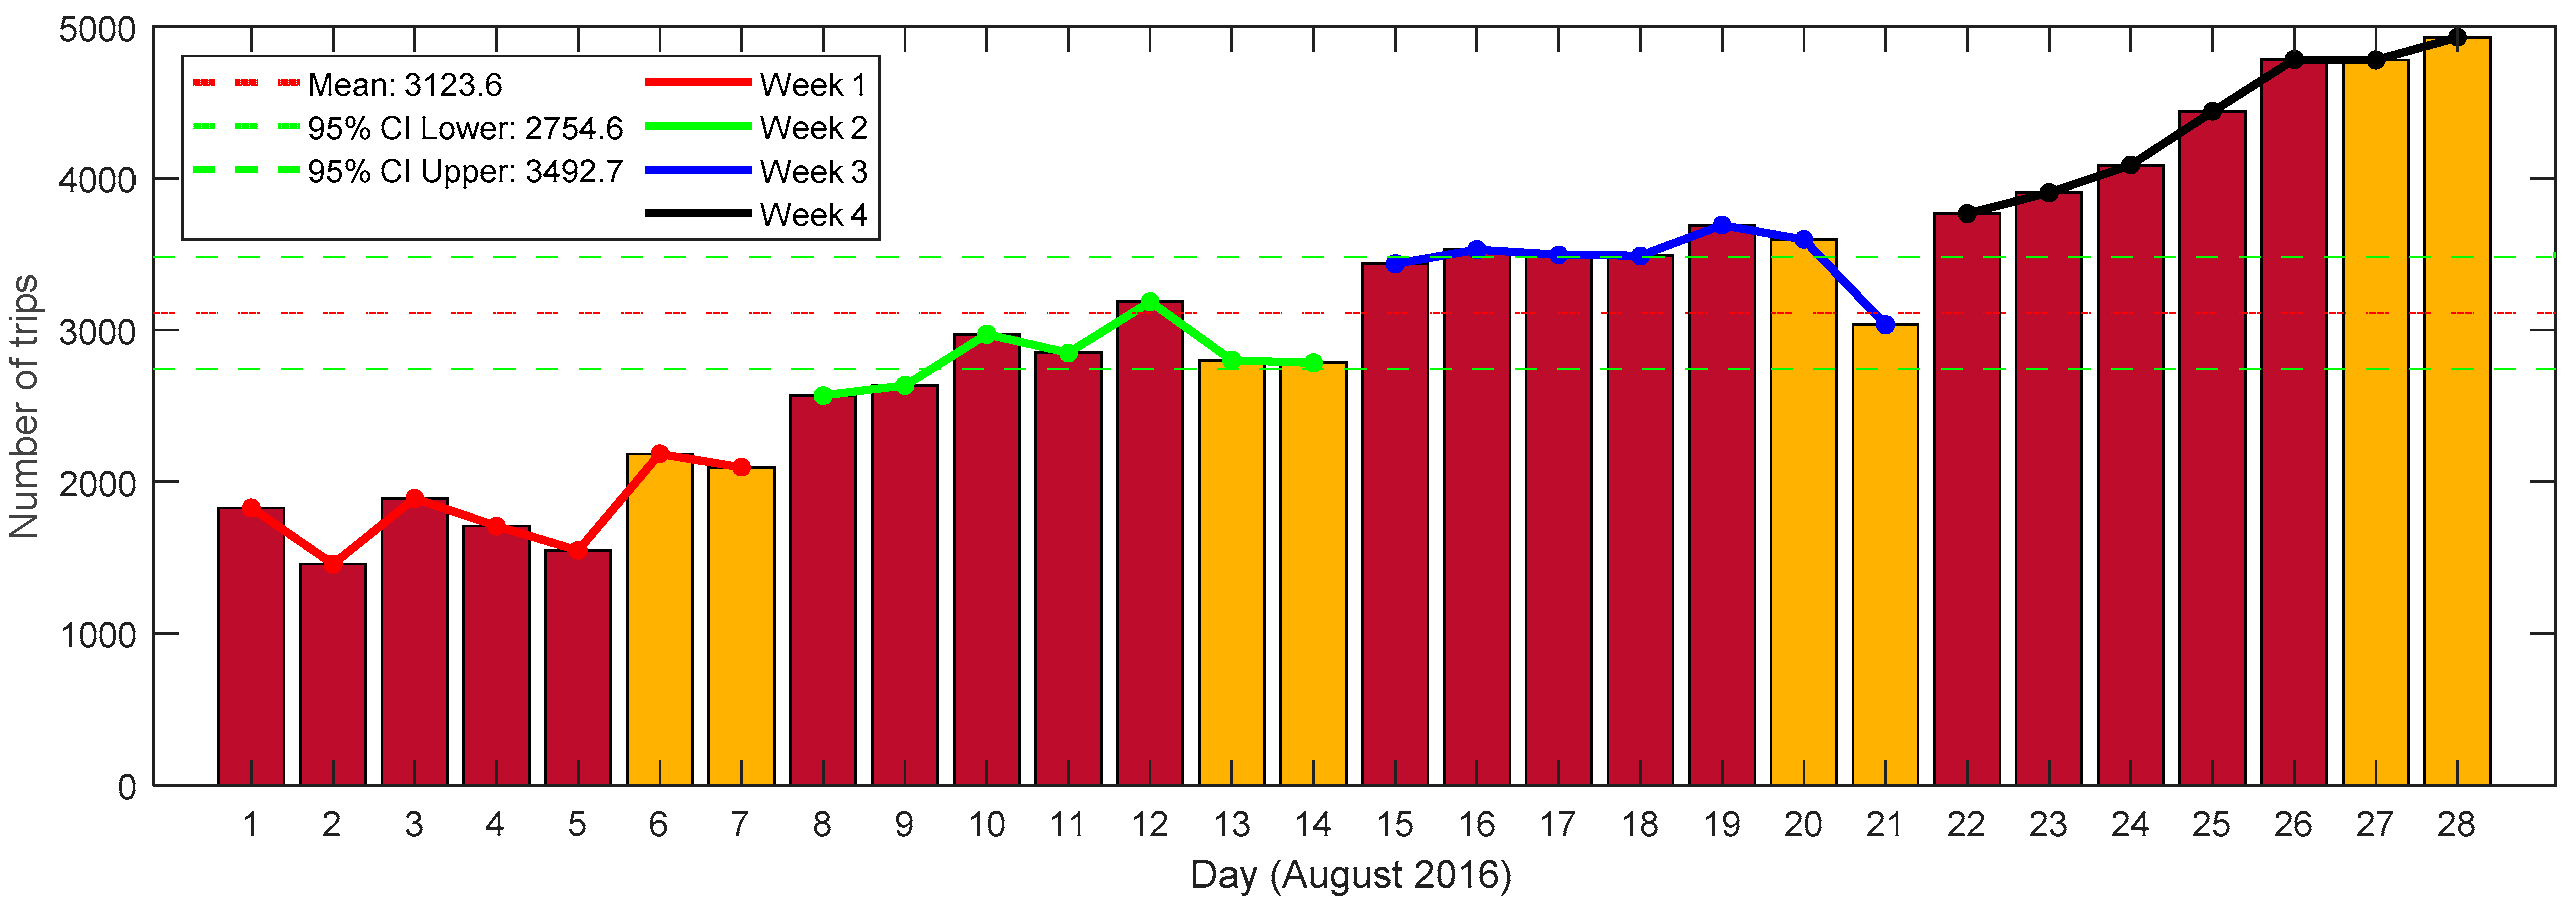
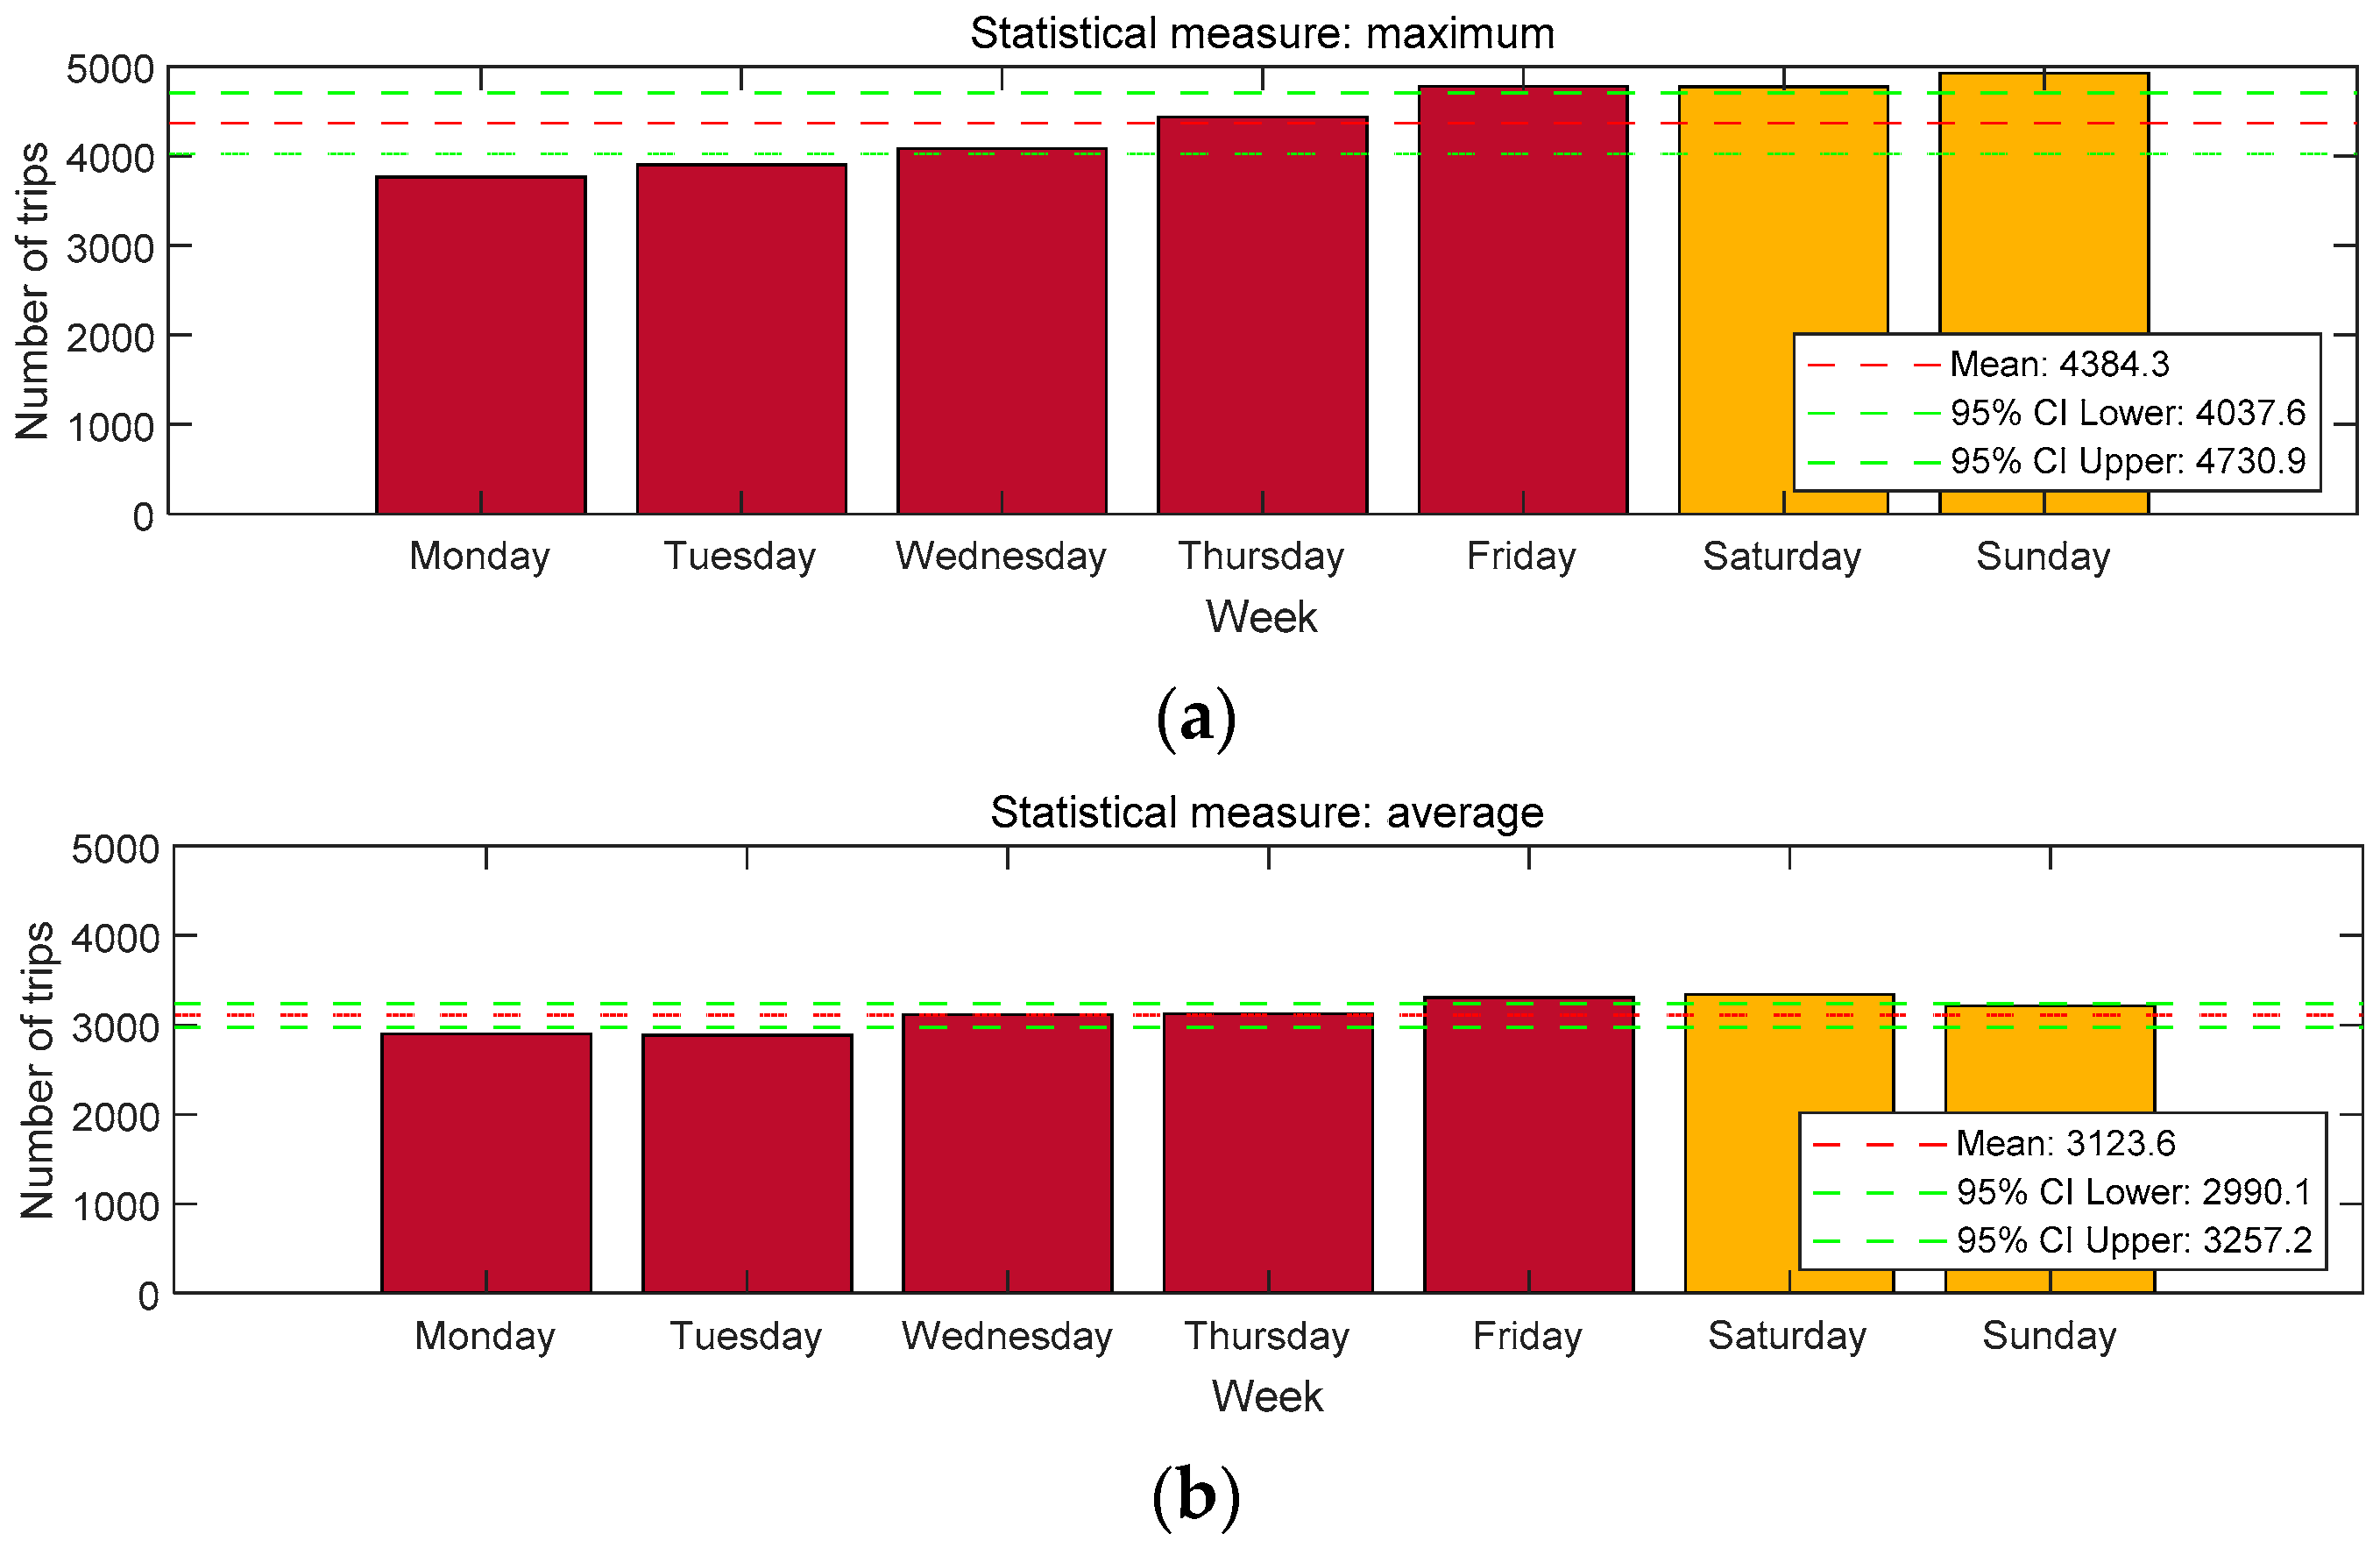
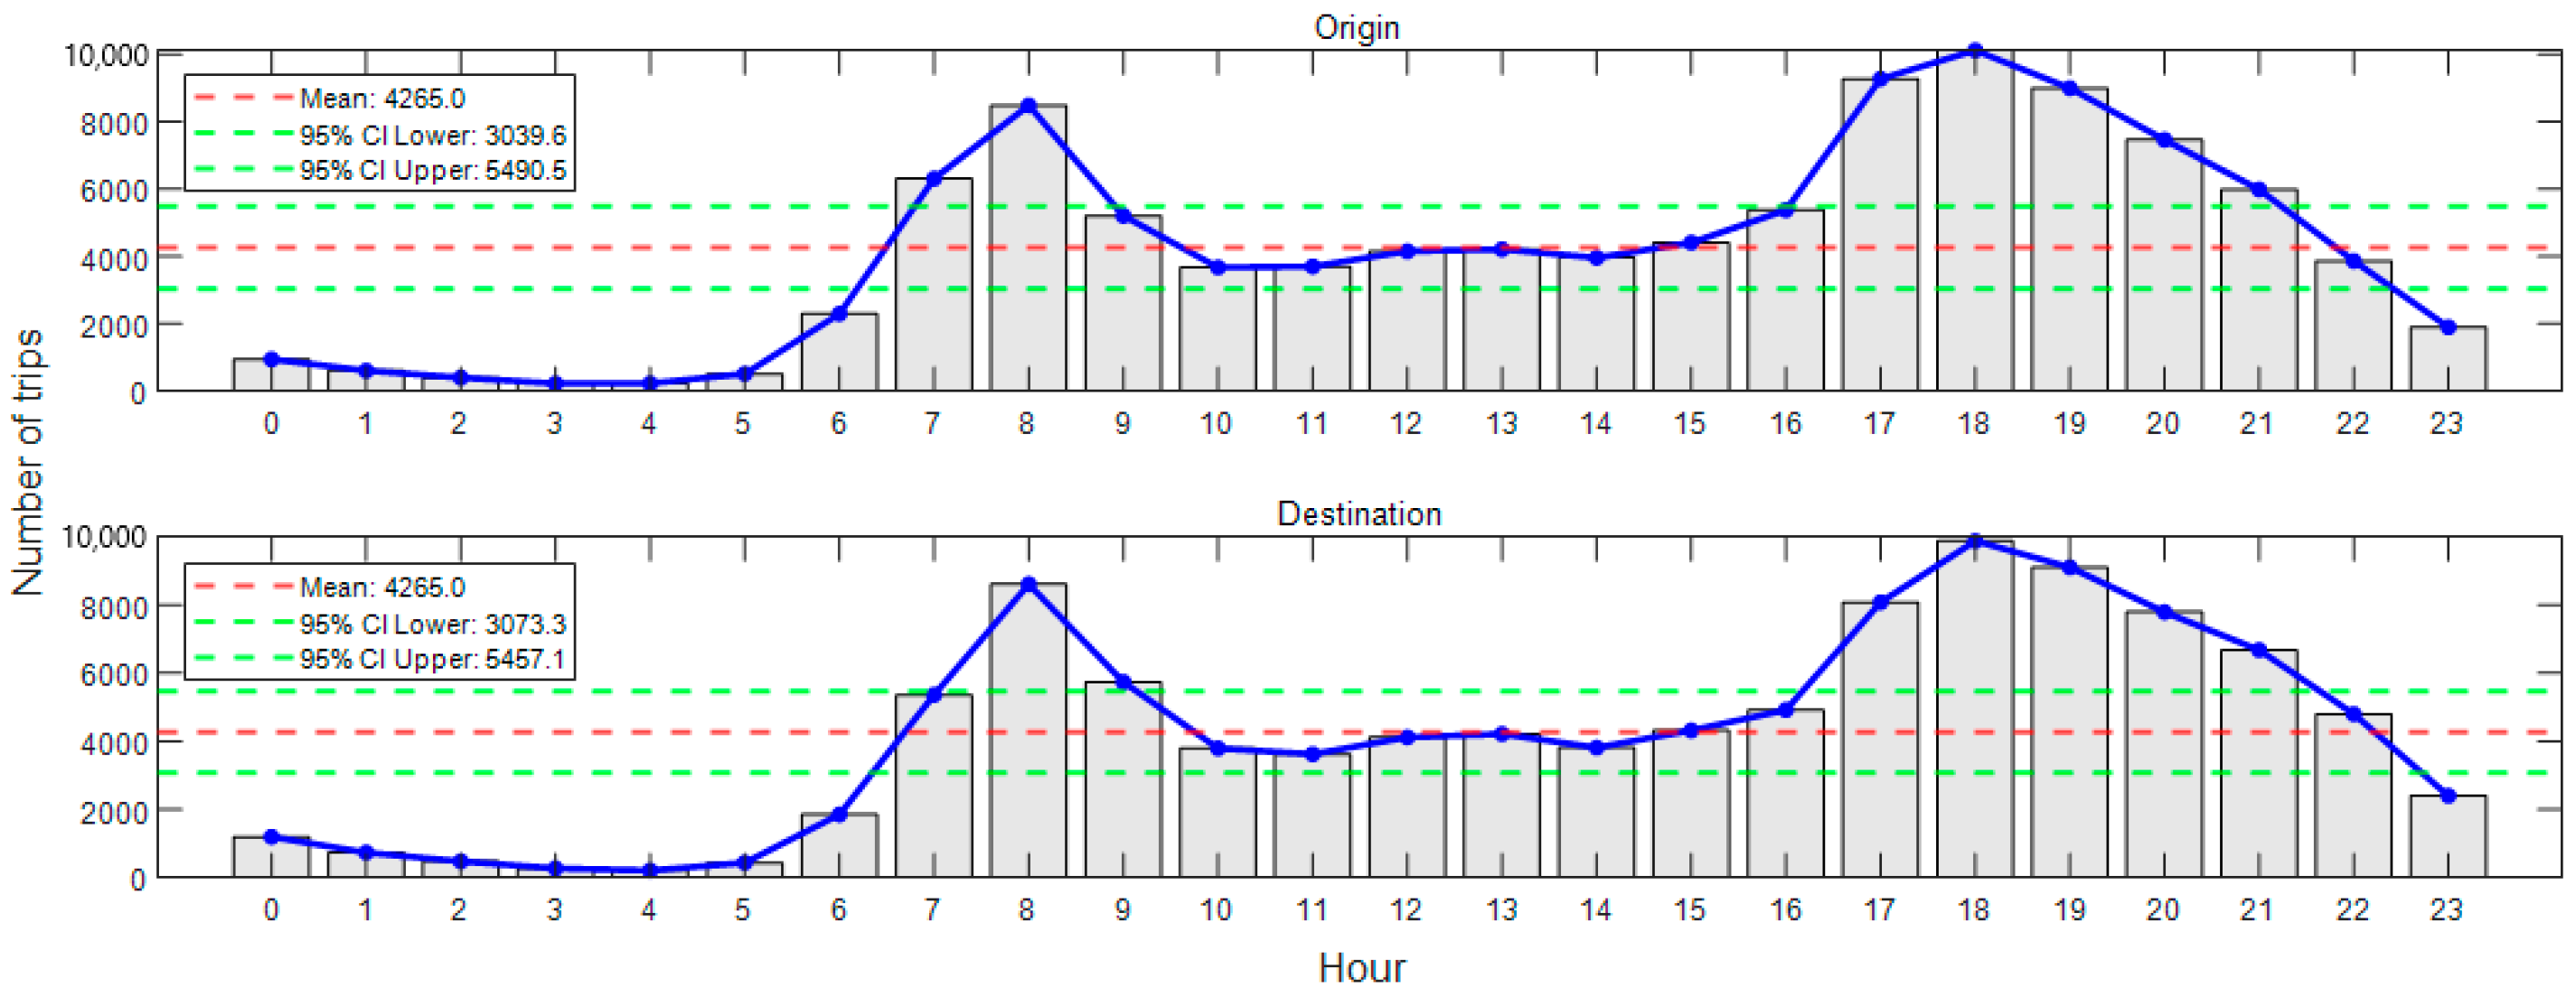
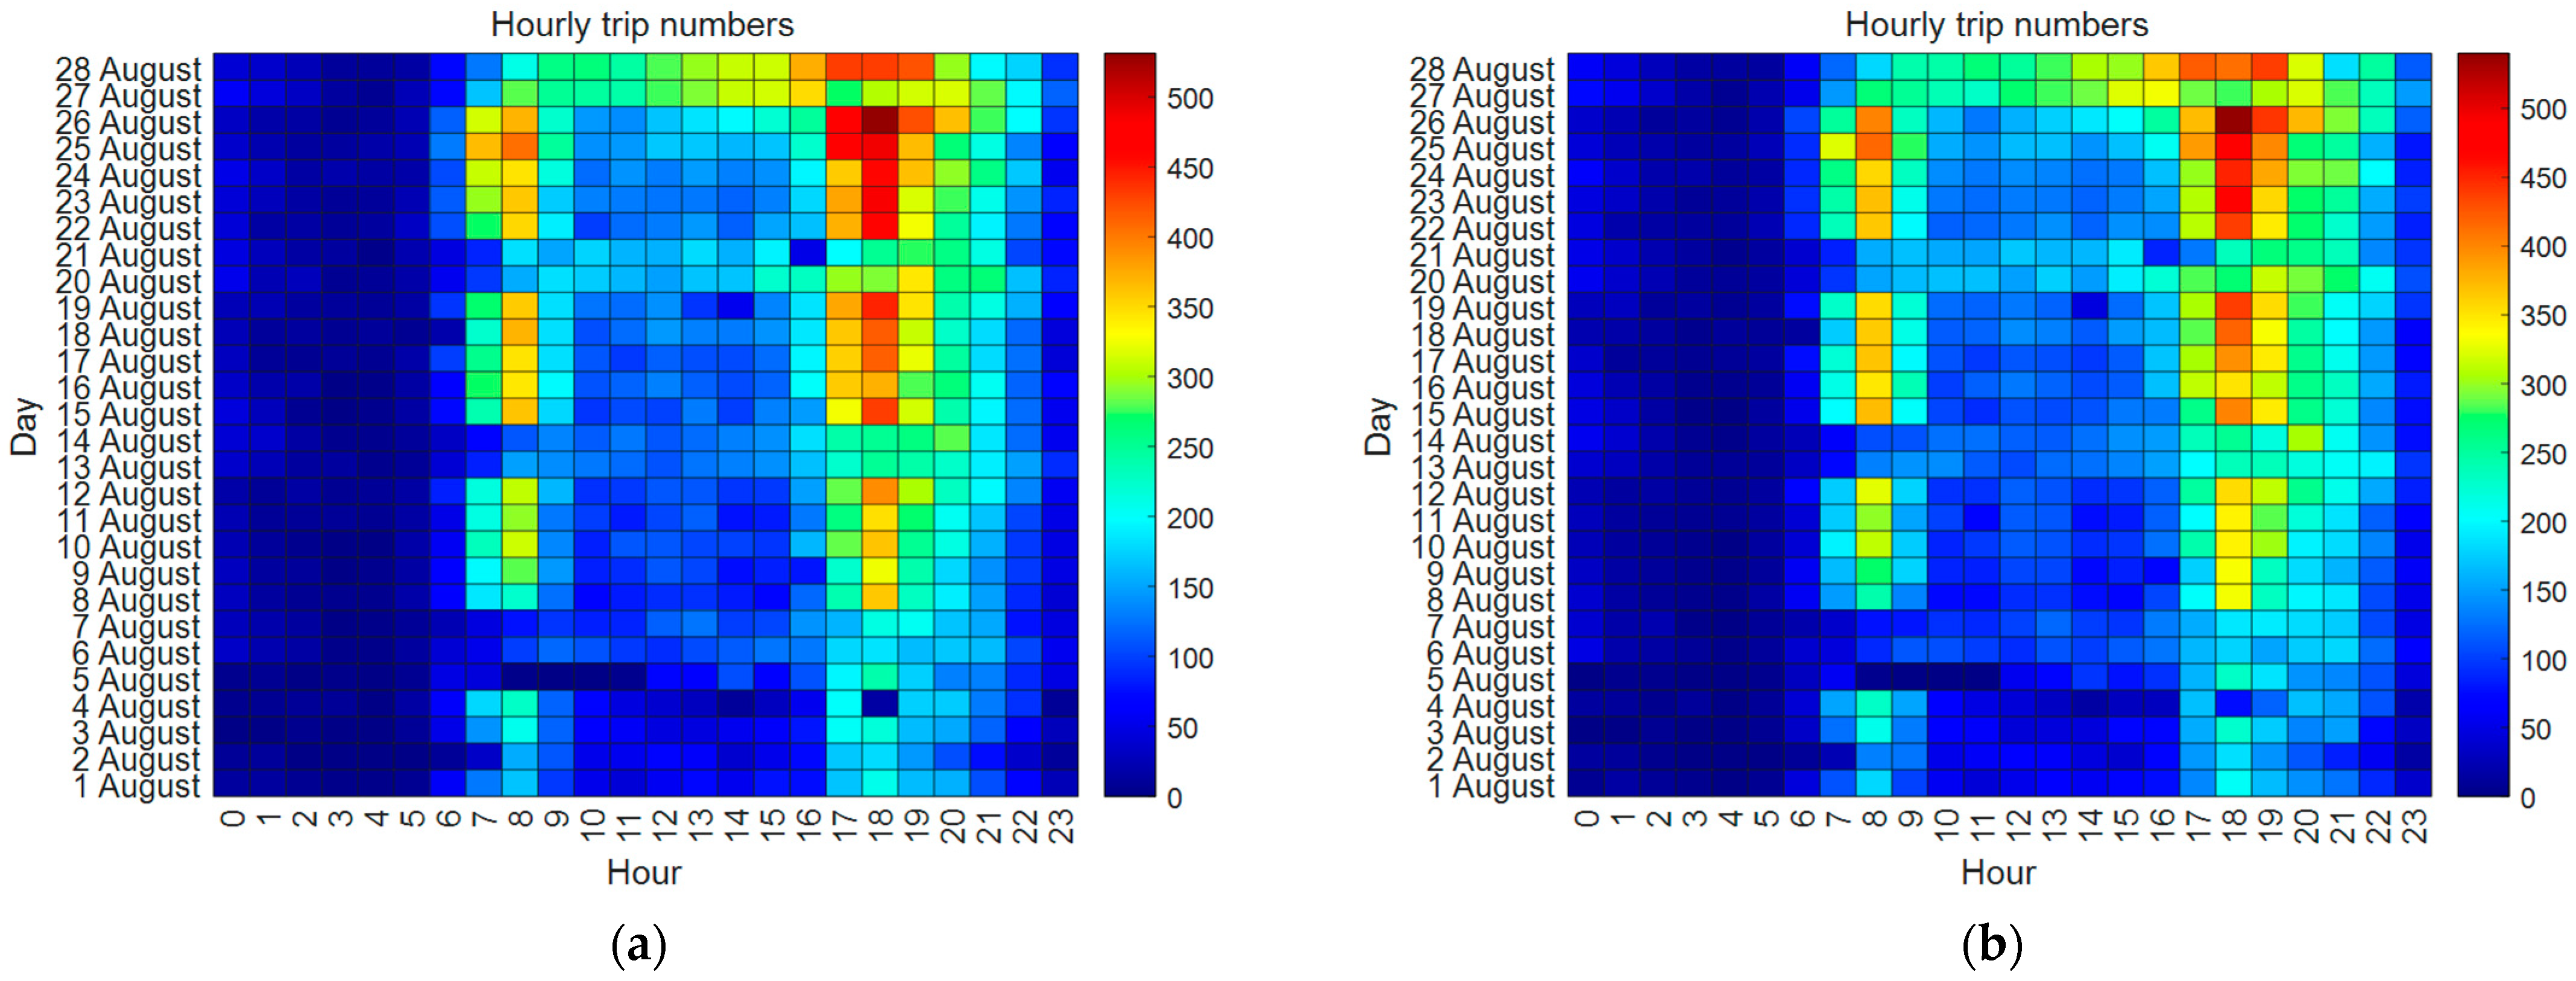
3.1.1. The Trip Numbers

The distribution of trip numbers on daily and weekly scales is visualized in Figure 4. In this figure, the horizontal axis represents individual days, while the vertical axis indicates the number of trips on those days. Additionally, the four weeks are marked with different-colored polylines: red for the first week, green for the second week, blue for the third week, and black for the fourth week. Moreover, the figure includes statistical confidence information, with the mean value indicated by a red dotted line and the 95% confidence interval represented by green dotted lines. Note that weekdays and weekends are highlighted using red and yellow rectangles, respectively. According to Figure 4, we can observe that, generally, the number of trips increases as the weeks progress. This interesting finding suggests that the number of trips may not exhibit strong periodic patterns throughout a month. Specifically, the number of trips in the latter weeks of a month might be larger than that in the initial weeks. For each week, the number of trips on weekends in three of the four weeks (i.e., week 1, week 2, and week 4) is larger than that on weekdays. Among the weekdays, Friday had the largest number of trips in three of the four weeks (i.e., week 2, week 3, and week 4). Additionally, in two of the four weeks (i.e., week 1 and week 2), Wednesday had the largest number of trips. This demonstrates that Wednesday and Friday are peak days for bike-sharing demand on weekdays, while weekends generally have higher demand than weekdays. Therefore, relevant departments can implement more effective measures to manage the high bike-sharing volumes on these specific days, ensuring smooth operation of bike-sharing traffic in intra-urban regions.
To further explore the distribution of trip numbers, we adopted the four commonly used statistical measures: maximum, average, median, and minimum. The distribution of trip numbers under these measures is shown in Figure 5. From Figure 5, we can observe that several patterns emerge. (1) Maximum measure: the maximum number of trips on Friday was the largest among weekdays, while Monday had the smallest maximum trip numbers. Additionally, maximum trip numbers on weekends were generally larger than those on weekdays. (2) Average measure: Friday had the largest average trip numbers on weekdays, followed by Wednesday and Thursday. Monday and Tuesday had the smallest average trip numbers. Average trip numbers on weekends were relatively larger than those on weekdays. (3) Median measure: Friday and Wednesday were the two days with the largest median trip numbers on weekdays, while weekends had generally smaller median trip numbers compared to weekdays. (4) Minimum measure: Wednesday had the largest minimum trip numbers. The minimum trip numbers on weekends were larger than those on weekdays, likely due to the overall larger trip numbers on these days. Overall, the findings based on the four statistical measures align well with the observations in Figure 4.
The distribution of hourly trip numbers is explored from two perspectives: the origin and the destination. This analysis is important because trips often span two neighboring hours. A trip is considered an origin if it starts within the corresponding hour and a destination if it ends within the corresponding hour. For example, if a trip starts from 8:05 and ends at 8:10, it is considered both an origin and a destination within the hour 8~9. If a trip starts from 8:55 and ends at 9:10, it is considered an origin within the hour 8~9 and a destination within the hour 9~10. Therefore, analyzing trips from both the origin and the destination perspectives provides a more objective and accurate representation of the actual situation. This approach helps us to characterize more reliable temporal patterns of intra-urban human mobilities.
The distribution of hourly trip numbers is shown in Figure 6. In this figure, the numbers on the horizontal axis denote the starting hour. According to Figure 6, the trends (red polyline) of hourly trip numbers are quite similar for both origin and destination. Two typical peaks are observed: 8:00~9:00 and 18:00~19:00. They correspond to the two commuting peaks in the morning and evening, respectively. This indicates a high demand on bike-sharing during these periods. It is also noticeable that the trip numbers were consistently larger during the evening peak compared to the morning peak for both origin and destination, indicating a greater demand for bike-sharing after work. Additionally, the hourly trip numbers in the evening (18:00~24:00) were larger than those in the early morning (0:00~5:00) for both origin and destination. This indicates that the most bike-sharing citizens engage in activities (e.g., entertainment) after work in the evening, while only a minority do so in the early morning before sleep. Another distinctive finding is that the trip numbers for origin during 7:00~8:00 and 17:00~18:00 were larger than those for destination. This indicates that more trips start during these hours than end, reflecting that more citizens begin work after 8:00 and finish after 17:00, while fewer start work before 7:00 and finish after 18:00.
To further explore the statistical characteristics of hourly trip numbers, we plotted the distribution of trip numbers for each day from the perspectives of both origin and destination using heatmaps, as shown in Figure 7. From Figure 7a,b, we can observe that the distributions are generally similar and align well with the trends shown in Figure 6. In both heatmaps, clear weekday–weekend patterns for hourly trip numbers are evident. Specifically, on weekdays, there are always two peaks (one in the morning and one in the evening) for both origin and destination. However, on weekends, the two-peak effect is not as pronounced. A distinctive finding on weekends is the presence of a clear peak in the evening, while the morning peak is less obvious. Additionally, the trip numbers on weekends were usually smaller than those on weekdays for both origin and destination. This indicates that bike-sharing traffic flows are more evenly distributed in the mornings on weekends but still relatively high in the evening, especially during 17:00~19:00. There are also differences in hourly trip numbers between Saturday and Sunday for both origin and destination. One noticeable difference is that the hourly trip numbers in the morning on Saturday are relatively larger than those on Sunday, indicating that more citizens prefer intra-urban mobilities on Saturdays than Sundays. These insights can provide valuable suggestions to related governmental departments and bike-sharing companies for better managing traffic flows and serving bike users.
The evolutions of trip numbers across time can be explored using the CTM. Specifically, the trip numbers for each day during any time interval, from the perspectives of both origin and destination, can be derived and visualized in the CTM diagrams. These diagrams can reveal potential temporal patterns related to trip numbers. For example, the CTM diagrams of trip numbers on 15 August from the perspectives of origin and destination are shown in Figure 8. According to Figure 8, the evolution trends of trip numbers for both origin and destination are quite similar, which is consistent with the previous conclusion drawn from Figure 7. However, Figure 8 provides much more detailed information, allowing for the uncovering of additional temporal patterns. One notable pattern is that although the evening peaks for both origin and destination occurred mainly during 18:00~19:00, the red color (indicating large trip numbers) is much denser in Figure 8a than in Figure 8b. Additionally, during neighboring time periods, the changes in trip numbers differ. For instance, during 17:00~18:00, more trips are shown in Figure 8a than Figure 8b, but during 19:00~20:00, more trips appear in Figure 8b than Figure 8a. The changes during 17:00~20:00 in Figure 8a are relatively sharp compared to those in Figure 8b, indicating that the mobilities for origins are more concentrated than destinations during this period. Another interesting pattern is that although the periods with low trip flows for both origin and destination were 00:00~6:00, the periods with no human mobility (indicated by white areas) were longer for origins than destination. Thus, by using CTM diagrams, one can explore detailed temporal patterns of human mobility on specific days.
The CTM can achieve the clear visualization of the days that have the largest trip numbers during all time intervals as well. Figure 9 displays the CTM diagrams with the largest trip numbers during all time intervals from the perspectives of both origin and destination. According to Figure 9, the largest trip numbers appeared on 28 August for both origin and destination. Specifically, the largest trip numbers occurred on 25 August during the first half of the day (00:00~12:00) and on 28 August during the second half of the day (12:00~24:00) for both origin and destination. During the morning and evening peaks, 25 August and 26 August had the largest trip volumes, respectively, for both origin and destination. Nevertheless, some obvious differences between Figure 9a,b exist as well. For example, during the period of 5:00~6:00, the largest trip number for origin was on 22 August, while for destination, it was on 25 August. During the period of 6:00~7:00, the largest trip number for origin was on 25 August, but it was on 26 August for destination. During 9:00~10:00, 28 August had the largest trip numbers for origin, but it was 25 August for destination. Similar differences were observed during the periods of 12:00~15:00, 17:00~18:00, and 21:00~23:00. In summary, both similar and different temporal patterns of intra-urban human mobility regarding trip numbers can be easily characterized using CTM diagrams according to one’s specific demands. Based on these patterns, such as the peak usage time intervals and the corresponding days, decision-making processes can be informed for bike-sharing companies. For example, by understanding these patterns, companies can better anticipate demand and adjust bike distribution dynamically, ensuring that bikes are available where and when they are most needed.

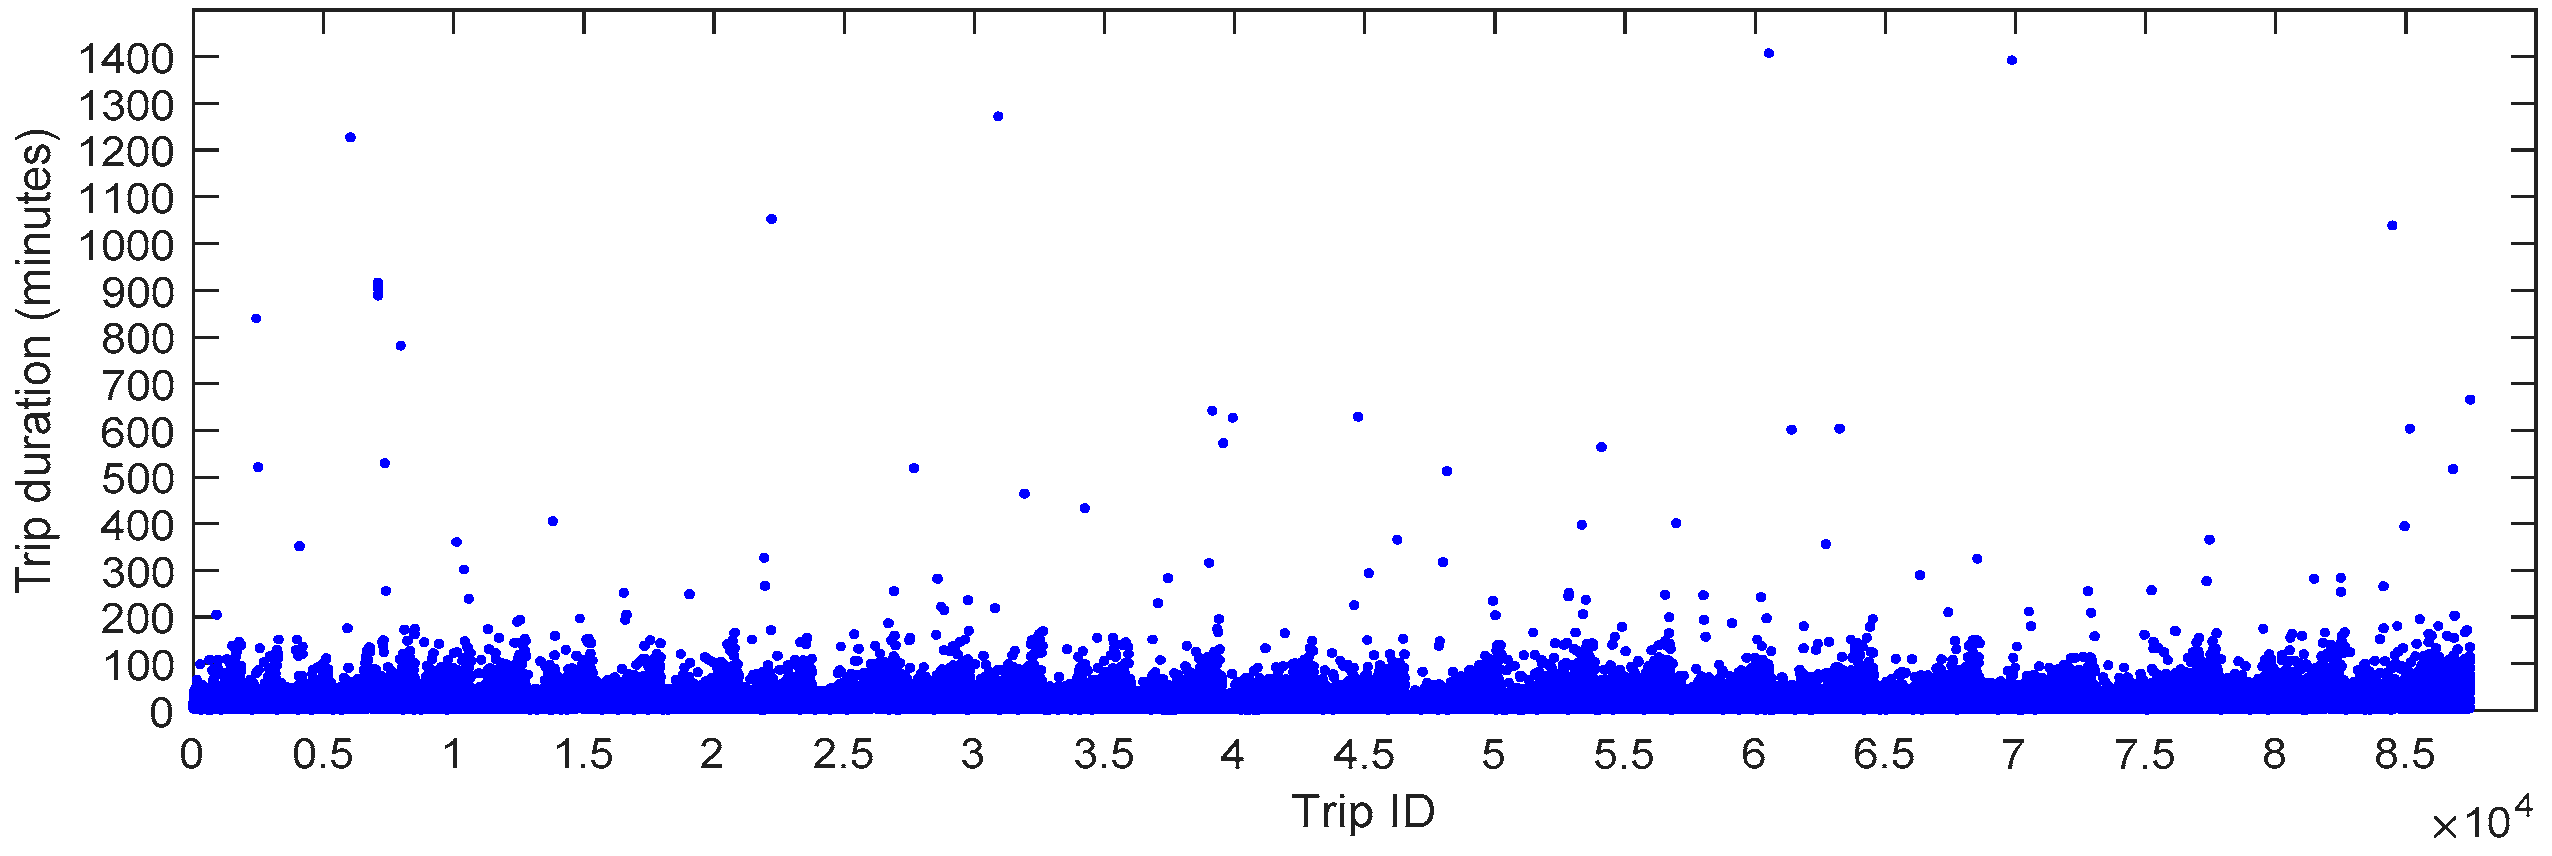
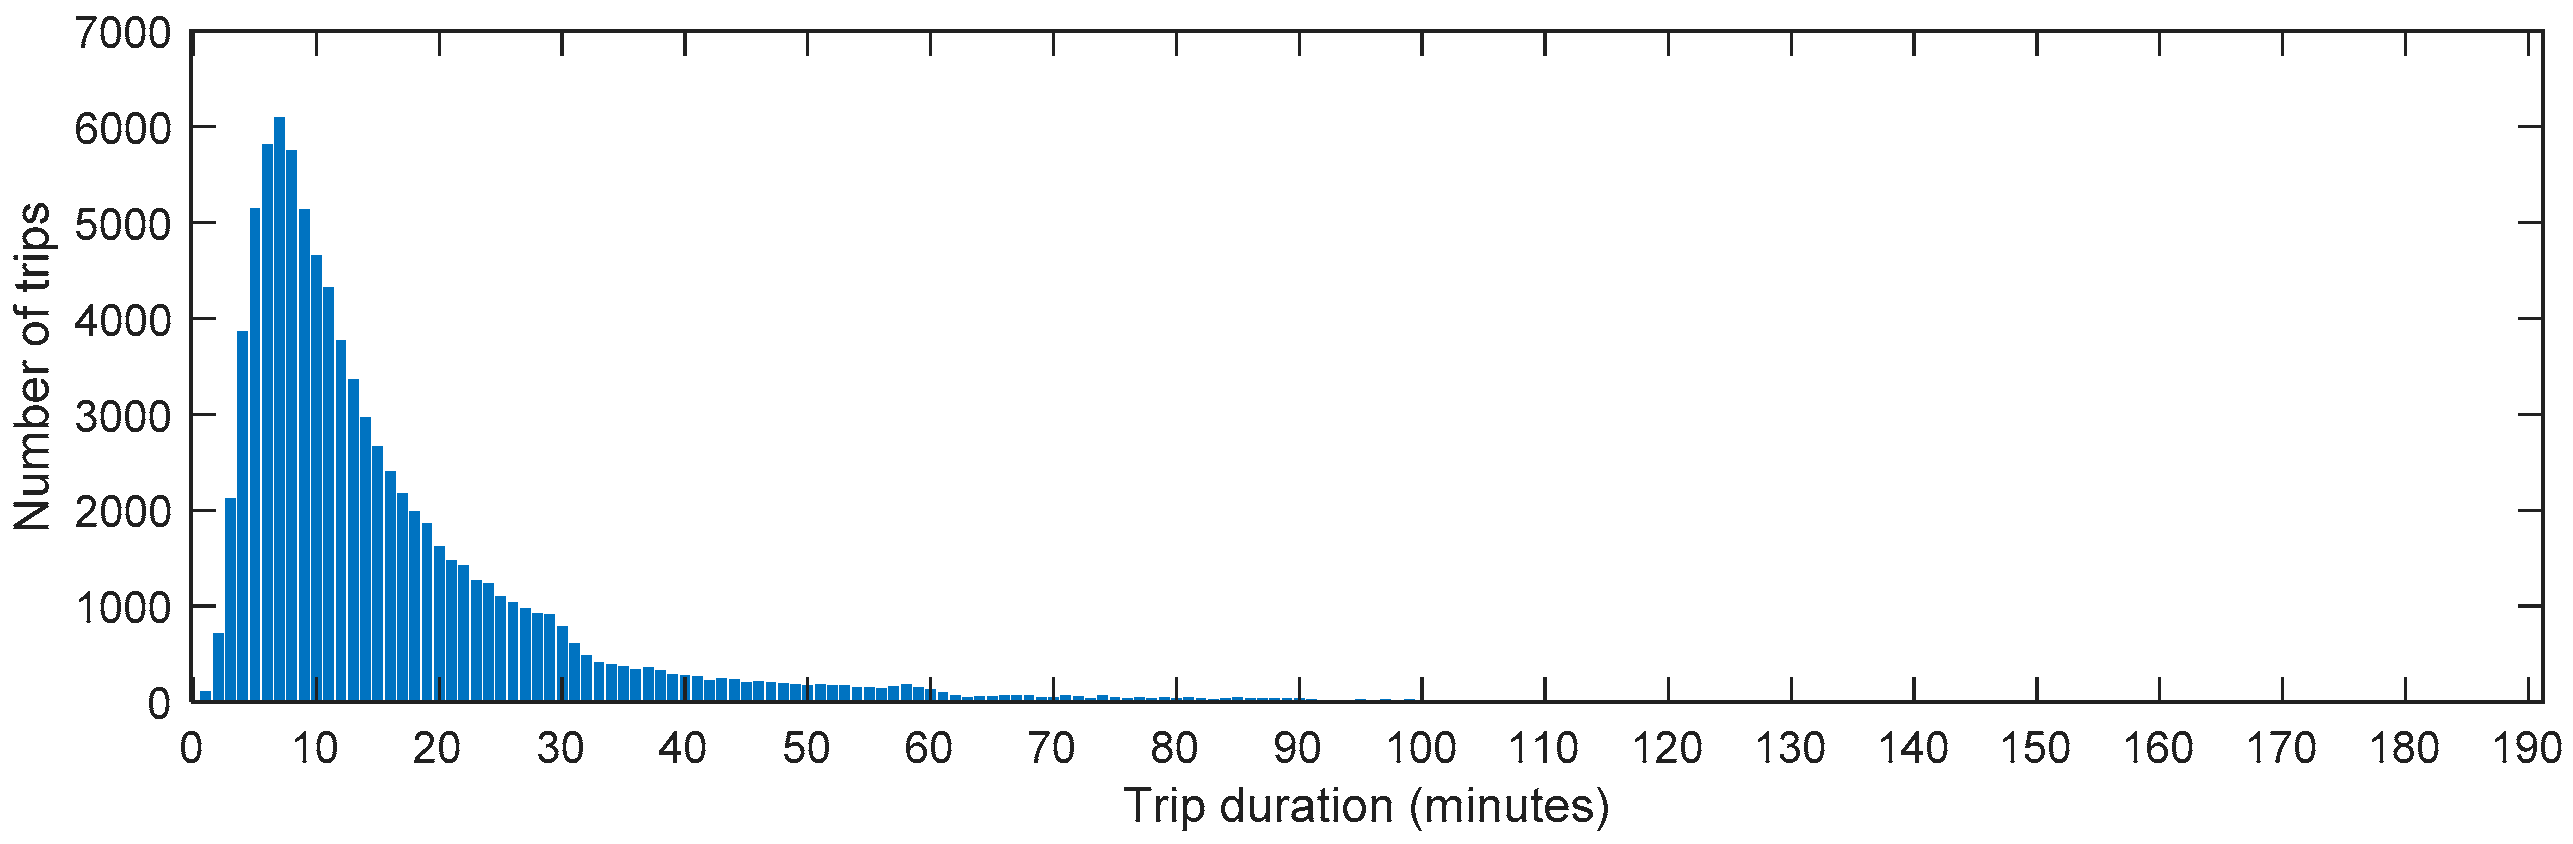
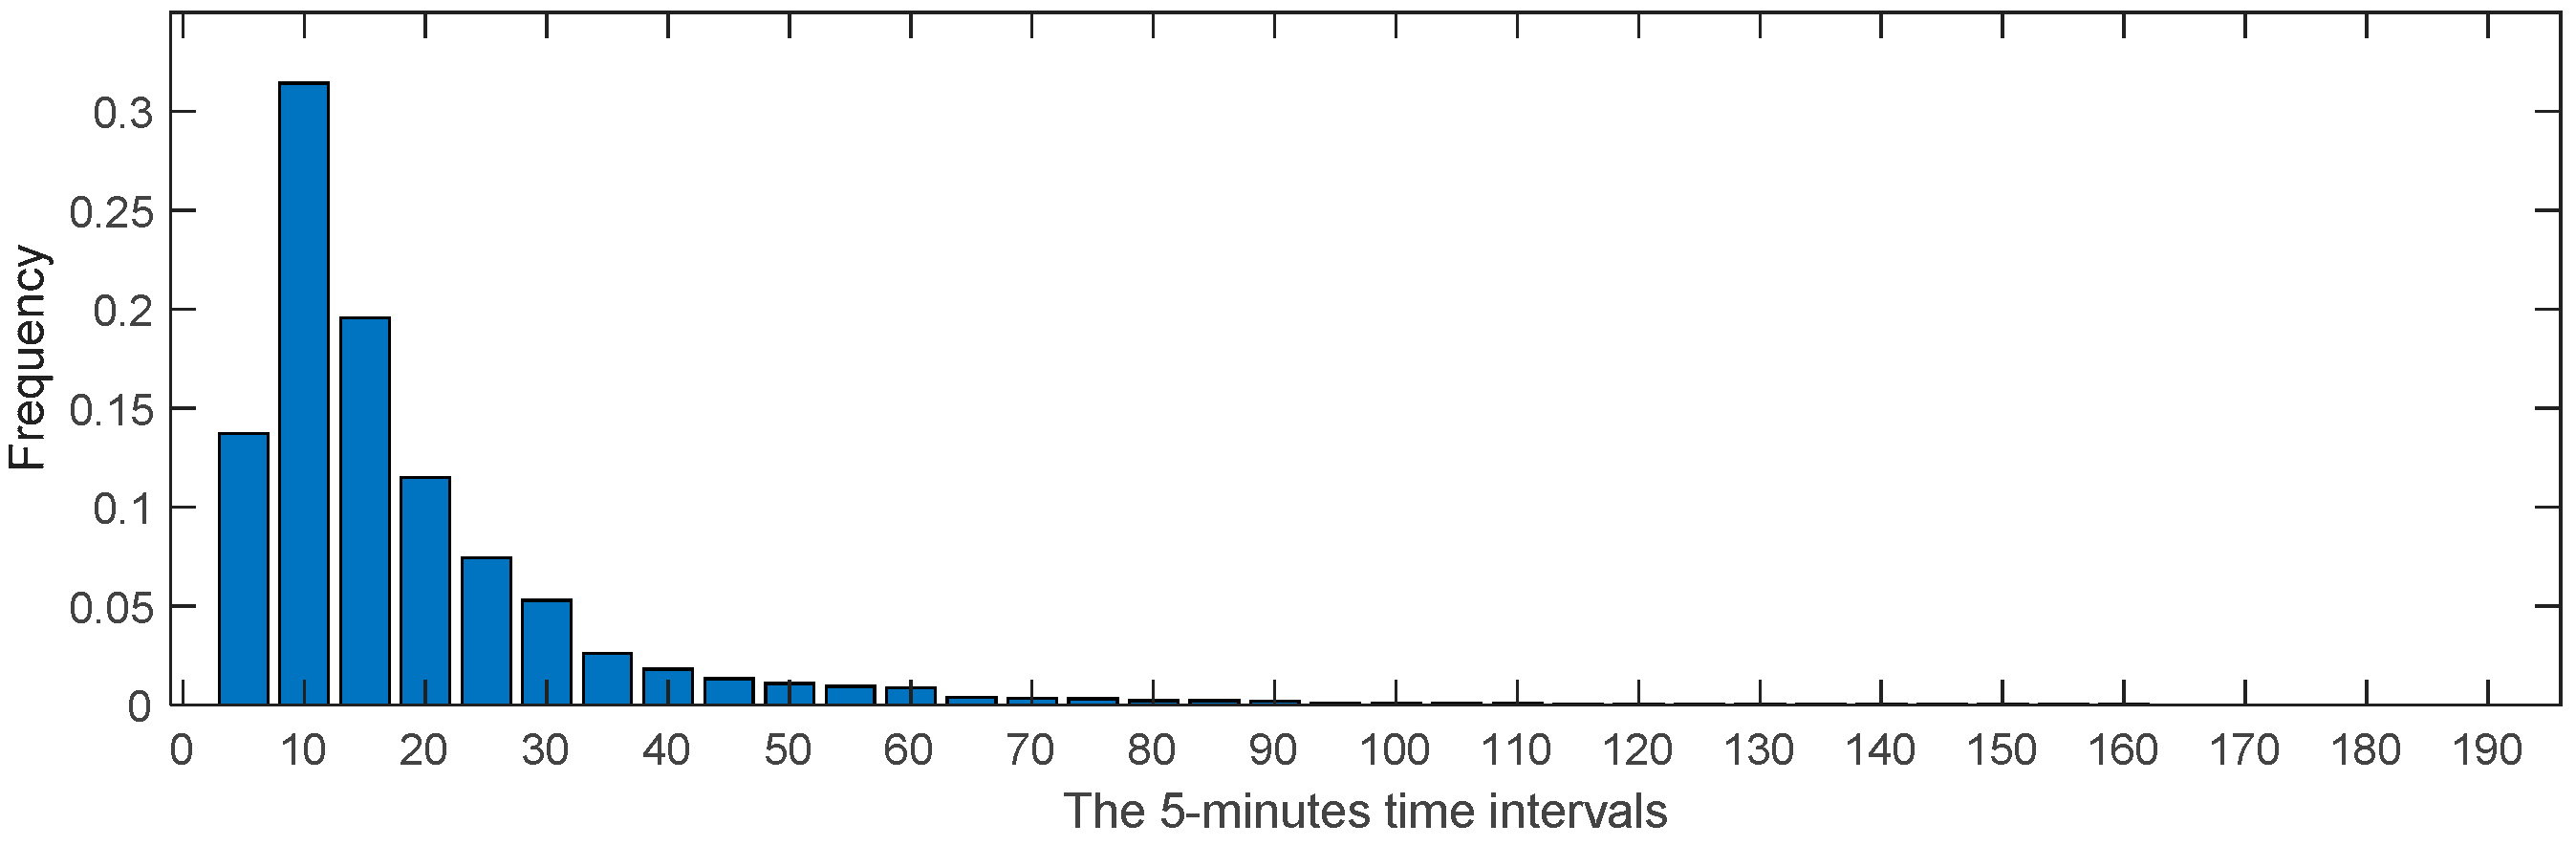
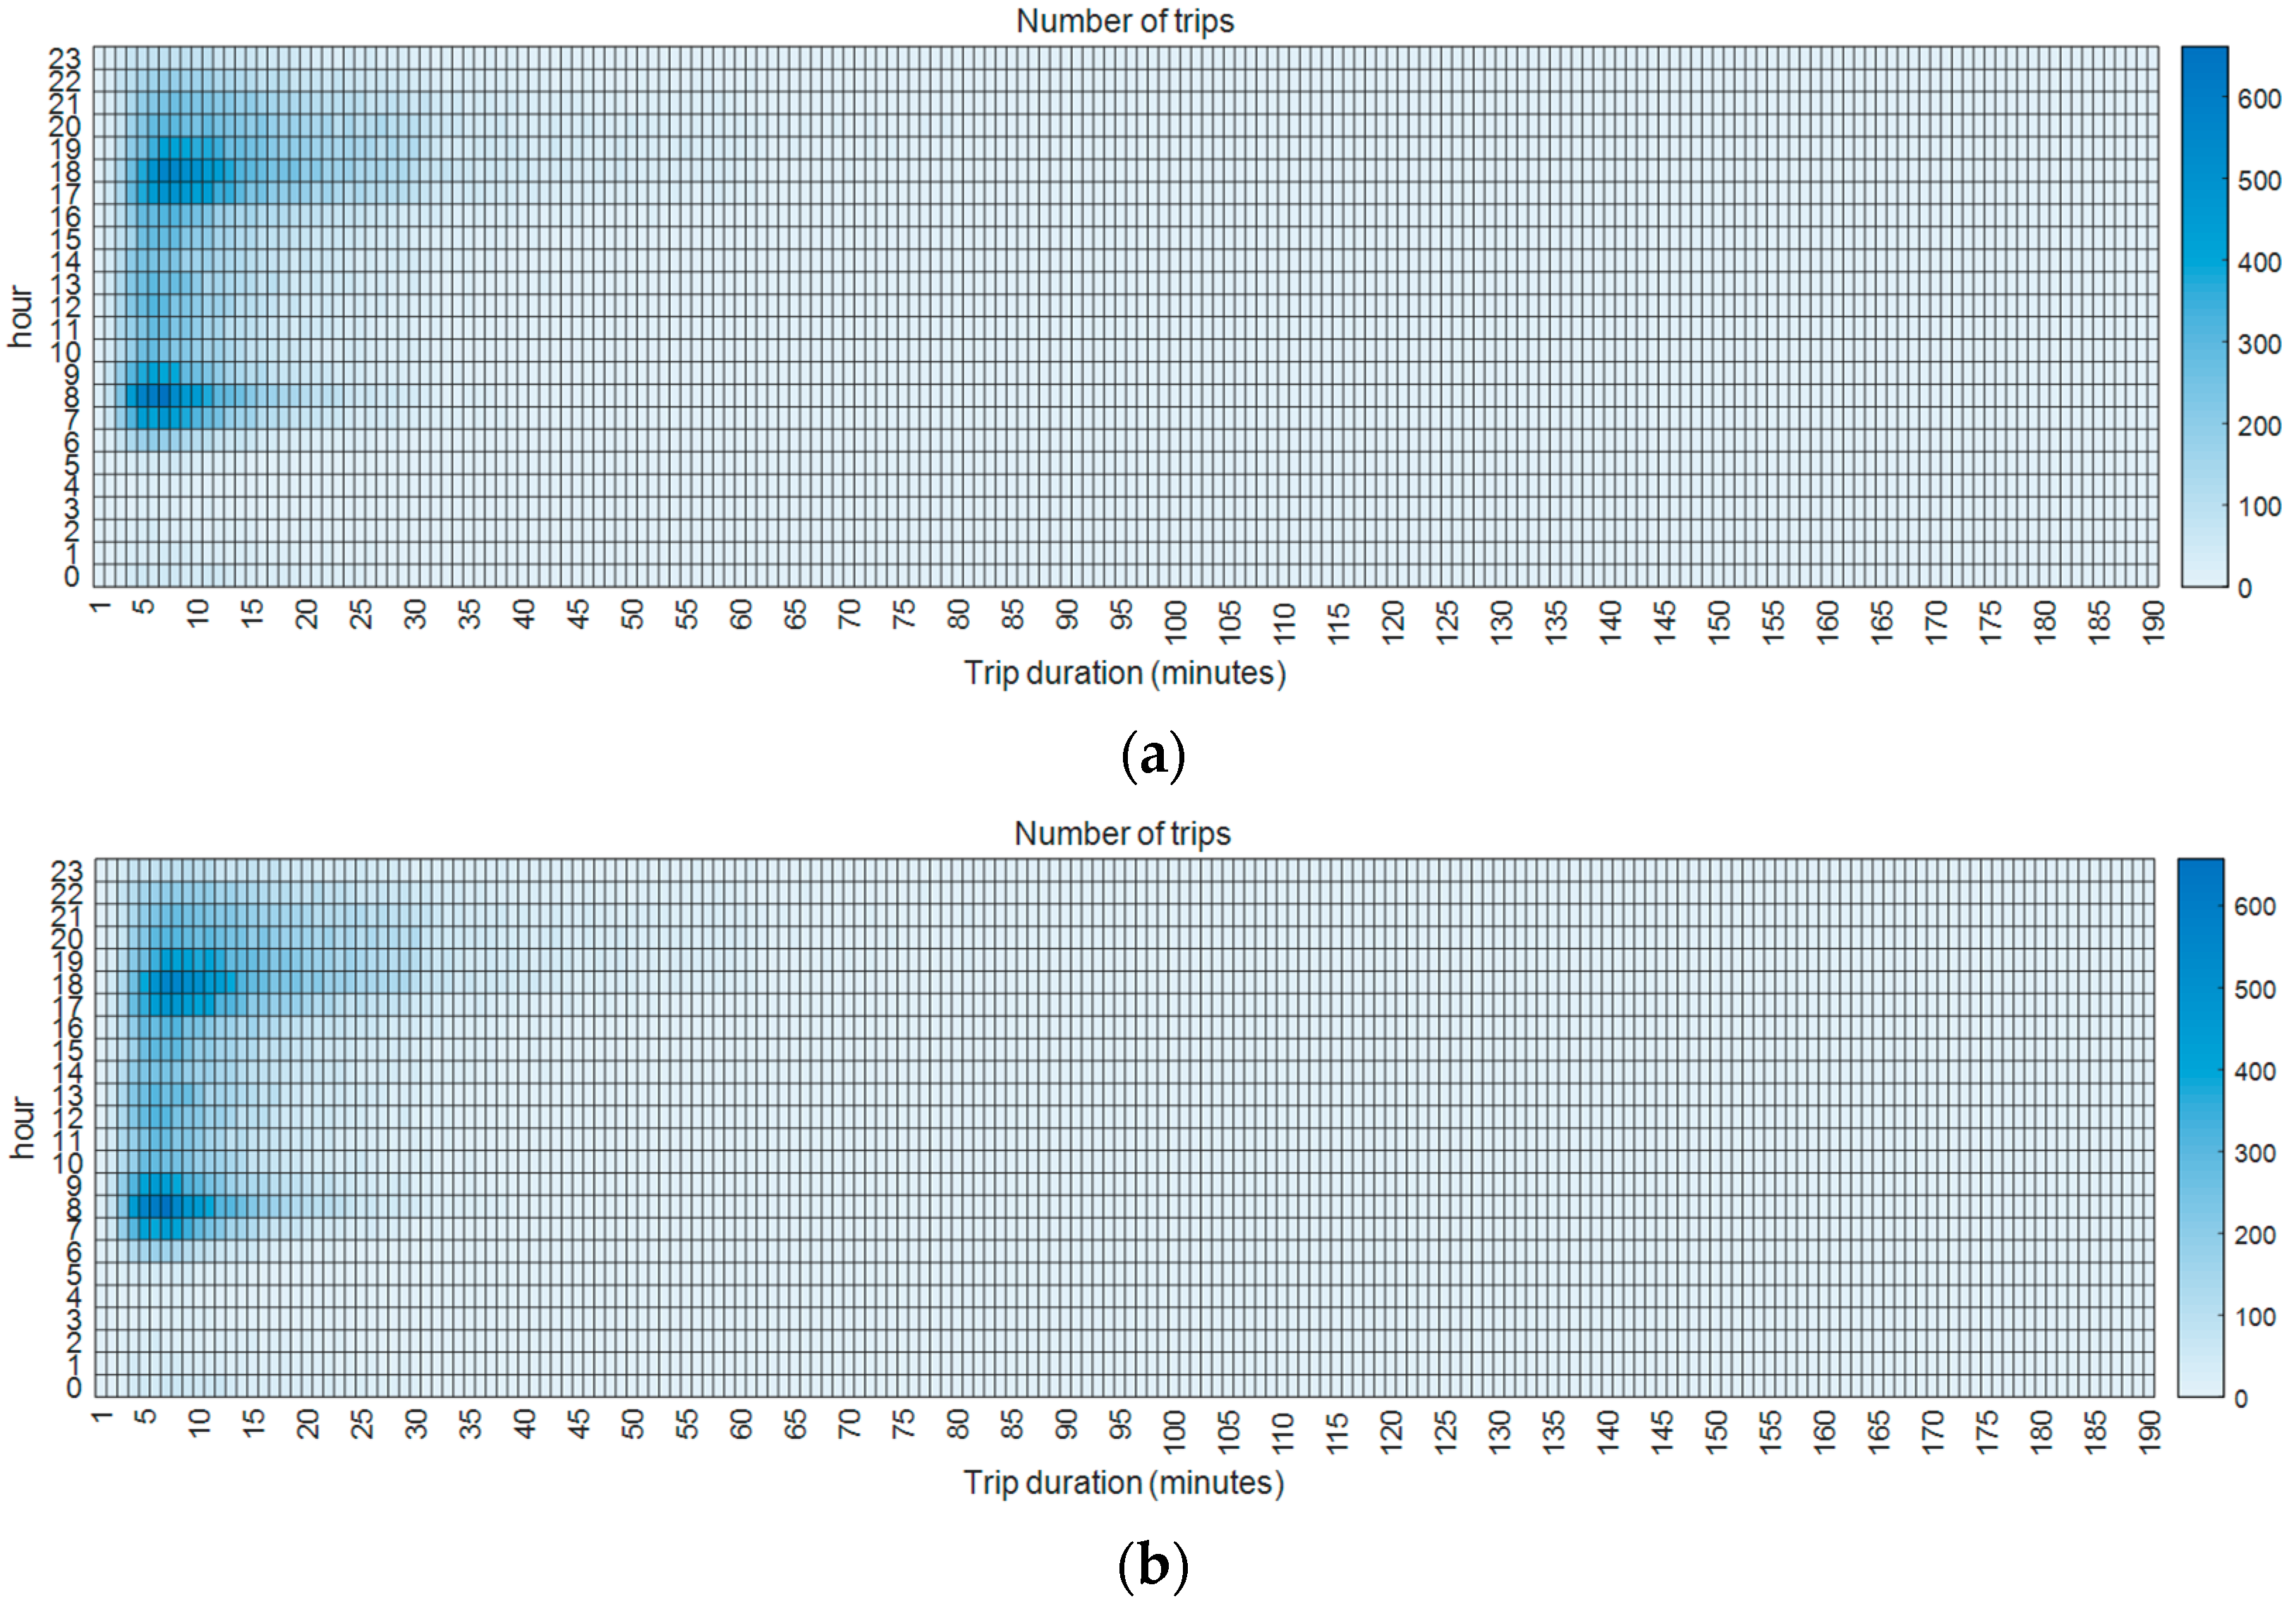
3.1.2. The Trip Durations

The duration of each trip was analyzed from various perspectives. Figure 10 shows a scatter plot of all trip durations, revealing that trip durations vary significantly, with the majority falling within approximately 50 min. Long-term trips may occur under specific circumstances, and in extreme cases, trip durations can be quite long (e.g., around 1400 min). However, such instances are rare in daily human intra-urban mobility. To further explore the statistical distribution of trip durations, we plotted a histogram showing the relationship between trip durations and the corresponding number of trips. As seen in Figure 10, although extremely long trip durations exist in the datasets, they are rare in reality. To provide a more accurate statistical analysis, we considered these extremely long trip durations as outliers and excluded them when plotting the histogram. Specifically, we treated the top 0.1% of the longest trip durations as outliers after analyzing the dataset. After removing these outliers, the maximum trip duration is 190 min. The corresponding histogram is shown in Figure 11. From Figure 11, we can observe that trips lasting 7 min accounted for the largest proportion, followed closely by trips lasting 6 min and 8 min. This suggests that the peak bike-sharing travel time for intra-urban human mobility is between 6 and 8 min. Additionally, the distribution of trip durations clearly follows the “long tail” theory, meaning that small values make up the majority, while very large values account for only a small percentage.
To clarify the results, we classified the trip durations into 5-min intervals, resulting in 38 distinct intervals. The frequency of each 5-min interval is visualized in the histogram shown in Figure 12. From Figure 12, we can observe that trip durations between 6 and 10 min accounted for the largest proportion (over 30%), followed by durations between 10 and 15 min (approximately 20%) and durations between 0 and 5 min (around 15%). This indicates that the majority of trips lasted within 15 min, suggesting that most people prefer to use bikes for intra-urban mobility when the travel time is within this range. For trips lasting longer than 15 min, many people might opt for other forms of transportation, such as cars, buses, or metros. In addition, the cumulative frequency of the 5-min interval is plotted in Figure 13. From Figure 13, we can see that trips lasting within 15 min made up about 65% of all trip durations. Approximately 90% of all trips were completed within 30 min and around 95% within 60 min. This reflects a distinctive characteristic of intra-urban human mobility facilitated by bike-sharing systems.
The statistical distribution of trip durations and corresponding number of trips for each day and each hour (both origin and destination) was explored as well, which is shown in Figure 14. From Figure 14, it is evident that the distribution of trip durations and corresponding trip numbers is quite consistent across each day and each hour. Additionally, this distribution is similar to what is observed in Figure 11. This indicates that trip durations generally follow the “long tail” theory, whether examined by hour, by day, or over the entire 28-day period, even though the number of trips varies by hour and day. This interesting finding can be considered “common sense” and provides valuable insights into intra-urban human mobility patterns when using bike-sharing transportation systems. Such insights could be useful for transportation departments and companies involved in managing and optimizing bike-sharing services.
In addition, the distribution of trip durations can be explored using commonly used statistical measures such as maximum, minimum, average, and median. Due to space limitations, this paper focuses on the average measure, which is widely used. The average measure was employed to explore trip durations during each hour of each day from two perspectives: origin and destination. The average trip durations for each hour of each day are shown in Figure 15. From Figure 15a,b, we can observe that the distribution of average trip durations for the same day, from the perspectives of both origin and destination, exhibited several common temporal patterns. Two typical patterns are that (1) the average trip durations during the morning peaks were shorter than those during the evening peaks, and (2) the average trip durations during “non-working hours” were longer than those during “working hours”. An interesting finding is that, even on the same day, the results for origin and destination may vary significantly. For instance, for 15 August 2016, the distribution of average trip durations for origin differs markedly from that for destination. In addition, the distribution of average trip durations exhibit a distinctive pattern: The average trip durations in the early morning and late evening are generally longer than during other periods. This indicates that the intra-urban human mobility by bikes in the early morning or late evening is typically longer, likely because public transportation systems are not operational during these periods. As a result, bike-sharing systems become the primary mode of intra-urban mobility. Conversely, during other periods, when public transportation is available, people have more options besides bike-sharing. This distinctive finding offers useful insights for bike-sharing companies in the context of sustainable intra-urban human mobility and the role of bike-sharing systems in reducing urban congestion and emissions, enabling them to strategically allocate bikes during specific periods to meet demands effectively.
The evolutions of average trip duration at all temporal scales for each day can be explored using the CTM. For example, the CTM diagrams of the average trip durations at all temporal scales from 0 to 24 h on 1 August are shown in Figure 16. From Figure 16a,b, we can see that the average trip duration at the coarsest temporal scale (i.e., 24 h) is similar for both origin and destination. However, at finer temporal scales, different evolution patterns emerged between origin and destination. Several distinctive patterns include the following: (1) during the period from 3:00 to 5:00, the average trip durations for destination were obviously longer than those of origin; (2) during the period from 6:00 to 8:00, the average trip durations for destination were relatively shorter than those for origin; and (3) during the period from 21:00 to 24:00, the average trip durations for destination were distinctly longer than those for origin. These patterns may be difficult to detect using traditional analysis tools, highlighting the advantages of using the CTM to characterize the temporal patterns of intra-urban human mobility. The CTM allows one to explore and characterize the temporal patterns of any day of interest, offering valuable insights into intra-urban human mobility.
Similar to the clear exhibition of the days with the largest trip numbers shown in Figure 9, the CTM can also effectively display the days with the longest average trip durations across all time intervals. The CTM diagrams of the days with the longest average trip durations in August are shown in Figure 17. According to Figure 17, it is evident that the evolution of days with the longest average trip durations varies significantly across different temporal scales. In general, the days with the longest average trip durations for origin were 28 August, 20 August, and 27 August at relatively large temporal scales; 6 August and 8 August at medium temporal scales; and various other days at smaller temporal scales. In comparison, the days with the longest average trip durations for destination were 28 August, 15 August, and 6 August at large temporal scales; 10 August and 13 August at medium temporal scales; and other days at smaller temporal scales. These observations can help characterize the typical temporal patterns of intra-urban human mobility from the perspective of days with the longest average trip durations.

3.2. The Bike Level

Although analyzing bike-sharing trips at the trip level provides various insights into intra-urban human mobility characteristics, it is still insufficient for thoroughly characterizing the temporal patterns of such mobility. Hence, to gain a more detailed understanding, it is essential to conduct exploratory analysis at other levels, such as the bike level and the user level. This section focuses on the exploratory analysis of bike-sharing trips at the bike level.
Based on the dataset used in this paper, 68,541 bikes are included. A key metric for assessing bikes is the number of utilizations. Therefore, this section primarily focuses on analyzing bike utilizations. First, a scatter plot showing the number of utilizations per day for each bike is presented in Figure 18. In this figure, the horizontal axis corresponds to the bike ID, and the vertical axis represents the number of utilizations. According to Figure 18, the number of utilizations generally ranges from 1 to 11. Among these, the overwhelming majority of bikes have five or fewer utilizations. To quantify this, all the number of utilizations, the occurrences of each number, the frequency of each number, and the cumulative frequency of each number are calculated, respectively. The corresponding results are listed in Table 1, which reveals that nearly 80% of the bikes had one utilization, approximately 15% had two utilizations, and nearly 99.9% had five or fewer utilizations. The histogram between the number of utilizations and the corresponding number of occurrences is shown in Figure 19, which also demonstrates a “long tail” distribution. These findings indicate that the majority of bikes used for intra-urban human mobility are utilized five times or fewer. This information could be valuable for bike-sharing companies in optimizing maintenance schedules and resource allocation based on bike utilization.
To further evaluate the performance of bike-sharing systems for potential maintenance and improvement, we analyzed the total service duration for each bike and made statistics for the occurrences of each total service duration among all the bikes. The results are shown in Figure 20. According to Figure 20, we can conclude that bikes with a total service duration of approximately 10 min constitute the largest proportion among all the bikes. Additionally, a significant majority of bikes had a total service duration of around 60 min or less, reflecting the temporal patterns of human mobility within urban areas. To clearly illustrate the distribution of the total service durations and the percentages of occurrences among all the bikes, we compiled statistics comparing the total service durations (in 5 min intervals) and the corresponding cumulative frequency, as listed in Table 2. According to Table 2, more than 50% of the bikes had a total service duration of 15 min or less. Approximately 80% of the bikes had a total service duration within 30 min, around 90% within 45 min, and about 95% within 60 min. Only around 5% of the bikes had a total service duration exceeding 60 min, despite a relatively large number of occurrences for durations over 60 min. The temporal patterns of intra-urban human mobility, characterized by the total service durations of the bikes, provide potentially valuable insights for related departments or companies to enhance operational strategies of bike-sharing systems.

4. Discussion

In this case study, which analyzed bike-sharing trips in Shanghai, China, using the methods of exploratory data analysis (EDA) and the continuous triangular model (CTM), we present several interesting results that led to distinctive findings. We believe these findings represent a significant contribution to the existing research on bike-sharing data analysis.
This paper primarily focused on the temporal aspects of bike-sharing trip analysis, with particular attention to trip numbers and trip durations, as these are fundamental indicators of temporal patterns. We explored these aspects from various perspectives to conduct in-depth analyses. The main contributions of our research are twofold: First, some of the results align well with previous findings, validating the correctness of our study and reinforcing prior research. This alignment demonstrates the novelty and robustness of our analysis methods, which offer more perspectives and greater depth than previous studies. Second, this paper provides additional results not previously mentioned in the literature, leading to distinctive findings. While these findings may not be broad in scope, they are numerous and meaningful in depth. These detailed insights are valuable supplements to existing research, offering a more comprehensive understanding of the temporal patterns of intra-urban human mobility through bike-sharing systems. Together with previous findings, this research contributes to a more objective picture of urban mobility patterns.
In addition to contributions at the trip level, this research also offers specific insights at the bike level. Relatively few studies have focused on the bike level, making our findings in this area important supplements to existing research. Our study achieved particular insights into bikes utilization, providing useful information for bike-sharing companies. Given that previous research has reported fewer related results at this level, our findings are timely additions to existing research and are expected to play an important role in future research specifically targeting bikes. By considering the temporal patterns characterized in this paper, relevant departments can develop more scientific strategies and policies to optimize current bike-sharing systems, thereby providing more convenient services to users. For example, bike-sharing companies could deploy more bikes on days or weeks with larger trip numbers to meet potential demands. We believe the findings in this study can play a crucial role in guiding actions aimed at optimizing bike-sharing systems in the future.
The research presented in this paper does have certain limitations. Specifically, the dataset used in the study spans only one month. While the research findings demonstrate the effectiveness of the dataset, this short time frame may constrain the study’s ability to fully understand the seasonal impacts of bike-sharing on travel. The primary limitation is the lack of comprehensive seasonal coverage, as a single month reflects only the specific conditions of that period, which may not accurately represent other seasons. This limited temporal scope prevents the observation of crucial variations in weather, daylight hours, and other seasonal factors. As a result, the study cannot identify long-term trends or cyclic patterns, such as the potential increase in bike usage during summer or decrease during winter. To address these limitations and gain a more robust understanding of the seasonal effects on bike-sharing, future research should consider using datasets that cover longer periods, such as an entire season or multiple seasons. This would allow for the characterization of related temporal patterns on a seasonal scale, providing a more comprehensive view of how different seasons impact bike-sharing behavior.

5. Conclusions

Human mobility is an important research focus in many disciplines, including geographical information science. This paper mainly concentrates on intra-urban human mobility. Given that a large proportion of intra-urban trips are relatively short, bike-sharing data serve as an excellent way to characterize these mobility patterns. Accordingly, this study aimed to characterize the temporal patterns of intra-urban human mobility by analyzing bike-sharing trips using either an exploratory data analysis (EDA) or the continuous triangular model (CTM). A case study was conducted using the bike-sharing trip data in Shanghai, China. The study explored temporal patterns at two levels: the trip level and the bike level. At each level, we examined and characterized the temporal patterns of intra-urban human mobility across various scales, such as per hour, per day, per week, and considering both origin and destination.
The study identified several key temporal patterns in intra-urban human mobility through bike-sharing systems. Most trips are short, with durations typically under 50 min and peaking between 6 and 8 min. The analysis revealed distinct daily patterns, such as shorter trips during morning peaks and longer trips in the evening, with a tendency for trips to be longer during non-working hours, early mornings, and late evenings, when public transport options are limited. Usage patterns showed that the majority of bikes are utilized fewer than five times within the study period. Additionally, periodic behaviors in bike usage were observed, reflecting the rhythms of daily and weekly life. These findings suggest that bike-sharing systems are primarily used for short, frequent trips and that user behavior varies significantly depending on the time of day and availability of alternative transportation. These findings can provide valuable suggestions and insights to governmental departments and bike-sharing companies, assisting in traffic management, policy-making, and strategy adjustments to improve environmental conditions and public health.
Given the importance of bike-sharing systems under the national strategy of “carbon neutrality” in China, the analysis of bike-sharing data is becoming increasingly important. While this paper offers a detailed analysis of trip numbers and trip durations from various perspectives, it primarily focuses on the temporal dimension. Due to space limitations and specific research objectives, a detailed analysis of trips on the spatial dimension (such as trip distances and trip coverages) was not included in this study. This will be the focus of our future work, where we anticipate uncovering novel findings.

Author Contributions

Conceptualization, P.Z. and M.L.; data curation, J.X.; formal analysis, P.Z., M.L. and J.X.; funding acquisition, P.Z.; investigation, P.Z.; methodology, P.Z., M.L. and J.X.; software, Z.Z. and R.C.; validation, P.Z.; visualization, R.C. and Z.Z.; writing—original draft, P.Z.; writing—review and editing, P.Z., M.L. and J.X. All authors have read and agreed to the published version of the manuscript.

Funding

This research was supported by grants from the Introduction Program of High-Level Innovation and Entrepreneurship Talents in Jiangsu Province (Grant No. CZ032SC20025), the NUPTSF (Grant No. NY219140), and the Smart Health Big Data Analysis and Location Services Engineering Lab of Jiangsu Province (Grant No. SHEL221004).

Institutional Review Board Statement

Not applicable.

Informed Consent Statement

Not applicable.

Data Availability Statement

The original data presented in the study are openly available in FigShare at https://doi.org/10.6084/m9.figshare.25975015.v1.

Acknowledgments

The authors would like to thank the anonymous reviewers for their valuable comments and suggestions to improve the manuscript.

Conflicts of Interest

The authors declare no competing interests.

References

  1. Li, W.; Wang, S.; Zhang, X.; Jia, Q.; Tian, Y. Understanding intra-urban human mobility through an exploratory spatiotemporal analysis of bike-sharing trajectories. Int. J. Geogr. Inf. Sci. 2020, 34, 2451–2474. [Google Scholar] [CrossRef]
  2. Tizzoni, M.; Bajardi, P.; Decuyper, A.; Kon Kam King, G.; Schneider, C.M.; Blondel, V.; Smoreda, Z.; Gonzalez, M.C.; Colizza, V. On the use of human mobility proxies for modeling epidemics. PLoS Comput. Biol. 2014, 10, e1003716. [Google Scholar] [CrossRef] [PubMed]
  3. Gao, F.; Li, S.; Tan, Z.; Liao, S. Visualizing the Spatiotemporal Characteristics of Dockless Bike Sharing Usage in Shenzhen, China. J. Geovis. Spat. Anal. 2022, 6, 12. [Google Scholar] [CrossRef]
  4. Xin, R.; Ai, T.; Ding, L.; Zhu, R.; Meng, L. Impact of the COVID-19 pandemic on urban human mobility—A multiscale geospatial network analysis using New York bike-sharing data. Cities 2022, 126, 103677. [Google Scholar] [CrossRef]
  5. Siła-Nowicka, K.; Vandrol, J.; Oshan, T.; Long, J.A.; Demšar, U.; Fotheringham, A.S. Analysis of human mobility patterns from GPS trajectories and contextual information. Int. J. Geogr. Inf. Sci. 2016, 30, 881–906. [Google Scholar] [CrossRef]
  6. Barbosa, H.; Barthelemy, M.; Ghoshal, G.; James, C.R.; Lenormand, M.; Louail, T.; Menezes, R.; Ramasco, J.J.; Simini, F.; Tomasini, M. Human mobility: Models and applications. Phys. Rep. 2018, 734, 1–74. [Google Scholar] [CrossRef]
  7. Zhang, P.; Miao, L.; Wang, F.; Li, X. Discovering Geographical Flock Patterns of CO2 Emissions in China Using Trajectory Mining Techniques. Int. J. Environ. Res. Public Health 2023, 20, 4265. [Google Scholar] [CrossRef]
  8. Li, Y.; Dai, Z.; Zhu, L.; Liu, X. Analysis of Spatial and Temporal Characteristics of Citizens’ Mobility Based on E-Bike GPS Trajectory Data in Tengzhou City, China. Sustainability 2019, 11, 5003. [Google Scholar] [CrossRef]
  9. Hatzopoulou, M.; Weichenthal, S.; Dugum, H.; Pickett, G.; Miranda-Moreno, L.; Kulka, R.; Andersen, R.; Goldberg, M. The impact of traffic volume, composition, and road geometry on personal air pollution exposures among cyclists in Montreal, Canada. J. Expo. Sci. Environ. Epidemiol. 2013, 23, 46–51. [Google Scholar] [CrossRef]
  10. Shaheen, S.; Martin, E.; Cohen, A. Public bikesharing and modal shift behavior: A comparative study of early bikesharing systems in North America. Int. J. Transp. 2013, 1, 35–54. [Google Scholar] [CrossRef]
  11. Du, Y.; Deng, F.; Liao, F. A model framework for discovering the spatio-temporal usage patterns of public free-floating bike-sharing system. Transp. Res. Part C Emerg. Technol. 2019, 103, 39–55. [Google Scholar] [CrossRef]
  12. Liu, Z.; Jia, X.; Cheng, W. Solving the Last Mile Problem: Ensure the Success of Public Bicycle System in Beijing. Procedia—Soc. Behav. Sci. 2012, 43, 73–78. [Google Scholar] [CrossRef]
  13. Lathia, N.; Ahmed, S.; Capra, L. Measuring the impact of opening the London shared bicycle scheme to casual users. Transp. Res. Part C Emerg. Technol. 2012, 22, 88–102. [Google Scholar] [CrossRef]
  14. Apparicio, P.; Carrier, M.; Gelb, J.; Séguin, A.-M.; Kingham, S. Cyclists’ exposure to air pollution and road traffic noise in central city neighbourhoods of Montreal. J. Transp. Geogr. 2016, 57, 63–69. [Google Scholar] [CrossRef]
  15. Gao, F.; Li, S.; Tan, Z.; Wu, Z.; Zhang, X.; Huang, G.; Huang, Z. Understanding the modifiable areal unit problem in dockless bike sharing usage and exploring the interactive effects of built environment factors. Int. J. Geogr. Inf. Sci. 2021, 35, 1905–1925. [Google Scholar] [CrossRef]
  16. Gao, F.; Li, S.; Tan, Z.; Zhang, X.; Lai, Z.; Tan, Z. How Is Urban Greenness Spatially Associated with Dockless Bike Sharing Usage on Weekdays, Weekends, and Holidays? ISPRS Int. J. Geo-Inf. 2021, 10, 238. [Google Scholar] [CrossRef]
  17. Zhang, Y.; Thomas, T.; Brussel, M.; van Maarseveen, M. Exploring the impact of built environment factors on the use of public bikes at bike stations: Case study in Zhongshan, China. J. Transp. Geogr. 2017, 58, 59–70. [Google Scholar] [CrossRef]
  18. Shen, Y.; Zhang, X.; Zhao, J. Understanding the usage of dockless bike sharing in Singapore. Int. J. Sustain. Transp. 2018, 12, 686–700. [Google Scholar] [CrossRef]
  19. Xu, Y.; Chen, D.; Zhang, X.; Tu, W.; Chen, Y.; Shen, Y.; Ratti, C. Unravel the landscape and pulses of cycling activities from a dockless bike-sharing system. Comput. Environ. Urban Syst. 2019, 75, 184–203. [Google Scholar] [CrossRef]
  20. Gudes, O.; Varhol, R.; Sun, Q.; Meuleners, L. Investigating articulated heavy-vehicle crashes in Western Australia using a spatial approach. Accid. Anal. Prev. 2017, 106, 243–253. [Google Scholar] [CrossRef]
  21. Guo, Y.; Zhou, J.; Wu, Y.; Li, Z. Identifying the factors affecting bike-sharing usage and degree of satisfaction in Ningbo, China. PLoS ONE 2017, 12, e0185100. [Google Scholar] [CrossRef] [PubMed]
  22. Chang, X.; Shen, J.; Lu, X.; Huang, S. Statistical patterns of human mobility in emerging Bicycle Sharing Systems. PLoS ONE 2018, 13, e0193795. [Google Scholar] [CrossRef] [PubMed]
  23. Li, X.; Zhang, Y.; Sun, L.; Liu, Q. Free-Floating Bike Sharing in Jiangsu: Users’ Behaviors and Influencing Factors. Energies 2018, 11, 1664. [Google Scholar] [CrossRef]
  24. Ai, Y.; Li, Z.; Gan, M. A solution to measure traveler’s transfer tolerance for walking mode and dockless bike-sharing mode. J. Supercomput. 2019, 75, 3140–3157. [Google Scholar] [CrossRef]
  25. Zheng, L.; Xia, D.; Zhao, X.; Tan, L.; Li, H.; Chen, L.; Liu, W. Spatial–temporal travel pattern mining using massive taxi trajectory data. Phys. A Stat. Mech. Appl. 2018, 501, 24–41. [Google Scholar] [CrossRef]
  26. Zhang, X.; Li, W.; Zhang, F.; Liu, R.; Du, Z. Identifying Urban Functional Zones Using Public Bicycle Rental Records and Point-of-Interest Data. ISPRS Int. J. Geo-Inf. 2018, 7, 459. [Google Scholar] [CrossRef]
  27. Wang, J.; Biljecki, F. Unsupervised machine learning in urban studies: A systematic review of applications. Cities 2022, 129, 103925. [Google Scholar] [CrossRef]
  28. Xu, N.; Luo, J.; Wu, T.; Dong, W.; Liu, W.; Zhou, N. Identification and portrait of urban functional zones based on multisource heterogeneous data and ensemble learning. Remote Sens. 2021, 13, 373. [Google Scholar] [CrossRef]
  29. Piter, A.; Otto, P.; Alkhatib, H. The Helsinki Bike-Sharing System—Insights Gained from a Spatiotemporal Functional Model. J. R. Stat. Soc. Ser. A Stat. Soc. 2022, 185, 1294–1318. [Google Scholar] [CrossRef]
  30. Hsieh, H.-P.; Lin, F.; Jiang, J.; Kuo, T.-Y.; Chang, Y.-E. Inferring Long-Term Demand of Newly Established Stations for Expansion Areas in Bike Sharing System. Appl. Sci. 2021, 11, 6748. [Google Scholar] [CrossRef]
  31. Frade, I.; Ribeiro, A. Bike-sharing stations: A maximal covering location approach. Transp. Res. Part A Policy Pract. 2015, 82, 216–227. [Google Scholar] [CrossRef]
  32. Haider, Z.; Nikolaev, A.; Kang, J.E.; Kwon, C. Inventory rebalancing through pricing in public bike sharing systems. Eur. J. Oper. Res. 2018, 270, 103–117. [Google Scholar] [CrossRef]
  33. Caggiani, L.; Camporeale, R.; Hamidi, Z.; Zhao, C. Evaluating the Efficiency of Bike-Sharing Stations with Data Envelopment Analysis. Sustainability 2021, 13, 881. [Google Scholar] [CrossRef]
  34. Lu, C.-C. Robust Multi-period Fleet Allocation Models for Bike-Sharing Systems. Netw. Spat. Econ. 2016, 16, 61–82. [Google Scholar] [CrossRef]
  35. Xie, N.; Li, Z.; Liu, Z.; Tan, S. A censored semi-bandit model for resource allocation in bike sharing systems. Expert Syst. Appl. 2023, 216, 119447. [Google Scholar] [CrossRef]
  36. Aifadopoulou, G.; Tsaples, G.; Salanova Grau, J.M.; Mallidis, I.; Sariannidis, N. Management of resource allocation on vehicle-sharing schemes: The case of Thessaloniki’s bike-sharing system. Oper. Res. 2022, 22, 1001–1016. [Google Scholar] [CrossRef]
  37. Duran-Rodas, D.; Villeneuve, D.; Pereira, F.C.; Wulfhorst, G. How fair is the allocation of bike-sharing infrastructure? Framework for a qualitative and quantitative spatial fairness assessment. Transp. Res. Part A Policy Pract. 2020, 140, 299–319. [Google Scholar] [CrossRef]
  38. He, T.; Bao, J.; Ruan, S.; Li, R.; Li, Y.; He, H.; Zheng, Y. Interactive bike lane planning using sharing bikes’ trajectories. IEEE Trans. Knowl. Data Eng. 2019, 32, 1529–1542. [Google Scholar] [CrossRef]
  39. Saelens, B.E.; Sallis, J.F.; Frank, L.D. Environmental correlates of walking and cycling: Findings from the transportation, urban design, and planning literatures. Ann. Behav. Med. 2003, 25, 80–91. [Google Scholar] [CrossRef]
  40. Nath, R.B.; Rambha, T. Modelling Methods for Planning and Operation of Bike-Sharing Systems. J. Indian Inst. Sci. 2019, 99, 621–645. [Google Scholar] [CrossRef]
  41. Karpinski, E. Estimating the effect of protected bike lanes on bike-share ridership in Boston: A case study on Commonwealth Avenue. Case Stud. Transp. Policy 2021, 9, 1313–1323. [Google Scholar] [CrossRef]
  42. Faghih-Imani, A.; Eluru, N.; El-Geneidy, A.M.; Rabbat, M.; Haq, U. How land-use and urban form impact bicycle flows: Evidence from the bicycle-sharing system (BIXI) in Montreal. J. Transp. Geogr. 2014, 41, 306–314. [Google Scholar] [CrossRef]
  43. Ashqar, H.I.; Elhenawy, M.; Almannaa, M.H.; Ghanem, A.; Rakha, H.A.; House, L. Modeling bike availability in a bike-sharing system using machine learning. In Proceedings of the 2017 5th IEEE International Conference on Models and Technologies for Intelligent Transportation Systems (MT-ITS), Naples, Italy, 26–28 June 2017; pp. 374–378. [Google Scholar]
  44. Ashqar, H.I.; Elhenawy, M.; Rakha, H.A.; Almannaa, M.; House, L. Network and station-level bike-sharing system prediction: A San Francisco bay area case study. J. Intell. Transp. Syst. 2022, 26, 602–612. [Google Scholar] [CrossRef]
  45. Morgenthaler, S. Exploratory data analysis. Wiley Interdiscip. Rev. Comput. Stat. 2009, 1, 33–44. [Google Scholar] [CrossRef]
  46. Kulpa, Z. Diagrammatic Representation of Interval Space in Proving Theorems about Interval Relations. Reliab. Comput. 1997, 3, 209–217. [Google Scholar] [CrossRef]
  47. Qiang, Y.; Chavoshi, S.H.; Logghe, S.; De Maeyer, P.; Van de Weghe, N. Multi-scale analysis of linear data in a two-dimensional space. Inf. Vis. 2013, 13, 248–265. [Google Scholar] [CrossRef]
  48. Zhang, P.; Beernaerts, J.; Zhang, L.; Van de Weghe, N. Visual exploration of match performance based on football movement data using the Continuous Triangular Model. Appl. Geogr. 2016, 76, 1–13. [Google Scholar] [CrossRef]
  49. Zhang, P.; Beernaerts, J.; Van de Weghe, N. A Hybrid Approach Combining the Multi-Temporal Scale Spatio-Temporal Network with the Continuous Triangular Model for Exploring Dynamic Interactions in Movement Data: A Case Study of Football. ISPRS Int. J. Geo-Inf. 2018, 7, 31. [Google Scholar] [CrossRef]
Figure 1. The study area in Shanghai.
Applsci 14 08583 g001
Figure 4. The distribution of trip numbers on the daily and weekly scales.
Applsci 14 08583 g004
Figure 5. The distribution of trip numbers under four different statistical measures: (a) maximum, (b) average, (c) median, and (d) minimum.
Applsci 14 08583 g005aApplsci 14 08583 g005b
Figure 6. The distribution of hourly trip numbers.
Applsci 14 08583 g006
Figure 7. The distribution of hourly trip numbers each day: (a) origin and (b) destination.
Applsci 14 08583 g007
Figure 8. The CTM diagrams of trip numbers on 15 August: (a) origin and (b) destination.
Applsci 14 08583 g008
Figure 9. The CTM diagram with the largest trip numbers during all time intervals: (a) origin and (b) destination.
Applsci 14 08583 g009
Figure 10. The scatter plot of all trip durations.
Applsci 14 08583 g010
Figure 11. The distribution of trip durations and corresponding trip numbers.
Applsci 14 08583 g011
Figure 12. The histogram of all the 5 min time intervals and their corresponding frequencies.
Applsci 14 08583 g012
Figure 13. The histogram of the 5 min time intervals and their corresponding cumulative frequencies.
Applsci 14 08583 g013
Figure 14. The distribution of trip duration and corresponding trip numbers for each hour: (a) origin and (b) destination.
Applsci 14 08583 g014
Figure 15. The distribution of average trip duration during each hour for each day: (a) origin and (b) destination.
Applsci 14 08583 g015
Figure 16. The CTM diagrams of average trip durations on 1 August: (a) origin and (b) destination.
Applsci 14 08583 g016
Figure 17. The CTM diagrams of the days with the longest average trip durations in August: (a) origin and (b) destination.
Applsci 14 08583 g017
Figure 18. The scatter plot of each bike and its corresponding number of utilizations.
Applsci 14 08583 g018
Figure 19. The histogram between the number of utilizations and the number of occurrences for all the bikes.
Applsci 14 08583 g019
Figure 20. The histogram between the total service durations and the number of occurrences among all the bikes.
Applsci 14 08583 g020
Table 1. The detailed information of the number of utilizations, the number of occurrences, the frequency of each number, and the cumulative frequency of each number for all the bikes.
Number of UtilizationsNumber of OccurrencesFrequencyCumulative Frequency
154,5110.795300.79530
210,5710.154230.94953
324820.036210.98575
46540.009540.99529
52330.003400.99869
6590.000860.99955
7240.000350.99990
850.000070.99997
910.000010.99999
1110.000011.00000
Table 2. The detailed information of the total service duration (every 5 min) and its corresponding cumulative frequency for all the bikes.
Total Service DurationCumulative FrequencyTotal Service DurationCumulative Frequency
50.10279650.95684
100.35604700.96355
150.53616750.96943
200.65858800.97386
250.74477850.97743
300.81089900.98105
350.85083950.98379
400.879821000.98612
450.901831050.98812
500.919931100.98969
550.935561150.99100
600.948881200.99219
Disclaimer/Publisher’s Note: The statements, opinions and data contained in all publications are solely those of the individual author(s) and contributor(s) and not of MDPI and/or the editor(s). MDPI and/or the editor(s) disclaim responsibility for any injury to people or property resulting from any ideas, methods, instructions or products referred to in the content.

