
Research on Pupil Center Localization Detection Algorithm with Improved YOLOv8

Abstract
1. Introduction
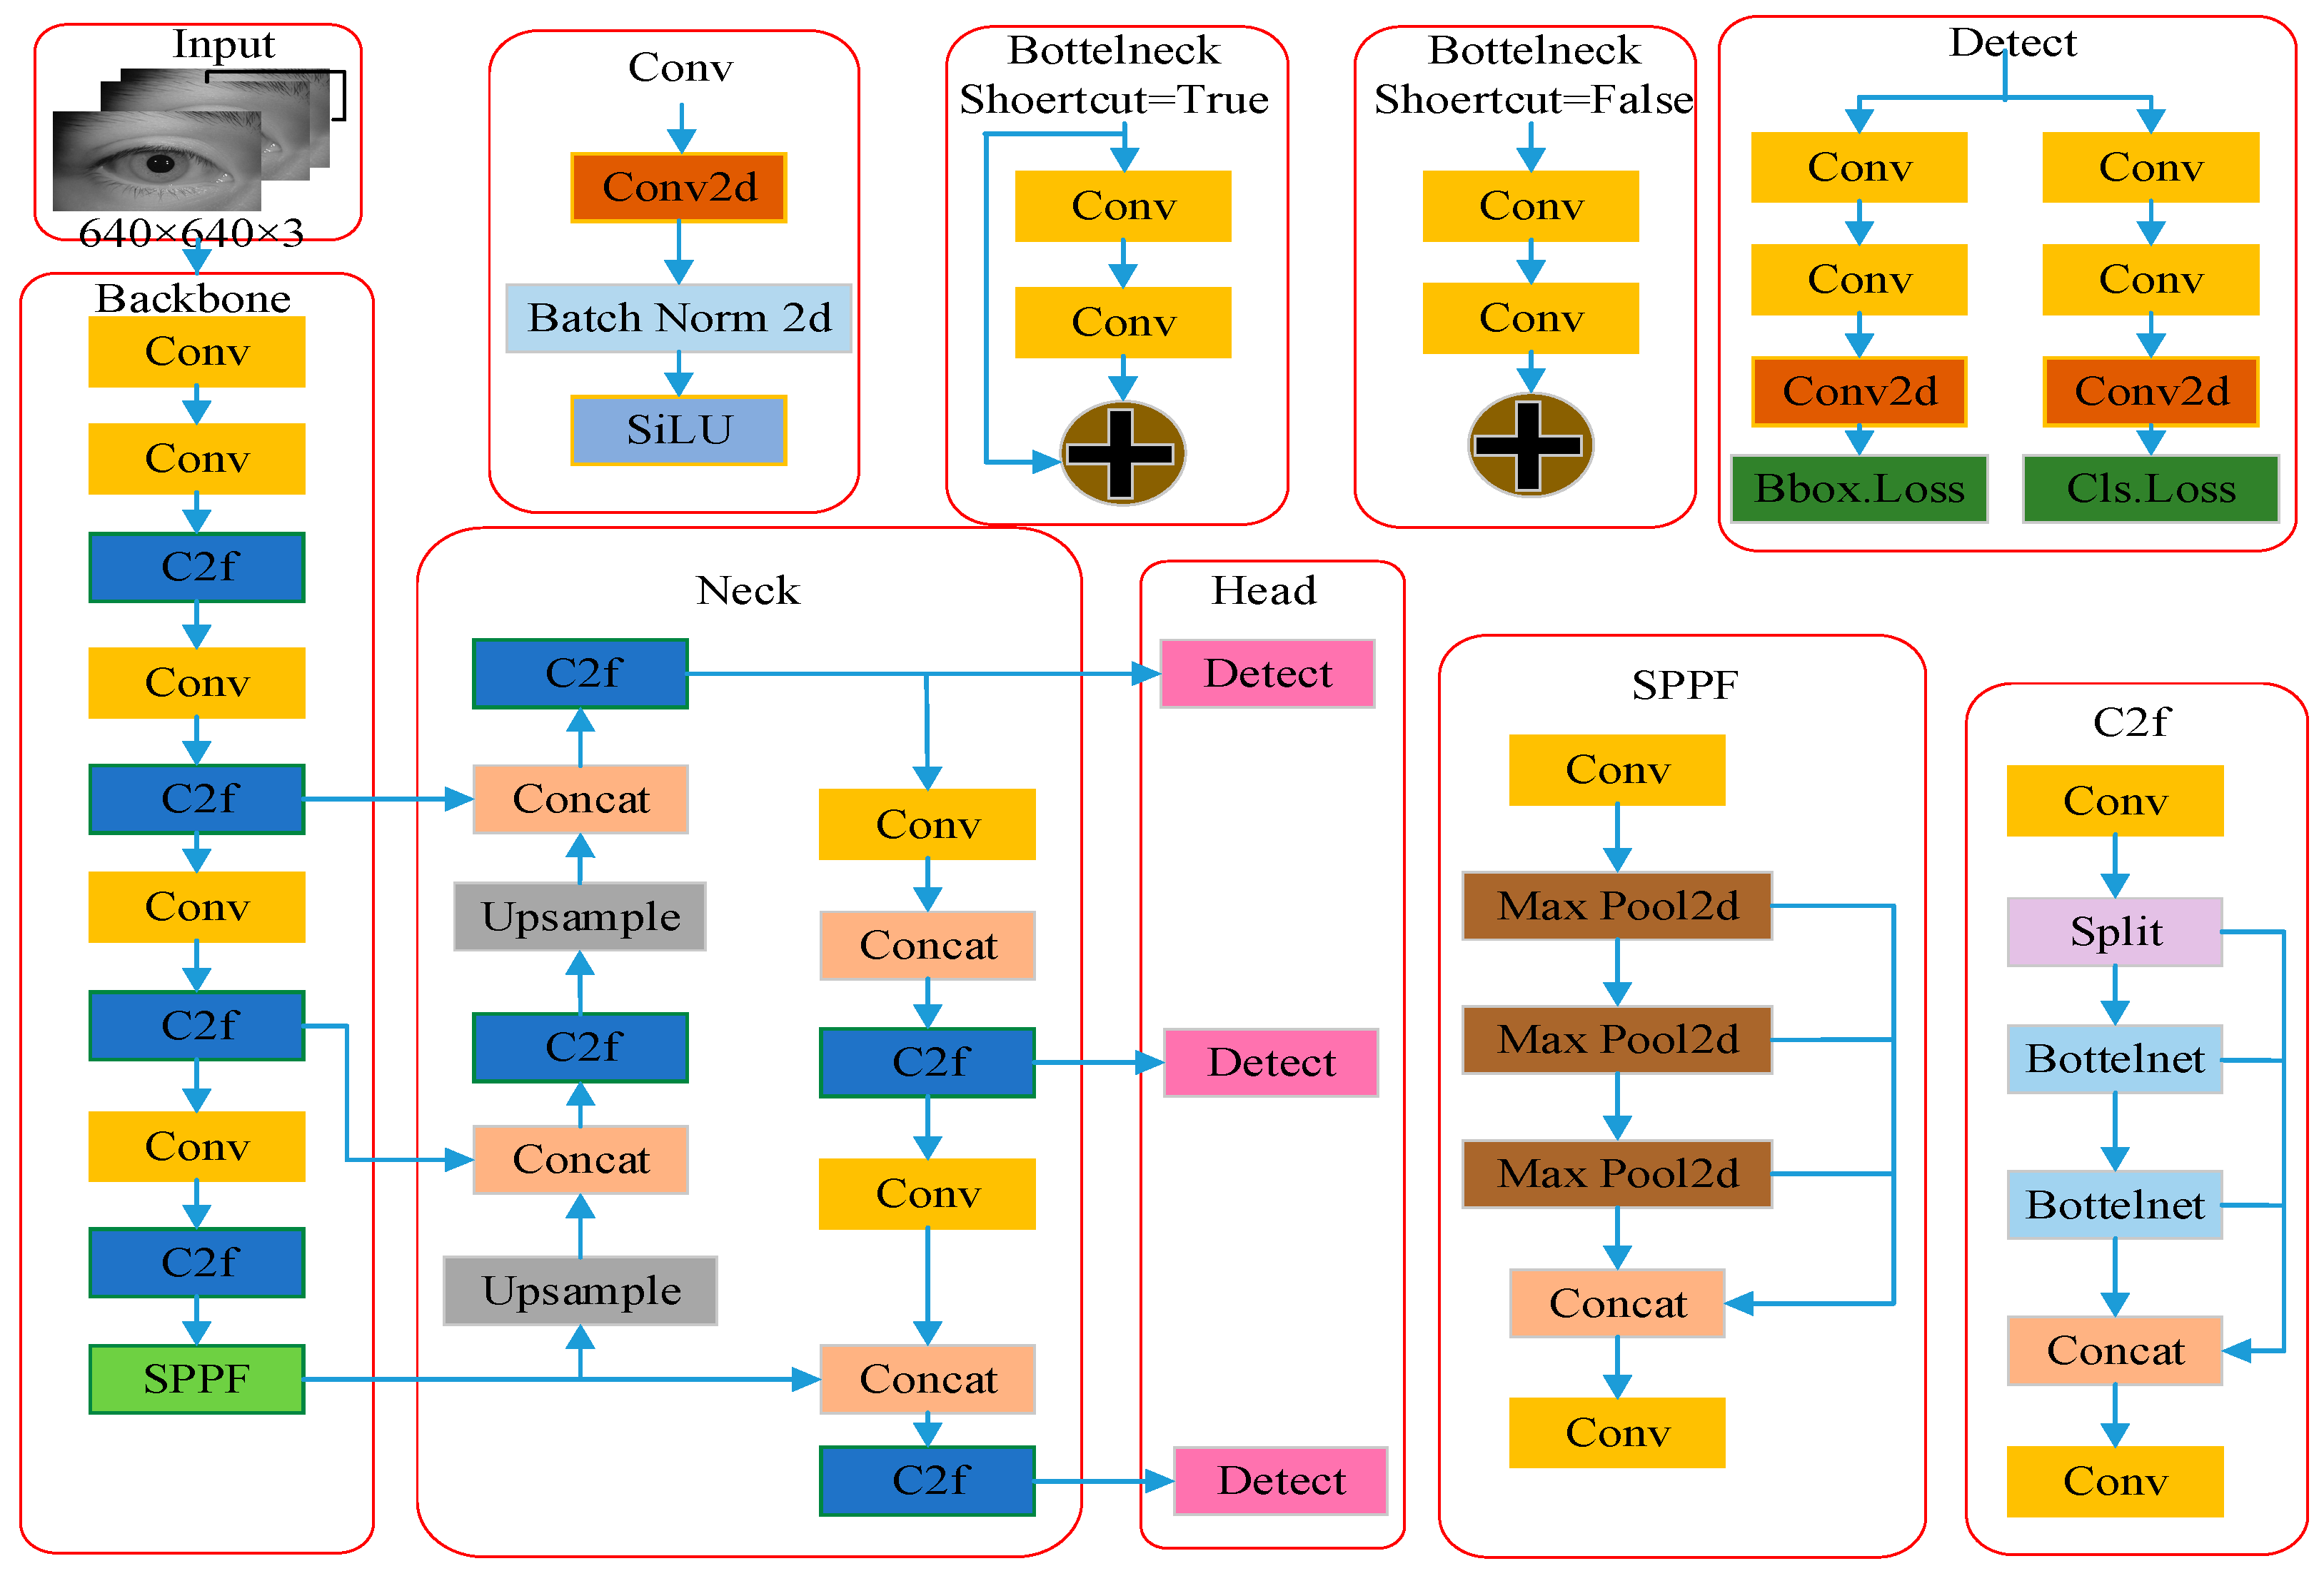
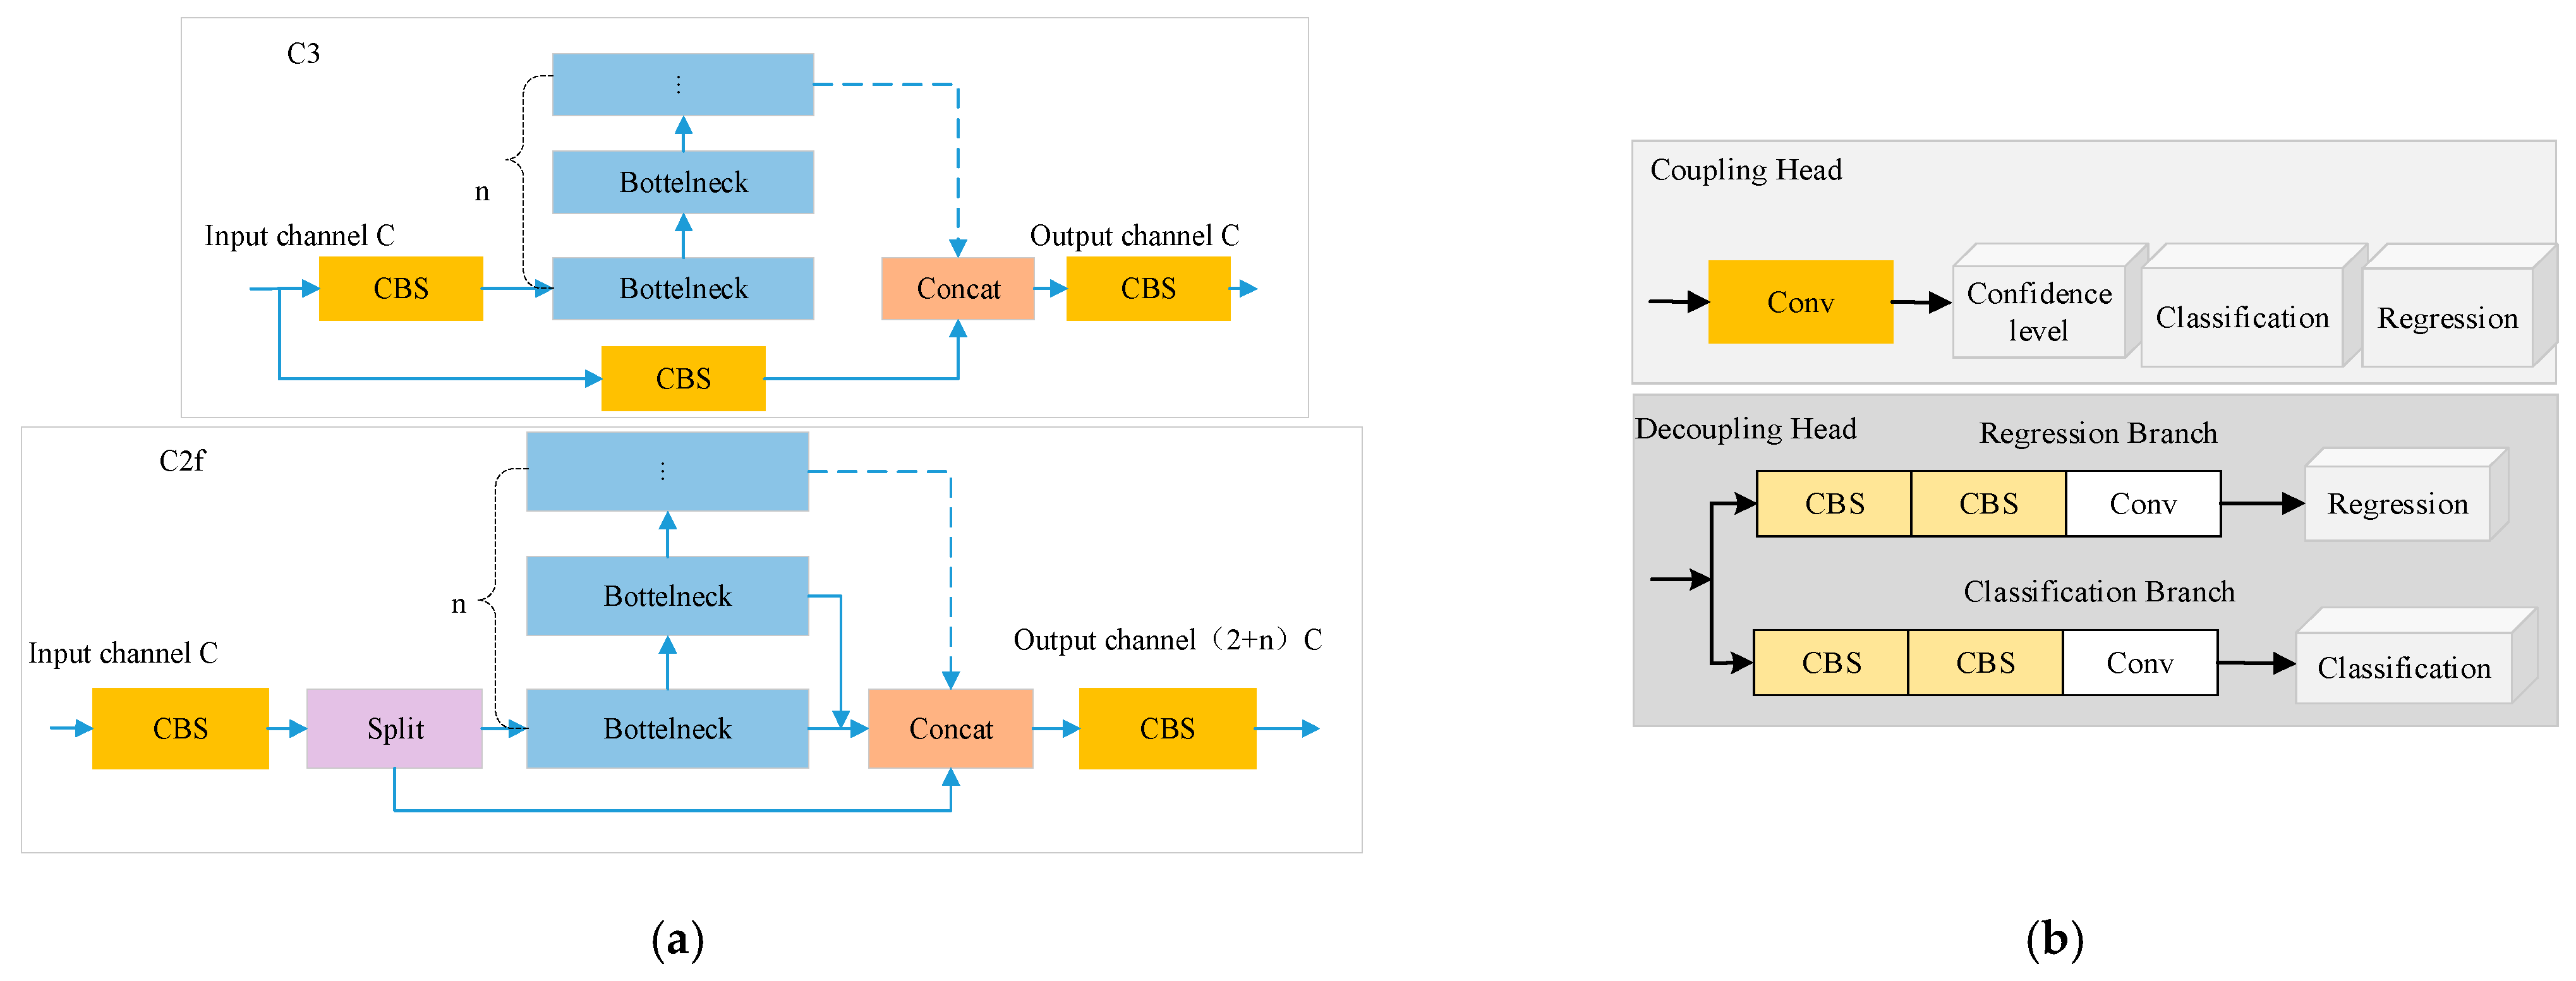
2. YOLOv8 Model
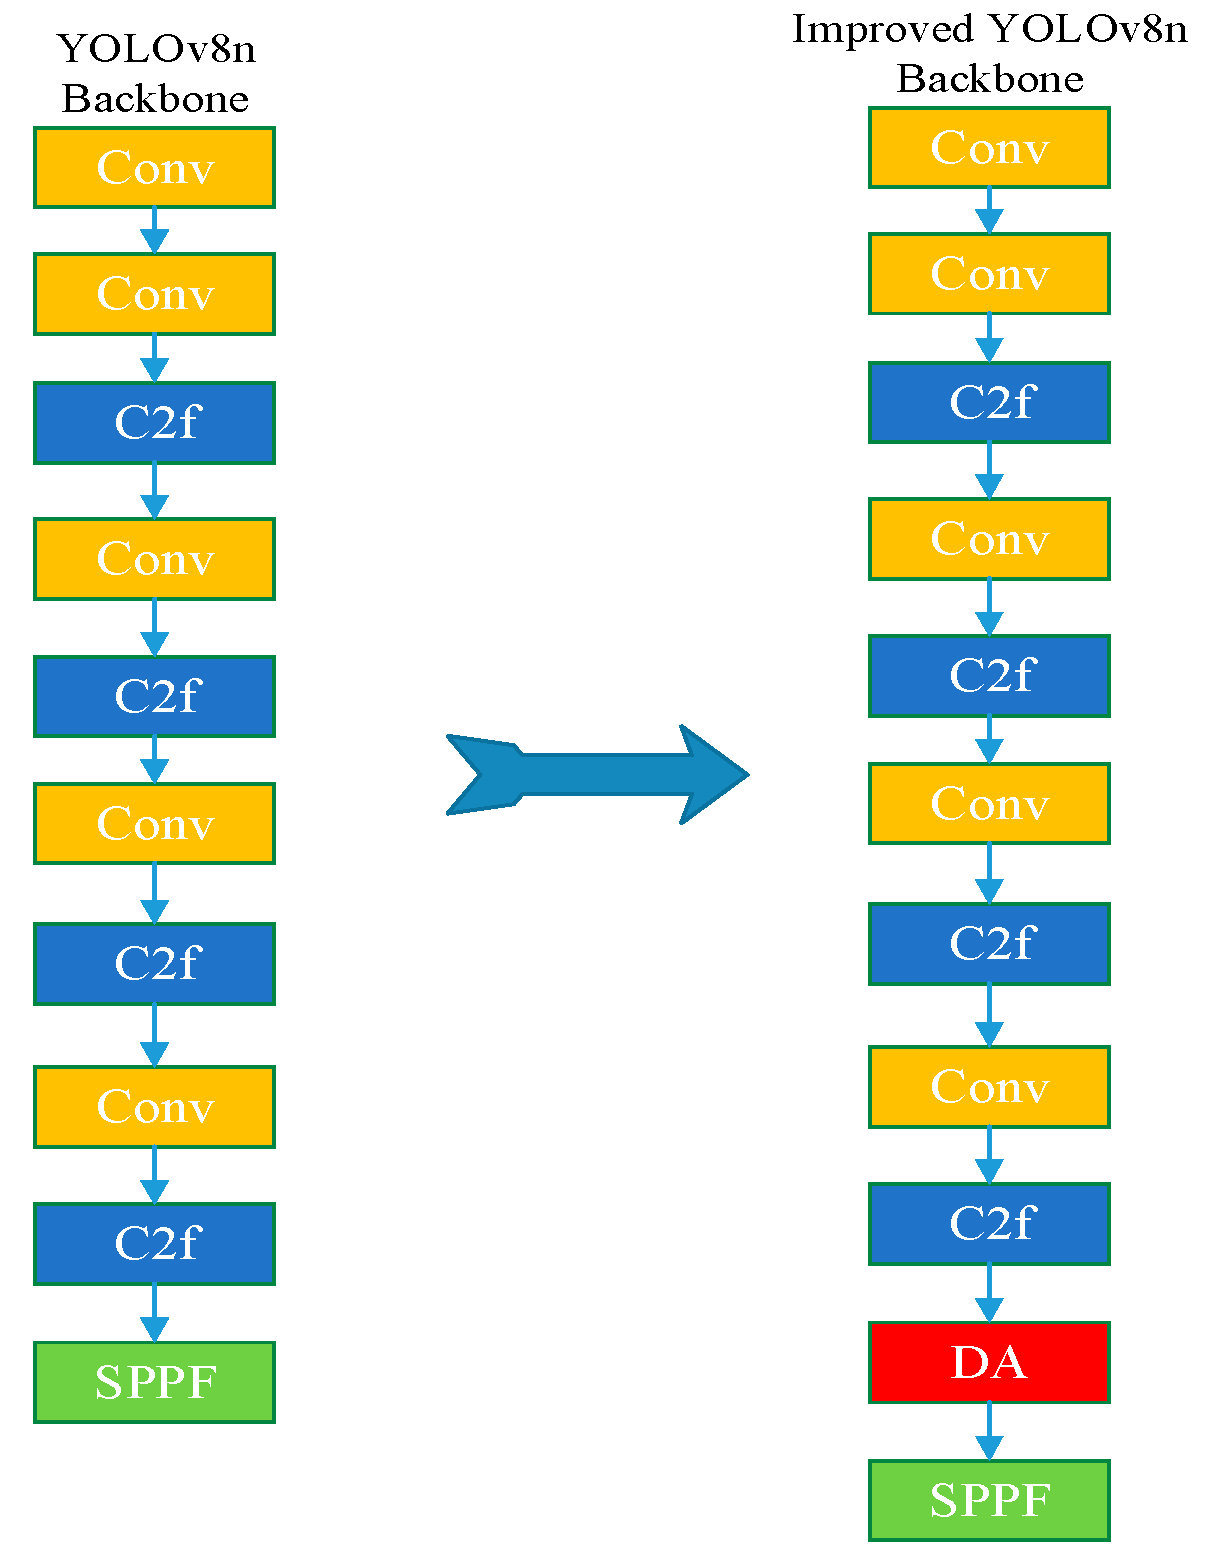
3. YOLOv8n Model Improvement
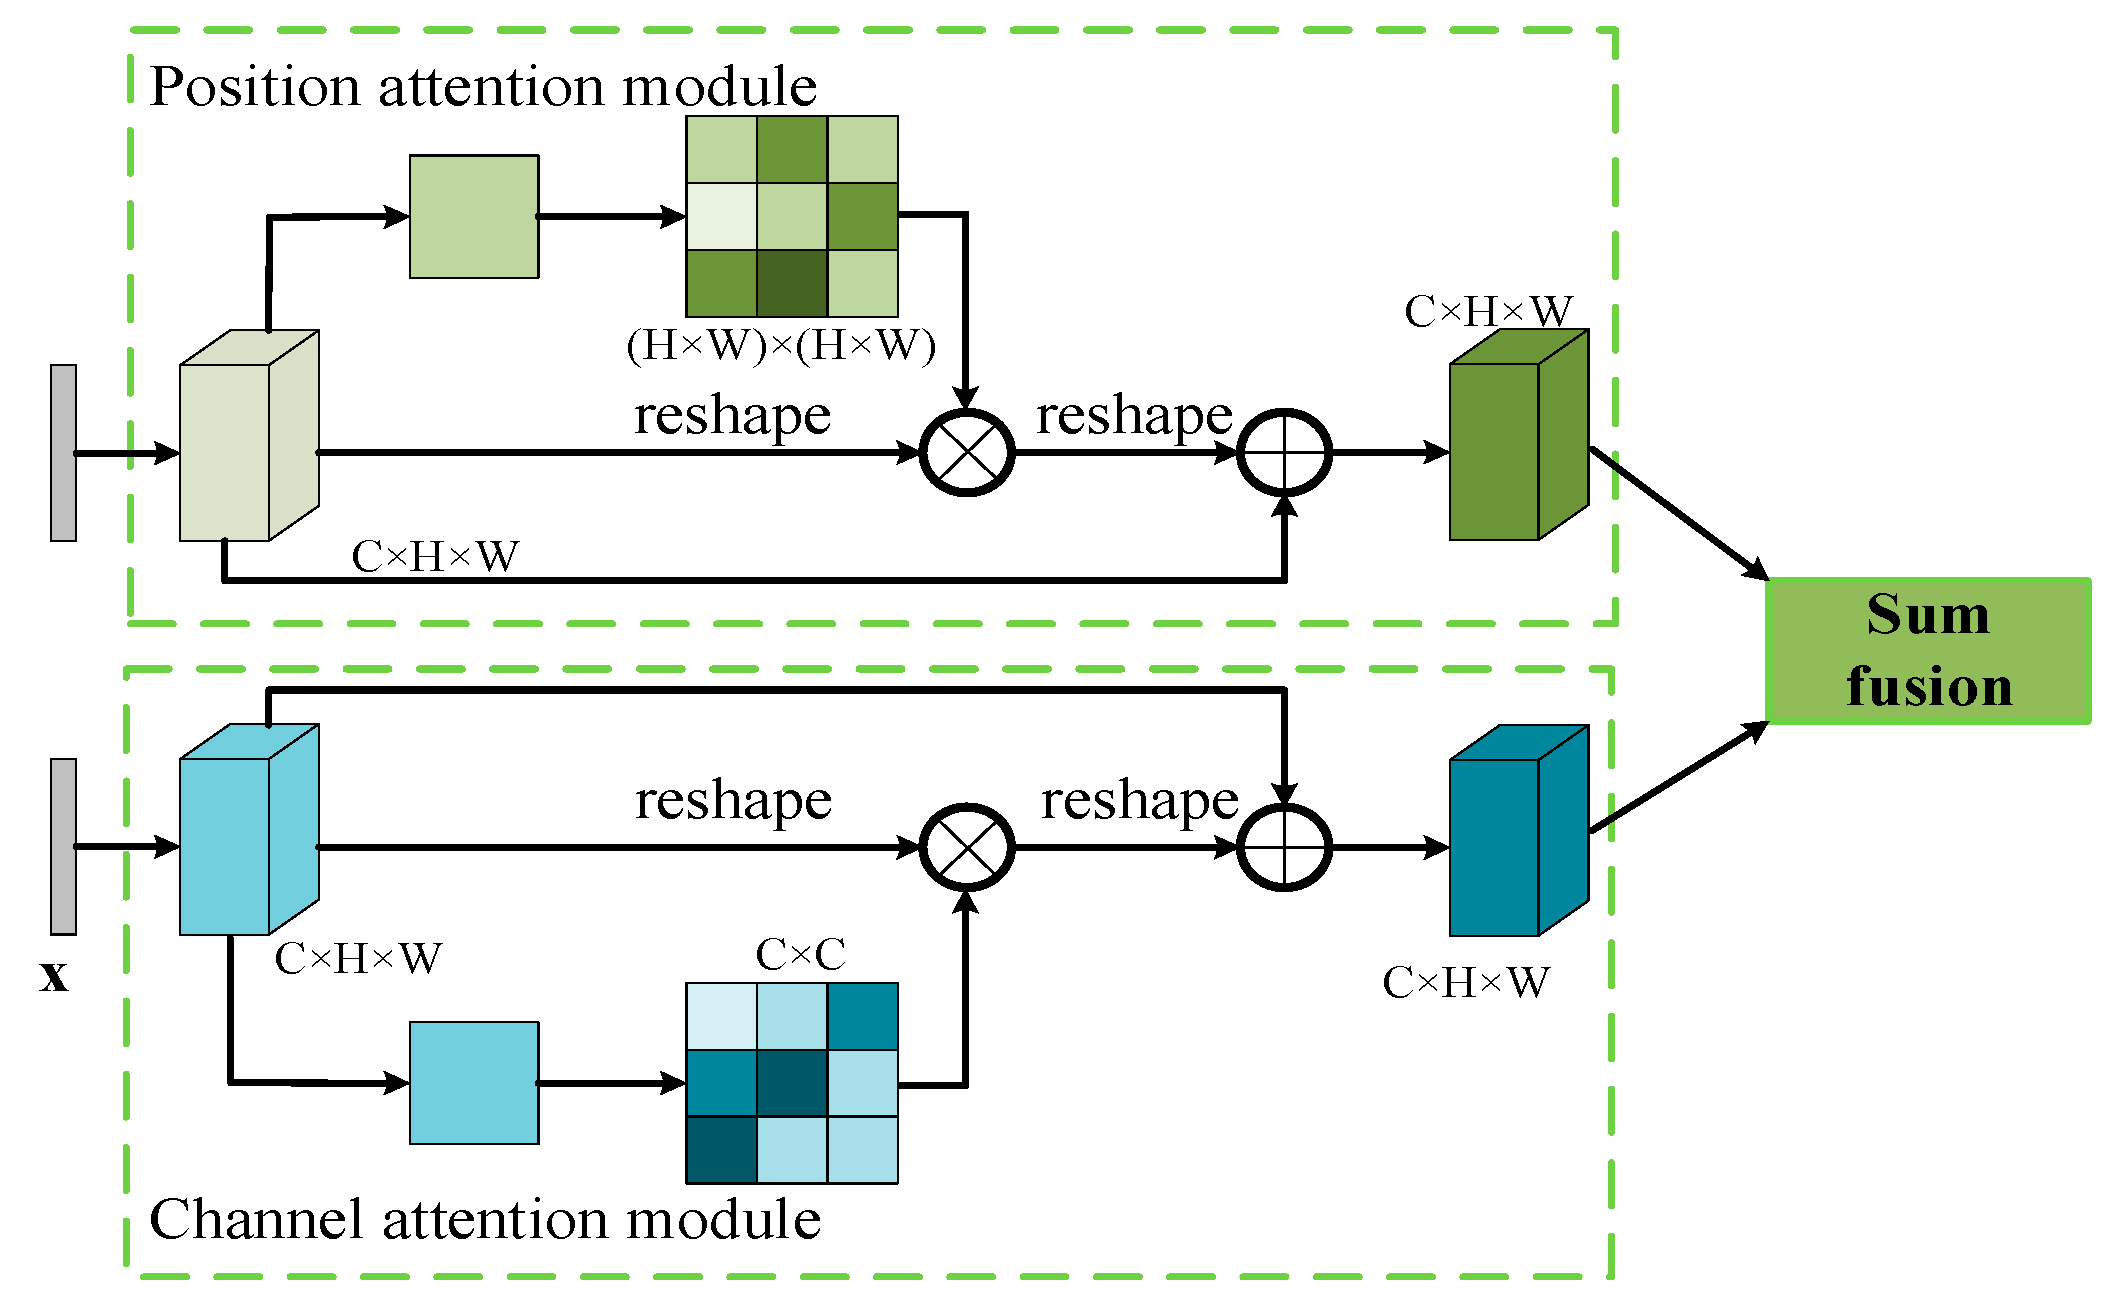
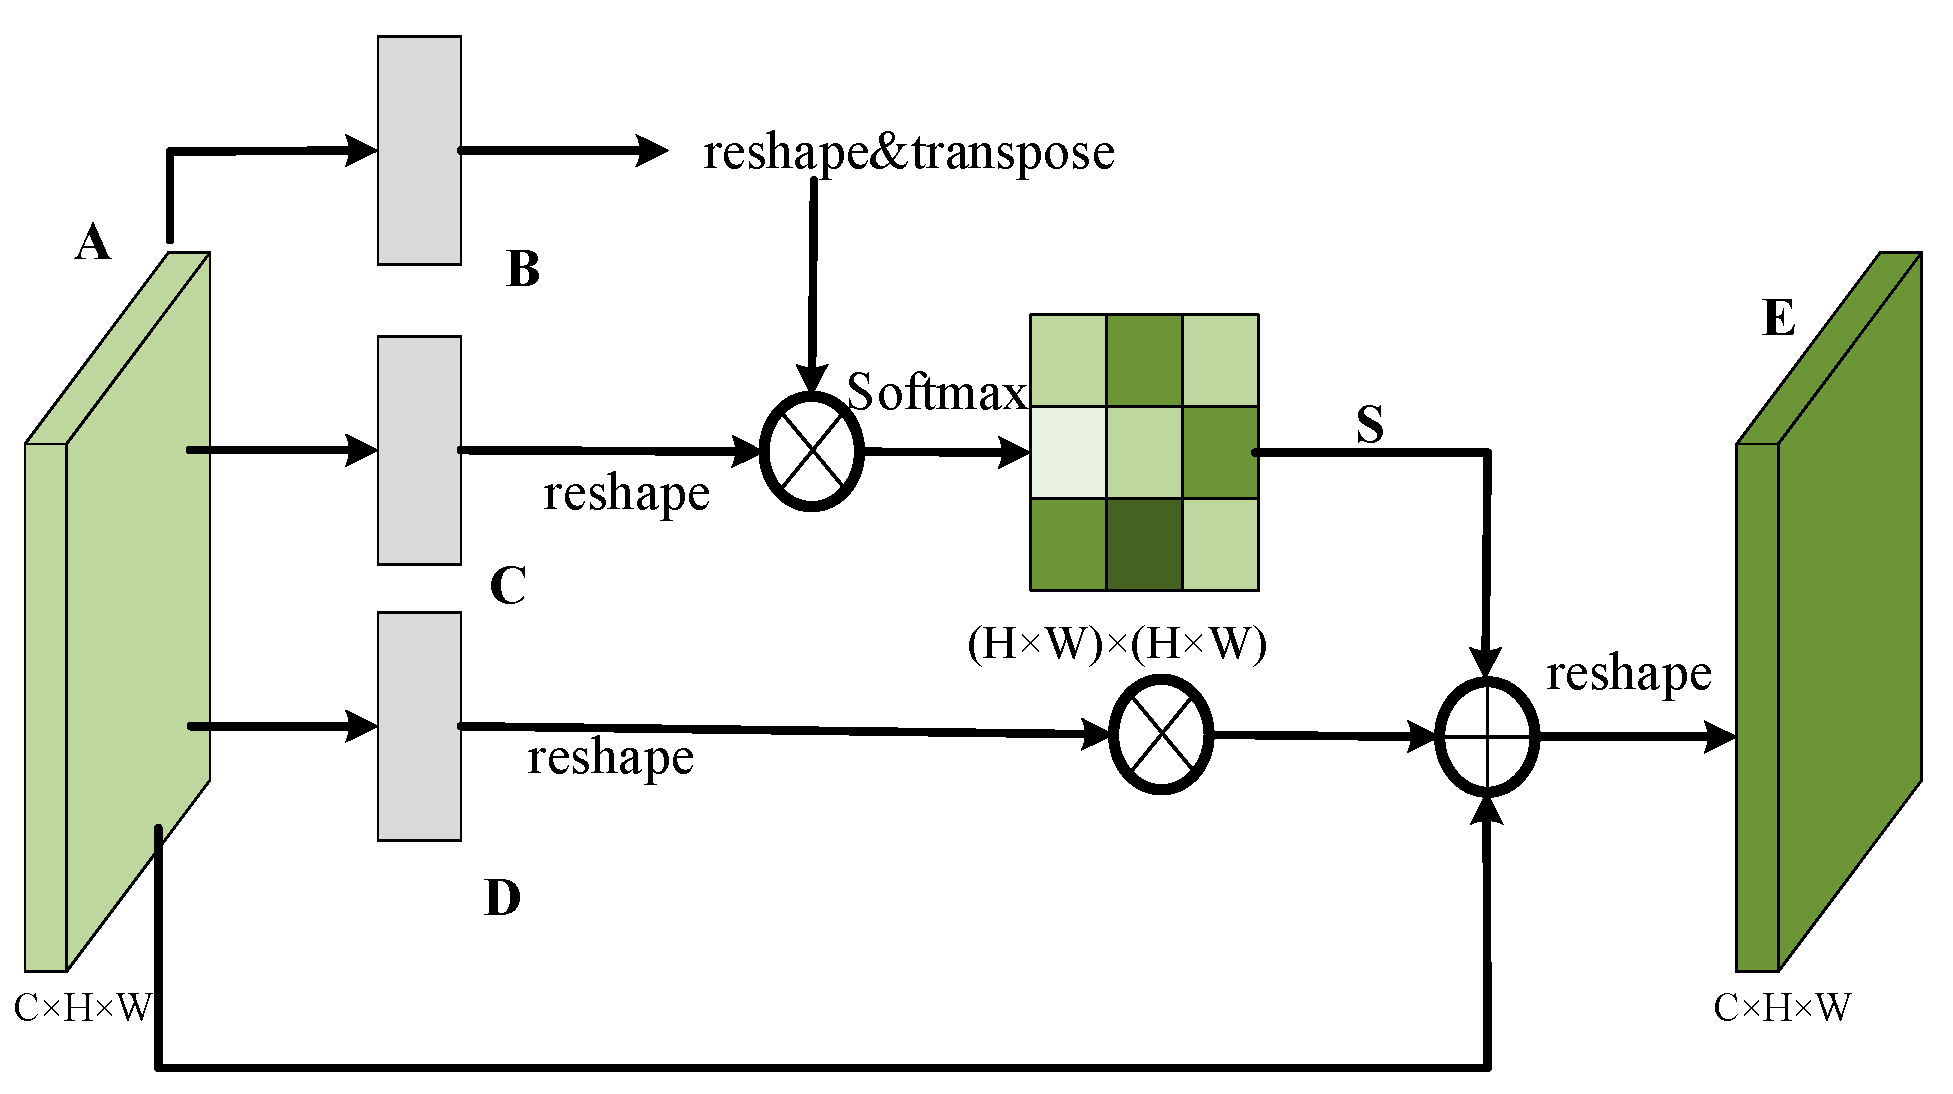
3.1. Dual Attention Mechanism
3.1.1. Position Attention Module
3.1.2. Channel Attention Module
3.2. The Focaler-IoU Damage Function
3.3. Dilated Convolution
4. Experimental Results and Analysis
4.1. Datasets
4.2. Experimental Configuration and Evaluation Indicators
4.3. Comparative Experiment on Attention Mechanisms
4.4. Comparative Experiments of Different Models
5. Discussion
6. Conclusions
Author Contributions
Funding
Institutional Review Board Statement
Informed Consent Statement
Data Availability Statement
Conflicts of Interest
Appendix A


References
- Massé, B.; Ba, S.; Horaud, R. Tracking gaze and visual focus of attention of people involved in social interaction. IEEE Trans. Pattern. Anal. Mach. Intell 2018, 40, 2711–2724. [Google Scholar] [CrossRef]
- Rathnayake, R.; Madhushan, N.; Jeeva, A.; Darshani, D.; Subasinghe, A.; Silva, B.N.; Wijesinghe, L.P.; Wijenayak, U. Current Trends in Human Pupil Localization: A Review. IEEE Access 2023, 11, 115836–115853. [Google Scholar] [CrossRef]
- Jan, F.; Min, N. An effective iris segmentation scheme for noisy images. Biocybern. Biomed. 2020, 40, 1064–1080. [Google Scholar] [CrossRef]
- Poulopoulos, N.; Psarakis, E. DeepPupil net: Deep residual network for precise pupil center localization. In Proceedings of the 17th International Joint Conference on Computer Vision, Imaging and Computer Graphics Theory and Applications (VISIGRAPP 2022), Setúbal, Portugal, 6–8 February 2022; Scitepress: Setúbal, Portugal, 2022; pp. 297–304. [Google Scholar]
- Timm, F.; Barth, E. Accurate Eye Centre Localisation by Means of Gradient. Visapp 2011, 11, 125–130. [Google Scholar]
- Nugroho, R.H.; Nasrun, M.; Setianingsih, C. Lie Detector with Pupil Dilation and Eye Blinks Using Hough Transform and Frame Difference Method with Fuzzy Logic. In Proceedings of the 2017 International Conference on Control, Electronics, Renew−able Energyand Communication (ICCREC), Yogyakarta, Indonesia, 26–28 September 2017. [Google Scholar]
- Wang, P.; Wen, H.T.; Wang, S. High−precision Pupil Center Positioning Method Based on Near−eye Infrared Image. J. Harbin Univ. Sci. Technol. 2022, 27, 38–46. [Google Scholar]
- Cai, H.Y.; Shi, Y.; Lou, S.L.; Wang, Y.; Chen, W.G.; Chen, X.D. Pupil location algorithm applied to infrared ophthalmic disease detection. Chin. Opt. 2021, 14, 605–614. [Google Scholar]
- Vranceanu, R.; Florea, C.; Florea, L.; Vertan, C. Gaze direction estimation by component separation for recognition of Eye Accessing Cues. Mach. Vis. Appl. 2015, 26, 267–278. [Google Scholar] [CrossRef]
- Zhang, H.; Wang, S.; Li, X.; Ma, H.; Cui, J.; Zhu, J.; Li, M.; Gao, Y.; Han, L.; Zhou, B. Research and implementation of pupil recognition based on Hough transform. Chin. J. Liq. Cryst. Disp. 2016, 31, 621–625. [Google Scholar] [CrossRef]
- Loy, G.; Zelinsky, A. Fast radial symmetry for detecting points of interest. IEEE Trans. Pattern Anal 2003, 25, 959–973. [Google Scholar] [CrossRef]
- Ning, X.; Mu, L. Research on pupil localization algorithm based on gradient direction constraint. Foreign Electron. Meas. Technol. 2021, 40, 115–121. [Google Scholar]
- Fuhl, W.; Santini, T.; Kasneci, G.; Kasneci, E. Pupil Nte: Convolutional neural networks for robust pupil detection. Rev. Odontol. Unesp 2016, 19, 806–821. [Google Scholar]
- Chinsatit, W.; Saitoh, T. CNN−based pupil center detection for wearable gaze estimation system. Appl. Comput. Intell. Soft Comput. 2017, 2017, 8718956. [Google Scholar] [CrossRef]
- Ma, Q.; Han, H.; Han, X.; Zhang, Z. Pupil center location based on star ray method. Comput. Eng. Des. 2021, 42, 1409–1417. [Google Scholar]
- Fuhl, W.; Eivazi, S.; Hosp, B.; Eivazi, A.; Rosenstiel, W.; Kasneci, E. BORE: Boosted-oriented edge optimization for robust, real time remote pupil center detection. In Proceedings of the 2018 ACM Symposium on Eye Tracking Research & Applications, Warsaw, Poland, 14–17 June 2018. [Google Scholar] [CrossRef]
- Hosp, B.; Eivazi, S.; Maurer, M.; Fuhl, W.; Geisler, D.; Kasneci, E. RemoteEye: An open-source high-speed remote eye tracker: Implementation insights of a pupil- and glint-detection algorithm for high-speed remote eye tracking. Behav. Res. Methods 2020, 52, 1387–1401. [Google Scholar] [CrossRef]
- Donuk, K.; Hanbay, D. Pupil center localization based on mini U-net. In Proceedings of the International Artificial Intelligence and Data Processing Symposium, (IDAP), Sofia, Bulgaria, 22 May 2022; pp. 185–191. [Google Scholar]
- Chen, G.; Dong, Z.; Wang, J.; Xia, L. ‘Pupil localization algorithm based on improved U-Net network. Electronics 2023, 12, 2591. [Google Scholar] [CrossRef]
- Song, B.; Du, W.; Duan, N.; Li, X. Research on pupil location algorithm of non−contact tonometer. Electron. Meas. Technol. 2022, 45, 112–117. [Google Scholar]
- Sun, Y.; Liu, W.; Jiang, M. Pupil location algorithm based on Attention Gate and dilated convolution. Electron. Meas. Technol. 2023, 46, 126−132. [Google Scholar]
- Xu, D.; Wang, L.; Li, F. Review of Typical Object Detection Algorithms for Deep Learning. Comput. Eng. Appl. 2021, 57, 10–25. [Google Scholar]
- Li, X. Research on Pupil Center Location and Tracking Based on Near−Eye Infrared Video Images. Master’s Thesis, North University of China, Taiyuan, China, 2024. [Google Scholar]
- Wang, X.; Gao, H.; Jia, Z. Improved road defect detection algorithm based on YOLOv8. Comput. Eng. Appl. 2024, 13, 2413. [Google Scholar]
- Zhang, L.; Sun, Z.; Tao, H.; Hao, S.; Yan, Q.; Li, X. Research on real−time monitoring method of mine personnel protective equipment with improved YOLOv8. Coal Sci. Technol. 2024, 1–12. Available online: https://link.cnki.net/urlid/11.2402.td.20240527.1700.004 (accessed on 27 July 2024).
- Lin, B.Y. Safety Helmet Detection Based on Improved YOLOv8. IEEE Access 2024, 12, 28260–28270. [Google Scholar] [CrossRef]
- Tian, P.; Mao, L. Improved YOLOv8 Object Detection Algorithm for Traffic Sign Target. Comput. Eng. Appl. 2024, 60, 202–212. [Google Scholar]
- Hu, M.; Wang, R.; Zhang, W.; Zhang, Q. Multi−scale Referring Image Segmentation Based on Dual Attention. J. Comput.-Aided Des. Comput. Graph. 2024, 1–10. Available online: https://link.cnki.net/urlid/11.2925.tp.20240531.1456.002 (accessed on 27 July 2024).


| Characteristics | |||||||||
|---|---|---|---|---|---|---|---|---|---|
| Subset | Sensor | Environment | Session | Attributes of subjects | No. of subjects | No. of classes | No. of images | Resolution | Features |
| CASIA-Iris -Interval | CASIA close-up Iris camera | Indoor | Two sessions for most iris images | Most are graduate students of CASIA | 249 | 395 | 2639 | 320 × 280 | Cross-session Iris images with extremely clear Iris texture details |
| CASIA-Iris -Lamp | OKI IRISPASS-h | Indoor with lamp on/off | One | Most are graduate students of CASIA | 411 | 819 | 16,212 | 640 × 480 | Nonlinear deformation due to variations in visible illumination |
| CASIA-Iris -Twins | OKI IRISPASS-h | Outdoor | One | Most are children participating in the Beijing Twins Festival | 200 | 400 | 3183 | 640 × 480 | The first publicly available Iris image dataset of twins |
| CASIA-Iris -Distance | CASIA long-range Iris camera | Indoor | One | Most are graduate students of CASIA | 142 | 284 | 2567 | 2352 × 1728 | The first publicly available long-range and high-quality Iris/ face dataset |
| CASIA-Iris -Thousand | Irisking IKEMB-100 | Indoor with lamp on/off | One | Students, workers, and farmers with wide distribution of ages | 1000 | 2000 | 20,000 | 640 × 480 | The first publicly available Iris image dataset with more than one thousand subjects |
| CASIA-Iris -Syn | CASIA iris image synthesis algorithm | N/A | N/A | The source Iris images are from CASIA-Iris V1 | 1000 | 1000 | 10,000 | 640 × 480 | Synthesized Iris image dataset |
| Total | A total of 54,601 Iris images from more than 1800 genuine subjects and 1000 virtual subjects | ||||||||
| Algorithm | P | R | mAP@0.5 | mAP@0.5:0.95 |
|---|---|---|---|---|
| YOLOv8n | 0.92411 | 0.8587 | 0.9221 | 0.58215 |
| YOLOv8n + SE | 0.91023 | 0.84991 | 0.91372 | 0.56497 |
| YOLOv8n + CBAM | 0.9227 | 0.86261 | 0.92526 | 0.58444 |
| YOLOv8n + CA | 0.92902 | 0.86654 | 0.93143 | 0.59625 |
| YOLOv8n + DA | 0.93011 | 0.87105 | 0.94013 | 0.60251 |
| Algorithm | P | R | mAP@0.5 | mAP@0.5:0.95 | Parameters | FLOPs |
|---|---|---|---|---|---|---|
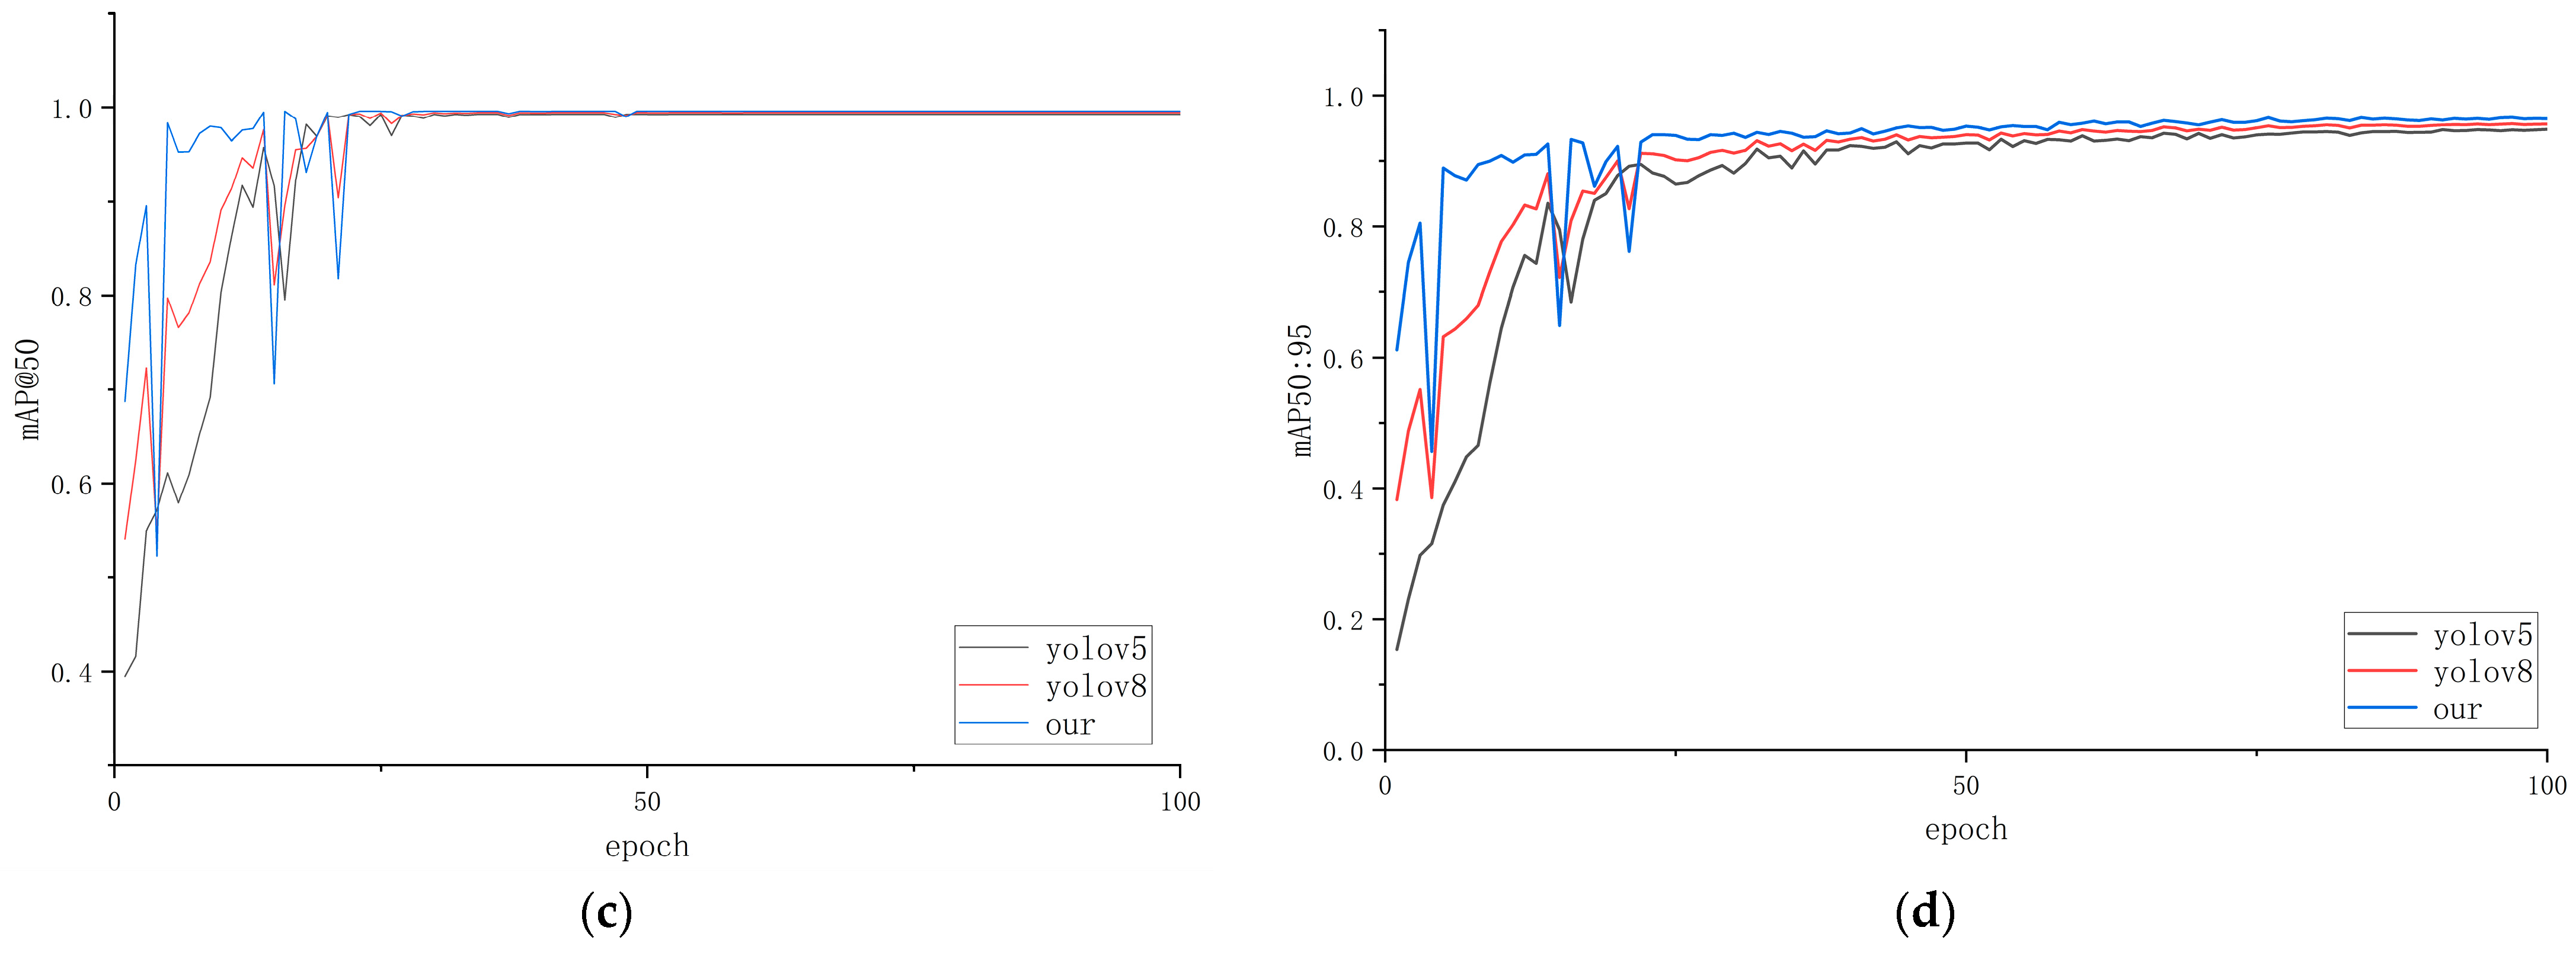
| YOLOv5 | 0.99913 | 0.99881 | 0.99275 | 0.9480 | 3006038 | 15.8 |
| YOLOv8n | 0.99944 | 0.99942 | 0.99445 | 0.95673 | 3006038 | 8.1 |
| Our | 0.99971 | 1 | 0.99611 | 0.96495 | 2790204 | 5.7 |
| +0.027% | +0.058% | +0.167% | +0.868% | −7.18% | −29.6% |
| NO | Time/ms |
|---|---|
| 1 | 15 |
| 2 | 15 |
| 3 | 15 |
| 4 | 17 |
| 5 | 16 |
| 6 | 15 |
| 7 | 17 |
| 8 | 15 |
| 9 | 21 |
| 10 | 27 |
| 11 | 22 |
| 12 | 22 |
| 13 | 15 |
| 14 | 21 |
| 15 | 18 |
| 16 | 14 |
| 17 | 15 |
| 18 | 21 |
| 19 | 21 |
| 20 | 15 |
| 21 | 21 |
| 22 | 21 |
| 23 | 15 |
| 24 | 15 |
| 25 | 21 |
| 26 | 21 |
| 27 | 21 |
| 28 | 19 |
| 29 | 24 |
| 30 | 16 |
| Average | 18.3667 |
Disclaimer/Publisher’s Note: The statements, opinions and data contained in all publications are solely those of the individual author(s) and contributor(s) and not of MDPI and/or the editor(s). MDPI and/or the editor(s) disclaim responsibility for any injury to people or property resulting from any ideas, methods, instructions or products referred to in the content. |
© 2024 by the authors. Licensee MDPI, Basel, Switzerland. This article is an open access article distributed under the terms and conditions of the Creative Commons Attribution (CC BY) license (https://creativecommons.org/licenses/by/4.0/).
Share and Cite
Xue, K.; Wang, J.; Wang, H. Research on Pupil Center Localization Detection Algorithm with Improved YOLOv8. Appl. Sci. 2024, 14, 6661. https://doi.org/10.3390/app14156661
Xue K, Wang J, Wang H. Research on Pupil Center Localization Detection Algorithm with Improved YOLOv8. Applied Sciences. 2024; 14(15):6661. https://doi.org/10.3390/app14156661
Chicago/Turabian StyleXue, Kejuan, Jinsong Wang, and Hao Wang. 2024. "Research on Pupil Center Localization Detection Algorithm with Improved YOLOv8" Applied Sciences 14, no. 15: 6661. https://doi.org/10.3390/app14156661
APA StyleXue, K., Wang, J., & Wang, H. (2024). Research on Pupil Center Localization Detection Algorithm with Improved YOLOv8. Applied Sciences, 14(15), 6661. https://doi.org/10.3390/app14156661