Article

Adaptive Frame Sampling and Feature Alignment for Multi-Frame Infrared Small Target Detection

Automation Department, School of Information Science and Engineering, East China University of Science and Technology, Shanghai 200237, China
*
Author to whom correspondence should be addressed.
Appl. Sci. 2024, 14(14), 6360; https://doi.org/10.3390/app14146360
Submission received: 16 June 2024 / Revised: 12 July 2024 / Accepted: 17 July 2024 / Published: 22 July 2024

Abstract

:
In recent years, infrared images have attracted widespread attention, due to their extensive application in low-visibility search and rescue, forest fire monitoring, ground target monitoring, and other fields. Infrared small target detection technology plays a vital role in these applications. Although there has been significant research over the years, accurately detecting infrared small targets in complex backgrounds remains a significant challenge. Multi-frame detection methods can significantly improve detection performance in these cases. However, current multi-frame methods face difficulties in balancing the number of input frames and detection speed, and cannot effectively handle the background motion caused by movement of the infrared camera. To address these issues, we propose an adaptive frame sampling method and a detection network aligned at the feature level. Our adaptive frame sampling method uses mutual information to measure motion changes between adjacent frames, construct a motion distribution, and sample frames with uniform motion based on the averaged motion distribution. Our detection network handles background motion by predicting a homography flow matrix that aligns features at the feature level. Extensive evaluation of all components showed that the proposed method can more effectively perform multi-frame infrared small target detection.

1. Introduction

In recent years, with advancements in science and technology, infrared images have found widespread use in low-visibility search and rescue, forest fire monitoring, ground target monitoring, and other fields [1,2,3,4]. Infrared small target detection (IRSTD) plays a crucial role in these applications, and numerous researchers have extensively studied this area for decades [5]. Most targets in IRSTD include ships, aircraft, and vehicles, with backgrounds of sky, ocean, and land [6]. Therefore, these targets often lack significant shape and texture, lack color information, and exhibit low contrast with the background in infrared images, and are often submerged in complex backgrounds [7]. For these reasons, accurately detecting the location of small targets in infrared images remains a very challenging problem [8].
Based on the use of infrared image frames, the current mainstream infrared small target detection methods can be divided into single-frame-based methods and multi-frame-based methods [9]. Single-frame-based detection methods mainly locate small infrared targets by separating background features from the target, and do not utilize the motion information of the targets. As shown in Figure 1, in scenarios where the target is embedded in a complex background and is small, occupying only a few pixels, the effectiveness of single-frame-based methods in distinguishing noise from the target is often limited.
By leveraging the temporal context, multi-frame-based methods can extract motion information from sequences [10]. As a result, multi-frame-based methods generally outperform single-frame-based methods, especially for complex backgrounds. The motion information helps build more robust infrared small target detection models [11]. This paper primarily discusses the difficulties and challenges faced by multi-frame-based infrared small target detection methods.
Multi-frame-based methods usually take the current frame F t and the previous k consecutive frames, i.e., [ F t k , , F t 1 , F t ] , as input. While the detection accuracy of the model is proportional to the number of input frames within a certain range, increasing the number of input frames significantly increases the computational workload, resulting in longer detection times. This poses challenges in scenarios with strict real-time detection requirements and limited computing resources, such as high-speed airborne platforms, unmanned aerial vehicle (UAV) systems, and handheld embedded devices. These situations present significant constraints and limitations in terms of the computational efficiency of infrared small target detection. As shown in Figure 1, the information contained between adjacent frames is often redundant. Enhancing detection performance and computational efficiency without increasing the computational burden can be achieved by extracting N frames from a sequence of T consecutive frames. This approach allows for the incorporation of more motion and scene details, leading to improved detection performance, while maintaining a favorable computational cost ratio.
Most of the currently used methods sample frames from consecutive dense frames at random or fixed intervals. However, this fixed strategy sampling method has the following issues. First, the motion patterns of different dense frame sets vary, and the targets do not move at a uniform speed. A fixed strategy sampling method may lose important information in some sets. Second, this method may sample redundant frames in other sets. Another issue with multi-frame infrared small target detection is the interference caused by background displacement due to the motion of the infrared detection sensor. Recently, this problem has been addressed by pre-processing the input frames to align them with the perspective of the detection frame F t [12,13,14]. However, this approach heavily relies on the quality of image registration preprocessing. Improper registration can introduce significant interference into the detection process, leading to poor robustness.
To solve these issues, this paper proposes a frame sampling pre-processing method based on mutual information for multi-frame infrared small target detection. Additionally, a multi-frame infrared small target detection model is introduced, which performs alignment at the feature level. The designed frame sampling method based on mutual information quantifies the motion variation between consecutive frames by computing the mutual information of the input dense frames. By accumulating the motion changes from f t k to f t , frame sampling is adaptively performed. Moreover, the proposed multi-frame infrared small target detection model, which performs alignment at the feature map level, embeds the registration operation from the preprocessing stage into the detection model and the model is trained in an end-to-end manner, enhancing its robustness.
The main contributions of this paper are summarized as follows:
  • We propose an adaptive frame sampling method based on mutual information for multi-frame infrared small target detection, to overcome the shortcomings of the fixed strategy frame sampling method.
  • A multi-frame infrared small target detection model is proposed, which incorporates feature alignment by placing the registration operation at the feature map level. The model is trained in an end-to-end fashion, overcoming the limitations of manual registration in the preprocessing stage in terms of robustness.
  • A comprehensive set of experiments were conducted on a mobile infrared small target dataset to evaluate the effectiveness of the proposed method. The results provide strong evidence supporting the efficacy of the proposed approach.
The structure of the remaining sections in this paper is as follows: In Section 2, an overview of previous work on infrared small target detection is presented. Section 3 outlines our proposed method and details the algorithm training procedure. Experimental datasets are discussed in Section 4, where quantitative results of various methods are analyzed and the detection performance is visualized. The paper concludes with a discussion and summary in Section 5.

2. Related Work

2.1. Infrared Small Target Detection Based on a Single Frame

Frame-based infrared small target detection refers to the process of detecting small targets in individual frames of raw infrared images. Typically, this is achieved by employing image processing techniques to enhance the targets or differentiate them from the background, followed by threshold segmentation for target recognition, without considering temporal sequences. Such methods are characterized by their concise approach, low computational complexity, fast detection speed, and ease of deployment on hardware platforms.
In 2013, Gao et al. [15] proposed the Infrared Patch Image (IPI) model for infrared small target detection. The approach involves dividing the image into blocks using a sliding window, followed by vectorizing the block matrices and rearranging them into a data matrix. Robust principal component analysis (RPCA) is employed to decompose the data matrix into a low-rank matrix and a sparse matrix. Finally, the sparse matrix is reconstructed into an image, yielding the target image. In 2014, Han et al. [16] proposed a fast target acquisition method for infrared small target detection based on the human visual system (HVS) attention transfer mechanism, which incorporates thresholding operations and a fast traversal mechanism. In 2016, Wei et al. [17] proposed a multi-scale image patch contrast measurement method, inspired by biology, aiming to enhance the contrast between the target and the background, to achieve the detection of small targets through a simple adaptive threshold segmentation method. In 2016, Deng et al. [18] proposed an effective small target detection method based on weighted image entropy. This method improves the signal-to-noise ratio between interfering objects and small targets in a scene that have similar thermal intensity measurements to the background through multi-scale grayscale difference weighted local entropy measurements, combined with adaptive threshold operations. In 2016, Dai et al. [19] proposed the weighted infrared patch-image (WIPI) model, which introduced structural prior information into the separation process of weak infrared targets and background, and added an adaptive coefficient to each image block, to replace the one used in the original IPI model, which had a unified coefficient.
Traditional methods cannot cope with changing scenarios with complex backgrounds. These methods usually need to adjust the parameters of each scenario according to each scenario, which brings challenges with application in actual scenarios. In recent years, methods based on deep learning have also been applied in the field of infrared small target detection. In 2015, Cui et al. [20] first used a phase spectrum Fourier transform to extract salient areas that may contain targets, and then used SVM to classify these areas to confirm the areas of small targets. In 2017, Liu et al. [21] used a multi-layer fully connected neural network to detect small infrared targets. The neural network only classified image blocks of size 21 × 21 and identified targets and non-targets. Its limited training data limited the detection ability of the model. In 2017, Wang et al. [22] used a context aggregation network as the basic network. The networks were connected to each other using U-net form, and they proposed a loss function based on missed detection and false detection to solve the problem of the serious imbalance between target and background duty cycles. The internal attention aware network (IAANet) explores the relationship between image pixels and enhances the correlation of different targets through attention at different scales [23]. DNANet proposed the DNIM module, which improves target feature extraction and preservation effects through dense connections and spatial pyramid fusion [24].

2.2. Infrared Small Target Detection Based on Multiple Frames

The infrared small target detection method based on sequence images mainly uses the temporal and spatial information of the sequence images, combined with the continuity of the target motion and the consistency of the trajectory to detect the target.
In 2011, Qi et al. [25] proposed two improved optical flow estimation methods. By modifying the constraint function and introducing an adaptive threshold, they solved the problems of the accuracy of optical flow estimation and holes in the target area at low gradient points. In 2019, Lu et al. [26] proposed a sparse representation method based on online learning of double sparse background dictionaries for efficient detection of small infrared targets. This method achieved accurate target detection and background clutter suppression by constructing a background dictionary and using a sparse representation model to decompose the target image. In 2020, Zhao et al. [27] proposed an infrared moving small target detection algorithm that utilizes the spatiotemporal consistency of motion trajectories. By densely sampling and tracking feature points, dense trajectories are calculated, and suspicious trajectories are deleted using the motion characteristics of the target. A binary image is created based on the image coordinates of the trajectory points, extracting significant contours as candidate target areas. Through an encoding mechanism of contour numbers, the temporal consistency of contour codewords is used to distinguish moving targets and backgrounds. In 2021, Wang et al. [28] proposed a new small target detection method based on the spatiotemporal information of infrared images. By establishing a non-overlapping patch spatio-temporal tensor (NPSTT) model and introducing a tensor capped kernel norm (TCNN), potential target detection in complex backgrounds is achieved.
However, the relevant research on applying deep learning technology to multi-frame infrared small target detection is still insufficient. Kwan et al. [29] directly detected video frames using deep learning single-frame detectors, which cannot utilize temporal context information. Some methods use the spatiotemporal context information of the current frame and super-resolution operations to enhance the details of the current frame, to improve target recognition capabilities [30,31]. Yao et al. [32] used a maximum filter preprocessing operation to integrate multiple frames as input to a single-frame detection method. Sun et al. [33] used the frame to be detected as the central frame, performed a subtraction operation between the adjacent frames adapted to the central frame and the central frame to obtain a difference map, and concatenated the central frame with the two obtained difference maps before inputting it into the detection network. These methods utilize multiple frames more directly and do not take into account the redundancy of consecutive frames. At the same time, they do not fully consider the interference caused by the background motion of infrared video frames on detection. On this basis, this paper proposes an adaptive frame sampling method and a multi-frame detection network aligned at the feature map level.

3. Our Method

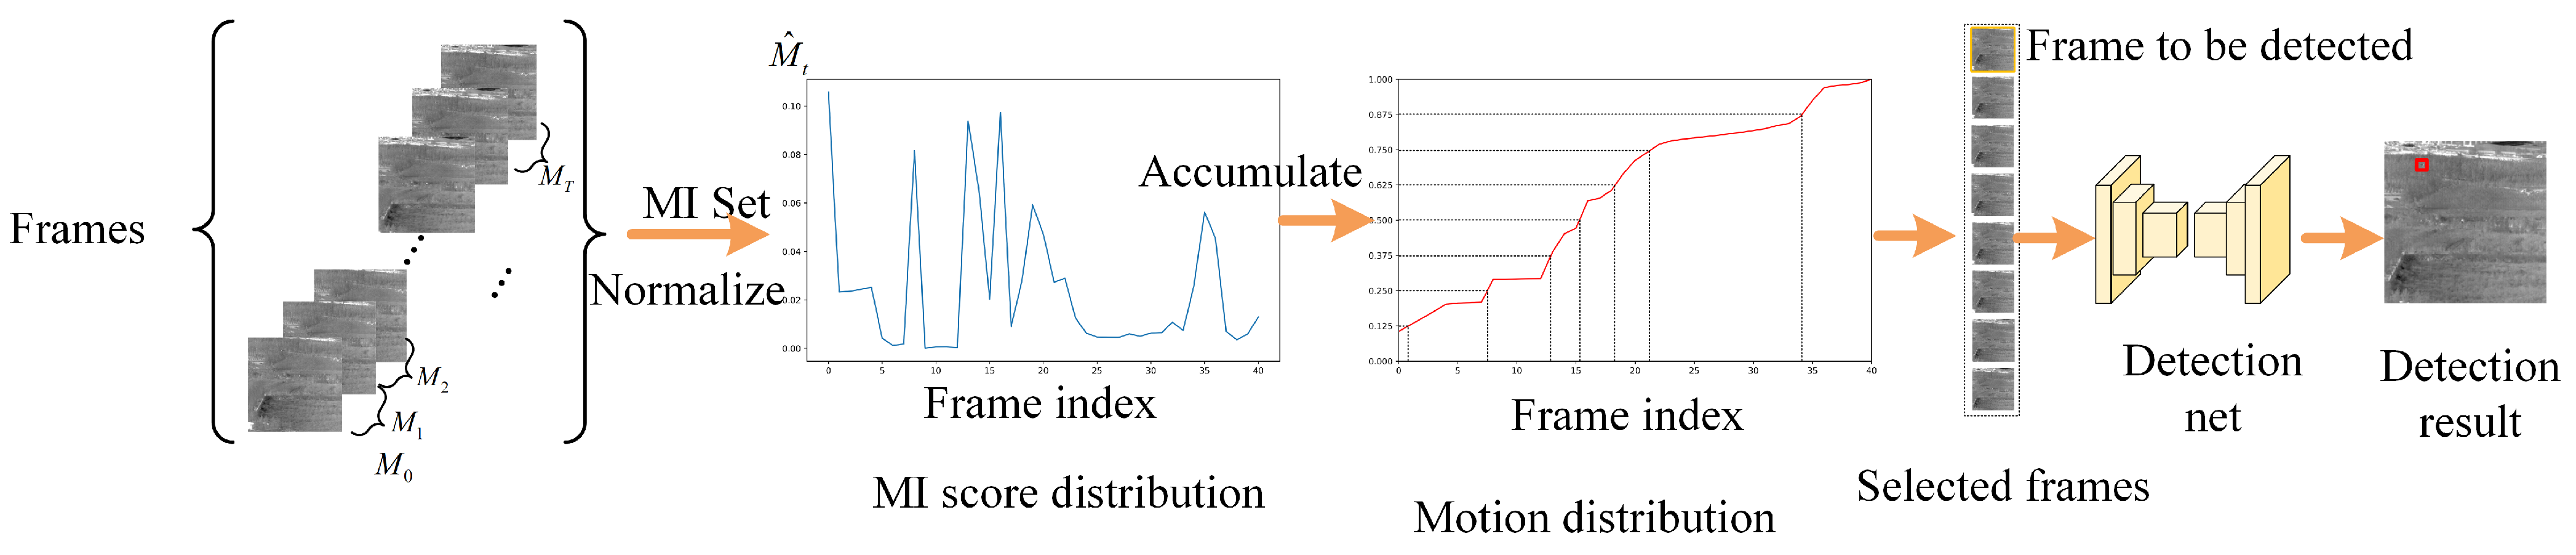
3.1. Adaptive Frame Sampling

In order to solve the shortcomings of uniform frame sampling and random frame sampling, this paper proposes an adaptive frame sampling method based on mutual information. The motion changes between frames are quantified by calculating the mutual information between consecutive frames, and then the motion is accumulated according to the time axis, to obtain the distribution function of the total motion change with time, and finally adaptive frame sampling is performed based on this function. The following content explains the adaptive frame sampling method in detail.

3.1.1. Mutual Information

Mutual information is a quantitative indicator that measures the correlation between two random variables. It relies on entropy and joint entropy. Entropy is a measure of the uncertainty of a random variable, and joint entropy examines the overall complexity of all possible outcomes given two random variables. Specifically, given two discrete random variables X and Y, the mutual information between them M I ( X , Y ) can be calculated as follows:
M I ( X , Y ) = H ( X ) + H ( Y ) H ( X , Y )
where H ( X ) and H ( Y ) respectively are the marginal entropies of random variables X and Y, and H ( X , Y ) is the joint entropy of X and Y. Marginal entropy and joint entropy can be calculated as follows:
H ( X ) = x X p ( x ) log p ( x )
H ( X , Y ) = x X , y Y p ( x , y ) log p ( x , y )
where p ( x ) represents the probability density function of X, and p ( x , y ) represents the joint probability density function of X and Y. If you put Equations (2) and (3) into Equation (1), you can further obtain the following equation:
M I ( X , Y ) = x X , y Y p ( x , y ) log p ( x , y ) p ( x ) p ( y )
To calculate the mutual information between two consecutive frames of infrared images, the marginal probability distribution can be obtained through from the respective histograms, and the joint probability distribution can be obtained using the joint histograms. Mutual information can measure the similarity between two frames of images [34]. The stronger the correlation between the two frames of images, the greater the mutual information. The weaker the correlation, the smaller the mutual information; that is, the more significant the motion between the current and subsequent frames. The smaller the mutual information, the more mutual information occurs when the two images are exactly the same.
Let the mutual information between the F t 1 frame and the F t frame be denoted as M t , which can be calculated as follows:
M t = M I ( F t 1 , F t )
where t 1 , 2 , , T , for frame F 0 , we simply define its mutual information M 0 as 0. In order to facilitate the analysis of the motion information distribution, we inverted M t and normalized it using l 1 norm:
M t = max i T ( M i ) M t
M ^ t = M t T M t
the M I score M ^ t can represent the motion information from the previous frame to the current frame. The larger the M ^ t , the more significant the motion between the two frames.

3.1.2. Adaptive Frame Sampling Based on Mutual Information

Inspired by the literature [35], we use the cumulative distribution function for frame sampling, and adaptively sample frames according to the motion information distribution of the entire set of consecutive frames to be sampled. As shown in Figure 2, given a set of consecutive frames to be sampled containing T + 1 frames, a set of M I scores can be obtained by calculating the M I scores of adjacent frame pairs, S = [ M ^ 0 , M ^ 1 , , M ^ T ] , where each element M ^ t [ 0 , 1 ] , t { 0 , 1 , , T } . Then, we accumulate the obtained M I scores to obtain the cumulative motion distribution function of the set of consecutive frames to be sampled:
M d ( t ) = i t M ^ i
The obtained motion accumulation distribution function is shown in Figure 2, where the X-axis represents the frame index and the Y-axis represents the total motion accumulation up to the current frame. Finally, to sample N frames from the consecutive frames set, we divide the Y-axis evenly into N segments, and the frames whose indices fall within the segments corresponding to the X-axis are regarded as sub-sampling sets, with a total of N sub-sampling sets. Then, in order to increase the diversity of the input model data, a frame is randomly sampled from each subsampling set rather than a frame at a specific location, and in particular, for the subsampling set where the frame to be detected F T is located, the frame to be extracted is fixedly set to the frame to be detected, F T . Then, they form the final sampled frame set, which is the input of the network for detection. As shown in Figure 2, this sampling method can sample more frames during periods of significant motion and fewer frames during periods of relatively static motion.

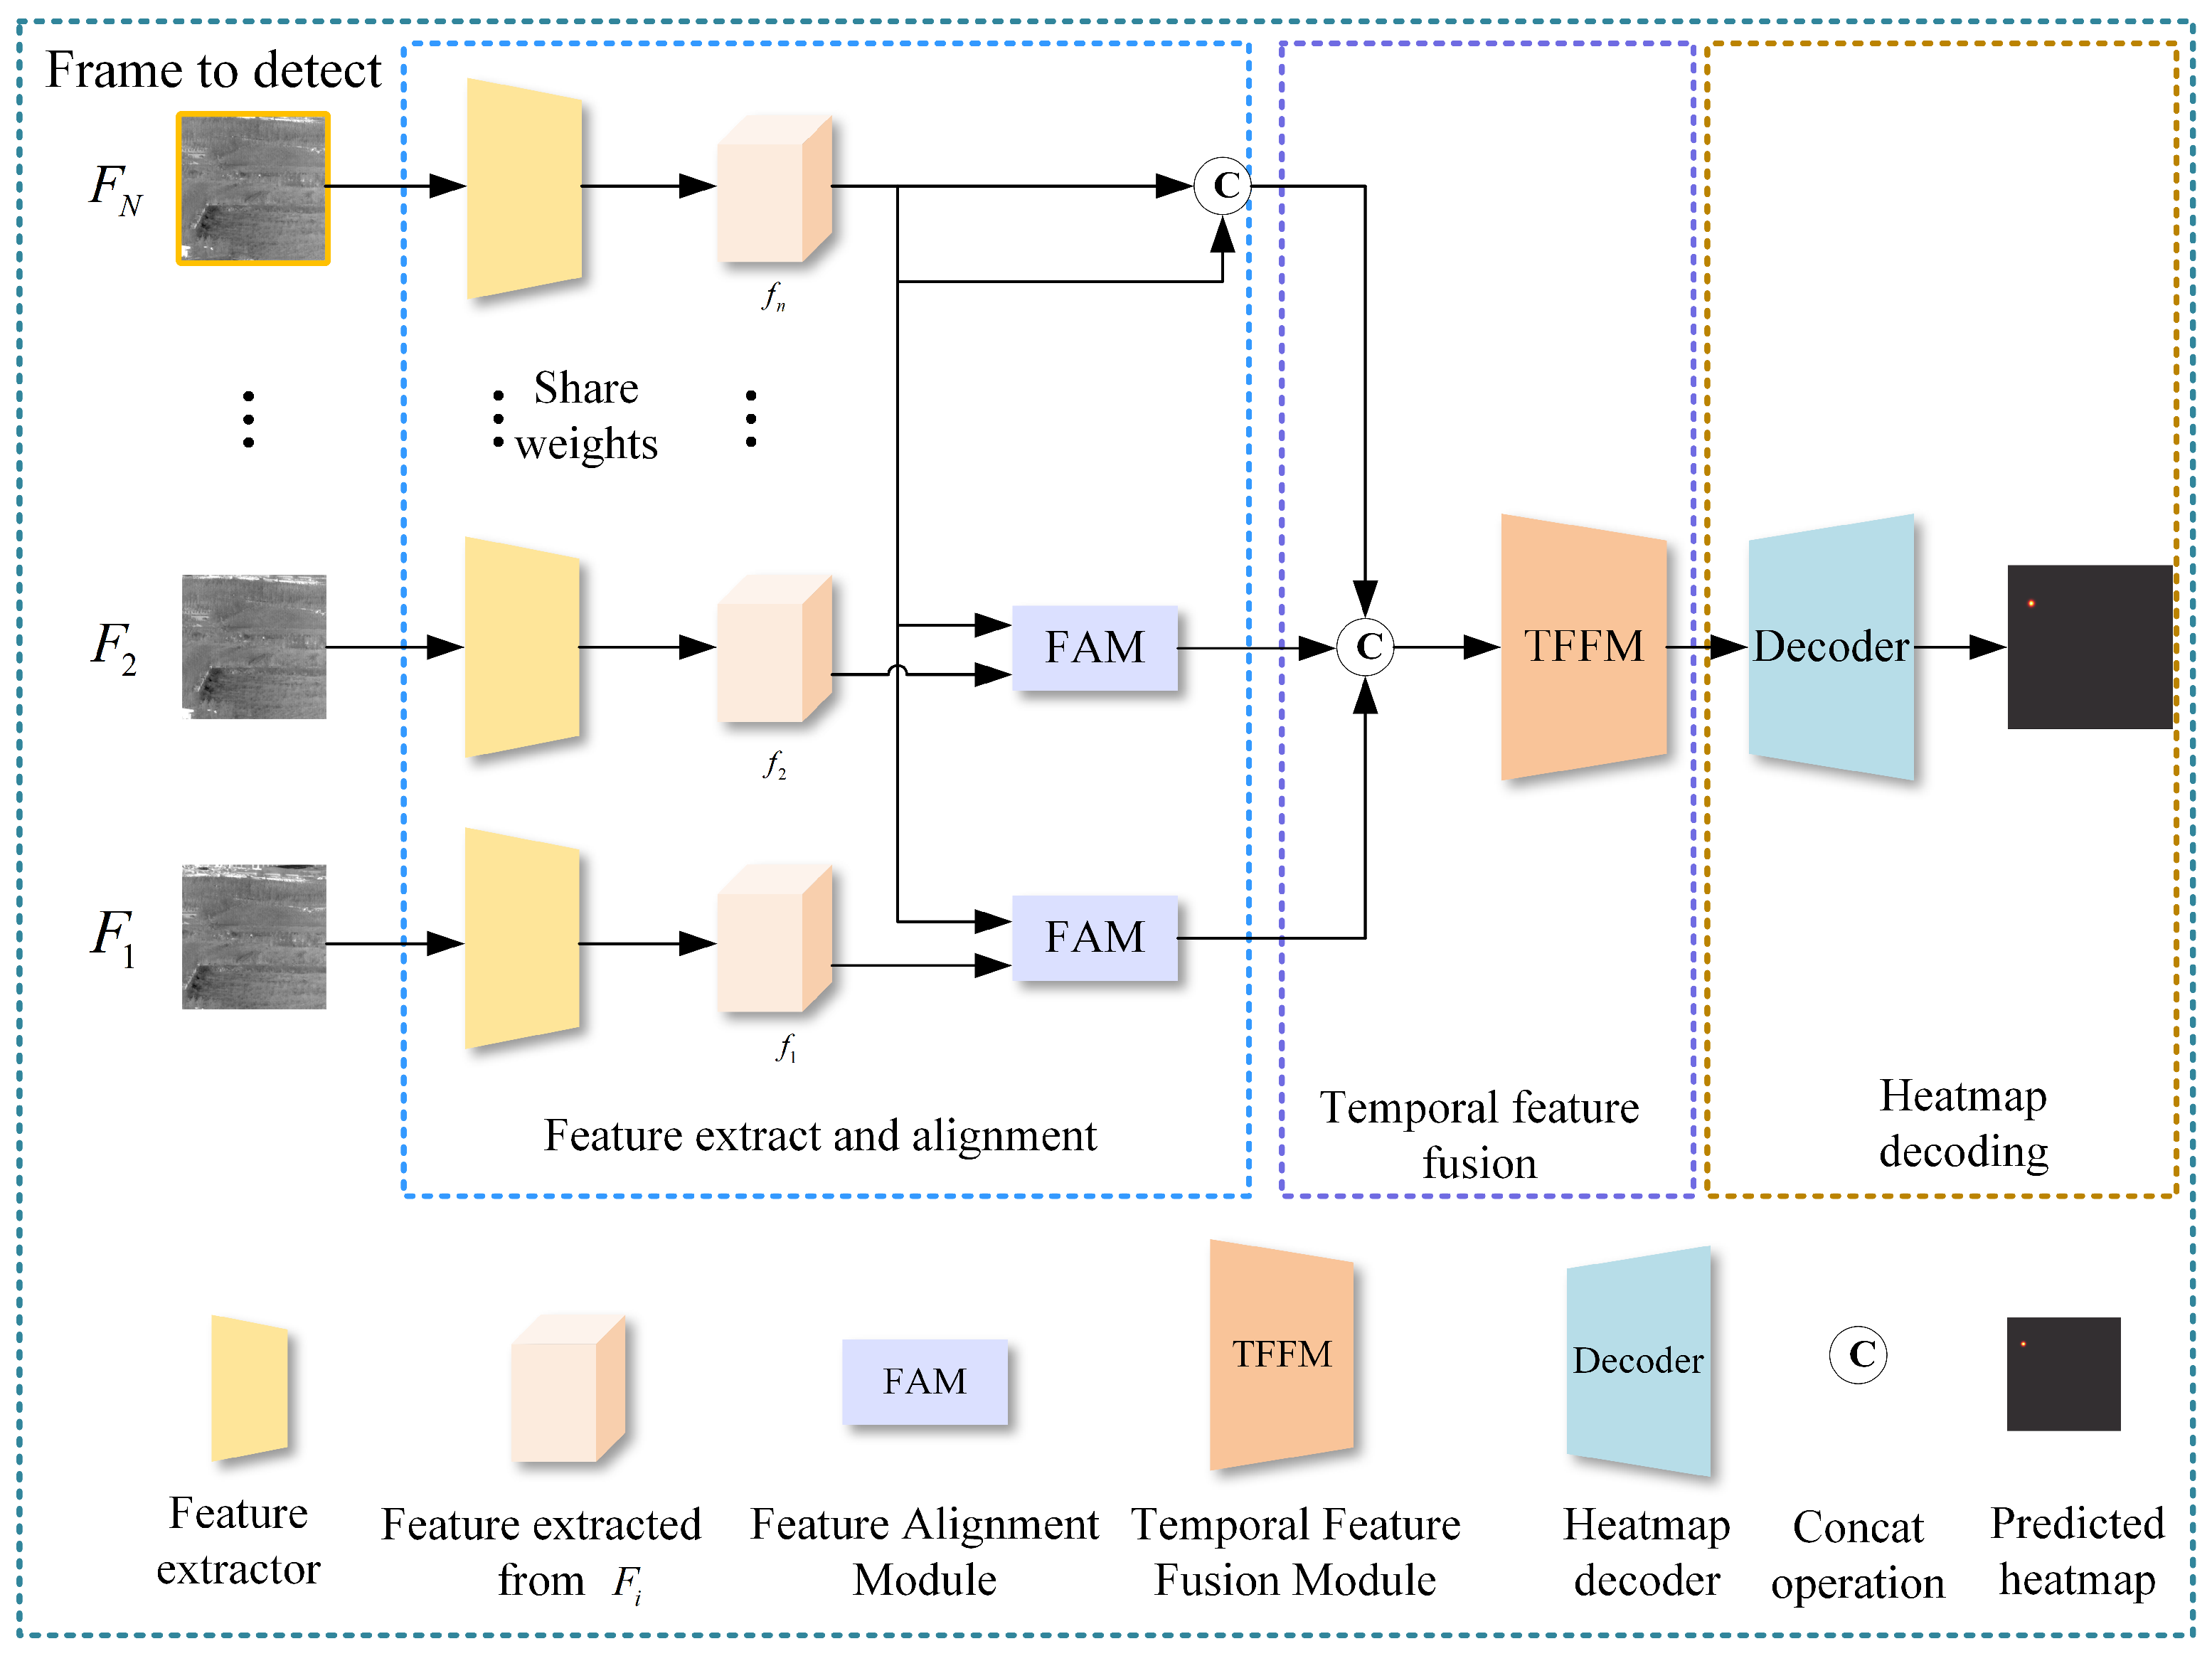
3.2. Network Architecture

In order to solve the interference caused by the motion of the infrared image background caused by the motion of the infrared detector, this paper proposes a multi-frame infrared small target detection network aligned at the feature map level. As shown in Figure 3, the proposed network consists of three parts: a feature extraction and alignment module, temporal feature fusion module, and decoding module.

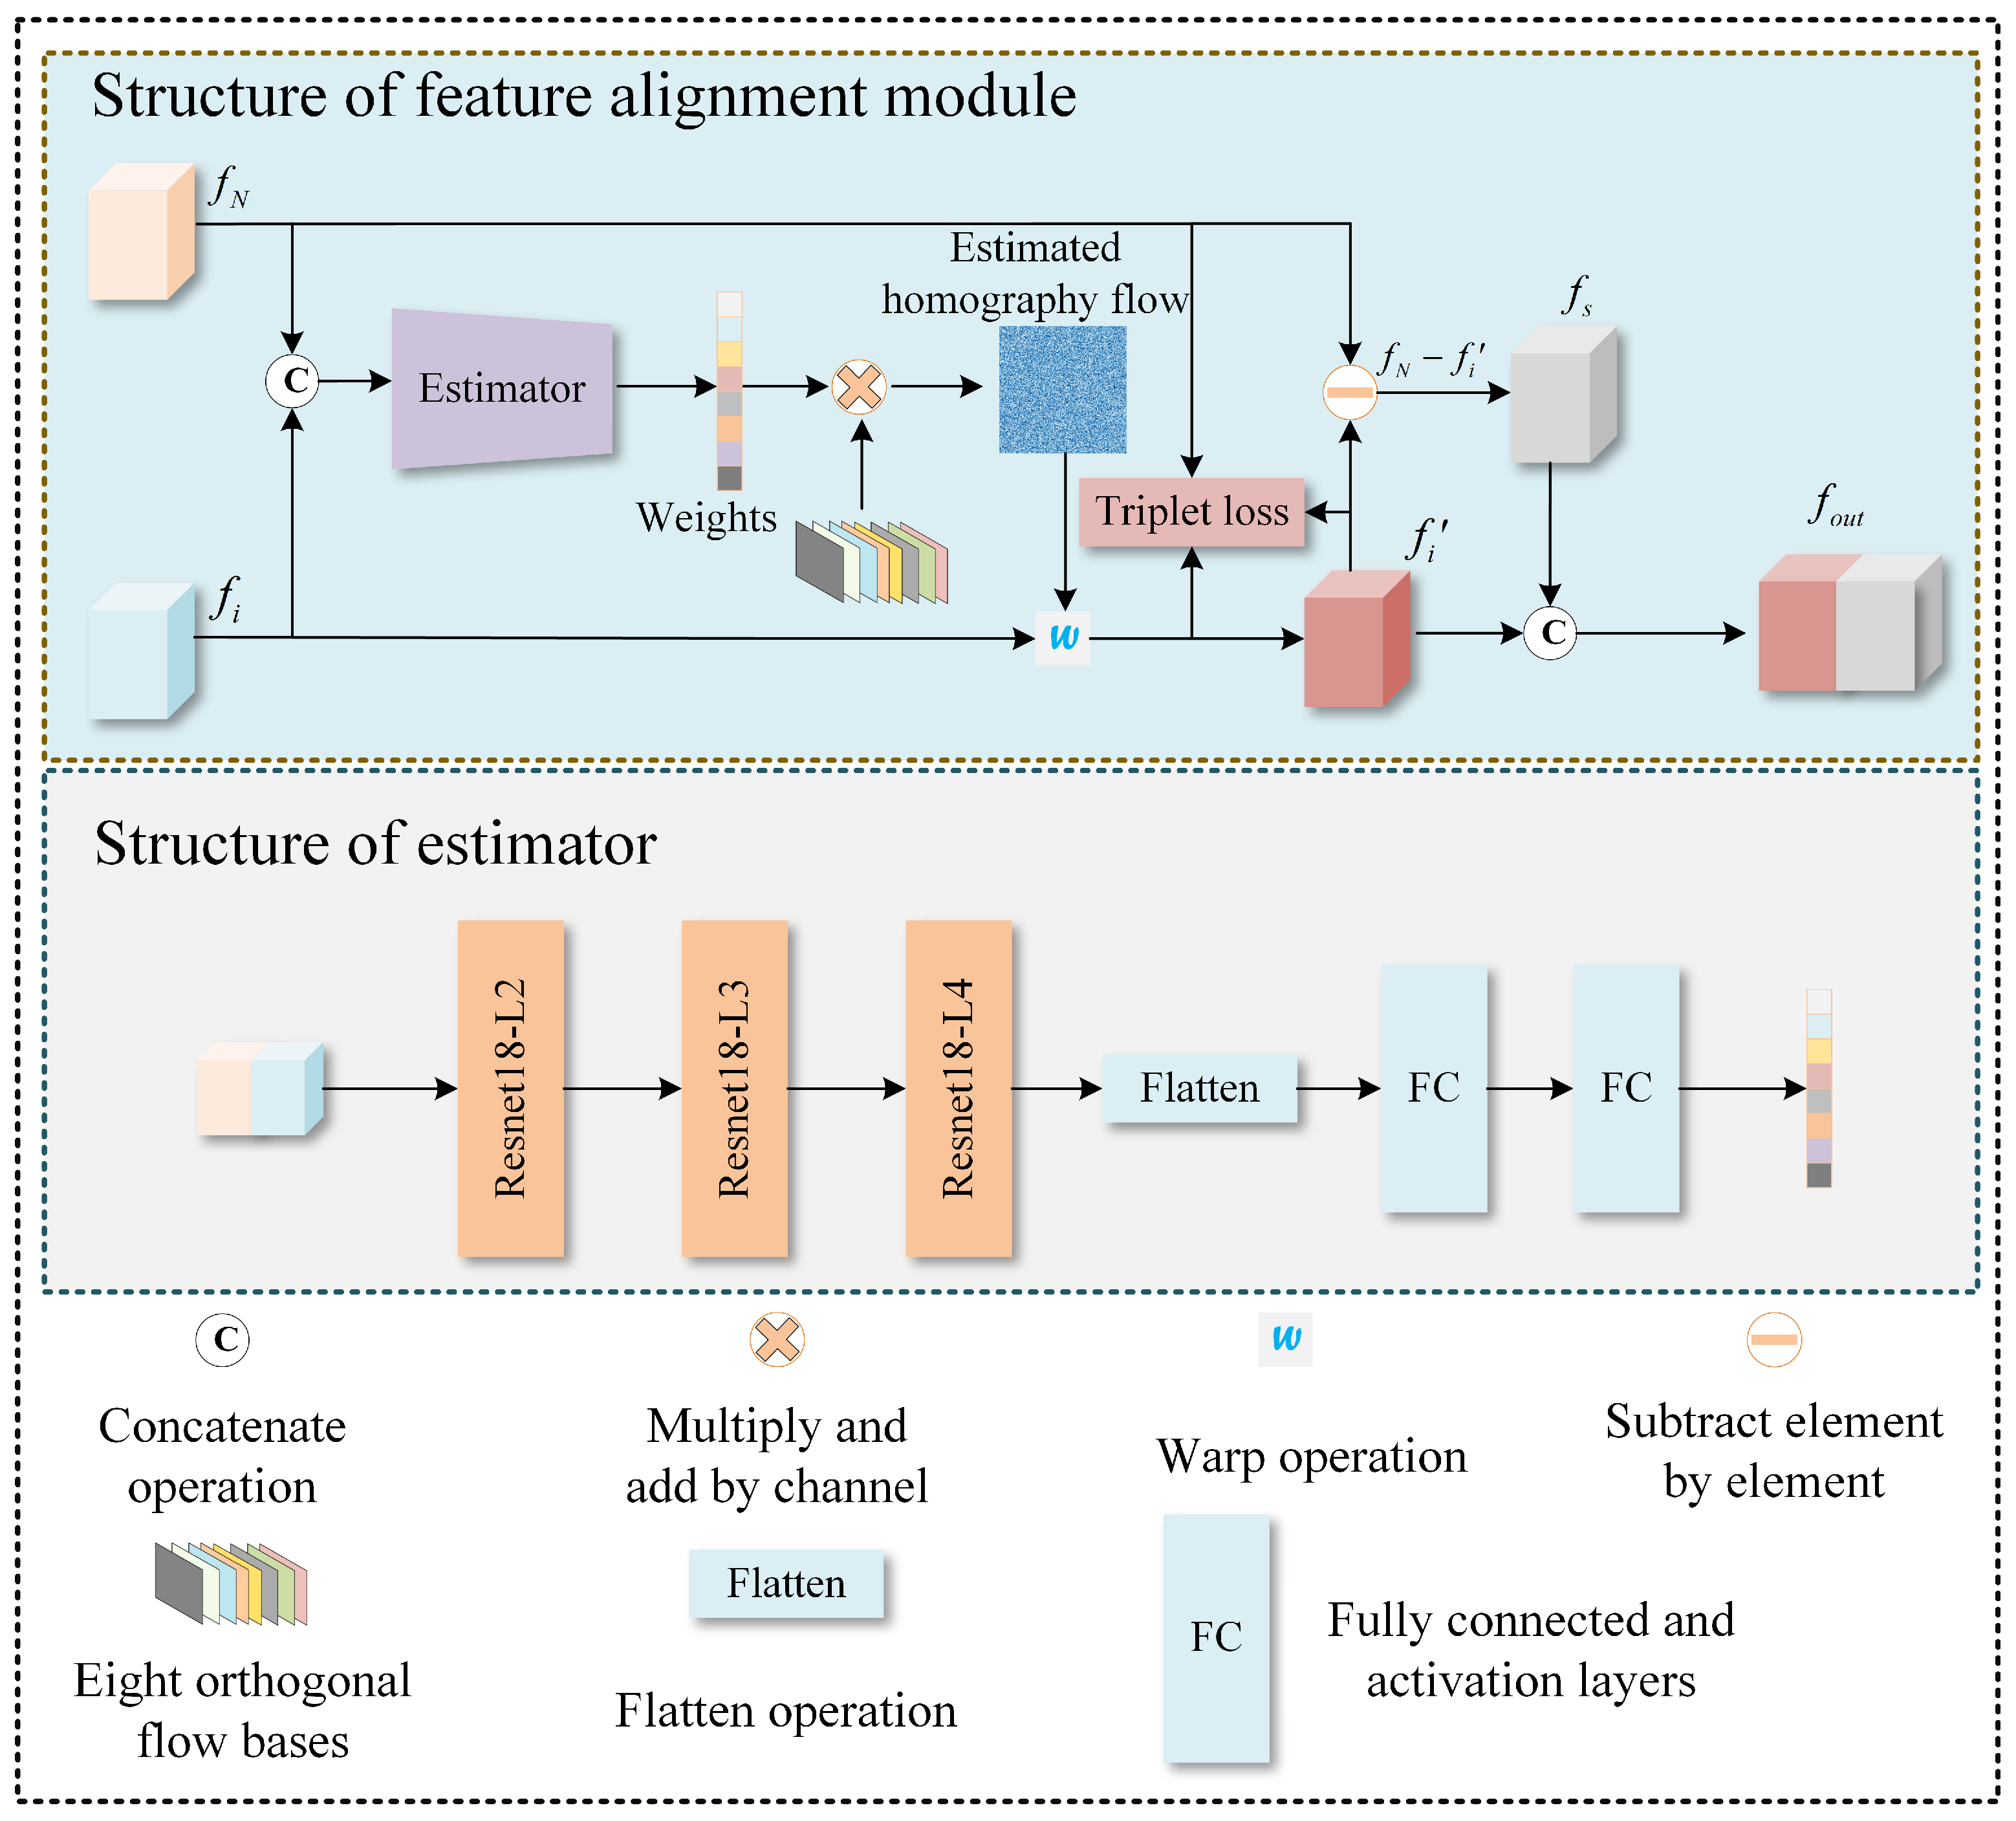
3.2.1. Feature Extraction and Alignment Module

After adaptive frame sampling is performed on a set of continuous infrared images, F = [ F 0 , F 1 , , F T ] that contains T + 1 frames, a set of infrared images, F ¯ = [ F 1 ¯ , F 2 ¯ , , F N ¯ ] that contains N frames is obtained as the input of the detection network, where F N ¯ is the frame to be detected. For each frame of the input network, its features are extracted using a shared weight backbone network. This backbone network was modified from MobileNetV3 [36]. In order to better extract the detailed information of infrared small target images, the number of downsampling operations was reduced to obtain a high-resolution feature map. The detailed structure is shown in Table 1. Except for the first row, each row of operation operators is connected in series to form the backbone network. Input in the first row represents the resolution and number of channels of the input feature map of the operation operator in that row, and Operator represents the operation operator, among which Conv2d,3 represents a two-dimensional convolution with a convolution kernel of 3 concatenated with a standard convolution block of batch normalization and an activation function. Bneck represents the basic bottleneck structure, using depthwise separable convolution [37]. CCA stands for cross attention module [38], which serves as the last layer of the backbone network, to strengthen the local important information of the spatial features obtained. Exp Size represents the number of channels of the feature map in Bneck after the first Dwconv. Out Channel represents the number of channels of the feature map after this operator. SE represents the channel attention network [39], True indicates that the Bneck uses channel attention, and False indicates that channel attention is not used. NL represents what activation function the operator uses, where HS represents the HardSwish activation function and RE represents the ReLU activation function. Stride represents the step size of the operator. If the step size is 1, the resolution of the input and output feature maps will remain unchanged. If the step size is 2, the feature map will be downsampled.
The feature alignment module is shown in Figure 4. Inspired by the literature [40], the feature map to be aligned f i and the current feature map f N are concatenated and fed into the homography estimation network to obtain the corresponding homography flow matrix. Then, a warp operation is performed on the f i to obtain an aligned feature map. The aligned feature map f i is subtracted from the feature map f i to obtain a differential feature map f s , and is concatenated with f i as the output f o u t . In order to ensure the quality of alignment, we also introduce a triplet loss for the feature alignment module, which is explained in detail in Section 3.3. As shown in Figure 4, the estimator in the feature alignment module consists of the last three layers of ResNet18 [41], and finally eight weights are obtained through two fully connected layers.

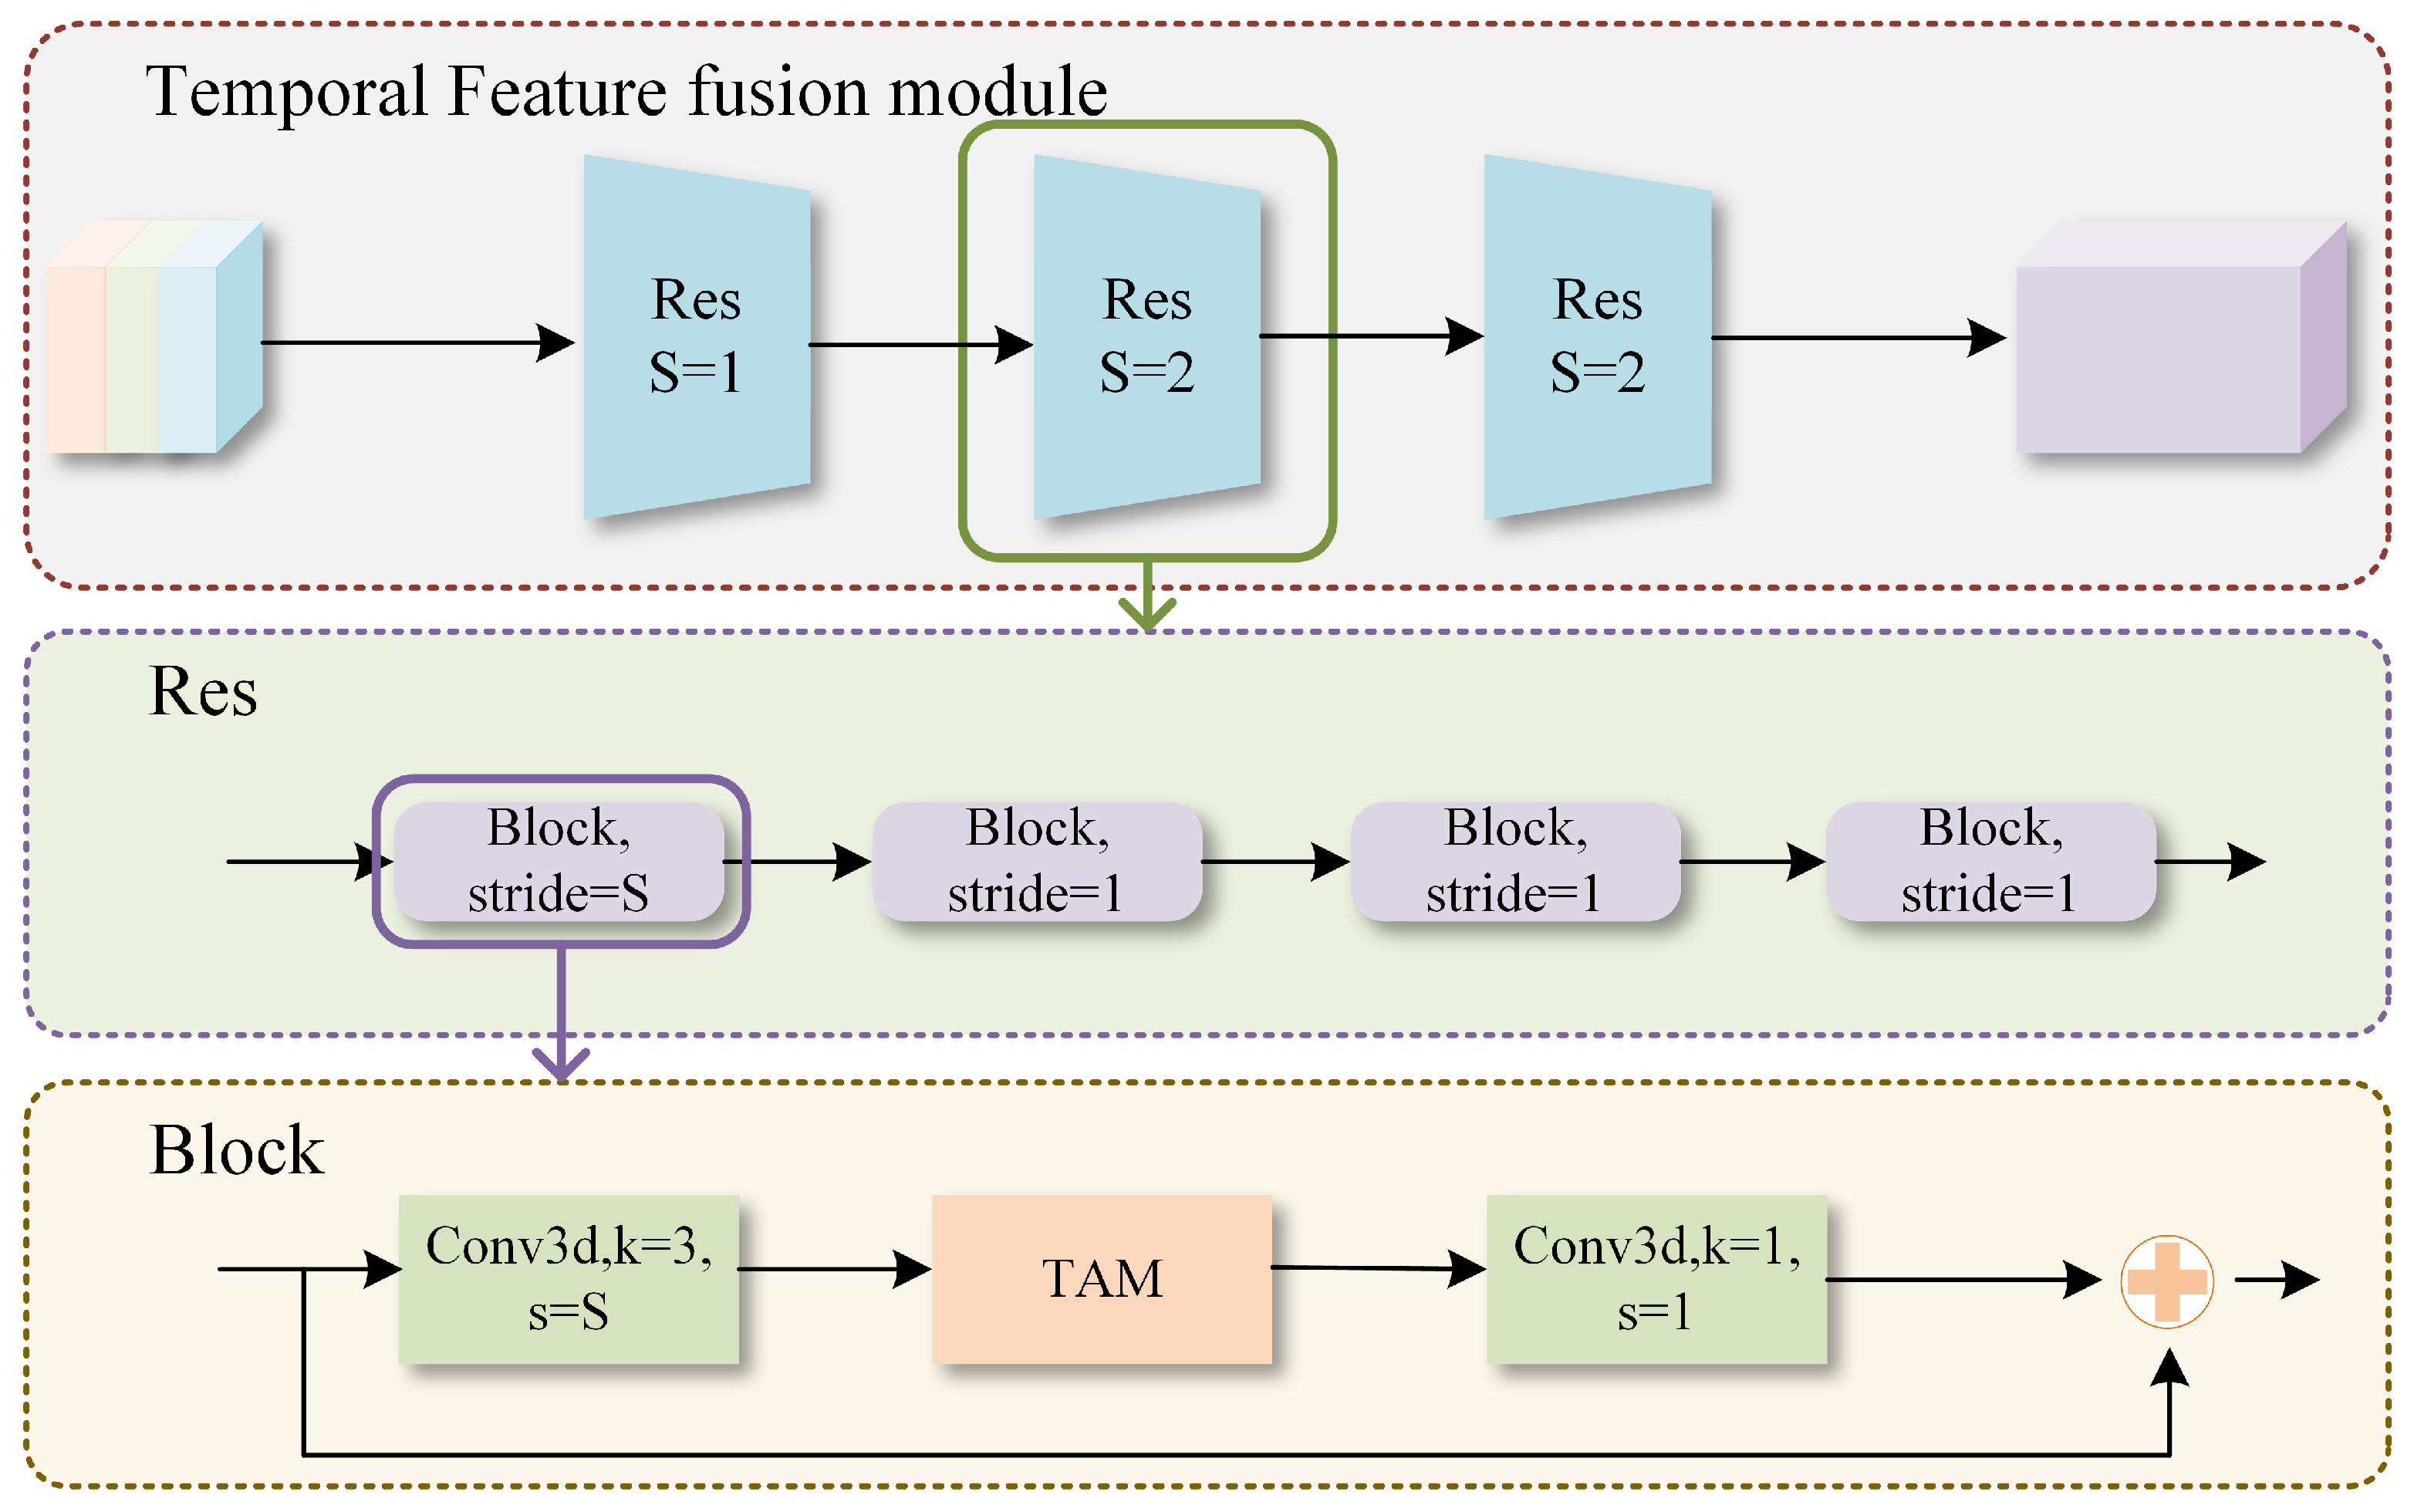
3.2.2. Temporal Feature Fusion Module

The spatiotemporal fusion module is modified from 3D ResNets [42]. Its structure is shown in Figure 5. It consists of three large residual units connected in series. The first residual unit has a step size of 1 and does not downsample the feature map in the time channel, while the last two residual units have a stride of 2, and the feature map is downsampled four times in the time channel in total. Each residual unit comprises four basic blocks connected in series. The first basic block has a different step size, and the remaining basic blocks have a step size of 1. Each basic block is composed of a 3D convolution structure superimposed with a time-adaptive module (TAM) [43]. In the basic block, conv3d, k = 3, s = S represents a 3D convolution with a kernel size of 3 and a stride of S. A standard 3D convolutional combination of batch normalization layers in series with ReLU activation functions is used. The TAM module enhances the network’s ability to capture important temporal information by learning adaptive kernels.

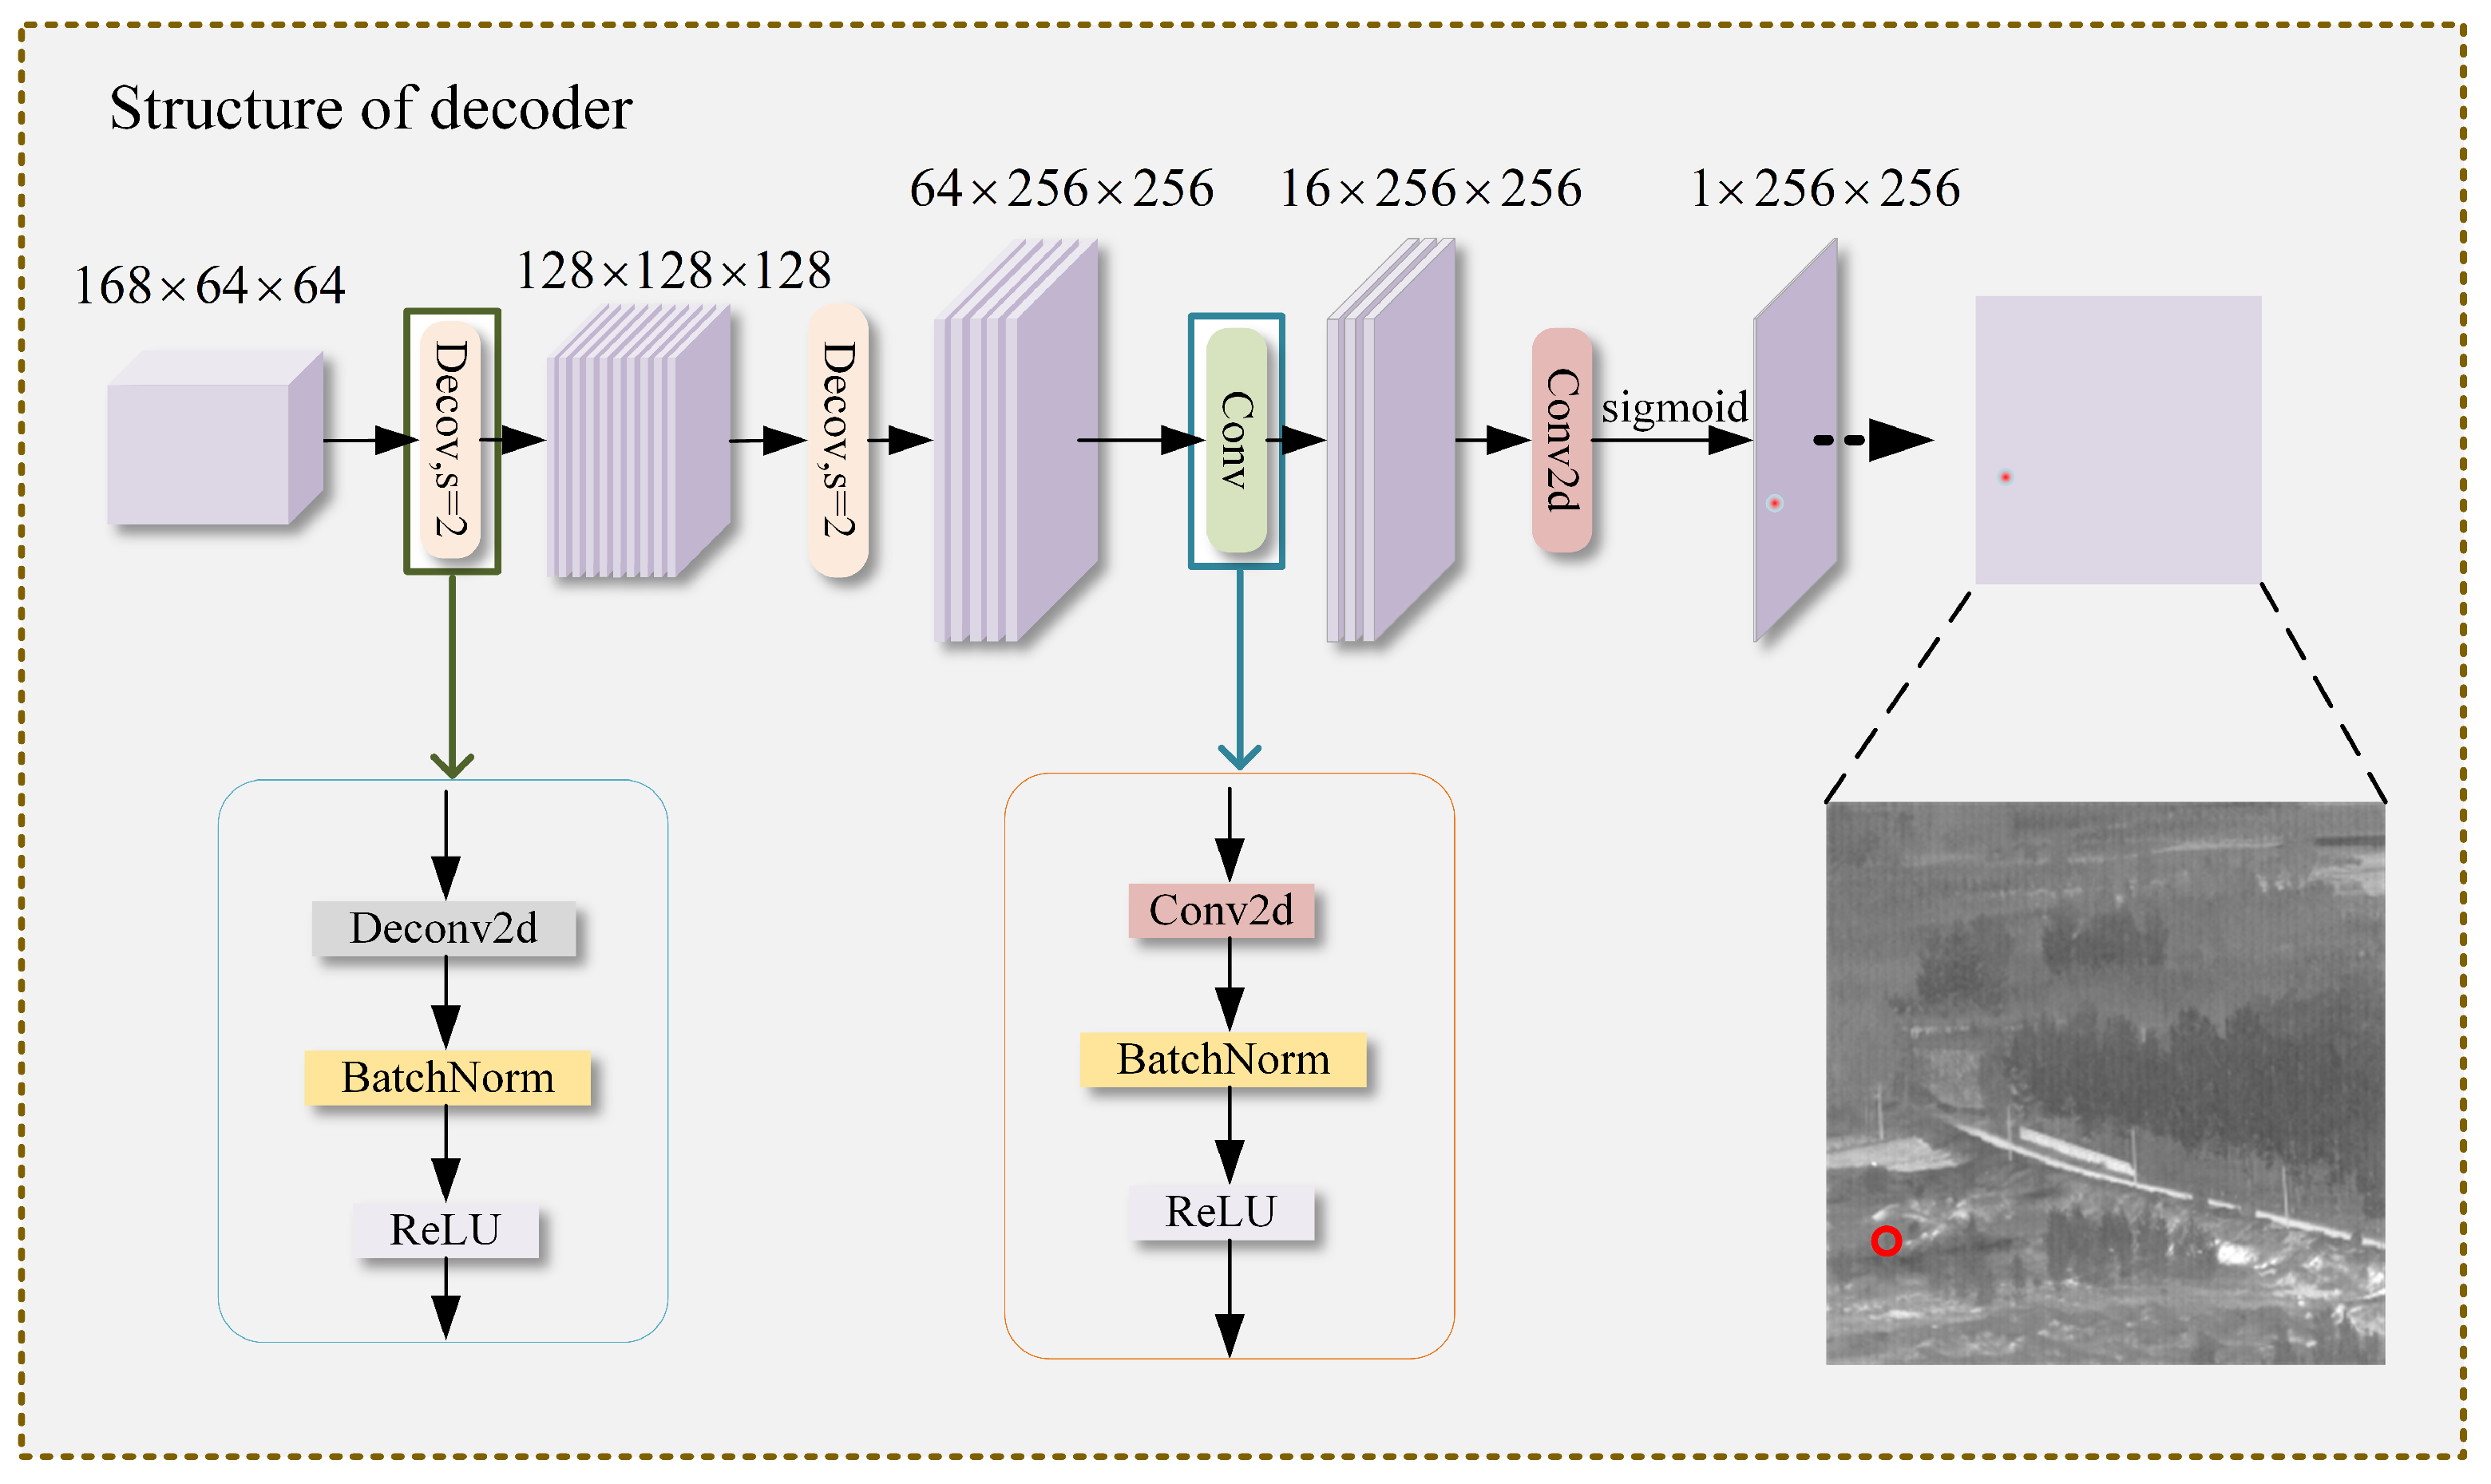
3.2.3. Decoding Module

The decoding network structure is shown in Figure 6. The input feature map first passes through two standard deconvolution layers with a step size of 2. Each standard deconvolution layer is composed of a two-dimensional deconvolution series batch normalization with a convolution kernel of 4. There is a unified layer and ReLU activation function, then the resolution of the feature map is restored to the same size as the input image resolution. Then the feature map goes through a standard convolution operation layer and a two-dimensional convolution to reduce the number of channels to 1, and finally passes through the sigmoid function to output a heat map with a value between 0 and 1. By decoding the heat map, the position coordinates of the small infrared target can be obtained.
Most infrared small target detection methods use datasets with segmentation binary masks as real labels. However, when the size of the target is too small, it is difficult to distinguish clear edges. At this time, it is very difficult to use segmentation binary masks for labeling. Only the center point can be used to mark the target. However, if only a binary mask is used to mark the center, and only the center point is 1 and the rest is 0, this will cause a serious problem of imbalance between positive and negative samples. In order to solve this problem, we use the two-dimensional Gaussian distribution to create the real labels of small infrared targets. Specifically, the real label can be constructed using the following formula:
g t ( m , n ) = exp 1 2 δ 2 m t x i 2 + n t y i 2
where δ is the standard deviation, i is the index label of the independent target, and t x i and t y i represent the x-coordinate and y-coordinate of the i-th target point. Using the two-dimensional Gaussian distribution to construct the ground truth label expands the non-zero part of the heatmap.

3.3. Loss Function

In the feature alignment module, in order to ensure the quality of alignment and guide the learning direction of the alignment module, we introduce a triplet loss without involving an attention mask as in [44], i.e.,
L t = i = 1 N 1 | f i f N | | f i f N |
where f i , f i are the feature map before and after alignment, and f N is the current feature map.
For infrared small targets, the area produced by the two-dimensional Gaussian expansion of the true label is still insufficient. In order to further balance the positive and negative samples, a mask loss is introduced to supervise the learning of the model, The mask matrix M is defined as follows:
M ( m , n ) = 1 , g t ( m , n ) > α 0 , else
where α is the probability threshold, and finally our loss function can be expressed by the following formula:
L h = p t g t 2 ( M + β ( 1 M ) )
where ⊙ means element-wise multiplication, and β in the formula is used to control the proportion of background areas in supervision. Since the number of negative samples of small infrared targets is much larger than the positive samples, the value of β will be set smaller to balance the positive and negative samples. The value of α should be set to a number slightly larger than 0 but not too large, to ensure that M accurately represents the real target area. In this paper, after some experiments, α was set to 0.2 and β was set to 0.3. The final total loss function can be written as
L = λ L t + L h
Since the value of L t is much larger than L h , in order to ensure the dominance of L h , we set λ to 0.01 to highlight the dominance of L h .

4. Experiments

4.1. Datasets

This paper used the real low-altitude scene infrared small target dataset [45] published by the National University of Defense Technology for training and testing the network. The typical wavelength range of this dataset is 3–5 µm, which belongs to the medium-wave infrared. There are 22 typical scenes, which mainly include a single target with a low-altitude complex background, targets moving from far to near, targets moving from near to far, the target leaving the field of view, the target returning to the field of view, etc. Most of the scenes in the dataset are ground backgrounds, including forests, rivers, buildings, etc. Each typical scene corresponds to a data sequence, with a total of 22 data sequences, 16,177 image frames, and 16,944 targets with labels. Each infrared image has a resolution of 256 × 256 pixels and a bit depth of 8 bits. Typical small target samples from the dataset are shown in Figure 7. The environmental background of the dataset and the signal-to-clutter ratio (SCR) information of the data are shown in Table 2. The definition of SCR is as follows:
S C R = γ t g γ i m g σ i m g
where γ t g is the brightness of the target area, γ i m g is the average brightness of the image, and σ i m g is the standard deviation of the image brightness.

4.2. Evaluation Metrics

This paper used five evaluation indicators [17,46] to evaluate the proposed method, including p r e c i s i o n , r e c a l l , F 1 score, detection rate P d , and false alarm rate F a . They are defined as follows:
P r e c i s i o n = T P T P + F P
R e c a l l = T P T P + F N
F 1 = 2 · P r e c i s i o n · R e c a l l P r e c i s i o n + R e c a l l
P d = R e c a l l
F a = 1 P r e c i s i o n
In the above formulas, T P represents the correct prediction, specifically referring to the number of predicted points within d pixels of the distance between the predicted point and the actual point. F P represents an incorrect prediction, specifically referring to the number of predicted points that do not have actual points within d pixels around the predicted point. F N represents the actual points that were missed, specifically referring to the number of actual points that have no predicted points within d pixels around the actual point. The value of d in this paper was set to 10. The p r e c i s i o n represents the ratio of the number of correctly predicted targets to the total number of predicted targets, the r e c a l l rate represents the ratio of the number of correctly predicted targets to the total number of real targets, and the F 1 score can comprehensively reflect the detection performance of the model.

4.3. Implementation Details

The method in this article was implemented using the PyTorch 1.10 deep learning framework. The computer platform was equipped with an Intel i7-6700 CPU and a NVIDIA GeForce GTX1080Ti GPU. The model was trained under the Ubuntu 20.04.2 LTS operating system environment. The settings during training included total training epochs of 100, using the Adam optimizer, where the batch size was 8. A dynamic learning rate strategy was sampled during training, with an initial learning rate of 0.0005. The learning rate was gradually reduced according to the cosine law within 66 epochs, and the final learning rate was 0.00025.

4.4. Experimental Results

4.4.1. Comparisons with Other Methods

In order to directly compare with the original results of the comparison methods, according to the different performance indicators, the method in this paper was tested on three groups and compared qualitatively and quantitatively with methods in other literature works. Data5, Data6, Data15, Data19, Data20, and Data22 in group 1 were used as the test set, and the rest were used as the training set. Data8 in group 2 was used as the test set, and Data2 and Data8 in group 3 were used as the test set. In group 1, the method in this paper was related to multi-scale patch-based contrast measurement (MPCM) [17], multi-scale relative local contrast measurement (RLCM) [46], spatiotemporal local contrast filter (STLCF) [18], and maximum filter, and compared with the four benchmark methods of median filter time fusion (MMTF) [47]. The performance indicators tested were detection rate and false alarm rate. The results are shown in Table 3. The bolded parts in the table indicate the best effect of rearrangement. It can be seen that, in terms of detection rate and false alarm rate, the detection performance of this method on six data segments was greatly improved compared to the three benchmark methods of MPCM, RLCM, and MMTF. Although the false alarm rate on data segment 20 was slightly higher than the benchmark method STLCF, the detection rate of this method was higher than STLCF, and the comprehensive detection performance was also better than STLCF.
In group 2, the method in this paper was compared with another method from the literature [48]. The performance indicators of the test were detection rate and false alarm rate. The results are shown in Table 4. The method proposed in this article was slightly better than the method from the literature [48]. At the same time, the false alarm rate of this method on data segment 8 was reduced by 13% compared with the other method, and the comprehensive detection performance F 1 score was 6.84% better than the other method.
In group 3, the method in this paper was compared with the method in [32]. The performance indicators of the test were accuracy, recall rate, and score. The results are shown in Table 5. On data segment 2 and data segment 8, the accuracy of this method and the P r e c i s i o n , R e c a l l , and F 1 score were all better than the method in [32].
The method in this paper was better than the traditional method in terms of real-time performance. A comparison of the inference speed with each method can be seen in Table 6. When the resolution of the input frame was 256 × 256 , the network inference time of this method was 0.0269, which can meet real-time requirements.

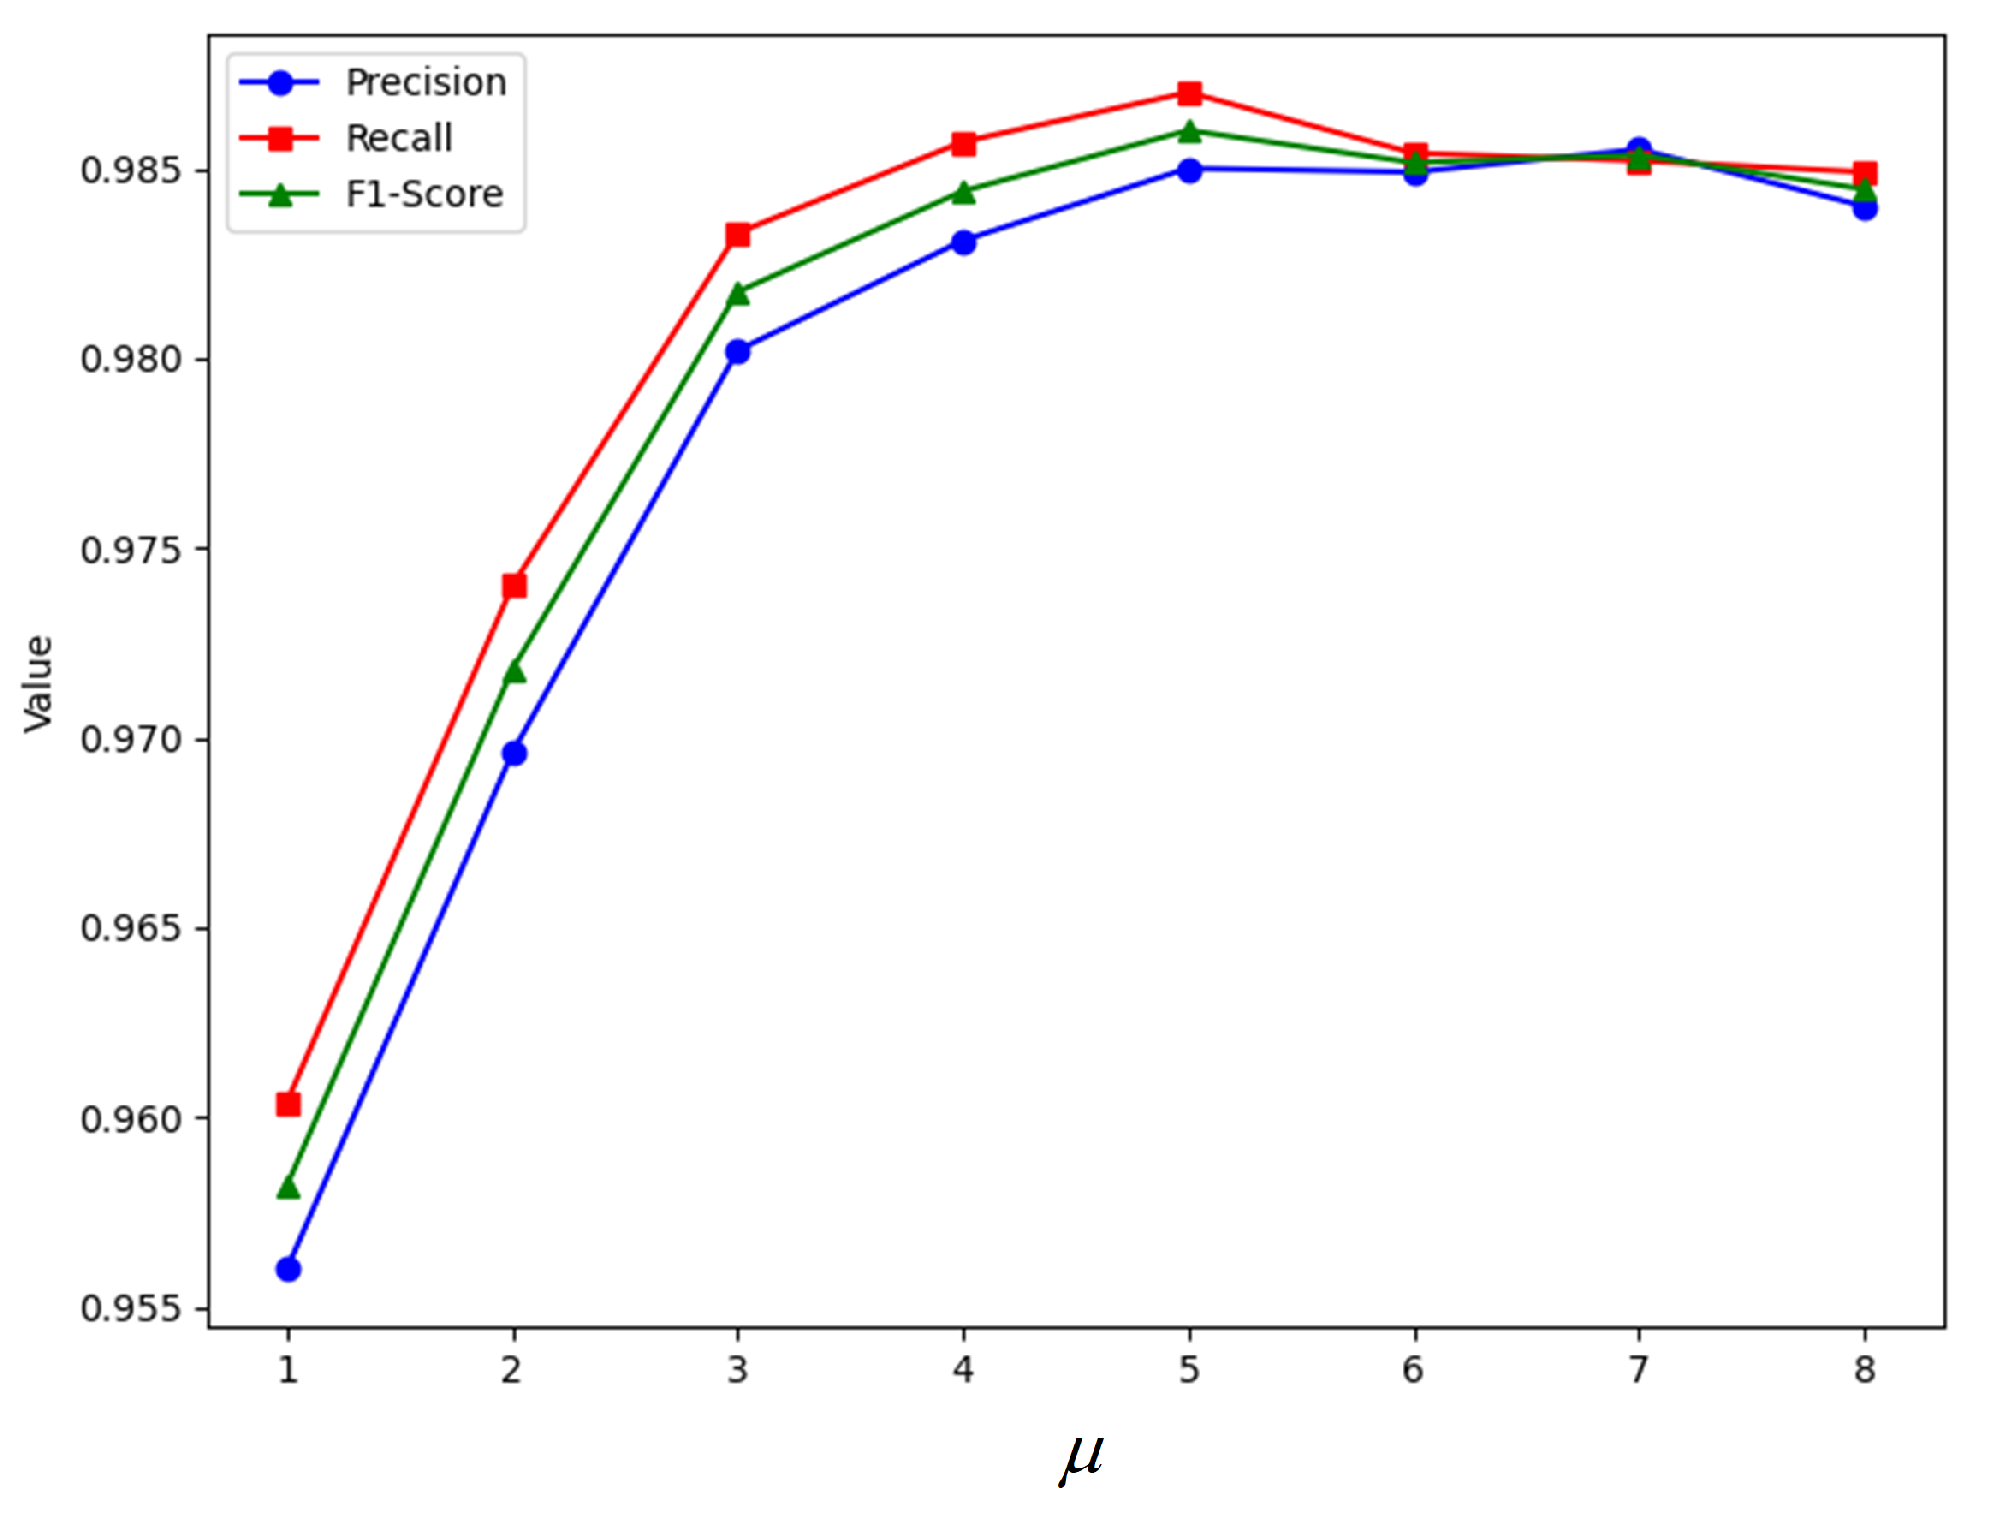
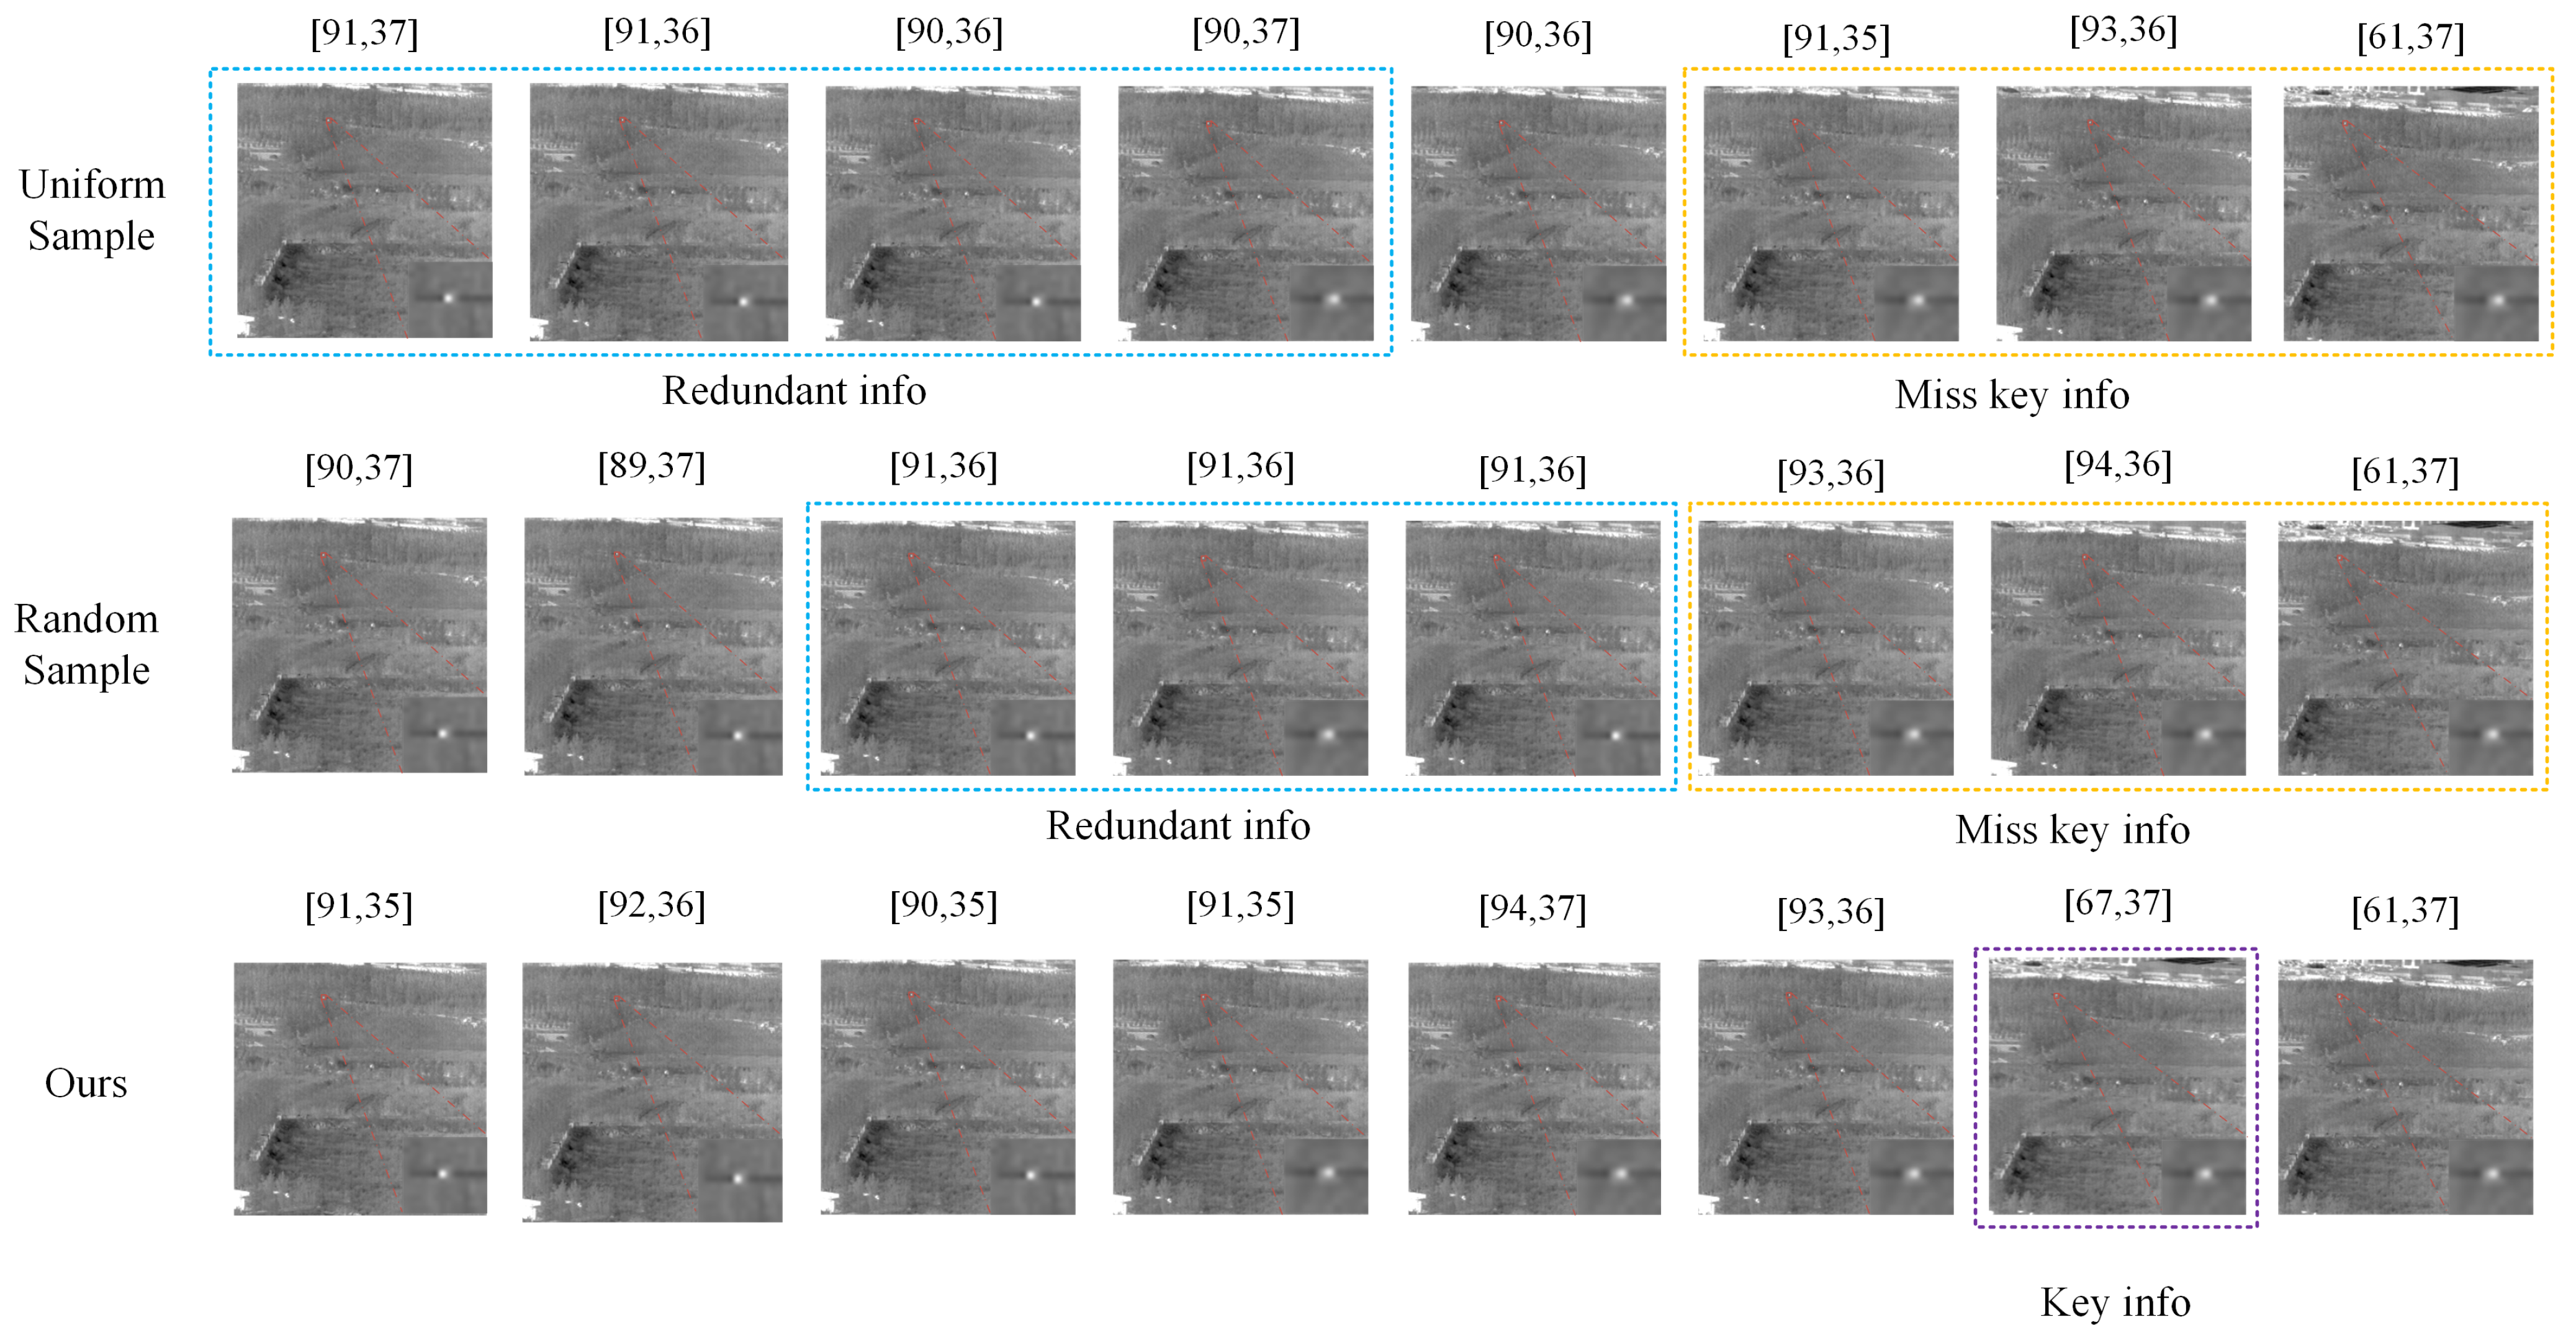
4.4.2. Ablation Experiment

We conducted ablation experiments to investigate the impact of the actual number of frames n input into the network and the total number of consecutive frames N used for frame sampling on the detection results. We obtained N by multiplying n by a positive integer μ , and the experiments were conducted on group 1. The impact of different actual input frame numbers n on detection performance is shown in the Table 7. According to Figure 8, the F 1 score of the model was the highest when μ was 5. Therefore the results in the table were all experimentally obtained under the condition that μ was 5. As n increased, the score of the model also increased slightly, but the Flops, model Parameters, and Inference Time of the model increased sharply, and the corresponding index score reflecting the accuracy of model detection only increased to a limited extent. Considering these factors comprehensively, this paper set the actual number of frames input to the network to 4.
The influence of μ on detection performance is shown in Figure 8. In the experiment, n was set to 4. It can be observed that the detection performance of the model increased with the increase in μ within a certain range. However, when μ exceeded 5, increasing μ not only failed to improve the detection performance but could even lead to a decrease. This is because introducing more frames can enrich the target’s motion information. However, when the time span of the introduced frames is too large, the continuity between the introduced frames and the frames to be detected becomes smaller, causing interference in the detection process.
In order to verify the effectiveness of the proposed adaptive frame sampling method and feature alignment detection network, this paper designed a series of ablation experiments. All ablation experiments were performed on group 1, n was set to 4 and μ was set to 5.
For the proposed frame sampling method, we conducted experiments on no sampling, random sampling, uniform sampling, and adaptive frame sampling, respectively. Sampling effect diagrams of the various sampling methods are shown in Figure 9, and the results are shown in Table 8. Under the same computational cost, using frame sampling can introduce more motion information, thereby enhancing the detection performance. At the same time, compared with fixed strategy sampling methods such as random sampling and uniform sampling, the adaptive frame sampling method proposed in this paper could sample more reasonably, making the sampled frame motion distribution more uniform.
For the proposed feature alignment module, in order to verify its effectiveness, ablation experiments were conducted on each component to verify its effectiveness. The experimental results are shown in Table 9. ✔ in the table indicates retaining the module in that column, and indicates removing the module. FAM (feature alignment module) is feature alignment module, which is explained in Section 3.2.1, and the experimental results show that each component in the proposed feature alignment module had a positive impact on the model performance.

5. Discussion

In this paper, we proposed an adaptive frame sampling method based on mutual information, to expand the input motion information of a multi-frame infrared small target detection model without increasing the computational complexity. At the same time, a multi-frame based infrared small target detection network was proposed that is aligned at the feature map level, and the feature maps are aligned by estimating the homography flow matrices. Experimental results demonstrated the effectiveness of our proposed method. Our proposed adaptive frame sampling method could sample more reasonably and make the sampled frame motion distribution more uniform. The proposed detection network containing a feature alignment module can be trained end-to-end, which enhances the robustness of the model. Our detection model could achieve an inference speed of 37 fps with a detection rate of 98% and a false alarm rate of 1% and a F 1 score of 98.5% on a NVIDIA 1080Ti GPU with 4 frames of input.

Author Contributions

Conceptualization, C.Y. and H.Z.; methodology, C.Y. and H.Z.; software, C.Y.; validation, C.Y.; formal analysis, C.Y. and H.Z.; investigation, C.Y. and H.Z.; resources, C.Y. and H.Z.; data curation, C.Y.; writing—original draft preparation, C.Y.; writing—review and editing, C.Y. and H.Z.; visualization, C.Y.; supervision, H.Z.; project administration, H.Z.; funding acquisition, H.Z. All authors have read and agreed to the published version of the manuscript.

Funding

This research was funded by the National Natural Science Foundation of China (NSFC) under Grant 62173143 and Grant 61973122.

Institutional Review Board Statement

Not applicable.

Informed Consent Statement

Not applicable.

Data Availability Statement

A publicly available dataset was analyzed in this study. These data can be found here: DSAT (accessed on 17 august 2020).

Conflicts of Interest

The authors declare no conflicts of interest.

References

  1. Gu, Y.; Wang, C.; Liu, B.; Zhang, Y. A kernel-based nonparametric regression method for clutter removal in infrared small-target detection applications. IEEE Geosci. Remote Sens. Lett. 2010, 7, 469–473. [Google Scholar] [CrossRef]
  2. Wang, X.; Peng, Z.; Kong, D.; He, Y. Infrared dim and small target detection based on stable multisubspace learning in heterogeneous scene. IEEE Trans. Geosci. Remote Sens. 2017, 55, 5481–5493. [Google Scholar] [CrossRef]
  3. Sun, X.; Liu, X.; Tang, Z.; Long, G.; Yu, Q. Real-time visual enhancement for infrared small dim targets in video. Infrared Phys. Technol. 2017, 83, 217–226. [Google Scholar] [CrossRef]
  4. Zhang, T.; Peng, Z.; Wu, H.; He, Y.; Li, C.; Yang, C. Infrared small target detection via self-regularized weighted sparse model. Neurocomputing 2021, 420, 124–148. [Google Scholar] [CrossRef]
  5. Song, Q.; Wang, Y.; Dai, K.; Bai, K. Single frame infrared image small target detection via patch similarity propagation based background estimation. Infrared Phys. Technol. 2020, 106, 103197. [Google Scholar] [CrossRef]
  6. Xue, W.; Qi, J.; Shao, G.; Xiao, Z.; Zhang, Y.; Zhong, P. Low-rank approximation and multiple sparse constraint modeling for infrared low-flying fixed-wing UAV detection. IEEE J. Sel. Top. Appl. Earth Obs. Remote Sens. 2021, 14, 4150–4166. [Google Scholar] [CrossRef]
  7. Zeng, M.; Li, J.; Peng, Z. The design of top-hat morphological filter and application to infrared target detection. Infrared Phys. Technol. 2006, 48, 67–76. [Google Scholar] [CrossRef]
  8. Lin, H.H.; Chuang, J.H.; Liu, T.L. Regularized background adaptation: A novel learning rate control scheme for Gaussian mixture modeling. IEEE Trans. Image Process. 2010, 20, 822–836. [Google Scholar] [PubMed]
  9. Guo, J.; Chen, G. Analysis of selection of structural element in mathematical morphology with application to infrared point target detection. In Proceedings of the Infrared Materials, Devices, and Applications, Beijing, China, 11–15 November 2007; SPIE: Bellingham, WA, USA, 2008; Volume 6835, pp. 178–185. [Google Scholar]
  10. Kerekes, R.; Kumar, B.V. Enhanced video-based target detection using multi-frame correlation filtering. IEEE Trans. Aerosp. Electron. Syst. 2009, 45, 289–307. [Google Scholar] [CrossRef]
  11. Lv, P.Y.; Sun, S.L.; Lin, C.Q.; Liu, G.R. Space moving target detection and tracking method in complex background. Infrared Phys. Technol. 2018, 91, 107–118. [Google Scholar] [CrossRef]
  12. Du, J.; Li, D.; Deng, Y.; Zhang, L.; Lu, H.; Hu, M.; Shen, X.; Liu, Z.; Ji, X. Multiple frames based infrared small target detection method using CNN. In Proceedings of the 2021 4th International Conference on Algorithms, Computing and Artificial Intelligence, Sanya, China, 22–24 December 2021; pp. 1–6. [Google Scholar]
  13. Du, J.; Lu, H.; Zhang, L.; Hu, M.; Chen, S.; Deng, Y.; Shen, X.; Zhang, Y. A spatial-temporal feature-based detection framework for infrared dim small target. IEEE Trans. Geosci. Remote Sens. 2021, 60, 3000412. [Google Scholar] [CrossRef]
  14. Li, D.; Mo, B.; Zhou, J. Boost infrared moving aircraft detection performance by using fast homography estimation and dual input object detection network. Infrared Phys. Technol. 2022, 123, 104182. [Google Scholar] [CrossRef]
  15. Gao, C.; Meng, D.; Yang, Y.; Wang, Y.; Zhou, X.; Hauptmann, A.G. Infrared patch-image model for small target detection in a single image. IEEE Trans. Image Process. 2013, 22, 4996–5009. [Google Scholar] [CrossRef] [PubMed]
  16. Han, J.; Ma, Y.; Zhou, B.; Fan, F.; Liang, K.; Fang, Y. A robust infrared small target detection algorithm based on human visual system. IEEE Geosci. Remote Sens. Lett. 2014, 11, 2168–2172. [Google Scholar]
  17. Wei, Y.; You, X.; Li, H. Multiscale patch-based contrast measure for small infrared target detection. Pattern Recognit. 2016, 58, 216–226. [Google Scholar] [CrossRef]
  18. Deng, H.; Sun, X.; Liu, M.; Ye, C.; Zhou, X. Infrared small-target detection using multiscale gray difference weighted image entropy. IEEE Trans. Aerosp. Electron. Syst. 2016, 52, 60–72. [Google Scholar] [CrossRef]
  19. Dai, Y.; Wu, Y.; Song, Y. Infrared small target and background separation via column-wise weighted robust principal component analysis. Infrared Phys. Technol. 2016, 77, 421–430. [Google Scholar] [CrossRef]
  20. Cui, Z.; Yang, J.; Jiang, S.; Wei, C. Target detection algorithm based on two layers human visual system. Algorithms 2015, 8, 541–551. [Google Scholar] [CrossRef]
  21. Liu, M.; Du, H.y.; Zhao, Y.j.; Dong, L.q.; Hui, M.; Wang, S. Image small target detection based on deep learning with SNR controlled sample generation. Curr. Trends Comput. Sci. Mech. Autom. 2017, 1, 211–220. [Google Scholar]
  22. Wang, H.; Shi, M.; Li, H. Infrared dim and small target detection based on two-stage U-skip context aggregation network with a missed-detection-and-false-alarm combination loss. Multimed. Tools Appl. 2020, 79, 35383–35404. [Google Scholar] [CrossRef]
  23. Wang, K.; Du, S.; Liu, C.; Cao, Z. Interior attention-aware network for infrared small target detection. IEEE Trans. Geosci. Remote Sens. 2022, 60, 5002013. [Google Scholar] [CrossRef]
  24. Li, B.; Xiao, C.; Wang, L.; Wang, Y.; Lin, Z.; Li, M.; An, W.; Guo, Y. Dense nested attention network for infrared small target detection. IEEE Trans. Image Process. 2022, 32, 1745–1758. [Google Scholar] [CrossRef] [PubMed]
  25. Qi, Y.; An, G. Infrared moving targets detection based on optical flow estimation. In Proceedings of the 2011 International Conference on Computer Science and Network Technology, Harbin, China, 24–26 December 2011; IEEE: Piscataway, NJ, USA, 2011; Volume 4, pp. 2452–2455. [Google Scholar]
  26. Lu, Y.; Huang, S.; Zhao, W. Sparse representation based infrared small target detection via an online-learned double sparse background dictionary. Infrared Phys. Technol. 2019, 99, 14–27. [Google Scholar] [CrossRef]
  27. Zhao, F.; Wang, T.; Shao, S.; Zhang, E.; Lin, G. Infrared moving small-target detection via spatiotemporal consistency of trajectory points. IEEE Geosci. Remote Sens. Lett. 2019, 17, 122–126. [Google Scholar] [CrossRef]
  28. Wang, G.; Tao, B.; Kong, X.; Peng, Z. Infrared small target detection using nonoverlapping patch spatial–temporal tensor factorization with capped nuclear norm regularization. IEEE Trans. Geosci. Remote Sens. 2021, 60, 5001417. [Google Scholar] [CrossRef]
  29. Kwan, C.; Gribben, D. Practical approaches to target detection in long range and low quality infrared videos. Signal Image Process. Int. J. (SIPIJ) 2021, 12, 1–16. [Google Scholar] [CrossRef]
  30. Kwan, C.; Gribben, D.; Budavari, B. Target Detection and Classification Performance Enhancement Using Superresolution Infrared Videos. Signal Image Process. Int. J. (SIPIJ) 2021, 12, 33–45. [Google Scholar] [CrossRef]
  31. Ying, X.; Wang, Y.; Wang, L.; Sheng, W.; Liu, L.; Lin, Z.; Zhou, S. Local motion and contrast priors driven deep network for infrared small target superresolution. IEEE J. Sel. Top. Appl. Earth Obs. Remote Sens. 2022, 15, 5480–5495. [Google Scholar] [CrossRef]
  32. Yao, S.; Zhu, Q.; Zhang, T.; Cui, W.; Yan, P. Infrared image small-target detection based on improved FCOS and spatio-temporal features. Electronics 2022, 11, 933. [Google Scholar] [CrossRef]
  33. Sun, J.; Wei, M.; Wang, J.; Zhu, M.; Lin, H.; Nie, H.; Deng, X. CenterADNet: Infrared Video Target Detection Based on Central Point Regression. Sensors 2024, 24, 1778. [Google Scholar] [CrossRef]
  34. Maes, F.; Collignon, A.; Vandermeulen, D.; Marchal, G.; Suetens, P. Multimodality image registration by maximization of mutual information. IEEE Trans. Med. Imaging 1997, 16, 187–198. [Google Scholar] [CrossRef] [PubMed]
  35. Zhi, Y.; Tong, Z.; Wang, L.; Wu, G. Mgsampler: An explainable sampling strategy for video action recognition. In Proceedings of the IEEE/CVF International Conference on Computer Vision, Montreal, BC, Canada, 11–17 October 2021; pp. 1513–1522. [Google Scholar]
  36. Howard, A.; Sandler, M.; Chu, G.; Chen, L.C.; Chen, B.; Tan, M.; Wang, W.; Zhu, Y.; Pang, R.; Vasudevan, V.; et al. Searching for mobilenetv3. In Proceedings of the IEEE/CVF International Conference on Computer Vision, Seoul, Republic of Korea, 27 October–2 November 2019; pp. 1314–1324. [Google Scholar]
  37. Andrew, G.; Menglong, Z. Efficient convolutional neural networks for mobile vision applications, mobilenets. arXiv 2017, arXiv:1704.04861. [Google Scholar]
  38. Huang, Z.; Wang, X.; Huang, L.; Huang, C.; Wei, Y.; Liu, W. Ccnet: Criss-cross attention for semantic segmentation. In Proceedings of the IEEE/CVF International Conference on Computer Vision, Seoul, Republic of Korea, 27 October–2 November 2019; pp. 603–612. [Google Scholar]
  39. Hu, J.; Shen, L.; Sun, G. Squeeze-and-excitation networks. In Proceedings of the IEEE Conference on Computer Vision and Pattern Recognition, Salt Lake City, UT, USA, 18–23 June 2018; pp. 7132–7141. [Google Scholar]
  40. Hong, M.; Lu, Y.; Ye, N.; Lin, C.; Zhao, Q.; Liu, S. Unsupervised homography estimation with coplanarity-aware gan. In Proceedings of the IEEE/CVF Conference on Computer Vision and Pattern Recognition, New Orleans, LA, USA, 21–24 June 2022; pp. 17663–17672. [Google Scholar]
  41. He, K.; Zhang, X.; Ren, S.; Sun, J. Deep residual learning for image recognition. In Proceedings of the IEEE Conference on Computer Vision and Pattern Recognition, Las Vegas, NV, USA, 27–30 June 2016; pp. 770–778. [Google Scholar]
  42. Hara, K.; Kataoka, H.; Satoh, Y. Learning spatio-temporal features with 3d residual networks for action recognition. In Proceedings of the IEEE International Conference on Computer Vision Workshops, Venice, Italy, 22–29 October 2017; pp. 3154–3160. [Google Scholar]
  43. Liu, Z.; Wang, L.; Wu, W.; Qian, C.; Lu, T. Tam: Temporal adaptive module for video recognition. In Proceedings of the IEEE/CVF International Conference on Computer Vision, Montreal, BC, Canada, 11–17 October 2021; pp. 13708–13718. [Google Scholar]
  44. Zhang, J.; Wang, C.; Liu, S.; Jia, L.; Ye, N.; Wang, J.; Zhou, J.; Sun, J. Content-aware unsupervised deep homography estimation. In Proceedings of the Computer Vision—ECCV 2020: 16th European Conference, Glasgow, UK, 23–28 August 2020; Part I 16. Springer: Berlin/Heidelberg, Germany, 2020; pp. 653–669. [Google Scholar]
  45. Hui, B.; Song, Z.; Fan, H.; Zhong, P.; Hu, W.; Zhang, X.; Ling, J.; Su, H.; Jin, W.; Zhang, Y.; et al. A dataset for infrared detection and tracking of dim-small aircraft targets under ground/air background. China Sci. Data 2020, 5, 291–302. [Google Scholar]
  46. Han, J.; Liang, K.; Zhou, B.; Zhu, X.; Zhao, J.; Zhao, L. Infrared small target detection utilizing the multiscale relative local contrast measure. IEEE Geosci. Remote Sens. Lett. 2018, 15, 612–616. [Google Scholar] [CrossRef]
  47. Gao, J.l.; Wen, C.l.; Bao, Z.j.; Liu, M.q. Detecting slowly moving infrared targets using temporal filtering and association strategy. Front. Inf. Technol. Electron. Eng. 2016, 17, 1176–1185. [Google Scholar] [CrossRef]
  48. Yan, P.; Yao, S.; Zhu, Q.; Zhang, T.; Cui, W. Real-time detection and tracking of infrared small targets based on grid fast density peaks searching and improved KCF. Infrared Phys. Technol. 2022, 123, 104181. [Google Scholar] [CrossRef]
Figure 1. Redundant continuous frame pictures.
Applsci 14 06360 g001
Figure 2. The process of adaptive frame sampling based on mutual information.
Applsci 14 06360 g002
Figure 3. The architecture of the detection network. This network consists of three parts, namely a feature extraction and alignment module, temporal feature fusion module, and decoding module.
Applsci 14 06360 g003
Figure 4. The framework of the feature alignment module.
Applsci 14 06360 g004
Figure 5. The framework of time feature fusion module.
Applsci 14 06360 g005
Figure 6. The framework of the decoder module.
Applsci 14 06360 g006
Figure 7. Typical small target examples.
Applsci 14 06360 g007
Figure 8. Performance under different μ .
Applsci 14 06360 g008
Figure 9. Sample eight frames from 40 continuous frames in data14.
Applsci 14 06360 g009
Table 1. Network structure of backbone network.
Input SizeOperatorExp SizeOutput ChannelsSENLStride
256 2 × 3 Conv2d,3-16-HS1
256 2 × 16 Bneck,31616TrueRE2
128 2 × 16 Bneck,37224FalseRE1
128 2 × 24 Bneck,38824FalseRE1
128 2 × 24 Bneck,59640TrueHS2
64 2 × 40 Bneck,524040TrueHS1
64 2 × 40 CCA-40---
Table 2. Scenarios of each data segment.
Data SegmentFramesAverage SCRSCR Variance
Data13999.720.033
Data25994.340.220
Data31002.170.908
Data43993.753.646
Data530005.451.285
Data63995.111.571
Data73996.3320.316
Data83996.070.159
Data93996.2917.086
Data104010.380.031
Data117452.882.148
Data1215005.202.226
Data137631.980.886
Data1414261.511.538
Data157513.420.965
Data164992.980.674
Data175001.090.353
Data185003.320.165
Data1915993.840.886
Data204003.011.485
Data215000.420.092
Data225002.200.150
Table 3. Test results of different methods for each data segment in group 1.
MethodData5Data6Data15Data19Data20Data22
P d (%) F a (%) P d (%) F a (%) P d (%) F a (%) P d (%) F a (%) P d (%) F a (%) P d (%) F a (%)
MPCM68.5847.9962.2552.3535.0531.9684.1625.3376.1138.2839.5434.49
RLCM69.564.7745.404.8839.504.5481.394.1281.904.1340.395.13
STLCF65.743.9273.593.9457.393.9560.833.8567.243.8782.703.91
MMTF33.264.1956.154.0247.844.0924.733.9540.123.9335.993.98
Ours99.80.33100099.64.7297.942.295.54.9796.60
Table 4. Test results of different methods for each data segment in group 2.
MethodData8
P d (%) F a (%) F 1 (%)
Yan et al. [48]98.1214.3591.46
Ours97.801.298.30
Table 5. Test results of different methods for each data segment in group 3.
MethodData2Data8
Precision (%) Recall (%) F 1 (%) Precision (%) Recall (%) F 1 (%)
Yao et al. [32]98.999.699.298.499.298.8
Ours99.399.599.410099.099.5
Table 6. Inference time and fps between our model and other methods.
MethodInput SizeInference Time (s)FPS
MPCM[256,256]0.52081.92
RLCM[256,256]4.16670.24
STLCF[256,256]1.35130.74
MMTF[256,256]0.63291.58
Yan et al. [48][256,256]0.059616.78
Yao et al. [32][256,256]0.028235.50
Ours[256,256]0.026937.14
Table 7. Quantitative results of ablation experiments with number of network input frames.
n F 1 (%)Flops (G)Parameters (M)Inference Time (s)
498.643.174.620.0269
898.984.326.780.0423
1699.0178.739.430.1153
Table 8. Quantitative results of ablation experiments with different sampling methods.
MethodPrecision (%)Recall (%) F 1 (%) P d (%) F a (%)
Without Sampling95.696.0495.8296.044.39
Random Sampling97.397.597.3997.52.72
Uniform Sampling97.497.797.597.72.61
Adaptive Sampling98.598.7498.6198.71.52
Table 9. Quantitative results of ablation experiments with components of FAM.
FAMFeature MinusTriplet LossPrecision (%)Recall (%) F 1 (%) P d (%) F a (%)
93.994.794.394.76.06
97.096.396.696.32.98
97.197.997.597.92.87
97.996.497.196.42.09
98.598.798.698.71.52
Disclaimer/Publisher’s Note: The statements, opinions and data contained in all publications are solely those of the individual author(s) and contributor(s) and not of MDPI and/or the editor(s). MDPI and/or the editor(s) disclaim responsibility for any injury to people or property resulting from any ideas, methods, instructions or products referred to in the content.

