Article

Study of the Vibration Isolation Properties of a Pneumatic Suspension System for the Seat of a Working Machine with Adjustable Stiffness

Department of Mechatronics and Armament, Faculty of Mechatronics and Mechanical Engineering, Kielce University of Technology, 25-314 Kielce, Poland
*
Author to whom correspondence should be addressed.
Appl. Sci. 2024, 14(14), 6318; https://doi.org/10.3390/app14146318
Submission received: 26 June 2024 / Revised: 17 July 2024 / Accepted: 18 July 2024 / Published: 19 July 2024

Abstract

:
This paper presents a study of the vibration isolation properties of pneumatic suspension systems for work machinery seats, with a particular focus on adjustable stiffness. It highlights the contribution that semi-active seat suspension systems make to vibration reduction, ultimately leading to improved passenger comfort levels and increased safety for vehicle users. The primary objectives of the research were twofold: firstly, to identify the key parameters of the apneumatic vibration isolation system; and secondly, to evaluate its performance in improving vibration damping. This entailed the development of a mathematical model that would foreground the movement through simulations based on different initial pressures, thus enabling the accurate prediction of real-life scenarios concerning the vibration-damping characteristics of the seating system, taking into account the different design options available for working machine technology applied at the test bed level, of which the pneumatic isolator is an integral component. In the cognitive process, the verification and validation of the formulated theoretical model play an important role. This approach enables the behaviour of the actual system to be inferred from the results of simulation studies, thus allowing the design of an appropriate vibration control system. By simulating different air bellow pressures, the characteristics of the seat suspension system can be assessed. This study provides valuable insights into optimising the vibration-damping capability of the air suspension system.

1. Introduction

The comfort and safety of work machinery operators are being improved by placing considerable emphasis on improving the vibration isolation properties of pneumatic seat suspension systems. Modelling studies shed light on the complex dynamics involved in mitigating the transmission of vibrations from the machine to the operator. This model limitation forms a key basis for the design optimisation process, enabling the simulation of various scenarios and adjustments to determine the most effective vibration isolation configurations [1]. The incorporation of mechatronics principles, in line with the discipline’s emphasis on the dynamics of physical systems, supports the development of sophisticated solutions that can adapt to and counteract these changing vibration forces. Through these collaborative efforts, research and development in pneumatic seat suspension systems can make significant progress in reducing operator fatigue and increasing overall productivity when operating work machinery [2].

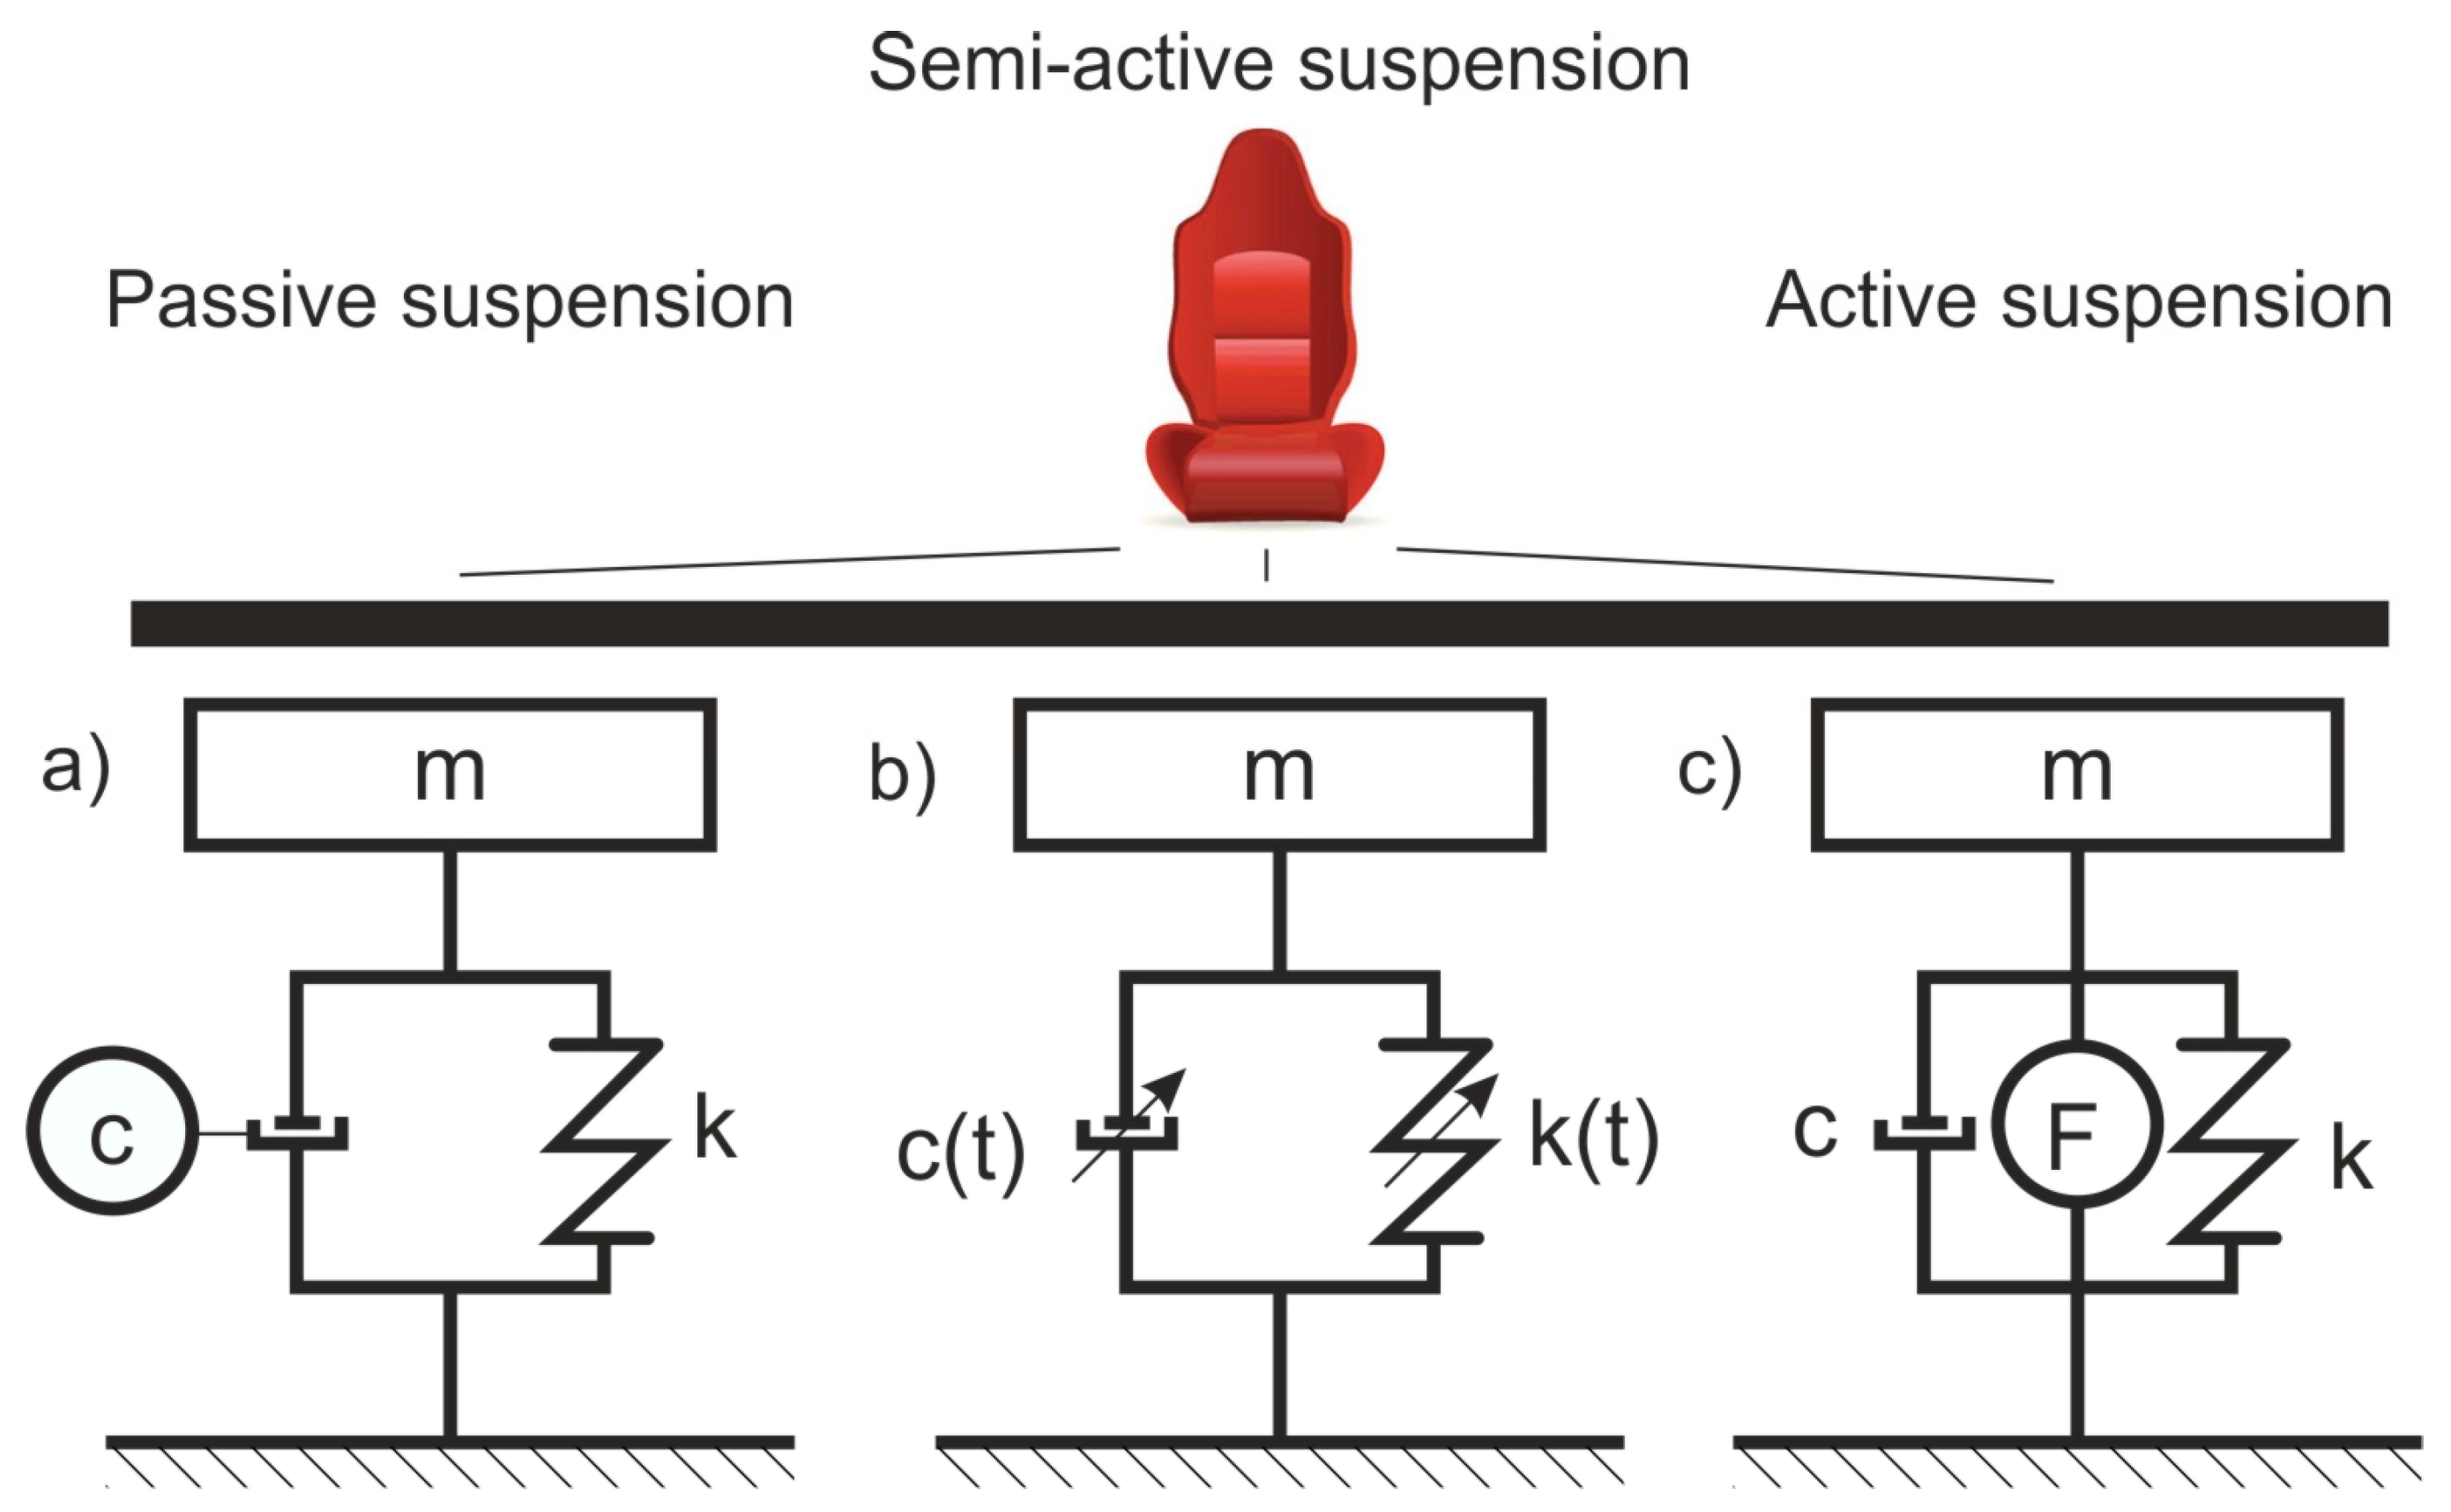
1.1. Suspension Types of Vehicle Driver Seats

One of the fundamental methods of mitigating the adverse effects of vibrations on machine and vehicle operators is the construction of seat suspensions with vibration-isolating properties [3,4]. These solutions can be classified as either passive or active vibration isolation. Passive vibration isolation utilises elements with linear elasticity (k) and non-linear damping (c), with constant characteristics (Figure 1).
In this type of suspension, the damping and stiffness coefficients are selected to align with the prevailing working conditions. In numerous designs, the operator is permitted to alter the damping coefficient (c) and stiffness according to their assessment of their weight and working conditions (Figure 1a). Effective damping can be achieved automatically or manually by setting a constant pressure (pneumatic spring) or tension in the magneto damper. Semi-active systems, which permit the damping and stiffness values to be varied over time, represent an extension of this method (Figure 1b).
The values of the damping coefficient c(t) and the stiffness k(t) vary continuously, allowing for measurement while the machine is exposed to vibrations caused by the condition of the road surface or by the vibrations themselves caused by its equipment. The active suspension system (Figure 1c) is equipped with an actuator that generates the force necessary to eliminate vibrations. A well-designed automatic control system for such a suspension continuously adapts to the current operating conditions of the working machine, as evidenced by the following references [5,6,7].
The semi-active suspension systems of driver seats in vehicles involve different technologies that enable the adjustment of comfort and stability. Types of semi-active suspensions include:
  • Semi-active damping allows the adjustment of damping to driving conditions, thus acting faster than traditional passive systems while enhancing vehicle comfort and handling;
  • An adaptive damping system that adjusts itself to changing road conditions for improved comfort and control—it can also respond to irregularities on the road surface;
  • Semi-active load-levelling, which maintains stability and vehicle height adjustment, especially while carrying heavy loads;
  • Semi-active suspension control that offers control over damping—improving ride comfort and road friendliness.
The aforementioned systems encompass electromagnetic, hydraulic and pneumatic systems [8]. In electromagnetic systems, the damping and stiffness of the suspension are controlled by electrical current, whereas in hydraulic systems, the suspension is regulated by pressurised fluids [9]. In contrast, pneumatic systems provide compressed air support, thereby enabling the necessary springiness and damping. Each system has its own set of advantages and disadvantages, and therefore factors such as cost, performance and reliability must be considered when deciding which system to use.

1.2. Functionality of Semi-Active Suspension Systems

Semi-active seat suspension systems play a pivotal role in reducing vibrations and enhancing ride comfort in vehicles. Semi-active seat suspension systems are employed in contemporary automobiles to reduce vibrations and enhance ride comfort. For instance, the latest generation of vehicles is anticipated to offer elevated levels of ride comfort, expansive interiors, effective soundproofing, innovative seating arrangements, and optional semi-active seat suspension systems. The utilisation of semi-active seat suspension systems confers a plethora of advantages, including enhanced driving comfort and diminished vibration [10,11]. The mechanism utilised in these systems enables the seat suspension to be dynamically modified during operation, responding directly to the immediate external conditions, including but not limited to road quality and vehicle speed. This entails adjusting the seat in a manner that mitigates the impact of shock and vibration, thereby enhancing the comfort of the journey for those occupying the vehicle. Furthermore, in the event of an emergency in which the vehicle must stop or turn abruptly, the adjustments made to the suspension ensure stability (and consequently safety) for all passengers in the various scenarios in which such a situation occurs. The principal advantage of such systems is their capacity to adapt to diverse road and road surface conditions. They are capable of automatically selecting the optimal level of damping without the need for driver intervention, based on the information provided by available sensors [12]. A pertinent illustration of this phenomenon is the suspension adjustment when traversing a rough road. This adjustment serves to mitigate the transmission of shocks and vibrations to each passenger, thereby preventing the perception of each bump in the road. Conversely, modifying the suspension when driving on a smooth motorway can provide greater stability, thereby enhancing the safety of passengers.
The technology of a semi-active seat suspension system is based on sensors that are integrated into both the seat and the suspension system. The two components work in conjunction with one another, continuously monitoring the condition of the road surface and the vehicle’s movement [13]. This enables the system to communicate effectively to make real-time adjustments to the suspension system for optimum support. Consequently, the system is capable of reacting promptly to alterations in road conditions, thereby ensuring a comfortable and secure journey for drivers. In addition to enhancing driving comfort and safety, semi-active seat suspension systems can also have a beneficial impact on the health and well-being of drivers and passengers. Long-term exposure to vibration and shock while driving can result in some health problems [14]. When driving on a smooth road, the suspension can be adjusted to provide a more stable ride, better support, and reduced lateral movement. Furthermore, semi-active seat suspension systems can also enhance vehicle handling and stability, particularly at high speeds or during cornering [15].
Individuals engaged in occupational activities requiring a seated posture, such as driving, operating machinery and construction site work, and tractor driving, are exposed to general vibration. This vibration is transmitted to the body from the ground via the pelvis and back. Those exposed to vibration experience disturbances of the nervous system, including decreased concentration and increased reaction time, sensory disturbances and lesions of the locomotor organs. Particularly adverse changes in the human body are caused by the resonant vibrations of internal organs [16]. The range of these frequencies depends on the individual’s physique and position (sitting, standing) and ranges from 2 to 12 Hz for internal organs and the thorax. The resonant frequencies for the head are in the range of 20 to 30 Hz, while those for the visual organs are 60 to 90 Hz. As knowledge and technology advance, cab seats for operators and drivers are being developed to limit transmitted vibration frequencies to the lowest possible range (below 20 Hz). Despite this, vibration syndrome remains a significant contributor to the overall incidence of occupational diseases, with research indicating that the use of newer suspension technologies for both machines and vehicle operators’ work seats can help to prevent these effects [17,18,19].
The objective of semi-active seat suspension systems is to enhance ride comfort by combining the features of passive and active systems. In contrast to passive systems, which rely primarily on springs and dampers, and active systems that utilise sensors and actuators to continuously adjust the suspension, semi-active systems facilitate straightforward control of the vehicle. These systems provide an enjoyable driving experience while simultaneously affording the driver control over the stability of the vehicle. This represents the optimal solution, offering the best of both worlds: comfort and control. Consequently, semi-active suspensions are commonly employed in contemporary vehicles. Furthermore, these systems facilitate reductions in vehicle vibration, which contributes to a more comfortable journey. Vibrations can be generated as a result of the unevenness of the road and the operation of the engine and gearbox combined with the dynamics of the tyres. These vibrations are not only displeasing to the passengers but also damaging to their health. Nevertheless, semi-active seat suspension systems enable a vehicle to adapt to varying frequencies and amplitudes, thereby adaptively enabling the dissipation of vibrations. The detection of vibrations and the subsequent adjustment of the seat suspension following these findings ensures a comfortable ride and avoids the negative effects of prolonged exposure to vibrations. The utilisation of semi-active seat suspension systems has been identified as a pivotal factor in the evolution of modern vehicles [20].
In recent times, vehicle manufacturers have placed a greater emphasis than ever before on two key aspects of driving: safety and comfort. The two most commonly utilised technologies in semi-active seat suspension systems are magneto-rheological and electromagnetic dampers [21]. Magneto-rheological dampers regulate the damping force by employing magnetic fields to alter the viscosity of the fluid, thereby enabling the suspension system to swiftly adapt to varying road conditions. Semi-active seat suspension systems have been lauded for their capacity to adapt to diverse driving styles and preferences. Some drivers may opt for a stiffer suspension to enhance the road feel, whereas others may select a softer suspension to better absorb bumps and potholes. Nevertheless, semi-active systems permit the seat suspension to be calibrated to align with drivers’ disparate preferences, thereby offering flexibility to personalise the driving experience without compromising on quality and safety [22].
In addition, semi-active seat suspension systems are capable of alleviating driver fatigue, a further benefit of their use. Long periods of driving can result in discomfort and fatigue due to the vibrations and shocks caused by a non-level road surface. Nevertheless, by reducing these vibrations and providing a more comfortable ride, semi-active seat suspension systems can assist in maintaining the driver’s alertness and focus. This can then result in a markedly enhanced driving experience for all, particularly for professional drivers who are required to spend extended periods behind the wheel. Furthermore, semi-active seat suspension systems have been empirically demonstrated to enhance safety [23]. By reducing vibration, these systems make it more difficult for factors that could lead the driver to lose control of the vehicle or prevent a rapid response in emergencies due to discomfort. It must be acknowledged, however, that equipping cars with semi-active seat suspensions may involve higher costs compared to installing passive systems. Furthermore, the use of intelligent sensors and control units for adjustment complicates vehicle design. Nevertheless, despite these potential drawbacks, which could act as a deterrent to manufacturers’ preference for semi-active seating, it still offers a superior level of comfort and safety compared to passive seating.
This paper presents a study of the vibration isolation properties of a vehicle driver’s seat pneumatic suspension system, where an air isolator in the form of a pneumatic bellows is an integral part of the system. Pneumatic bellows are crucial components of the entire suspension system. They are the ones that cushion the forces acting on the machine or vehicle operator, stopping most of them and not transferring them further to the driver’s seat. This type of driver’s seat suspension is a type of damping and spring system. They are a kind of ‘cushion’ into which compressed nitrogen or air is pumped using a compressor. As a result, the inflated bellows successfully cushion vibrations and shocks when driving over bumps. Pneumatic spring elements allow the vibration damping to be adapted to the load. Thanks to a valve, the air pressure can be adjusted to an appropriate level independent of the loads caused by road irregularities. A crucial role is played by the pneumatic bellows used in vehicle seat suspension systems to ensure comfort and stability while driving. Pneumatic bellows also allow the seat height to be adjusted about the vehicle chassis, allowing the seat position to be adapted to the driver’s or passenger’s requirements.

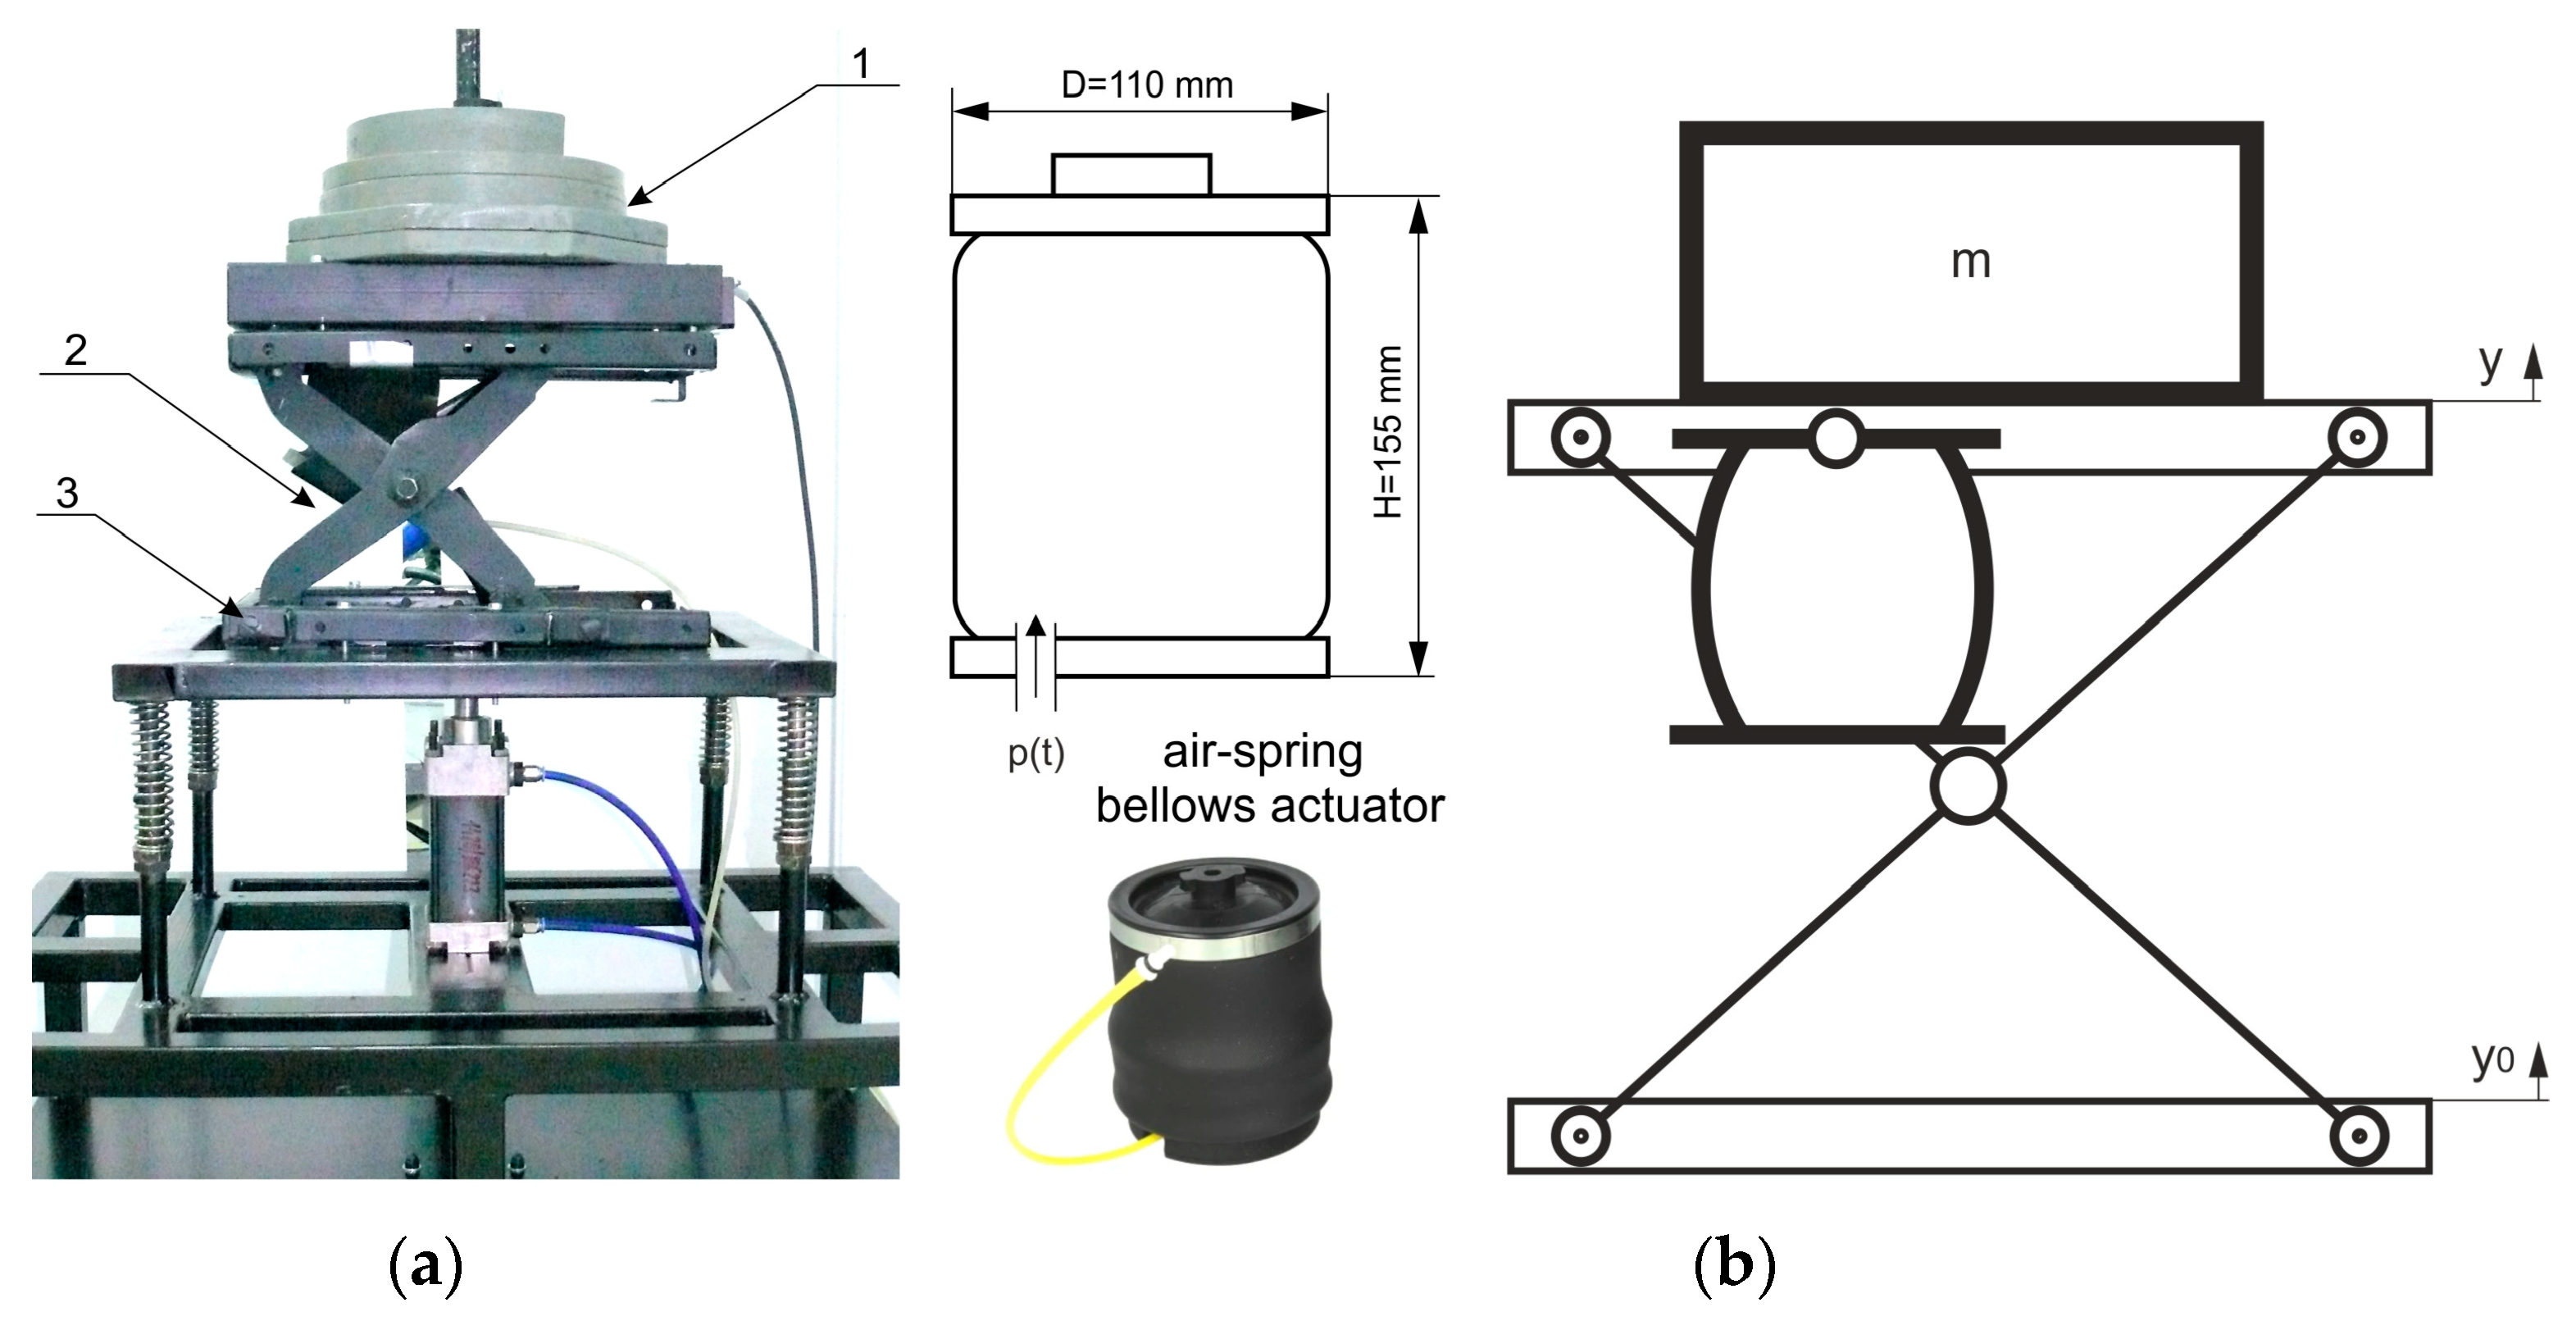
2. Test Stand Description

Figure 2 illustrates the experimental test stand for the vibration isolation properties of the working machine seat.
The pneumatic isolator was constructed from a double-articulated quadrilateral frame to which the machine operator’s seat was ultimately attached [24]. The basic element of the stand is the vibration isolator seat base of the working machine (2), which is of a scissor-type design with a mounted pneumatic bellows actuator. Its lower part is attached to the vibrating platform (3), while the upper part allows the mass load (1) to be mounted. The vibrating table is driven by a pneumatic cylinder, which is controlled by a proportional Festo pneumatic straight-run servo-valve MPYE-5-1/8-HF-010-B. This design allows vertical displacements in the range of 0–220 mm at frequencies of up to 5 Hz. The passive and semi-active damping element in the system is a pneumatic bellow actuator ISRI with dimensions of D = 110 mm and H = 155 mm. This component is fitted as standard to the suspension of the driver’s seat as part of the shock absorber for the VOLVO and SCANIA seats (IRSI, https://isri.eu/). For the non-contact measurement of the relative displacement of the seat, the stand was equipped with a triangulating laser transducer from Baumer Electric’s OADM series (Frauenfeld, Switzerland). The control element for the bellows actuator is a pressure-proportional valve from SMC, type VEP3121-2 (Tokyo, Japan). The workstation also includes a computer in a master control system equipped with control software. The direct control computer is equipped with PCI-DAS1602/16 converter cards from Measurement Computing Corporation (Norton, MA, USA). The cards together with the position transducers form a measurement system. The tests on the test bench were carried out by generating displacements of the vibrating platform (3) with step and harmonic waveforms. Following these displacements, the displacement values of the mass-loaded suspension system (1) can be measured.

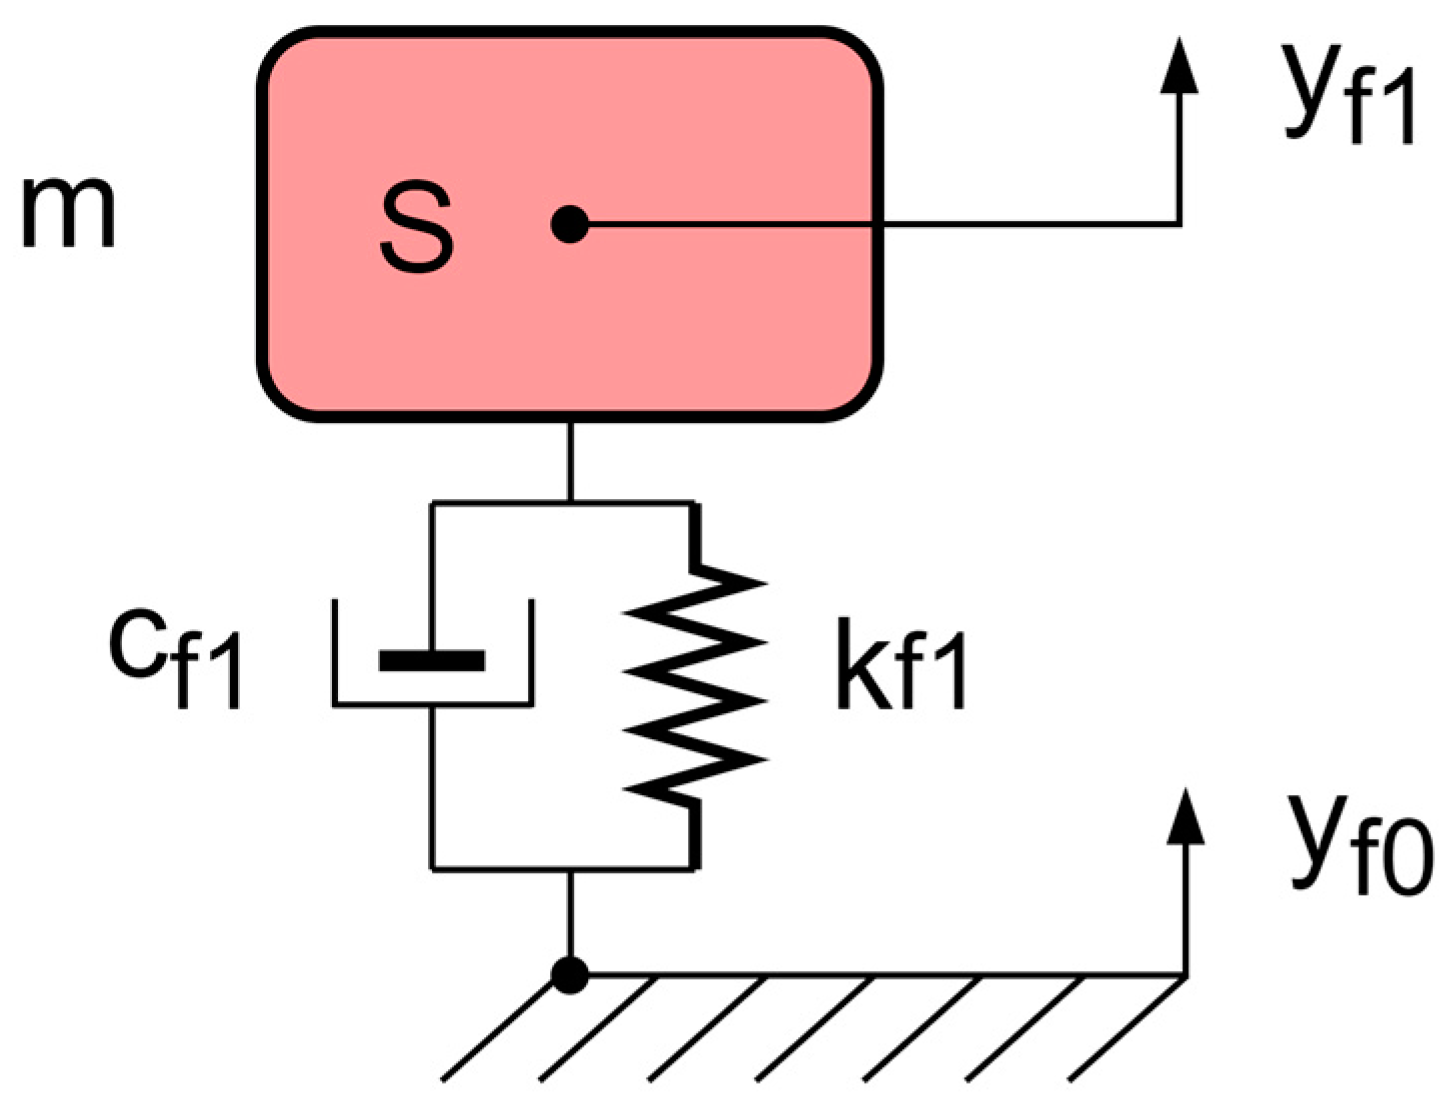
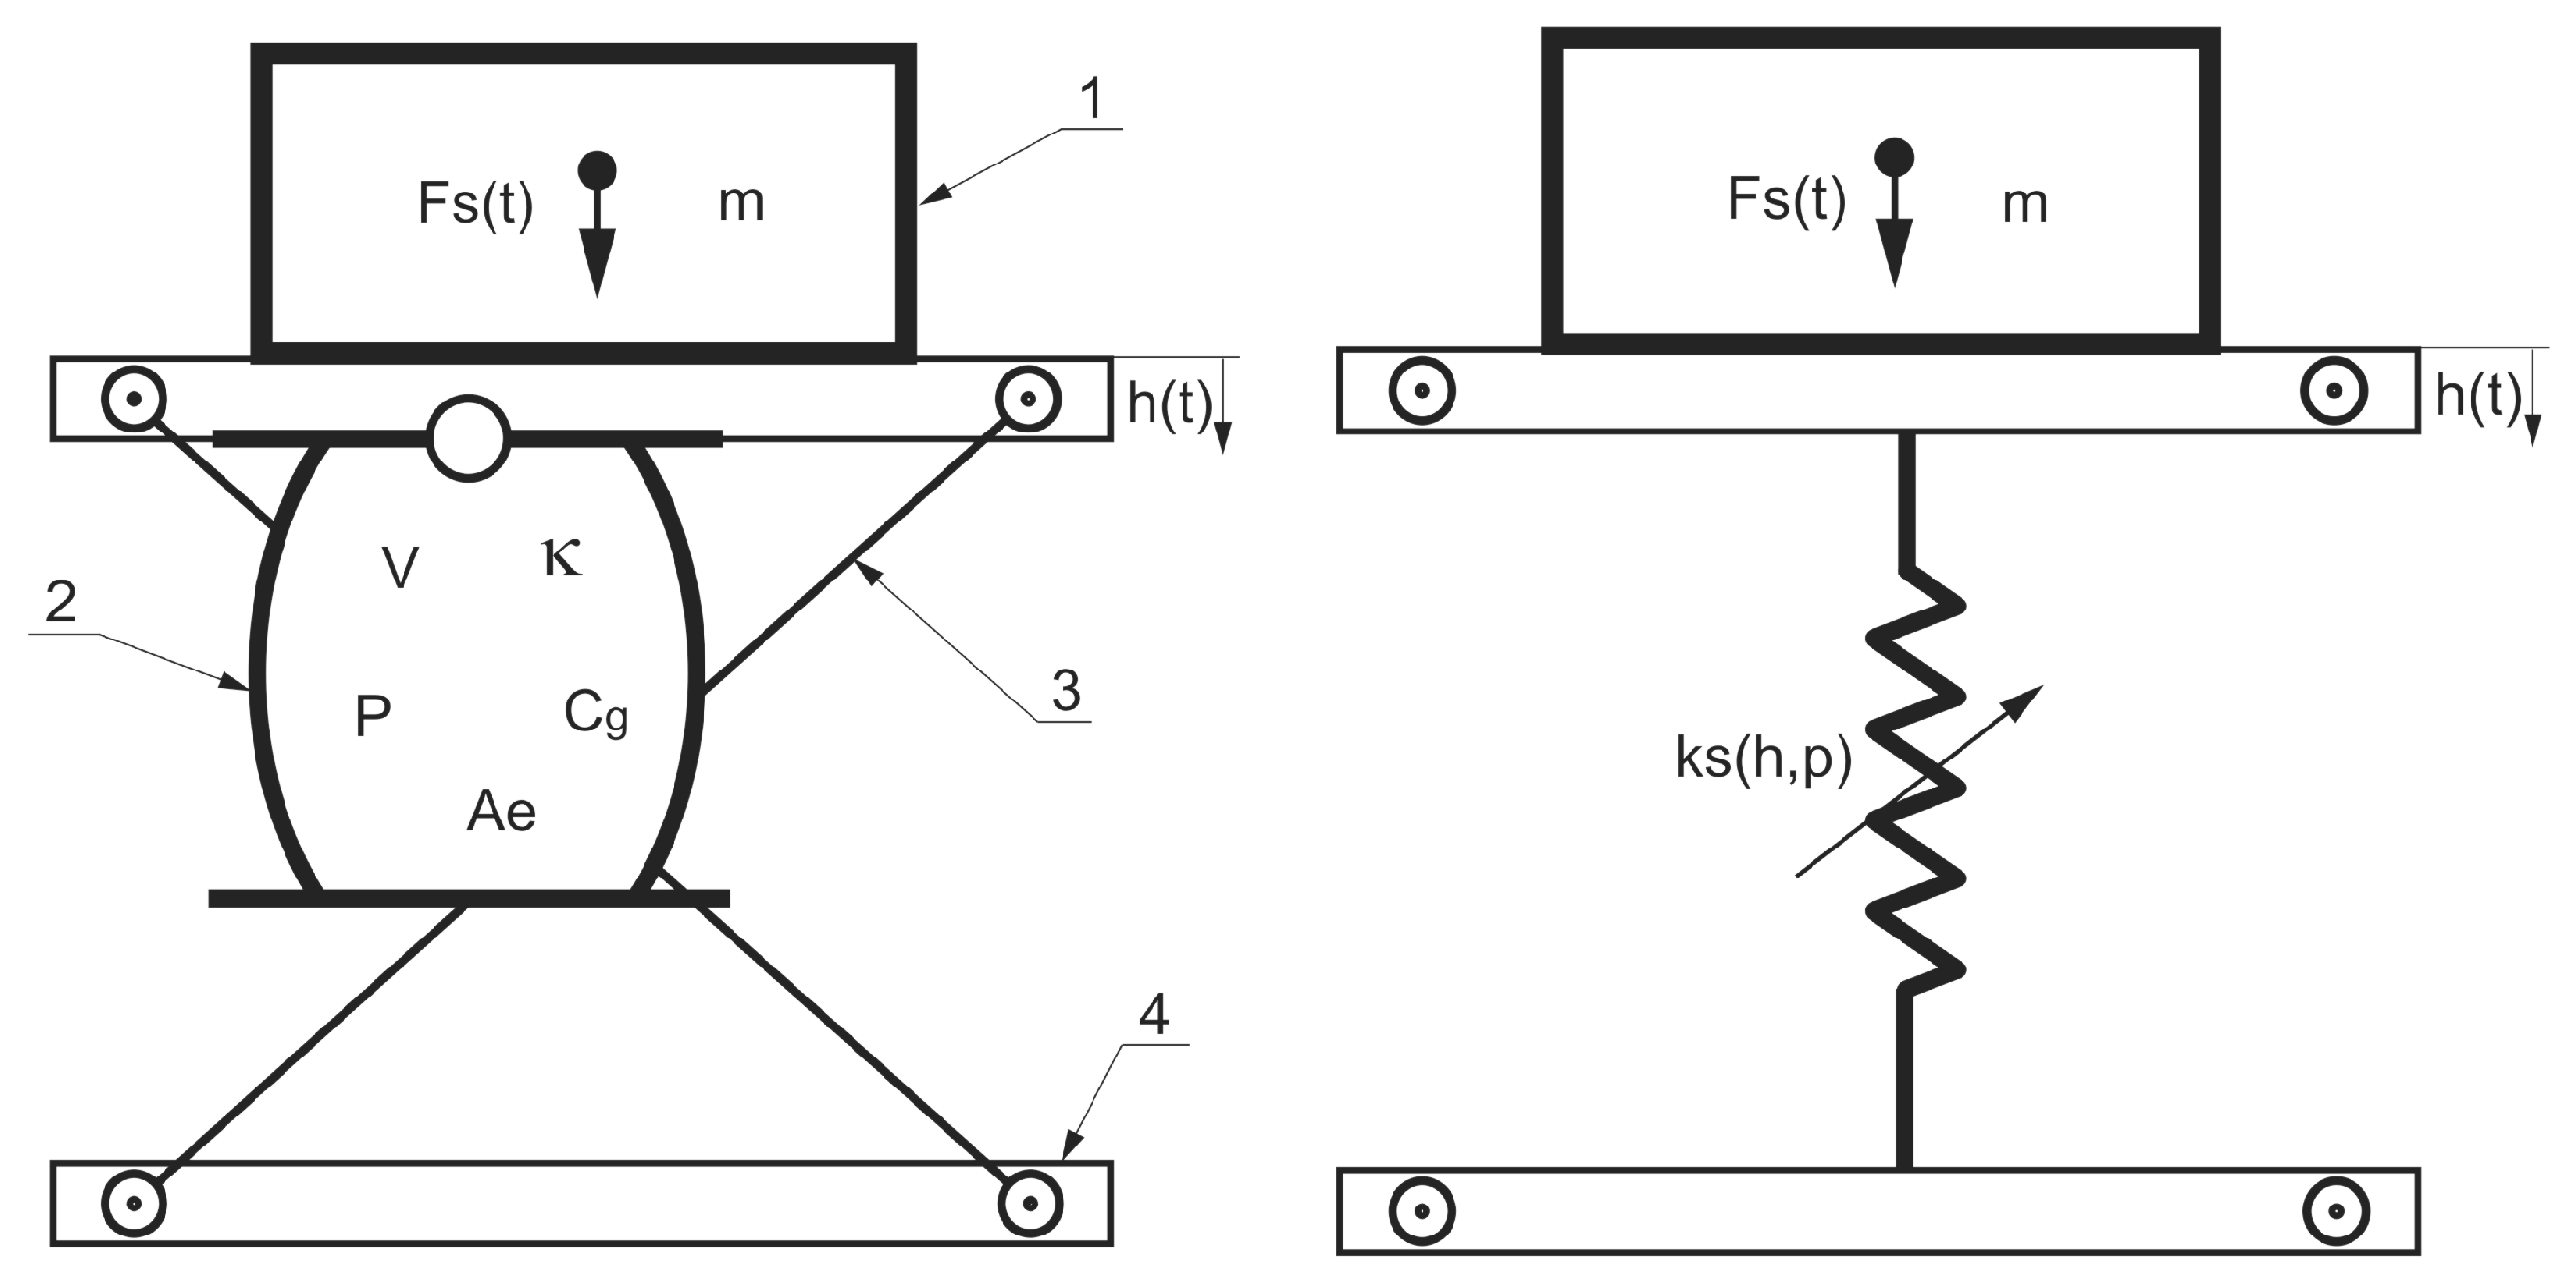
3. Physical and Mathematical Model of a Single-Degree-of-Freedom Seat Suspension

The operation of work machinery and vehicles necessitates the involvement of a human being, who serves as a subordinate decision-making element. The movement of the system is contingent upon the individual’s behavioural responses, assessment of prevailing conditions, dexterity in performing manipulative actions and speed in making the appropriate decisions. Consequently, the introduction of an adequate vibration isolation system is intended to enhance human comfort and safety.
The parametric estimation of the suspension characteristics of the seat, as illustrated in Figure 2, has led to the formulation of a physical model with one degree of freedom, as depicted in Figure 3. This model is deemed appropriate for the test bench structure. Consequently, the human anthropo-dynamic model has been reduced to a concentrated mass, mc. The fundamental motion of the human with the seat is closely related to the fundamental motion of the carrier.
The seat on which the human sits is modelled as a concentrated mass m f of a passive deformable element in the form of a rheological Voigt–Kelvin model with the parameters k f 1 and c f 1 , where k f 1 is the stiffness coefficient and c f 1 is the damping coefficient. The mass of the human–seat system is:
m = m c + m f
The human mass was assumed based on the parameters defined by S. Rakhej in his publication [25]. A diagram of the physical model is shown in Figure 3.
The number of degrees of freedom resulting from the formulated structure of the model of a human sitting on a chair describing the perturbation of the fundamental motion in the vertical plane is one. A single independent generalised coordinate, y f 1 , is used to determine the vertical displacement of the concentrated mass, m, at any instant in time. The force acting on the seat suspension base from the carrier side is determined by the coordinate y f 0 .
The mathematical model is a discrete, physically non-linear, determined, time-varying, dissipative and non-cooperative system. The equation of motion of the human–physical system is as follows:
m y ¨ f 1 + c f 1 y ˙ f 1 + k f 1 ( y f 1 + y f 1 s t ) = c f 1 y ˙ f 0 + k f 1 y f 0 m g
where y f 1 s t —static displacement of an inertial element, g—the acceleration of gravity.
The equilibrium equation is as follows:
k f 1 y f 1 s t + m g = 0
Equation (2) is the mathematical model describing the motion of the physical system shown in Figure 3. In this equation, there is a component mg on the right-hand side representing the weight of the passive deformable element in the form of a Voigt–Kelvin rheological model. Consequently, the static displacement y f 1 s t of the mass m, obtained from the equilibrium Equation (3), must be included in the equation of motion (2). Without the y f 1 s t component in Equation (2), the system model would be excited to oscillate even before the introduction of the force. The mass m is placed on the seat during the experimental tests and does not move. Only introducing an external force—in the model, these are the components y f 0 and y ˙ f 0 —causes the system to move. Therefore, y f 1 is the displacement of the mass m relative to the static displacement y f 1 s t .
The frequency of free vibration is as follows:
ω = ω 0 2 δ 2
where:
ω 0 = k f 1 m ,   δ = c f 1 2 m .
Parameters of the model: m f = 8.0   k g , m c = 69.6   k g , g = 9.81   m / s 2 .
A mathematical model of the forcing mechanism is presented:
y f 0 = A w π a r c t g t t H 1 A H τ a r c t g t t H 2 A H τ
y ˙ f 0 = A H τ A w π 1 A H 2 τ 2 + t t H 1 2 1 A H 2 τ 2 + t t H 2 2
where:
A w —amplitude of the forcing;
A H —aspect ratio;
t H 1 , t H 2 —times for which velocity reaches an extreme;
τ —duration of the extortion.
A physical and mathematical model with two degrees of freedom was also formulated. It is presented in Appendix A.

Results of the Theoretical and Experimental Analysis

A model of the forcing acting on the seat suspension base, y f 0 , y ˙ f 0 , was developed based on the actual forcing characteristics (Figure 4a).
The shape of the forcing was chosen to have a significant negative impact on operator comfort and not to be susceptible to passive vibration. Given the above assumptions, the forcing shown in Figure 4 was selected for analysis. The shape of the developed forcing model slightly deviates from the actual forcing obtained during experimental testing. The responses of the system to the specified forcing obtained during numerical simulation correspond with sufficient accuracy to the responses of the real system. Therefore, it can be assumed that the behaviour of the virtual model corresponds to the real system. The parameters of the mathematical forcing model are presented in Table 1. The full list of simulation parameters is provided in Appendix B Table A3.
The objective of the considerations carried out and planned in this work is the possibility of automatically selecting the initial value of the bellows pressure depending on the weight of the operator. Ultimately, consideration is being given to the possibility of automatically measuring the weight of the operator sitting on the seat and, on this basis, setting the most appropriate pressure value by the installed system. Therefore, additional mass values are introduced later in the article, for which calculations are also carried out. This is very important to ensure the comfort of the operator with a certain weight.
The course of variability in the time function of the displacement of the human mass with the seat against a given forcing for the initial values of p = [4.0, 4.5, 5.0, 5.5] bar was obtained following the numerical simulation of the movement of the formulated theoretical model. A comparison of the results obtained from the motion simulation of the formulated model with those obtained from the experimental tests of the actual system is presented in Figure 5 and Figure 6. The results obtained from the initial pressure values of p = 4.0 bar and p = 4.5 bar are presented in Figure 5.
Figure 6 illustrates the outcomes of the experiment conducted with initial pressure values of p = 5.0 bar and p = 5.5 bar.
To compare how the system processes displacement signals at different frequencies for the simulation experiment with the real one, frequency characteristics are presented (Figure 7 and Figure 8). The data obtained allow the graphs to be analysed for changes in amplitude as a function of frequency. In contrast, the logarithmic characteristics show changes in the low band (1–15 Hz), where the signal amplitude is significantly attenuated.
An estimation of the seat suspension parameters was conducted for initial pressures of 4.0 bar, 4.5 bar, 5.0 bar and 5.5 bar. Table 2 presents a summary of the standard deviation δ y f 1 y f 0 of the variation of relative displacement as a function of time for selected pressures in the pneumatic bellows.
From the value determined from the approximation of the standard deviation of the displacement of the inertial element as a function of pressure, it can be inferred that the error made is of the order of 9.4%. An additional method of assessing the quality of the performed estimation is to compare the course of the displacement variation as a function of time obtained from the performed motion simulation of the formulated model (Figure 5 and Figure 7) with the result obtained from the experimental tests of the real system.
The course of the variation in stiffness values as a function of pressure for characteristic moments is illustrated in Figure 9.
The course of the variation in the damping value as a function of time for the initial pressure values of p = {3.75, 4.0, 4.3, 4.5, 5.0, 5.5, 6.25} bar is shown in Figure 10a. The course of the variation in the static displacement of the inertial element as a function of pressure is shown in Figure 10b.
The subsequent stages of the investigation, which seek to ascertain the bellows pressure at which the operator’s work is conducted, are presented. The value of the determined pressure is of paramount importance from the standpoint of human safety and comfort. The resulting excursions caused by the overrun of a single hump are exceedingly challenging to rectify. This is due to the brief duration of the human–seat system’s exposure to the forcing generated within it and the time lag in the response of the vibration isolation system. Despite the challenges associated with optimising the parameters of the bellows for a system subjected to forcing with the characteristics depicted in Figure 4, an estimation of these values was conducted by calculating the effective acceleration y ¨ f 1 R M S and the maximum value of the relative displacement ( y f 1 y f 0 ) max , as illustrated in Figure 11.
This process enables the determination of the optimal pressure in the bellows, which is then set automatically by the system. To achieve this, the following operations must be carried out:
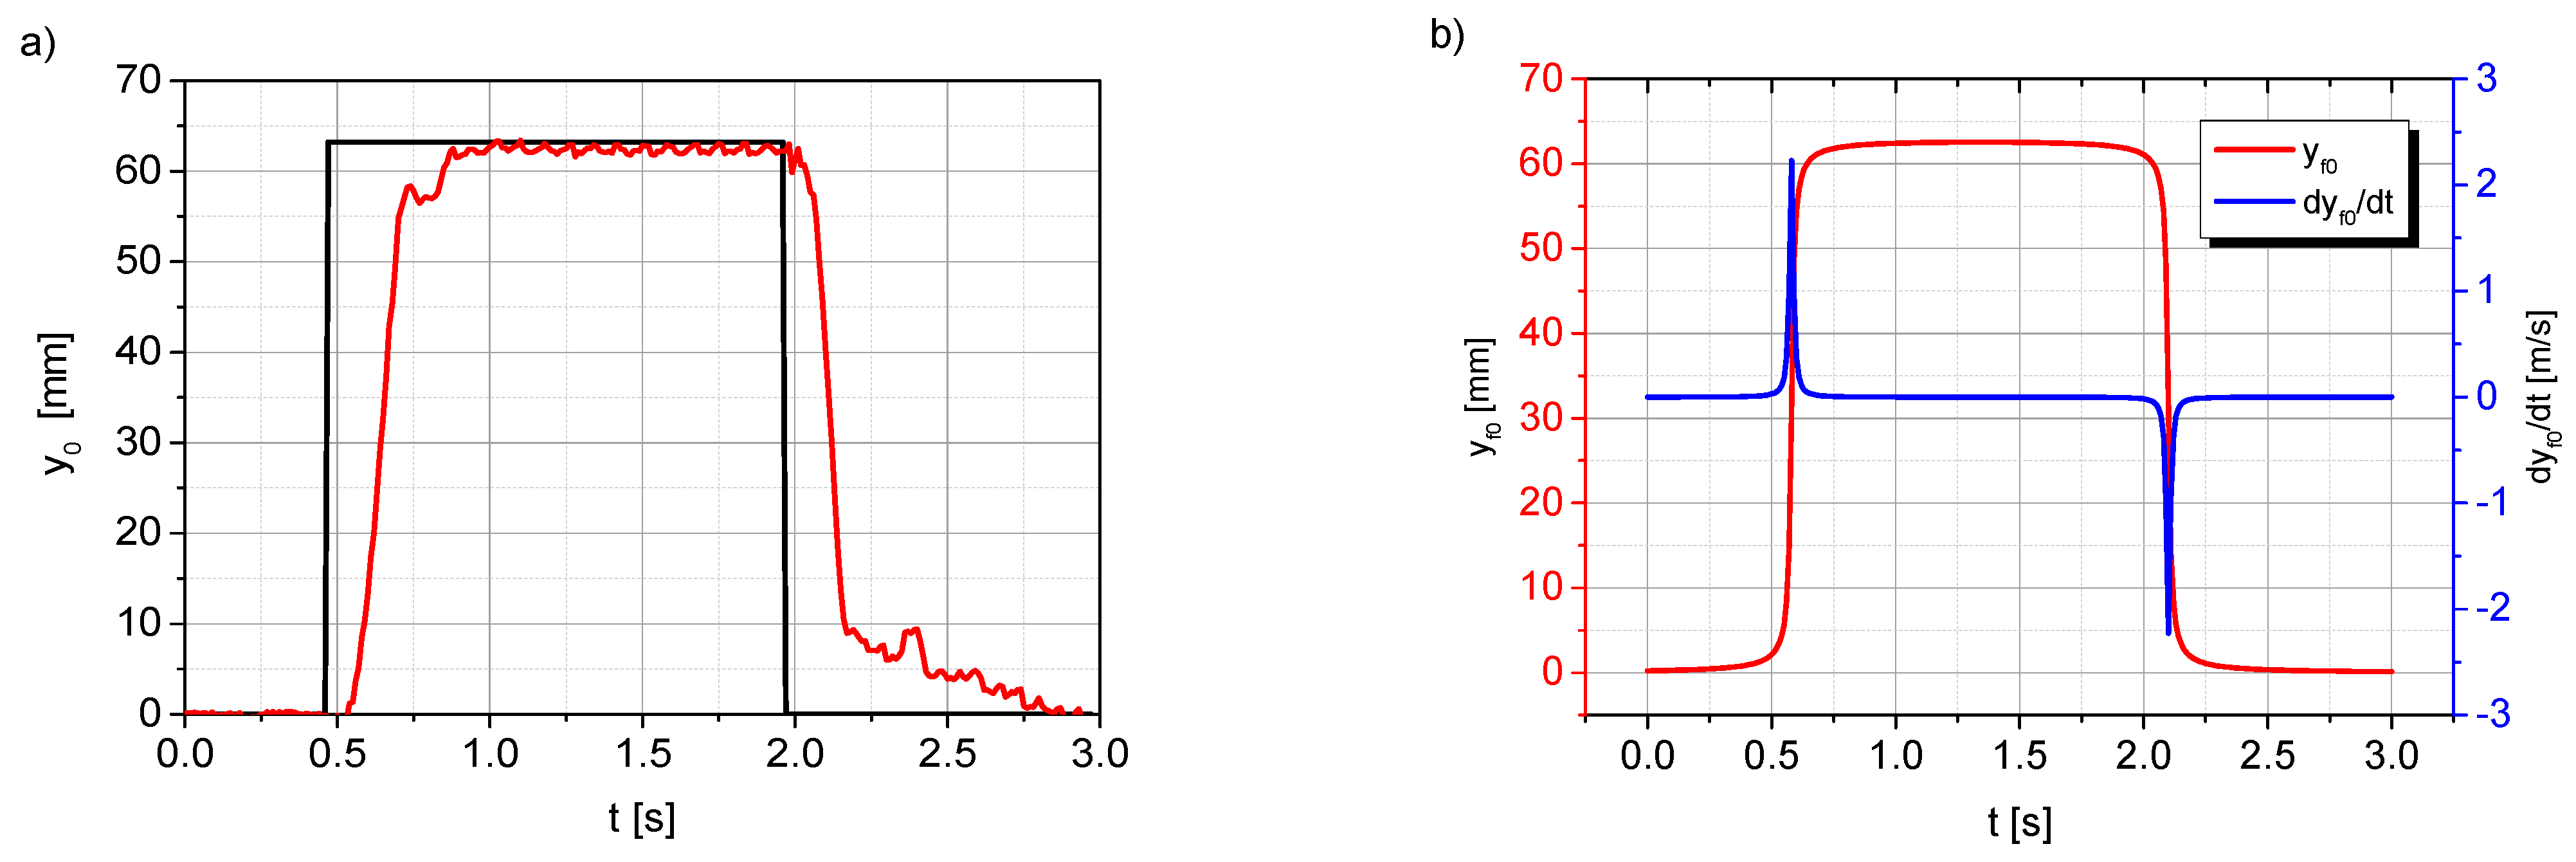
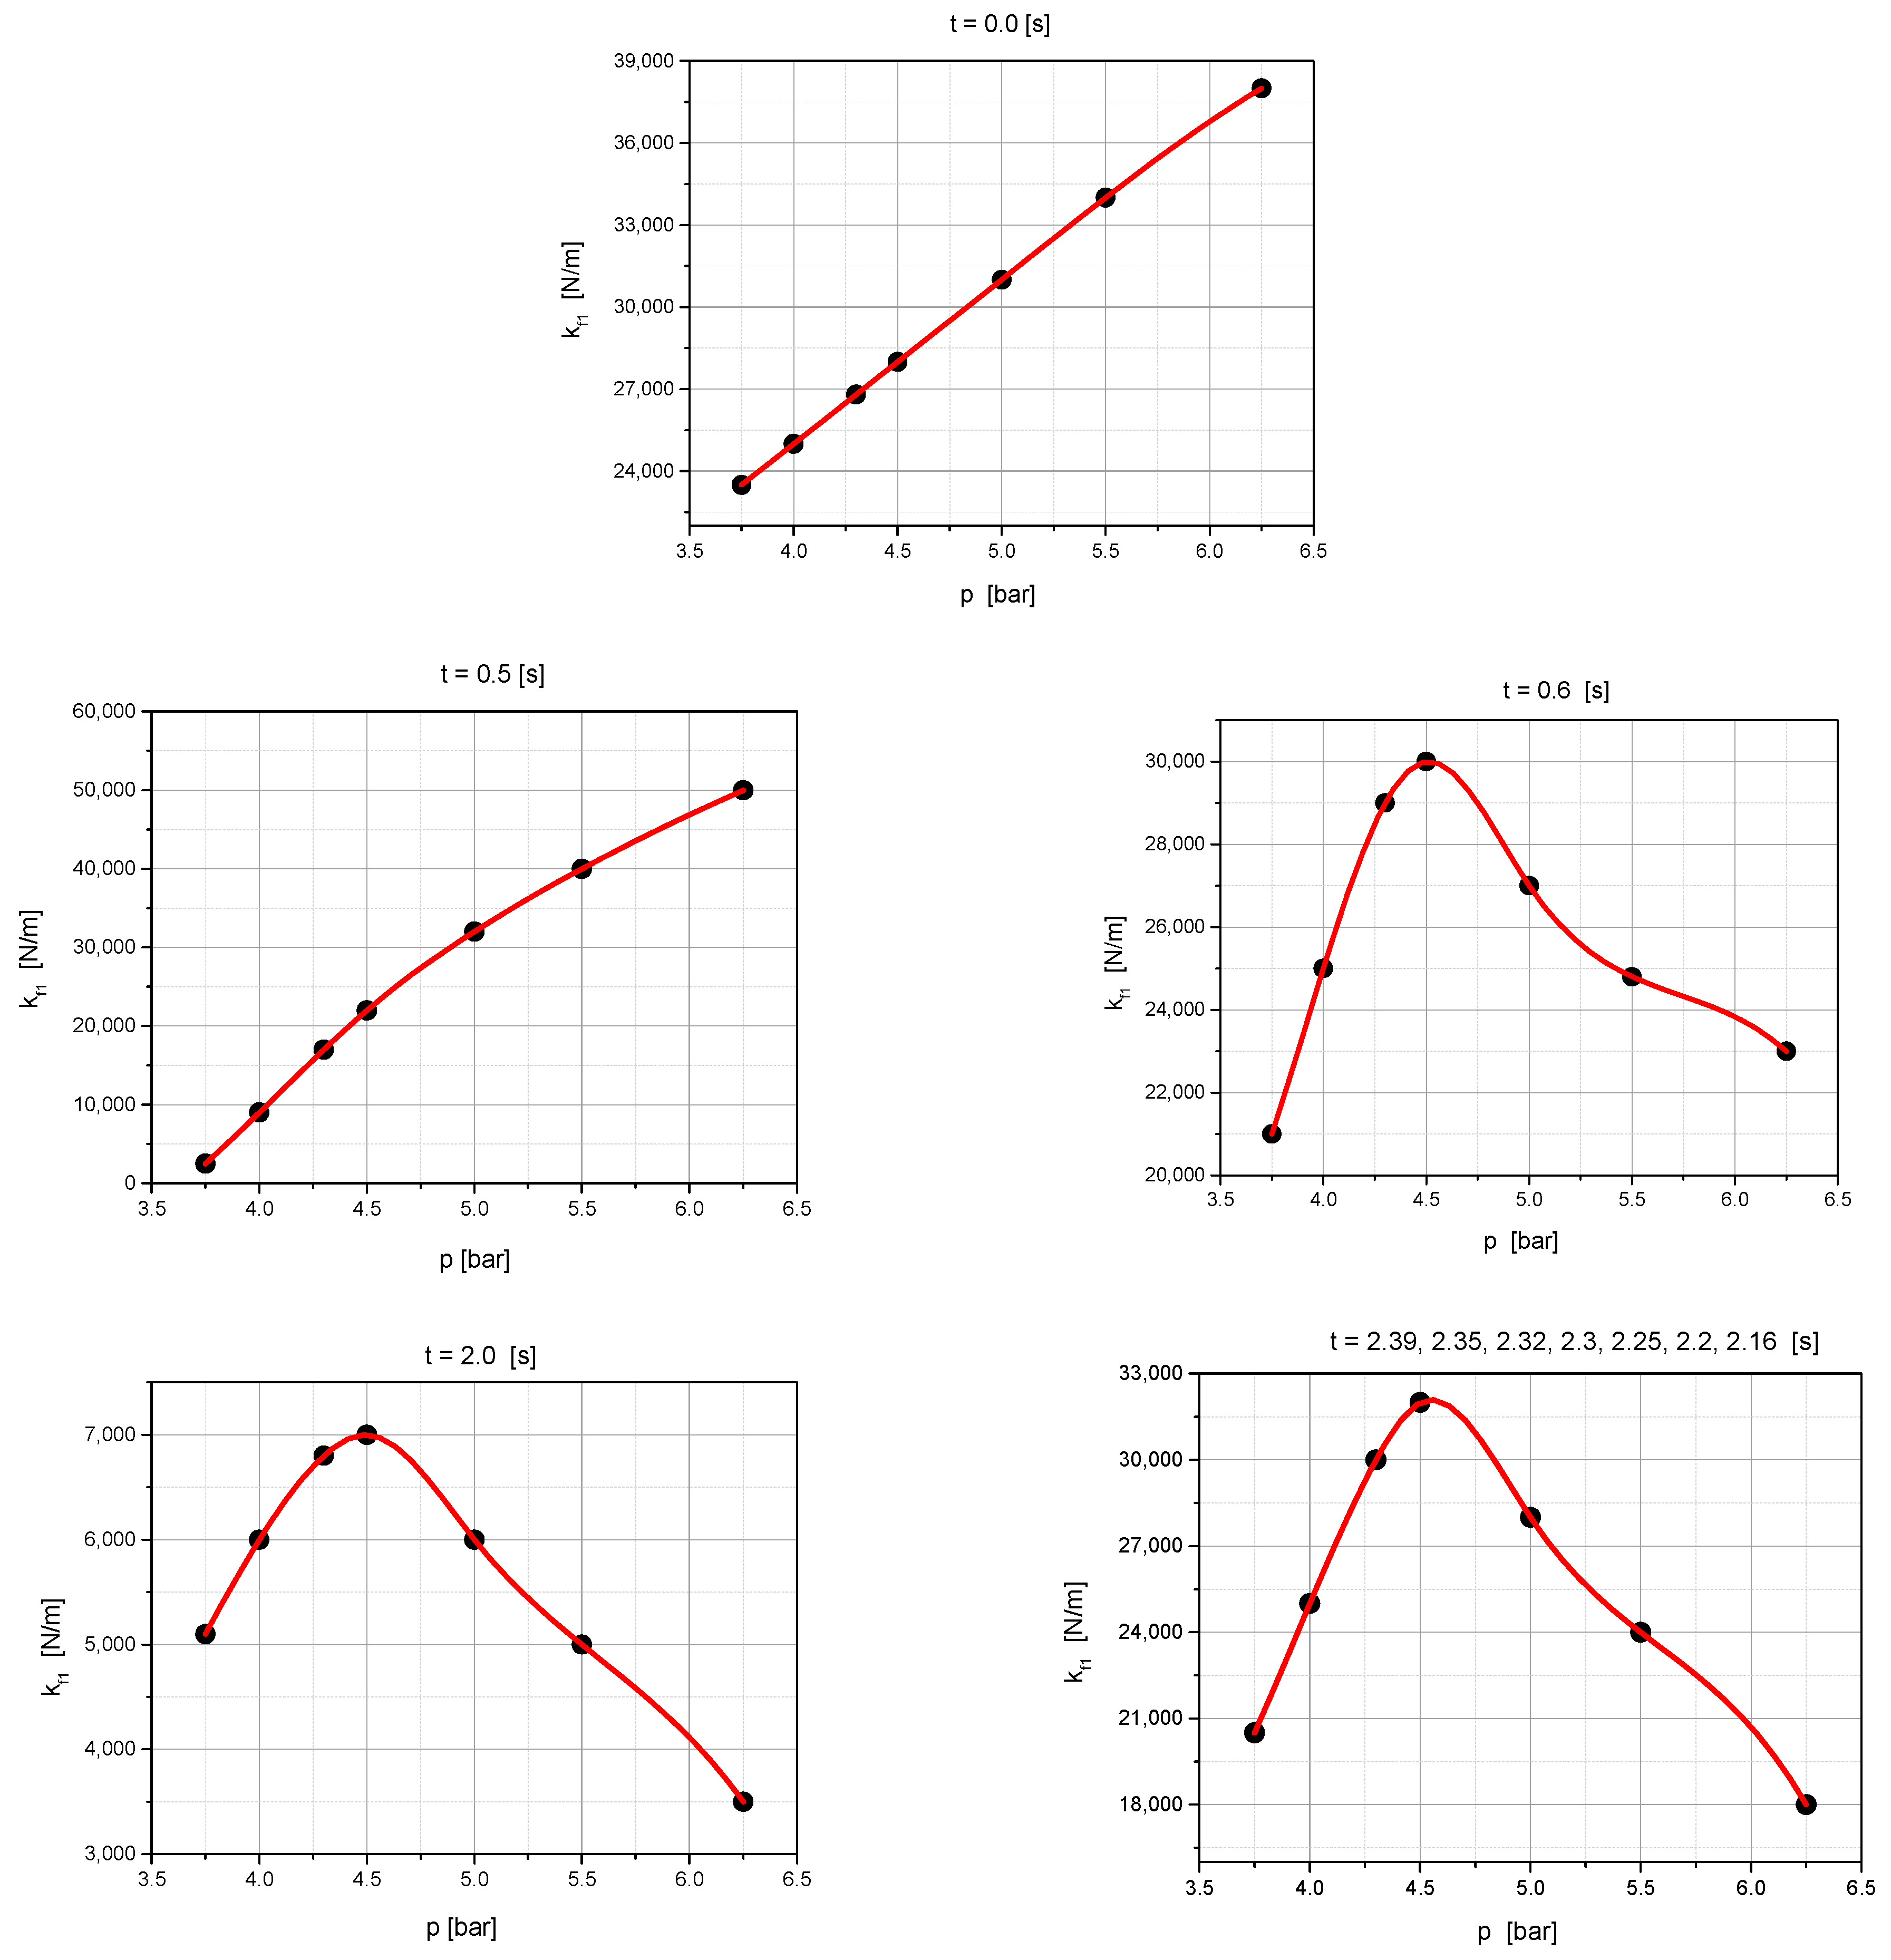
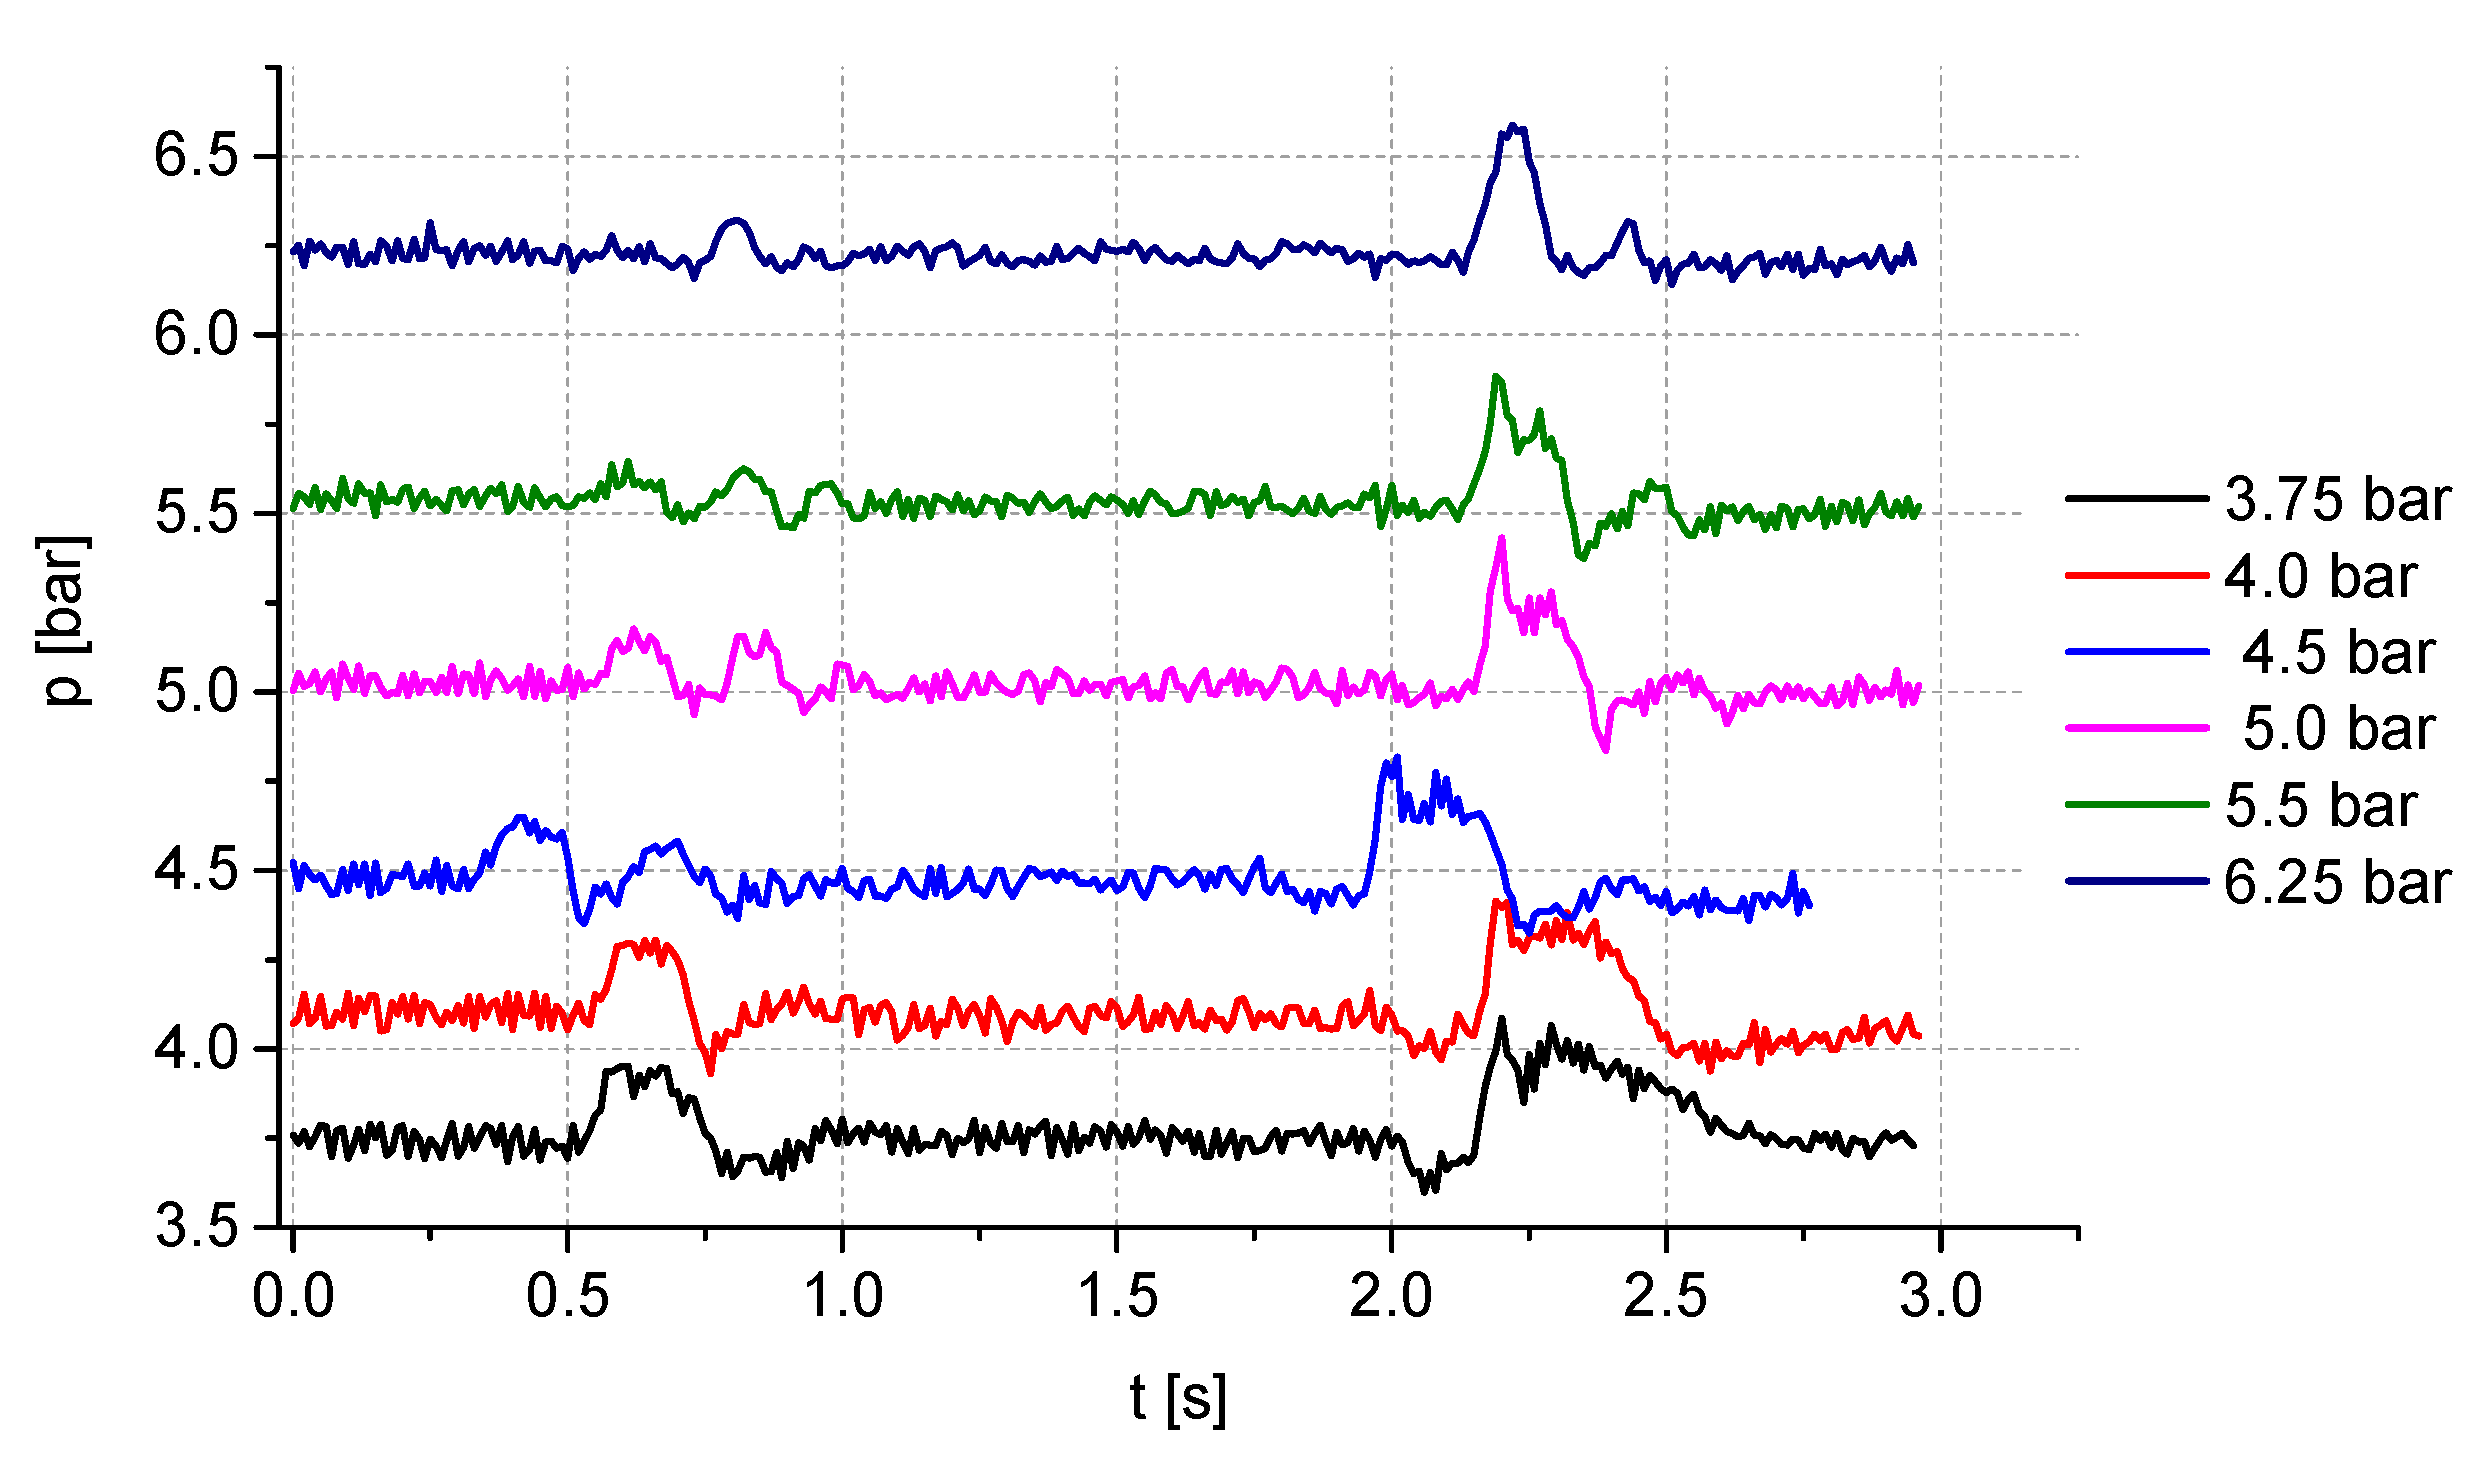
  • The bellows are filled to the initial pressure specified by the pneumatic silencer manufacturer, as illustrated in Figure 9 for t = 0.0 s. The pressure value is set automatically by the system.
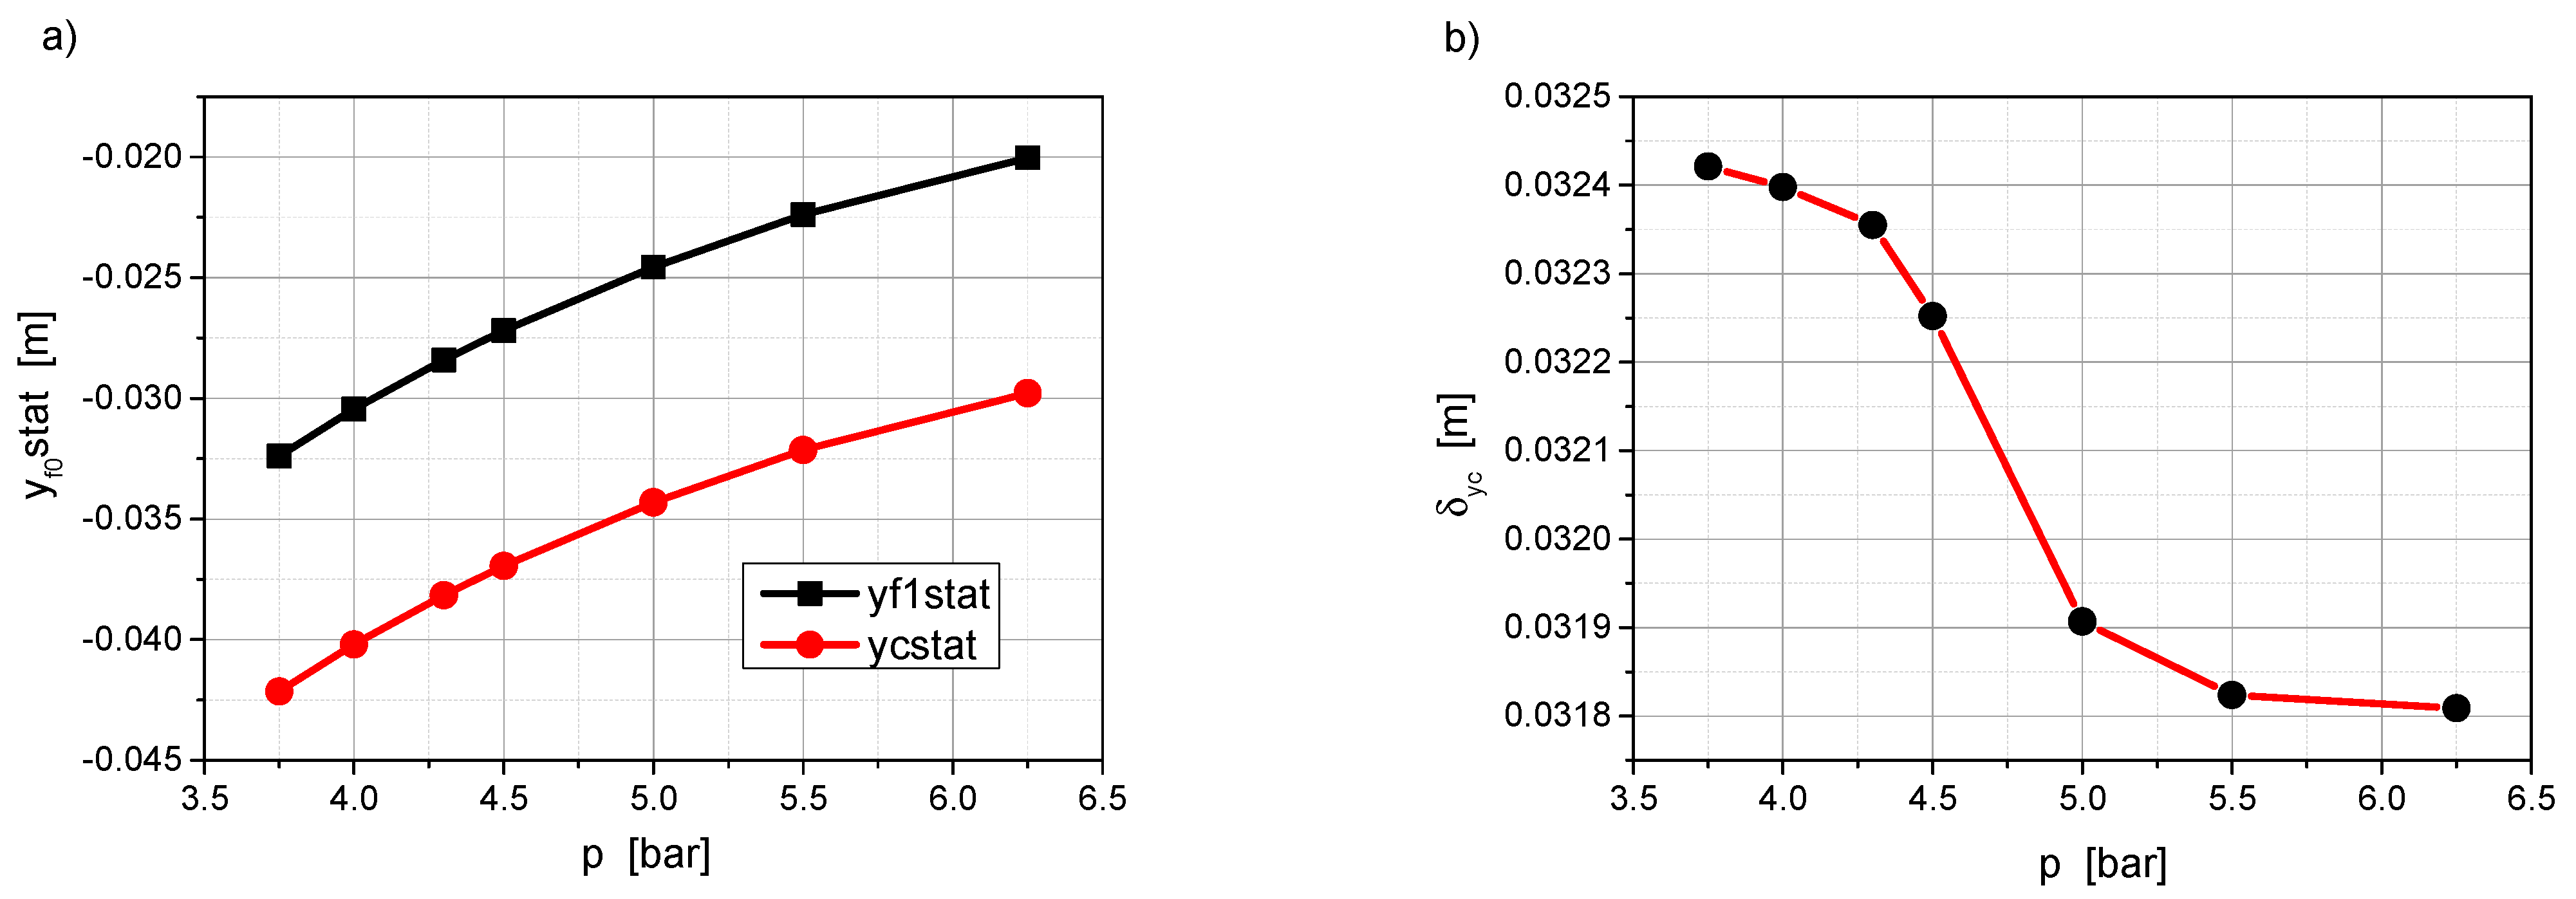
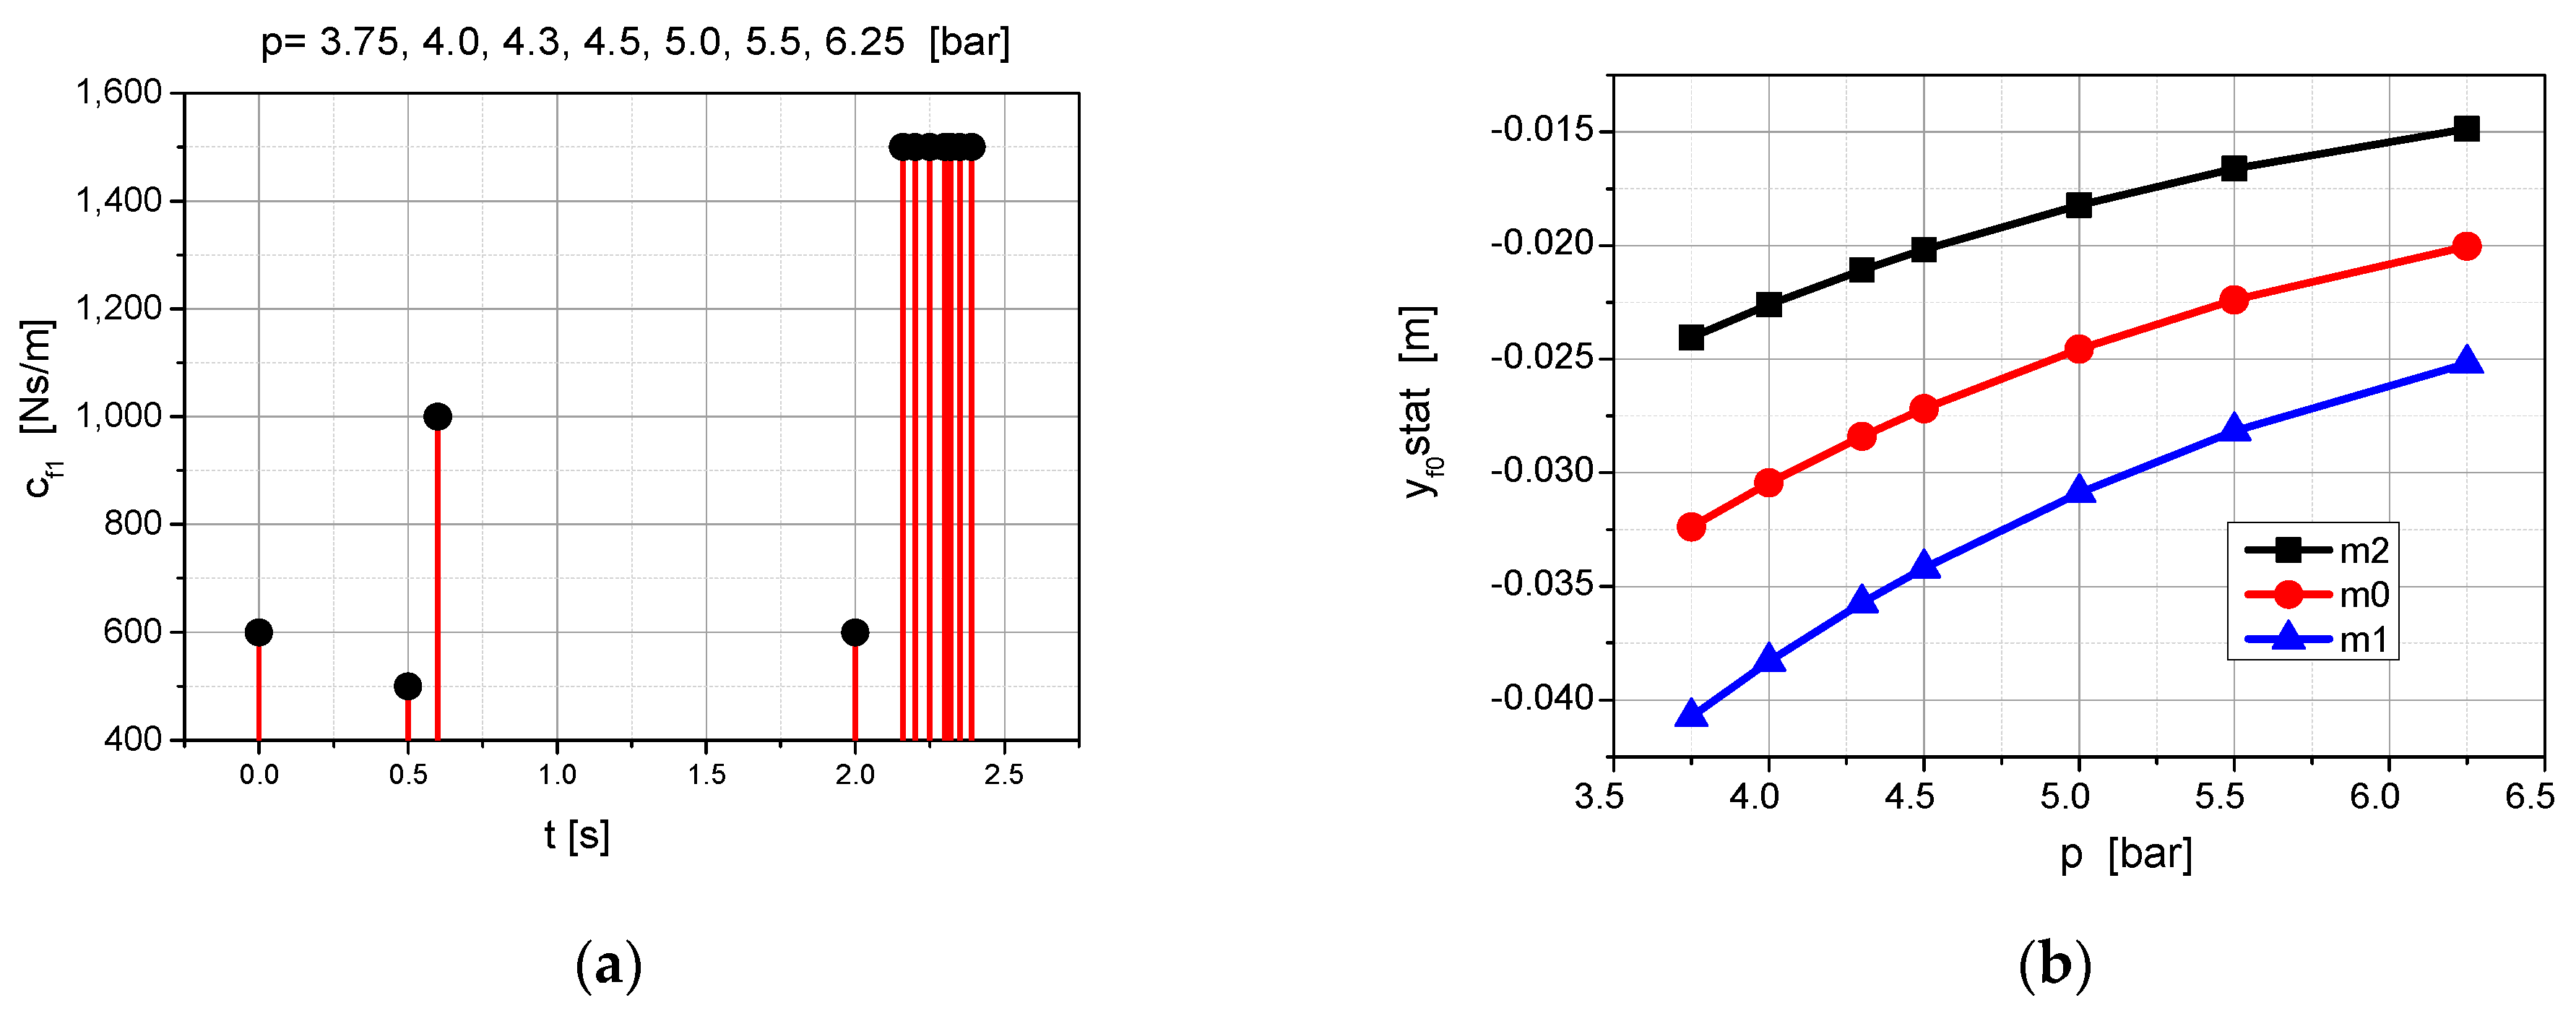
  • The operator is seated on the seat, causing it to move. The displacement of this movement is automatically measured by the system. Thisdisplacementisstatic, y f 1 s t .
  • The weight of the operator is automatically determined by the system. There are two options for this determination. The first is to use the relationship from Figure 10b and approximate the mass value. The second is to use the relationship from Figure 9 for t = 0.0 s and calculate the mass from Equation (3). It is possible to use both options simultaneously and determine the average mass.
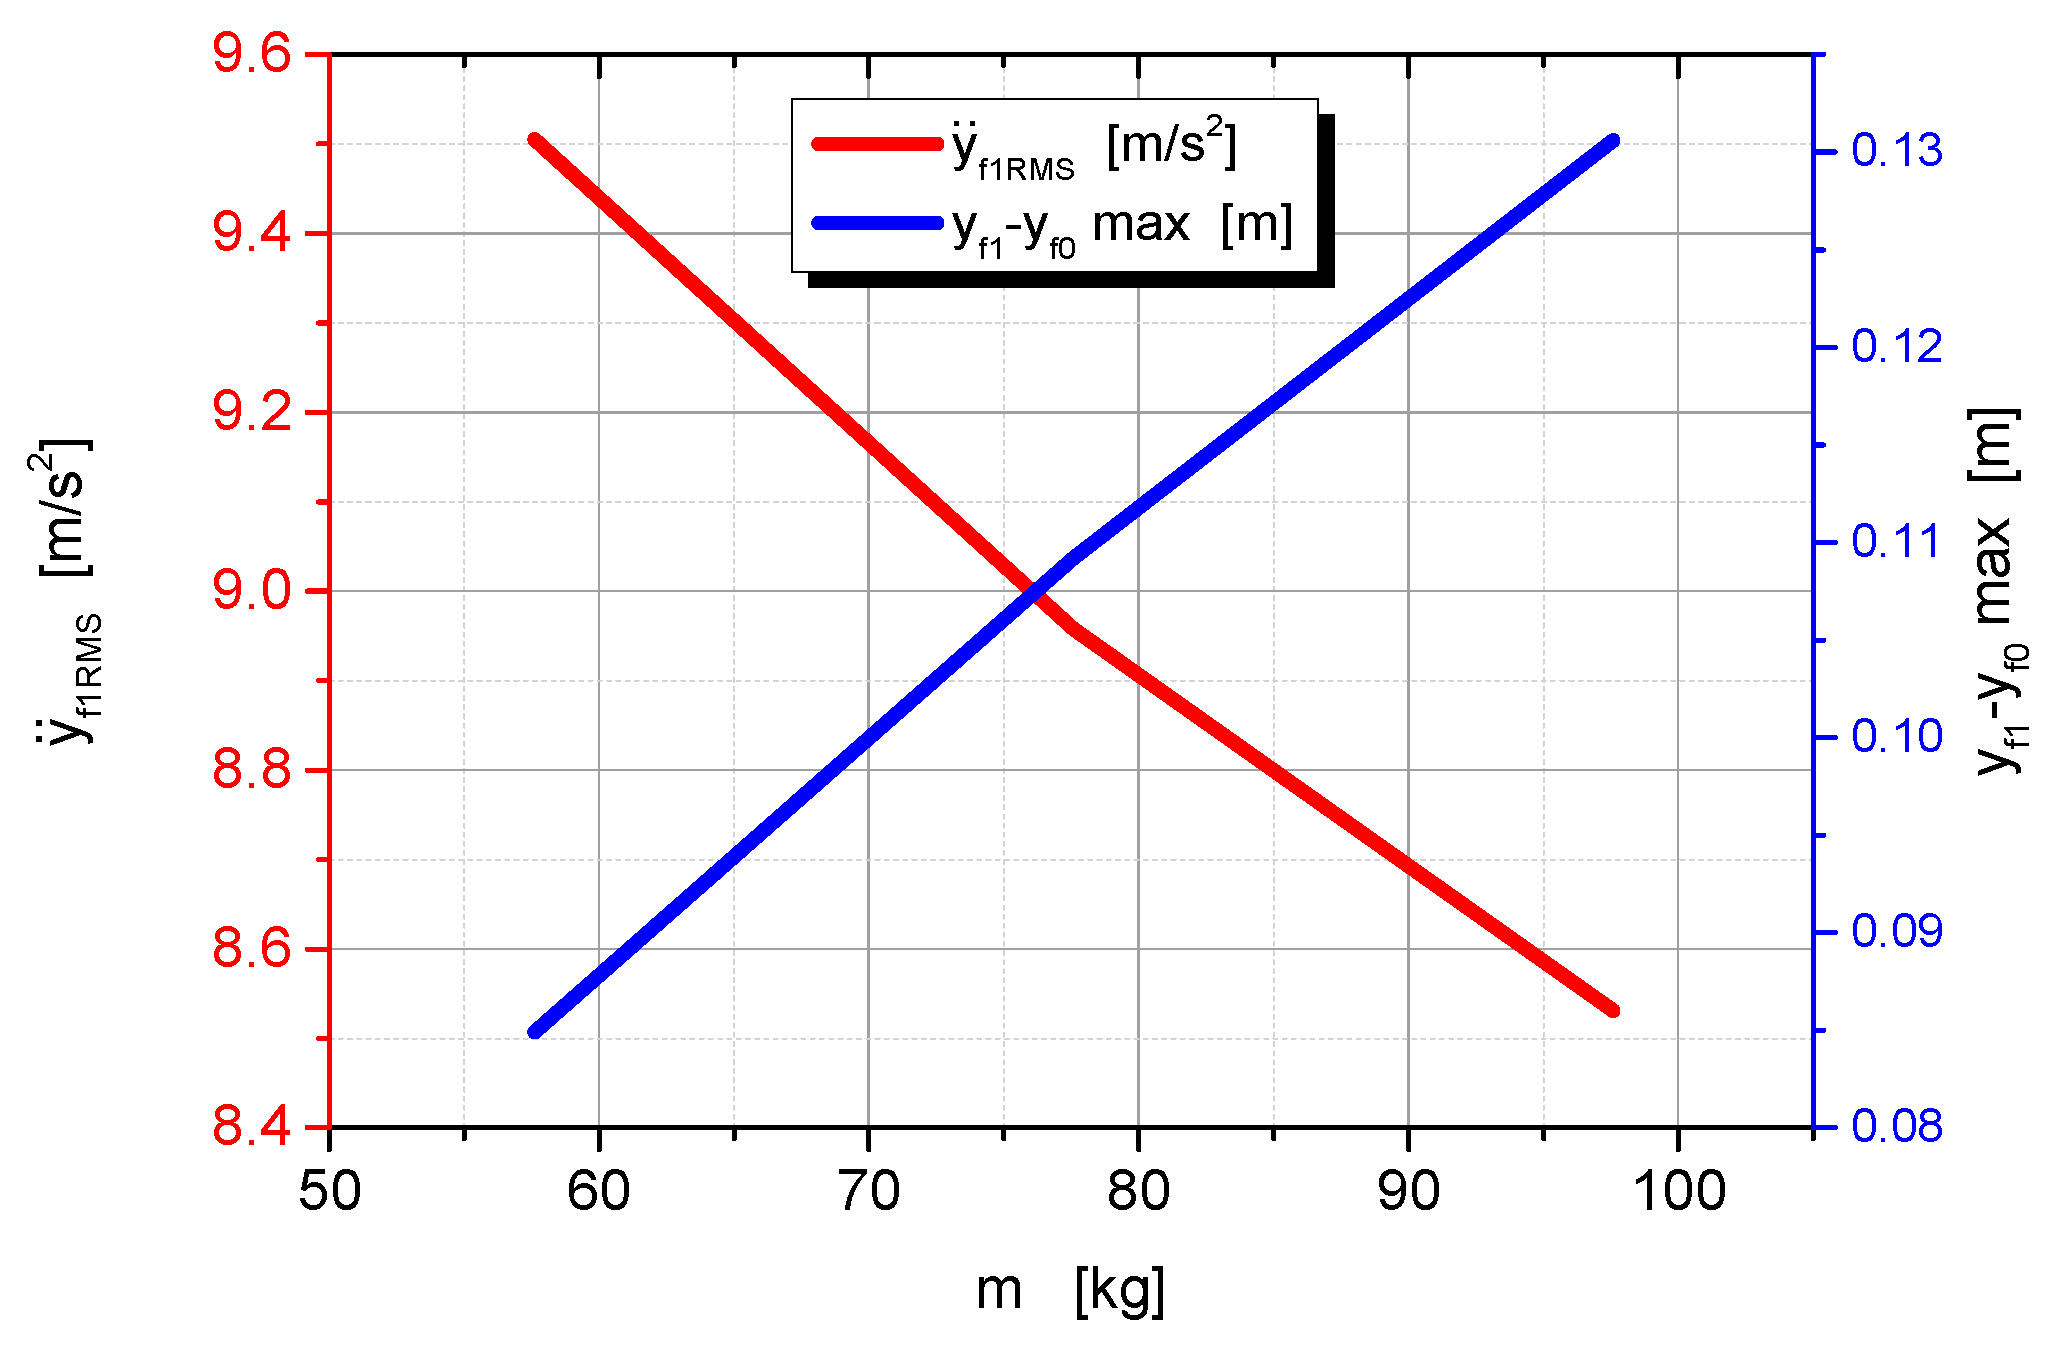
  • The effective acceleration y ¨ f 1 R M S and the maximum relative displacement values ( y f 1 y f 0 ) max , as determined by the system, can be found in Figure 12. The relative importance of these opposing vibration isolation quality criteria can be quantified by introducing weighting factors. It is necessary to decide which parameter is considered more important. The acceleration parameter can directly affect the human internal organs, while the displacement parameter can affect the perception of the activities performed.
  • The values of the effective acceleration y ¨ f 1 R M S and maximum relative displacement ( y f 1 y f 0 ) max , in conjunction with the current system weight, permit the determination of the bellows pressure at which the operator’s work will be performed.
The estimation of the driver’s seat suspension characteristics allows the results obtained to be applied to the favourable development of the vibration-isolating properties of the pneumatic suspension system. In the range of initial values of pressure in the pneumatic bellows cylinder from p = 4.0 bar to p = 5.5 bar, the applied algorithm accurately describes the course of motion of the inertial system. The situation is slightly less favourable for the extreme values, namely for pressure values of p = 3.75 bar and p = 6.25 bar. The results obtained can be further improved by tuning the response of the system by varying the dissipative properties over a wider range.

4. AirSpring Equation

Bellows actuators are employed as actuating elements in pneumatic drive systems for machinery and equipment, as well as in the form of pneumatic springs (cushions) for the vibration isolation of machines, the cushioning of vehicles, and other applications. In pneumatic drives, bellows actuators operate as single-acting actuators, commonly referred to as push cylinders. The operation of these actuators is based on the principles of filling (supplying pressure) and discharging (venting). From the perspective of vibration isolation, the action of the bellows actuator when filled with a constant pressure is of significance. In this state, it functions as an air spring.
Figure 13 illustrates a schematic of the air spring vibration isolation system. The system comprises a mass (1) which loads the system (3), causing the mass to vibrate vertically. The internal volume of the air spring (2) changes in response to the oscillation of the concentrated mass m, resulting in a change in pressure within the air spring (p).
The equation of motion according to Figure 13 for the mass–stiffness system of the bellows can be written as follows:
m h ¨ + k s h = F s
where h is the bellows deflection, m is the bellows loading mass, ks is the bellow stiffness and Fs is the external force on the bellows.
The stiffness of a pneumatic bellows ks is defined as the ratio of the load m to the deflection h of the bellows. This is expressed as ks = dFs/dh. The relationship between the bellows’ deflection h and pressure p is defined as follows:
k s = d F s d h = d ( p A e ) d h = p d A e d h + A e d p d h
where p is the pressure inside the bellows and Ae is the effective surface area of the pneumatic bellows.
To ascertain the derivative of pressure concerning height, and assuming an adiabatic transformation P V κ = c o n s t , the change in pressure as a function of bellows deflection is given by:
d ( p V κ ) d h = κ   p V κ 1 d V d h + V κ d p d h = 0
From the relationships shown in Equation (9), the change in pressure as a function of the deflection of the pneumatic bellows is apparent.
d p d h = κ   p V κ 1 V κ d V d h = κ   p V d V d h
As the pressure p increases, the height of the spring also increases, accompanied by an increase in volume V. Upon consideration of the relationship d V / d h A e and Equation (9), the following equation is derived:
d p d h = A e κ   p V
As a result, the stiffness of the pneumatic bellows ks as a function of its deflection h and gas volume Cg and pressure is plotted as follows:
k s h , p = p d A e d h + A e 2 κ   p V = p d A e d h + A e 2 C g
where Cg—the gas capacity of the bellows, Cg = V/Kg, Kg—the bulk modulus of elasticity of air, Kg = κp, and κ = 1.4—the adiabatic exponent.
The initial component of the equation represents the alteration in the effective area of the pneumatic spring. Given the configuration of the bellows actuator (Figure 2), a constant effective area, Ae, was postulated. It was assumed that the change d A e / d h 0 in the stiffness of the pneumatic bellows ks was calculated following the following formula:
k s A e 2 C g = A e 2 κ   p V
Assuming that the change in volume of the air below is:
V = V 0 V = V 0 A e   h
and assuming that V 0 = A e h 0 , then the stiffness of the bellows can be defined as:
k s h , p κ   p   A e 2 V 0 ( V 0 V 0 A e   h ) κ + 1
The dynamic variation in the p-pressure values during the experiments conducted to force the seat base (Figure 4) is presented in Figure 14.
An experiment was carried out to determine the value of the stiffness of a pneumatic bellows ks during its operation. Figure 15 shows the plots of the stiffness of a pneumatic bellows ks, bellows deflection h and pressure p for the effective area Ae = 0.01 m2, initial volume V0 = 0.0013 m3 and the value of the adiabatic exponent κ = 1.4. Considerations were made for a rectangular displacement (top-down) of the seat base (Figure 4a). The values of deflection h were calculated indirectly from the measurements of the seat base displacement y and the proportional ( h = 0.078 y ) geometric dependence of the suspension. The values of pressure p were measured directly.

5. Experimental and Simulation Studies of the Harmonic Motion

Tests were carried out using harmonic forcing, which is the simplest form of analysing the behaviour of a system subjected to external forcing. The tests carried out are an appropriate form of confirmation of the correct choice of model and its parameterisation. That is, it is a type of test to verify the correctness of the research method used. Figure 16 shows the plots of the actual sinusoidal waveforms for vertical accelerations with a maximum amplitude of y0 = 63 mm. Oscillatory motion is defined by the position relative to the equilibrium point. The positive and negative values of the oscillation represent the positions on either side of the equilibrium point.
For comparison, Figure 17 shows the results of the simulation studies of the model’s response in terms of displacements yf1 to a sinusoidal forcing yf0. The parameters of the forcing waveform are analogous to the experimental studies of Figure 16.
Table 3 shows the values of the vibration amplitude amplification coefficients for the passive suspension system of the operator seat. Tests were carried out for different air pressures in the bellows actuator and a constant mass load (m = 69.6 kg).
For a hypothetical improvement in operator comfort, a range of 0.3 to 0.7 was assumed for the amplitude gain (Ku = y/y0 and Kfu = yf1/yf0) of the excitation signal.
The results of the bench experiments (Figure 2) for a modulated displacement (forcing) frequency y0 ranging from 1 to 6 Hz and y displacement are shown in Figure 18. A frequency study for the Ku(y/y0) amplification at different modulation frequencies produced the frequency response of the pneumatic vibration isolation system (Figure 18b). From this diagram, it is possible to estimate the points at which the gain is maximum or minimum. Naturally, for low frequencies of the input signal y0, the amplitude of the output signal y is close to that of the input signal. However, as the frequency increases, the amplitude of the output signal becomes smaller than the amplitude of the input signal. This is due to the properties of the circuit, which attenuates the higher frequencies. In this case (p = 4.0 bar), there is a local amplitude amplification for the frequency f = 2.12 Hz. For this frequency, the instantaneous effectiveness of the pneumatic vibration isolation is limited. However, in the set range (up to 6 Hz), vibration isolation effectiveness can be demonstrated for the system.

6. Conclusions

The role of air seat suspension in improving operator comfort and safety is huge—it isolates them from the vibrations that are normally transmitted to humans. In this article, we have looked at how we can shape these vibration isolation properties, as we believe that the solution to vibration problems in work machinery can be achieved through research into optimising the design and performance evaluation of air seat suspension systems. The evaluation of the suspension characteristics of the driver’s seat provides valuable information for optimising the vibration isolation capability of the air suspension system. In particular, in the initial pressure range of 4.0 to 5.5 bar, the algorithm used effectively determines both the kinematic and dynamic quantities characterising the motion of the inertial system. This allows the vibrations to be reduced and the harmful frequency band to be shifted out of the unfavourable range. For the extreme values of the initial pressure, namely 3.75 bar and 6.25 bar, the algorithm used is less effective. To better compensate for the efficiency of the algorithm, its capabilities should be extended by introducing damping properties in a wider range of adjustments. The present study focuses, among other things, on the selection of elastic properties. Attention is also given to the additional possibility of isolating the person on the seat from external disturbances by introducing a cushion with appropriately selected parameters. The resonance frequencies of some very important human organs are quite high, so a passive vibration reduction system can contribute to the comfort of the seated person. The analysis of issues related to the effects of excitation on individual human organs and effective vibration isolation requires the development of a physical model. The study of the dynamics and vibration isolation of a seated operator subjected to external forces presented in this article provides a basis for further research.

Author Contributions

Methodology, P.W.; Software, P.W. and Z.D.; Validation, P.W.; Formal analysis, Z.D.; Writing—review & editing, P.W. and Z.D. All authors have read and agreed to the published version of the manuscript.

Funding

This research received no external funding.

Institutional Review Board Statement

Not applicable.

Informed Consent Statement

Not applicable.

Data Availability Statement

Data are contained within the article.

Conflicts of Interest

The author declares no conflicts of interest.

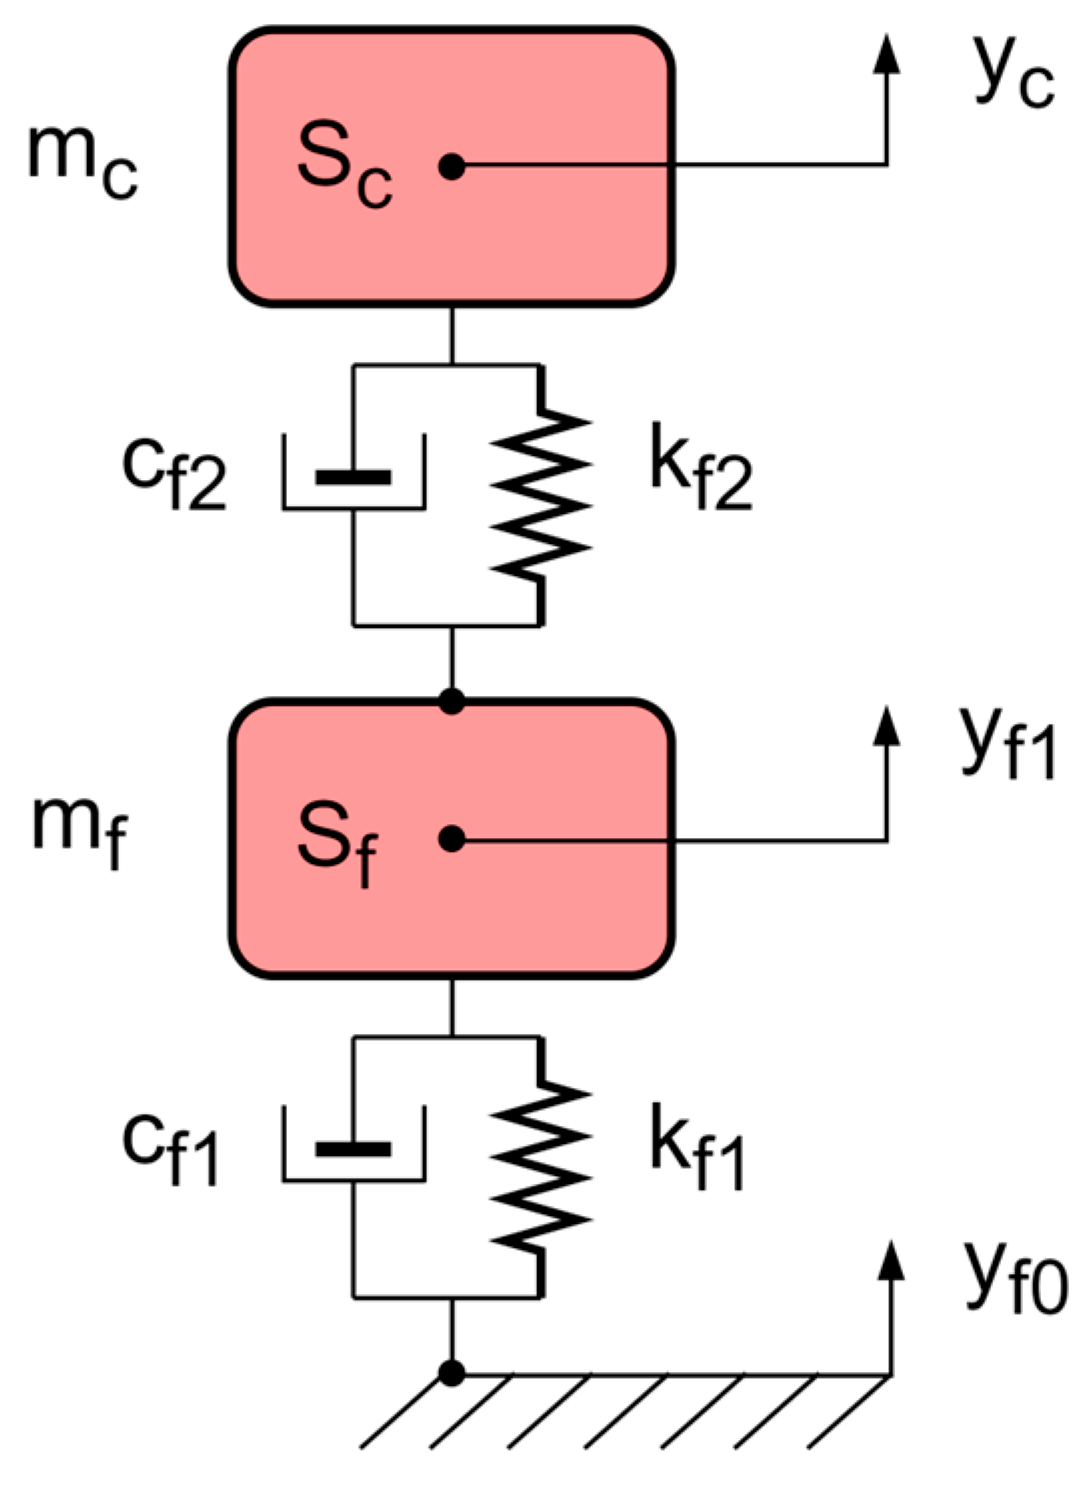
Appendix A. Physical and Mathematical Model of a Human–Seat System with Two Degrees of Freedom

After the parametric estimation of the suspension of the seat characteristics, a two-degree-of-freedom physical model was formulated as shown in Figure A1. The human anthropo-dynamic model is represented as a concentrated mass m c . The seat is modelled in the form of a concentrated mass m f , a passive deformable element in the form of a Voigt–Kelvin rheological model with the parameters k f 1 and c f 1 representing the suspension, and the cushions also in the form of a Voigt–Kelvin rheological model with parameters k f 2 and c f 2 .
Figure A1. A physical model of the human–seat system.
Applsci 14 06318 g0a1
The number of degrees of freedom resulting from the formulated structure of the model of a person sitting in a chair describing the perturbation of the fundamental motion in the vertical plane is two. An independent generalised coordinate   y f 1 is used to determine the vertical displacement of the concentrated mass m f at any time. An independent generalised coordinate y c is used to determine the vertical displacement of the concentrated mass m c at each instant. The force acting on the seat suspension base from the support side is determined by the y f 0 coordinate.
The mathematical model is a discrete, physically non-linear, determined, time-varying, dissipative and non-sympathetic system. The equations of motion of the human–physical system in summation form are as follows:
m f y ¨ f 1 + c f 1 + c f 2 y ˙ f 1 c f 2 y ˙ c + k f 1 + k f 2 y f 1 + y f 1 s t k f 2 y c + y c s t = c f 1 y ˙ f 0 + k f 1 y f 0 m f g
m c y ¨ c c f 2 y ˙ f 1 + c f 2 y ˙ c k f 2 ( y f 1 + y f 1 s t ) + k f 2 ( y c + y c s t ) = m c g
where:
y f 1 s t —static displacement of the seat,
y c s t —static displacement of a person,
g—the acceleration of gravity.
The equilibrium equations are as follows:
( k f 1 + k f 2 ) y f 1 s t k f 2 y c s t = m f g k f 2 y f 1 s t + k f 2 y c s t = m c g
The natural frequencies are determined from the following characteristic equation:
m f m c s 4 + [ m f k f 2 + m c ( k f 1 + k f 2 ) ] s 2 + ( k f 1 + k f 2 ) k f 2 k f 2 2 = 0
Hence, conjugate imaginary elements: s 1 = ± i ^ ω 01 , s 2 = ± i ^ ω 02 .
The mode-shape vectors of natural vibrations are:
The first mode-shape vectors  The second mode-shape vectors
μ 11 = 1 μ 12 = 1
μ 21 = k f 1 + k f 2 m f ω 01 2 k f 2 μ 22 = k f 1 + k f 2 m f ω 02 2 k f 2
The frequencies of the free vibrations can be determined from the following characteristic equation.
m f m c s * 4 + [ m f c f 2 + m c ( c f 1 + c f 2 ) ] s * 3 + [ m f k f 2 + m c ( k f 1 + k f 2 ) + ( c f 1 + c f 2 ) c f 2 2 ] s * 2 + [ ( c f 1 + c f 2 ) k f 2 + ( k f 1 + k f 2 ) c f 2 ( c f 2 k f 2 ) 2 ] s * + ( k f 1 + k f 2 ) k f 2 k f 2 2 = 0
Hence, conjugate imaginary elements: s * 1 = h 1 ± i ^ ω * 01 , s * 2 = h 2 ± i ^ ω * 01 .
The parameters for model Equation (A5) are given in Table A1.
Table A1. Parameters of the mathematical model of the human–seat system.
m f m c k f 2 c f 2
8   k g 69.6   k g 70,000   N / m 150   N s / m
The model of the force acting on the base of the seat suspension is analogous to that of the single-degree-of-freedom model.
The course of variation as a function of time of the displacement of the human and seat masses relative to a given forcing for the initial values of pressure p = {3.75, 4.0, 4.3, 4.5, 5.0, 5.5, 6.25} bar was obtained after carrying out numerical simulations of the movement of the developed theoretical model.
Figure A2 shows the variation as a function of time of the displacement of the human mass and seat against a given forcing for an initial pressure value of p = 3.75 and p = 4.3 bar. The graph shows the response of the system to the kinematic forcing.
Figure A2. Displacement obtained from simulations of yf1yf0 and ycyf0 for initial pressure values of (a) p = 3.75 bar and (b) p = 4.3 bar.
Applsci 14 06318 g0a2
Results were obtained for initial pressure values of p = 4.5 bar and p = 5.0 bar (Figure A3).
Figure A3. Displacement obtained from simulations of yf1yf0 and ycyf0 for initial pressure values of (a) p = 4.5 bar and (b) p = 5.0 bar.
Applsci 14 06318 g0a3
The results were obtained for initial pressure values of p = 5.5 bar and p = 6.25 bar (Figure A4).
Figure A4. Displacement obtained from simulations of yf1 and yc for initial pressure values of (a) p = 5.5 bar and (b) p = 6.25 bar.
Applsci 14 06318 g0a4
The results obtained for the initial pressures are shown in Table A2. These are the calculated values of the static displacements y f 1 s t ,   y c s t for the given pressures and the standard deviation of the human displacement variation δ y c .
Table A2. Parameters of the mathematical model of the human–seat system.
p [bar] y f 1 s t [m] y c s t [ m ] δ y c [ m ]
3.75 0.0324 0.0421 0.0324
4.0 0.0304 0.0402 0.0324
4.3 0.0284 0.0382 0.0324
4.5 0.0272 0.0369 0.0322
5 0.0246 0.0343 0.0319
5.5 0.0224 0.0321 0.0318
6.25 0.02 0.0298 0.0318
Figure A5 shows the plots of the static displacements y f 1 s t ,   y c s t and the standard deviation of the human displacement variation δ y c .
Figure A5. Static displacements y f 1 s t ,   y c s t (a) and standard deviation of human displacement δ y c (b).
Applsci 14 06318 g0a5
A prerequisite for the optimum operation of the suspension system is the introduction of appropriate (preset) input variables into the system, i.e., setting an initial stiffness appropriate to the weight of the operator. From the point of view of isolating the person on the seat from external disturbances, the characteristics of the cushion can be important. A passive vibration isolation system in the form of a cushion with appropriately selected parameters can contribute to a reduction in vibrations at higher frequencies.

Appendix B. Simulation Parameters

Table A3. Parameters used in the simulation.
SymbolValueUnitQuantity
p3.75–6.5barPressure in the pneumatic bellows
H0.155mPneumaticbellowsheight
D0.11mPneumaticbellowsdiameter
V00.0013m3Initial volume in pneumatic bellows
Ae0.01m2Area of the pneumatic bellows
κ1.4 Exponent of adiabatic
m c 69.6kgMass of the person
m f 8kgMass of the seat
g 9.81m/s2Acceleration of gravity
A w 0.063mExcitation amplitude
A H 0.003 Shape factor
t H 1 0.58sThe first-time extremes
t H 2 2.1sThe second-time extremes
τ sDuration of forcing

References

  1. Pellecchia, D.; Vaiana, N.; Spizzuoco, M.; Serino, G.; Rosati, L. Axial Hysteretic Behaviour of Wire Rope Isolators: Experiments and Modelling. Mater. Des. 2023, 225, 111436. [Google Scholar] [CrossRef]
  2. Desai, R.; Guha, A.; Seshu, P. A Comparison of Different Models of Passive Seat Suspensions. Proc. Inst. Mech. Eng. Part D J. Automob. Eng. 2021, 235, 2585–2604. [Google Scholar] [CrossRef]
  3. Tu, L.; Ning, D.; Sun, S.; Li, W.; Huang, H.; Dong, M.; Du, H. A Novel Negative Stiffness Magnetic Spring Design for Vehicle Seat Suspension System. Mechatronics 2020, 68, 102370. [Google Scholar] [CrossRef]
  4. Hryciów, Z.; Krasoń, W.; Wysocki, J. Evaluation of the Influence of Friction in a Multi-Leaf Spring on the Working Conditions of a Truck Driver. Eksploat. i Niezawodn. 2021, 23, 422–429. [Google Scholar] [CrossRef]
  5. Na, W.; Dawei, G. Identification and Optimization of Vehicle Vibration and Noise. In Proceedings of the 8th International Conference on Electromechanical Control Technology and Transportation (ICECTT 2023), Hangzhou, China, 7 September 2023. [Google Scholar] [CrossRef]
  6. Zhu, Z.; Wang, R.; Yang, L.; Sun, Z.; Meng, X. Modelling and Control of a Semi-Active Dual-Chamber Hydro-Pneumatic Inerter-Based Suspension System. Proc. Inst. Mech. Eng. Part D J. Automob. Eng. 2021, 235, 2355–2370. [Google Scholar] [CrossRef]
  7. Bouvin, J.L.; Moreau, X.; Benine-Neto, A.; Hernette, V.; Serrier, P.; Oustaloup, A. Modelling and Design of a Pneumatic CRONE Suspension Architecture for Ride Comfort. Veh. Syst. Dyn. 2021, 59, 890–906. [Google Scholar] [CrossRef]
  8. Tan, X.; Chen, S.; Wang, B.; Tang, J.; Wang, L.; Zhu, S.; Yao, K.; Xu, P. Real-Time Tunable Negative Stiffness Mechanical Metamaterial. Extrem. Mech. Lett. 2020, 41, 100990. [Google Scholar] [CrossRef]
  9. Chen, L.; Ding, R.; Wang, R.; Meng, X. Research on the Mode Switching Control of Vehicle Electromagnetic Suspension Employing Linear Motor. Int. J. Veh. Syst. Model. Test. 2020, 14, 195. [Google Scholar] [CrossRef]
  10. Bian, Y.; Wang, Y.; Dong, M.; Kong, H. Research on Vertical Vibration Characteristics of Human Body under Standard Sitting Posture. In Proceedings of the Proc. SPIE 12612, International Conference on Artificial Intelligence and Industrial Design (AIID 2022), 126121B, Zhuhai, China, 14 April 2023. [Google Scholar] [CrossRef]
  11. Jiao, R.; Nguyen, V.; Le, V. Ride Comfort Performance of Hydro Pneumatic Isolation for Soil Compactors Cab in Low Frequency Region. J. Vibroengineering 2020, 22, 1174–1186. [Google Scholar] [CrossRef]
  12. Vo, N.Y.P.; Nguyen, M.K.; Le, T.D. Analytical Study of a Pneumatic Vibration Isolation Platform Featuring Adjustable Stiffness. Commun. Nonlinear Sci. Numer. Simul. 2021, 98, 105775. [Google Scholar] [CrossRef]
  13. Tu, L.; Du, H.; Dong, M.; Ning, D.; Wu, Y.; Li, W.; Huang, H. Semiactively Controllable Vehicle Seat Suspension System with Negative Stiffness Magnetic Spring. IEEE/ASME Trans. Mechatron. 2021, 26, 156–167. [Google Scholar] [CrossRef]
  14. Nguyen, V.; Jiao, R.; Le, V.; Wang, P. Study to Control the Cab Shaking of Vibratory Rollers Using the Horizontal Auxiliary Damping Mount. Math. Model. Eng. 2020, 6, 57–65. [Google Scholar] [CrossRef]
  15. Liao, X.; Zhang, N.; Du, X.; Zhang, W. Theoretical Modeling and Vibration Isolation Performance Analysis of a Seat Suspension System Based on a Negative Stiffness Structure. Appl. Sci. 2021, 11, 6928. [Google Scholar] [CrossRef]
  16. Radhakrishnan, K.; Godwin Antony, A.; Rajaguru, K.; Sureshkumar, B. Torsional Vibration Analysis of Torsion Bar Spring for off Road Vehicle Driver Seat. Mater. Today Proc. 2020, 21, 669–672. [Google Scholar] [CrossRef]
  17. Liu, C. Vibration Isolation and Noise Reduction Design of Commercial Vehicle Cab Mounting System Based on Blind Source Separation. In Proceedings of the International Conference on Mechatronics Engineering and Artificial Intelligence (MEAI 2022), Changsha, China, 1 March 2023. [Google Scholar] [CrossRef]
  18. Davoodi, E.; Safarpour, P.; Pourgholi, M.; Khazaee, M. Design and Evaluation of Vibration Reducing Seat Suspension Based on Negative Stiffness Structure. Proc. Inst. Mech. Eng. Part C J. Mech. Eng. Sci. 2020, 234, 4171–4189. [Google Scholar] [CrossRef]
  19. Wang, X.; Gong, H.; Liu, J. Design and Simulation of a Vibration Isolation Platform Based on Air Spring for Road Transportation Applications. In Proceedings of the 2nd International Conference on Internet of Things and Smart City (IoTSC 2022), Xiamen, China, 8 May 2022. [Google Scholar] [CrossRef]
  20. Liu, C.; Hemmatian, M.; Sedaghati, R.; Wen, G. Development and Control of Magnetorheological Elastomer-Based Semi-Active Seat Suspension Isolator Using Adaptive Neural Network. Front. Mater. 2020, 7, 171. [Google Scholar] [CrossRef]
  21. Zhu, H.; Yang, J.; Zhang, Y. Dual-Chamber Pneumatically Interconnected Suspension: Modeling and Theoretical Analysis. Mech. Syst. Signal Process. 2021, 147, 107125. [Google Scholar] [CrossRef]
  22. Brijeshkumar, P.; Santhosh, B. Dynamics and Isolation Capabilities of a Magnetic Spring-Based Quasi-Zero Stiffness Vibration Isolation Mechanism for Passenger Vehicle Seat Isolation. In Advances in Industrial Machines and Mechanisms; Lecture Notes in Mechanical Engineering; Springer: Singapore, 2021. [Google Scholar] [CrossRef]
  23. Cheng, C.; Hu, Y.; Ma, R. Enhanced Ride Comfort Using Nonlinear Seat Suspension with High-Static-Low-Dynamic Stiffness. Noise Vib. Worldw. 2020, 51, 63–76. [Google Scholar] [CrossRef]
  24. Woś, P.; Dindorf, R. Studies of Properties of the Seat Suspension System with Air Spring. EPJ Web Conf. 2019, 213, 02101. [Google Scholar] [CrossRef]
  25. Rakheja, S.; Afework, Y.; Sankar, S. An Analytical and Experimental Investigation of the Driver—Seat—Suspension System. Veh. Syst. Dyn. 1994, 23, 501–524. [Google Scholar] [CrossRef]
Figure 1. Types of seat suspensions for work machines: (a) passive (adjustable) suspension, (b) semi-active suspension, (c) active suspension.
Applsci 14 06318 g001
Figure 2. Experimental test stand: (a) general view of the stand: 1—mass load, 2—vibration seat base, 3—vibration table; (b) diagram of the seat suspension system.
Applsci 14 06318 g002
Figure 3. Physical model of the human–seat system.
Applsci 14 06318 g003
Figure 4. Forcing characteristics of the seat base movement in the time domain: (a) real diagrams, (b) diagrams from a simulation experiment.
Applsci 14 06318 g004
Figure 5. Displacement obtained from simulation yf1yf0 and experimental y − y0 for initial pressure values of (a) p = 4.0 bar and (b) p = 4.5 bar.
Applsci 14 06318 g005
Figure 6. Displacement obtained from simulation yf1yf0 and experimental yy0 for initial pressure values of (a) p = 5.0 bar and (b) p = 5.5 bar.
Applsci 14 06318 g006
Figure 7. Frequency responses of vertical acceleration; (a) pre−pressure p = 4.0 bar; (b) pre−pressure p = 4.5 bar.
Applsci 14 06318 g007
Figure 8. Frequency responses of vertical acceleration; (a) pre−pressure p = 5.0 bar; (b) pre−pressure p = 5.5 bar.
Applsci 14 06318 g008
Figure 9. Stiffness kf1 of the seat suspension as a function of pressure.
Applsci 14 06318 g009
Figure 10. Suspension damping as a function of time cf1 (a) and static displacement of the inertial element yf1stat as a function of pressure (b).
Applsci 14 06318 g010
Figure 11. The effective acceleration y ¨ f 1 R M S of mass m as a function of pressure p (a) and the maximum value of relative displacement ( y f 1 y f 0 ) max as a function of pressure p (b). The range of mass values adopted in the calculations m 0 = m , m 0 = m + 20 kg, and m 0 = m 20 kg.
Applsci 14 06318 g011
Figure 12. The mean effective acceleration y ¨ f 1 R M S and mean maximum relative displacement ( y f 1 y f 0 ) max as a function of the mass of the inertial system under test (or the human−seat system).
Applsci 14 06318 g012
Figure 13. Scheme of air spring in suspension seats.
Applsci 14 06318 g013
Figure 14. Pressure variation curves p in the pneumatic bellows.
Applsci 14 06318 g014
Figure 15. The variation curves, as a function of time, were obtained from the simulation for ks and the experimental tests of p and h for an initial pressure value of p = 4.5 bar.
Applsci 14 06318 g015
Figure 16. Displacement curves y(seat) and y0 (base) for suspensions: (a) passive optimum fixed p = 4 bar, (b) passive optimum fixed p = 4.5 bar, (c) passive soft p = 3.75 bar, and (d) passive hard p = 5.5 bar.
Applsci 14 06318 g016aApplsci 14 06318 g016b
Figure 17. Simulation displacement diagrams yf1 (seat) and yf0 (base) for suspensions: (a) passive optimal p = 4 bar, (b) passive optimal p = 4.5 bar, (c) passive soft p = 3.75 bar, and (d) passive hard p = 5.5 bar.
Applsci 14 06318 g017
Figure 18. Results of test stand experiments using frequency modulation of seat floor forcing: (a) displacement waveforms y (seat) and y0(base) for p = 4 bar pressure; (b) frequency response for Ku(y/y0).
Applsci 14 06318 g018
Table 1. Simulation parameters of the mathematical model of forcing.
A w A H t H 1 t H 2 τ
0.063   m 0.003 0.58   s 2.1   s 3   s
Table 2. Overview of standard deviation δ y f 1 y f 0 .
p [ b a r ] 3.754.305.06.25
δ y f 1 y f 0 [ m ] 0.0537   0.0455 0.0310 0.0355
Table 3. Values of relative displacement and amplification factor of vibration amplitude.
Types of SeatsPressure p [bar]Amplification Coefficient
Amplitudes for the Model Kfu
Amplification
Coefficient Amplitudes Ku
Passive soft3.750.960.95
Passive optimal 14.00.370.36
Passive optimal 24.50.650.65
Passive hard5.51.511.58
Disclaimer/Publisher’s Note: The statements, opinions and data contained in all publications are solely those of the individual author(s) and contributor(s) and not of MDPI and/or the editor(s). MDPI and/or the editor(s) disclaim responsibility for any injury to people or property resulting from any ideas, methods, instructions or products referred to in the content.

