1. Introduction
Digital holographic stereograms, introduced in 1995 by Yamaguchi et al. [
1], have since met expectations in various fields, including art, advertising, the military, architecture, the automotive industry, medicine, and entertainment [
2,
3]. The latest generation of holoprinters, called CHIMERA [
4], employs three low-power, continuous, red, green, blue (RGB) lasers combined with the silver-halide material Ultimate U04 [
5], producing full-color holograms with a hogel [
6] resolution of 250 μm, a speed of 60 Hz, and full parallax.
To create CHIMERA holographic stereograms, a large series of perspective images of a three-dimensional (3D) model must first be obtained. For a physical 3D model that is manipulable and of manageable size, images can be directly captured indoors using cameras, curved rails, turntables, or dedicated scanners [
7]. When dealing with a large outdoor physical model, the initial step typically involves recording it using various scanning technologies and converting it into a virtual 3D model. Perspective images are then created from the virtual 3D model using advanced 3D computer graphics software. These scanning technologies, such as photogrammetry [
8,
9], Gaussian splatting [
10,
11], and light detection and ranging (LiDAR) [
12,
13], require time, professional tools (special cameras and drones), and technical expertise to achieve good results.
This study aims to record large-scale outdoor content using simpler and more accessible tools such as smartphones, basic tools, free phone applications, and free software. Four methods were proposed: interpolation, photogrammetry, Gaussian splatting, and LiDAR. The different results were evaluated and compared to determine the simplest, fastest, and best solutions for obtaining CHIMERA holograms of outdoor content.
2. Materials and Methods
2.1. CHIMERA Recordings
CHIMERA holographic stereogram recordings require the prior acquisition of a series of perspective images of a 3D scene, whether real or virtual. To create a half-parallax CHIMERA, up to 768 horizontal perspective images are needed, spaced evenly over a maximum arc of 120°, as illustrated in
Figure 1. The axis of rotation is the vertical axis of the final CHIMERA, with everything in front of this axis appearing to float in front of the film plane. The radius of rotation (r) falls within the range of the model’s height (h) to twice its height.
2.3. Interpolation Method
Previous work by Gentet et al. [
15,
16] has shown the possibility of limiting the number of initial perspective images and interpolating the missing images using a neural network [
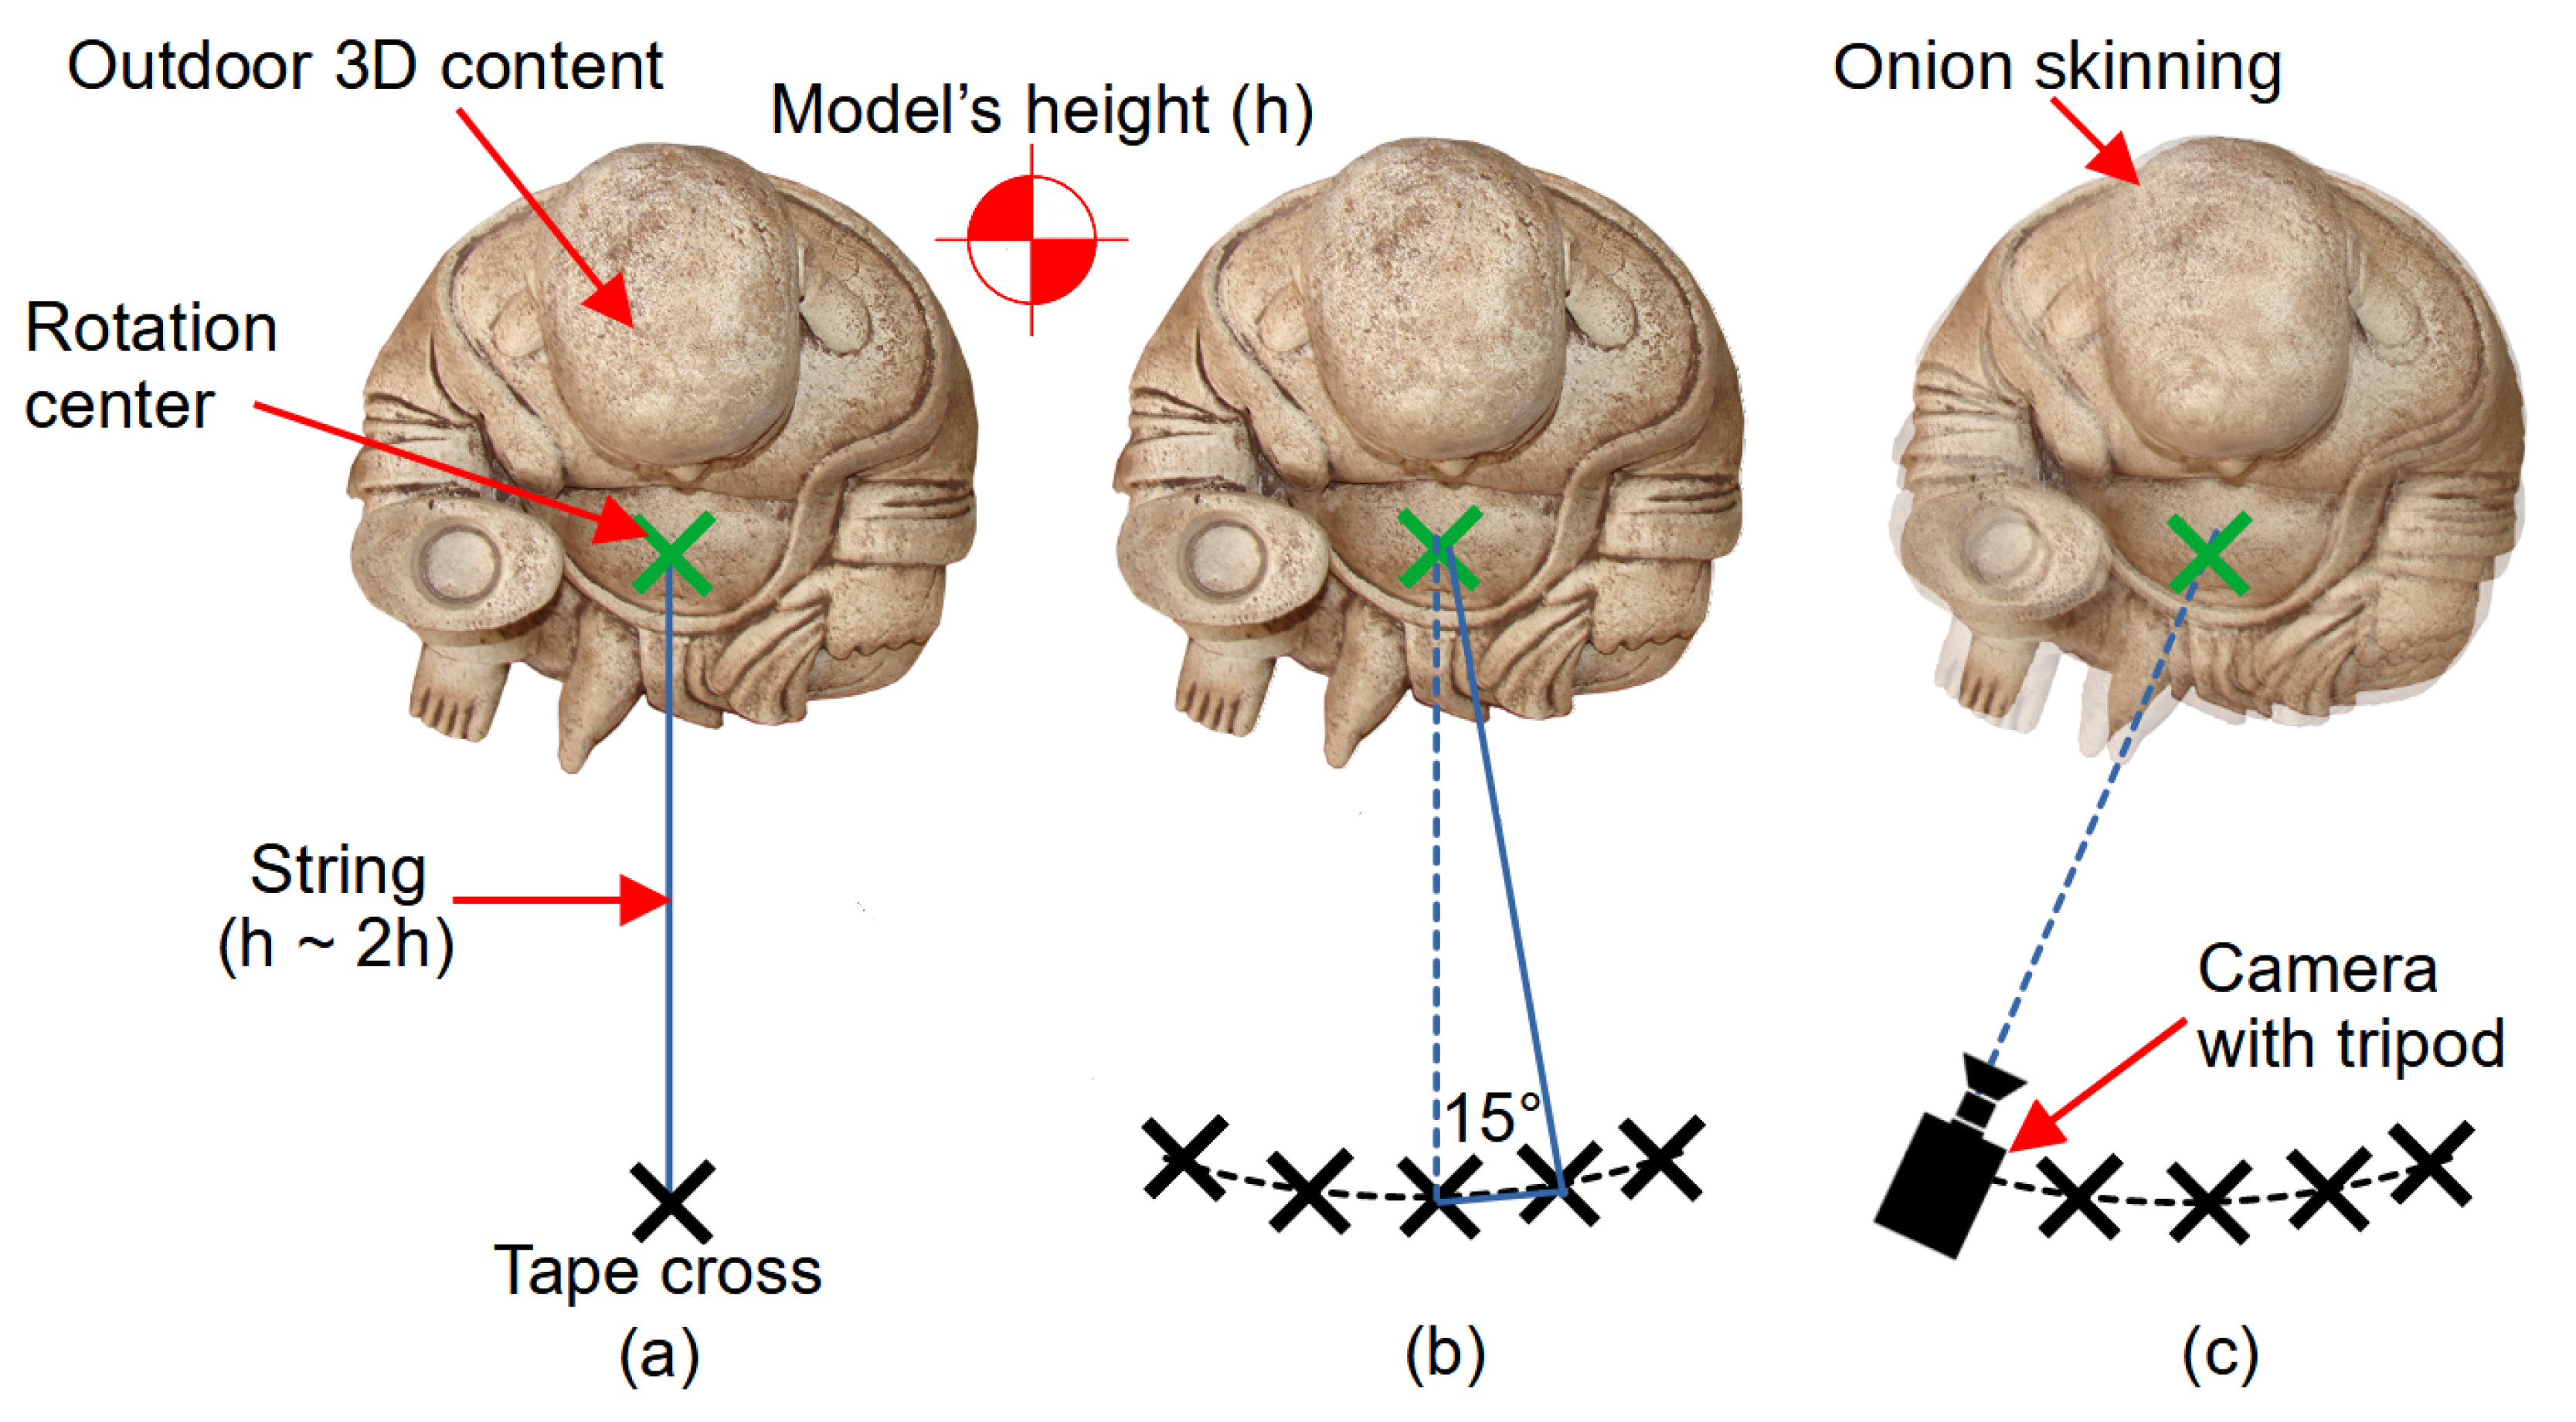
17]. Building on these findings, the proposed interpolation method involves recording a limited number of images of large-scale outdoor content using an iPhone and simple tools, such as a string, adhesive tape, ruler tape, and tripod.
Once the height of the scene to be recorded was determined with a ruler tape, a string was extended from it to a distance ranging from the height itself to twice the measured height, taking into account the natural features of the terrain (
Figure 2a). The string starts at the center of rotation, which determines the hologram plane. Crosses were then placed on the ground with adhesive tape at regular intervals of up to 15° between the points around the object. This setup created an arc that served as a guide for the camera position at each image capture point (
Figure 2b). Images were captured using an iPhone camera on a tripod and the OnionCam2 application on an Apple device (
Figure 2c). This application uses the onion-skinning technique, a procedure usually used in stop-motion animation, to simultaneously observe two different frames. This feature is crucial for maintaining a constant camera height and ensuring that the camera remains aligned as it rotates around the object.
The interpolation method did not work properly with the background; therefore, it was removed from each image. This can be performed online using free APIs (application programming interfaces). Removing the background ensures that the neural network used for interpolation focuses solely on the geometric and textural details of the object without being influenced by extraneous elements in the scene.
2.4. Photogrammetry Method
Photogrammetry is a technique that utilizes photographs captured from multiple perspectives to generate 3D coordinates. This process involves determining the spatial positions of the cameras and identifying common points within the images. The resulting model can be textured to achieve a photorealistic representation. Specialized software was used to analyze the images, estimate camera positions, and generate a point cloud, which was then transformed into a 3D mesh. Today, individuals can readily engage in photogrammetry using smartphones, thanks to various user-friendly applications for spatial object reconstruction. The MetaScan iPhone application [
18], a free and robust all-in-one 3D capture tool, was selected for this study.
2.5. Gaussian Splatting Method
Gaussian splatting is a visualization technique used to process point-cloud data in 3D graphics. This process involves determining the positions of the points in space and using a Gaussian function to interpolate the influence of each point on the rendering surface. The Gaussian splatting process initiates with the collection of point-cloud data, followed by the utilization of specialized software to estimate the local density or intensity around each point using a Gaussian function. Subsequently, this density is mapped onto a 2D or 3D grid to form a continuous scalar field, facilitating the creation of smooth and visually appealing surfaces from irregularly spaced data. The iPhone application Scaniverse [
19] offers efficient and flexible Gaussian splatting capabilities.
2.6. LiDAR Method
LiDAR is a remote-sensing method that uses light to measure distances and generates detailed three-dimensional (3D) models of objects and environments. The LiDAR sensor in the iPhone 13 Pro [
20] emits a pulsed infrared pattern. This advanced sensor empowers users to conduct 3D scans while moving and recording videos around an object using specialized applications. The captured data were processed online to generate 3D models. The iPhone application MetaScan was also chosen for this purpose.
2.7. Scene Environment Parameters
Environmental influences, such as variations in lighting and weather conditions, can further impact the quality of data captured in 3D methods involving outdoor scanning. Shadows can significantly affect the quality of captures by creating unwanted contrasts and obscuring details. Diffuse lighting is crucial for mitigating harsh shadows and ensuring uniform illumination. Wind can also disrupt the consistency of the recording by causing elements of the scene to move. The experiments are therefore carried out in cloudy weather with no wind.
2.8. Blender Rendering
Blender [
21] generates perspective images from 3D models using photogrammetry, Gaussian splatting, and LiDAR methods. Blender 4.2 LTS is an open-source 3D modeling and rendering software capable of effectively handling complex geometries. This capability enables precise adjustments of viewing angles and lighting, ensuring high-quality and consistent visualization of 3D models using various techniques.
2.9. CHIMERA Printing
Hogels were generated from the perspective images obtained from each method using proprietary software. Each hogel was sequentially recorded using an RGB display system consisting of three spatial light modulators (SLMs) and a 120° full-color optical printing head. The interference pattern of the reference beam was captured for each RGB hogel on a U04 plate. The CHIMERA holoprinter (Ultinate Holography, Bordeaux, France) utilizes three RGB DPSS lasers with a power level of 20 mW and wavelengths of 640, 532, and 457 nm. Four CHIMERA holograms were printed onto the same 15 × 20 cm U04 holographic plate to facilitate a better comparison.
2.10. Comparison Method
To offer a comprehensive overview of the different recording methods employed to create holographic images, a comparison was conducted based on several key aspects. These aspects include the number of images used, the type of technology employed, rendering time, and visual quality. This comparison aims to delineate the strengths and limitations of each method in a succinct format, facilitating an understanding of its applicability and efficiency in practical scenarios.
3. Results
This section is subdivided into several subsections, each providing a concise and precise description of the experimental results, their interpretation, and the conclusions drawn from the experiments.
3.1. Selecting Subject for Experiment
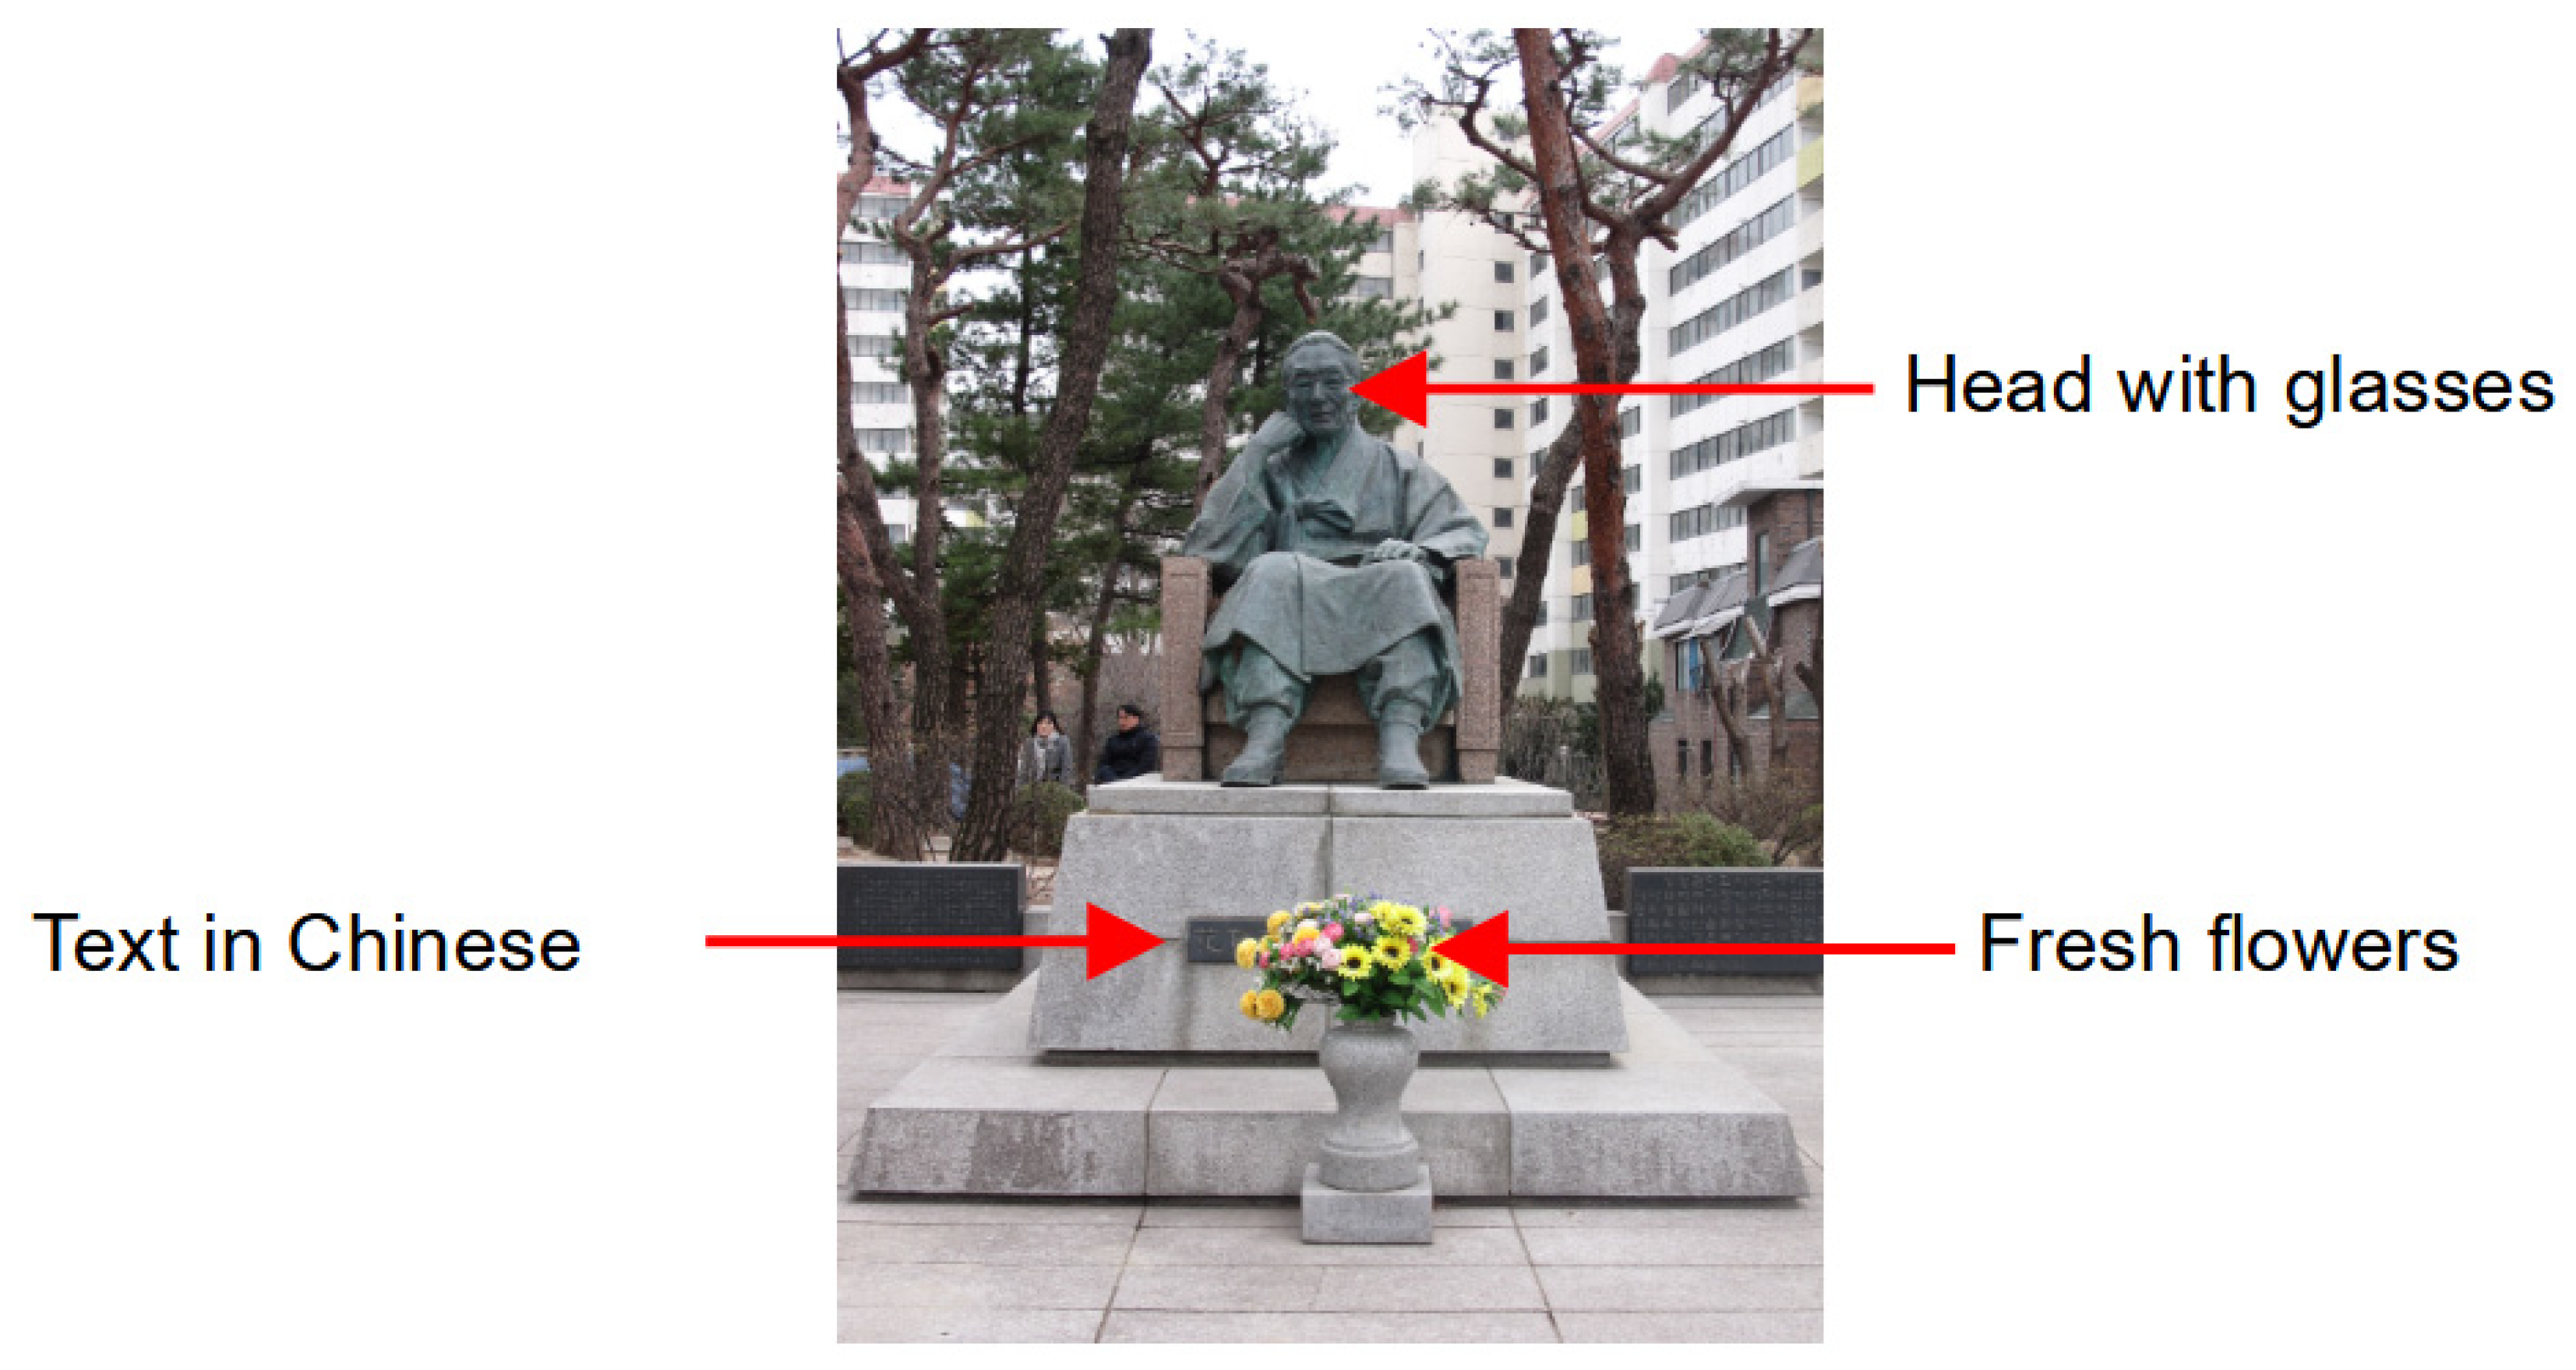
A bronze statue standing several meters tall in the Kwangwoon University garden, as shown in
Figure 3, was selected as the subject for the experiment. This statue boasts a rich array of intricate features, including a head adorned with glasses, engraved Chinese text, and a fresh bouquet. These details were selected to assess the precision and effectiveness of different holographic rendering methods.
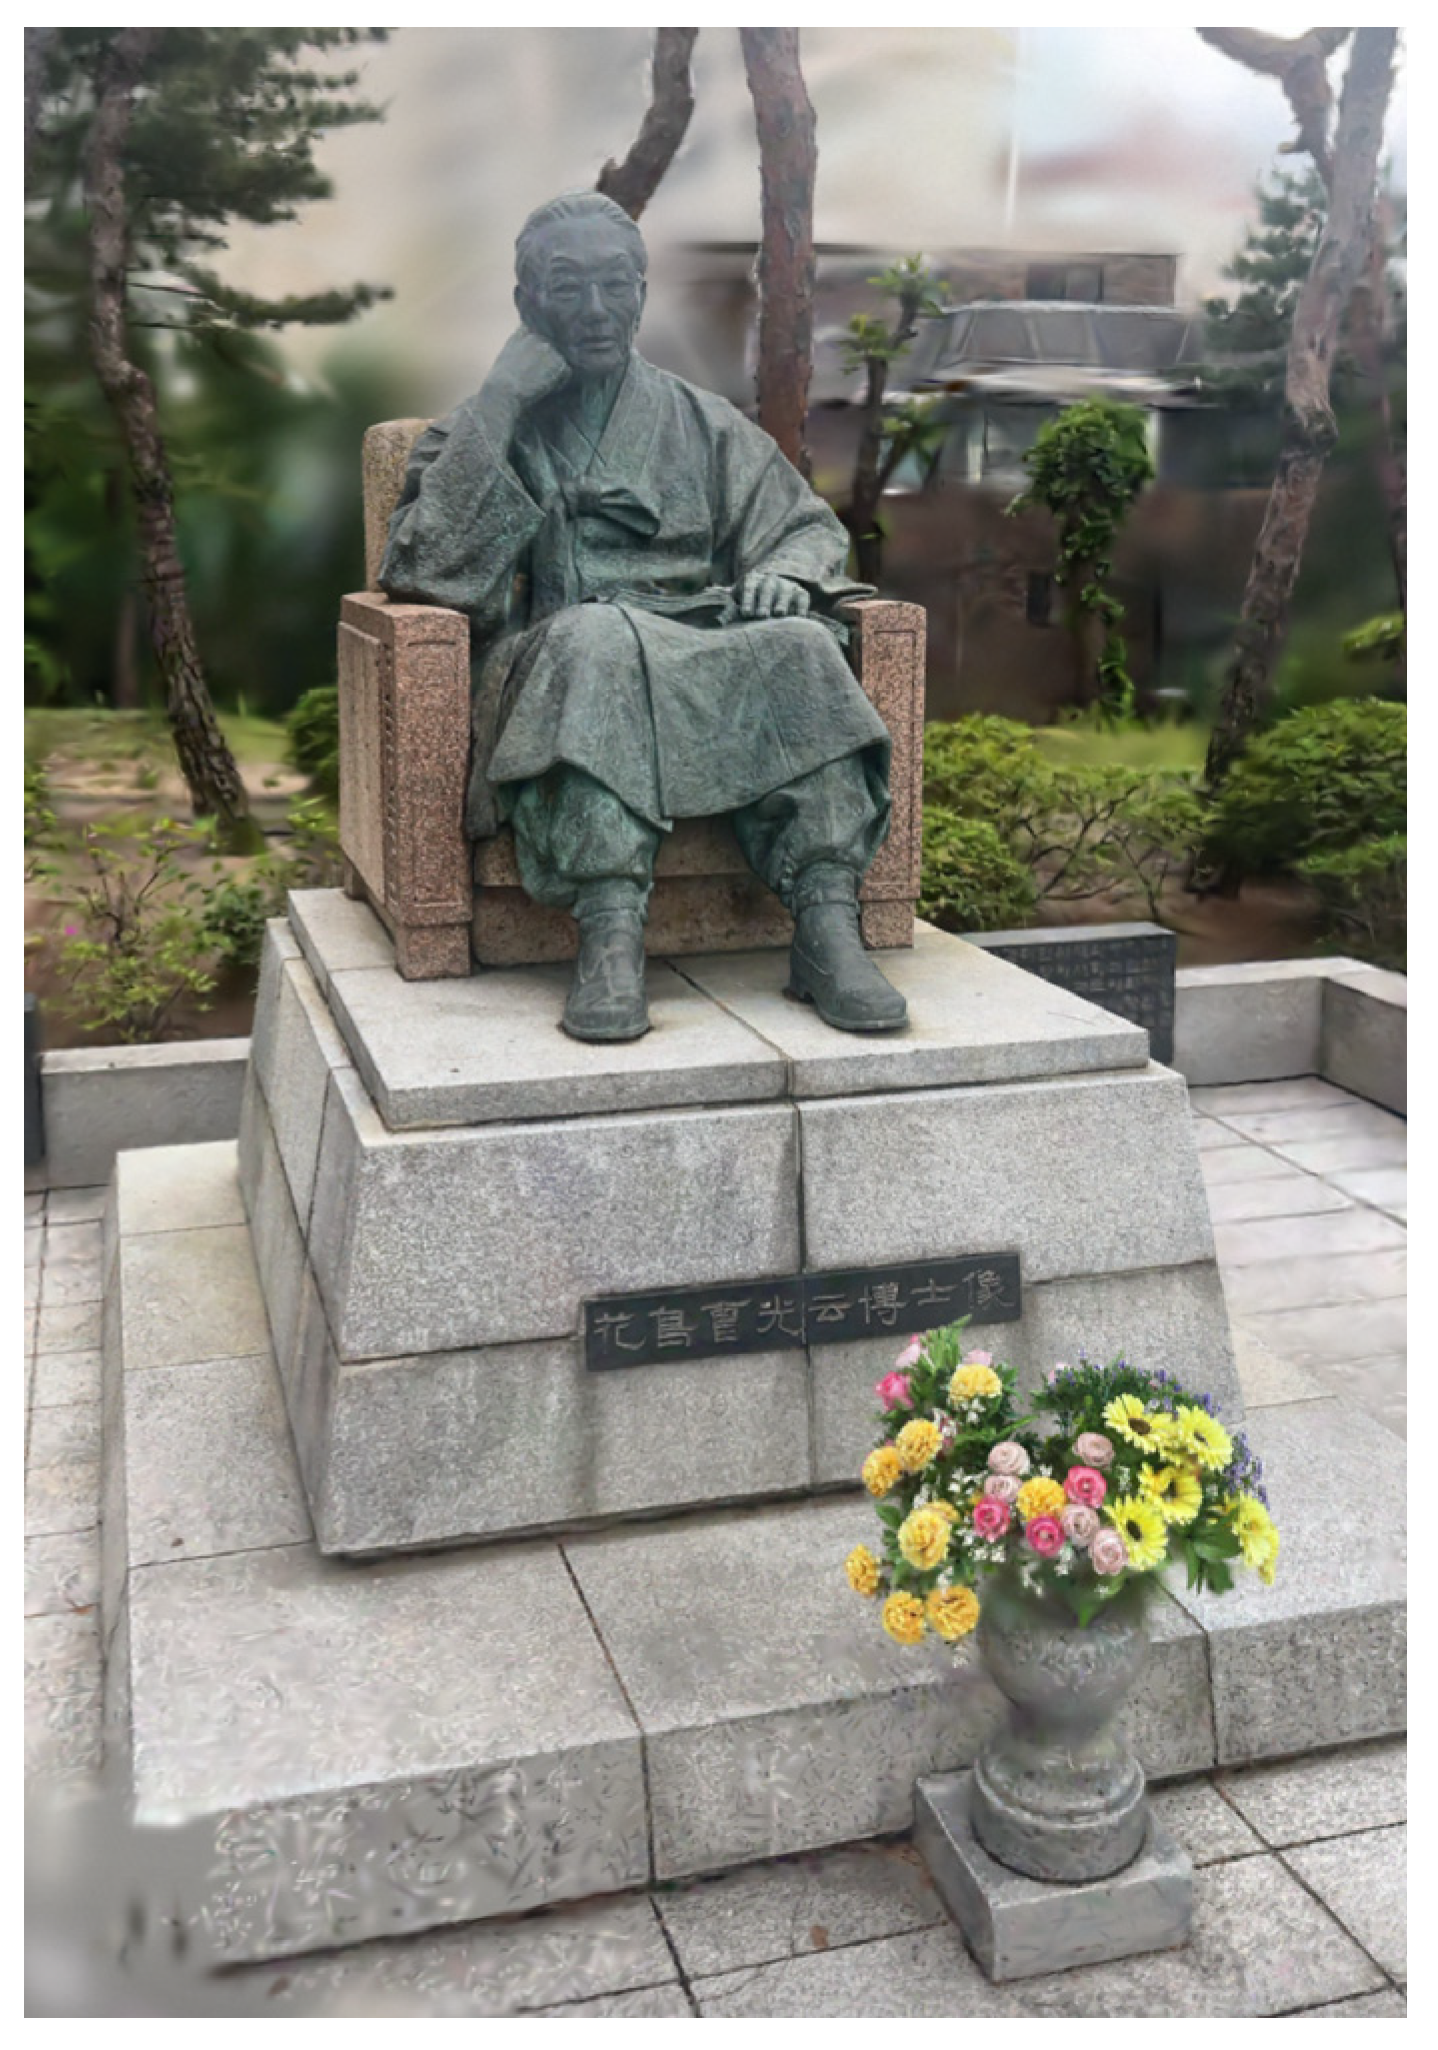
Additionally, four experiments were conducted on a cloudy day to utilize the diffuse lighting conditions provided by overcast skies and without wind to prevent the flowers from moving.
3.2. Interpolation
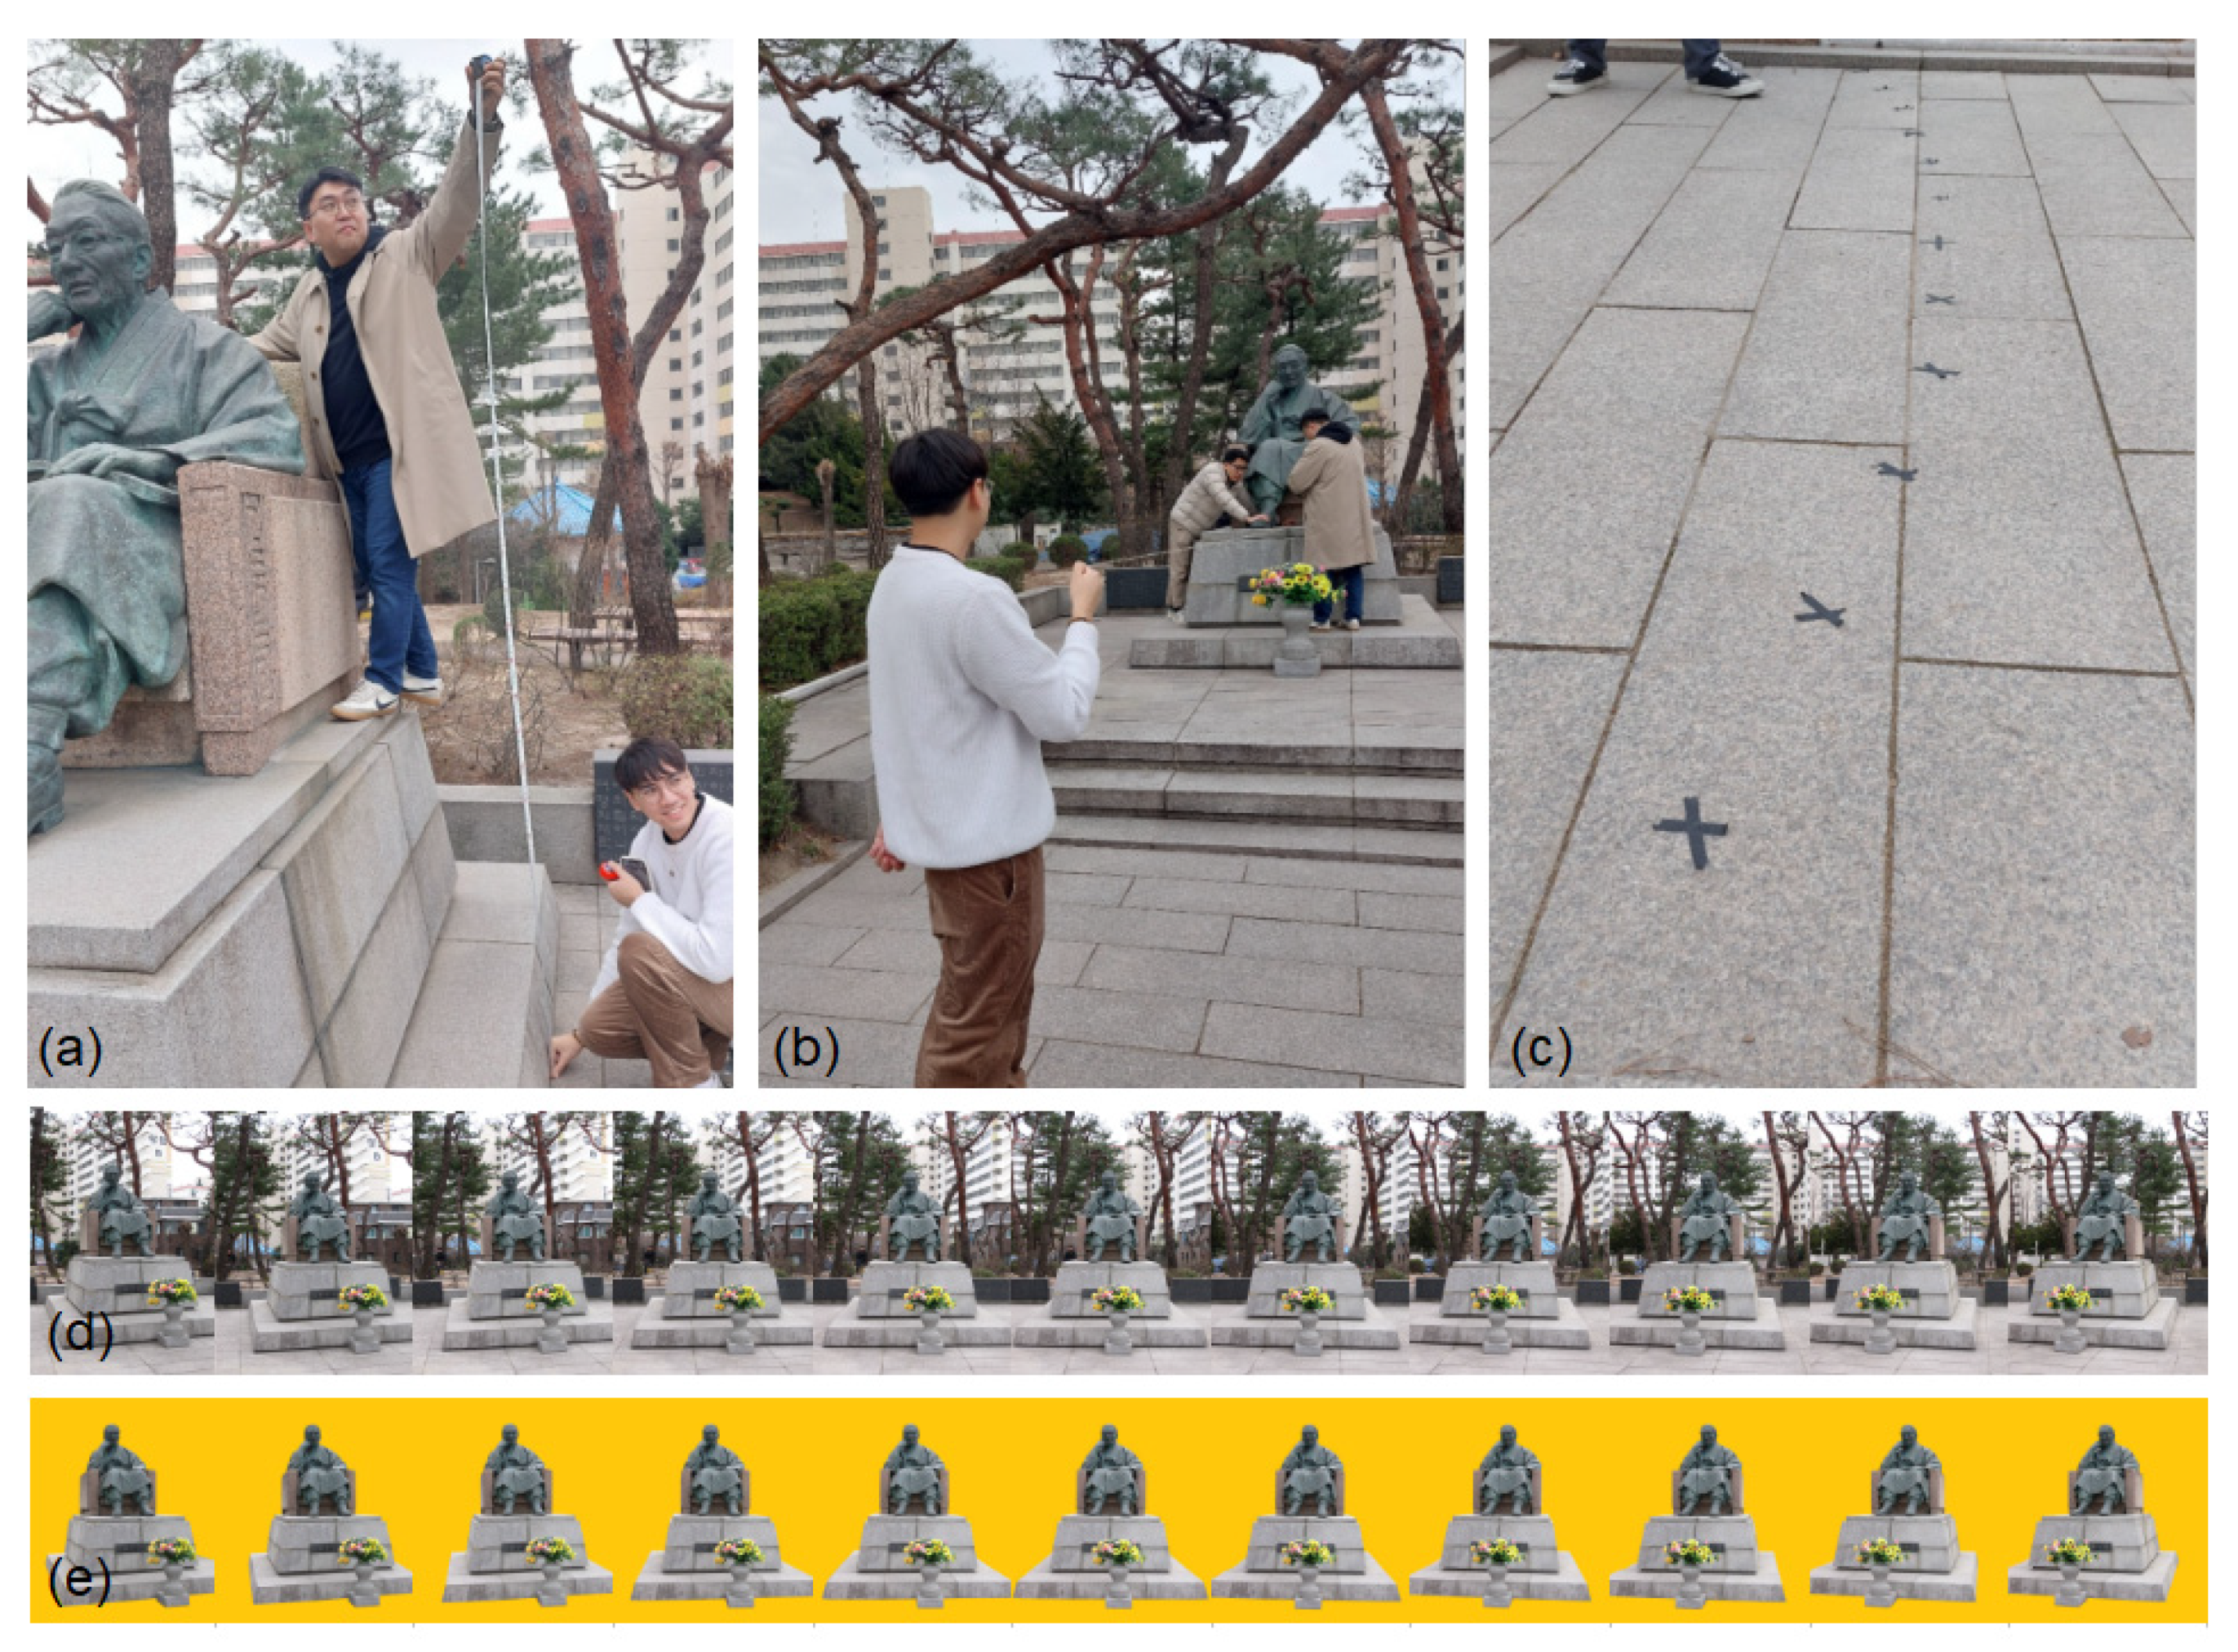
The height of the statue was determined at 3 m using a tape measure (
Figure 4a). Subsequently, a string was extended from a position between the feet to a distance of 6 m (
Figure 4b). Crosses were then marked on the ground using tape at regular intervals of 5° between each point (
Figure 4c). Due to the terrain configuration, only 11 crosses could be placed, resulting in a total arc angle of 50°. All perspective images with a resolution of 3024 × 4032 pixels were captured 5 min later using the iPhone camera mounted on a tripod and the OnionCam2 application (
Figure 4d). Within 2 min, the background was removed using a free online API and replaced with yellow (
Figure 4e). Additionally, 192 perspective images were interpolated within 3 min using the neural network, as shown in
Video S1.
3.3. Photogrammetry
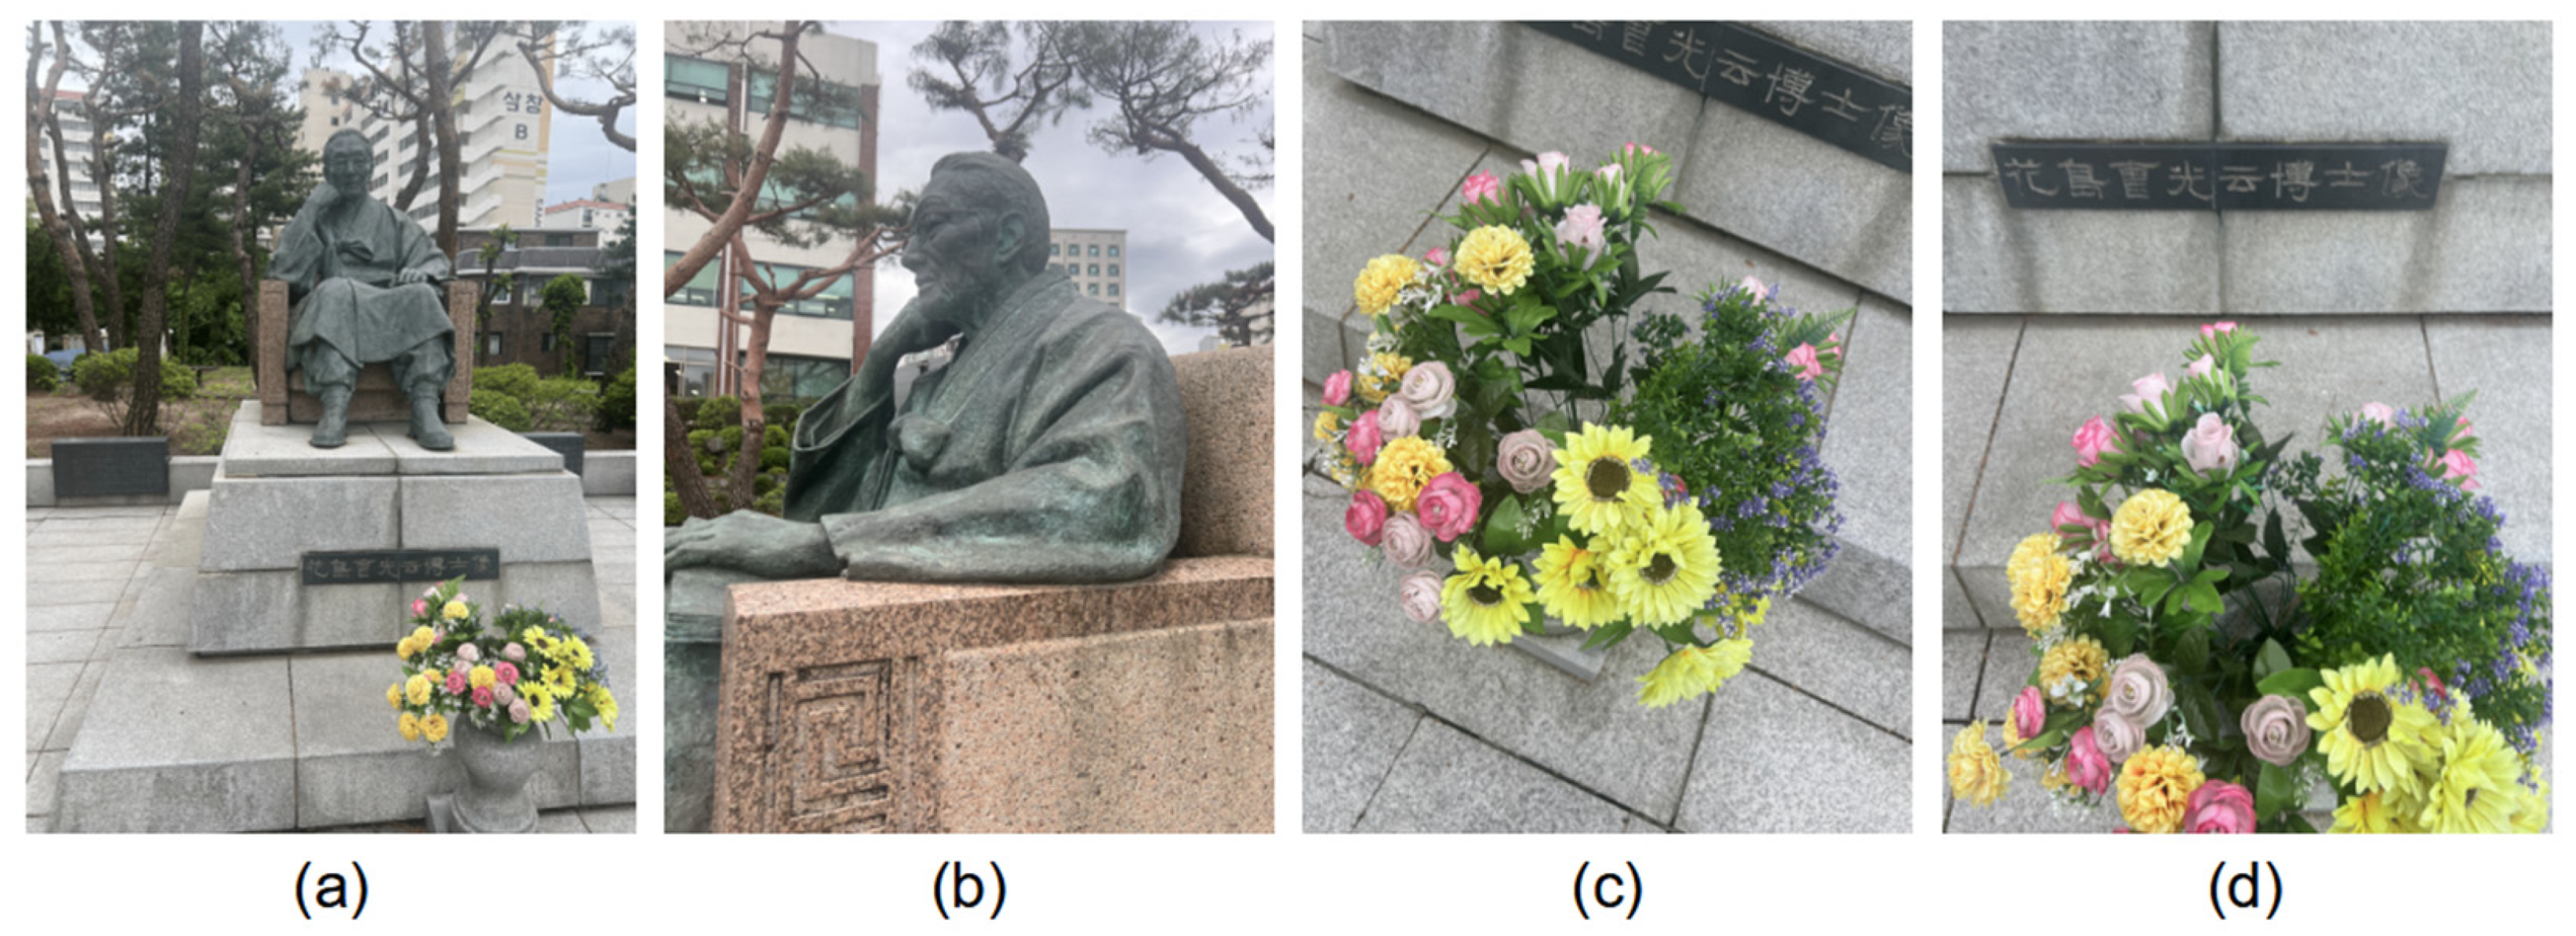
For the photogrammetry method, MetaScan was used to capture a comprehensive set of images of the statue. A total of 75 photos, each with a resolution of 3024 × 4032 pixels, were captured within 2 min. These images were focused on various components and perspectives of the statue to ensure the creation of a detailed and accurate 3D model. This set included 30 global images of the statue taken from different angles (
Figure 5a), 20 detailed images of the statue’s head to capture intricate details such as glasses and facial features (
Figure 5b), 20 images of the bouquet to document its complexity (
Figure 5c), and five images specifically focusing on the engraved text (
Figure 5d).
After the images were collected, they were uploaded to the MetaScan server for processing. The server software analyzed the photographs to construct a precise 3D model, as shown in
Figure 6. This process involved aligning the images, reconstructing the geometry, and texturing the model to accurately reflect the real-world appearance of the statue. A final USDZ (Universal Scene Description Zip) file was generated within 10 min. USDZ is Apple’s latest file format for augmented reality and can be imported into Blender for further editing or visualization.
3.4. Gaussian Splatting
The Gaussian splatting method utilized the Scaniverse application. A single comprehensive 4K/24fps video of the statue, lasting 2 min, was captured and subsequently segmented into distinct parts to ensure detailed analysis and processing. These segments included a global view of the statue to understand its overall structure, close-ups of the statue’s head to capture intricate details such as glasses and facial expressions, a focused segment on the flowers to document their complex textures and movements, and a segment dedicated to the engraved text on the statue. Once segmented, the video was processed entirely using Scaniverse, which automatically aligned the video frames, reconstructed the detailed geometry, and applied Gaussian filters. This process resulted in a dynamic 3D model with texture maps and depth profiles for each part, as illustrated in
Figure 7. A final polygon file format (PLY) was generated within 10 min. The PLY format is commonly used to store 3D model data, including vertices, edges, and faces. This file can be imported into Blender for further editing and visualization.
3.5. LiDAR
MetaScan was utilized to process LiDAR data, capturing a single comprehensive 4K/24fps video lasting 1 min. The advanced processing capabilities of MetaScan were then employed to convert the LiDAR data into a detailed 3D model, as shown in
Figure 8. Sophisticated software algorithms aligned the data points, reconstructed the geometry, and applied high-resolution textures to closely mimic the real-world appearance of the statue. The final USDZ file was generated within 5 min and imported into Blender for further editing or visualization.
3.6. Rendering Perspective Views for 3D Models
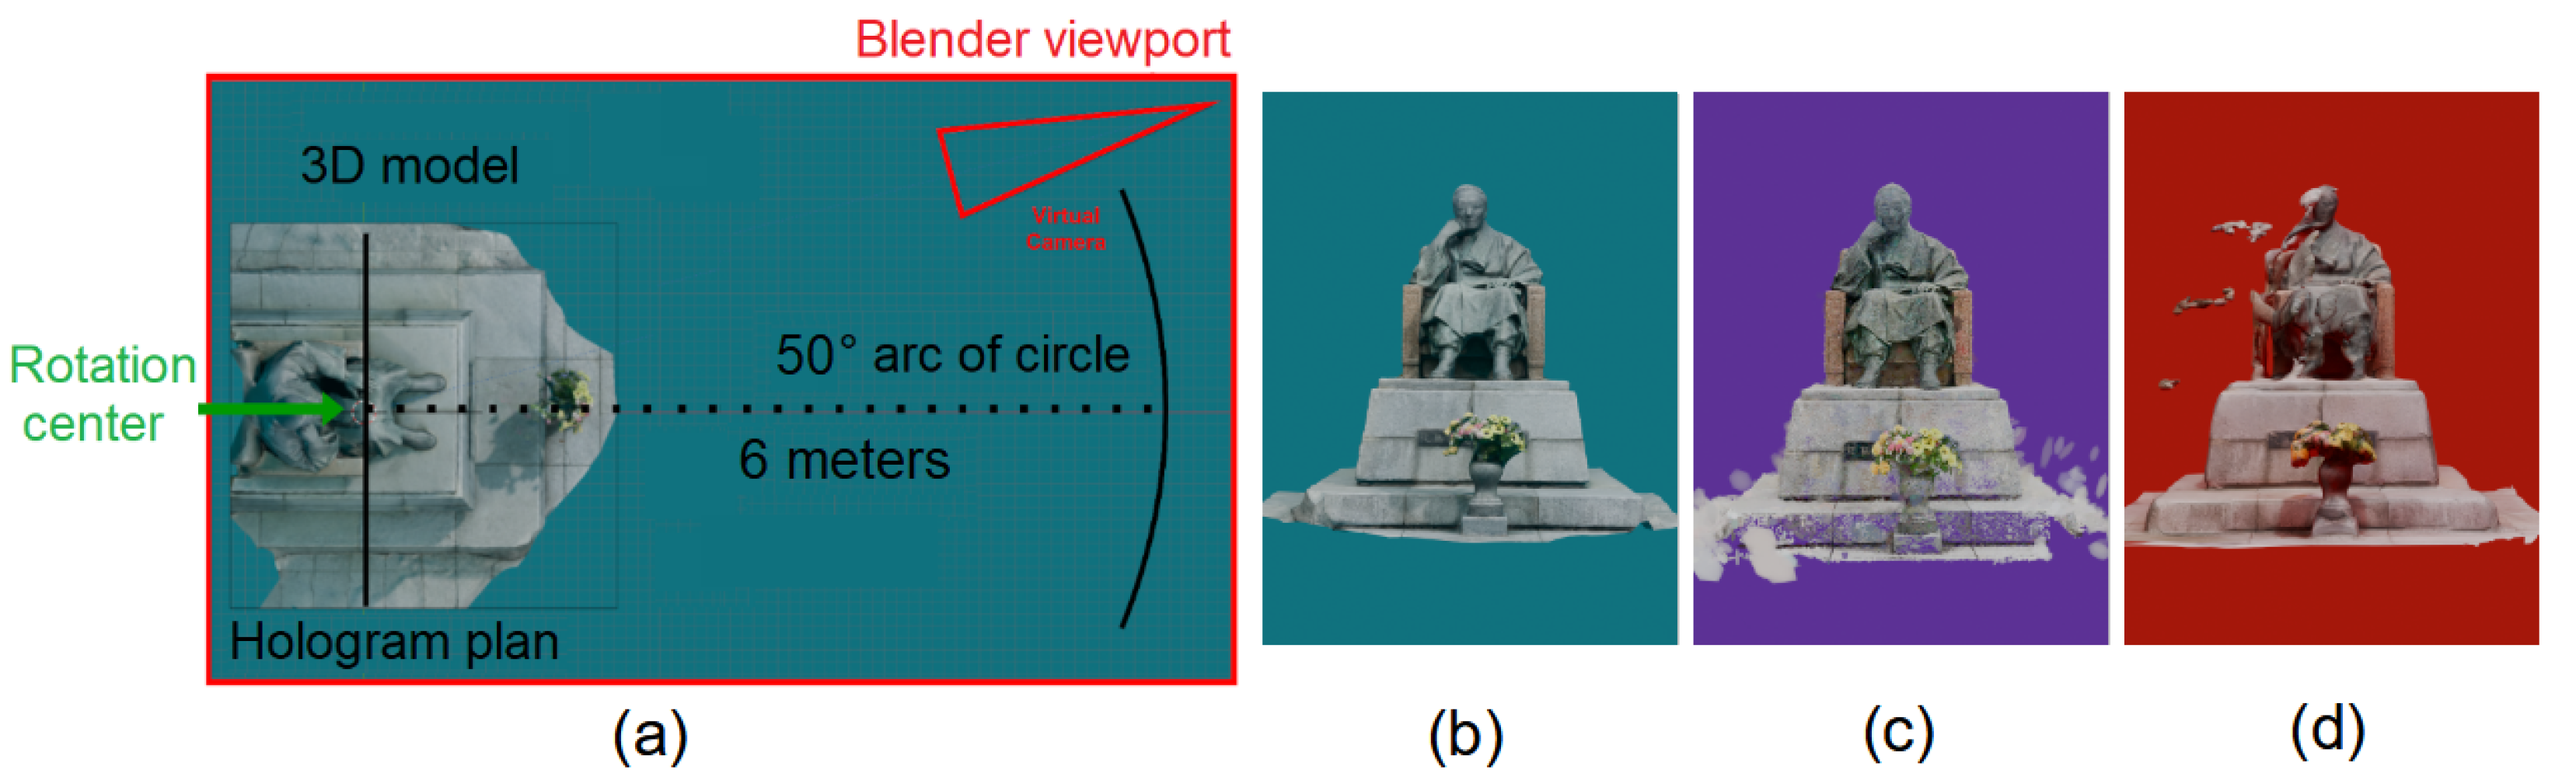
Regardless of the method used to capture and generate the 3D models—whether through photogrammetry, Gaussian splatting, or LiDAR—all models underwent a similar rendering process to prepare for the holographic display. This standardization ensured that the holograms produced were comparable in terms of quality and accuracy, facilitating a fair evaluation of the effectiveness of each technique. Once the 3D models (USDZ and PLY) were created, they were imported into Blender software, where a custom script was applied to capture the perspective images necessary for the CHIMERA system. To maintain consistency across all methods, the rendering parameters were standardized. These included setting a 50-degree field of view and positioning the camera 6 m away from the subject (
Figure 9a). Additionally, the axis of rotation was positioned at the same location for each method to ensure that all perspectives were captured from the same vantage point. Following the interpolate method, backgrounds were removed from all 3D models during the rendering process in Blender and changed to blue for photogrammetry (
Figure 9b), violet for Gaussian splatting (
Figure 9c), and red for LiDAR (
Figure 9d).
The rendering time varied depending on the model’s details and the number of polygons, with perspective images generated in 30 min for photogrammetry and LiDAR, and 1 h for Gaussian splatting. Perspective images are shown in
Videos S2–S4.
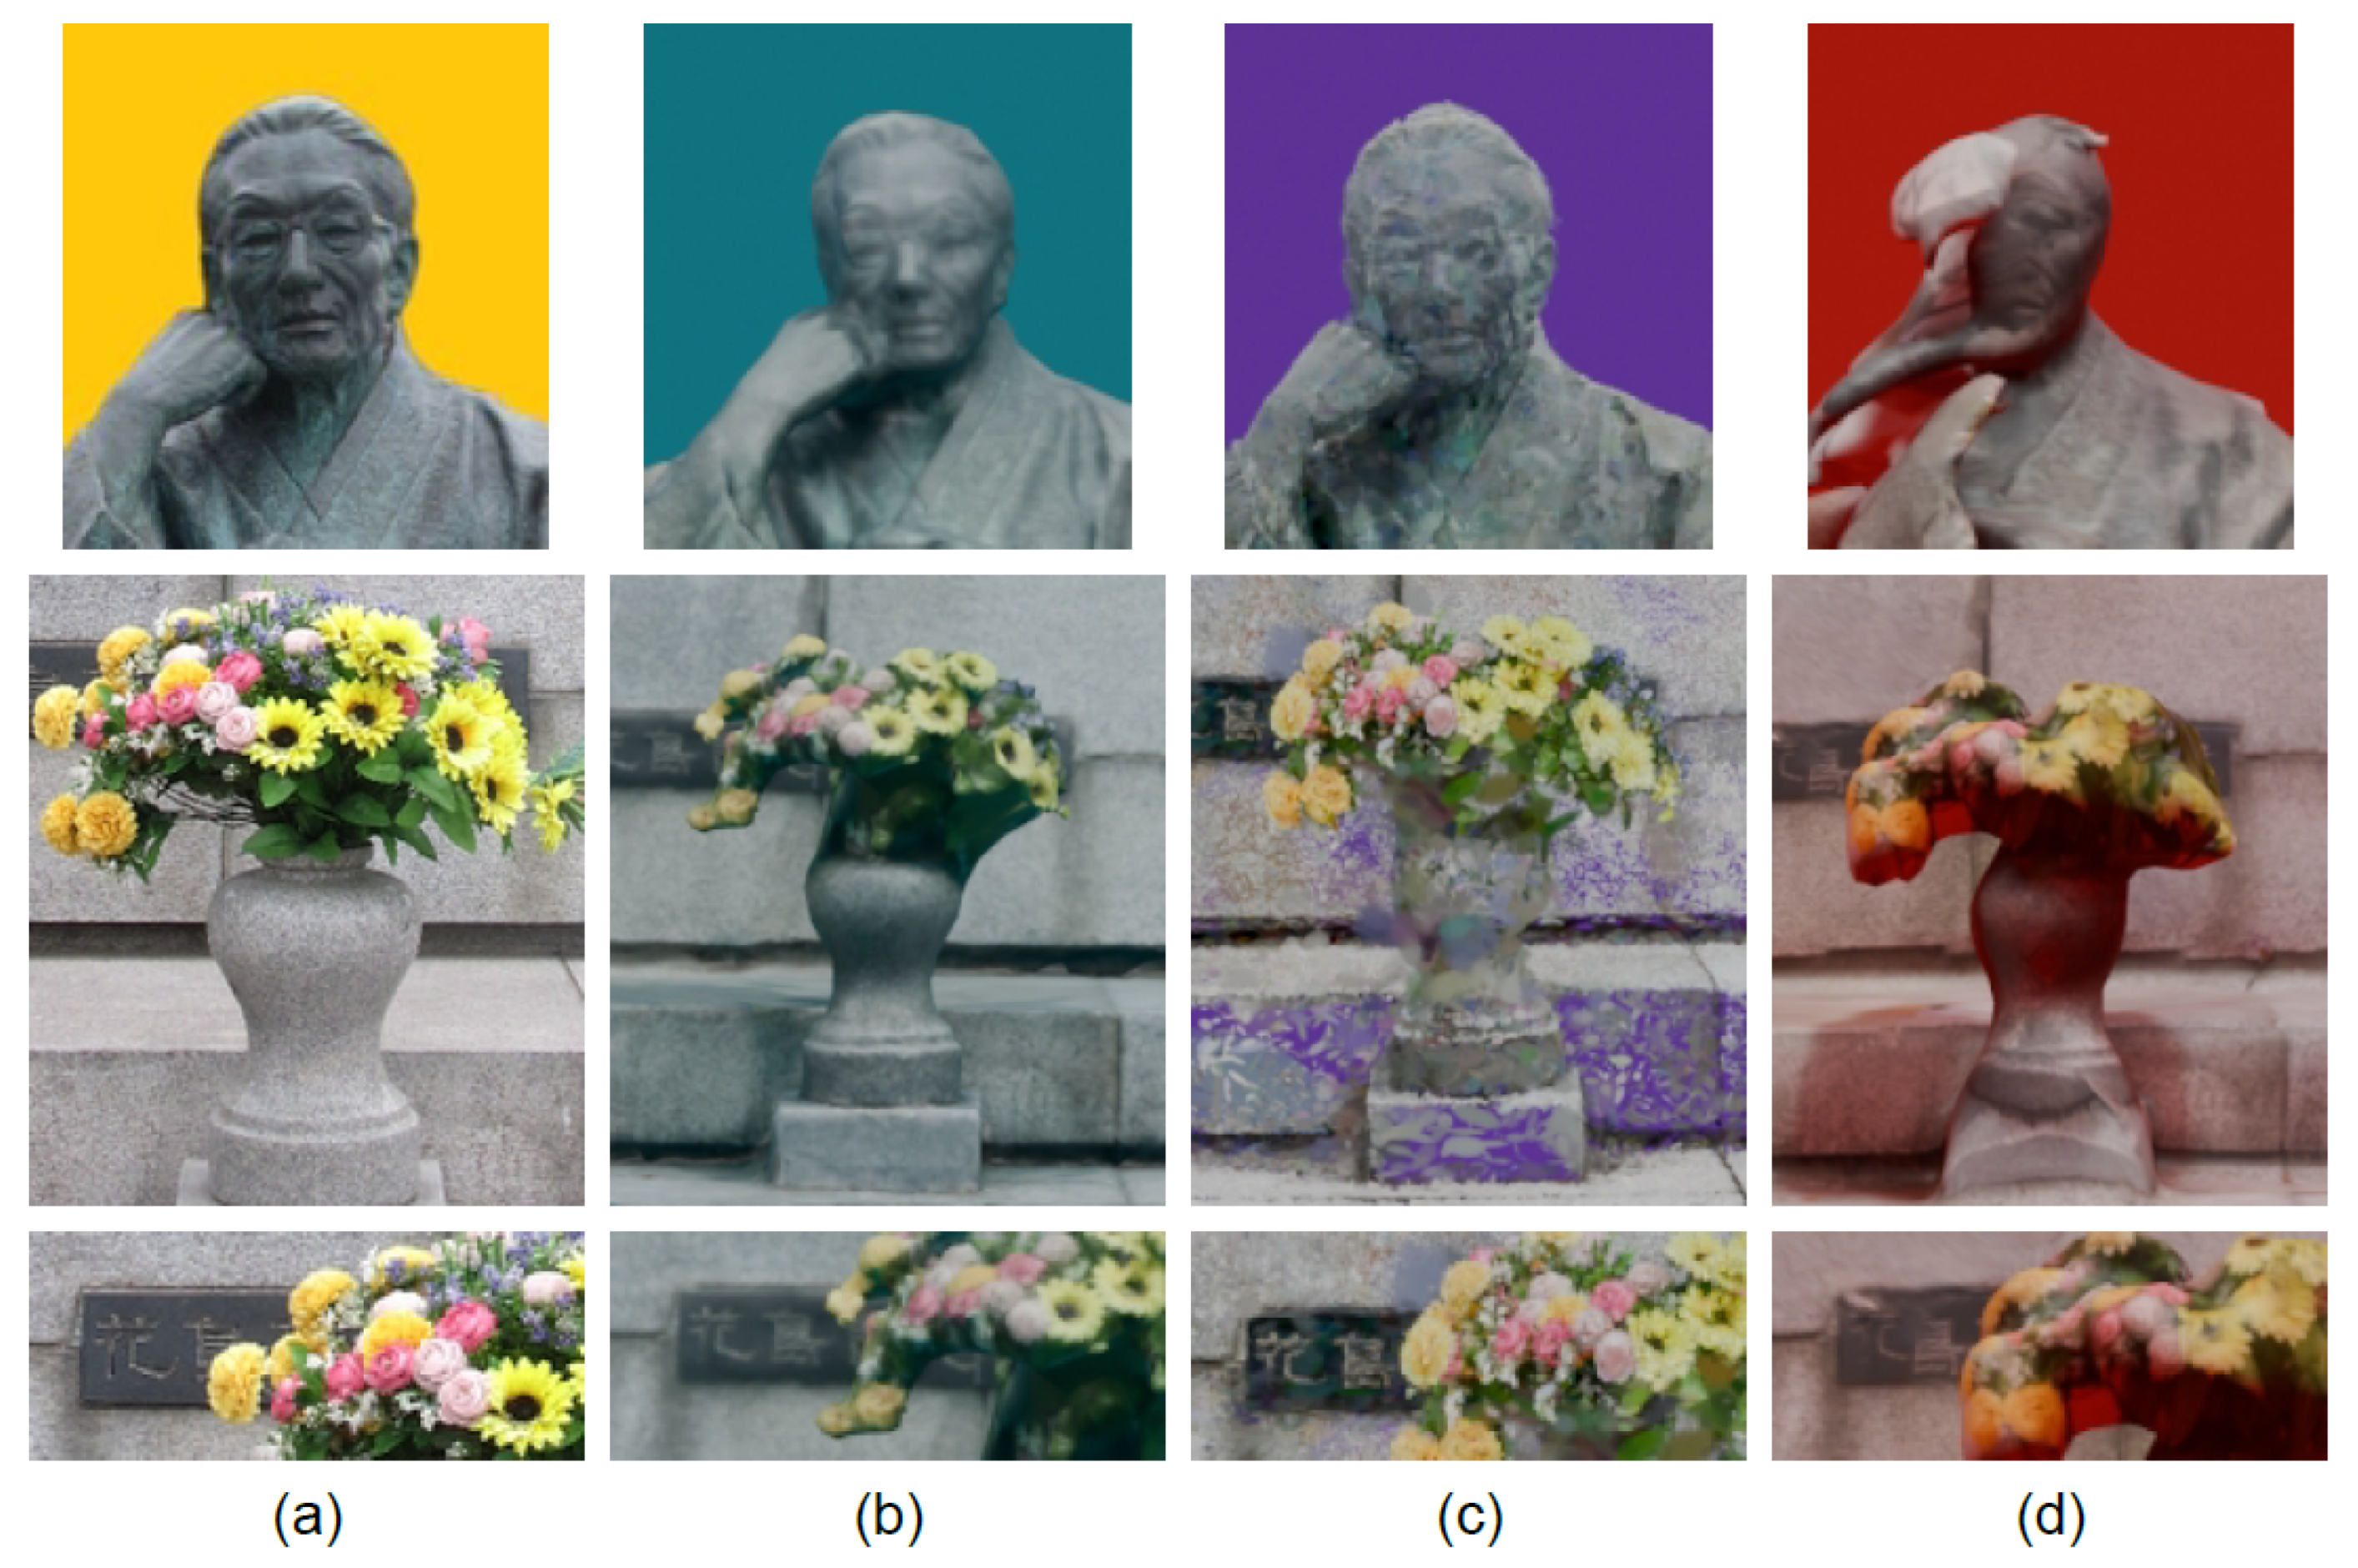
3.7. Visual Comparison of Perspective Images of Four Methods
A comparison of the four interpolation methods (
Figure 10a) alongside photogrammetry (
Figure 10b), Gaussian splatting (
Figure 10c), and LiDAR (
Figure 10d) reveals the distinct characteristics and outcomes of each method, as demonstrated by the results.
The interpolation method yields clear and realistic images in which the textures and details of the statue, text, and flowers are well-preserved. This method excels in detail retention and accurate color representation, making it ideal for applications where visual fidelity is crucial. However, its success is contingent upon the quality of the initial images, and any errors in the alignment during capture can propagate to the final image.
Photogrammetry results in images with medium visual quality. There is a noticeable loss of fine details (such as the glasses on the face, separation of flowers, and legibility of text) and a slight blur, due to the stitching and alignment of multiple images. This method effectively captures the 3D structure and overall form, providing a good balance between detail and depth. However, defects are evident, and color accuracy may vary, impacting visual fidelity.
Gaussian splatting introduces color distortions and noise, particularly purple artifacts around objects. This method offers a unique textural representation that may be useful in artistic applications or where textural depth is more important than color accuracy. Nevertheless, the visual quality is compromised by noticeable artifacts, blurring, and some holes in the model, thus reducing overall realism. While the face, flowers, and text were better reconstructed than with photogrammetry, they were still inferior to the results obtained by interpolation.
LiDAR produces images with significant color distortion and loss of detail, rendering the object less realistic. The text and flowers become unrecognizable, and the rendering of the head completely fails, making it the method with the lowest visual quality among those evaluated. Although LiDAR offers quick capture and processing times and excels at capturing geometric details, its poor color accuracy and lack of detail limit its suitability for applications requiring high visual fidelity.
3.8. Comparison of Processing Times
Interpolation proved to be the fastest method, requiring only 10 min of processing. This method directly generates the necessary perspective views, bypassing the need for a 3D rendering engine such as Blender. In contrast, photogrammetry, Gaussian splatting, and LiDAR methods rely on 3D rendering engines to generate perspective views, which increases the rendering time depending on the level of detail in the model. Photogrammetry required approximately 42 min, Gaussian splatting required approximately 72 min, and LiDAR required approximately 36 min. These differences in rendering times are crucial for determining the suitability of each method for various applications, especially when quick turnaround times are essential.
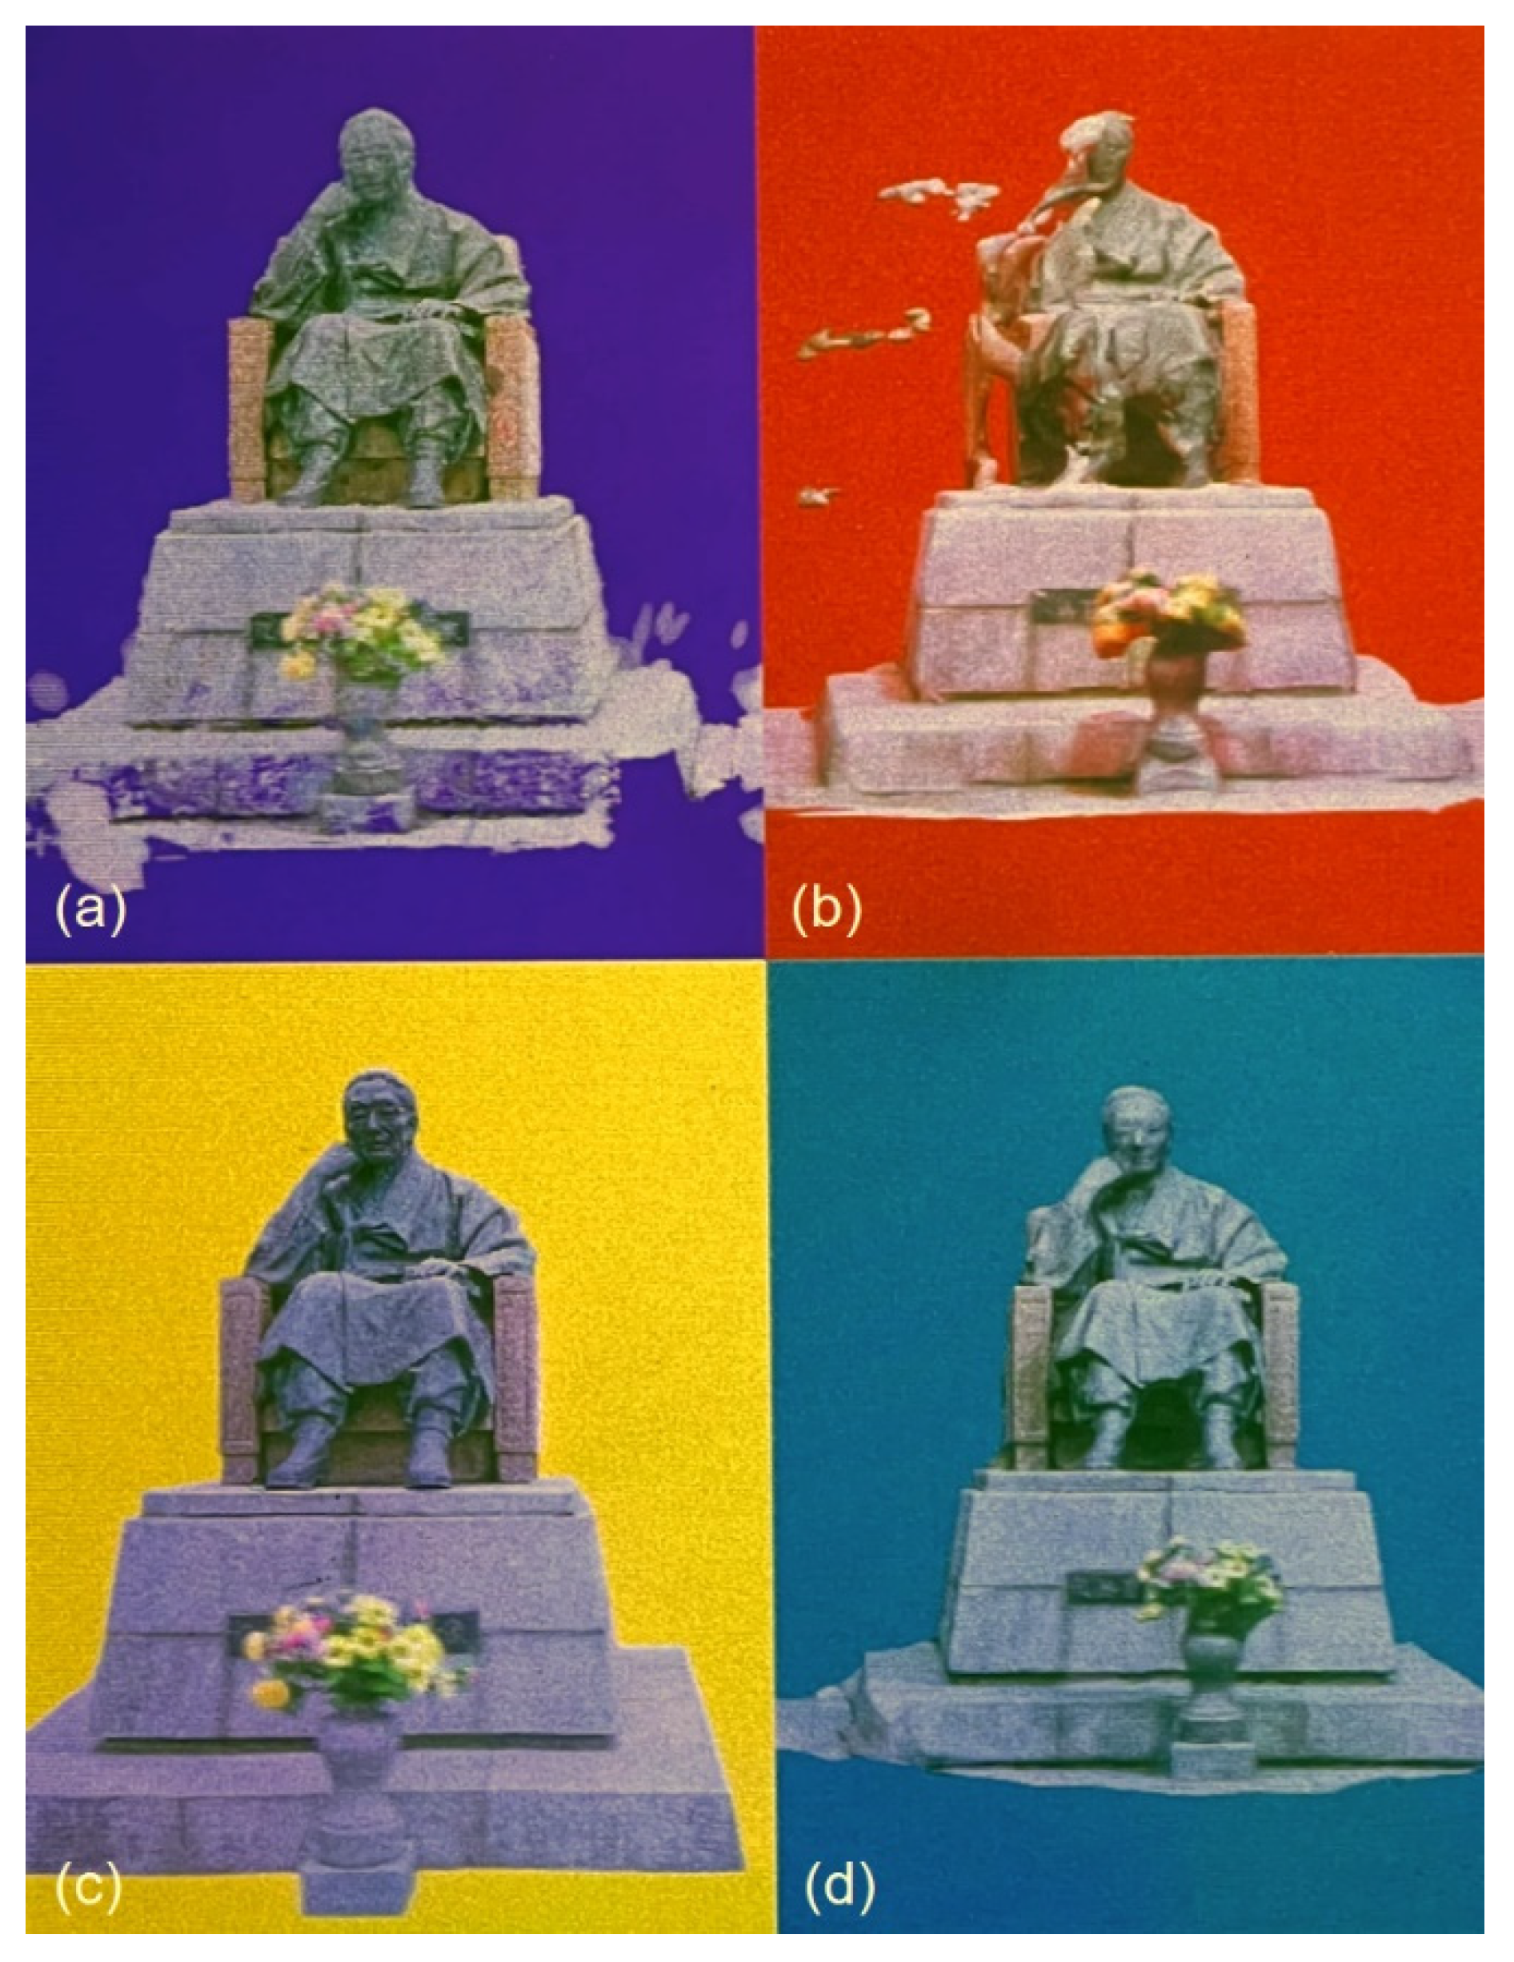
3.9. Final Hologram
Hogels were then generated from these perspective images for the four methods and recorded with a 250 μm resolution, one after another, onto the same 15 × 20 cm U04 holographic plate. When the CHIMERA was illuminated 50 cm from the center of the hologram and at an angle of 45° with an RGB LED lamp, four fine full-color and half-parallax reconstructions of the statue were generated, as shown in
Figure 11 and demonstrated in
Video S5.
Observations of the final holograms confirmed the distinct visual outcomes observed in the perspective images for each method. The interpolation method delivered the highest level of realism and detail. Photogrammetry provided good detail and color accuracy with minor blurring. Gaussian splatting showed artifacts and color distortions, thereby reducing realism. LiDAR exhibited the poorest quality, with significant color distortion and detail loss, making text and flowers unrecognizable, and failing to render the head accurately.
3.10. Results Summary
A comparison of the technology, the processing times, the number of images, and the visual qualities of the four methods—interpolation, photogrammetry, Gaussian splatting, and LiDAR—is shown in
Table 1 below.
4. Discussion
The results of this study confirm that ultra-realistic outdoor holograms can indeed be created using simple tools such as strings, smartphones, free phone applications, and free software. The method that produced the best results in terms of speed and quality was the interpolation method. Photogrammetry and Gaussian splatting provided acceptable results but fell short in terms of achieving realism. LiDAR, unfortunately, failed to produce a realistic image under the specific conditions of this experiment.
Despite its impressive visual realism and accuracy, the interpolation method does have limitations that affect its broad applicability. It requires a controlled environment free from spatial restrictions and obstacles, making it impractical in varied and uncontrolled settings. The necessity of maintaining a proportional distance relative to the size of the object limits scalability, rendering the method less effective in constrained or expansive scenes. Additionally, complex backgrounds can introduce noise and artifacts that impair the visual clarity of the holograms when interpolated and must be suppressed most of the time. Moreover, this method produces holograms with half parallax, and environmental factors such as lighting and weather conditions can impact image quality, introducing variability and affecting reliability. These limitations underscore the importance of careful planning and consideration when deploying holographic projects using interpolation methods. Nevertheless, despite these drawbacks, the interpolation method remains easy to implement and does not require technical skills or professional equipment, making it accessible to a wider audience. It can be performed with any smartphone or camera. This method allows realistic outdoor content holograms to be developed and disseminated to the public on a larger scale and offers potential applications in various fields such as education, art, and entertainment.
3D methods such as photogrammetry, Gaussian splatting, and LiDAR come with inherent limitations, especially when utilized within free 3D modeling applications. These applications often lack the advanced features and robust processing capabilities found in premium software, resulting in potential drawbacks in terms of processing power and model accuracy. They may struggle with large datasets or complex processing tasks required for high-resolution 3D modeling, resulting in longer processing times and potentially lower-quality models. Additionally, these tools often have limited capabilities for post-processing edits such as texture refinement and quality enhancement, which are crucial for improving visual fidelity. Scalability issues may also arise, as these applications may not efficiently handle extensive image datasets or integrate them seamlessly with other tools or systems. Moreover, while photogrammetry and other 3D modeling methods offer advantages, they cannot match the realistic quality achieved by interpolation methods that use actual images. This advantage makes interpolation valuable for producing highly realistic holograms despite its limitations. However, it is worth noting that 3D methods can achieve full-parallax holograms, providing a more immersive viewing experience, albeit typically requiring specialized hardware like an iPhone.
Author Contributions
Conceptualization, P.G.; methodology, P.G. and M.C.; software, M.C.; validation, P.G. and. S.H.L.; investigation, P.G., M.C., B.H.C., J.S.K., N.O.M., J.W.K., T.D.L.P. and A.J.F.U.; resources, S.H.L.; writing—original draft preparation, P.G., M.C., B.H.C., J.S.K., N.O.M., J.W.K., T.D.L.P. and A.J.F.U.; writing—review and editing, P.G. and M.C.; visualization, P.G. and M.C.; supervision, P.G.; project administration, P.G.; funding acquisition, S.H.L. All authors have read and agreed to the published version of the manuscript.
Funding
This research was supported by the MSIT (Ministry of Science and ICT), Korea, under the ITRC (Information Technology Research Center) support program (IITP-2024-2020-0-01846) supervised by the IITP (Institute for Information & Communications Technology Planning & Evaluation); This research was also supported by the Ministry of Culture, Sports and Tourism and Korea Creative Content Agency (Project Number: RS-2024-00401213). The present research was conducted by the Excellent Researcher Support Project of Kwangwoon University in 2022.
Institutional Review Board Statement
Not applicable.
Informed Consent Statement
Not applicable.
Data Availability Statement
The original contributions presented in the study are included in the article/
Supplementary Materials, further inquiries can be directed to the corresponding author.
Conflicts of Interest
The authors declare no conflicts of interest.
References
- Yamaguchi, M.; Koyama, T.; Endoh, H.; Ohyama, N.; Takahashi, S.; Iwata, F. Development of a prototype full-parallax holoprinter. In Practical Holography IX; International Society for Optics and Photonics: Washington, DC, USA, 1995; Volume 2406, pp. 50–56. [Google Scholar]
- Bjelkhagen, H.; Brotherton-Ratcliffe, D. Ultra-Realistic Imaging: Advanced Techniques in Analogue and Digital Colour Holography; CRC Press: Boca Raton, FL, USA, 2013. [Google Scholar]
- Su, J.; Yan, X.; Huang, Y.; Jiang, X.; Chen, Y.; Zhang, T. Progress in the synthetic holographic stereogram printing technique. Appl. Sci. 2018, 8, 851. [Google Scholar] [CrossRef]
- Gentet, Y.; Gentet, P. CHIMERA, a new holoprinter technology combining low-power continuous lasers and fast printing. Appl. Opt. 2019, 58, G226–G230. [Google Scholar] [CrossRef] [PubMed]
- Gentet, P.; Gentet, Y.; Lee, S.H. Ultimate 04 the new reference for ultra-realistic color holography. In Proceedings of the 2017 International Conference on Emerging Trends & Innovation in ICT (ICEI), Pune, India, 3–5 February 2017; pp. 162–166. [Google Scholar]
- Lucente, M. Diffraction-Specific Fringe Computation for Electro-Holography. Ph.D. Dissertation, Massachusetts Institute of Technology, Cambridge, MA, USA, 1994. [Google Scholar]
- Gentet, P.; Gentet, Y.; Lee, S. An in-house-designed scanner for CHIMERA holograms. In Practical Holography XXXVII: Displays, Materials, and Applications; SPIE: Bellingham, WA, USA, 2023; Volume 12445, pp. 79–83. [Google Scholar]
- Malihi, S.; Valadan Zoej, M.J.; Hahn, M.; Mokhtarzade, M.; Arefi, H. 3D building reconstruction using dense photogrammetric point cloud. Int. Arch. Photogramm. Remote Sens. Spatial Inf. Sci. 2016, 41, 71–74. [Google Scholar] [CrossRef]
- Shashi, M.; Jain, K. Use of photogrammetry in 3D modeling and visualization of buildings. ARPN J. Eng. Appl. Sci. 2007, 2, 37–40. [Google Scholar]
- Kerbl, B.; Kopanas, G.; Leimkühler, T.; Drettakis, G. 3D Gaussian splatting for real-time radiance field rendering. ACM Trans. Graph. 2023, 42, 139–141. [Google Scholar] [CrossRef]
- Cai, Z.; Yang, J.; Wang, T.; Huang, H.; Guo, Y. 3D Reconstruction of Buildings Based on 3D Gaussian Splatting. Int. Arch. Photogramm. Remote Sens. Spat. Inf. Sci. 2024, 48, 37–43. [Google Scholar] [CrossRef]
- Vizzo, I.; Mersch, B.; Marcuzzi, R.; Wiesmann, L.; Behley, J.; Stachniss, C. Make it dense: Self-supervised geometric scan completion of sparse 3D lidar scans in large outdoor environments. IEEE Robot. Autom. Lett. 2022, 7, 8534–8541. [Google Scholar] [CrossRef]
- Cheng, L.; Gong, J.; Li, M.; Liu, Y. 3D building model reconstruction from multi-view aerial imagery and lidar data. Photogramm. Eng. Remote Sens. 2011, 77, 125–139. [Google Scholar] [CrossRef]
- Polat, N. Availability of iPhone 13 Pro laser data in 3D modeling. Adv. LiDAR 2022, 2, 10–14. [Google Scholar]
- Gentet, P.; Coffin, M.; Gentet, Y.; Lee, S.-H. Recording of full-color snapshot digital holographic portraits using neural network image interpolation. Appl. Sci. 2023, 13, 12289. [Google Scholar] [CrossRef]
- Gentet, P.; Gentet, Y.; Lee, S. Creating a 3D hologram from a stereoscopic pair thanks to AI and CHIMERA. In Practical Holography XXXVIII: Displays, Materials, and Applications; SPIE: Bellingham, WA, USA, 2024; Volume 12910, pp. 9–12. [Google Scholar]
- Reda, F.; Kontkanen, J.; Tabellion, E.; Sun, D.; Pantofaru, C.; Curless, B. Film: Frame interpolation for large motion. In European Conference on Computer Vision; Springer: Cham, Switzerland, 2022; pp. 250–266. [Google Scholar]
- Bătrîna, D.Ș.; Sticlaru, C. Processing and analysis of the data obtained using photogrammetry for 3D scanning. Robot. Manag. 2023, 28, 2. [Google Scholar] [CrossRef]
- Kłosowski, J. Validation of the Accuracy and Precision of Scaniverse Scanning Application (Apple iPhone 13 Pro) by Utilizing Metrological Tests and Statistical Inference. Ph.D. Dissertation, Zakład Geodezji Inżynieryjnej i Systemów Pomiarowych, Base of Knowledge Warsaw University of Technology, Warsaw, Poland, 2023. [Google Scholar]
- Chase, P.; Clarke, K.; Hawkes, A.; Jabari, S.; Jakus, J. Apple iPhone 13 Pro LiDAR accuracy assessment for engineering applications. Transf. Constr. Real. Capture Technol. 2022. Available online: https://conferences.lib.unb.ca/index.php/tcrc/article/view/645 (accessed on 1 May 2024).
- Bonatti, C.; Crovisier, S.; Diaz, L.; Wilkinson, A. What is… a blender? arXiv 2016, arXiv:1608.02848. [Google Scholar] [CrossRef]
Figure 1.
CHIMERA recording. Acquisition of up to 768 perspective images of a 3D scene on a maximum 120-degree arc of a circle.
Figure 1.
CHIMERA recording. Acquisition of up to 768 perspective images of a 3D scene on a maximum 120-degree arc of a circle.
Figure 2.
Interpolation method. A string is drawn from the scene (a), crosses are placed on the ground with adhesive tape at regular intervals (b) and images are then captured using a camera on a tripod and onion-skinning technique (c).
Figure 2.
Interpolation method. A string is drawn from the scene (a), crosses are placed on the ground with adhesive tape at regular intervals (b) and images are then captured using a camera on a tripod and onion-skinning technique (c).
Figure 3.
Subject of experiment. Huge bronze statue with a rich array of detailed features, including a head adorned with glasses, engraved text in Chinese, and fresh flowers.
Figure 3.
Subject of experiment. Huge bronze statue with a rich array of detailed features, including a head adorned with glasses, engraved text in Chinese, and fresh flowers.
Figure 4.
Interpolation method. The height of the statue was measured (a), a string was used to set capture distance (b), and crosses were placed at regular intervals (c). Eleven images were captured using a tripod and OnionCam2 app (d), and backgrounds were removed (e).
Figure 4.
Interpolation method. The height of the statue was measured (a), a string was used to set capture distance (b), and crosses were placed at regular intervals (c). Eleven images were captured using a tripod and OnionCam2 app (d), and backgrounds were removed (e).
Figure 5.
A set of 75 images were captured for photogrammetry: 30 global images from different angles (a), 20 of the statue’s head (b), 20 of the bouquet (c), and 5 focusing on the text (d).
Figure 5.
A set of 75 images were captured for photogrammetry: 30 global images from different angles (a), 20 of the statue’s head (b), 20 of the bouquet (c), and 5 focusing on the text (d).
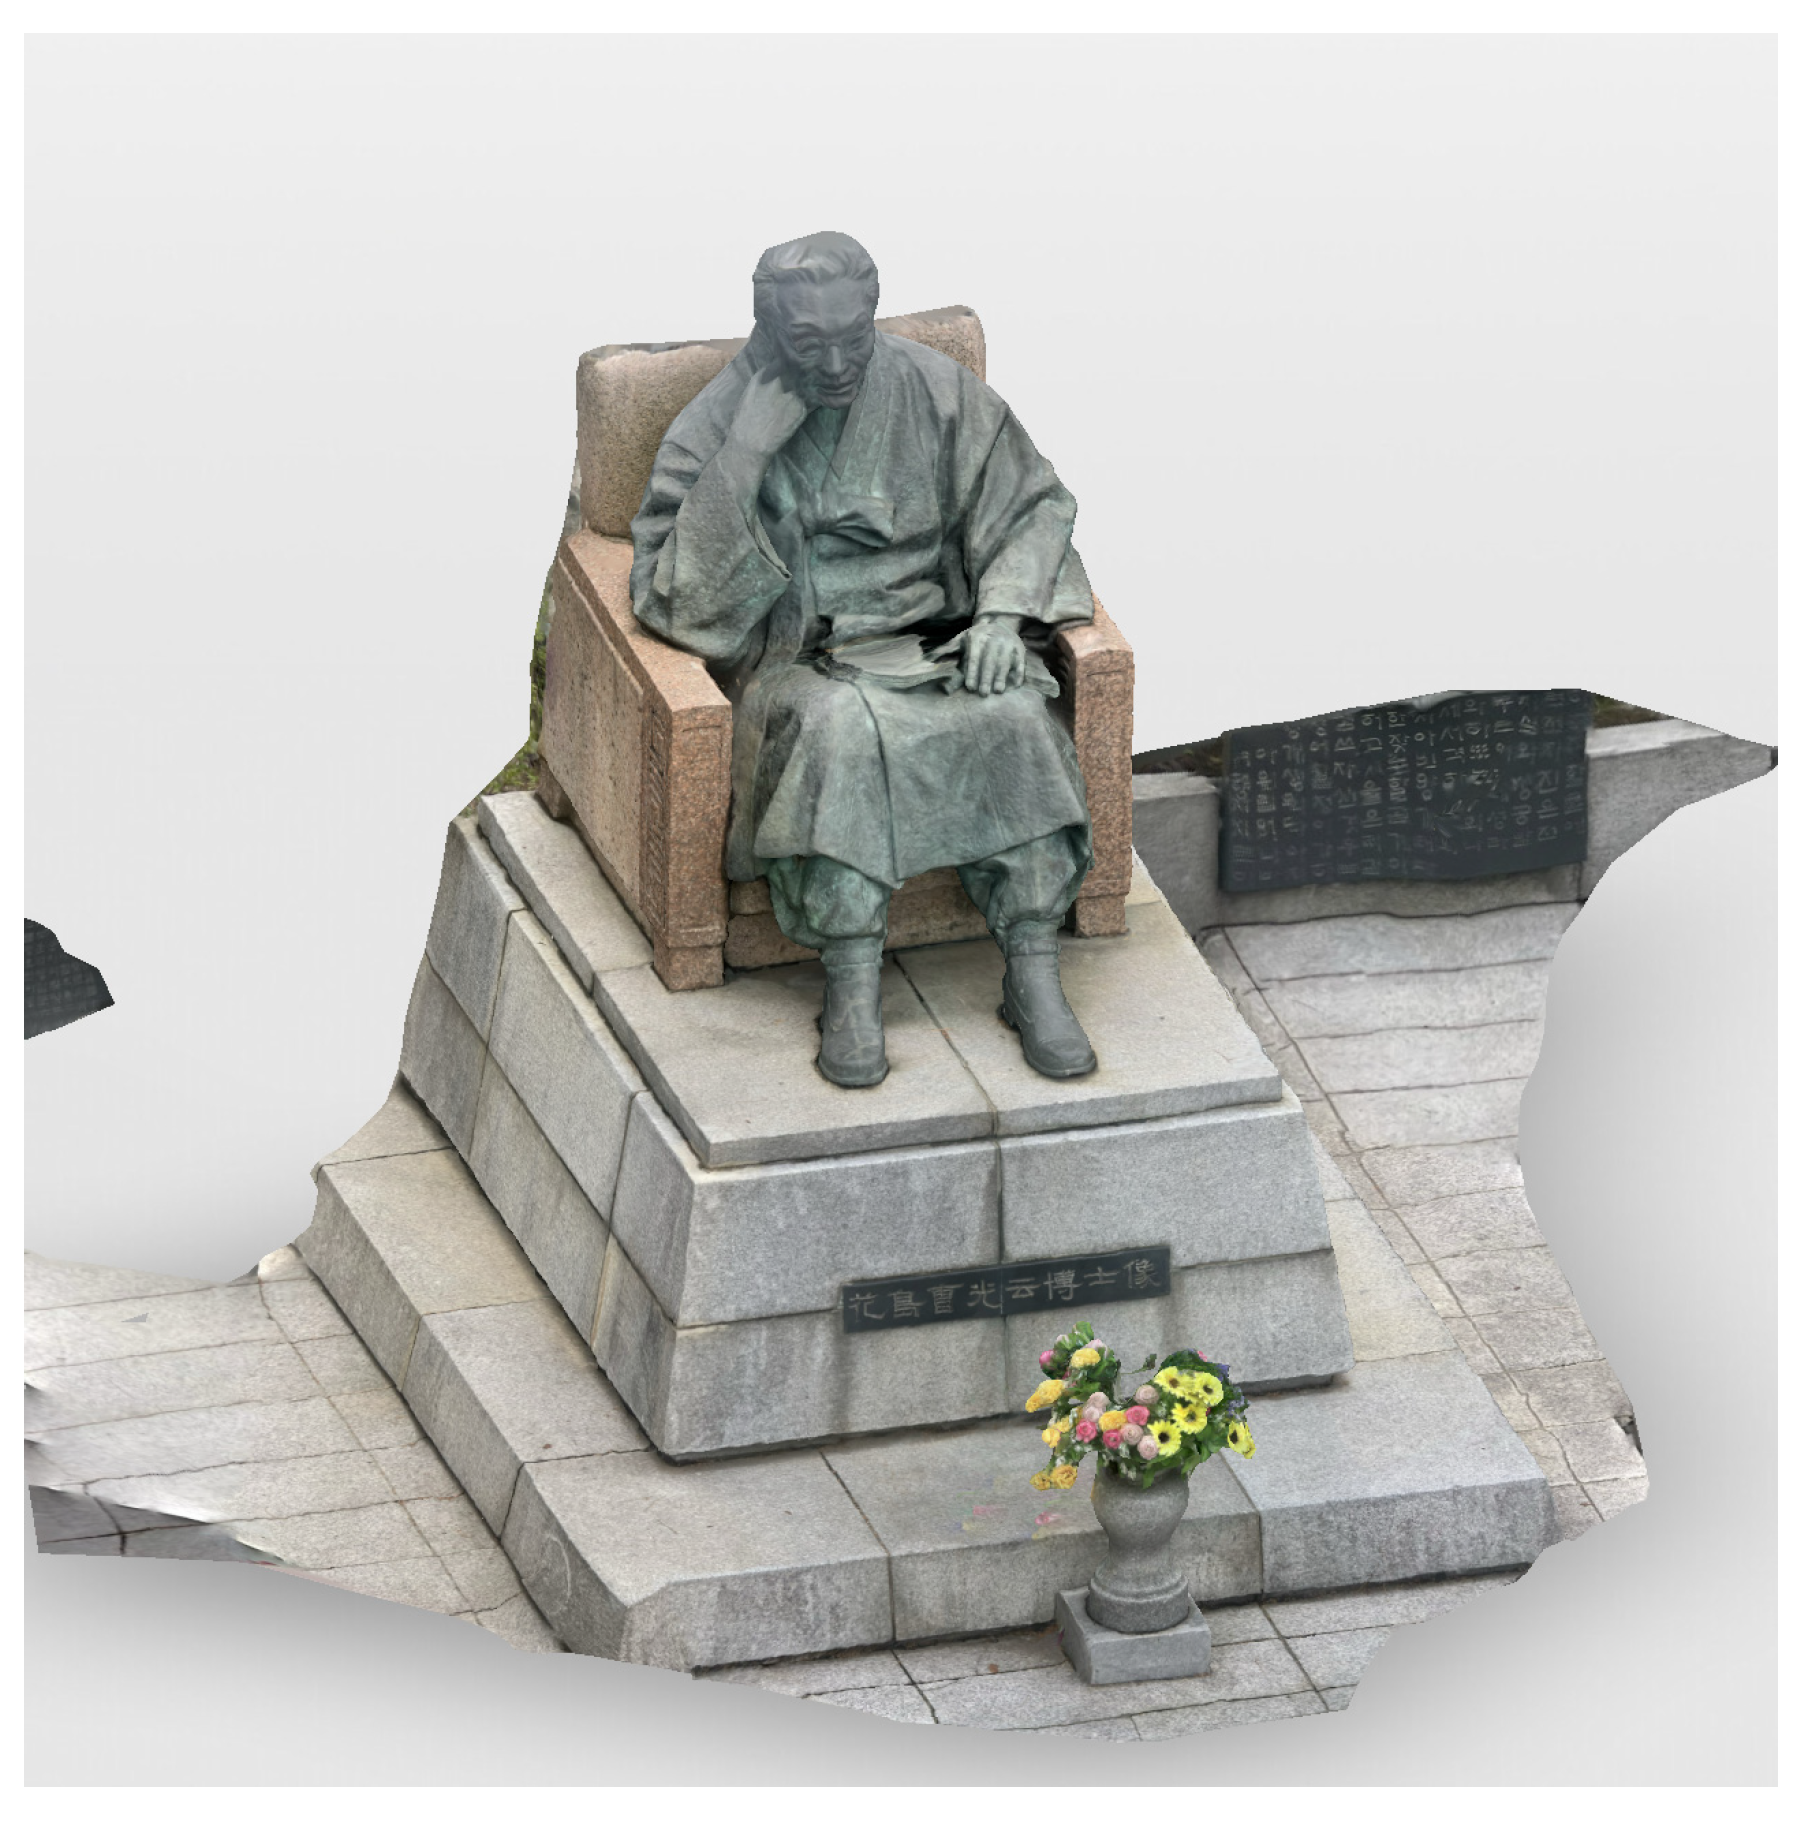
Figure 6.
3D model reconstructed with photogrammetry and Metascan software.
Figure 6.
3D model reconstructed with photogrammetry and Metascan software.
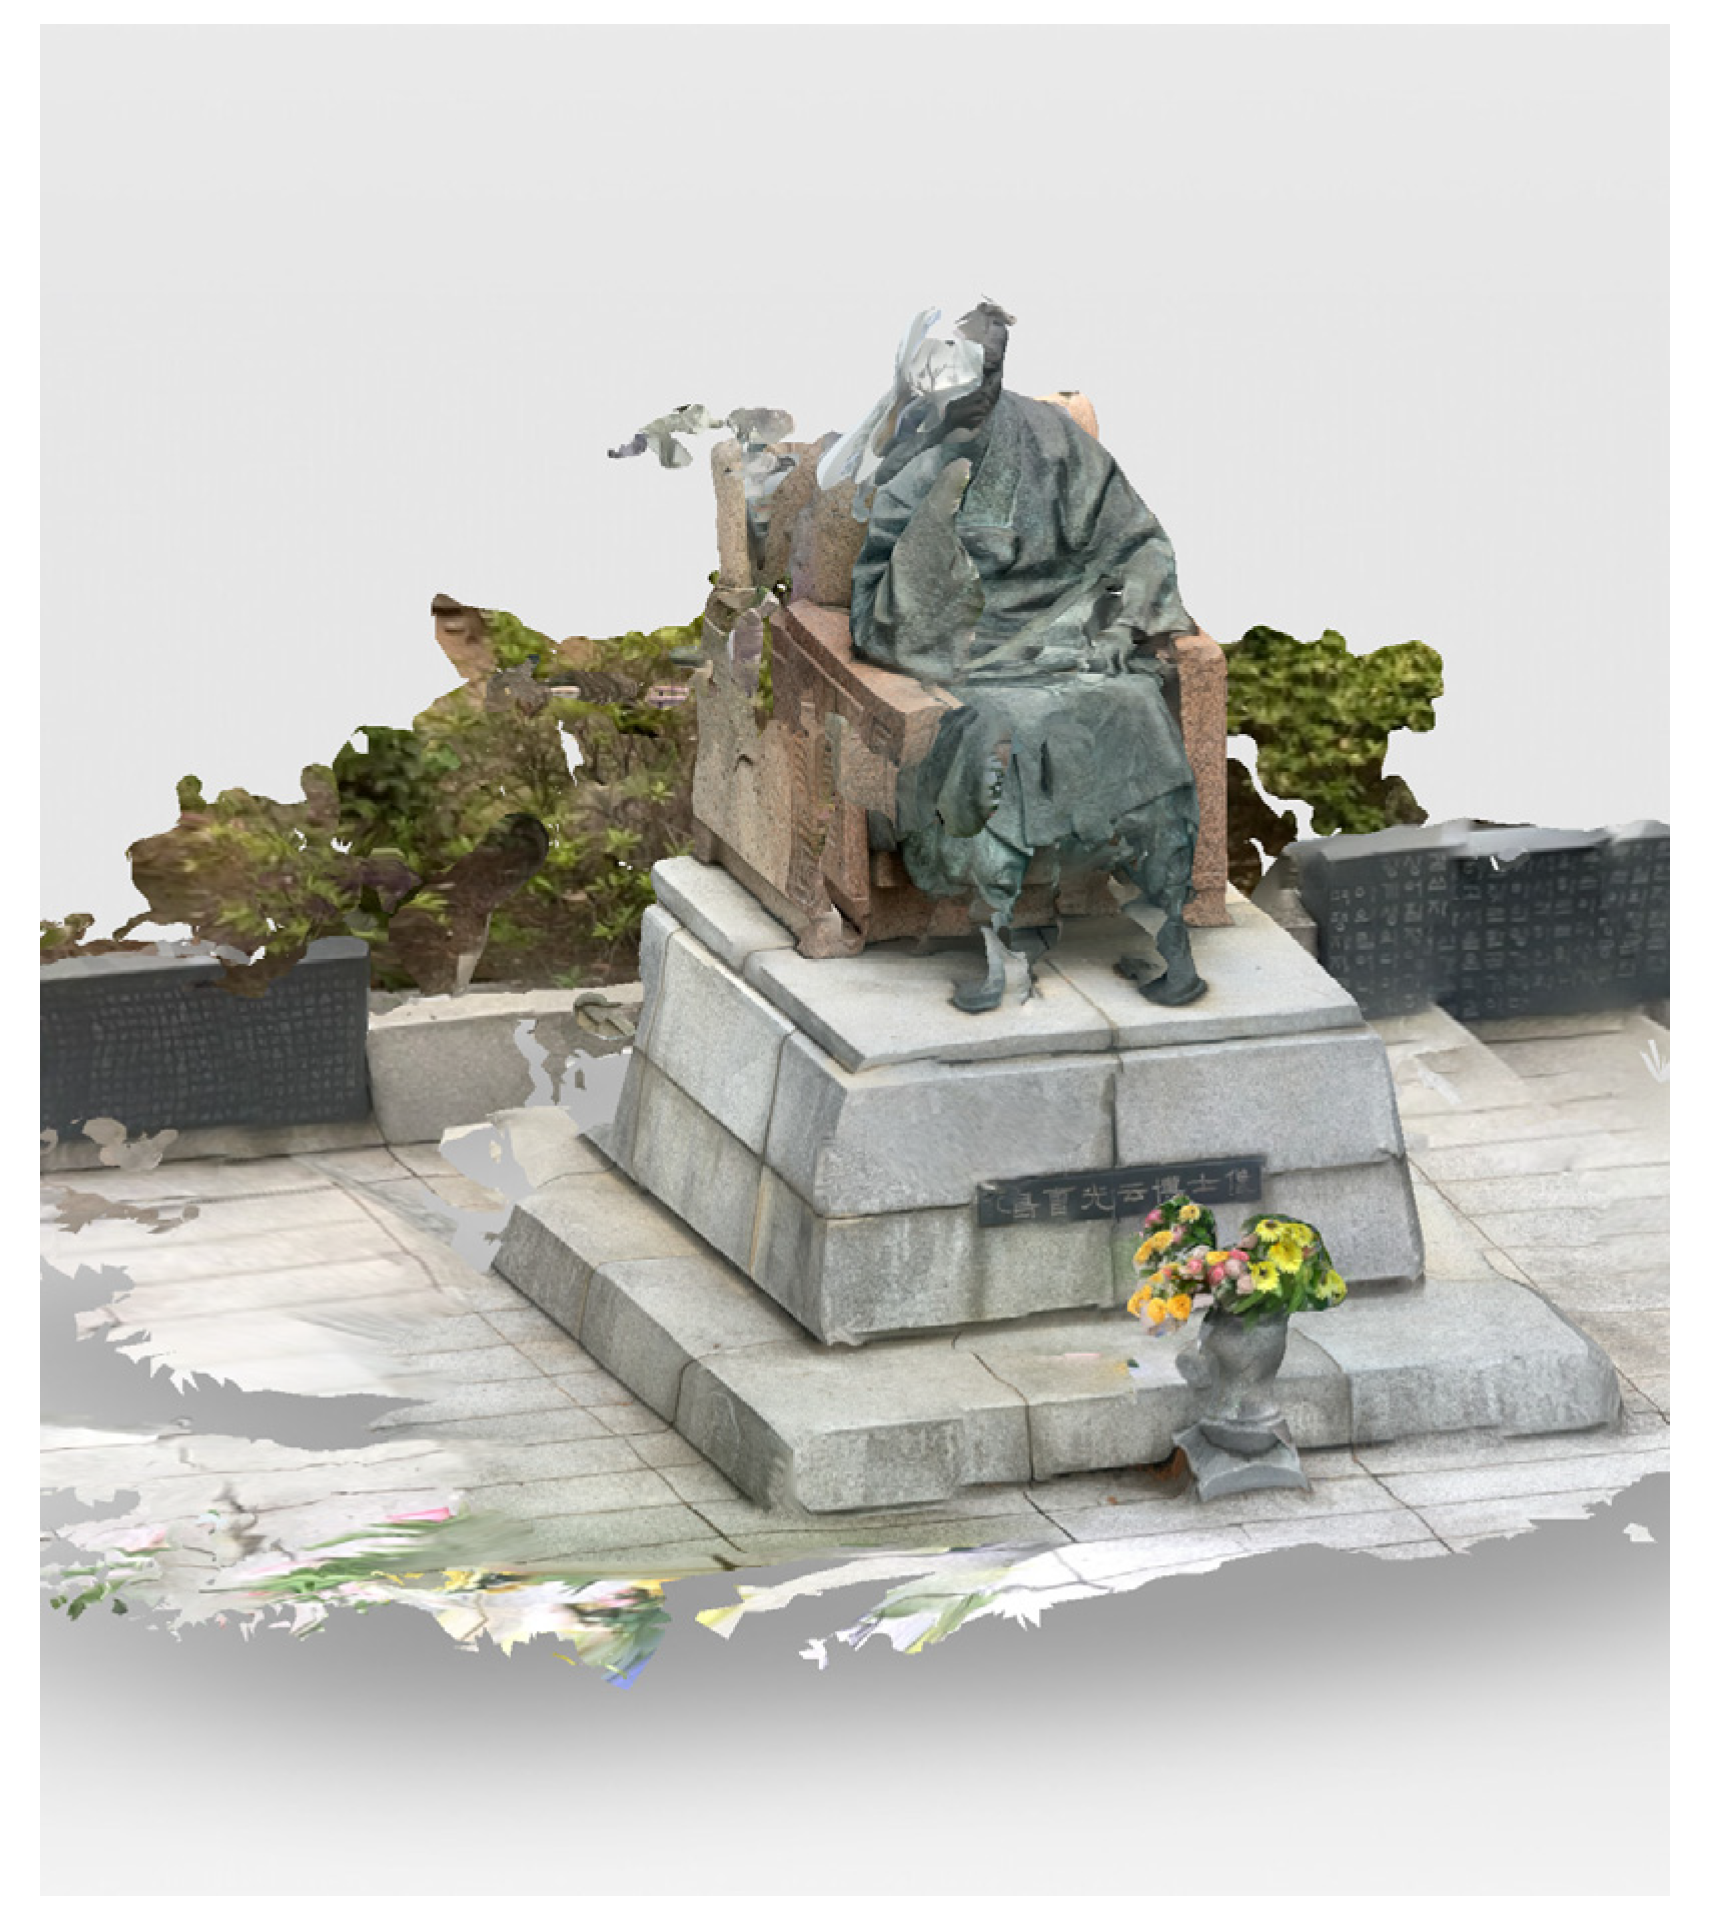
Figure 7.
3D model reconstructed with Gaussian splatting and Scaniverse software.
Figure 7.
3D model reconstructed with Gaussian splatting and Scaniverse software.
Figure 8.
3D model reconstructed with LiDAR and Metascan software.
Figure 8.
3D model reconstructed with LiDAR and Metascan software.
Figure 9.
Blender rendering. The 3D model is positioned for rendering with a 50-degree field of view and camera distance of 6 m (a), backgrounds are removed and changed to blue for photogrammetry (b), violet for Gaussian splatting (c), and red for LiDAR (d).
Figure 9.
Blender rendering. The 3D model is positioned for rendering with a 50-degree field of view and camera distance of 6 m (a), backgrounds are removed and changed to blue for photogrammetry (b), violet for Gaussian splatting (c), and red for LiDAR (d).
Figure 10.
Visual comparison for the four methods; interpolations (a), photogrammetry (b), Gaussian splatting (c), and LiDAR (d).
Figure 10.
Visual comparison for the four methods; interpolations (a), photogrammetry (b), Gaussian splatting (c), and LiDAR (d).
Figure 11.
Photo of the final hologram. Gaussian splatting (a), LiDAR (b), interpolation (c), and photogrammetry (d).
Figure 11.
Photo of the final hologram. Gaussian splatting (a), LiDAR (b), interpolation (c), and photogrammetry (d).
Table 1.
Comparison of the four methods.
Table 1.
Comparison of the four methods.
| Method | Technology | Processing Time | No. of Images | Visual Quality |
|---|
| Interpolation | Neural Network | 10 min | 11 | High |
| Photogrammetry | Metascan | 42 min | 75 | Good |
| Gaussian Splatting | Scaniverse | 72 min | 2880 | Medium |
| LiDAR | Metascan | 36 min | 1440 | Bad |
| Disclaimer/Publisher’s Note: The statements, opinions and data contained in all publications are solely those of the individual author(s) and contributor(s) and not of MDPI and/or the editor(s). MDPI and/or the editor(s) disclaim responsibility for any injury to people or property resulting from any ideas, methods, instructions or products referred to in the content. |
© 2024 by the authors. Licensee MDPI, Basel, Switzerland. This article is an open access article distributed under the terms and conditions of the Creative Commons Attribution (CC BY) license (https://creativecommons.org/licenses/by/4.0/).


 ,
, 

