1. Introduction
The global demand for food continues to rise, while the need for environmental protection becomes increasingly important [
1]. One of the most significant applications of modern technology is the use of computer vision for seed sorting [
2]. This method allows for precise identification of seeds, sorting them by size, shape, or color. Each of these criteria directly impacts the health and viability of seeds [
3,
4]. Seed size is often an indicator of maturity and germination potential [
5]. Larger seeds typically contain more nutrients, promoting better development of young plants. By using computer vision, larger, more valuable seeds can be accurately separated from smaller ones, increasing the likelihood of uniform and healthy germination. Seeds with regular shapes and smooth surfaces are less prone to mechanical damage and diseases. Irregular shapes may indicate genetic defects or developmental issues, which can negatively affect plant growth [
5]. Computer vision allows for the rapid and efficient elimination of such seeds from the sowing process. Seed color is often related to their health status. Color changes can signal the presence of diseases, infections, or seed aging. Sorting seeds by color enables the removal of those with potentially reduced viability, which is crucial for ensuring the good condition of crops. Proper seed sorting allows for the rapid and precise preparation of seeds for planting, directly resulting in better yields. Automating the seed sorting process significantly reduces the need for intensive manual labor, which is crucial in times when there is a shortage of workers willing to work in agriculture. Another advantage of this approach is the reduction of waste. Since machines can accurately select the best seeds, fewer seeds are wasted. This helps conserve resources and aligns with the principles of sustainable development. In the case of certain seeds, such as coffee beans, size and shape directly affect the nutritional quality and flavor profile of the final product. Larger coffee beans are often considered higher quality because they typically contain more oils and aromatic compounds, which are crucial for the intensity and depth of flavor [
6].
Seed selection utilizes several primary sorting methods, which vary depending on the specific requirements. The first and most traditional method is manual selection, where workers manually evaluate the seeds, analyzing their size, shape, color, and overall quality. Although time-consuming, this process allows for very precise detection of even minor defects. Another technique involves mechanical sorting mechanisms, such as vibrating screens, rotary drums, or conveyor belts. These devices are used to quickly and efficiently separate seeds by size and weight, but they may not be as precise in detecting subtler damages. A modern method is optical sorting, which uses advanced cameras and optical sensors to accurately analyze each seed [
5]. This technology can detect even the smallest irregularities and defects, such as improper color, surface damage, or irregular shape. Technological advancements have also enabled the use of robots equipped with computer vision systems, capable of processing large quantities of seeds in a short time while maintaining high sorting precision. These advanced systems are increasingly used due to their efficiency, speed, and ability to significantly reduce human error.
The application of advanced methods, including computer vision, is critical in seed-related industries as it enhances product uniformity and quality, ensures better utilization of raw materials, and minimizes waste. As a result, these processes become more automated, efficient, and economical, which is essential for meeting contemporary market and environmental demands.
2. State of the Art
Numerous studies have been published that present various research on the use of vision systems for the classification and quality assessment of seeds. In the study [
7], a simple method based on image processing and the use of an artificial neural network for rice grain classification was proposed. The classification is conducted by calculating the length of the major axis of the rice grain, the length of the minor axis, the area, the eccentricity, and the perimeter. Artificial neural networks were utilized to categorize rice grains into three levels with a classification accuracy of 98%. In the study [
8], features such as area, perimeter, compactness, length, width, asymmetry, and the groove of the seed were utilized. The main machine learning methods used in this research are logistic regression, linear discriminant analysis (LDA), k-neighbors classifier, decision tree classifier, and support vector machine. The best results, achieving 95.8% accuracy, were obtained using LDA for the classification of various seeds. In the study [
9], attention was focused on various visual attributes of rice seeds. By integrating these simple features with machine learning algorithms such as support vector machine, multi-layer perceptron, and Bayesian networks, rice grain identification was achieved. The classification accuracy ranged from 90.3% to 90.5%. Employing neural networks enhanced both accuracy and precision, with CNN emerging as the most effective neural network for seed classification. In the paper [
10], research involving a CNN was presented. The dataset used for training the model consisted of images showing the top and bottom profiles of seeds. The CNN achieved a classification accuracy of 96.9%. In the article [
11], a system is explored that uses a model to categorize 14 familiar seed types employing complex CNN techniques. By applying symmetry, uniformity is achieved in the resizing and labeling of images for extracting their characteristics. The model demonstrated a 99% accuracy level on the test set. In the study [
12], image segmentation is achieved using the well-known deep learning technique, mask R-CNN, while classification is conducted using a new network referred to as the Soybean network (SNet). SNet, a highly compact model built on convolutional networks featuring mixed feature recalibration (MFR) modules, demonstrated an identification accuracy of 96.2% in tests. In the study [
13], a method using a CNN as a universal feature extractor is presented. The extracted features were classified using various techniques, including artificial neural networks, cubic and quadratic support vector machines, weighted k-nearest neighbors, boosted and bagged trees, and linear discriminant analysis. Models trained with CNN-extracted features demonstrated higher accuracy in classifying corn seed varieties compared to models based solely on simple features. The CNN-ANN classifier achieved the best results, with a classification accuracy of 98.1%, precision of 98.2%, recall of 98.1%, and an F1-score of 98.1%. The article [
14] describes a computational methodology for quantitatively assessing soybean seed defects using a classification based on deep learning techniques. By developing a new, lightweight network for identifying defective soybean seeds, named SSDINet, it is possible to quickly and accurately distinguish between good and defective seeds. Research findings indicate that the SSDINet network achieved an accuracy of 98.6%. The article [
15] presents an integration of hyperspectral imaging and deep learning for processing and classifying hyperspectral images (HSI) of rice seeds. The authors developed a method using a three-dimensional convolutional neural network (3D-CNN) to classify rice seed images exposed to high temperatures during the day and night. A deep neural network achieved an average accuracy of 94.8% and 91% across five different rice seed treatments with varying exposure durations to high temperatures. In the study [
16], research on seed quality classification in mixed cropping using the You Only Look Once v5 (YOLO) algorithm was presented. The system was trained on a dataset containing labeled images of healthy and diseased seeds of pearl millet and maize. The system achieved the highest precision and recall at 99%. The methods presented do not encompass all solutions for image segmentation and classification. Recently, numerous new proposals for architectures and training methods have emerged. Techniques related to deep residual learning [
17], densely connected convolutional networks [
18], and gated convolutional networks with hybrid connectivity for image classification [
19] deserve attention. Image recognition and segmentation techniques have substantial practical applications and contribute to the creation of many training datasets, libraries, and frameworks that can be utilized in practice [
20].
It can be observed that the use of deep learning and convolutional neural networks yields excellent results in seed classification and segmentation. However, it is important to note that numerous publications address seed classification and segregation. Factors such as seed size, seed type, the number of recognized seed classes, and the number of seeds in an image can influence the results obtained.
4. Materials
For the purposes of this research, a database containing images of seeds was created [
21]. The photos were taken in conditions simulating a real industrial environment, with a dark conveyor belt. The seed photos were captured with iPhone 13 and Samsung S23 mobile phones. The cameras were positioned at a distance of 20 cm to 40 cm from the plane, and the photographs were taken parallel to the plane with a deviation of up to approximately 5°. A circular LED ring light with adjustable color temperature (cool, neutral, warm) and light intensity was used for illumination. The lamp was set parallel to the plane, with the camera positioned in the center of the ring, minimizing shadows around the irregular objects. During the photography, the ISO digital parameter was manually adjusted, which affected the brightness of the photos and the visibility of the objects.
The database includes images of different types of seeds: coffee and white beans. The decision to include coffee and white bean seeds in the database was based on a deliberate approach to diversifying the research material. Both types of seeds present different challenges related to their appearance, which is a key aspect of image analysis. Additionally, coffee and white beans are commonly used in various branches of the food industry, highlighting the practical application of the research results. The choice of these two plants allows for the development of a solution that can potentially be used in the context of different products, increasing the versatility of the developed solution.
To ensure the database serves as a reliable source for training and testing models, it is essential to account for a variety of parameters in the images. In this context, diverse photographic conditions and different arrangements and quantities of seeds are crucial for maintaining the realism and representativeness of the dataset. The variable parameters in the images include:
Number of seeds in the image: A variable number of seeds represents different scenarios, from sparsely to densely packed, allowing the examination of model responses to different object densities.
Seed arrangement in the image: Various arrangements of seeds, in terms of both distance and orientation, create realistic conditions under which models should operate.
The newly created database comprises both a training set and a test set. The training set includes 50 images, with 25 for each seed type. Similarly, the test set contains 50 photographs, divided equally with 25 for each type of seed. These images incorporate diverse arrangements and quantities of seeds. Each image includes a 1 PLN coin as a consistent and easy-to-measure reference point for accurate size calculations of the seed areas.
For each image, the areas containing seeds and information about the seed types were manually annotated using the Labelme 5.5.0 software [
22]. The format for recording information about the seed areas is a JSON file. For each image, a file was prepared containing the annotated positions of the seeds, taking into account both the arrangement and the precise outline and type of seeds.
Figure 2 shows sample images recorded during the creation of the database. The database has been made available on the website
https://github.com/kolodzima/Seeds_Dataset (accessed on 11 June 2023).
5. Methods
In recent years, the development of deep neural networks (DNNs), particularly convolutional neural networks (CNNs), has led to significant advancements in the fields of image processing and computer vision. Due to their ability to detect features at various levels of abstraction, CNNs have become foundational in solving complex problems such as image recognition, object detection, and semantic segmentation. Image recognition, one of the primary applications of CNNs, involves classifying entire images into specific categories. CNNs automatically detect and learn important features from images during the training process, eliminating the need for manual feature design, which was necessary in traditional computer vision methods.
Object detection extends the capabilities of image recognition by enabling the identification and localization of multiple objects within a single image. The YOLO algorithm has been a breakthrough in this field, offering a fast and accurate real-time object detection solution [
23]. Unlike traditional approaches that first generate region proposals and then classify them, YOLO treats object detection as a single regression problem, predicting the classes and locations of objects directly from the entire image in one pass through the network. Semantic segmentation, another application of CNNs, involves assigning a class label to each pixel in an image, allowing for precise separation and understanding of different elements within a scene. Similar to object detection, CNNs can learn complex feature representations from images, enabling accurate pixel-level class label predictions.
The YOLO architecture is based on an innovative “one-shot” approach to object detection and segmentation. It excels in simultaneously locating and classifying objects within an image, making it efficient for real-time applications. The model effectively balances high performance with good accuracy in image segmentation. Its single-stage approach allows for rapid localization and classification of objects in an image, making it widely used in applications requiring quick real-time analysis. Although there might be slightly lower precision in detecting smaller details, its ability to recognize multiple objects simultaneously makes it an attractive solution for various scenarios, such as urban monitoring systems and autonomous vehicle technologies. Due to these attributes, YOLO is a powerful tool, combining efficiency with satisfactory accuracy in practical applications.
YOLO is an advanced object detection model comprised of several key components. The first is the powerful base model, CSPDarknet53, which serves as the backbone network responsible for feature extraction from images [
24]. The model then uses a PANet-based Neck, which effectively combines information from different levels of abstraction [
24]. The main part of the model (head) is based on spatial pyramid pooling (SPP) [
25] and feature pyramid network (FPN) [
26], allowing for context consideration at various scales. YOLOv8 is designed for multi-object detection, achieved through a prediction layer that generates bounding boxes and the predicted probabilities of class membership. The model outputs a tensor containing information about object locations and their classifications. For activation and normalization functions, YOLOv8 employs leaky ReLU and advanced normalization layers [
27]. The model training process is based on optimizing a loss function, such as mean squared error (MSE). The entire model architecture has been optimized to balance detection precision and performance, making it highly effective for real-time object detection [
27].
The model comes in various versions designated as YOLOv8_n, where “n” refers to the number of layers in the model. For instance, YOLOv8_s has fewer layers than YOLOv8_m, and YOLOv8_l has more layers than YOLOv8_m. Each of these versions differs in model size, which affects the number of parameters and network complexity. The greater the number of layers, the more complex and capable the model is of representing intricate objects, but it also demands more computational resources. The choice of a specific variant depends on the application specifics, available hardware resources, and object detection performance requirements. The training process for the three YOLOv8 models was conducted using the prepared training dataset. The images were resized to 640 × 640 pixels using linear interpolation. To achieve better results, pre-trained YOLOv8 segmentation models, available from the common objects in context (COCO) dataset, were utilized.
In the YOLOv8 network, the training parameters were set as follows: The batch size was 16, and the number of epochs was set to 100. The patience parameter was 10, indicating the number of epochs to wait without improvement before early stopping. The optimizer was set to auto, which defaulted to AdamW. The image size was specified as 640 × 640, which was the target dimension for resizing training images. The initial learning rate was 0.01. Momentum, used with certain optimizers to influence updates, was set at 0.937. Weight decay (L2 regularization) was set at 0.0005 to avoid overfitting. Mosaic data augmentation was disabled in the last 10 epochs. Warmup epochs were set at 3.0, meaning the learning rate gradually increased from a lower base. Warmup momentum was set at 0.8, adjusting the momentum during the warmup phase. The warmup bias learning rate was 0.1, indicating a special learning rate for bias parameters during the warmup phase. The training utilized the BCE (binary cross-entropy) loss function. The training was stopped when the loss function value reached 0.41.
Each of the pre-trained models, varying in size from n to m, was appropriately loaded and then fine-tuned through transfer learning on the dataset tailored to the research project needs. Upon completion of the training process, the weights of all models were saved, and the training progress was documented. The saved model weights are available for future use in ongoing research on seed size detection.
Table 1 details each of the trained models, including their input size, number of parameters, and inference time.
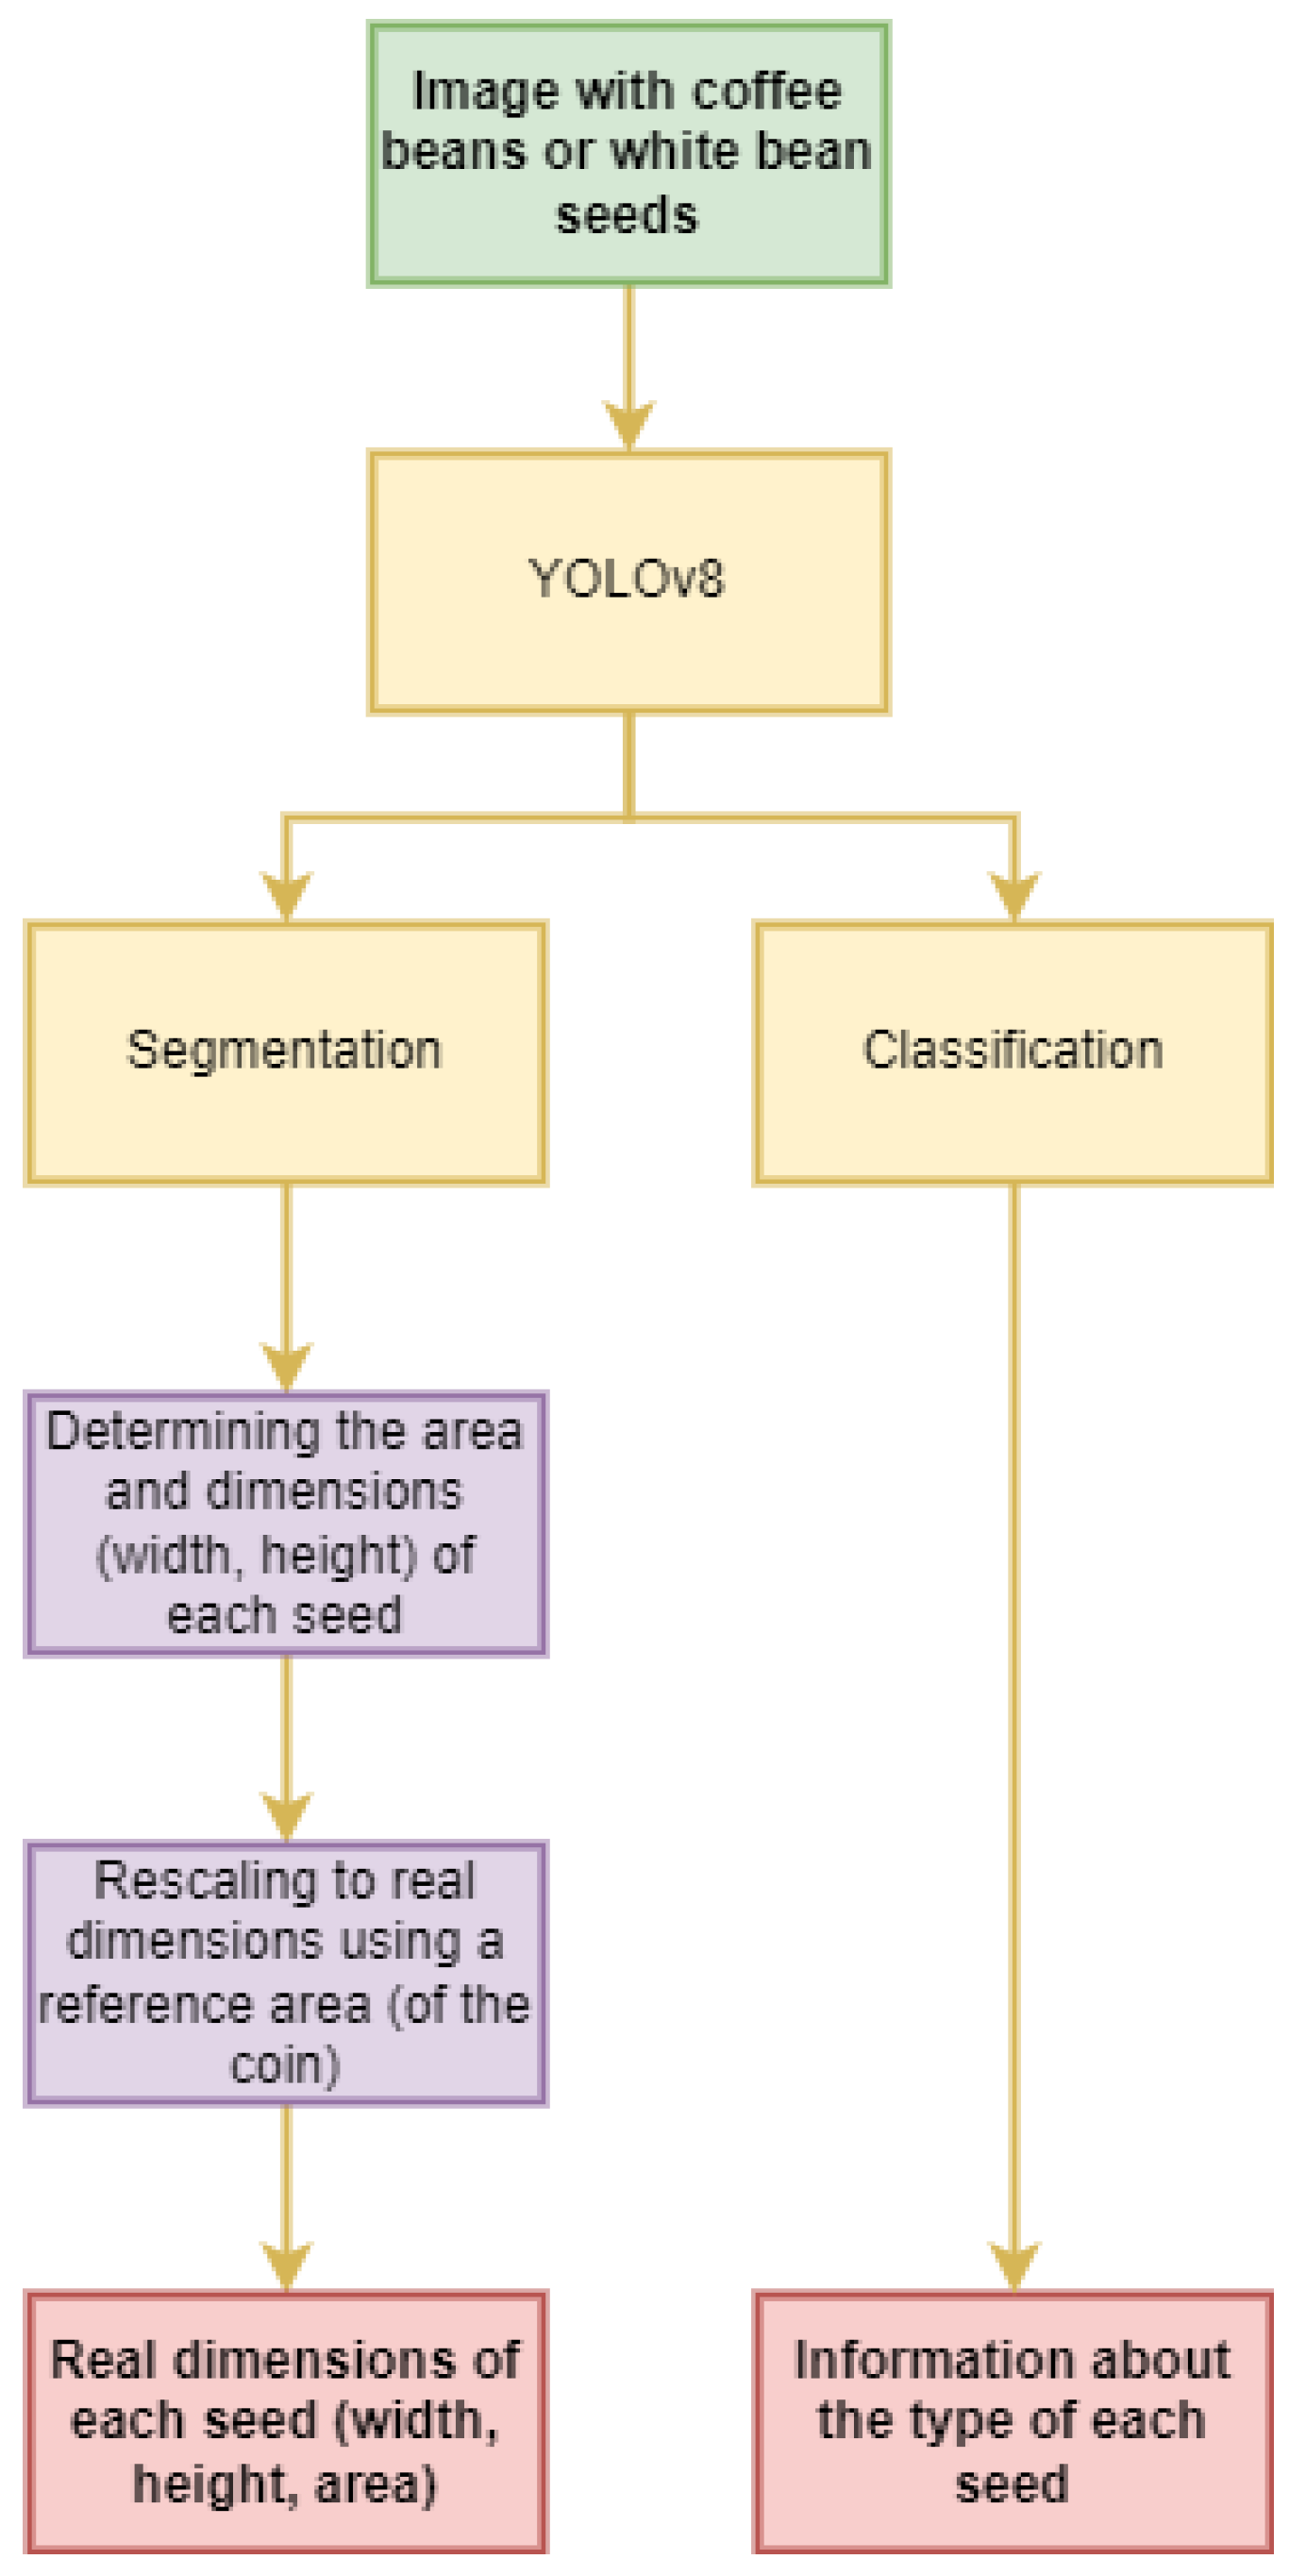
To determine the physical dimensions of the seeds, image analysis techniques were employed. Using the YOLO algorithm to identify the seeds, the central point of each designated seed area was determined. Then, the longest axis passing through this central point, lying within the seed area, was identified. Once this axis was found, the points where it intersected the edges of the area were determined. The distance between these points defines the height of the seed. Next, a perpendicular axis to this longest axis was drawn through the center of the seed. The points where this perpendicular axis intersected the edges of the seed area were also identified, allowing the calculation of its width.
Using the YOLO algorithm for seed identification, the area of each designated seed region was calculated in pixels. To convert these values into actual physical dimensions, a reference element, a 1 PLN coin, was used, which appeared in each image. The diameter of the coin, d = 23 mm, and its area were measured. Knowing the actual dimensions of the coin and the number of pixels it occupied in the image, it was possible to convert the seed area into square millimeters and determine the height and width of the seed in millimeters. In this way, the actual surface area, width, and length dimensions of the seeds were determined.
6. Results and Discussion
To visualize the effects and assess the effectiveness of the created models, the results of segmentation and size detection of seeds in the images were presented (
Figure 3,
Figure 4,
Figure 5 and
Figure 6).
Segmentation areas identified by the YOLO algorithm were overlaid on the images. Additionally, lines and points were used to mark the determined sizes of each seed. Textual information containing detailed data about the dimensions of each seed was placed next to them. This graphical presentation of results not only allowed for ongoing evaluation of the CNN models’ performance but also served as an excellent way to visualize the outcomes. In the
Supplementary Materials, the detection results are included, along with the calculated dimensions of the seeds, including width, height, and surface area for all test images.
Measuring the accuracy of image segmentation is crucial for fully understanding the effectiveness of computer vision models. Metrics can be divided into two main categories: segment area metrics, which assess the overlap between the predicted and actual object areas, and classification metrics, which focus on the precision and completeness of the recognized areas. This approach allows for a comprehensive evaluation of segmentation quality, which is essential for further improving computer vision models.
Since many practical applications of seed segmentation focus on determining individual dimensions and areas, metrics such as intersection over union (IoU), pixel accuracy, precision, recall, and F1-score were used. Intersection over union (IoU) is the ratio of the area of overlap between prediction A and the true object area B to the total area of both regions combined. The IoU value ranges from 0 to 1, with 1 indicating perfect overlap. It can be expressed using the Jaccard index [
28]:
Pixel accuracy is the percentage of pixels that have been correctly classified by the model. While this metric is simple to implement and understand, it is not always the best measure, especially for imbalanced datasets where objects cover a small portion of the image. Pixel accuracy can be expressed as:
where
represents the number of pixels correctly classified for class
j, and
is the total number of pixels belonging to class
j in the ground truth. The summation is performed over all classes
k, from
j = 1 to
j =
k.
Precision measures how many of the segments in an image have been correctly detected and classified (i.e., their IoU is above a certain threshold, typically IoU > 0.5). It is the ratio of true positive cases to the sum of true positive and false positive cases. Precision is expressed as:
where
TP (true positives) denotes the number of correctly identified positive cases.
FP (false positives) represents the number of negative cases incorrectly identified as positive.
Recall is the ratio of true positive cases to the sum of true positive and false negative cases. It measures the model’s ability to detect all positive cases. Recall is expressed as:
where
FN (false negatives) is the number of cases that are positive but have been incorrectly identified as negative by the model.
The F1-Score is the harmonic mean of precision and recall. It offers a balance between these two metrics and is particularly useful in the case of imbalanced classes.
In the context of detecting object sizes, there is a significant need to evaluate the effectiveness of models beyond traditional segmentation metrics. The actual sizes of objects allow for precise comparison of the results of a CNN-based model with the real parameters of the objects. These metrics demonstrate how well the detected sizes, based on model predictions, reflect the actual sizes. In practice, having information about the actual sizes of objects enables the construction of precise evaluation criteria, which in turn allows for model adaptation to the specifics of the analyzed task. Commonly used accuracy measures for detected sizes include the mean size error, mean relative size error, and mean area error, which measure the differences between the actual and predicted dimensions or surface areas of objects. Relative error is a metric that measures the average relative difference between the actual and predicted size of an object. Unlike absolute error, relative error is calculated proportionally to the actual size of the object. The lower the error value, the better the object sizes are detected. Area error is the average difference between the actual and predicted area of an object. This metric is useful for evaluating the effectiveness of a model, particularly in cases where determining the areas of detected elements in images is important.
Table 2 presents detailed results of the model that achieved the highest precision in size detection—YOLOv8_n—for a test set consisting of 50 images. Segmentation metrics and size detection metrics are presented for each individual seed class, as well as aggregated for the entire test set.
These results provide a comprehensive understanding of the model’s effectiveness in identifying seed sizes of varying dimensions. The values 50 and 75 correspond to the threshold values of 0.5 and 0.75 for IoU, respectively. If the intersection of the actual and detected object is at least 0.75 or 0.5, it is considered detected; otherwise, it is considered undetected. This method was used to calculate values for precision, recall, and other related metrics.
The analysis of the presented results shows that the YOLO method achieved excellent outcomes in identifying and segmenting coffee and white bean seeds. The pixel accuracy for each category exceeds 99.9%, which is an outstanding result. The mean intersection over union (IoU), a key indicator for assessing segmentation quality, ranges from 88.2% for coffee to 92.1% for white beans, indicating high precision in separating the background from the object. Precision and recall for thresholds of 50% and 75% remain very high, around 97% or higher, demonstrating the model’s effectiveness in identifying and classifying seeds. The mean relative error, which is less than 5% in the worst case, and the mean dimensional errors in millimeters, which are below 1 mm, indicate the model’s high accuracy in determining seed sizes. This level of accuracy is more than sufficient for practical applications, such as seed sorting.
Considering these results, the outcomes are sufficiently robust to apply the YOLO method to seed segmentation in practice. Not only do they confirm the effectiveness of the YOLOv8 model in accurately detecting and locating seeds in images, but they also pave the way for using this technology in industrial applications, where fast and efficient image analysis is crucial. Such automation can significantly speed up and increase the efficiency of the seed sorting process.
In the following section, the impact of seed size and quantity on segmentation and detection accuracy was examined, considering both relative and absolute measurement errors of seed sizes. For this purpose, each of the 50 test images containing coffee and white bean seeds was used. For each seed in these images, the IoU and relative error were calculated.
Figure 7 shows the IoU distribution for white beans, depending on the number of seeds in the test images.
Figure 8 shows the IoU distribution for coffee beans, depending on the number of seeds in the test images. The results indicate that there is no trend suggesting that the number of seeds in the image affects the IoU.
Figure 9 shows the relative error distribution for white beans, depending on the number of seeds in the test images.
Figure 10 shows the relative error distribution for coffee beans, depending on the number of seeds in the test images. The results also indicate that there is no trend suggesting that the number of seeds in the image affects the relative error.
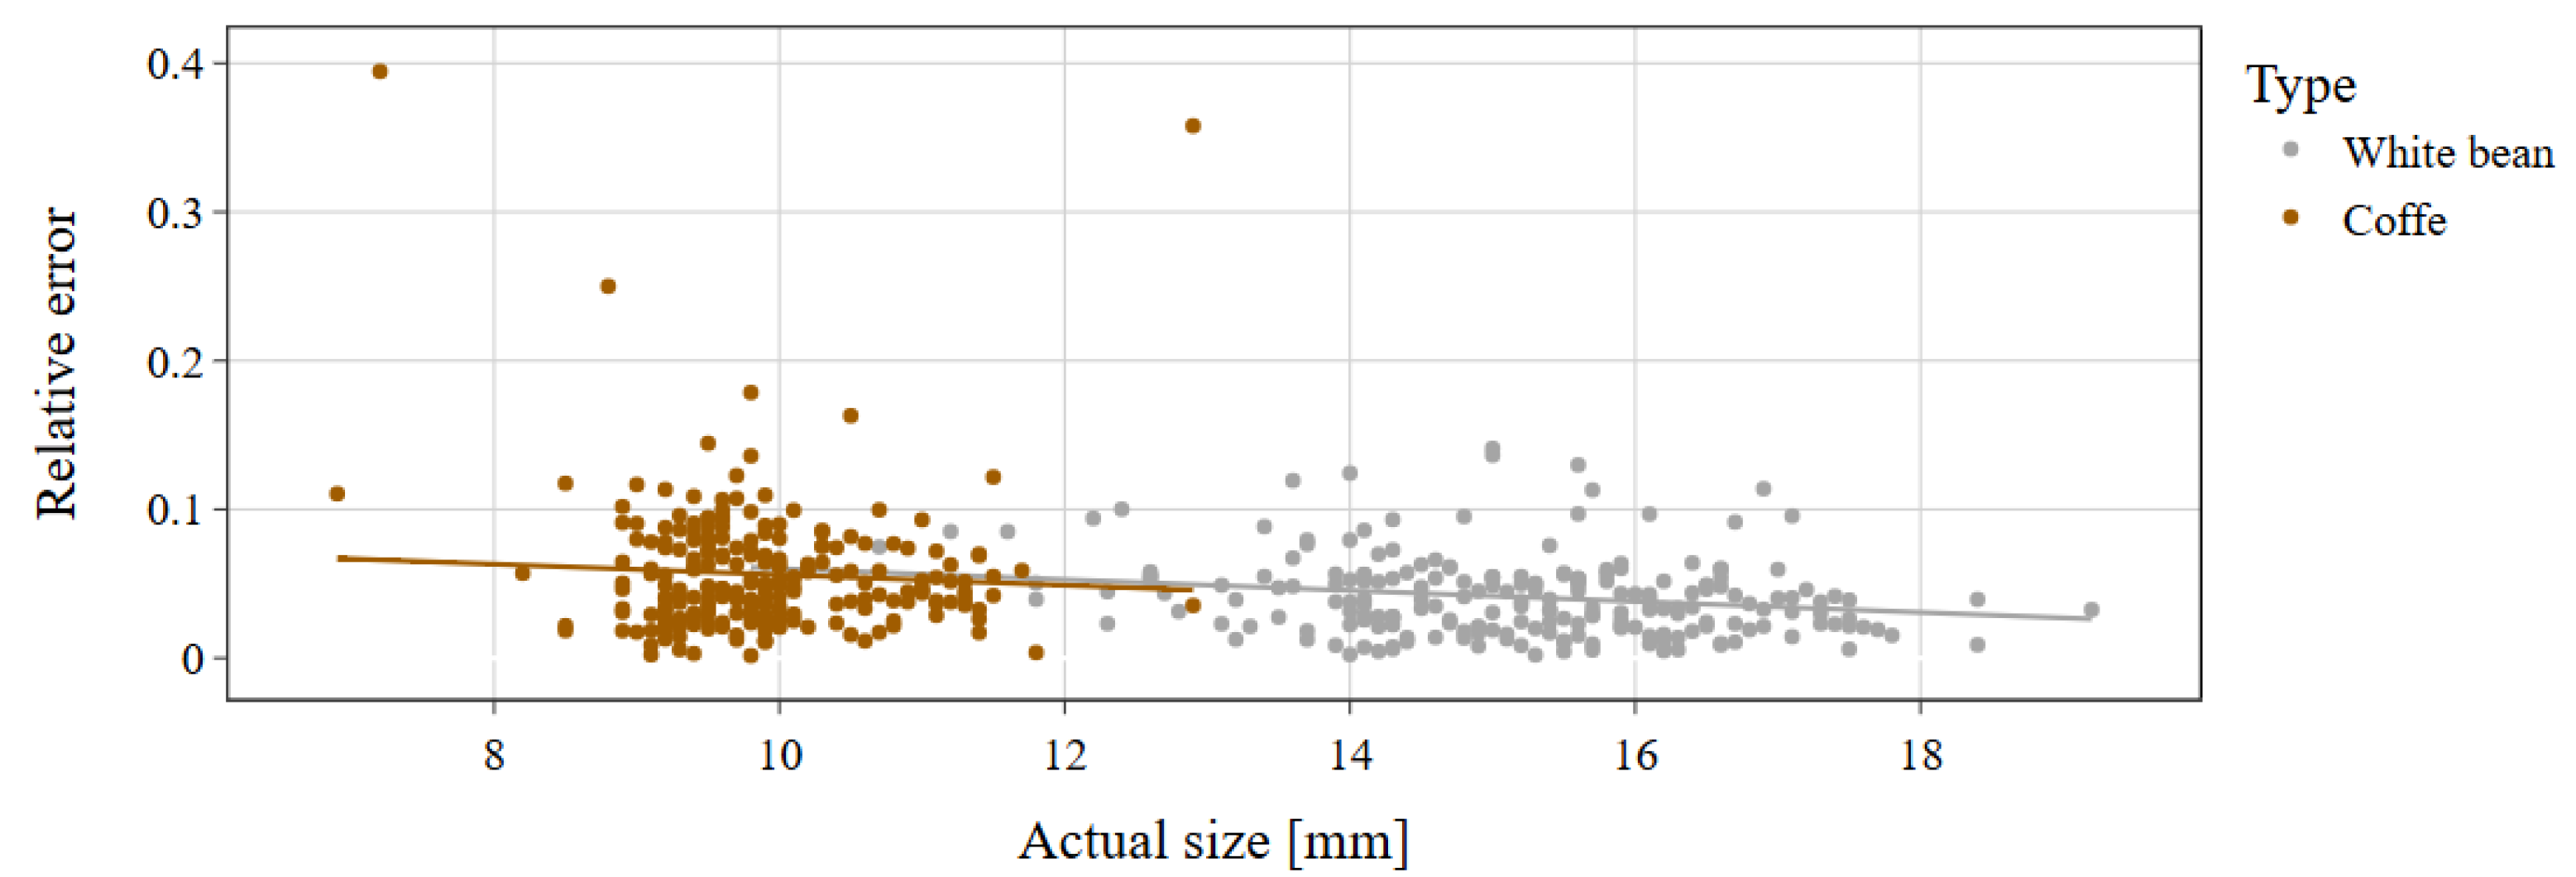
An essential aspect of evaluating the effectiveness of CNN models is analyzing the quality of image segmentation in the context of seed size. From
Figure 11, a trend emerges indicating that the larger the seeds, the better the segmentation accuracy (larger IoU). This phenomenon applies to both bean and coffee seeds, suggesting that segmentation accuracy tends to improve as the object size increases, indicating that the algorithm handles larger seeds slightly better. The actual size represents the average of the seed’s actual height and width dimensions. The quality of seed segmentation in the image, expressed by the IoU measure, translates to the relative error. In
Figure 12, we can observe the relative error in relation to the actual size of coffee and white bean seeds. The larger the seed, the smaller the relative error. This trend applies to both coffee and white bean seeds.
The conducted studies, although focused on the impact of seed size on segmentation accuracy, do not consider other variables such as seed shape irregularity and image brightness. More irregular seed shapes can pose challenges for segmentation algorithms, leading to errors in recognizing and separating objects. Image brightness, dependent on lighting conditions, also plays a crucial role. Variable lighting can affect image quality, making seed segmentation more difficult in darker areas. Artificial lighting minimizes these issues, providing reliable and consistent results. Considering variables such as seed shape and image brightness is essential for a comprehensive evaluation of CNN models. Ignoring these factors can lead to overly optimistic conclusions. Therefore, future research should include these additional variables to obtain more realistic and practical results that can be applied in practice.
The proposed solution demonstrates impressive efficiency but requires significant computational resources. In the future, it will be crucial to conduct research on the application of dilation techniques in the context of segmentation and classification, which will enable the practical use of algorithms for seed detection and segmentation [
29,
30]. Such an approach will not only expand the capabilities of these methods but also enhance their accessibility and efficiency in various industrial and scientific applications.
To evaluate how the proposed YOLO-based method compares with other standard signal processing and analysis techniques, additional studies were conducted. Various edge detection and image segmentation methods were employed to identify and extract the regions of interest for the seeds. Methods such as Roberts, Prewitt, Sobel, thresholding, and adaptive thresholding were applied. A comparison of the results between the YOLO method and typical seed area detection methods is presented in
Figure 13. The Roberts method involves using small masks to detect edges by calculating the intensity gradient horizontally and vertically [
31]. The Prewitt method is similar but uses larger masks, making it more robust to noise and better suited for detecting edges in medium-quality images [
31]. The Sobel method, an extension of the Roberts and Prewitt methods, also uses larger masks and places greater emphasis on central pixels, making it one of the most commonly used edge detection methods due to its efficiency [
31]. The simplest image segmentation method is thresholding, which involves applying a single global threshold. All pixels with values above the set threshold are classified as seed areas, while the rest are classified as the background. This method is quick, but its effectiveness depends on the appropriate choice of the threshold value, which can be challenging in images with uneven lighting. During the experiments, Otsu’s method was used to calculate the pixel threshold [
32]. Adaptive thresholding applies different thresholds in different parts of the image, depending on local pixel properties. This method is particularly useful in scenarios where the image has uneven lighting. Popular approaches include mean thresholding, where the threshold is set as the average intensity value in the local neighborhood of the pixel. During the experiments, a block size of 11 was used to calculate the local mean pixel value, with the resulting threshold applied only to that block of the image.


