
Chronological and Archaeometric Evaluation of Bricks from Archaeological Sites of Upper Assam, Northeast India: Estimation of the Firing Temperature and Civilization History

 , and
, and 
Abstract
1. Introduction
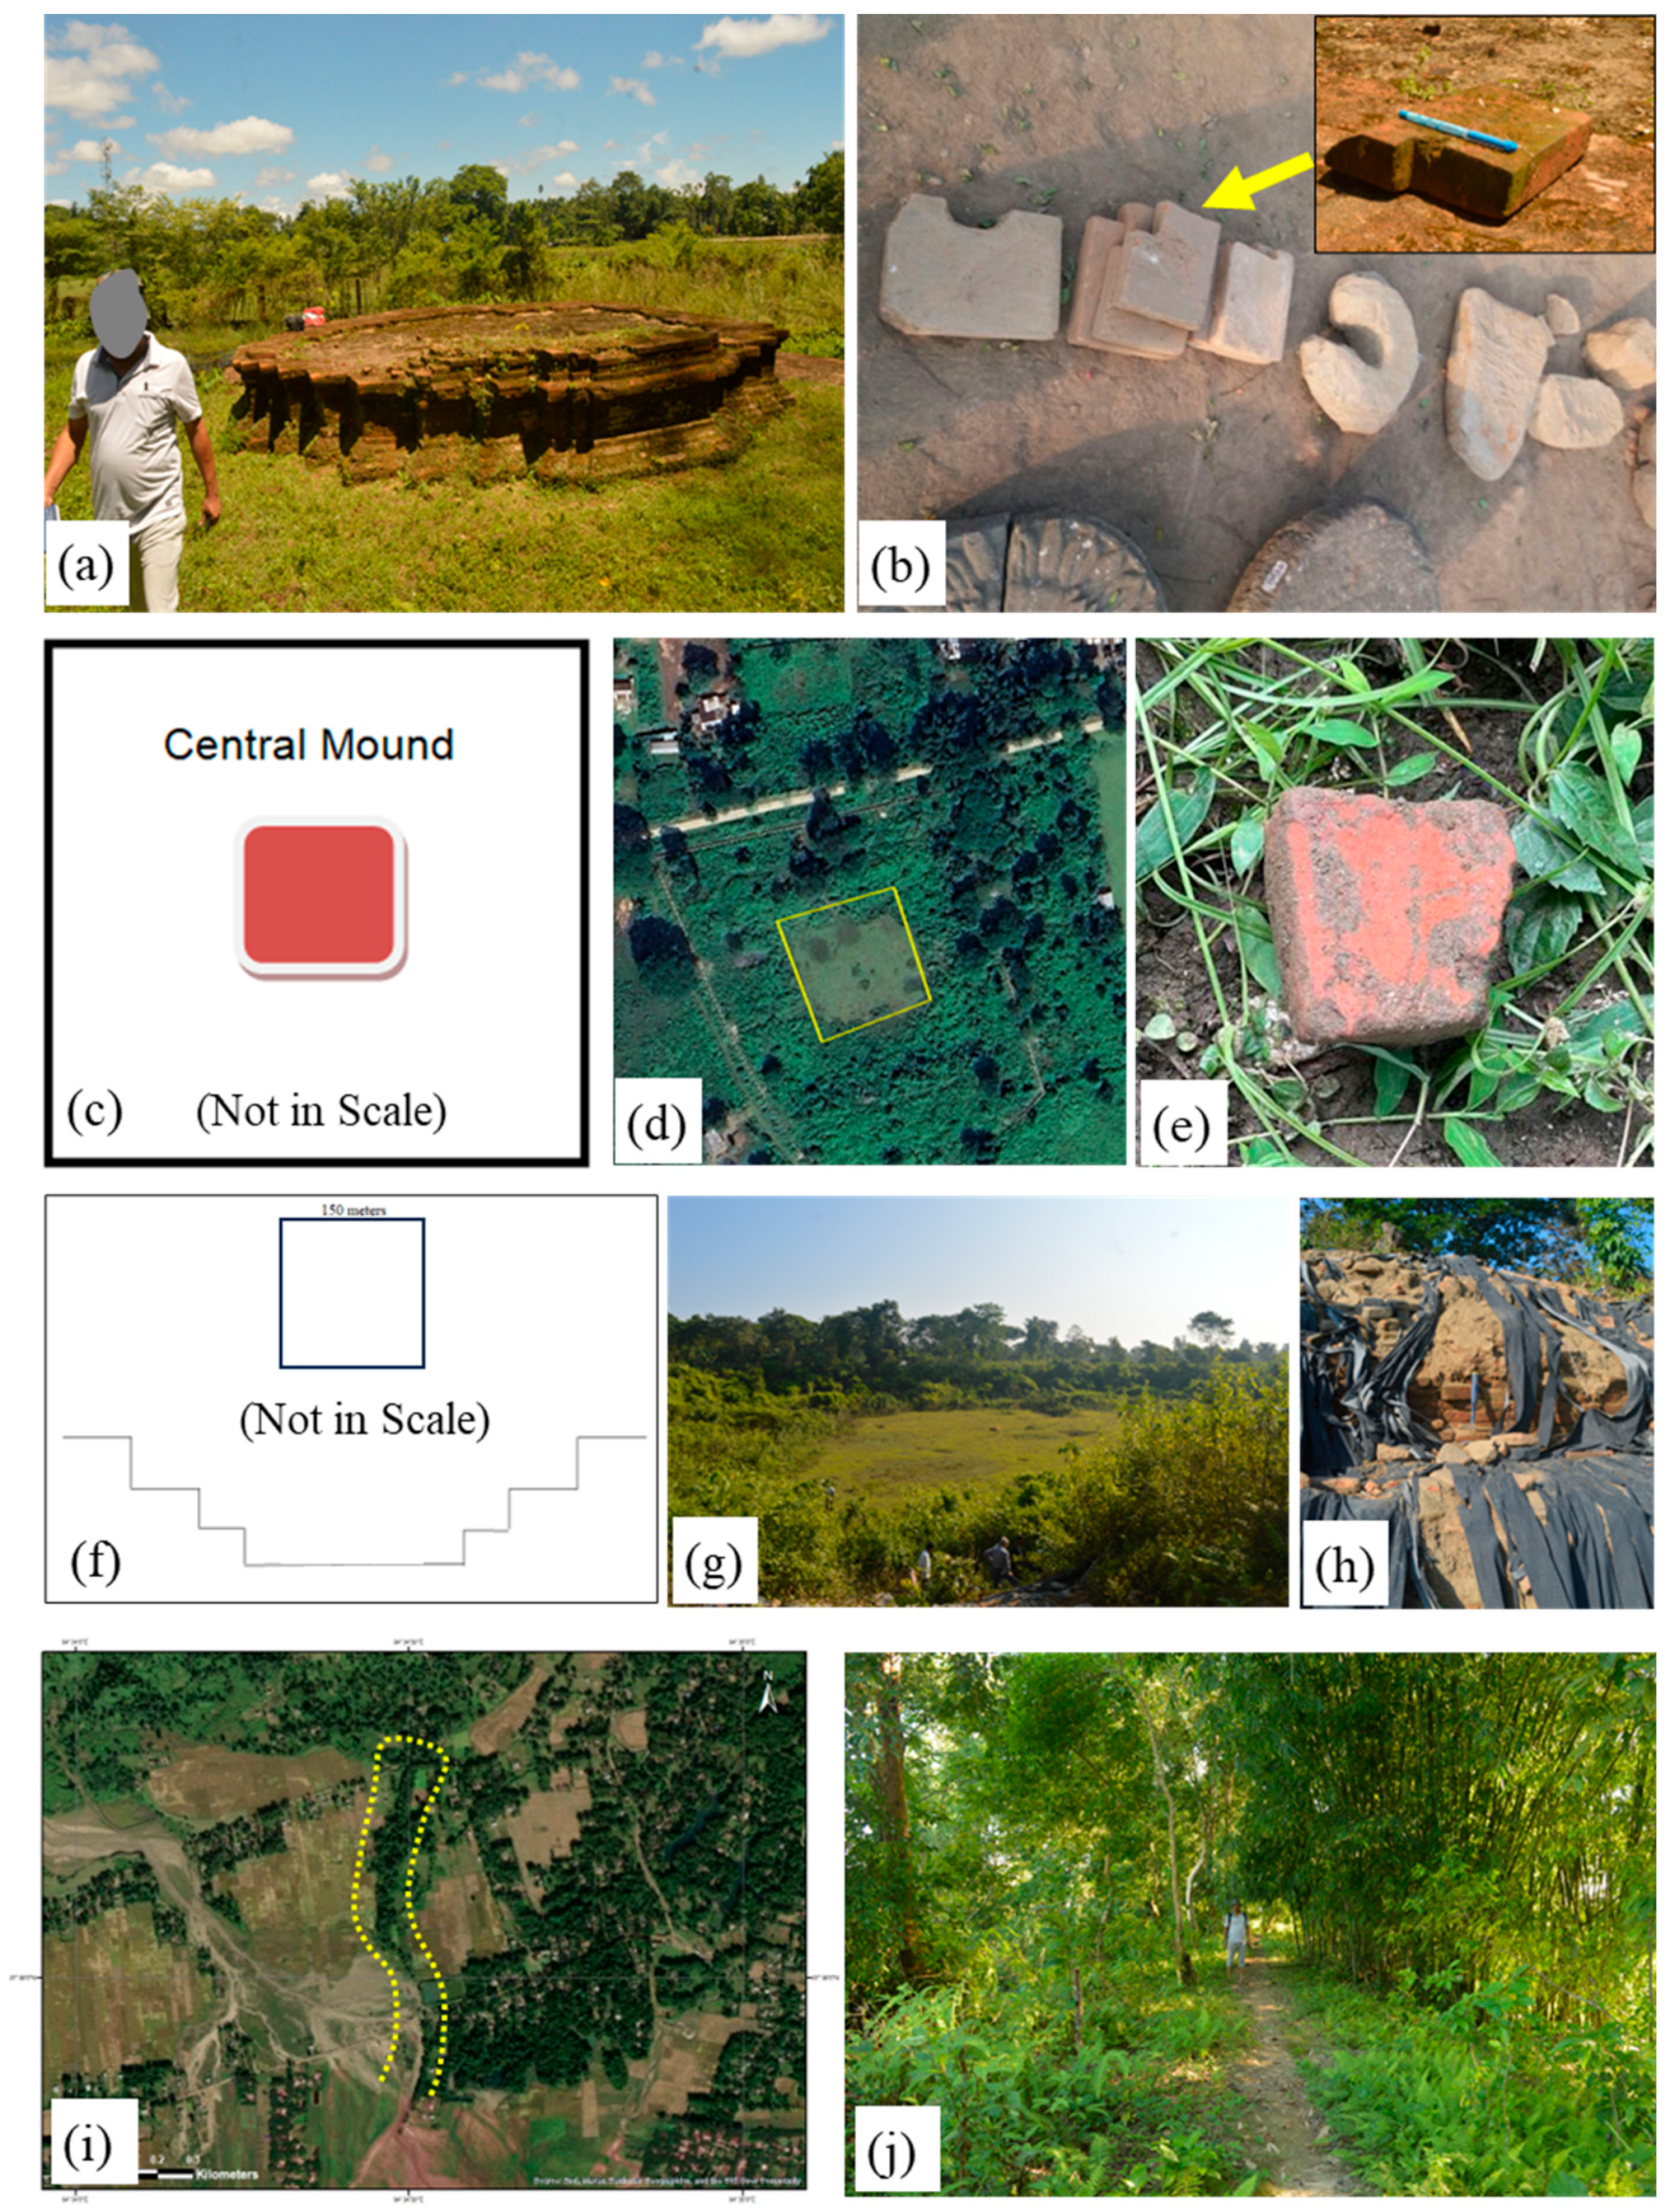
1.1. Study Area
1.1.1. Mouramora Archaeological Spot
1.1.2. Pratima Garh Archaeological Spot
1.1.3. Padum Pukhuri Archaeological Spot
1.1.4. Rukmini Garh Archaeological Spot
2. Materials and Methods
2.1. Color of the Bricks Identification
2.2. XRD and FTIR Analysis
2.3. SEM and EDS Analysis
2.4. TL and OSL/IRSL Dating
3. Results and Discussion
3.1. Identification of Minerals through FTIR Analysis

| Frequency with Relative Intensity (cm−1) | |||||||
|---|---|---|---|---|---|---|---|
| Assigned Mineralogy/ Assignment | Sample No with Absorption Frequency and Relative Intensity (cm−1) | Reference | |||||
| Mouramora-1 | Mouramora-2 | Mouramora-3 | Padumpukhuri | Pratima Garh | Rukmini Garh | ||
| Quartz | 1870VW | - | - | - | 1876VW | 1873W | ([15,28,51,52,53]) |
| - | - | - | - | - | 1619VW | ||
| - | 795S | 795S | - | - | - | ||
| 778S | 778S | 778S | 778S | 776M | 778SSp | ||
| 693S | 693M | 694S | 692M | 693M | 693S | ||
| 460S | 461S | - | - | 463S | - | ||
| - | - | 457S | 458S | - | 458S | ||
| Microcline | - | - | - | - | 1050S | - | ([54]) |
| Orthoclase | - | - | - | - | 642W | - | ([28]) |
| Albite | - | - | - | - | 725W | - | [16] |
| OH Stretching of Water Molecule | - | 3851VW | - | - | 3851VW | - | [25,40,41,55] |
| - | 3746VW | - | - | 3745W | - | ||
| - | 3671VW | - | - | - | - | ||
| OH stretching of inner hydroxyl group | - | - | - | - | - | 3496WBr | |
| - | - | - | 3475W | - | - | ||
| 3468W | - | 3460W | - | 3462M | - | ||
| Kaolinite | 1080S | 1080S | 1081S | 1084SBr | - | 1081SBr | |
| - | 3647VW | - | - | - | - | ||
| Chlorite | - | 3565VW | - | - | - | - | [56] |
| Palygorskite | 1623W | 1630W | 1625W | 1629W | 1629W | - | [28] |
| Carbonate Minerals | - | - | - | - | - | 1788W | ([28,42]) |
| - | - | 1384W | 1381VW | - | - | ||
| Magnetite | - | - | - | - | 576W | - | [57] |
| Hematite | - | - | - | - | 531W | - | [28,51] |
| Organic compound | 2922VW | 2922VW | 2919VW | 2919VW | 2919VW | 2928VW | [27,28,57,58,59] |
| 2851VW | 2851VW | 2854VW | 2854VW | 2854VW | - | ||
| - | - | - | - | 2356VW | - | ||
| - | - | - | 2004VW | - | - | ||
| 1998VW | - | 1998VW | - | - | 1984VW | ||
| - | 1878VW | 1879VW | 1879VW | - | - | ||
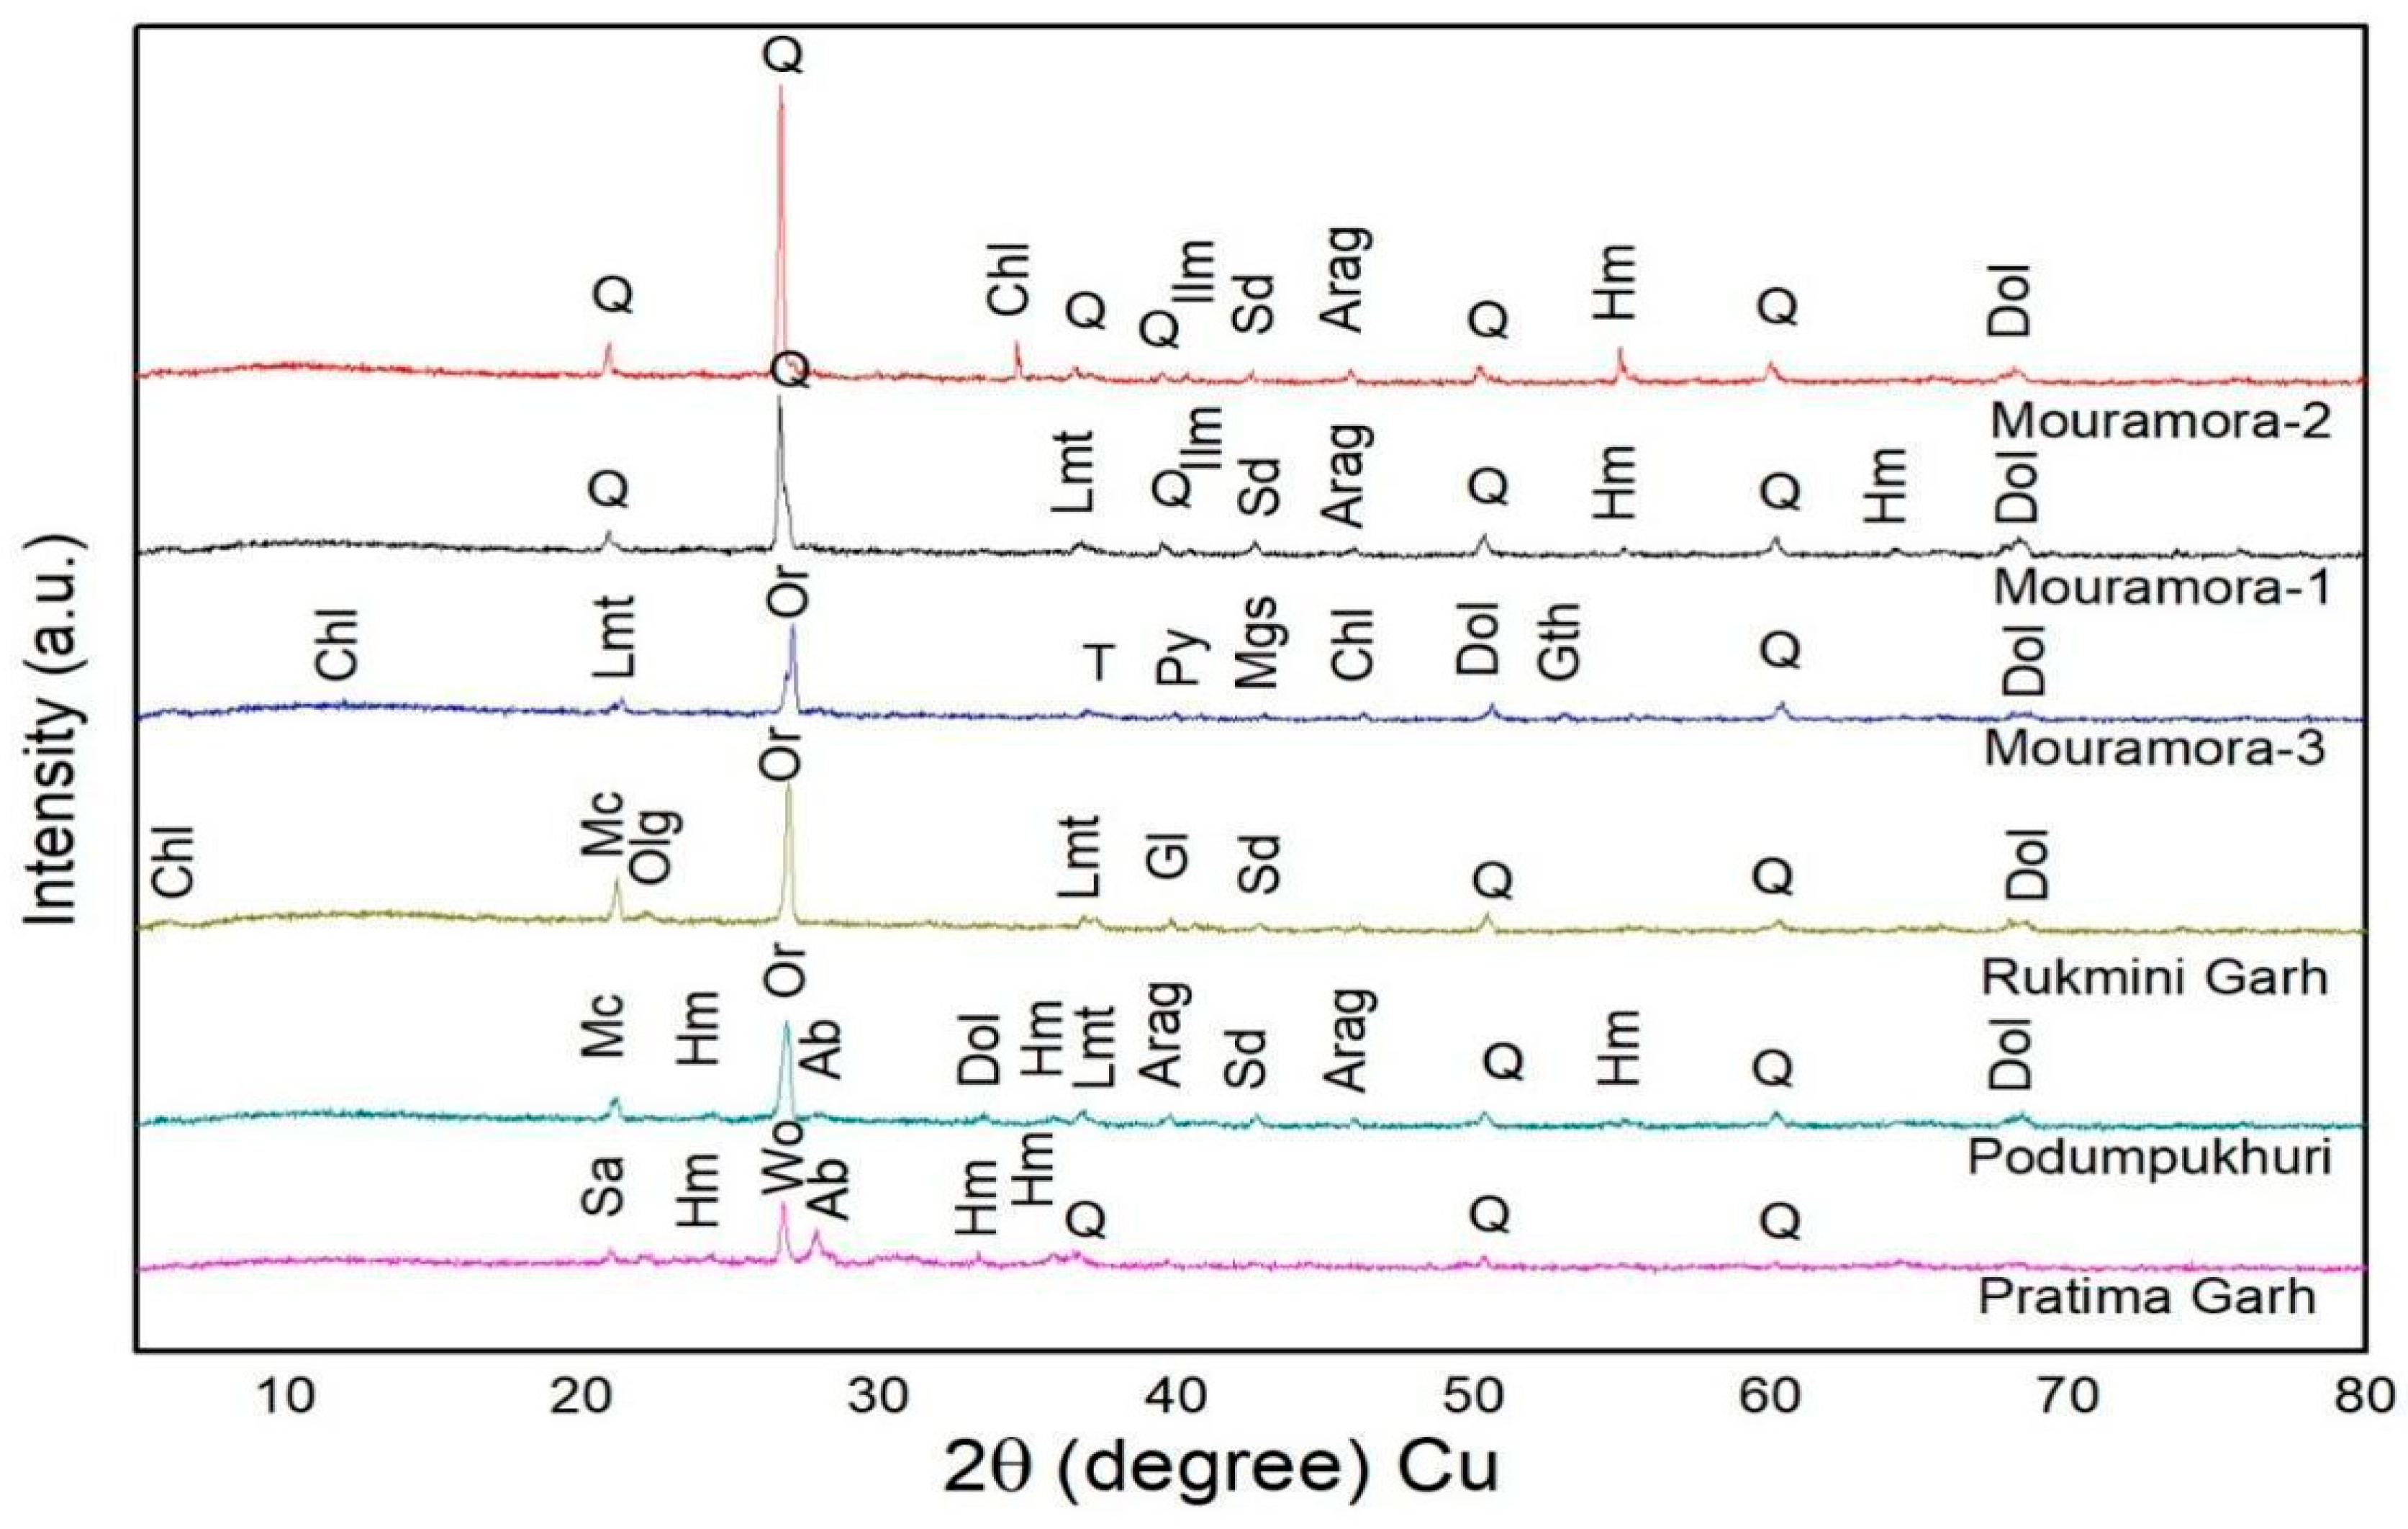
3.2. Identification of Mineral through XRD Analysis
3.3. The Firing Temperature Analysis Using FTIR and XRD
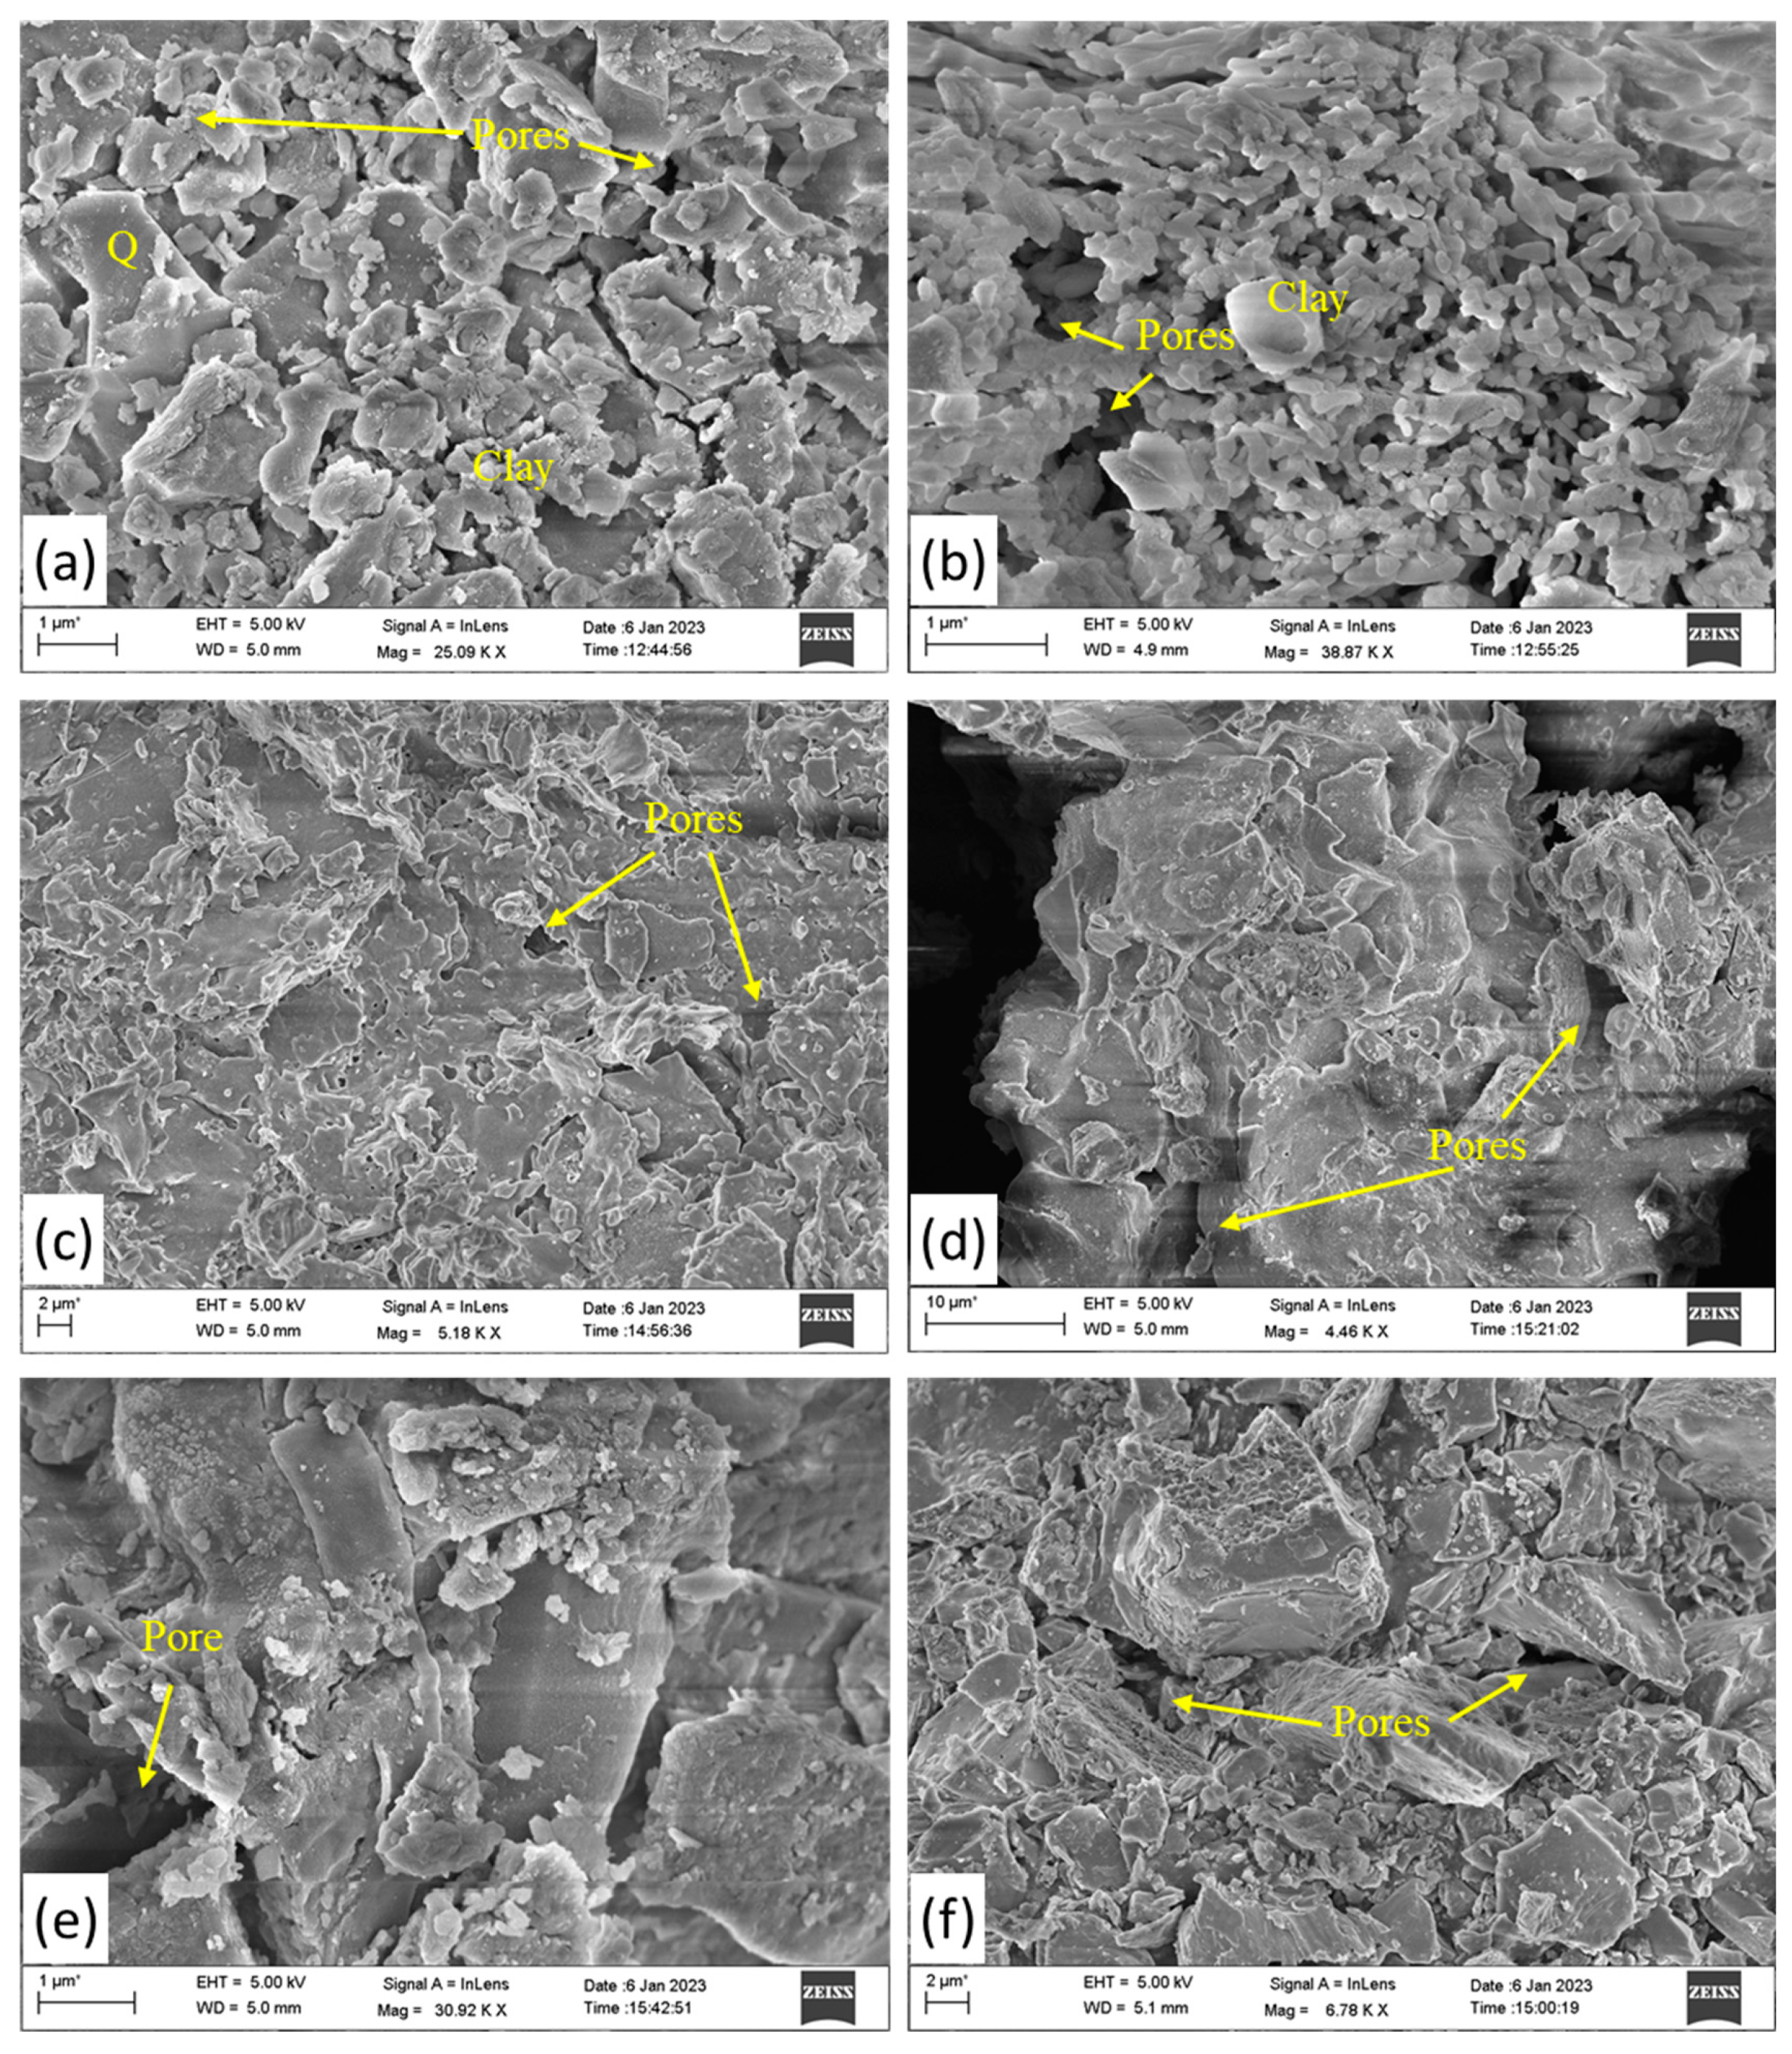
3.4. The Firing Temperature Analysis Using SEM-EDS
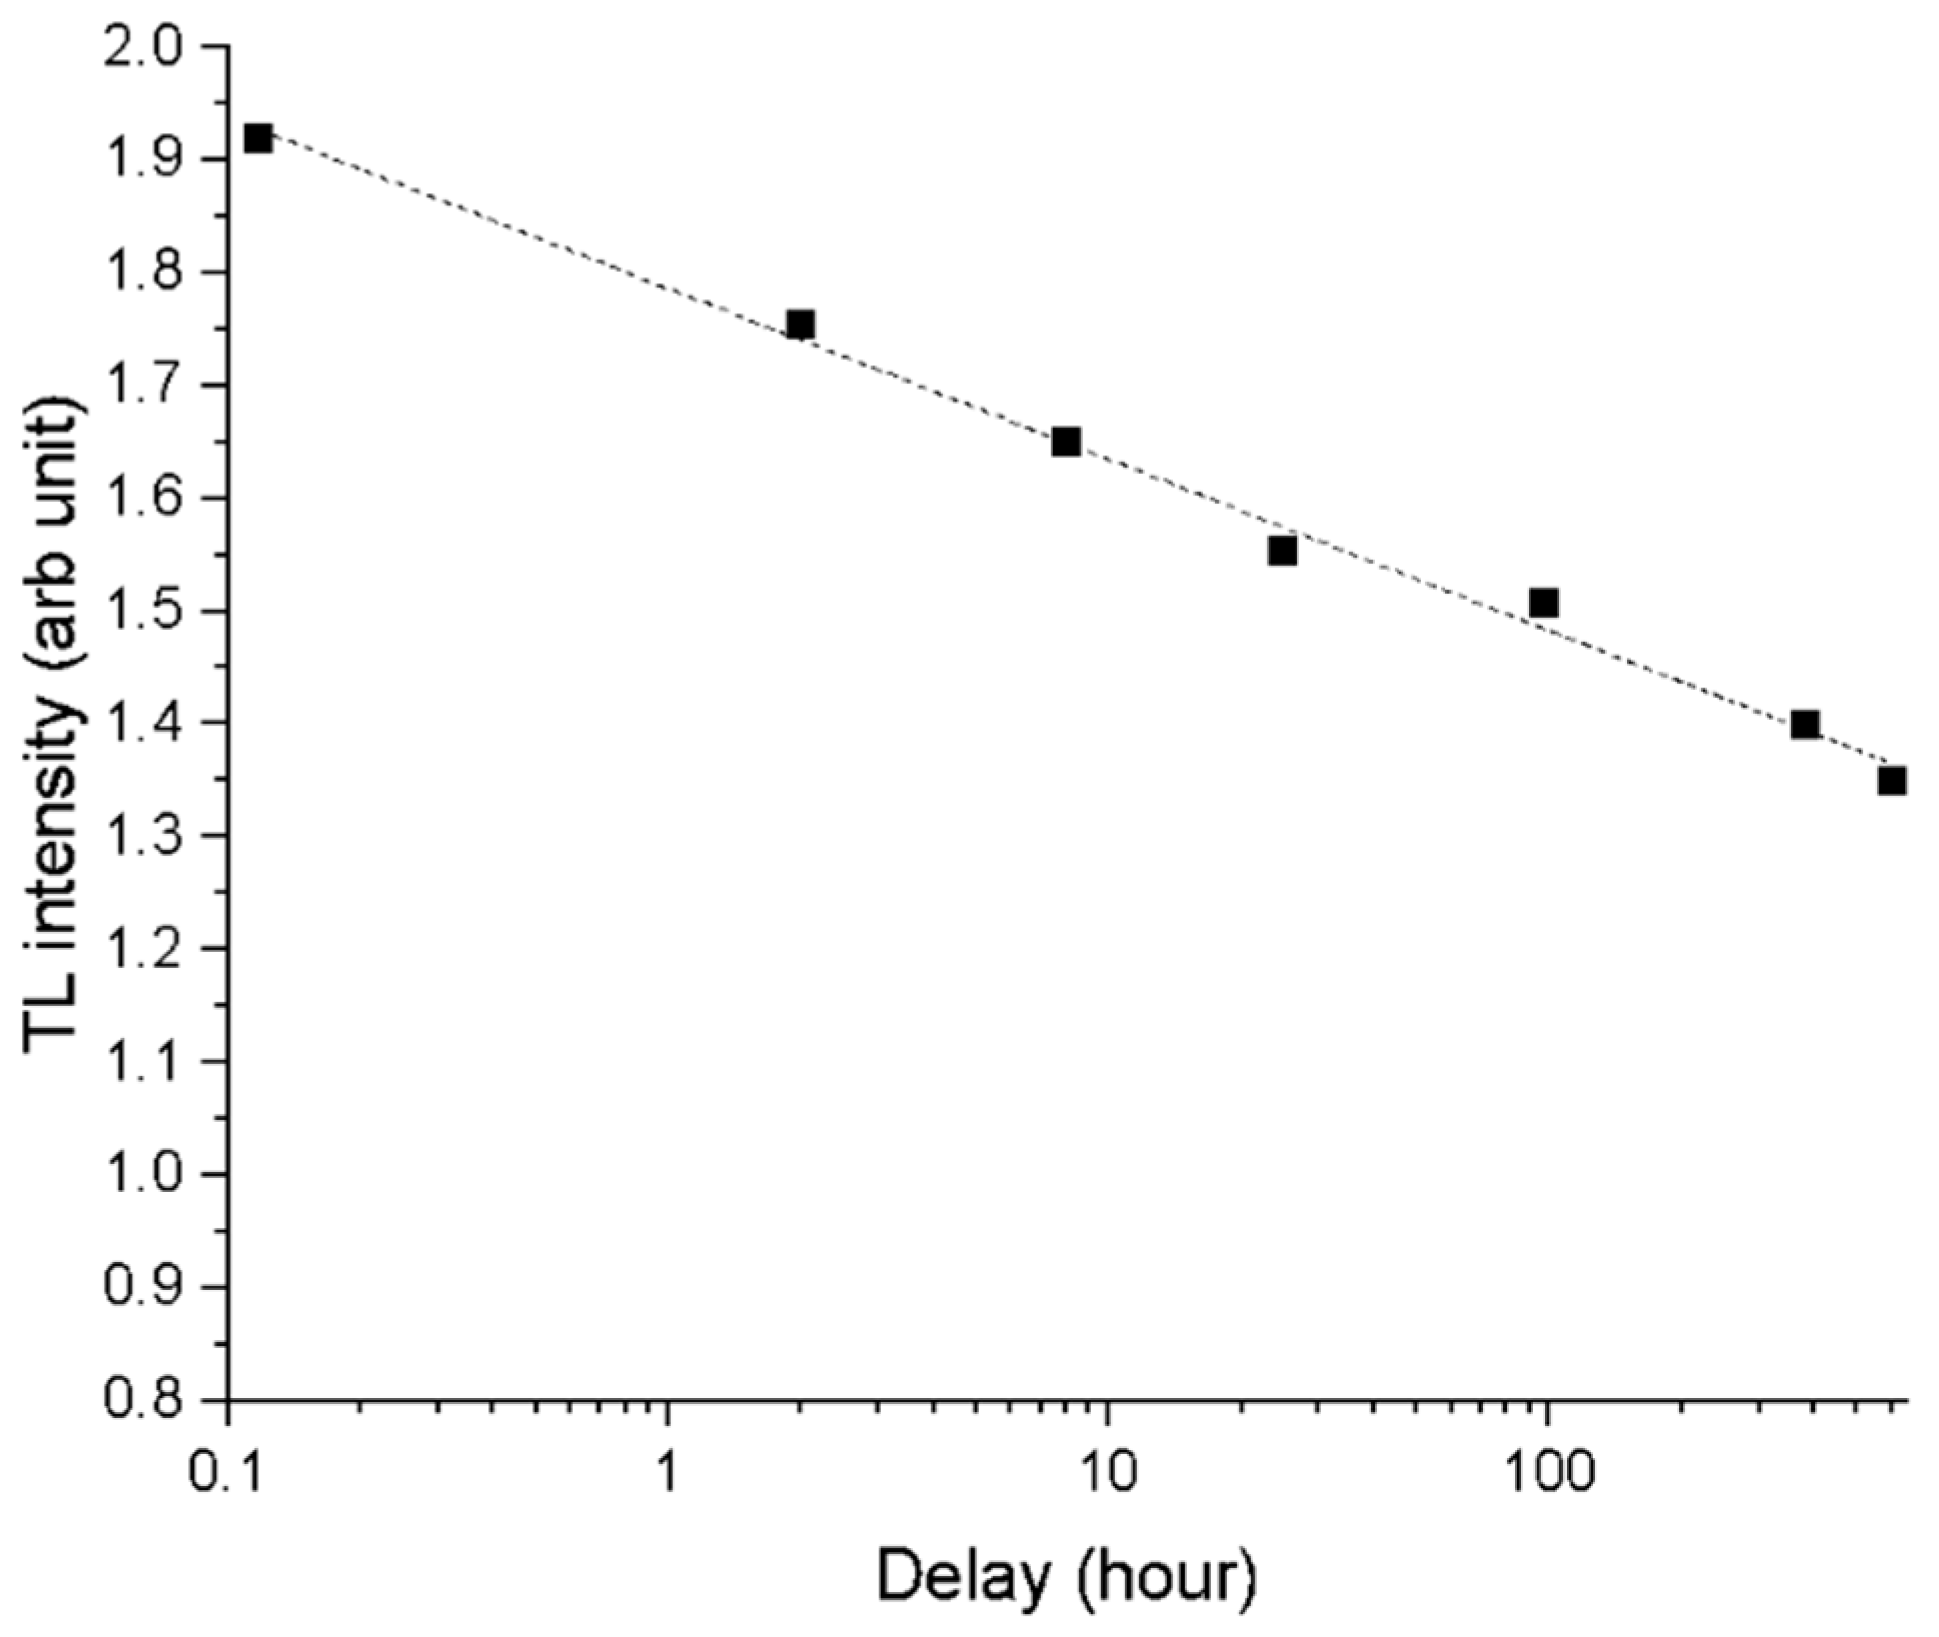
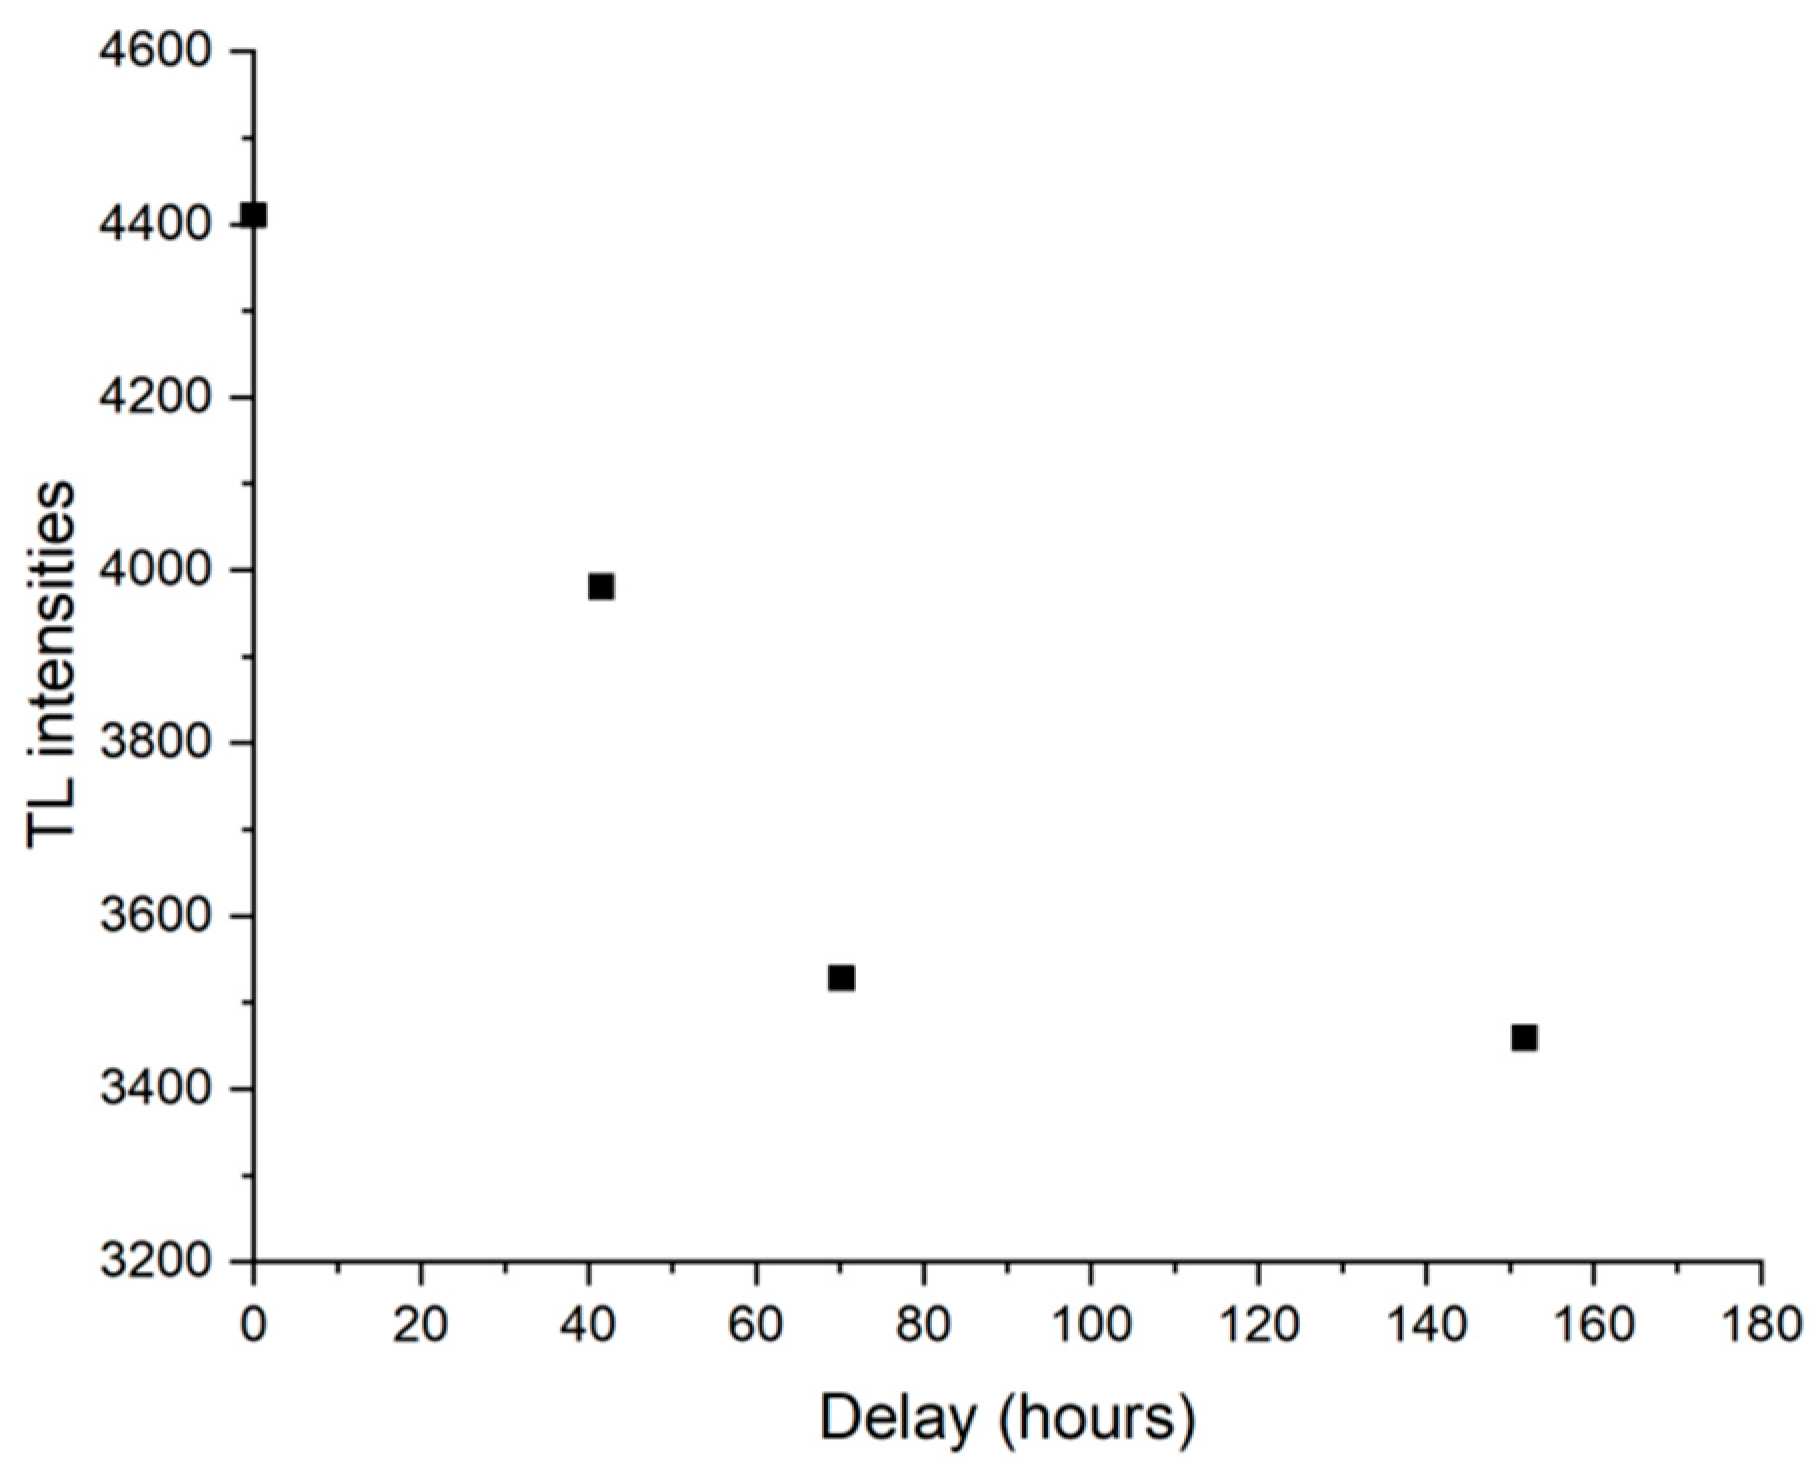
3.5. TL, OSL, and IRSL Results
3.6. Chronology of Bricks
4. Conclusions
Author Contributions
Funding
Institutional Review Board Statement
Informed Consent Statement
Data Availability Statement
Acknowledgments
Conflicts of Interest
References
- Weaver, M.E. Conserving Buildings: Guide to Techniques and Materials, Revised Edition; John Wiley & Sons, Inc.: Hoboken, NJ, USA, 1997; Available online: https://www.biblio.com/book/conserving-buildings-guide-techniques-materials-revised/d/1573100919 (accessed on 30 March 2024).
- Fernandes, F.M.; Lourenço, P.B.; Castro, F. Ancient Clay Bricks: Manufacture and Properties. In Materials, Technologies and Practice in Historic Heritage Structures; Dan, M.B., Přikryl, R., Török, Á., Eds.; Springer: Dordrecht, The Netherlands, 2010; pp. 29–48. [Google Scholar] [CrossRef]
- Johari, I.; Said, S.; Hisham, B.; Bakar, A.; Ahmad, Z.A. Effect of the change of firing temperature on microstructure and physical properties of clay bricks from Beruas (Malaysia). Sci. Sinter. 2010, 42, 245–254. [Google Scholar] [CrossRef]
- Mostaghelchi, M.; Zahiri, R.; Miremad, S.H.; Ebadi, A.G. Use of Mica Mineral Powder in Bricks Industry to Improve the Performances. Asian J. Chem. 2013, 25, 9144–9148. [Google Scholar] [CrossRef]
- Rasmussen, K.L.; De La Fuente, G.A.; Bond, A.D.; Mathiesen, K.K.; Vera, S.D. Pottery firing temperatures: A new method for determining the firing temperature of ceramics and burnt clay. J. Archaeol. Sci. 2012, 39, 1705–1716. [Google Scholar] [CrossRef]
- Amkpa, J.A.; Badarulzaman, N.A.; Aramjat, A.B. Influence of Sintering Temperatures on Physico-Mechanical Properties and Microstructure of Refractory Fireclay Bricks. Int. J. Eng. Technol. 2016, 8, 2588–2593. [Google Scholar] [CrossRef]
- Amkpa, J.A.; Badarulzaman, N.A.; Aramjat, A.B. Impact of Sintering Temperatures on Microstructure, Porosity and Mechanical Strength of Refractory Brick. Mater. Sci. Forum 2017, 888, 66–70. [Google Scholar] [CrossRef]
- Karaman, S.; Erşahin; S.; Günal, H. Firing temperature and firing time influence on mechanical and physical properties of clay bricks. J. Sci. Ind. Res. 2006. Available online: https://www.semanticscholar.org/paper/Firing-temperature-and-firing-time-influence-on-and-Karaman-Er%C5%9Fahin/f0cf8fe0caf2127e9b95492b85981a3292925d16 (accessed on 2 April 2024).
- Velraj, G.; Janaki, K.; Musthafa, A.M.; Palanivel, R. Estimation of firing temperature of some archaeological pottery shreds excavated recently in Tamilnadu, India. Spectrochim. Acta Part A Mol. Biomol. Spectrosc. 2009, 72, 730–733. [Google Scholar] [CrossRef]
- Maritan, L.; Nodari, L.; Mazzoli, C.; Milano, A.; Russo, U. Influence of firing conditions on ceramic products: Experimental study on clay rich in organic matter. Appl. Clay Sci. 2006, 31, 1–15. [Google Scholar] [CrossRef]
- İssi, A.; Kara, A.; Alp, A.O. An investigation of Hellenistic period pottery production technology from Harabebezikan/Turkey. Ceram. Int. 2011, 37, 2575–2582. [Google Scholar] [CrossRef]
- Papachristodoulou, C.; Oikonomou, A.; Ioannides, K.; Gravani, K. A study of ancient pottery by means of X-ray fluorescence spectroscopy, multivariate statistics and mineralogical analysis. Anal. Chim. Acta 2006, 573–574, 347–353. [Google Scholar] [CrossRef]
- Böhme, N.; Hauke, K.; Neuroth, M.; Geisler, T. In situ Raman imaging of high-temperature solid-state reactions in the CaSO4–SiO2 system. Int. J. Coal Sci. Technol. 2019, 6, 247–259. [Google Scholar] [CrossRef]
- Ghale, D.B.; Bohara, N.B.; Duwal, N.; Bhattarai, J. Investigation on the mineralogical phase of ancient brick samples of Kathmandu Valley (Nepal) using XRD and FTIR analysis. Rasayan J. Chem. 2019, 12, 402–408. [Google Scholar] [CrossRef]
- Keller, W.D.; Pickett, E.E. Absorption of infrared radiation by powdered silica minerals. Am. Mineral. 1949, 34, 855–868. [Google Scholar]
- Legodi, M.A.; De Waal, D. Raman spectroscopic study of ancient South African domestic clay pottery. Spectrochim. Acta Part A Mol. Biomol. Spectrosc. 2007, 66, 135–142. [Google Scholar] [CrossRef] [PubMed]
- Mendelovici, E. Comparative study of the effects of thermal and mechanical treatments on the structures of clay minerals. J. Therm. Anal. 1997, 49, 1385–1397. [Google Scholar] [CrossRef]
- Rutherford, J.S.; Almond, M.J.; Nunn, P.D. Analysis of pottery samples from Bourewa, the earliest known Lapita site in Fiji. Spectrochim. Acta Part A Mol. Biomol. Spectrosc. 2012, 85, 155–159. [Google Scholar] [CrossRef]
- Velraj, G.; Seetha, D.; Hemamalini, R. FT-IR, XRD, Porosity and TG-DTA Analysis of Archaeological Potteries Excavated from Kottapuram, Kerala, South India. Elixir Vib. Spec. 2014, 66, 20815–20819. [Google Scholar]
- Aitken, M.J. Thermoluminescence Dating; Academic Press Inc.: London, UK, 1985. [Google Scholar]
- Aitken, M.J. An Introduction to Optical Dating: The Dating of Quaternary Sediments by the Use of Photon-Stimulated Luminescence; Oxford Science Publications: Oxford, UK, 1998. [Google Scholar]
- Galli, A.; Martini, M.; Montanari, C.; Panzeri, L.; Sibilia, E. TL of fine-grain samples from quartz-rich archaeological ceramics: Dosimetry using the 110 and TL peaks. Radiat. Meas. 2006, 41, 1009–1014. [Google Scholar] [CrossRef]
- Galli, A.; Sibilia, E.; Martini, M. Ceramic chronology by luminescence dating: How and when it is possible to date ceramic artefacts. Archaeol. Anthropol. Sci. 2020, 12, 190. [Google Scholar] [CrossRef]
- Dhanapandian, S.; Shanthi, M.; Manoharan, C. FTIR and Mossbauer Studies on Industrial Clay Bricks from Three Different Regions of Tamilnadu State. Int. J. Curr. Res. 2010, 4, 122–126. [Google Scholar]
- Govindasamy, A.; Viruthagiri, G.; Ramesh, K. FI-IR Spectroscopic and Porosity Studies to Estimate the Firing Temperature of the Clay Brick. Intern. J. Appl. Eng. Res. 2019, 14, 2904–2909. [Google Scholar]
- Kiruba, S.; Ganesan, S. FT-IR and Micro-Raman spectroscopic studies of archaeological potteries recently excavated in Poompuhar, Tamilnadu, India. Spectrochim. Acta Part A Mol. Biomol. Spectrosc. 2015, 145, 594–597. [Google Scholar] [CrossRef]
- Raja Annamalai, G.; Ravisankar, R.; Rajalakshmi, A.; Chandrasekaran, A.; Rajan, K. Spectroscopic characterization of recently excavated archaeological potsherds from Tamilnadu, India with multi-analytical approach. Spectrochim. Acta Part A Mol. Biomol. Spectrosc. 2014, 133, 112–118. [Google Scholar] [CrossRef] [PubMed]
- Ramasamy, V.; Rajkumar, P.; Ponnusamy, V. Depth wise analysis of recently excavated Vellar river sediments through FTIR and XRD studies. Indian J. Phys. 2009, 83, 1295–1308. [Google Scholar] [CrossRef]
- Ravisankar, R.; Raja Annamalai, G.; Naseerutheen, A.; Chandrasekaran, A.; Prasad, M.V.R.; Satpathy, K.K.; Maheswaran, C. Analytical characterization of recently excavated megalithic sarcophagi potsherds in Veeranam village, Tiruvannamalai dist., Tamilnadu, India. Spectrochim. Acta Part A Mol. Biomol. Spectrosc. 2013, 115, 845–853. [Google Scholar] [CrossRef] [PubMed]
- Ravisankar, R.; Naseerutheen, A.; Rajalakshmi, A.; Raja Annamalai, G.; Chandrasekaran, A. Application of thermogravimetry–differential thermal analysis (TG–DTA) technique to study the ancient potteries from Vellore dist, Tamilnadu, India. Spectrochim. Acta Part A Mol. Biomol. Spectrosc. 2014, 129, 201–208. [Google Scholar] [CrossRef] [PubMed]
- Velraj, G.; Sathya, P.; Champion, P.M.; Ziegler, L.D. Mineralogical Appraisal Of Ancient Brick Samples Using FT-IR Spectroscopy; American Institute of Physics: College Park, MD, USA, 2010; pp. 307–308. [Google Scholar] [CrossRef]
- Sheikh, M.R.; Barua, A.G. X-ray Diffraction and Fourier Transform Infrared Spectra of the Bricks of the Kamakhya Temple. Indian J. Pure Appl. Phys. 2013, 15, 745–748. [Google Scholar]
- Chen, P.-Y. Table of Key Lines in X-ray Powder Diffraction Patterns of Minerals in Clays and Associated Rocks. 1977. Available online: https://scholarworks.iu.edu/dspace/items/61872b58-e6ab-4827-8b49-4b8ce8f754b4, (accessed on 11 June 2024).
- Lindholm, R.C. A Practical Approach to Sedimentology; Springer: Dordrecht, The Netherlands, 1987. [Google Scholar] [CrossRef]
- Tucker, M. Techniques in Sedimentology; Blackwell Scientific Publications: Oxford, London, Edinburgh, Boston, Melbourne, 1988; Available online: https://www.semanticscholar.org/paper/Techniques-in-sedimentology-Tucker/8f7d146ef7f60092851570958bf1d81525820305 (accessed on 11 June 2024).
- Zimmerman, D.W. Thermoluminescence dating using fine grains from pottery. Archaeometry 1971, 13, 29–52. [Google Scholar] [CrossRef]
- Murray, A.S.; Roberts, R.G. Measurement of the equivalent dose in quartz using a regenerative-dose single-aliquot protocol. Radiat. Meas. 1998, 29, 503–515. [Google Scholar] [CrossRef]
- Prescott, J.R.; Hutton, J.T. Cosmic ray contributions to dose rates for luminescence and ESR dating: Large depths and long-term time variations. Radiat. Meas. 1994, 23, 497–500. [Google Scholar] [CrossRef]
- Panzeri, L.; Galli, A.; Maspero, F.; Saleh, M.; Martini, M. The activities of the LAMBDA (Laboratory of Milano Bicocca university for Dating and Archaeometry): What’s new? J. Phys. Conf. Ser. 2022, 2204, 012047. [Google Scholar] [CrossRef]
- Elsass, F.; Olivier, D. Infra-red and electron spin resonance studies of clays representative of the sedimentary evolution of the basin of Autun. Clay Min. 1978, 13, 299–308. [Google Scholar] [CrossRef]
- Bukalo, N.N.; Ekosse, G.-I.E.; Odiyo, J.O.; Ogola, J.S. Fourier Transform Infrared Spectroscopy of Clay Size Fraction of Cretaceous-Tertiary Kaolins in the Douala Sub-Basin, Cameroon. Open Geosci. 2017, 9, 407–418. [Google Scholar] [CrossRef]
- Lyon, R.J.P. Infrared absorption spectroscopy. In Physical Methods in Determinative Mineralogy; Zussman, J., Ed.; Academic Press: London, UK; New York, NY, USA, 1967; pp. 371–403. [Google Scholar]
- Hayashi, H.; Otsuka, R.; Imai, N. Infrared study of sepiolite and paly-gorskite on heating. Am. Mineral. 1969, 54, 1613–1624. [Google Scholar]
- Russell, J.D. Infrared methods. In A Handbook of Determinative Methods in Clay Mineralogy, Wilson, M.J., Ed.; Blackie and Sons Ltd.: New York, NY, USA, 1987; p. 133. [Google Scholar]
- Serna, C.; VanScoyoc, G.E.; Ahlrichs, J.L. Hydroxyl groups and water in palygorskite. Am. Mineral. 1977, 62, 784–792. [Google Scholar]
- Bain, D.C.; Fraser, A.R. An Unusually Interlayered Clay Mineral from the Eluvial Horizon of a Humus-Iron Podzol. Clay Miner. 1994, 29, 69–76. [Google Scholar] [CrossRef]
- Dios Cancela, G.; Romero Taboada, E.; Huertas, F.J.; Hernández Laguna, A.; Sánchez Rasero, F. Interaction of Trialkyl Phosphites with Montmorillonites. Clays Clay Miner. 1996, 44, 170–180. [Google Scholar] [CrossRef]
- Hajjaji, M.; Kacim, S.; Alami, A.; El Bouadili, A.; El Mountassir, M. Chemical and mineralogical characterization of a clay taken from the Moroccan Meseta and a study of the interaction between its fine fraction and methylene blue. Appl. Clay Sci. 2001, 20, 1–12. [Google Scholar] [CrossRef]
- Song, Z.; Chouparova, E.; Jones, K.; Feng, H.; Marinkovic, N. FTIR Investigation of Sediments from NY/NJ Harbor, San Diego Bay, and the Venetian Lagoon. NSLS Act. Rep. 2001, 2, 112–116. Available online: https://scholar.google.com/citations?view_op=view_citation&hl=en&user=H6QBGp0AAAAJ&citation_for_view=H6QBGp0AAAAJ:ufrVoPGSRksC (accessed on 11 June 2024).
- Fysh, S.A.; Fredericks, P.M. Fourier Transform Infrared Studies of Aluminous Goethites and Hematites. Clays Clay Miner. 1983, 31, 377–382. [Google Scholar] [CrossRef]
- Chutia, A.; Taye, C.D.; Daimari, J.; Chutia, D. Petrography and Clay Mineralogical Study of the Siwalik Group of Rocks Exposed along Pasighat-Mariyang Road Section, East Siang District, Arunachal Pradesh, Northeast India. J. Geol. Soc. India 2020, 95, 263–272. [Google Scholar] [CrossRef]
- Hlavay, J.; Jonas, K.; Elek, S.; Inczedy, J. Characterization of the Particle Size and the Crystallinity of Certain Minerals by IR Spectrophotometry and other Instrumental Methods—II. Investigations on Quartz and Feldspar. Clays Clay Miner. 1978, 26, 139–143. [Google Scholar] [CrossRef]
- Ramasamy, V.; Murugesan, S.; Mullainathan, S. Characterisation of minerals and relative distribution of quartz in Cauvery river sediments from Tamilnadu, India—A FTIR Study. Bull. Pure Appl. Sci. 2004, 23F, 1–7. [Google Scholar]
- Theodosoglou, E.; Koroneos, A.; Soldatos, T.; Zorba, T.; Paraskevopoulos, K.M. Comparative Fourier transform infrared and X-ray powder diffraction analysis of naturally occurred K-feldspars. Bull. Geol. Soc. Greece 2010, 43, 5. [Google Scholar] [CrossRef]
- Seetha, D.; Velraj, G. Characterization and chemometric analysis of ancient pot shards trenched from Arpakkam, Tamil Nadu, India. J. Appl. Res. Technol. 2016, 14, 345–353. [Google Scholar] [CrossRef]
- Jozanikohan, G.; Abarghooei, M.N. The Fourier transform infrared spectroscopy (FTIR) analysis for the clay mineralogy studies in a clastic reservoir. J. Pet. Explor. Prod. Technol. 2022, 12, 2093–2106. [Google Scholar] [CrossRef]
- Hindy, K.; Baghdady, A.; Howari, F.M.; Abdelmaksoud, A. A Qualitative Study of Airborne Minerals and Associated Organic Compounds in Southeast of Cairo, Egypt. Int. J. Environ. Res. Public Health 2018, 15, 568. [Google Scholar] [CrossRef] [PubMed]
- Libretexts. Infrared Spectroscopy Absorption Table. Chemistry LibreTexts. 2014. Available online: https://chem.libretexts.org/Ancillary_Materials/Reference/Reference_Tables/Spectroscopic_Reference_Tables/Infrared_Spectroscopy_Absorption_Table (accessed on 17 November 2023).
- Shillito, L.M.; Almond, M.J.; Wicks, K.; Marshall, L.-J.R.; Matthews, W. The use of FT-IR as a screening technique for organic residue analysis of archaeological samples. Spectrochim. Acta Part A Mol. Biomol. Spectrosc. 2009, 72, 120–125. [Google Scholar] [CrossRef]
- Maniatis, Y.; Katsanos, A.; Caskey, M.E. Technological Examination of Low-Fired Terracotta Statues from Ayia Irini, Kea. Archaeometry 1982, 24, 191–198. [Google Scholar] [CrossRef]
- Ramasamy, K.; Kamalakkannan, V. Infrared study of some South Indian Clays. Indian J. Pure Appl. Phys. 1987, 25, 284–286. [Google Scholar]
- Damjanović, L.; Holclajtner-Antunović, I.; Mioč, U.B.; Bikić, V.; Milovanović, D.; Evans, I.R. Archaeometric study of medieval pottery excavated at Stari (Old) Ras, Serbia. J. Archaeol. Sci. 2011, 38, 818–828. [Google Scholar] [CrossRef]
- Maniatis, Y.; Tite, M.S. Technological examination of Neolithic-Bronze Age pottery from central and southeast Europe and from the Near East. J. Archaeol. Sci. 1981, 8, 59–76. [Google Scholar] [CrossRef]
- Ravisankar, R.; Raja Annamalai, G.; Rajan, K.; Naseerutheen, A.; Senthil Kumar, G. Mineral Analysis In Archaeological Pottery From Porunthal, Dindigal Dist, Tamilnadu, India By FT-IR Spectroscopic Technique. Int. J. Sci. Innov. Discov. 2012, 2, 53–60. [Google Scholar]
- Ravisankar, R.; Kiruba, S.; Naseerutheen, A.; Chandrasekaran, A.; Annamalai, G.R.; Seran, M.; Balaji, P.D. Estimation of the firing temeparaure of arachaelocigical pottery excavated from Thiruverkadu, Tamilnadu, India by FT-IR spectroscopy. Arch. Phys. Res. 2011, 2, 108–114. [Google Scholar]
- Ravisankar, R.; Kiruba, S.; Shamira, C.; Naseerutheen, A.; Balaji, P.D.; Seran, M. Spectroscopic techniques applied to the characterization of recently excavated ancient potteries from Thiruverkadu Tamilnadu, India. Microchem. J. 2011, 99, 370–375. [Google Scholar] [CrossRef]
- Castellanos, A.O.M.; Río, R.C.A.; Ramos, G.M.A.; Plaza, P.E.V. A comparative study of mineralogical transformations in fired clays from the Laboyos Valley Upper Magdalena Basin (Colombia). Boletín Geol. 2012, 34, 43–55. [Google Scholar]
- Shoval, S. The firing temperature of a persian-period pottery kiln at Tel Michal, Israel, estimated from the composition of its pottery. J. Therm. Anal. 1994, 42, 175–185. [Google Scholar] [CrossRef]
- Russ, W.; Mörtel, H.; Meyer-Pittroff, R. Application of spent grains to increase porosity in bricks. Constr. Build. Mater. 2005, 19, 117–126. [Google Scholar] [CrossRef]
- Cultrone, G.; Sebastián, E.; Elert, K.; De La Torre, M.J.; Cazalla, O.; Rodriguez–Navarro, C. Influence of mineralogy and firing temperature on the porosity of bricks. J. Eur. Ceram. Soc. 2004, 24, 547–564. [Google Scholar] [CrossRef]
- Grim, R.E. Clay Mineralogy, 2nd ed.; McGraw Hill: New York, NY, USA, 1968. [Google Scholar]
- Iordanidis, A.; Garcia-Guinea, J.; Karamitrou-Mentessidi, G. Analytical study of ancient pottery from the archaeological site of Aiani, northern Greece. Mater. Charact. 2009, 60, 292–302. [Google Scholar] [CrossRef]
- Maniatis, Y.; Simopoulos, A.; Kostikas, A.; Perdikatsis, V. Effect of reducing atmosphere on minerals and iron oxides developed in fired clays: The role of Ca. J. Am. Ceram. Soc. 1983, 66, 773–781. [Google Scholar] [CrossRef]
- Tite, M.S.; Maniatis, Y. Examination of ancient pottery using the scanning electron microscope. Nature 1975, 257, 5522. [Google Scholar] [CrossRef]
- Goldstein, J.I.; Newbury, D.E.; Echlin, P.; Joy, D.C.; Lyman, C.E.; Lifshin, E.; Sawyer, L.; Michael, J.R. Scanning Electron Microscopy and X-ray Microanalysis: Third Edition; Springer: Boston, MA, USA, 2003. [Google Scholar] [CrossRef]
- Tite, M.S. The Impact of Electron Microscopy on Ceramic Studies. Proc. Br. Acad. 1992, 77, 111–131. [Google Scholar]
- Maniatis, Y.; Tite, M.S. Ceramic Technology in the Aegan world during the Bronze Age; Doumas, C., Ed.; Thera and the Aegan World: Santorini, Greece, 1978; Volume 1. [Google Scholar]
- Leriche, A.; Cambier, F.; Hampshire, S. Sintering of Ceramics. In Reference Module in Materials Science and Materials Engineering; Elsevier: Amsterdam, The Netherlands, 2017; p. B9780128035818102887. [Google Scholar] [CrossRef]
- Lecomte, G.; Pateyron, B.; Blanchart, P. Experimental study and simulation of a vertical section mullite-ternary eutectic (985 °C) in the SiO2–Al2O3–K2O system. Mater. Res. Bull. 2004, 39, 1469–1478. [Google Scholar] [CrossRef]
- Osborn, E.F.; Muan, A. Phase Equilibrium Diagrams of Oxide Systems; American Ceramic Society with the Edward Orton Jr. Ceramic Foundation: Columbus, OH, USA, 1960. [Google Scholar]
- Garzón, E.; Pérez-Villarejo, L.; Eliche-Quesada, D.; Martínez-Martínez, S.; Sánchez-Soto, P.J. Vitrification rate and estimation of the optimum firing conditions of ceramic materials from raw clays: A review. Ceram. Int. 2022, 48, 15889–15898. [Google Scholar] [CrossRef]
- Sánchez-Soto, P.J.; Garzón, E.; Pérez-Villarejo, L.; Eliche-Quesada, D. Sintering behaviour of a clay containing pyrophyllite, sericite and kaolinite as ceramic raw materials: Looking for the optimum firing conditions. Boletín Soc. Española Cerámica Y Vidr. 2023, 62, 26–39. [Google Scholar] [CrossRef]
- Wintle, A.G. Anomalous Fading of Thermo-luminescence in Mineral Samples. Nature 1973, 245, 5421. [Google Scholar] [CrossRef]
- Huntley, D.J.; Lamothe, M. Ubiquity of anomalous fading in K-feldspars and the measurement and correction for it in optical dating. Can. J. Earth Sci. 2001, 38, 1093–1106. [Google Scholar] [CrossRef]
- Garcia Guinea, J.; Correcher, V.; Valle-Fuentes, F.J. Thermoluminescence of Kaolinite. Radiat. Prot. Dosim. 1999, 84, 507–510. [Google Scholar] [CrossRef]
- Correcher, V.; Garcia-Guinea, J.; Crespo-Feo, E.; Rodriguez-Lazcano, Y.; Prado-Herrero, P. Dose–response of thermoluminescence in natural kaolinite. Thermochim. Acta 2010, 503–504, 12–15. [Google Scholar] [CrossRef]
- Polymeris, G.S.; Kitis, G.; Afouxenidis, D.; Sfampa, I.K.; Tsirliganis, N.C.; Rousaki, A.; Kouloumpi, E.; Paraskevopoulos, K.M. On the feasibility of dating portable paintings: Preliminary luminescence measurements on ground materials. Mediterr. Archaeol. Archaeom. 2013, 13, 93–103. [Google Scholar]
- Sheikh, M.R. Physics for Cultural Heritage: TL Dating of the Kamakhya Temple, Assam, India. Int. J. Curr. Trends Eng. Technol. 2017, 3, 174–176. [Google Scholar]


| S.No. | Sample ID | Color | Type of the Clay | Estimation of Firing Temperature |
|---|---|---|---|---|
| 1 | Mouramora-1 | Light red color | White clay | Below 650 °C |
| 2 | Mouramora-2 | Light red color | White clay | Below 650 °C |
| 3 | Mouramora-3 | Light red color | White clay | Above ~800 °C |
| 4 | Padum Pukhuri | Light red | White clay | Above ~800 °C |
| 5 | Rukmini Garh | Reddish yellow | White clay | Above ~800 °C |
| 6 | Pratima Garh | Weak red | Red clay | Above ~800 °C |
| SAMPLE ID | W (%) | a Value | ppm U (±5%) | ppm Th (±5%) | K2O (±3%) | E.D. (Gy) | Dose Rate (mGy/a) | Age (y) | Date | Error |
|---|---|---|---|---|---|---|---|---|---|---|
| Mour1 TL | 18 | 0.14 | 4.1 | 12.9 | 2.98 | 2.2 ± 0.3 | 6.9 ± 0.3 | 320 | 1700 | 60 |
| Mour-1 IRSL | 18 | 0.14 | 4.1 | 12.9 | 2.98 | 2.6 ± 0.8 | 7.5 ± 0.3 | 350 | 1670 | 90 |
| Mour-2 TL | 23 | 0.18 | 4.3 | 13.8 | 2.56 | 2.7 ± 0.3 | 7.2 ± 0.4 | 380 | 1640 | 60 |
| Mour-2 IRSL | 23 | 0.18 | 4.3 | 13.8 | 2.56 | 3.1 ± 0.5 | 7.8 ± 0.4 | 400 | 1620 | 90 |
| Mour-3 TL | 24 | 0.14 | 4.2 | 13.4 | 3.52 | 2.7 ± 0.3 | 7.6 ± 0.4 | 360 | 1640 | 70 |
| Mour-3 IRSL | 24 | 0.14 | 4.2 | 13.4 | 3.52 | 1.8 ± 0.2 | 7.7 ± 0.4 | 230 | 1790 | 60 |
| Prat TL | 33 | 0.14 | 5.0 | 15.8 | 3.52 | 3.6 ± 0.3 | 7.3 ± 0.4 | 490 | 1530 | 60 |
| Prat IRSL | 33 | 0.14 | 5.0 | 15.8 | 3.52 | 4.2 ± 0.3 | 7.9 ± 0.4 | 530 | 1490 | 70 |
| PadumTL | 30 | 0.25 | 2.7 | 8.5 | 1.48 | 4.9 ± 0.4 | 4.9 ± 0.2 | 1000 | 1020 | 120 |
| PadumOSL | 30 | 0.25 | 2.7 | 8.5 | 1.48 | 4.2 ± 1.0 | 4.9 ± 0.2 | 860 | 1160 | 250 |
| PadumIRSL | 30 | 0.25 | 2.7 | 8.5 | 1.48 | 1.6 ± 02 | 5.5 ± 0.2 | 290 | 1730 | 60 |
| SAMPLE ID | g-Value | Age Faded | Date Faded |
|---|---|---|---|
| Mour-1 (TL) | 6.8 ± 0.4 | 630 ± 130 | 1390 ± 130 |
| Mour-1 (IRSL) | 7.9 ± 0.5 | 920 ± 220 | 1100 ± 220 |
| Mour-2 (TL) | 8.4 ± 1.8 | 1010 ± 300 | 1010 ± 270 |
| Mour-2 (IRSL) | 5.7 ± 1.5 | 870 ± 250 | 1150 ± 250 |
| Mour-3 (TL) | 9.0 ± 0.3 | 1170 ± 280 | 850 ± 280 |
| Mour-3 (IRSL) | 9.8 ± 0.3 | 910 ± 250 | 1110 ± 250 |
| Prat (TL) | 8.6 ± 2.1 | 1410 ± 390 | 610 ± 390 |
| Prat (IRSL) | 9.0 ± 0.2 | 1860 ± 300 | 160 ± 500 |
| Padum (TL) | 3.4 ± 0.7 | 1350 ± 180 | 670 ± 180 |
| Padum (OSL) | 3.3 ± 0.6 | 1140 ± 360 | 880 ± 360 |
| Padum (IRSL) | 9.1 ± 0.1 | 1040 ± 200 | 980 ± 200 |
| Name of Archaeological Sites | Type of Clay Used | Calculated Age | Estimated Firing Temperature |
|---|---|---|---|
| Mouramora-1 | Non-calcareous | XI-XIV sec CE | Below 650 °C |
| Mouramora-2 | Non-calcareous | Below 650 °C | |
| Mouramora-3 | Non-calcareous | Above ~800 °C | |
| Pratima Garh | Calcareous | VII-X sec CE (i.e., pre-Ahom) | Above ~800 °C |
| Padum Pukhuri | Non-calcareous | Above ~800 °C | |
| Rukmini Garh | Non-calcareous | Not datable | Above ~800 °C |
Disclaimer/Publisher’s Note: The statements, opinions and data contained in all publications are solely those of the individual author(s) and contributor(s) and not of MDPI and/or the editor(s). MDPI and/or the editor(s) disclaim responsibility for any injury to people or property resulting from any ideas, methods, instructions or products referred to in the content. |
© 2024 by the authors. Licensee MDPI, Basel, Switzerland. This article is an open access article distributed under the terms and conditions of the Creative Commons Attribution (CC BY) license (https://creativecommons.org/licenses/by/4.0/).
Share and Cite
Saikia, R.R.; Taye, C.D.; Amin, N.; Konwar, S.; Panzeri, L.; Galli, A. Chronological and Archaeometric Evaluation of Bricks from Archaeological Sites of Upper Assam, Northeast India: Estimation of the Firing Temperature and Civilization History. Appl. Sci. 2024, 14, 6271. https://doi.org/10.3390/app14146271
Saikia RR, Taye CD, Amin N, Konwar S, Panzeri L, Galli A. Chronological and Archaeometric Evaluation of Bricks from Archaeological Sites of Upper Assam, Northeast India: Estimation of the Firing Temperature and Civilization History. Applied Sciences. 2024; 14(14):6271. https://doi.org/10.3390/app14146271
Chicago/Turabian StyleSaikia, Raktim Ranjan, Chaitra Dhar Taye, Nurul Amin, Sorat Konwar, Laura Panzeri, and Anna Galli. 2024. "Chronological and Archaeometric Evaluation of Bricks from Archaeological Sites of Upper Assam, Northeast India: Estimation of the Firing Temperature and Civilization History" Applied Sciences 14, no. 14: 6271. https://doi.org/10.3390/app14146271
APA StyleSaikia, R. R., Taye, C. D., Amin, N., Konwar, S., Panzeri, L., & Galli, A. (2024). Chronological and Archaeometric Evaluation of Bricks from Archaeological Sites of Upper Assam, Northeast India: Estimation of the Firing Temperature and Civilization History. Applied Sciences, 14(14), 6271. https://doi.org/10.3390/app14146271