1. Introduction
The classification of metals and metalloids with an atomic density above 5 g cm
−3 is referred to as heavy metals [
1]. In recent times, the growing discharge of agricultural, industrial, and household waste into water sources has elevated the public apprehension regarding the presence of heavy metals, posing a significant threat to human health [
2,
3]. Heavy metals exhibit a propensity to engage with biological ligands, inducing alterations in protein molecular structures and enzyme inhibition, thereby leading to toxicological and carcinogenic consequences [
4,
5]. Mercury (Hg) emerges as a highly hazardous metal contaminant in the environment, with its occurrence stemming from natural processes like the breakdown of minerals in rocks, volcanic eruptions, and soil degradation. Additionally, human activities contribute significantly to its presence through industrial processes, utilization in batteries, thermometers, and catalysts [
6,
7]. Mercury induces significant health issues in humans, including elevated blood pressure, glioma, acute cognitive impairments, nervousness, depression, eye problems, and dysfunction of the central nervous system. The World Health Organization (WHO) recommends acceptable mercury levels in water samples for human consumption to be 1.0 µg L
−1 and in food samples within the range of 0.02 to 0.9 mg kg
−1 [
8]. Therefore, accurate and precise analytical methods are essential for the reliable determination of mercury in various types of samples.
Various conventional enrichment-separation techniques, such as liquid–liquid micro-extraction (LLME) [
9,
10], solid-phase extraction [
11,
12], cloud point extraction [
13,
14], dual cloud point extraction [
15], online enrichment [
16], micro-columns [
17] supramolecular solvent-based liquid-phase micro-extraction with ultrasonic assistance [
18], and coprecipitation [
19], have been employed for the preconcentration of trace levels of mercury.
The integration of green chemistry principles into laboratory practices signifies a recent advancement in the field of chemistry. This shift is characterized by a reassessment of experiments, placing a strong emphasis on the utilization of environmentally friendly materials and the implementation of efficient waste-management strategies. In this context, innovative systems have been introduced to evaluate the efficacy of green chemistry methodologies in comparison to traditional approaches. Analytical chemistry, in particular, faces a notable challenge in developing sample preparation methods that are not only more effective but also environmentally sustainable. The Green Analytical Chemistry (GAC) approach is influenced by various factors, encompassing sample collection, preparation, reagents, instrumentation, and the overall method type. To comprehensively assess the environmental impact of any procedure, it is essential to elucidate and consider these factors thoroughly. Within the domain of Green Analytical Chemistry (GAC), sample preparation assumes a crucial role, involving the concentration of trace-level analytes and the elimination of interfering substances. The solidified floating organic drop micro-extraction (SFODME) method addresses these objectives with notable advantages. Noteworthy features include its requirement for only small amounts of extraction liquid, simplicity, affordability, minimal use of organic solvents, absence of chelating agents, and the ability to achieve a high enrichment factor. These attributes distinguish SFODME from conventional methodologies, highlighting its environmental friendliness and efficiency [
20].
In the present study, the solidified floating organic drop micro-extraction method has been developed with the help of ionic liquid (IL-SFODME) for the preconcentration and graphite furnace atomic absorption spectroscopy (GFAAS) determination of mercury ions in various water samples. The method utilizes 1-Hexyl-3-methylimidazolium hexafluorophosphate (HMIMPF6) (ionic liquid) instead of a chelating agent, and 1-dodecanol serves as the extraction solvent. In the scope of this study, the combination of the ionic liquid and SFODME methods without using a chelating agent is used for the first time. There is no similar study to the best of the author’s knowledge. This approach offers a simple, selective, sensitive, and cost-effective means for concentrating and analyzing mercury ions, particularly in water samples. The utilization of IL-SFODME underscores its practicality and potential as an analytical tool for mercury detection.
2. Materials and Methods
2.1. Reagents and Materials
The Hg(II) stock solution employed in this study was prepared using a single standard element solution containing Hg(II) at a concentration of 1000 mg/L, specifically produced for atomic absorption and inductively coupled plasma–optical emission spectrometry in a 10% HNO3 environment (Perkin Elmer Single Standard Solution, 125 mL, (Waltham, MA, USA)). Both standard and sample solutions used in the method were derived by diluting the stock solution in appropriate proportions. The extraction solvent, 1-dodecanol (CH3(CH2)10CH2OH), was sourced from Merck, while 1-Hexyl-3-methylimidazolium hexafluorophosphate (HMIMPF6), an ionic liquid (IL) forming ion pairs with mercury ions, was obtained from Sigma-Aldrich, St. Louis, MO, USA). For pH adjustment, a phthalate buffer solution was employed, prepared by combining 0.1 mol/L potassium hydrogen phthalate (Merck, Darmstadt, Germany) and 0.1 mol/L hydrochloric acid (Merck) in suitable proportions. Ethanol (Merck) was used to dilute the organic phase. Matrix modifier chemicals: palladium nitrate (Pd(NO3)2) and magnesium nitrate hexahydrate (Mg(NO3)2∙6H2O) were obtained from Merck. The 0.05% Pd solution was prepared by its nitrate salt, and 10 µL of this solution was injected during the analysis. Similarly, the 0.03% Mg(NO3)2 solution was prepared by its nitrate salt, and 10 µL of this solution was injected during the analysis. The concentrations of matrix modifiers were calculated through the recommended conditions obtained from Perkin Elmer. To assess the accuracy of the method, ERM-CA713 certified reference wastewater material from LGC Standards GmbH (Wesel, Germany) was utilized. In the interest of maintaining the integrity of laboratory materials, all equipment used during the experiments underwent an overnight soak in 10% HCl solution and were subsequently rinsed three times with deionized water.
2.2. Instrumentation
In the experiments, all chemicals utilized were of analytical purity and all solutions were prepared using ultrapure water with a resistance of 18.1 MΩ cm. The ultrapure water employed was Type-1 water from the Elga Purelab brand and model ultrapure water device. pH measurements of the solutions were conducted using a Thermo brand Orion 4-Star model pH-conductivity measuring device. Sample solutions were heated to the required temperature and subjected to the recommended method at the appropriate stirring speed using a Kudos brand HS15-26P model multi-heater magnetic stirrer.
A Perkin Elmer AAnalyst 800 Atomic Absorption Spectrometer (USA) (Waltham, MA, USA) with a longitudinal Zeeman effect background correction system was used for the determination of Hg. A Perkin Elmer electrodeless discharge lamp (EDL) was used as the radiation source. The mercury absorbance was measured at 253.7 nm with a 0.7 nm spectral band pass. The employed atomizer was a transversely heated graphite tube with an integrated pyrolytic graphite platform. A Perkin-Elmer AS-800 autosampler (Waltham, MA, USA) with was used to inject samples into a furnace. Argon gas at a flow rate of 250 mL/min was used as an inert gas during all the stages except for atomization when the flow was stopped. Absorbances obtained during the analysis were determined from the areas under the peaks.
2.3. Procedure
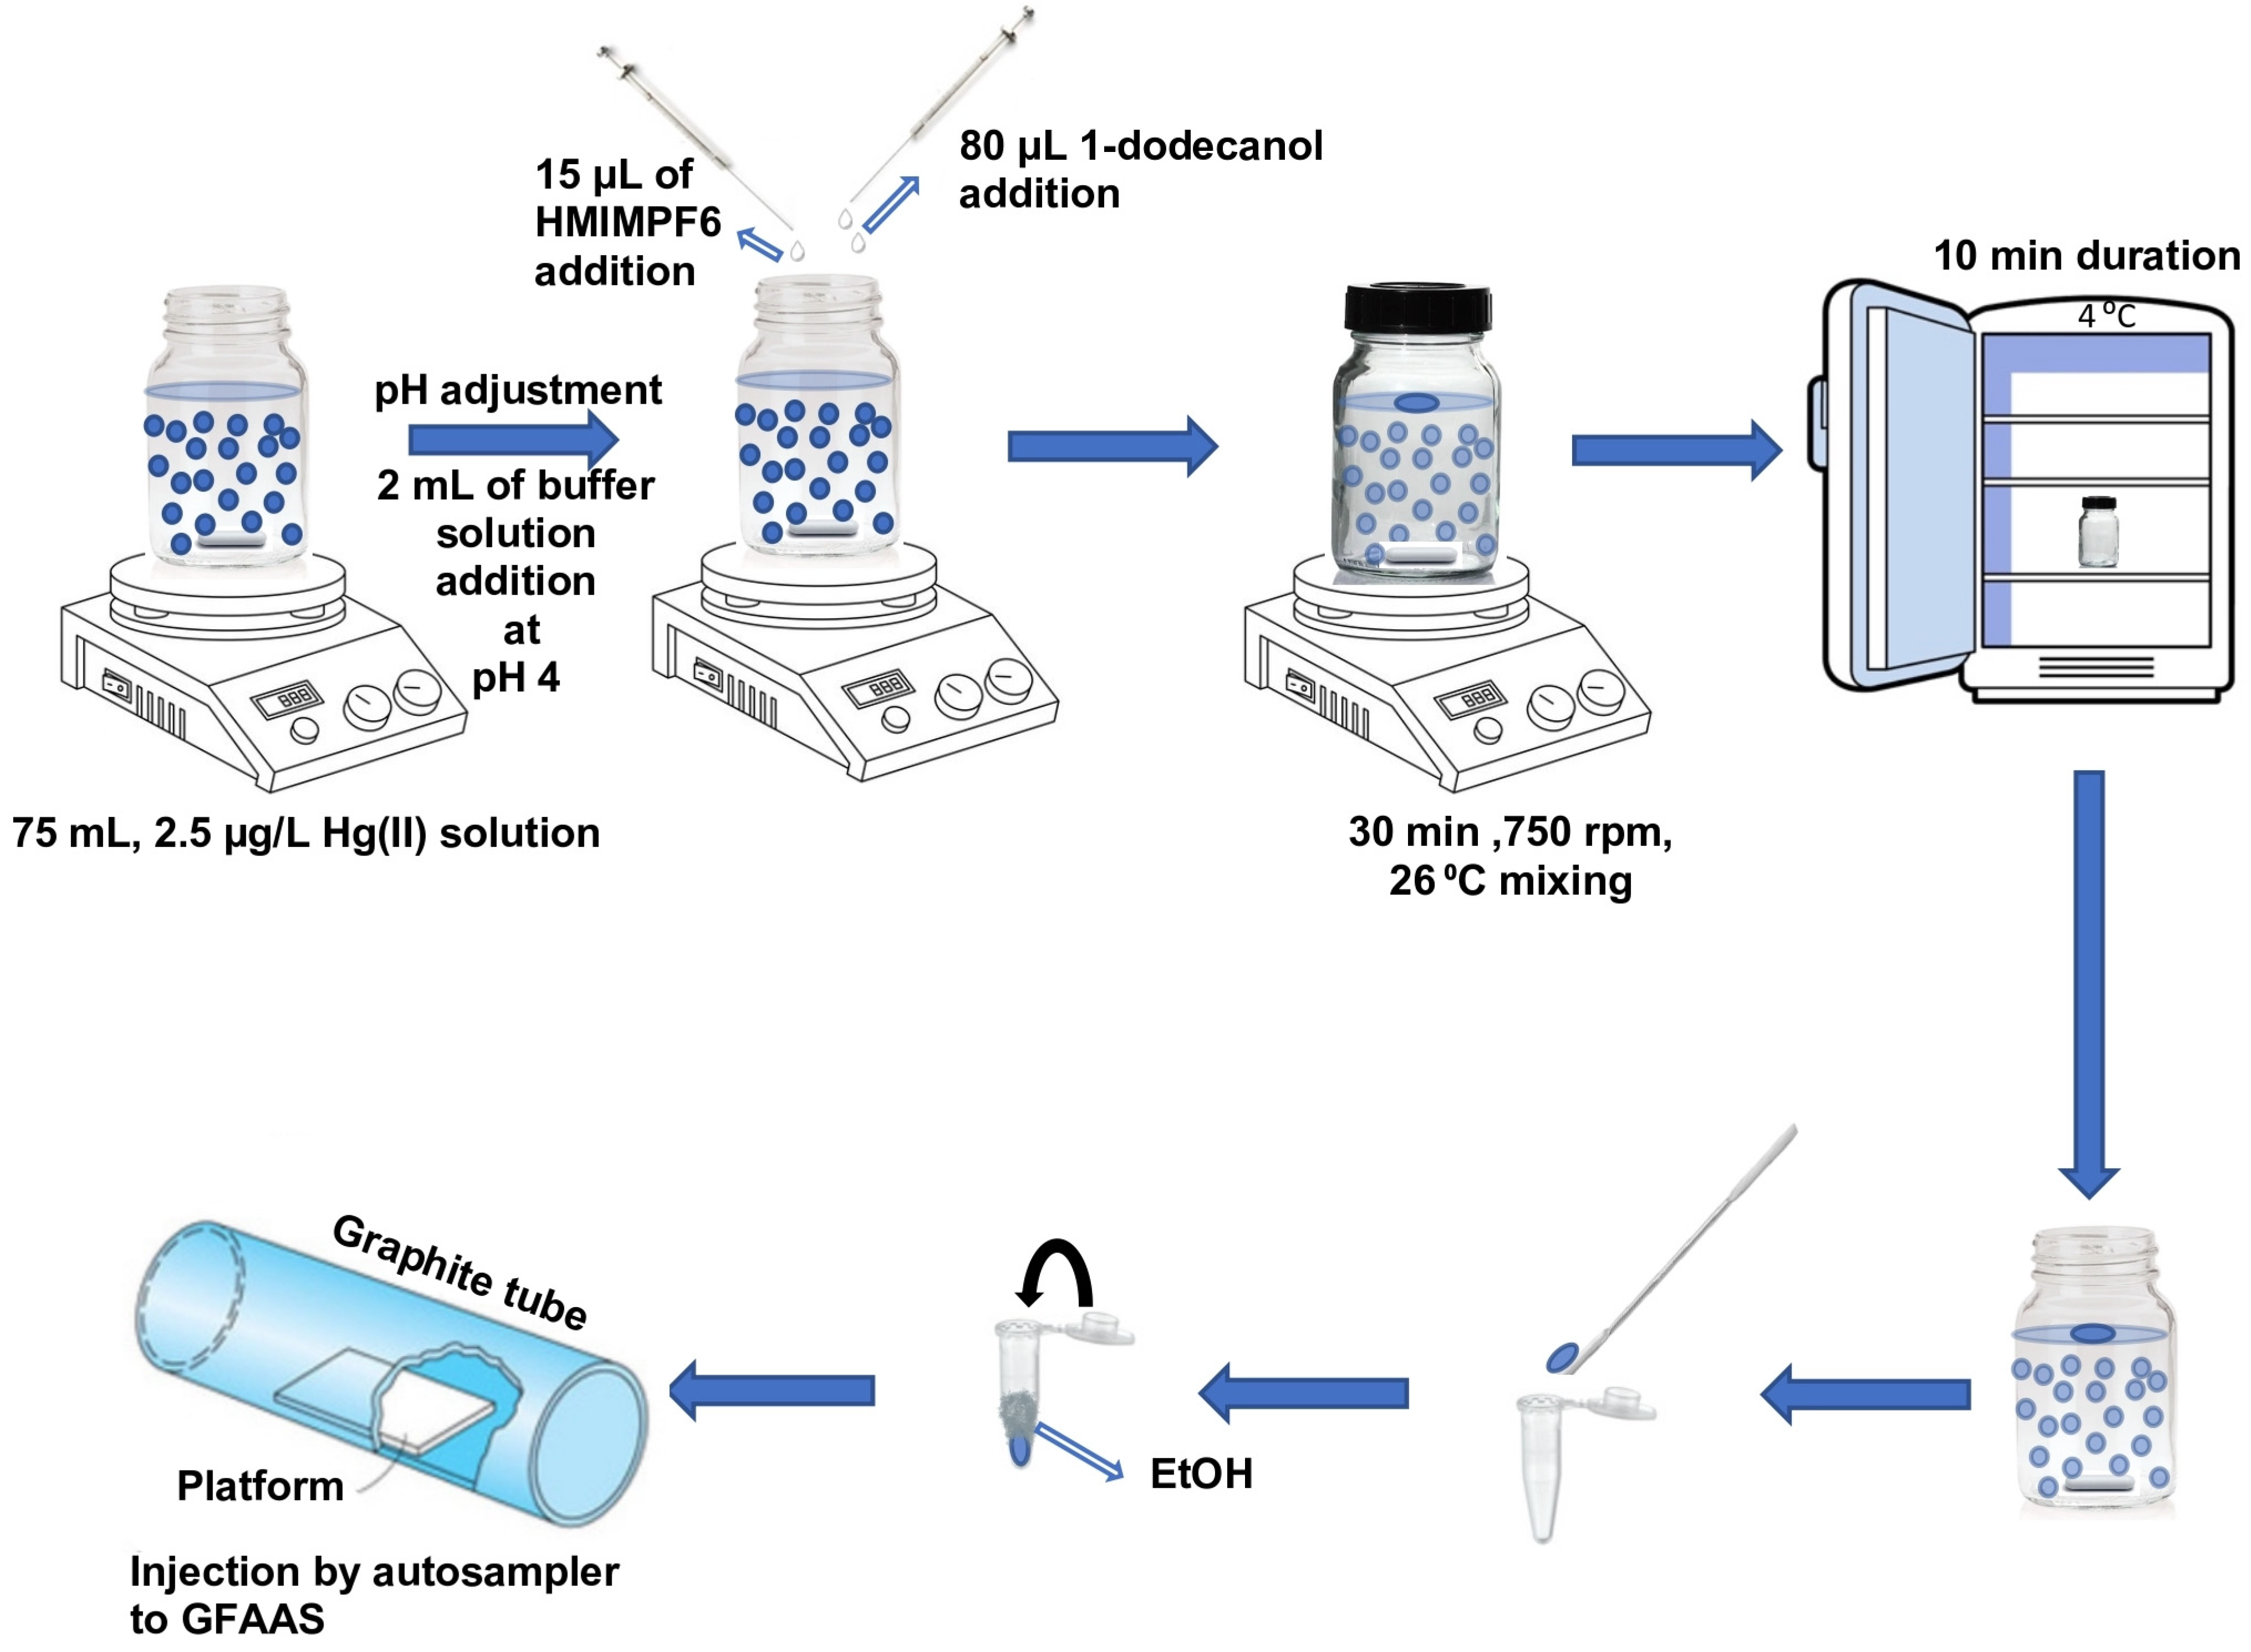
Aliquots of 75 mL were prepared for the IL-SFODME procedure, each containing either a sample or a standard solution of mercury. These aliquots were carefully placed in a 100 mL glass bottle that had a wide neck and a locked lid. A stirrer bar was also added to facilitate mixing. To adjust the pH of the solution, 2 mL of a buffer solution with a pH of 4 was added. Subsequently, 80 μL of the extraction solvent 1-dodecanol and 15 μL of HMIMPF6 were sequentially introduced into the sample solution using a micro-syringe. Once the bottle cap was tightly closed, the solution was stirred for a duration of 30 min at a speed of 750 rpm and a temperature of 26 °C, utilizing a magnetic stirrer. Under these specific stirring conditions, the organic solvent droplet, which had a lower density than water, formed and floated on the surface of the aqueous solution. Throughout the stirring process, Hg(II) ions were extracted into the 1-dodecanol with the assistance of the ionic liquid. After the extraction time had elapsed, the closed bottle was transferred to a refrigerator set at 4 °C, causing the organic solvent to solidify. Due to the close melting point of 1-dodecanol to room temperature (24 °C), the solidified droplet was obtained within a span of 10 min. Subsequently, the solidified droplet was promptly moved to the autosampler’s micro-vials using a mini spatula. It was then diluted to a volume of 300 µL with ethanol in a conical vial and immediately tightly closed by parafilm. All standard/real and modifier samples were placed in an AS 800 Autosampler (Waltham, MA, USA). During the calibration and determination steps, 10 µL Pd + 10 µL Mg(NO
3)
2 + 20 µL of calibration/sample solutions were sucked in sequence into the tubing through the tip from separate vials, then they were injected into the graphite furnace at once by the autosampler. The parafilm was removed just before the sampling by tip. The furnace program mentioned in
Table 1 was applied and the results were recorded (
Figure 1). Each analysis was repeated 3 times.
3. Results
3.1. Selection of Extraction Solvent
In the IL-SFODME method, the selection of an appropriate extraction solvent is crucial and must fulfill several criteria. The solvent must have a lower density than water, allowing it to remain at the top of the aqueous phase. Crucially, its freezing point should be near ambient temperature, roughly 25 °C, to ensure it solidifies post-extraction. To prevent loss of the organic phase, which is minimal, the solvent should exhibit low volatility and minimal to no solubility in water. Moreover, it should efficiently extract the target analyte. Aligning with the principles of green chemistry and environmental preservation, the solvent’s toxicity and quantity used should be minimal. Potential solvents include 1-bromohexadecane, 1,10-dichlorodecane, 1-dodecanol, 1-undecanol, 2-dodecanol, and n-hexadecane.
Table 2 presents the melting points and extraction efficiencies of these solvents. 1-dodecanol stands out with an extraction efficiency of approximately 98.8% (
Table 2). Given this high efficiency, along with its cost-effectiveness and availability, 1-dodecanol was chosen as the extraction solvent.
3.2. Optimization of pH
The pH is a critical factor that affects both the formation of metal complexes and their extraction processes. This study examined the influence of pH on the preconcentration of Hg(II) ions within a pH range of 2.0 to 9.0, as depicted in
Figure 2. To adjust the pH of the extraction medium, 1 mL of various buffer solutions was used: 0.2 mol/L KCl and 0.2 mol/L HCl for pH 2; 0.1 mol/L potassium hydrogen phthalate and 0.1 mol/L hydrochloric acid for pH 3 to 4; 0.1 mol/L potassium hydrogen phthalate and 0.1 mol/L sodium hydroxide for pH 5 to 6; and 0.1 mol/L tris(hydroxymethyl) aminomethane and 0.2 mol/L HCl for pH 7 to 8. Optimal extraction of the complex was achieved at pH 4.0, leading to the decision to buffer all subsequent samples to pH 4.0 for further analysis. At pH values lower or higher than the optimal pH of 4.0, it is likely that the ion–associate complex (Hg(II)–HMIMPF6) becomes charged, preventing its transfer to the organic phase. Based on the solubility product constant (Ksp) of mercury hydroxide, it is expected that at pH values above 5.8, mercury precipitates as its hydroxide compound.
Conditions: C0: 2.5 µg/L Hg(II); 1 mL buffer solution; ionic liquid amount: 10 µL HMIMPF6; extraction time: 20 min; extraction temperature: 26 °C; extraction speed: 750 rpm; added dodecanol amount: 80 µL; final volume: 150 µL.
3.3. Optimization of Buffer Solution Amount
The volume of buffer solution used in the extraction process is a significant factor affecting the efficiency of Hg(II) ion preconcentration. To determine the optimal buffer volume, various amounts were tested: 0.2 mL, 0.5 mL, 1 mL, 2 mL, 3.5 mL, and 5 mL. Each buffer volume amount was evaluated for its effectiveness in maintaining the desired pH and ensuring the complete extraction of Hg(II) ions. Through these experiments, it was found that using 2 mL of buffer solution provided the most effective results (
Figure 3). This volume ensured that the pH was consistently maintained at the optimal level of 4.0, facilitating complete extraction of the Hg(II)–HMIMPF6 complex. Lower volumes, such as 0.2 mL and 0.5 mL, were insufficient in stabilizing the pH, leading to incomplete extraction. Conversely, higher volumes, like 5 mL, did not significantly improve extraction efficiency and were less practical for the process. Therefore, 2 mL was selected as the optimal buffer volume for subsequent experiments, ensuring reliable and consistent extraction of Hg(II) ions.
Conditions: C0: 2.5 µg/L Hg(II); pH: 4.0; ionic liquid amount: 10 µL HMIMPF6; extraction time: 20 min; extraction temperature: 26 °C; extraction speed: 750 rpm; added dodecanol amount: 80 µL; final volume: 150 µL.
3.4. Optimization of Ionic Liquid Amount
The volume of ionic liquid utilized in the extraction process is a critical parameter influencing the efficiency of Hg(II) ion preconcentration. To determine the optimal volume, a range of ionic liquid amounts were evaluated: 5 µL, 10 µL, 15 µL, 20 µL, 40 µL, and 75 µL. The performance of each volume was assessed based on its ability to effectively extract the Hg(II)–HMIMPF6 complex. Experimental results indicated that 15 µL of ionic liquid was the optimal volume for achieving maximum extraction efficiency (
Figure 4). This volume was sufficient to form a stable Hg(II)–HMIMPF6 complex, facilitating complete extraction of Hg(II) ions. Volumes less than 15 µL, such as 5 µL and 10 µL, were inadequate for the full formation of the complex, resulting in incomplete extraction. Conversely, increasing the volume beyond 15 µL, including 20 µL, 40 µL, and 75 µL, did not yield any significant improvement in extraction efficiency. Thus, 15 µL was determined to be the optimal volume for the ionic liquid, providing the best balance between complex formation and practical efficiency in the extraction process.
Conditions: C0: 2.5 µg/L Hg(II); pH: 4.0, 2 mL; extraction time: 20 min; extraction temperature: 26 °C; extraction speed: 750 rpm; added dodecanol amount: 80 µL; final volume: 150 µL.
3.5. Optimization of Extraction Time
The transfer of the analyte from aqueous samples to the organic solvent drop is critical in determining the extraction efficiency within a given timeframe. Consequently, extraction time is a key parameter that can significantly affect overall extraction efficiency. To assess the influence of extraction time on efficiency, a series of experiments were performed under consistent conditions, varying the duration from 5 to 90 min. The results, illustrated in
Figure 5, showed that absorbance values increased with longer extraction times until stabilizing at 30 min (
Figure 5). Therefore, an extraction time of 30 min was selected as optimal for subsequent experiments.
Conditions: C0: 2.5 µg/L Hg(II); pH: 4.0, 2 mL; ionic liquid amount: 15 µL HMIMPF6; extraction temperature: 26 °C; extraction speed: 750 rpm; added dodecanol amount: 80 µL; final volume: 150 µL.
3.6. Optimization of Extraction Temperature
In order to determine the effect of temperature on the extraction of Hg(II) ions with the ionic liquid-supported SFODME technique, experiments were carried out at different temperatures (22 °C–68 °C). The highest absorbance, as seen in
Figure 6, was observed at 26 °C. When the temperature was further increased, a decrease in the analytical signal was observed due to the increase in the solubility of the organic phase. Therefore, experimental studies were carried out at 26 °C (room temperature in Ankara/Türkiye).
Conditions: C0: 2.5 µg/L Hg(II); pH: 4.0, 2 mL; ionic liquid amount: 15 µL HMIMPF6; extraction time: 30 min; extraction speed: 750 rpm; added dodecanol amount: 80 µL; final volume: 150 µL.
3.7. Optimization of Mixing Speed
The time required to reach equilibrium between the sample solution and the droplet is minimized by stirring the sample, as this process enhances the diffusion of analytes towards the organic phase. To examine this effect, experiments were conducted with stirring rates ranging from 0 to 900 rpm. It was observed that stirring rates above 750 rpm resulted in decreased absorbance, attributed to spattering and damage to the droplet. As illustrated in
Figure 7, the optimal stirring rate was identified as 750 rpm.
Conditions: C0: 2.5 µg/L Hg(II); pH: 4.0, 2 mL; ionic liquid amount: 15 µL HMIMPF6; extraction time: 30 min; extraction temperature: 26 °C; added dodecanol amount: 80 µL; final volume: 150 µL.
3.8. Optimization of Added Dodecanol Amount
In various extraction methodologies, the volume of the extracting solvent is a crucial factor influencing extraction efficiency. The rate of analyte transfer into the solvent micro-drop is directly proportional to the contact area between the aqueous and extracting phases and inversely related to the volume of the extracting phase. Thus, increasing the drop volume enhances both the contact area and extraction efficiency. However, further increases in drop volume can lead to a diminishing effect on extraction efficiency. To investigate the impact of extraction solvent volume, different volumes of 1-dodecanol, ranging from 25 to 175 µL, were utilized in the extraction process. The results demonstrated a positive correlation between analyte absorbance and increasing volumes of 1-dodecanol within the range of 25–75 µL, as shown in
Figure 8. Beyond this range, a slight decrease in absorbance was observed between 75 and 100 µL, and for volumes exceeding 100 µL, the absorbance levels stabilized. Consequently, a volume of 75 µL of 1-dodecanol was identified as the optimal choice for further experimentation.
Optimum Conditions: C0: 2.5 µg/L Hg(II); pH: 4.0, 2 mL; ionic liquid amount: 15 µL HMIMPF6; extraction time: 30 min; extraction temperature: 26 °C; added dodecanol amount: 80 µL; final volume: 150 µL.
3.9. Optimization of Final Volume
The modified final volume has a significant impact on the enhancement factor. High enhancement factors can be attained by reducing the organic phase’s dilution and the final volume; nevertheless, there is a threshold value for the minimum final volume due to some reasons. The reasons can be explained by the fact that there is an ideal final volume for the AAS system to satisfy at least three replicate analyses in order to the find standard deviation. Also, the viscosity of the final volume should be proper to avoid blocking in the tip during sucking and injecting processes in the auto-sampling step. Another reason is that when the tip of the autosampler is immersed in the vial, there should be enough volume height to sample an accurate amount of standard/real sample. An experiment was carried out to investigate the effect of the organic phase’s ultimate volume on the extraction efficiency. Solutions with different final volumes, ranging from 100 to 800 µL, were used in the suggested procedure (
Figure 9). Naturally, the enhancement factors automatically decrease as the preconcentrated solution’s final volume rises. The solution with the highest absorbance value was 200 µL, the one with the smallest final volume. The volume value of 100 µL has a high standard deviation value, probably due to its high viscosity. Its high viscosity causes a decrease in the absorbance value with high possibility.
Conditions: C0: 2.5 µg/L Hg(II); pH: 4.0, 2 mL; ionic liquid amount: 15 µL HMIMPF6; extraction time: 30 min; extraction temperature: 26 °C; extraction speed: 750 rpm; added dodecanol amount: 80 µL.
3.10. Effect of Other Ions
In order to test the selectivity of the method, the effect of other ions on the analyte ion to be analyzed in the solution environment was examined. After adding metal ions at different concentrations to 75 mL solutions containing 5 μg L
−1 mercury ions to be analyzed, the solidified organic drop micro-extraction method was applied and the effect of other ions was examined. The acceptable limit is defined as the added ion concentration that causes a relative error of less than ±5%. As can be seen in
Table 3, the most serious inhibition was observed in the lead ion, followed by copper and chromium ions. According to Marczenko, extraction of Hg(II) from a strong acid medium enables one to separate Hg from Cu, Bi, Zn, Ni, Pb, and other metals easily [
21]. When dealing with wastewater containing high amounts of these interfering ions, as can be seen in
Figure 2 in the pH scan graph, the effect of these ions can be avoided by sacrificing a little bit of the absorbance value (enhancement factor) by working at a pH lower than 4.
3.11. Analytical Performance of the Method
The analytical performance values of the proposed method were determined through various experiments and calculations. The enhancement factor was computed by dividing the slope of the line obtained after the enrichment process of Hg(II) ions by the slope of the calibration line from aqueous solutions without the enrichment process. In this study, the enhancement factor for Hg(II) ions was found to be 171 (0.069178/0.000404). The proposed method demonstrated a linear range of 0.5–10 µg/L for mercury ions. The limit of detection (LOD), defined as the concentration corresponding to three times the standard deviation (3 s) of ten measurements of the lowest concentration in the calibration plot, was determined to be 0.12 µg/L. The limit of quantification (LOQ), which indicates the minimum level of analyte that can be measured precisely and accurately, was defined as ten times the standard deviation (10 s) of ten measurements and was identified as 0.40 µg/L. The %relative standard deviation (%RSD) for 1 µg/L mercury was ±2.78% (n = 7). As shown in
Table 4, the proposed method exhibits excellent analytical performance values.
3.12. Accuracy of the Method
To verify the effectiveness of the proposed method, recovery experiments were conducted using certified reference material. ERM-CA713 (wastewater) was utilized as the validation medium, and the results are presented as the average of three replicates.
Table 5 demonstrates a favorable agreement between the obtained results and the established reference values. The recovery rates confirm the efficacy of the proposed method in accurately determining mercury concentrations.
3.13. Analysis of Real Samples
To demonstrate the applicability of the proposed method to real water samples, Hg ions were added at specified concentrations to 75 mL of river water, tap water, seawater, and wastewater. Their concentrations were then determined using the IL-SFODME method. The analysis results for Hg(II) in these water samples are shown in
Table 6.
4. Discussion
To use solidified floating organic drop micro-extraction (SFODME) combined with 1-Hexyl-3-methylimidazolium hexafluorophosphate ([HMIM][PF6]) as the ionic liquid without using a chelating agent and subsequent analysis with graphite furnace atomic absorption spectrometry (GFAAS) was applied for the determination of Hg in environmental water samples for the first time and proved to be highly effective. This method leverages the unique properties of [HMIM][PF6], including its low volatility, high thermal stability, and good extraction efficiency for Hg. SFODME helps to separate the mercury preconcentrated phase from the aqueous phase quite practically due to easy freezing of 1-dodecanol close to room temperature. The separation step was as easy as removing the solidified drop over the aqueous phase with an ordinary spatula.
The IL-SFODME-GFAAS technique provided remarkable analytical performance, characterized by high sensitivity, a satisfactory enhancement factor, and low detection limits. The data (as summarized in
Table 7) clearly indicate that the enhancement factor attained by the proposed method is either superior or comparable to that of other methods reported in the literature. The proposed method stands out due to its several advantages including operational practicality, and cost-effectiveness. Nowadays, scientists give effort to propose more environmentally friendly micro-extraction techniques. The features of this proposed method show compatibility with principles of green chemistry, especially with principle 5 (the use of auxiliary substances (e.g., solvents, separation agents, etc.) should be made unnecessary wherever possible and, innocuous when used), principle 6 (Design for Energy Efficiency), and principle 8 (Reduce Derivatives). The key advantages of this proposed methodology for mercury extraction and determination include very low sample consumption, minimal/no use of toxic organic solvents, meaningful extraction period, being very practical, easily affordable economically, and the fact that it obtained a satisfactory number as an enhancement factor. By the application of this method, mercury analysis in water samples becomes feasible using conventional GFAAS, even at trace levels. In this proposed study the combination of the ionic liquid and SFODME methods without using chelating agent is used for the first time for metal extraction. Furthermore, the simplicity and rapidity of IL-SFODME-GFAAS facilitate its practical application for routine monitoring of mercury in environmental water samples.
If it is desired to test the applicability of the results obtained in this study in different contexts of mercury analysis, some suggestions can be given as tips for applying this preconcentration method for mercury analysis in environmental water samples to other environmental samples. When applying this developed preconcentration method for mercury analysis in environmental water samples to other environmental samples like soil, plants, air, etc., sample preperation steps will be the most crucial and important steps. For soil samples, it is important to homogenize, dry, and reduce the soil samples to an appropriate particle size (e.g., sieving). Chemical dissolving can be performed using acid digestion (e.g., aqua regia or HNO
3-HCl mixture); however, microwave digestion will be the best option before applying this proposed preconcentration method. For the plant samples, they should be washed, dried, and ground. Suitable solvents (e.g., acids or organic solvents) can be used for chemical digestion, and then this proposed preconcentration procedure can be applied. For air samples, high-volume air samplers can be used. Mercury can be found in solid particulate or gas phases, so sampling devices (e.g., activated carbon filters or glass fiber filters) can be used for collection. Adsorbent materials (e.g., activated carbon or gold-coated adsorbents) can be used for mercury separation, and then this proposed preconcentration technique can be applied after washing mercury from these adsorbents. The pH will be arranged easily by the addition of buffer solution during the preconcentration procedure. Because of this, pH will not be the problem. When other ion effects are checked in
Table 3, Cr
3+ and Cu
2+ are the only ions that may possibly interfere with the results. However, the concentration level for Cr
3+ is not expected to be in this kind of environmental sample, and Cu
2+ can only interfere at the 5% level.


