Article

Remote Sensing Image Change Detection Based on Deep Learning: Multi-Level Feature Cross-Fusion with 3D-Convolutional Neural Networks

by
Sibo Yu
1,2,
Chen Tao
1,
Guang Zhang
1,
Yubo Xuan
3 and
Xiaodong Wang
1,*
1
Changchun Institute of Optics, Fine Mechanics and Physics, Chinese Academy of Sciences, Changchun 130033, China
2
University of Chinese Academy of Sciences, Beijing 100049, China
3
College of Communication Engineering, Jilin University, Changchun 130012, China
*
Author to whom correspondence should be addressed.
Appl. Sci. 2024, 14(14), 6269; https://doi.org/10.3390/app14146269
Submission received: 7 June 2024 / Revised: 12 July 2024 / Accepted: 12 July 2024 / Published: 18 July 2024
(This article belongs to the Special Issue Advances in Image Recognition and Processing Technologies)

Abstract

:
Change detection (CD) in high-resolution remote sensing imagery remains challenging due to the complex nature of objects and varying spectral characteristics across different times and locations. Convolutional neural networks (CNNs) have shown promising performance in CD tasks by extracting meaningful semantic features. However, traditional 2D-CNNs may struggle to accurately integrate deep features from multi-temporal images, limiting their ability to improve CD accuracy. This study proposes a Multi-level Feature Cross-Fusion (MFCF) network with 3D-CNNs for remote sensing image change detection. The network aims to effectively extract and fuse deep features from multi-temporal images to identify surface changes. To bridge the semantic gap between high-level and low-level features, a MFCF module is introduced. A channel attention mechanism (CAM) is also integrated to enhance model performance, interpretability, and generalization capabilities. The proposed methodology is validated on the LEVIR construction dataset (LEVIR-CD). The experimental results demonstrate superior performance compared to the current state-of-the-art in evaluation metrics including recall, F1 score, and IOU. The MFCF network, which combines 3D-CNNs and a CAM, effectively utilizes multi-temporal information and deep feature fusion, resulting in precise and reliable change detection in remote sensing imagery. This study significantly contributes to the advancement of change detection methods, facilitating more efficient management and decision making across various domains such as urban planning, natural resource management, and environmental monitoring.

1. Introduction

Change detection in remote sensing images is a critical area of current research in geographic information science and remote sensing applications. The Earth’s surface is constantly undergoing dynamic changes, including urban expansion, land use transformation, ecosystem succession, and natural disasters. Timely and accurate information on these changes is essential for understanding surface processes, monitoring environmental evolution, and making informed decisions. While traditional on-site surveys and manual interpretation can detect changes in local areas, they are limited in providing a comprehensive view of surface changes on a larger scale due to their restricted spatio-temporal scale and high workload. With the rapid advancement of remote sensing technology, high-resolution satellite images are becoming increasingly available. Remote sensing image change detection technology helps overcome these limitations, enabling systematic tracking and comprehensive assessment of surface system changes. This significantly improves real-time monitoring and efficiency in monitoring Earth’s environment. Hegazy et al. [1] utilized remote sensing change detection technology to evaluate urban expansion and land use changes in Egypt’s Daqahlia Province over the past three decades, providing crucial information for regional planning and sustainable development. Similarly, Paul et al. [2] utilized Sentinel-2 satellite data to develop a technique for generating glacier extent and surface zoning maps, allowing them to monitor spatiotemporal variations in glacier coverage. This method enhances the monitoring of glacier dynamics and provides essential data for glacier studies, hydrological modeling, and climate change assessments.
The objective of change detection is to identify pixels that exhibit ‘semantic change’ between multitemporal remote sensing images captured at different times within the same area, classifying each pixel in a region as either ‘change’ or ‘no change’ [3]. The challenge in change detection lies in ensuring that the final change map accurately captures only meaningful changes while filtering out non-semantic changes like those resulting from camera motion, sensor noise, or variations in lighting. Furthermore, defining change specifically as alterations in man-made structures such as buildings and vehicles, rather than seasonal variations, adds another layer of complexity to the task. Traditional change detection methods often rely on pixel-based or object-based approaches, which may overlook subtle changes or introduce inaccuracies due to noise or registration errors. To tackle these challenges, there is a growing interest in leveraging deep learning techniques, particularly convolutional neural networks (CNNs), for change detection tasks [4,5,6,7].
Recently, 3D convolutional neural networks (3D-CNNs) have emerged as a potent tool for processing spatiotemporal data [8]. By conducting three-dimensional convolution operations on spatiotemporal data, 3D-CNNs can capture features in both spatial and temporal dimensions. Unlike 2D-CNNs and 1D-CNNs, which handle spatial or temporal features separately, 3D-CNNs excel in modeling correlations within spatiotemporal data. While traditional 2D-CNNs can only process data from a single time frame, 3D-CNNs can analyze data from multiple time frames simultaneously to grasp dynamic features along the time dimension [9]. This capability is particularly advantageous for studying change processes in sequences of remote-sensing images. The 3D-CNNs can extract features in both spatial and temporal dimensions simultaneously, capturing interdependent features in spatiotemporal data modeling. By automatically learning complex spatial-temporal interactions, 3D-CNNs provide a more discriminative representation [10]. Particularly effective in remote sensing image time series data, 3D-CNNs are an advanced approach for tasks like remote sensing change detection [11].
Although these methods are successful in practice, a common problem is that continuous down-sampling leads to the loss of precise spatial position information, which often leads to uncertainty in the edge pixels of changing objects and a lack of determination of small objects. To this end, this study introduces a Multi-level Feature Cross-Fusion technique, combining low-order and high-order features [12,13,14]. Low-level features preserve detailed information for capturing small local changes, while high-level features offer semantic information for identifying higher-level change patterns. By integrating these features, the model can consider both local details and global semantics, improving the accuracy of detecting changed areas [15]. Furthermore, Multi-level Feature Cross-Fusion enhances the model’s generalization ability, preventing overfitting on specific change patterns and making it more robust and suitable for diverse remote sensing scenarios. Consequently, this study utilizes the 3D-CNN method to effectively analyze data across multiple time frames, capturing both spatial and temporal two-dimensional features simultaneously. By integrating Multi-level Feature Cross-Fusion, the model preserves local low-level features while incorporating advanced global semantic information. This method enhances the pixel information of the target edge, leading to a significant improvement in the accuracy of change detection, and offering more precise data for applications such as forest environment monitoring, land resource management, disaster monitoring and emergency response, urban planning, and traffic management. The main work of this paper is as follows:
(1)
This paper introduces a novel approach for remote sensing image change detection using 3D-CNNs and Multi-level Feature Cross-Fusion (MFCF). The method combines the temporal dynamics captured by 3D-CNNs with the merging of complementary information through Multi-level Feature Cross-Fusion to achieve accurate detection of changes in remote sensing images.
(2)
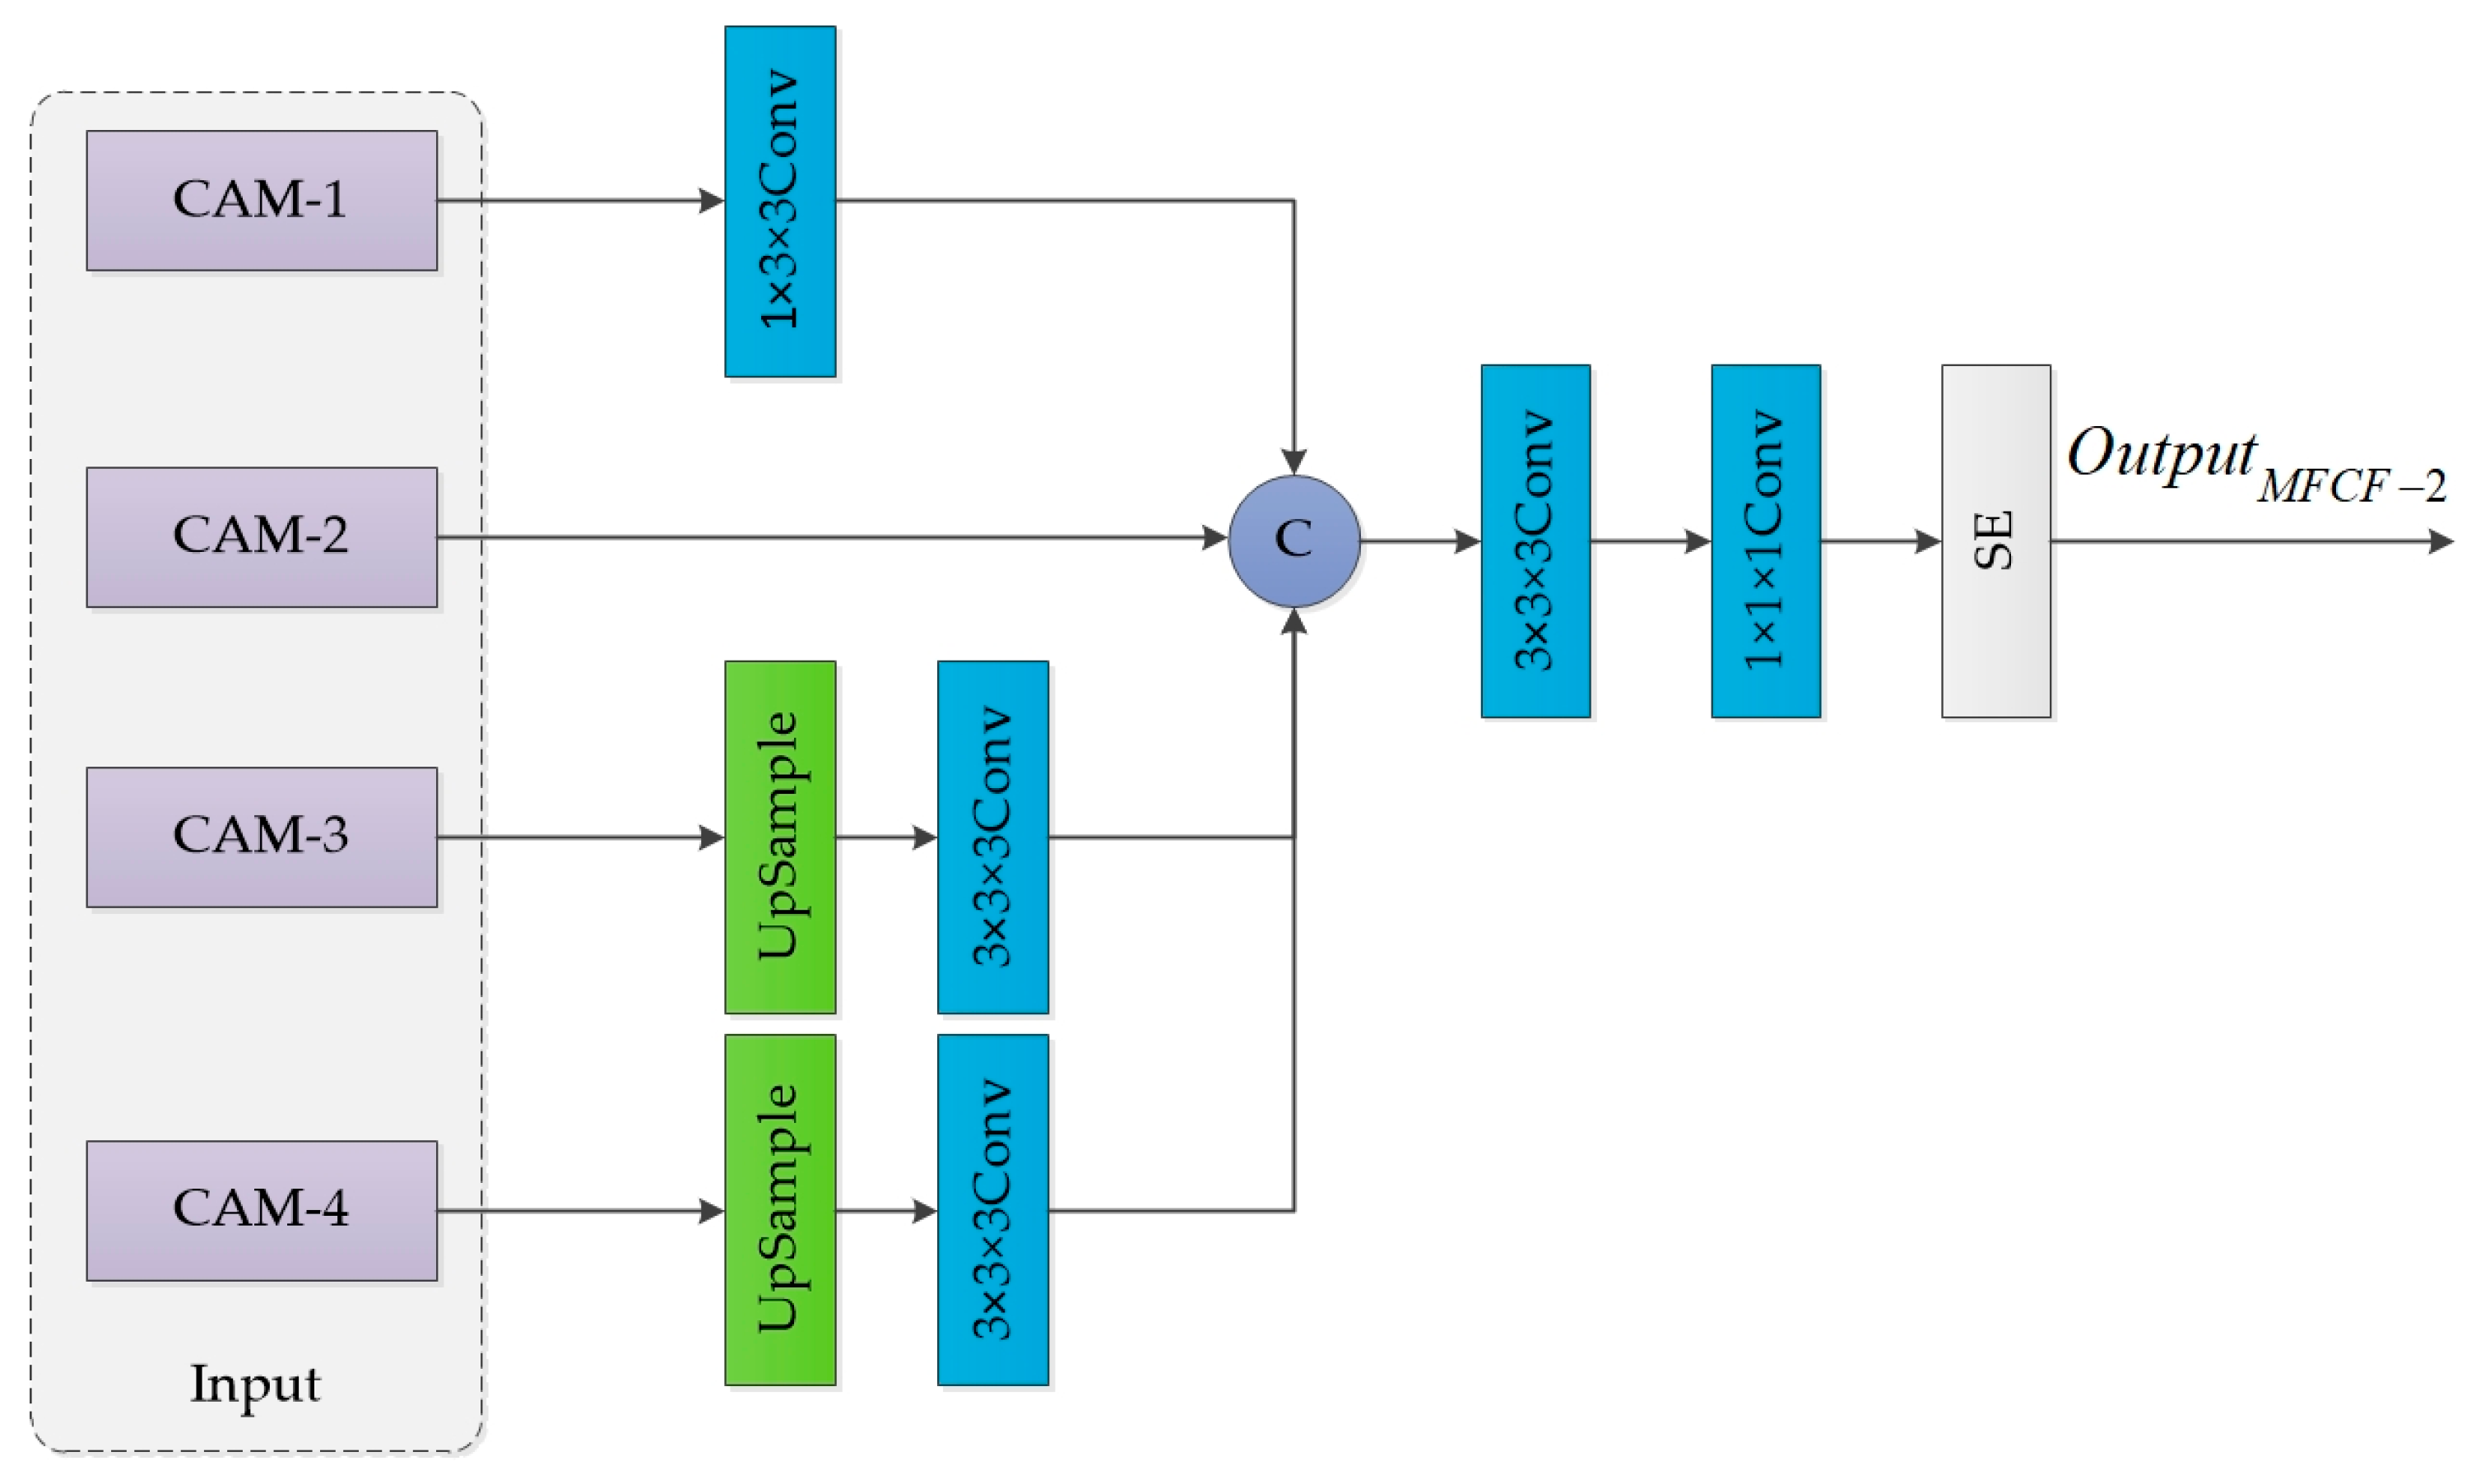
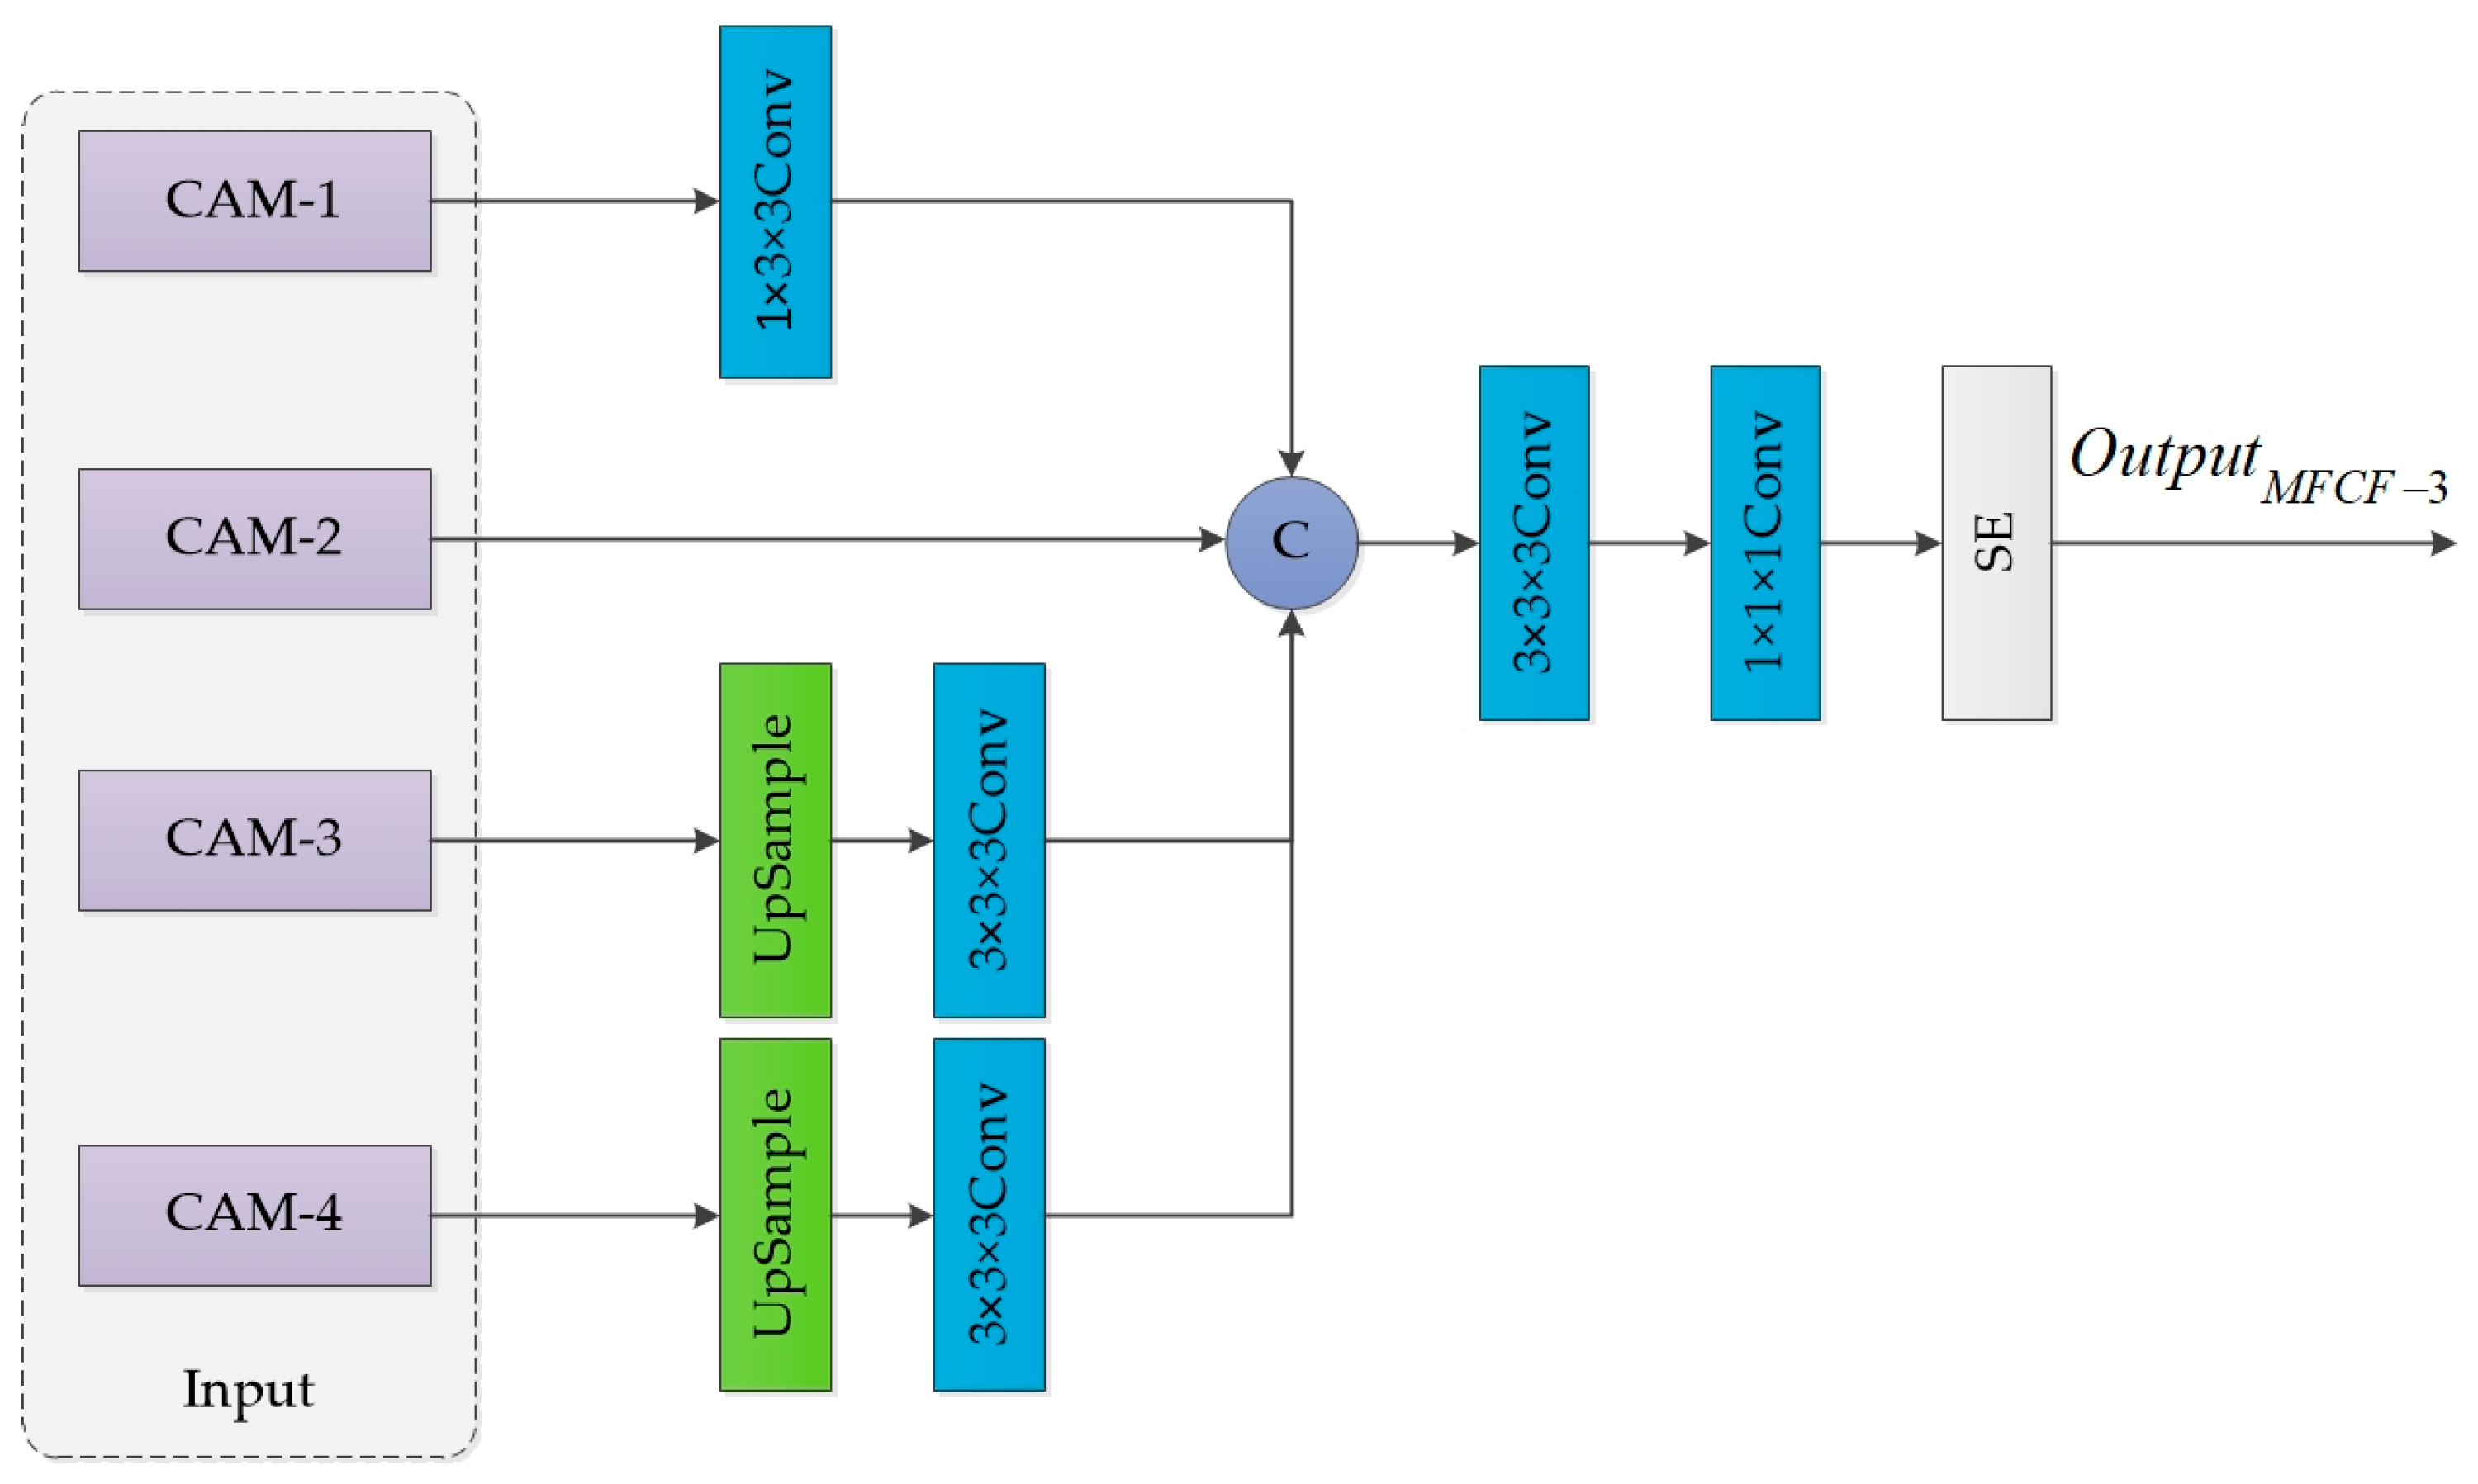
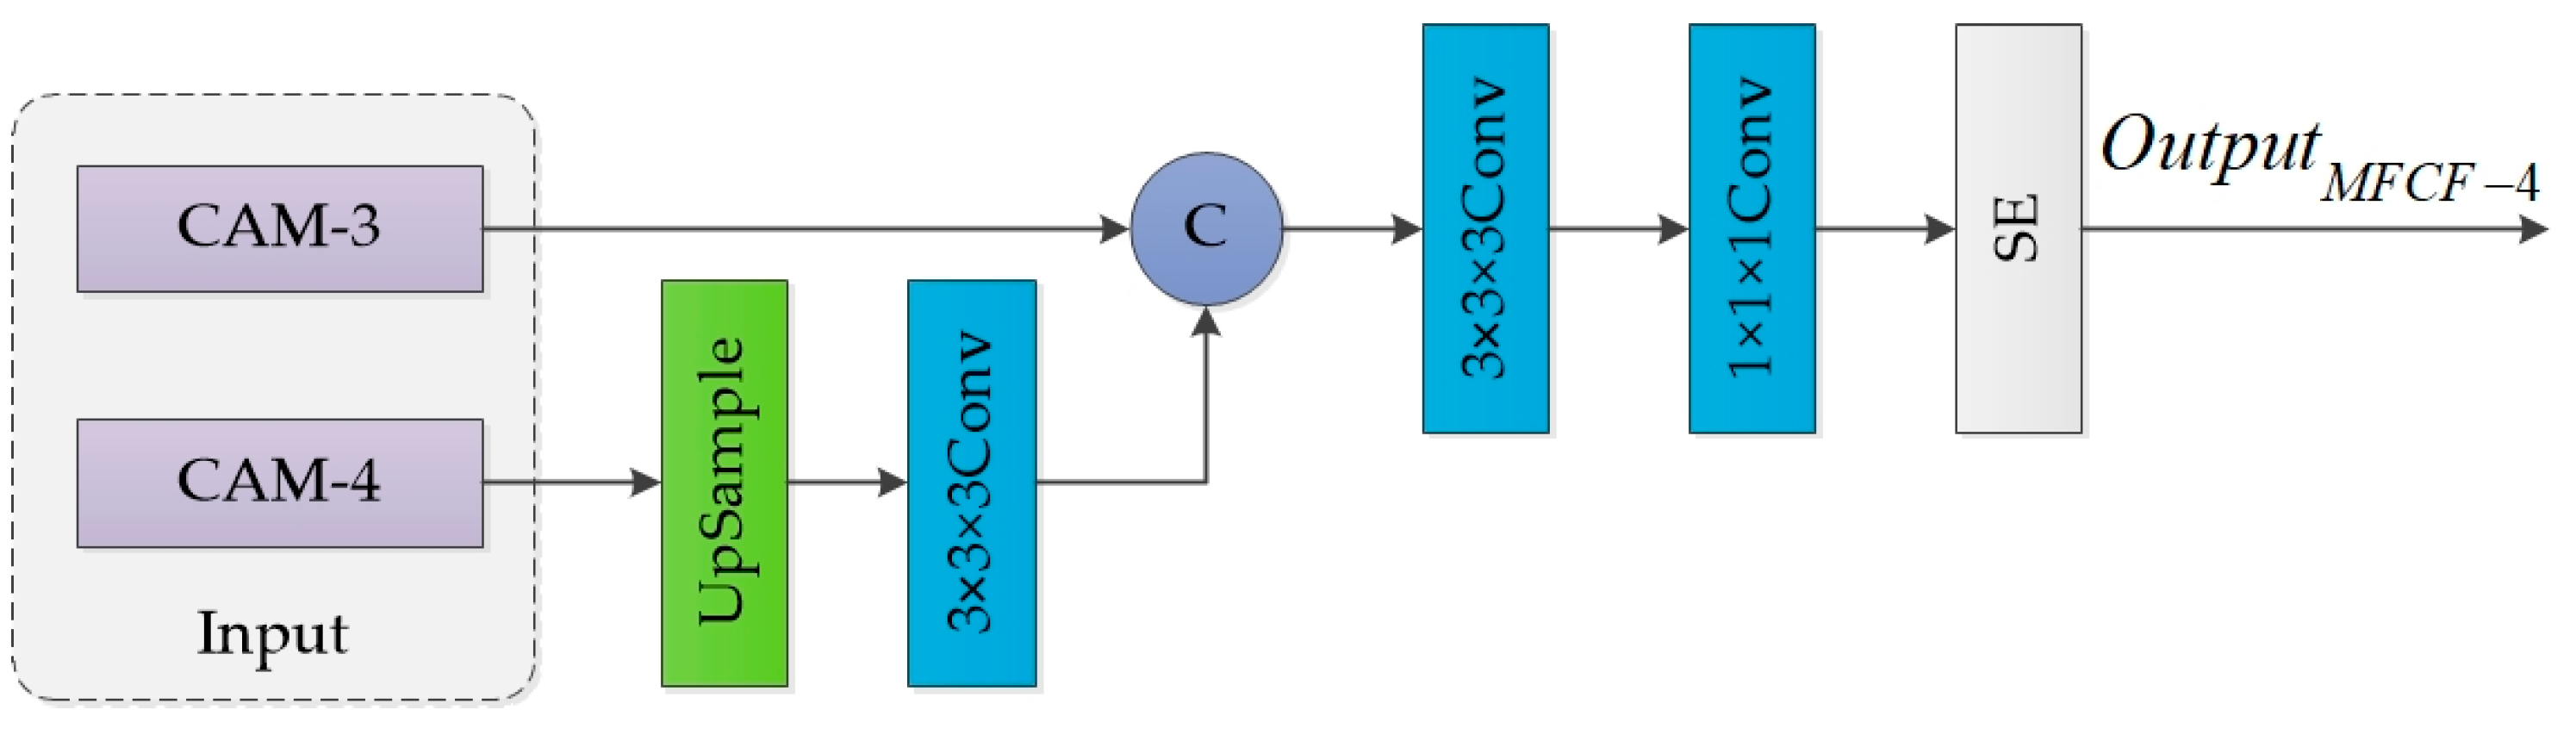
In convolutional neural networks, MFCF is proposed to merge high and low-level feature maps. This allows for the incorporation of both spatial and semantic information, resulting in a more comprehensive set of feature information.
(3)
Add a channel attention mechanism (CAM) module to the convolutional neural network. CAM is a technique that highlights the most important regions in images or time series data that contribute to the model’s decision-making process. Integrating a CAM can enhance the interpretability and reliability of the model.
(4)
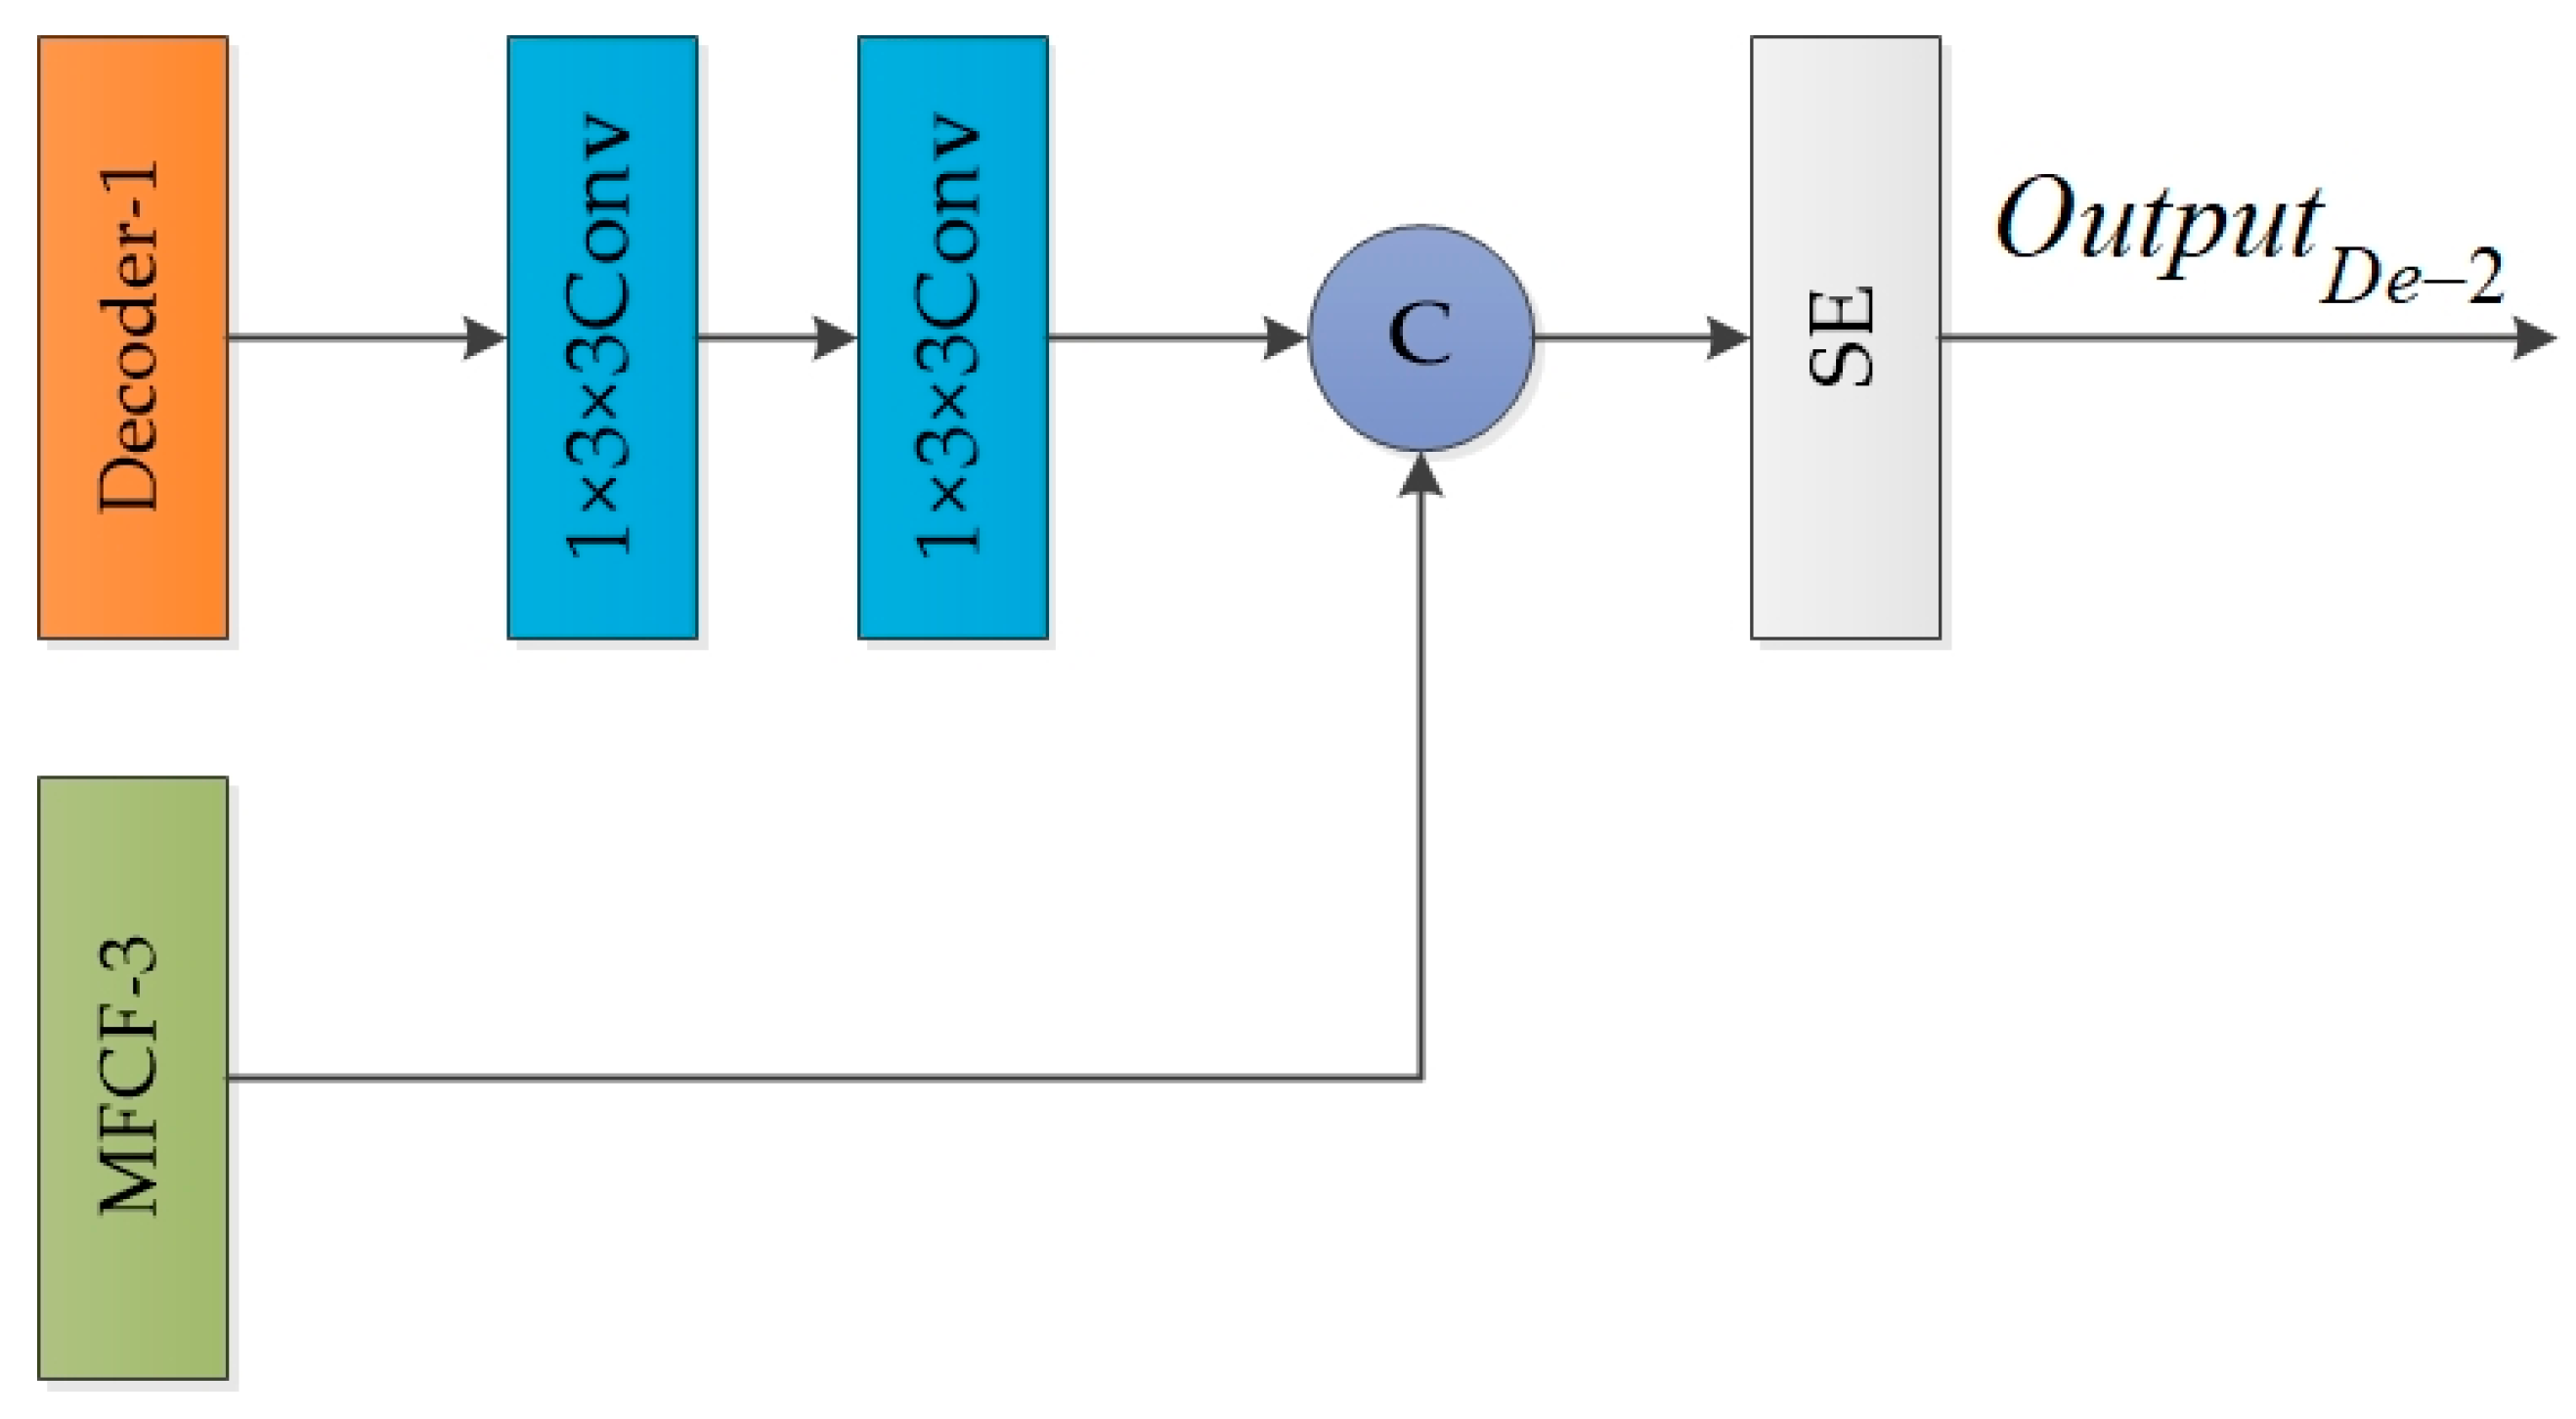
This paper presents a novel two-stage decoder that incorporates two bilinear up-sampling and convolution blocks to process the feature map and then applies a Squeeze-and-Excitation (SE) attention mechanism for fine-tuning the feature map.
(5)
Our proposed method was validated on the LEVIR construction dataset (LEVIR-CD). The experimental results demonstrate that our network exhibits superior performance, showcasing higher accuracy and robustness.
The remainder of this paper is organized as follows: Section 2 reviews existing research on remote sensing image change detection. Section 3 elaborates on the proposed methodology, covering the design of the 3D-CNNs and the multi-level feature fusion strategy. Section 4 showcases experimental results and performance evaluation using benchmark datasets. Lastly, Section 5 wraps up this paper with conclusions and explores potential future research avenues.

2. Literature Review

For numerous years, the field of remote sensing image change detection has been extensively researched, leading to the development of various methods to address this complex task [16]. Traditional approaches typically depend on manually crafted features and pixel-level difference techniques, which may struggle to detect intricate changes in extensive images [17]. Recently, deep learning methods have demonstrated encouraging outcomes in change detection tasks, leveraging the representation learning abilities of convolutional neural networks [18,19,20,21].
Early deep learning-based change detection methods initially concentrated on extracting spatial features from a single image patch using 2D-CNNs. Gong, M. et al. [22] introduced a remote sensing image change detection method that combines PCA and 2D-CNNs to enhance change detection performance. By compressing the feature space and extracting key features, this method effectively reduces dimensionality and enhances calculation efficiency. Utilizing principal component analysis, the method identifies key features in the changed area, thereby improving detection accuracy. However, the reliance on a manually designed feature extraction mechanism limits its ability to capture complex change patterns. Moreover, noise and registration errors can have a significant impact, potentially leading to the oversight of subtle changes in information.
Zhan, Y. et al. [23] introduced a novel 2D-CNN approach utilizing contrastive learning, demonstrating several advantages. This method eliminates the need for pre-marking changed areas and effectively leverages a substantial amount of unlabeled remote sensing data for training, ultimately improving the robustness of feature representation. However, this technique solely focuses on extracting spatial features from a single time frame, limiting its ability to fully exploit time series information. Consequently, it may struggle to accurately differentiate between genuine change areas and noise-induced interference, potentially impacting the overall change detection performance.
Traditional 2D-CNN methods have made progress in remote sensing change detection, but they struggle to effectively capture temporal dynamics and global context information [24]. To overcome these limitations and enhance accuracy and robustness, researchers have started exploring the use of more advanced 3D-CNN models. These models extend traditional CNNs by incorporating spatiotemporal volumes.
Ji, Shuiwang, et al. [25] introduced a novel three-dimensional CNN model for action recognition. This model effectively extracts features from spatial and temporal dimensions using three-dimensional convolution, allowing for the capture of motion information across multiple adjacent frames. By generating multiple channels of information from input frames and combining information from all channels in the final feature representation, the developed model demonstrates enhanced performance. Additionally, the authors suggest further improving performance by regularizing the output with advanced features and combining predictions from different models. This method represents a pioneering use of 3D-CNN technology.
In addition to exploring advanced network architectures, the researchers investigated various feature fusion strategies to enhance the accuracy of change detection. Multi-level feature fusion techniques aim to integrate features extracted at different levels of abstraction, enabling models to utilize both low-level details and high-level semantics. Zhang et al. [26] introduced Feature Cross-Fusion Block technology to amalgamate features from various levels in object detection tasks, thereby improving the model’s capability to detect and pinpoint targets. This approach merges low-level detailed features and high-level semantic features through a hierarchical feature representation, effectively combining local and global information to enhance the model’s target perception. This design effectively combines various levels of feature information by integrating detailed low-level features and high-level semantic features. By considering both local and global information, the model improves target identification and localization. The method demonstrates strong performance in object detection tasks, validating the efficacy of feature cross-fusion technology. This module can be seamlessly integrated into the current CNN detection network to enhance both detection accuracy and efficiency. Ye, et al. [11] combined the spatiotemporal modeling capabilities of 3D-CNNs with the multi-scale feature integration mechanism of feature cross-fusion to leverage the rich information in remote sensing time series images. They introduced the adjacent level feature cross-fusion module to effectively merge features at different abstract levels, enhancing the identification of changing areas. By incorporating cross-scale feature fusion, the model can capture detailed information about slightly changed areas and semantic features of significantly changed areas, thereby improving overall change detection accuracy. However, the complex network structure and high computational resource and training data requirements may hinder practical deployment and efficiency. While spatiotemporal information integration is achieved, further strategies for enhancing time modeling are needed to fully capture complex dynamic change characteristics in continuous time series. The method primarily focuses on change detection through image contrast and may not effectively handle noise interference, atmospheric condition changes, and other factors affecting remote sensing data quality, necessitating improvements in robustness.
To dynamically adjust the importance of different spatiotemporal regions in the input data, researchers have incorporated an attention mechanism module into the network. This module assists the model in concentrating on pertinent information while reducing the impact of irrelevant or noisy features, ultimately enhancing the robustness of the transformation detection model.
Xu R et al. [27] investigated the benefits of integrating attention mechanisms into high-resolution remote sensing image classification tasks. By incorporating an attention module into the neural network architecture, the model can enhance its ability to learn more effective feature representations. This attention module allows the network to dynamically focus on the most relevant areas and features within the input image, leading to improved classification performance. Extensive experiments were conducted on a large remote sensing image dataset, demonstrating that the attention-enhanced network outperforms traditional convolutional neural networks significantly. The integration of attention mechanisms in remote sensing image classification presents an innovative approach, highlighting the broad applicability of attention mechanisms in this domain.
Driven by deep learning technology, significant progress has been made in the field of remote sensing change detection. Specifically, recent advancements in 3D-CNNs and multi-level feature fusion methods have shown promising results in accurately identifying changes in remote sensing images. These advanced technologies can effectively leverage the abundant spatiotemporal information present in satellite images, offering a more efficient solution to the remote sensing change detection challenge and enhancing support for dynamic environmental monitoring and analysis. In comparison to traditional methods, these approaches have notably enhanced accuracy, robustness, and intelligence.

3. Methods

The following section provides a detailed explanation of the proposed MFCF network utilizing 3D-CNNs. It begins by outlining the overall network architecture and subsequently delves into the unique design of the Multi-level Feature Cross-Fusion module in Section 3.1. The CAM is discussed in Section 3.2, followed by the introduction of the decoder block in Section 3.3. The mixed loss function is then elucidated in Section 3.4.
To improve boundary detection accuracy and reduce false positives, this study presents a Multi-level Feature Cross-Fusion Network using 3D convolution. The network comprises four key components: a 3D Feature Encoder based on an enhanced 3D convolutional ResNet-18 [28], a CAM module for model interpretability and performance enhancement, a MFCF module for cross-fusion of multi-level features, and a 3D decoder for fine feature fusion. This approach results in the generation of an accurate change map.
Figure 1 shows the proposed network architecture of MFCF 3D-Net.
Our network takes two 256 × 256 dual-temporal images as input. These images are initially concatenated in the depth dimension using the TC (Temporal Concatenation) module. The TC module first combines two dual-phase images along the depth dimension to create a three-dimensional tensor, allowing the model to process each pixel position in both space and time. This representation enables the model to learn directly from sequential changes between two temporal instances of each spatial location. The main advantage of the TC module is its ability to enhance the model’s capacity to model timing dependencies by integrating temporal information directly into the network architecture. This integration helps capture pixel-level changes over time, crucial for tasks like change detection in remote sensing. This deep concatenation through the TC module allows the model to capture more intricate temporal features, enhancing its ability to model timing dependencies. By incorporating previous information through deep concatenation, the model can better recognize timing patterns. The tensor output from the TC module is subsequently input into the 3D Feature Encoder module for feature extraction. This module, which is built on 3D ResNet, is designed to extract image features. Specifically, it is employed to capture the feature information of the two-phase image post-time series. The study’s model conducts a 4-layer feature extraction process to obtain 4-scale features. Attention is applied to enhance the quality of feature extraction. The resulting 4-scale feature map undergoes MFCF, combining feature information from various layers to generate four cross-fused feature maps. The fused features integrate spatial and semantic information from high- and low-level feature maps. These fused features are then refined by the cross-fused decoder module to gradually reconstruct the feature map size and enhance the overall detection accuracy.

3.1. Multi-Level Feature Cross-Fusion Module

In convolutional neural networks, feature representations from different levels of feature maps exhibit varying characteristics. Lower levels tend to contain more spatial information but lack semantic information, while higher levels exhibit the opposite. By fusing high and low-level feature maps, a combination of rich spatial and semantic information can be achieved simultaneously. To address the disparities between high and low levels, this study introduces a cross-fusion module to extract comprehensive feature information. This module utilizes bilinear interpolation to up-sample high-level features and convolution to down-sample low-level features, ensuring a consistent resolution across different levels. Feature maps of the same resolution are then concatenated and fused in the channel dimensions to capture intricate feature relationships. Within this module, 3 × 3 × 3 and 1 × 1 × 1 convolutional blocks are employed to enhance the model’s expressiveness and effectively model features in convolutional neural networks. The MFCF module is illustrated in Figure 2, Figure 3, Figure 4 and Figure 5.
As illustrated in Figure 2, Operation C represents concatenation, and SE denotes the Squeeze-and-Excitation attention mechanism. The MFCF-1 module takes two inputs, one from CAM-1 and the other from CAM-2. Initially, the feature information from CAM-2 undergoes up-sampling and convolution with a 3 × 3 × 3 kernel, followed by concatenation with the features from CAM-1. Subsequently, the concatenated features pass through two convolutional layers before entering the SE module. The SE module can adaptively adjust the weight of each channel to enhance important features and suppress unimportant ones. Initially, compression is conducted followed by global average pooling on the input feature map to obtain a vector representing the global features of each channel. Subsequently, Excitation involves feeding this global feature vector into a network with two fully connected layers, producing weights equal to the number of channels in the input feature map. These weights are subjected to a nonlinear transformation through the ReLU activation function to ensure reasonable values. Ultimately, the generated weights are element-wise multiplied with the original feature map by channel to re-adjust the intensity of each feature channel.
As illustrated in Figure 3 and Figure 4, both MFCF-2 and MFCF-3 utilize the same network structure. This module takes in 4 parameters, coming from CAM-1, CAM-2, CAM-3, and CAM-4, respectively. Before feature concatenation, the features from CAM-1 undergo a 1 × 3 × 3 convolution, while the features from CAM-3 and CAM-4 undergo up-sampling and a 3 × 3 × 3 convolution. The combined features then pass through consecutive convolutional layers before entering the SE module and are eventually output.
As shown in Figure 5, the MFCF-4 module uses a similar network structure to MFCF-1. The difference is that the MFCF-4 module accepts input features from CAM-3 and CAM-4.

3.2. Channel Attention Mechanism

To assess and adjust the significance of various channel features, we integrated a CAM module into the feedback block architecture. [27] This module comprises four components: global average pooling, feature compression, attention weights generation, and feature rescaling.
The first step in the channel attention mechanism involves global average pooling. This process begins by passing the input feature map through an adaptive average pooling layer, which serves to globally average the spatial information of each channel. This pooling step condenses each channel into a single value that represents the average intensity of that channel across the entire feature map. The next phase, the feature compression layer, takes the average pooling result and flattens it before passing it through a series of fully connected layers. These layers consist of two fully connected linear transformations followed by a Relu activation function. The first linear transformation compresses each channel dimension to preserve essential information and reduce computational complexity. The subsequent Relu activation function introduces nonlinearity to capture complex feature dependencies. Finally, the second linear transformation maps the compressed features back to their original channel dimensions, providing attention to each channel. The next stage involves the generation of attention weights. After the fully connected layer processing, the feature dimension is restored to the original feature map, allowing for element-wise multiplication with the original features. The output of each channel is then scaled to the range [0, 1] using the Sigmoid activation function, resulting in attention weights for each channel. These attention weights are then multiplied by the corresponding channel features of the input. Finally, the attention weights are multiplied by the features of the corresponding channels of the input, which emphasizes the regions that contribute the most to the classification decision. This process enhances the model’s ability to generalize across various scenarios and periods, which is essential for consistent change detection across diverse regions and timeframes.

3.3. Decoder Block

The decoder block involves two stages. In the first stage, the feature map is obtained by up-sampling through a 2× bilinear up-sampling and convolution block operation. This feature map is then divided into multiple 1 × 3 × 3 convolution blocks of the same size, which are spliced according to the depth dimension. The processed feature maps are obtained by fusing the residual tensor through the convolution layer. Subsequently, the SE (Squeeze-and-Excitation) module is applied to the processed feature map to calibrate the feature map and reduce the depth dimension feature to 1, resulting in the final feature map. The SE module utilizes the squeeze-excitation mechanism to adaptively adjust each feature by weighting the channel features. This adaptive channel recalibration enhances the network’s response to important features and improves the quality of feature representation. Additionally, the SE module reduces the dimensionality of feature depth by compressing the channel dimension of the original feature map to 1 dimension. This compression is achieved through a global average pooling operation on each channel feature value, significantly reducing feature dimension while preserving key channel-level information. In summary, the SE module serves two key roles: enhancing the quality and expressive ability of feature maps through adaptive channel recalibration and compressing the feature depth to 1 dimension. The final 1-dimensional feature map produced by the SE module is used as input for the next step.
Figure 6 depicts the network structure of the De-1 module, which is designed to accept 4 input features. The input feature out1 undergoes three 1 × 3 × 3 convolutions, while out2 undergoes two 1 × 3 × 3 convolutions. Out3 undergoes a single 1 × 3 × 3 convolution and is then concatenated with out4 in the channel dimension. The combined features are then processed through the se module to produce the output of the De-1 module.
As shown in Figure 7, the output of decoder block De-1 is combined with the MFCF-3 module processed feature graph through two 1 × 3 × 3 convolutions and then enters the SE attention module to obtain the final feature map.
As shown in Figure 8, The output of decoder block De-2 is combined with the processed feature graph from the MFCF-2 module through two 1 × 3 × 3 convolutions. Subsequently, it enters the SE attention module to generate the final feature map, as illustrated in Figure 8. In Figure 9, the output of decoder block De-3 is combined with the MFCF-1 module processed feature graph through two 1 × 3 × 3 convolutions and then enters the SE attention module to obtain the final feature map.

3.4. Mixed Loss Function

This section introduces the loss function utilized during the training of the network. The article discusses the use of a hybrid loss function combining Binary Cross-Entropy (BCE) and Sørensen–Dice (DICE) to compute the total loss. These loss functions are commonly employed in deep learning for tasks such as image segmentation, particularly in binary segmentation tasks.
In the task of remote sensing image change detection, the BCE loss function is a commonly used and effective choice [29]. Change detection in remote sensing is often approached as a binary classification problem, where the goal is to determine if each pixel has changed. The BCE loss function is well suited for modeling and optimizing this type of binary classification task. Remote sensing images typically have a small proportion of changed areas, leading to a significant imbalance between positive and negative samples. The BCE loss function is robust in handling this imbalance and effectively addresses sample imbalance issues. By utilizing the BCE loss function in conjunction with the Sigmoid activation function, the probability of change for each pixel can be directly predicted. This probability output serves as a crucial foundation for subsequent tasks such as change area extraction and selection of change detection thresholds. Moreover, the BCE loss function demonstrates good numerical stability and mitigates the risk of gradient vanishing or exploding, thus promoting model convergence.
L B C E = ( y · log ( y ^ ) + ( 1 y ) · log ( 1 y ^ ) )
where y is the true label of the sample, y ^ is the probability predicted by the model. In the context of binary classification, the BCE loss function penalizes the model based on the difference between the predicted probability y ^ and the true label y . When the true label is 1, the loss is log ( y ^ ) , pushing the model to predict probabilities close to 1. Conversely, when the true label is 0, the loss is log ( 1 y ^ ) , encouraging the model to predict probabilities close to 0. The goal of minimizing the BCE loss is to reduce the discrepancy between the predicted probability and the actual label, with small values indicating correct predictions and large values indicating errors. Therefore, the BCE loss function is commonly utilized in remote sensing image change detection for its simplicity, efficiency, robustness to sample imbalance, and compatibility with change probability output. This function plays a crucial role in the development of a reliable and effective change detection model.
The Sørensen–Dice (DICE) [30] coefficient is frequently utilized to assess the similarity between predicted segmentation results and actual labels. It can also serve as a loss function for training segmentation models. The DICE loss function is defined as follows:
L D i c e = 2 ( | y y ^ | ) | y | + | y ^ |
In the formula above, y represents the actual change label, y ^ represents the predicted change probability map by the model, and y y ^ represents the intersection area between the actual change area and the predicted change area. A higher value indicates a greater overlap between the two. The Dice loss function ranges between 0 and 1, where 0 signifies no overlap and 1 signifies complete overlap. The Dice loss function formula effectively assesses the similarity between predicted results and actual labels, making it a popular choice for segmentation tasks like remote sensing change detection. By minimizing this loss function, the model’s predictions can closely align with the actual change areas.
The advantages of the two loss functions can be combined to make the model consider both pixel-level classification accuracy and region-level overlap in the training process. This helps to improve the performance of the model in complex image segmentation tasks, especially when the boundary between the target region and the background region is blurred or the size of the target region is different. When using the mixed loss function, the BCE loss and Dice loss are calculated separately, and then the two are added together to get the final loss value. Mixing BCE loss and Dice loss is an effective strategy for improving the performance of deep learning models in image segmentation tasks. This strategy can synthesize pixel-level and region-level information so that the model can better adapt to complex scenes and changing target shapes, to achieve more accurate segmentation results.
The BCE loss prioritizes pixel-level binary classification accuracy for effectively detecting changed and unchanged regions, while the DICE loss focuses on accurate segmentation of changed areas to enhance detection performance in those regions. By combining these two loss functions, this study addresses both classification and segmentation optimization objectives, ultimately leading to improved model performance. This approach is illustrated in Formula (3), where the model considers both pixel-level classification accuracy and region-level overlap during training. This methodology helps enhance the model’s efficacy in complex image segmentation tasks, especially in scenarios where distinguishing between the target area and background area is challenging or where the size of the target area varies.
L t o t a l = λ 1 L B C E + λ 2 L D i c e
Changed areas in remote sensing images typically consist of small areas with low proportions, resulting in a significant sample imbalance issue. While the BCE loss demonstrates some robustness to this imbalance, the DICE loss can better highlight small changing areas. By combining these two loss functions, the model’s ability to address sample imbalance is further enhanced. Therefore, in this study, to leverage the strengths of both loss functions, the values of λ 1 and λ 2 are set to 1. In summary, the hybrid loss function, combining BCE loss and DICE loss, enhances the performance of remote sensing image change detection. This fusion of loss functions proves to be a successful method in enhancing deep learning model performance for image segmentation tasks. By integrating pixel-level and regional-level information, the model can effectively adapt to intricate scenes and changes in target shapes, resulting in more precise segmentation outcomes. This approach plays a vital role in the development of an efficient and dependable remote sensing change detection system.

4. Results

The dual-phase images in LEVIR-CD [31] were sourced from 20 distinct areas across various cities in Texas, USA. This dataset comprises 637 pairs of very high-resolution (VHR, 0.5 m/pixel) Google Earth (GE) image patches, each measuring 1024 × 1024 pixels. These bitemporal images with a period of 5 to 14 years have significant land-use changes, especially the construction growth. LEVIR-CD covers various types of buildings, such as villa residences, tall apartments, small garages, and large warehouses. These bitemporal images are annotated by remote sensing image interpretation experts using binary labels (1 for change and 0 for unchanged). Some examples of these images are shown in Figure 10.
To optimize GPU memory usage and avoid overfitting, we divided the image into multiple patches each sized 256 × 256. Specifically, 80% of the patches are allocated for training, 10% for validation, and the remaining 10% for testing.

4.1. Evaluation Index and Parameter Setting

4.1.1. Evaluation Index

In this study, we have chosen precision ( P r ), F 1 , and I O U as evaluation metrics to assess the model’s performance objectively. Higher values of these metrics indicate better image quality. The calculation formulas for these indicators are presented in Equations (4)–(7):
P r = T P T P + F P
The precision calculation process is described in Formula (4), with T P (True Positive) representing correctly predicted positive examples, F P (False Positive) representing incorrectly predicted positive examples, and P r representing the proportion of true positive examples in the sample. Precision reflects the accuracy of the model’s positive predictions, indicating how well it can differentiate between positive and negative examples. However, precision does not account for missed positive examples, which are captured by the recall rate formula. The recall rate formula is as follows:
R e = T P T P + F N
where F N (False Negative) represents the number of samples that the model incorrectly predicts as negative examples, the recall rate indicates the model’s ability to identify positive examples accurately, showing how many true positive examples the model can detect. A higher recall rate signifies that the model correctly identifies a greater number of positive examples.
F 1 = 2 × P r × R e P r + R e
The F 1 score in Formula (6) is calculated as the harmonic mean of precision and recall, providing a balanced measure between the two. It ranges from 0 to 1, with 1 representing optimal performance. By combining precision and recall, the F 1 score offers a more comprehensive evaluation of the model’s performance compared to using either metric in isolation.
I O U = T P + T N T P + F P + T N + F N
I O U (Intersection over Union) is a metric utilized for assessing localization accuracy in object detection and image segmentation tasks. In Equation (7), TN denotes the prediction of the negative class as true negative. It quantifies the ratio of the intersection area to the union area of the predicted box and the true box. The I O U value ranges from 0 to 1, where 1 indicates a perfect match between the predicted and true boxes. A prediction box with an I O U exceeding 0.5 is commonly deemed a valid detection outcome, indicating a substantial spatial overlap between the prediction and ground truth.

4.1.2. Parameter Setting

The experiment utilized a 6GHz i9-14900k CPU with 32 GB of memory and two NVIDIA GeForce RTX 3090 GPUs with a combined memory of 48 GB to implement the proposed method. We use version 1.9.1 of the PyTorch framework. To optimize GPU memory usage and ensure fair comparisons with different methods, we partitioned the image into multiple patches, each measuring 256 × 256. To ensure consistency in the experiment, we set the manual seed to 1. Additionally, the parameters λ 1 and λ 2 in the loss function were also set to 1. The network is trained using the Adam optimizer with a base learning rate of 1 × 10⁻⁴, which is decayed by 0.5 every 200 epochs. The model was trained with a batch size of 16 for 1000 iterations, resulting in a total training time of 20 h.

4.2. Contrast Experiment

4.2.1. Quantitative Comparison

To better verify the generalization performance of the model, the improved model was simultaneously applied to the LEVIR-CD dataset and compared with other classical remote sensing image change detection methods.
FC-Siam-conc (Fully Convolutional Siamese Network with Concatenation) [32] leverages the Siamese network structure, comprising two parameter-sharing sub-networks. Each sub-network is a standard convolutional neural network designed to extract features from two periods of remote sensing images. The feature maps of the two images are concatenated to create a fused feature representation, enabling comprehensive utilization of information from both images and facilitating the learning of change patterns. In contrast to traditional fully connected networks, FC-Siam-Conc employs a fully convolutional network architecture, enabling the model to process input images of varying sizes. Subsequently, the fused feature map generates a change detection probability map through additional convolution layers and activation functions, with each pixel value indicating the probability of change at that specific location. The FC-Siam-conc model is trained using supervised learning, typically employing binary cross-entropy or Dice loss as the loss function. Compared to conventional pixel difference-based methods, this model excels in capturing intricate change patterns and holds significant potential for diverse remote sensing applications.
Fang S et al. proposed SNUNet-CD [33], a densely connected Siamese network for change detection that integrates the Siamese network and NestedUNet. SNUNet-CD addresses the issue of localization information loss in deep neural network layers by ensuring compact information transmission between encoder and decoder, as well as between decoder and decoder. Moreover, an Ensemble Channel Attention Module (ECAM) is introduced for deep supervision. With ECAM, the most representative features from various semantic levels are refined and utilized for the final classification. The characteristics of SNUNet-CD enable it to excel in high-resolution image change detection tasks, exhibiting both high accuracy and robustness.
Chen H et al. introduced the bi-temporal image transformer (BIT) [34] as a method to efficiently model spatial-temporal contexts. The key changes of interest are represented by semantic tokens, which condense the information into a compact form. By transforming the bitemporal image into tokens and utilizing a transformer encoder, contexts are effectively modeled in the space-time domain.
We implement the above networks using their public codes with default hyperparameters. Table 1 shows the results of the comparison of the four methods on the LEVIR dataset. To make the table more readable, the best data is marked in bold.
The experimental results in Table 1 demonstrate that the proposed method surpasses all evaluation indices. Specifically, regarding the recall indicator, the method presented in this article exhibits an improvement of approximately 8.35% compared to FC-Siam-conc, 1.36% compared to SNUNet-CD, and 1.4% compared to BIT. This enhancement signifies that our method can effectively identify true positive samples (i.e., regions of change), thereby reducing the occurrence of missed detections.
Our method demonstrated the highest performance on the F 1 score metric. It showed a 13.31% improvement compared to FC-conc, a 2.97% increase compared to SNUNet-CD, and a 1.28% enhancement compared to BIT. The F 1 score, which combines accuracy and recall, highlights the balanced performance of our method.
In terms of the I O indicator, our method demonstrates its superiority. It showed an increase of approximately 18.67% compared to FC-conc, and about 7.31% compared to SNUNet-CD. Additionally, there was an improvement of around 2.80% compared to BIT. I O measures the overlap between the predicted region and the actual region, and our method can more effectively adapt to changing regions and reduce false detections. In the case of comparison of three different indicators, the index values of our method have increased to different degrees, indicating that the proposed method has better image segmentation and change detection capabilities on the LEVIR-CD dataset than the other three methods.

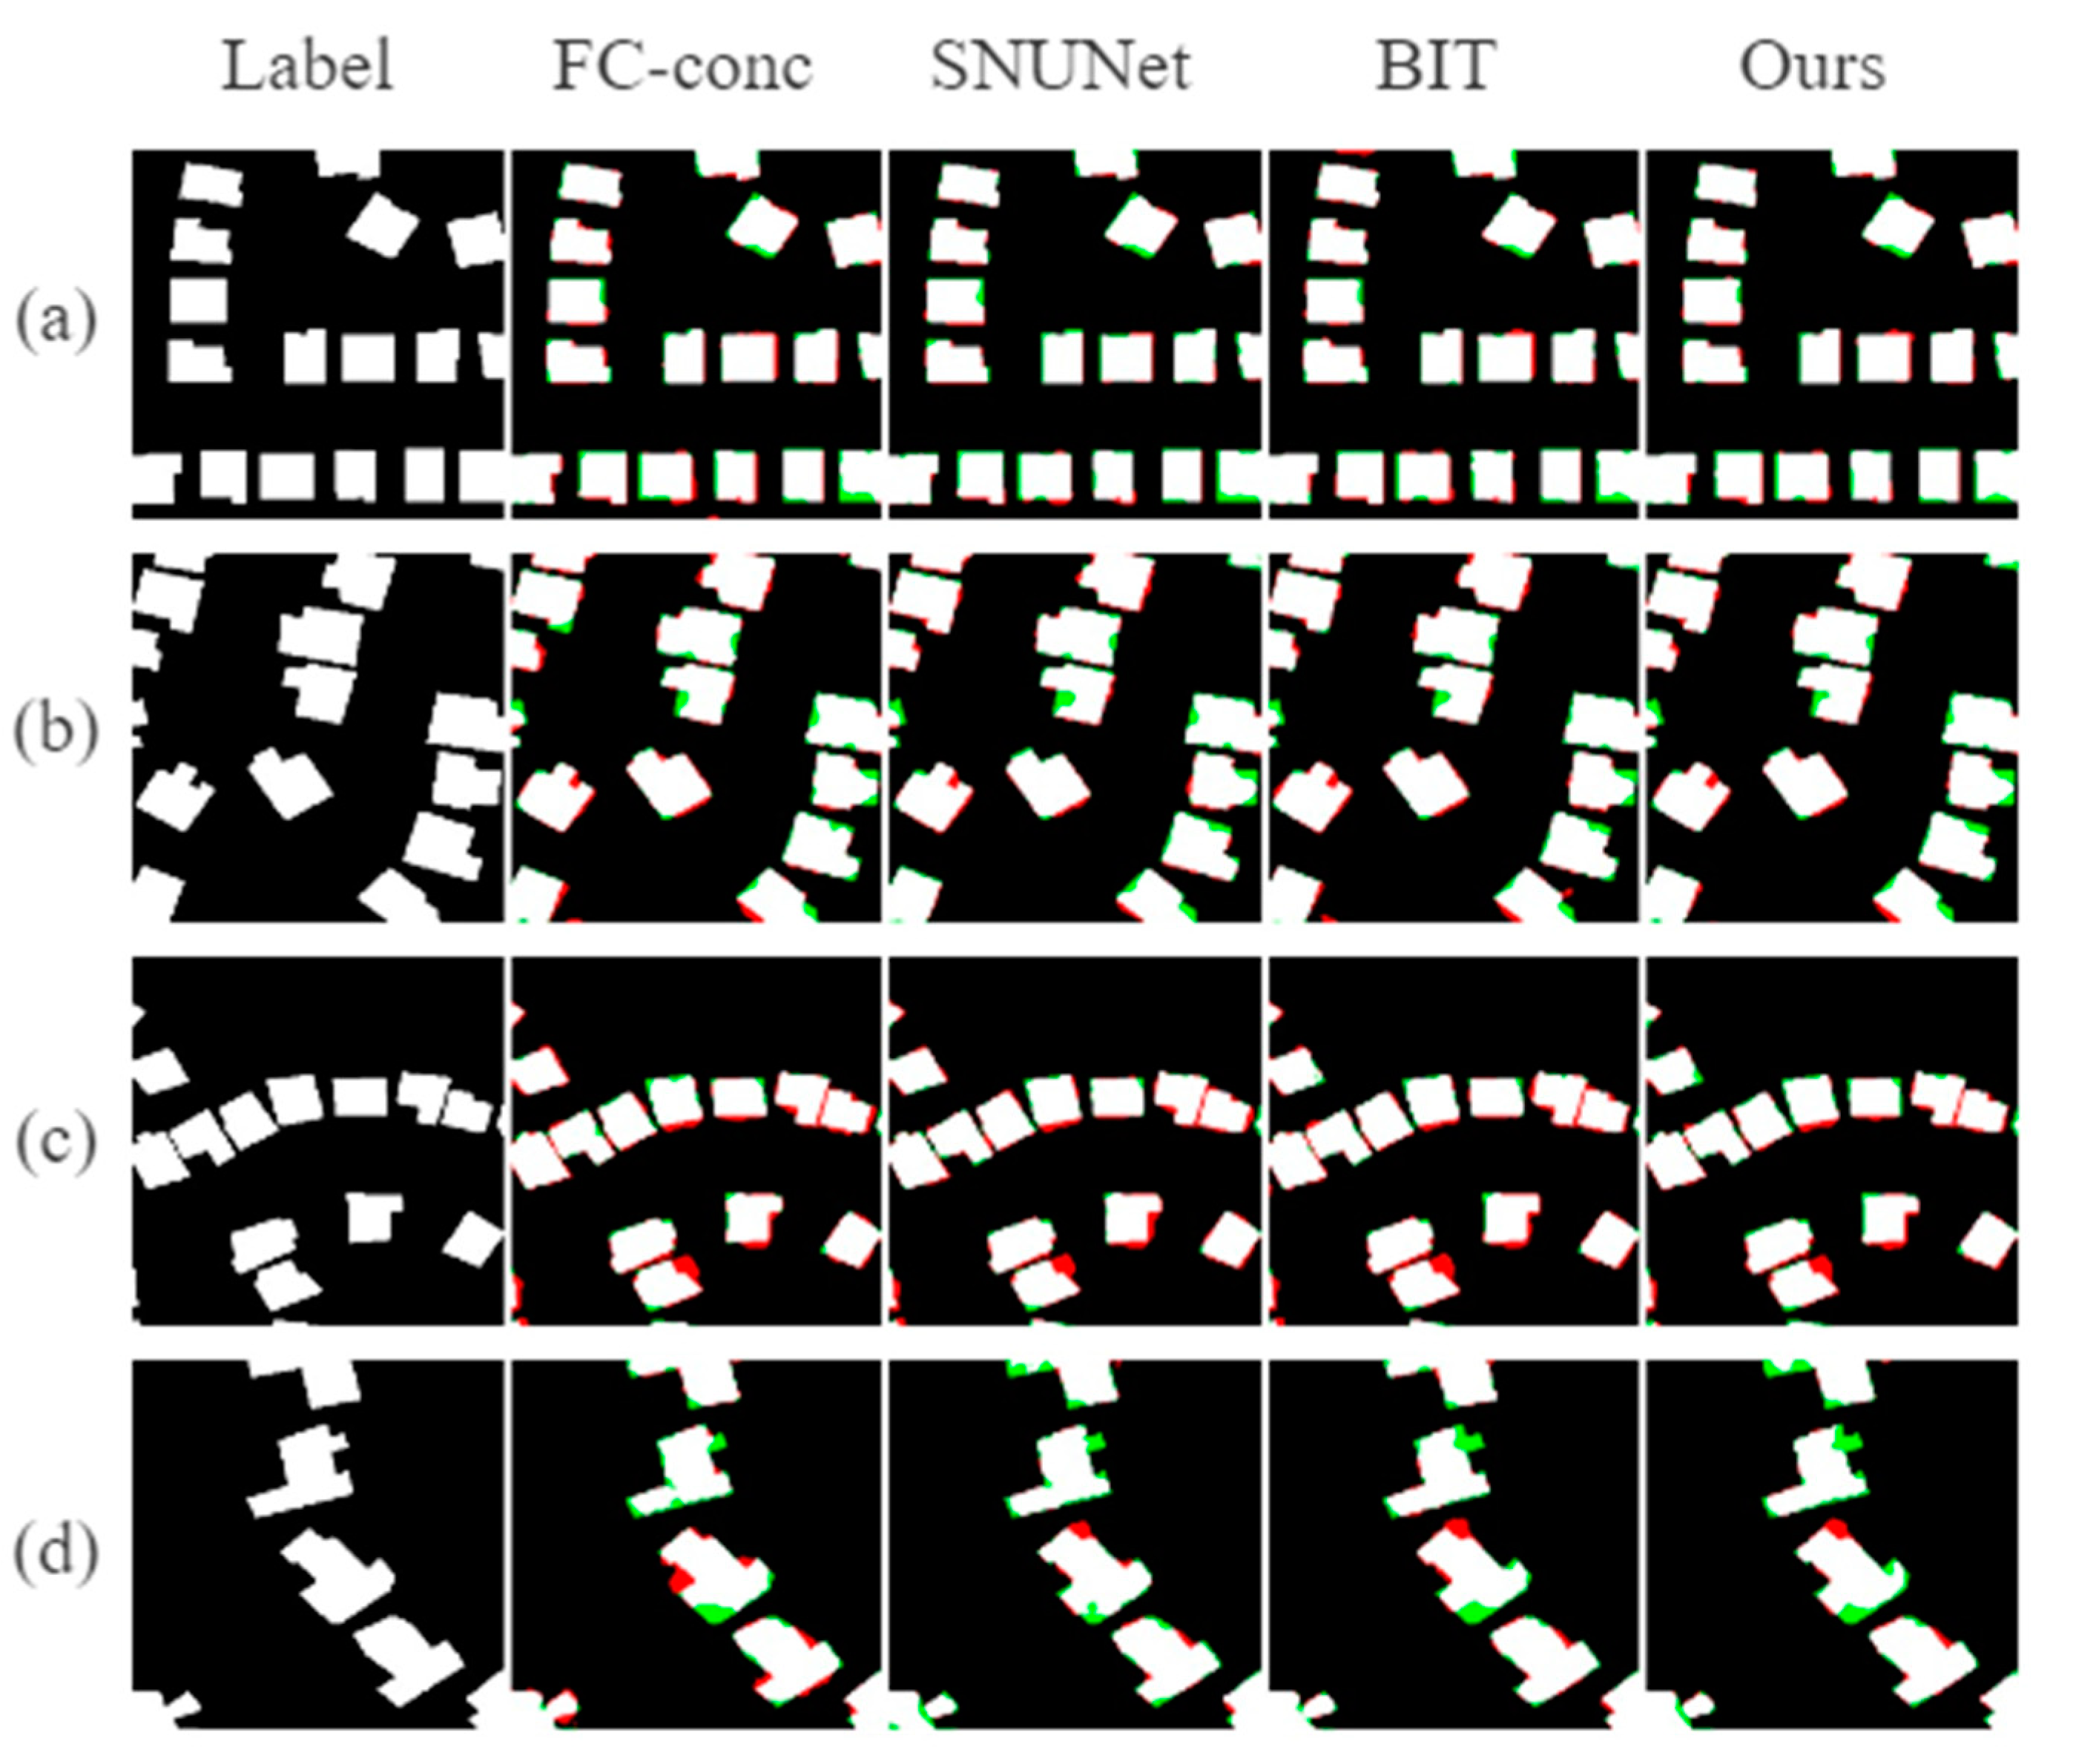
4.2.2. Qualitative Comparison

This section primarily presents the experimental results of qualitative comparison, focusing on the visualization effects of four comparison methods. Figure 11a–d showcases four representative samples from the LEVIR-CD dataset, where different colors are used to distinguish error-detected change areas (FP) highlighted in red and no change areas (FN) highlighted in green, aiming to enhance visualization.
Representative images from the dataset were carefully chosen and compared visually. The method introduced in this paper clearly shows fewer false boundary detections in the change region and effectively identifies change-intensive regions. Among the four methods compared, the proposed method exhibits the lowest rates of missed and false detections in the detection area, indicating its superior accuracy. Overall, the results highlight that this method surpasses others in achieving optimal change detection performance on the LEVIR-CD dataset.

4.3. Ablation Experiment

In this subsection, we conduct a series of experiments to verify the influence of the MFCF module and decoder module on the overall network performance.
To evaluate the efficacy of the MFCF module and decoder module proposed in this study, an ablation experiment was conducted on the Levi-CD dataset. The purpose was to analyze the impact of these modules within the network by removing and combining them. The Base setting represents a feature extraction network utilizing 3D ResNet50 as its foundation without any additional modules. The Base + MFCF setting indicates that MFCF modules are added to the Base network. The Base + De setting represents a network that adds decoder modules on top of Base. Our represents the final network structure proposed in this article. The ablation experimental results are shown in Table 2. To make the table more readable, the best data are marked in bold and the data are displayed as a percentage.
Upon integrating the MFCF module into the Base network, there was a notable increase of 0.22% in the F 1 score and approximately 0.15% in the I O U indicator. Furthermore, incorporating the De module led to a significant improvement of 0.95% in the F 1 score and 1.5% in the I O U indicator compared to the Base network. Ultimately, the final network architecture in this study demonstrated enhancements of approximately 1.06% in the F 1 score and 1.56% in the I O U indicator when compared to the Base network.
The ablation experiment further demonstrates the effectiveness of our model. Our method can better distinguish positive samples (i.e., changed areas) and decrease the occurrence of incorrect tests. Additionally, the results of the ablation experiment indicate that integrating the MFCF module and De module into this network can improve the F 1 score and I O U indicator. Specifically, the De module plays a crucial role in enhancing the precision of change detection.
Figure 12 presents visualizations of four different methods applied to the LEV-IR-CD dataset. The figure displays four representative samples from the dataset, using various colors to distinguish error-detected change areas (FP) shown in red and no change areas (FN) shown in green, providing improved visual clarity.
The visualized outcomes of the ablation experiment are depicted in the figure above. When compared to the results from the basic network structure, it is clear that the MFCF module and the De module, as introduced in this paper, show reduced false boundary detection in transitional areas and improved detection efficacy in rapidly changing regions. Among the four ablation experiments compared, the final method presented in this article displays the lowest missed detection rate and false detection rate in the detection area, as well as the highest detection accuracy. Overall, the MFCF module and De module proposed in this study prove to be effective in enhancing performance in change detection. Particularly, the De module plays a significant role in improving the overall detection accuracy of the network.

5. Conclusions

This study presents a novel network designed for detecting changes in regions of dual-temporal images. The network is specifically developed to tackle issues related to edge integrity caused by noise or registration errors, ultimately improving the accuracy of change detection in remote sensing images. The network incorporates Temporal Concatenation to process the input images, followed by 4 ResNet 3D modules for feature extraction. Subsequently, the feature maps pass through the CAM channel attention mechanism for weighting, and then through four MFCF modules for cross-fusion of different depths. Finally, the Decoder module is used to decode feature information of varying scales. The 3D CNN is employed to extract feature information from two-phase remote sensing images, with the MFCF module effectively fusing feature information from different convolution depths. To enhance module performance, the SE attention mechanism is utilized to ensure that the MFCF module focuses more on the feature information of the evolving region during the fusion of feature information from different convolutional depths. The Decoder module utilized in this study effectively restores the input size without compromising the details of the edge region. By combining BCE and Dice loss functions, the detection accuracy of the altered region is significantly enhanced. The network model is assessed using the LEVIR-CD dataset. In comparison with the other three methods, our network incorporates feature information of varying scales via MFCF, enhancing the overall edge detection completeness and transformation detection accuracy of remote sensing images. This improvement provides more precise data for various applications including forest environment monitoring, land resource management, disaster monitoring and emergency response, urban planning, and traffic management. However, the processing speed of the decoder may face limitations when handling extensive high-resolution data, particularly in resource-constrained environments. Moving forward, our focus will be on enhancing both the accuracy and efficiency of remote sensing image change detection algorithms.

Author Contributions

Conceptualization, S.Y.; methodology, S.Y., C.T., G.Z. and X.W.; software, S.Y.; validation, S.Y. and Y.X.; formal analysis, S.Y.; investigation, C.T.; resources, C.T.; data curation, S.Y.; writing—original draft preparation, S.Y.; writing—review and editing, S.Y., C.T., G.Z., X.W. and Y.X.; visualization, S.Y., C.T. and Y.X.; supervision, C.T. and X.W.; project administration, C.T.; funding acquisition, C.T. and X.W. All authors have read and agreed to the published version of the manuscript.

Funding

This work was supported by the National Key R&D Plan of China (grant No. 2022YFF0708500) and the National Natural Science Foundation of China (grant No. 12273040).

Institutional Review Board Statement

Not applicable.

Informed Consent Statement

Not applicable.

Data Availability Statement

The raw data supporting the conclusions of this article will be made available by the authors on request.

Conflicts of Interest

The authors declare no conflicts of interest.

Abbreviations

AbbreviationsFull form
CDChange Detection
CNNsConvolutional Neural Networks
MFCFMulti-Level Feature Cross-Fusion
CAMChannel Attention Mechanism
3D-CNNs3D Convolutional Neural Network
SESqueeze-and-Excitation
TCTemporal Concatenation
BCEBinary Cross-Entropy
DICESørensen–Dice
VHRVery High-Resolution
GEGoogle Earth
PrPrecision
IOUIntersection Over Union
1FNFalse Negative
TPTrue Positive
FPFalse Positive
ReRecall
DeDecoder

References

  1. Hegazy, I.R.; Kaloop, M.R. Monitoring urban growth and land use change detection with GIS and remote sensing techniques in Daqahlia governorate Egypt. Int. J. Sustain. Built Environ. 2015, 4, 117–124. [Google Scholar] [CrossRef]
  2. Paul, F.; Winsvold, S.H.; Kääb, A.; Nagler, T.; Schwaizer, G.J.R.S. Glacier remote sensing using Sentinel-2. Part II: Mapping glacier extents and surface facies, and comparison to Landsat 8. Remote Sens. 2016, 8, 575. [Google Scholar] [CrossRef]
  3. Yang, B.; Qin, L.; Liu, J.Q.; Liu, X.X. IRCNN: An Irregular-Time-Distanced Recurrent Convolutional Neural Network for Change Detection in Satellite Time Series. IEEE Geosci. Remote Sens. Lett. 2022, 19, 2503905. [Google Scholar] [CrossRef]
  4. Qu, J.H.; Hou, S.X.; Dong, W.Q.; Li, Y.S.; Xie, W.Y. A Multilevel Encoder-Decoder Attention Network for Change Detection in Hyperspectral Images. IEEE Trans. Geosci. Remote Sens. 2022, 60, 5518113. [Google Scholar] [CrossRef]
  5. Xu, X.T.; Li, J.J.; Chen, Z. TCIANet: Transformer-Based Context Information Aggregation Network for Remote Sensing Image Change Detection. IEEE J. Sel. Top. Appl. Earth Obs. Remote Sens. 2023, 16, 1951–1971. [Google Scholar] [CrossRef]
  6. Yang, X.; Luo, H.C.; Wu, Y.H.; Gao, Y.; Liao, C.Y.; Cheng, K.T. Reactive obstacle avoidance of monocular quadrotors with online adapted depth prediction network. Neurocomputing 2019, 325, 142–158. [Google Scholar] [CrossRef]
  7. Wang, G.H.; Li, B.; Zhang, T.; Zhang, S.B. A Network Combining a Transformer and a Convolutional Neural Network for Remote Sensing Image Change Detection. Remote Sens. 2022, 14, 2228. [Google Scholar] [CrossRef]
  8. Shi, Z.S.; Cao, L.J.; Guan, C.; Zheng, H.Y.; Gu, Z.R.; Yu, Z.B.; Zheng, B. Learning Attention-Enhanced Spatiotemporal Representation for Action Recognition. IEEE Access 2020, 8, 16785–16794. [Google Scholar] [CrossRef]
  9. Arif, S.; Wang, J.; Ul Hassan, T.; Fei, Z.J.F.I. 3D-CNNs-based fused feature maps with LSTM applied to action recognition. Future Internet 2019, 11, 42. [Google Scholar] [CrossRef]
  10. Tu, J.H.; Liu, M.Y.; Liu, H. Skeleton-based human action recognition using spatial temporal 3D convolutional neural networks. In Proceedings of the IEEE International Conference on Multimedia and Expo (IEEE ICME), San Diego, CA, USA, 23–27 July 2018. [Google Scholar]
  11. Ye, Y.X.; Wang, M.M.; Zhou, L.; Lei, G.Y.; Fan, J.W.; Qin, Y. Adjacent-Level Feature Cross-Fusion With 3-D CNN for Remote Sensing Image Change Detection. IEEE Trans. Geosci. Remote Sens. 2023, 61, 5618214. [Google Scholar] [CrossRef]
  12. Ma, C.; Zhang, Y.T.; Guo, J.Y.; Zhou, G.Y.; Geng, X.R. FusionHeightNet: A Multi-Level Cross-Fusion Method from Multi-Source Remote Sensing Images for Urban Building Height Estimation. Remote Sens. 2024, 16, 958. [Google Scholar] [CrossRef]
  13. Ke, Q.T.; Zhang, P. MCCRNet: A Multi-Level Change Contextual Refinement Network for Remote Sensing Image Change Detection. Isprs Int. J. Geo-Inf. 2021, 10, 591. [Google Scholar] [CrossRef]
  14. Liu, H.; Yang, G.Q.; Deng, F.L.; Qian, Y.R.; Fan, Y.Y. MCBAM-GAN: The Gan Spatiotemporal Fusion Model Based on Multiscale and CBAM for Remote Sensing Images. Remote Sens. 2023, 15, 1583. [Google Scholar] [CrossRef]
  15. Liu, Y.; Petillot, Y.; Lane, D.; Wang, S. Global Localization with Object-Level Semantics and Topology. In Proceedings of the IEEE International Conference on Robotics and Automation (ICRA), Montreal, QC, Canada, 20–24 May 2019; pp. 4909–4915. [Google Scholar]
  16. Wang, L.J.; Li, H.J. HMCNet: Hybrid Efficient Remote Sensing Images Change Detection Network Based on Cross-Axis Attention MLP and CNN. IEEE Trans. Geosci. Remote Sens. 2022, 60, 5236514. [Google Scholar] [CrossRef]
  17. Tokarczyk, P.; Wegner, J.D.; Walk, S.; Schindler, K. Beyond hand-crafted features in remote sensing. In Proceedings of the International-Society-for-Photogrammetry-and-Remote-Sensing Workshop on 3D Virtual City Modeling (VCM), Regina, SK, Canada, 28 May 2013; pp. 35–40. [Google Scholar]
  18. Khelifi, L.; Mignotte, M. Deep Learning for Change Detection in Remote Sensing Images: Comprehensive Review and Meta-Analysis. IEEE Access 2020, 8, 126385–126400. [Google Scholar] [CrossRef]
  19. Varghese, A.; Gubbi, J.; Ramaswamy, A.; Balamuralidhar, P. ChangeNet: A Deep Learning Architecture for Visual Change Detection. In Proceedings of the 15th European Conference on Computer Vision (ECCV), Munich, Germany, 8–14 September 2018; pp. 129–145. [Google Scholar]
  20. Li, Y.; Peng, C.; Chen, Y.; Jiao, L.; Zhou, L.; Shang, R.J.I.T.o.G.; Sensing, R. A deep learning method for change detection in synthetic aperture radar images. IEEE Trans. Geosci. Remote Sens. 2019, 57, 5751–5763. [Google Scholar] [CrossRef]
  21. Zhang, M.; Shi, W.J.I.T.o.G.; Sensing, R. A feature difference convolutional neural network-based change detection method. IEEE Trans. Geosci. Remote Sens. 2020, 58, 7232–7246. [Google Scholar] [CrossRef]
  22. Gong, M.; Zhao, J.; Liu, J.; Miao, Q.; Jiao, L. Change detection in synthetic aperture radar images based on deep neural networks. IEEE Trans. Neural Netw. Learn. Syst. 2015, 27, 125–138. [Google Scholar] [CrossRef]
  23. Zhan, Y.; Fu, K.; Yan, M.L.; Sun, X.; Wang, H.Q.; Qiu, X.S. Change Detection Based on Deep Siamese Convolutional Network for Optical Aerial Images. IEEE Geosci. Remote Sens. Lett. 2017, 14, 1845–1849. [Google Scholar] [CrossRef]
  24. Ghosh, R.; Bovolo, F. TransSounder: A Hybrid TransUNet-TransFuse Architectural Framework for Semantic Segmentation of Radar Sounder Data. IEEE Trans. Geosci. Remote Sens. 2022, 60, 4510013. [Google Scholar] [CrossRef]
  25. Ji, S.; Xu, W.; Yang, M.; Yu, K. 3D convolutional neural networks for human action recognition. IEEE Trans. Pattern Anal. Mach. Intell. 2012, 35, 221–231. [Google Scholar] [CrossRef] [PubMed]
  26. Zhang, X.L.; Li, J.X.; Zhou, K.X.; Ma, K. Feature cross-fusion block net for accurate and efficient object detection. J. Electron. Imaging 2021, 30, 013011. [Google Scholar] [CrossRef]
  27. Xu, R.D.; Tao, Y.T.; Lu, Z.Y.; Zhong, Y.F. Attention-Mechanism-Containing Neural Networks for High-Resolution Remote Sensing Image Classification. Remote Sens. 2018, 10, 1602. [Google Scholar] [CrossRef]
  28. Hara, K.; Kataoka, H.; Satoh, Y. Can spatiotemporal 3d cnns retrace the history of 2d cnns and imagenet? In Proceedings of the IEEE Conference on Computer Vision and Pattern Recognition, Salt Lake City, UT, USA, 18–23 June 2018; pp. 6546–6555. [Google Scholar]
  29. Su, J.; Liu, Z.; Zhang, J.; Sheng, V.S.; Song, Y.Q.; Zhu, Y.; Liu, Y. DV-Net: Accurate liver vessel segmentation via dense connection model with D-BCE loss function. Knowl.-Based Syst. 2021, 232, 107471. [Google Scholar] [CrossRef]
  30. Li, X.Y.; Sun, X.F.; Meng, Y.X.; Liang, J.J.; Wu, F.; Li, J.W.; Assoc Computat, L. Dice Loss for Data-imbalanced NLP Tasks. In Proceedings of the 58th Annual Meeting of the Association-for-Computational-Linguistics (ACL), Electr Network, Online, 5–10 July 2020; pp. 465–476. [Google Scholar]
  31. Chen, H.; Shi, Z.W. A Spatial-Temporal Attention-Based Method and a New Dataset for Remote Sensing Image Change Detection. Remote Sens. 2020, 12, 1662. [Google Scholar] [CrossRef]
  32. Daudt, R.C.; Le Saux, B.; Boulch, A. Fully Convolutional Siamese Networks For Change Detection. In Proceedings of the 25th IEEE International Conference on Image Processing (ICIP), Athens, Greece, 7–10 October 2018; pp. 4063–4067. [Google Scholar]
  33. Fang, S.; Li, K.Y.; Shao, J.Y.; Li, Z. SNUNet-CD: A Densely Connected Siamese Network for Change Detection of VHR Images. IEEE Geosci. Remote Sens. Lett. 2022, 19, 8007805. [Google Scholar] [CrossRef]
  34. Chen, H.; Qi, Z.; Shi, Z. Remote sensing image change detection with transformers. IEEE Trans. Geosci. Remote Sens. 2021, 60, 5607514. [Google Scholar] [CrossRef]
Figure 1. MFCF 3D-Net network structure.
Applsci 14 06269 g001
Figure 2. The MFCF-1 module.
Applsci 14 06269 g002
Figure 3. The MFCF-2 module.
Applsci 14 06269 g003
Figure 4. The MFCF-3 module.
Applsci 14 06269 g004
Figure 5. The MFCF-4 module.
Applsci 14 06269 g005
Figure 6. First stage decoder block De-1.
Applsci 14 06269 g006
Figure 7. Second stage decoder block De-2.
Applsci 14 06269 g007
Figure 8. Second stage decoder block De-3.
Applsci 14 06269 g008
Figure 9. Second stage decoder block De-4.
Applsci 14 06269 g009
Figure 10. Examples of the training samples used in this paper from the LEVIR-CD dataset.
Applsci 14 06269 g010
Figure 11. Visualizations of different methods in the sample tested on the LEVIR-CD dataset. Rows (ad) showcase four representative samples from the dataset. The first column is the label of the samples. The 2nd to 4th columns are the results of this comparison method on the samples, and the last column is the results of ours.
Applsci 14 06269 g011
Figure 12. Comparison of ablation experiments. Rows (ad) showcase four representative samples from the dataset. The first column is the label of the samples. The 2nd to 4th columns are the results of the ablation experiment, and the last column is the results of ours.
Applsci 14 06269 g012
Table 1. The quantitative comparison results of four methods on the LEVIR-CD dataset. The highest score is marked in bold. All the scores are described in percentages (%).
MethodsReF1IOU
FC-Siam-conc [32]81.6477.4964.48
SNUNet-CD [33]88.6387.8375.84
BIT [34]88.5989.5280.35
Ours89.9990.8083.15
Table 2. The ablation results of four methods on the LEVIR-CD dataset. The highest score is marked in bold. All the scores are described in percentages (%).
Network SettingLEVIR-CD
MFCFDeF1IOU
Base××89.8581.79
Base + MFCF×90.0781.94
Base + De×90.8083.29
Our90.9183.35
Disclaimer/Publisher’s Note: The statements, opinions and data contained in all publications are solely those of the individual author(s) and contributor(s) and not of MDPI and/or the editor(s). MDPI and/or the editor(s) disclaim responsibility for any injury to people or property resulting from any ideas, methods, instructions or products referred to in the content.

