Article

Improved Similarity Law for Scaling Dynamic Responses of Stiffened Plates with Distorted Stiffener Configurations

by
Hongyu Zhou
1,2,3,4,
Tetsuo Okada
5,*,
Yasumi Kawamura
5,
Deyu Wang
2,3 and
Ginga Hayakawa
5
1
Graduate School of Engineering Science, Yokohama National University, Yokohama 240-8501, Japan
2
State Key Laboratory of Ocean Engineering, Shanghai Jiao Tong University, Shanghai 200240, China
3
Institute of Marine Equipment, Shanghai Jiao Tong University, Shanghai 200240, China
4
School of Naval Architecture, Ocean and Civil Engineering, Shanghai Jiao Tong University, Shanghai 200240, China
5
Faculty of Engineering, Yokohama National University, Yokohama 240-8501, Japan
*
Author to whom correspondence should be addressed.
Appl. Sci. 2024, 14(14), 6265; https://doi.org/10.3390/app14146265
Submission received: 11 June 2024 / Revised: 12 July 2024 / Accepted: 12 July 2024 / Published: 18 July 2024
(This article belongs to the Section Marine Science and Engineering)

Abstract

:
Experimental analysis on small-scale models is widely used to predict the dynamic responses of full-scale structures subjected to impact loads. However, due to manufacturing constraints, achieving a perfectly scaled model under a large scaling factor is challenging, leading to the use of distorted scaled models as a compromise. This paper introduces an improved similarity law that ensures distorted scaled models accurately replicate the dynamic responses of prototype stiffened plates under impact loads. The proposed similarity law meticulously considers both the distorted attached plate thickness and variations in stiffener configuration. Double input parameters involving the load case and geometry are formulated to govern the dynamic responses of integrated stiffeners. Additionally, an approximate method rooted in elastic–plastic theory is developed to assess the dominant behaviors of stiffened plates during impact. Consequently, the distorted stiffener configuration of scaled models is designed through a methodology primarily centered on capturing dominant behaviors. Comprehensive numerical simulations are conducted to evaluate the behavior of stiffened plates subjected to impact loads. The results compellingly demonstrate that the proposed similarity law adeptly compensates for geometric distortions, ensuring reliable predictions of dynamic responses in distorted scaled models.

1. Introduction

Ships and offshore structures experiencing low-velocity impacts, including collision, grounding, and floating object collisions, are prone to catastrophic disasters. In severe cases, the structures on the side of the ship that are impacted can undergo significant deformations and fractures, potentially leading to environmental pollution and injuries. The serious consequences of these collision incidents have driven researchers to investigate structural crashworthiness. Numerous valuable insights have been gained through analytical studies, numerical simulations, and experiments [1,2,3,4].
Experimental research has been conducted since the last century to evaluate the important parameters, including impact load, stress, and the initiation and propagation of fractures, associated with impact events. Experimental analyses are regarded as an irreplaceable method in the field of impact research and serve as a verification tool [5]. However, owing to their high cost and restricted experimental conditions, small-scale model tests are frequently utilized to study the response of ship structures, enabling the prediction of the damage sustained by the prototype structure during collisions [6]. To accurately capture the behaviors of the prototype, it is crucial to design models based on appropriate similarity laws. Given the significant nonlinear effects involved in impact scenarios, dimensional analysis methods are extensively employed to simplify these problems. The Buckingham-Π theorem [7], a widely used approach, establishes scaling laws and asserts that complete similarity is maintained when all dimensionless numbers of the scaled model are identical to those of the prototype, as expressed in Equation (1).
Π i m = Π i p
The scaling laws governing impacted structures are well established and extensively employed in the field [8,9]. These laws, which are based on a dimensional analysis within the classic mass–length–time (MLT) system, facilitate the achievement of complete similarity. The fundamental relationships between the scaled models and the prototypes are summarized as scaling factors in references [6,10]. These scaling factors establish a connection between the dynamic behavior of the prototype and the perfect similar scaled models. The scaling factor β, defined in Equation (2), represents the relationship between the dimensions of the perfect similar scaled model (as subscript m) and those of the prototype (as subscript p). Additionally, the relationship defined for variable X can be denoted using the scaling factor βX and is expressed in Equation (3).
β = L m / L p
β X = X m / X p
However, in practical problems, particularly those involving impact scenarios, achieving complete similarity as described in the previous statement is often unattainable. This leads to what is known as incomplete similarity, also referred to as similarity for distortion [11]. Previous research has primarily focused on generating solutions and related parameters solely through a dimensional analysis. However, when distortions are present, the aforementioned approach becomes inadequate, emphasizing the need for further investigation and research. Moreover, Jones [6] highlighted that the response of structures under impact loads does not adhere to conventional similarity laws due to several factors, including strain rate sensitivity, structural fracture and thermal responses, and gravity. Consequently, it is imperative to explore the similarity laws that account for distortions and their additional effects.
Structural dynamic behaviors, especially those of structures made of materials like steel and alloys, have been extensively studied to understand the impact of strain rate [11,12,13,14,15]. As the field of similarity applications has evolved, an increasing number of researchers have turned their attention to geometric distortion similarity methods. They [16,17,18,19,20] primarily focused on the buckling of stiffened plates under compressive loads, with the objective of ensuring the similarity of key parameters during the buckling process. Additionally, when stiffened plates are subjected to lateral impacts, the additional common types of distortion encountered pertain to sole distortion, such as the plate thickness [21,22,
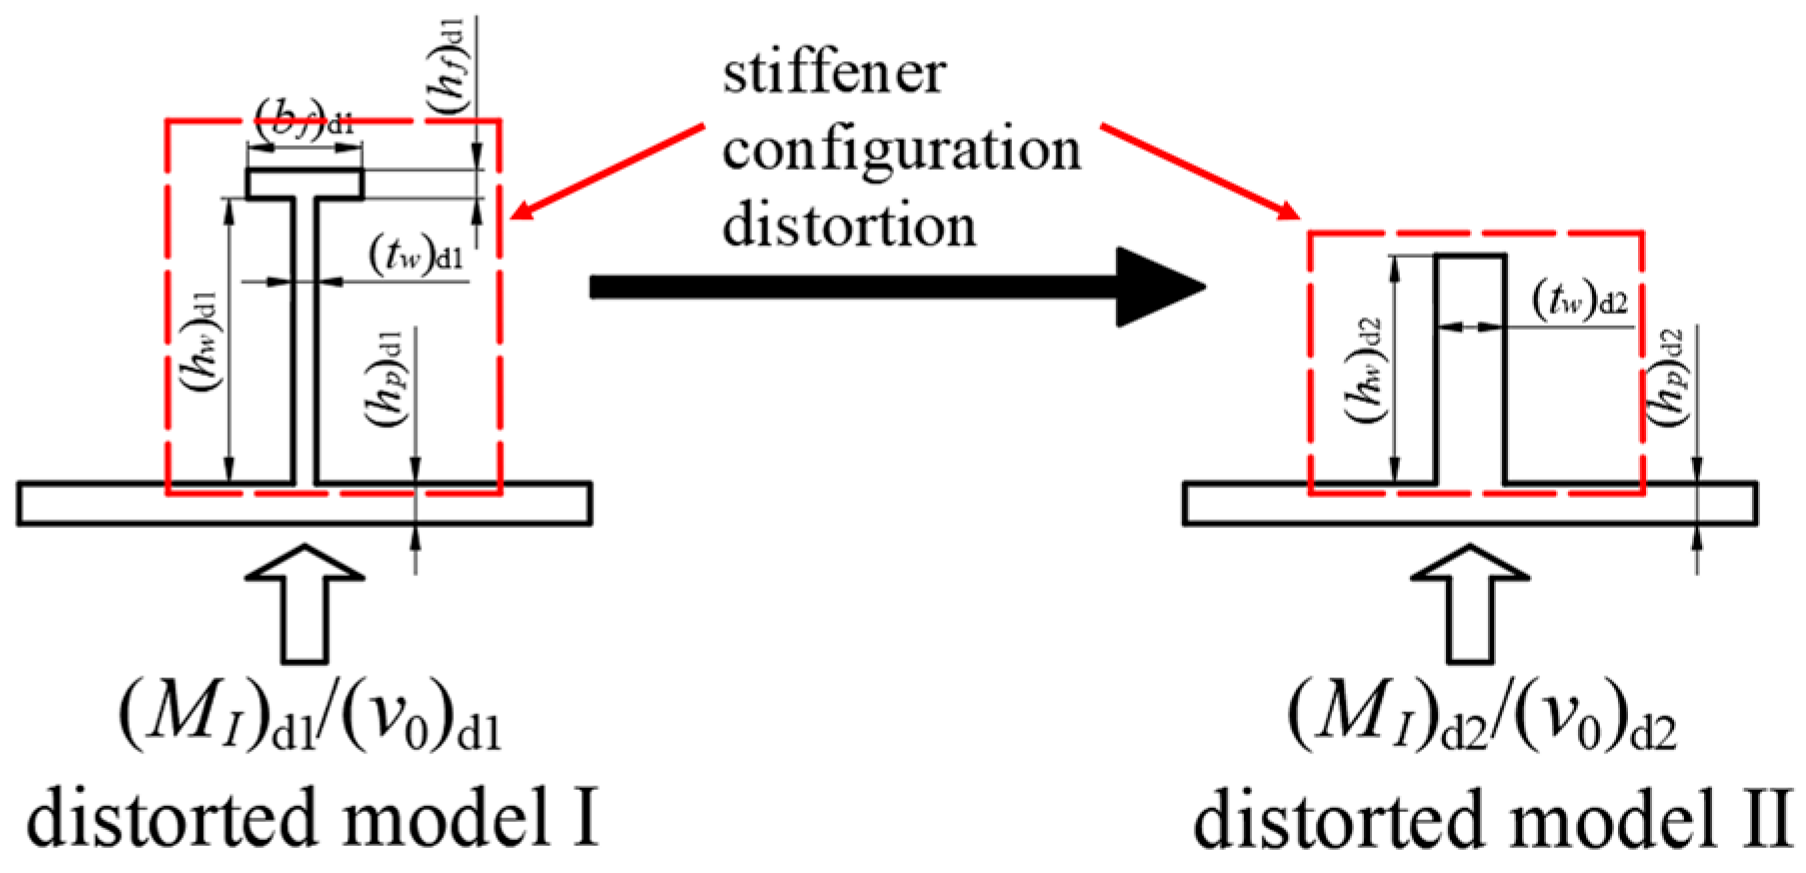
23], and complex distortion, such as stiffener configurations [24,
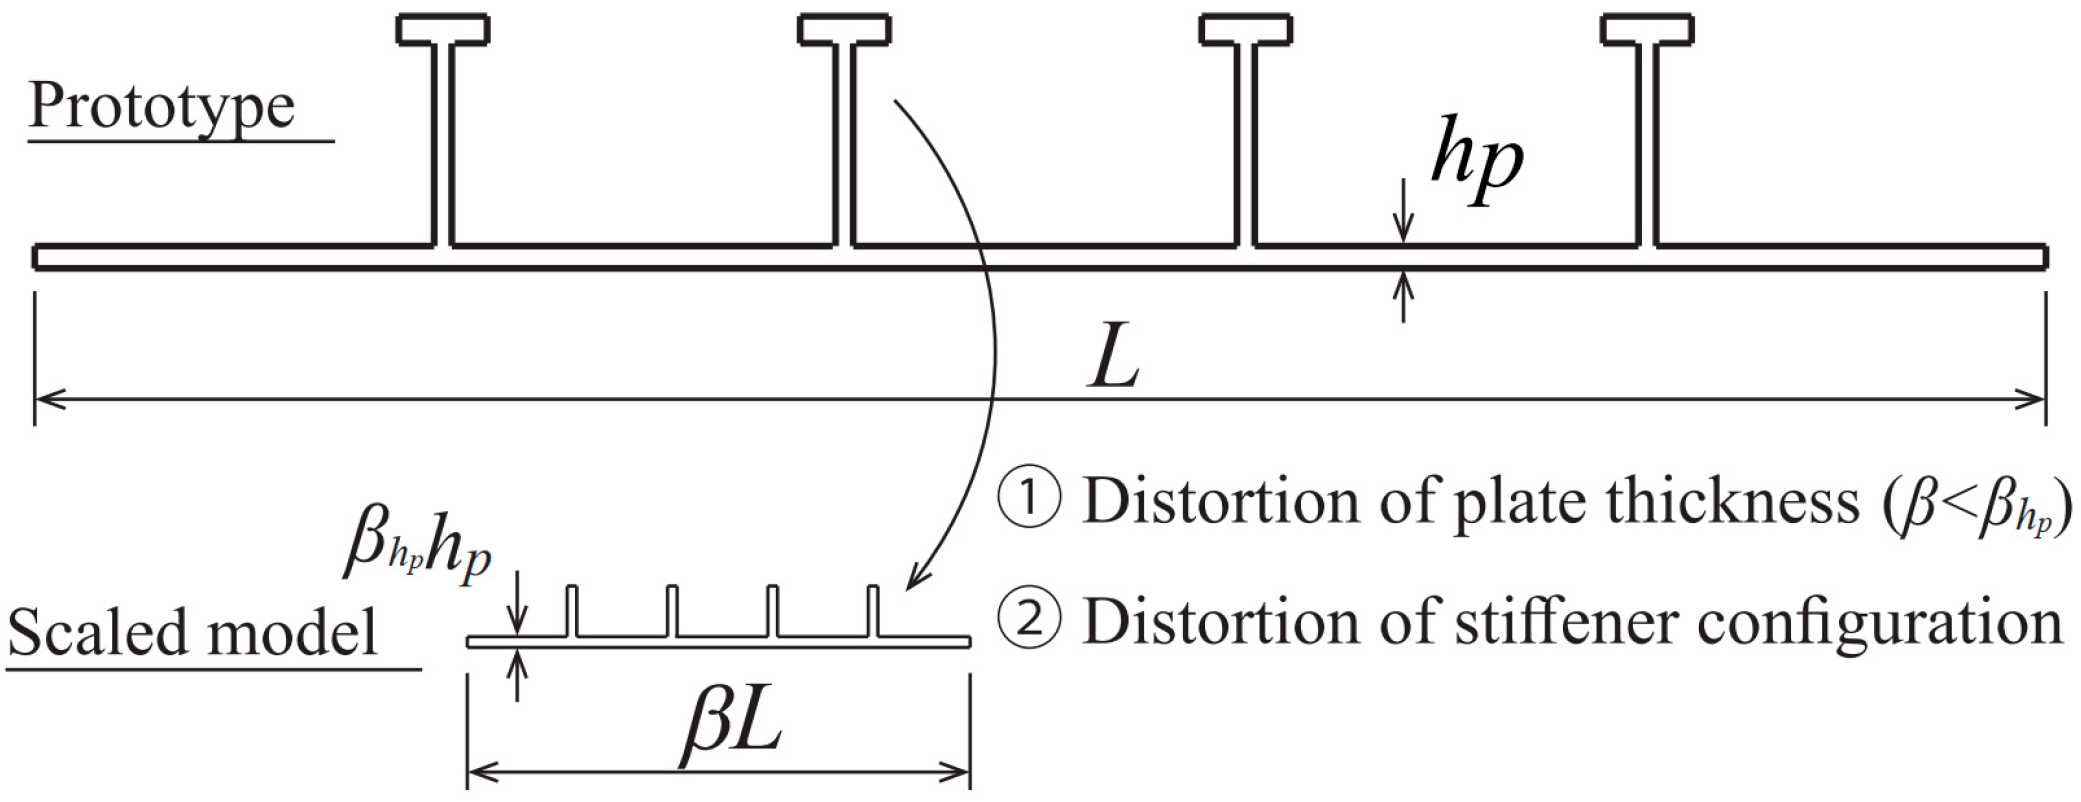
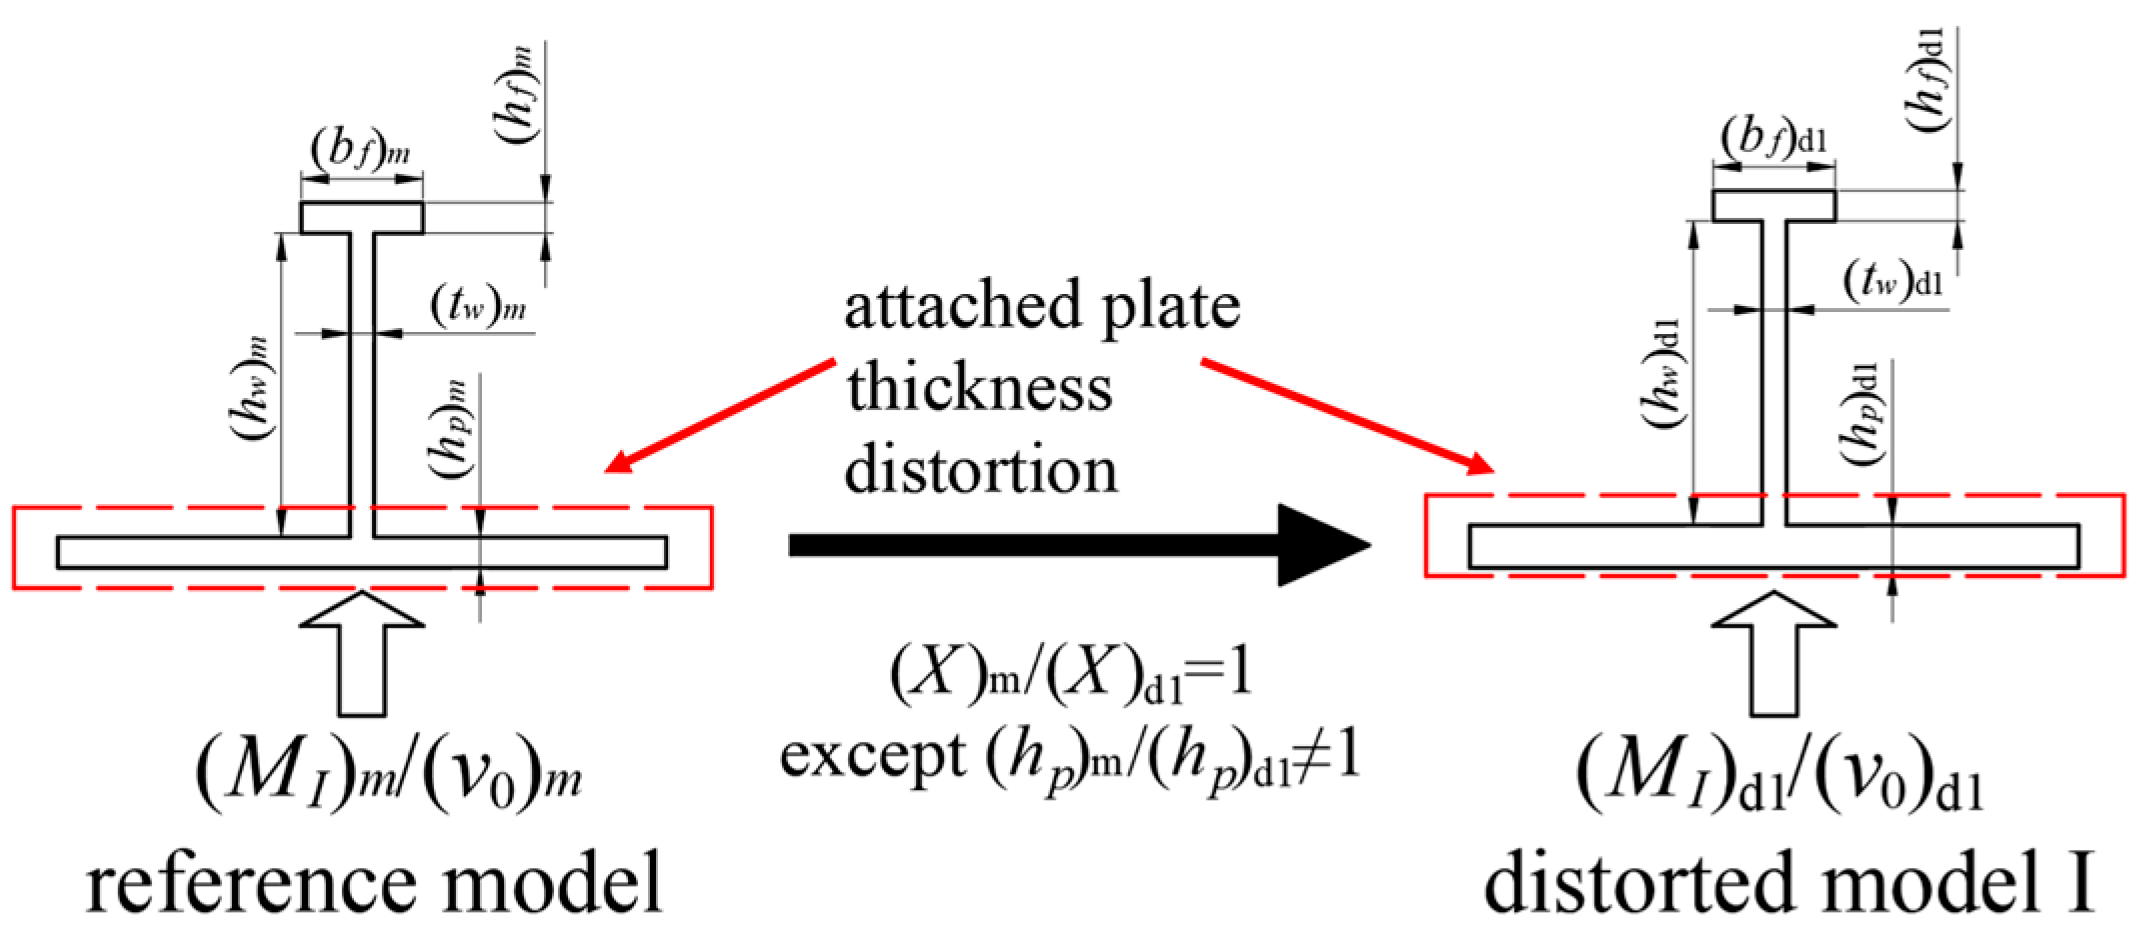
25], which are frequently constrained owing to the substantial overall scaling factor in thin-walled shipbuilding model tests, as Figure 1 illustrates. The thin-walled shipbuilding structure, characterized by its considerable size, requires a significant overall scaling factor (β) to obtain a specimen in model testing. Consequently, the scaled model’s plate thickness and stiffener spacing are significantly reduced, leading to a distortion of plate thickness (β < βhp) and the compromise approach of replacing T-type stiffeners with flat bars. These similarity requirements often encounter challenges to the same plate thickness and stiffener configurations, owing to limitations in achievable part sizes [11].
Oshiro and Alves [11] proposed a method using the corrected impact velocity to address the geometric distortion that arises between a prototype and its scaled model that are composed of the same material. To account for geometric distortion based on previous work on the strain rate effect, they introduced a corrected impact velocity factor using an exponential function of the scaling factor β and the involved distortion-related factor with an exponent nV. On the basis of the VSG dimensionless system, Zhou [10] introduced a scaling factor βS, relating to the static moment for structural cross-sections, to account for geometric distortion, leading to a corrected velocity scaling factor. This approach focuses on the geometric distortions to the plate thickness of the attached plate during impact. Cho et al. [21] introduced an empirical similarity method, which offers an empirical approach to establishing dependable correlations between prototypes and scaled models. This method addresses two common types of distortions: geometric and material. Mazzariol and Alves [22] proposed a novel approach to address the small thickness distortions in beams and plates by introducing a new expression for calculating the corrected impact velocity. This expression is based on a dimensionless parameter, the plastic bending moment M0, to effectively compensate for small thickness distortions.
Based on the correction approach proposed by Oshiro and Alves [11,14], Kong et al. [23] established a similar procedure to address incomplete scaled-down plates distorted in a single dimension, and developed a rapid solution to determine the significant exponent nV. Furthermore, in their subsequent work, Kong et al. [24] extended the corrected similarity relationship to account for the additional distortions encountered in prototype stiffened plates and scaled-down models subjected to blast loads. These distortions involved variations in the plate thickness and stiffener configuration relative to the prototype. Chang et al. [25] underscored the significance of stiffener dimensions during impact and proposed a technique for a stiffened plate with distorted flat bar stiffeners, in which an equivalent plate thickness is utilized to substitute for the stiffeners. With the help of this equivalent plate thickness, they derived a similarity law based on the DLV dimensionless system [26] that accounts for the distorted stiffener dimensions. Although numerical simulation investigations indicate that a scaled model with distorted flat bar stiffeners can predict the responses of the prototype, the focus was on a single type of stiffener, neglecting the deviation of different configurations on dominant behaviors during impact.
It is evident that the configuration of the stiffener must be adjusted in accordance with the specific experimental conditions, with the exception of the dimensions of the stiffener itself. Consequently, geometric distortion presents notable challenges when attempting to simulate prototype behaviors using scaled models. These phenomena are not prone to scaling, thereby impeding the accurate replication of the prototype in geometrically distorted scaled model experiments. Although existing methods [10,11,12,13,14,15,21,22,23,24,25,26] for addressing geometrically distorted scaled models provide a means of identifying similarities, they primarily focus on individual geometric distortions and require iterative processes to identify key factors. This makes them complex to utilize in practical applications. To address these nonscaling phenomena, this study introduces a systematic procedure that modifies the load cases in a rational manner, primarily aimed at compensating for geometric distortions relative to the prototype. It is imperative to emphasize that the similitude methodology is based on the assumption of thin plate theory focusing on ductile material, requiring the prototype to be composed of thin, ductile plates.
The following section outlines the structure of the remainder of this paper. Section 2 investigates the dynamic behavior of a stiffened plate under impact loading using the finite element method. It provides valuable guidance for establishing suitable criteria for altering the stiffener configuration in distorted models. Section 3 outlines the similarity procedure employed to capture the dynamic response of a prototype stiffened plate using distorted scaled models, neglecting the strain rate effect based on numerical observations, and focusing on correcting double input parameters involving the load case and geometry. Section 4 presents numerical simulations that validate the reliability of the similarity procedure and distortion criterion for shipbuilding structures. Section 5 discusses the limitations of the proposed method, emphasizing large stiffener heights and introducing an approximate approach to discern dominant behaviors during impact. Finally, Section 6 summarizes the key findings and contributions of this study.

2. Numerical Simulations Method and Response of Structure

2.1. Specimens Details

The simulation was carefully designed to resemble a realistic scenario, in which the bulb bow of a ship strikes the side structure of another ship, causing penetration during the collision, as depicted in Figure 2. To replicate this scenario, a rectangular stiffened plate located near a draft of 8000 mm, constrained by web girders and bulkhead, was extracted as the struck prototype structure. In addition, the side girder was replaced with a T-type stiffener with the same dimensions as the adjacent stiffeners. The four edges of the stiffened plate were fully clamped by referring to the boundary conditions adopted in previous experimental studies to simulate practical scenarios [27]. Additionally, the top portion of the bulbous bow was modeled as hemispherical with a radius of RI, and an initial impact velocity of v0 was applied.
Figure 3 shows the geometry and detailed dimensions of a struck system. As the frame space of the bulkhead was 3400 mm, the prototype stiffened plate was 6400 mm in length, 3400 mm in width, and 13 mm in thickness, with seven T-type stiffeners uniformly arranged on the plate along the width. The dimensions of these stiffeners were 350 × 11 125 × 15 , which means that the length and thickness of the web were 350 mm and 11 mm, respectively, whereas the corresponding flange sizes were 125 mm and 15 mm, respectively. The struck impact block was a hemisphere with a radius of 800 mm, and its deformation was not included in this study. Additionally, the impact block struck vertically at the center of the stiffened plate with an initial impact velocity of 3.0 m/s, approximately 5.832 knots, which is commonly observed during collisions.
The reference model refers to a perfectly similar model scaled down by an overall scaling factor of 1/10 from the prototype one-way stiffened plate, with the dimensions listed in Table 1. Its dimensions were scaled to obey the same scaling factor and boundary conditions as those of the prototype. Subsequently, the prototype stiffened plate and a perfectly similar scaled model were designed to provide a reference for the behaviors of the distorted scaled models.

2.2. Finite Element Modeling

Several groups of numerical simulations were performed using the Abaqus/Explicit finite element package (Version 6.14), to verify the applicability of the proposed method in scaling the models distorted in the plate thickness and stiffener configuration. For all simulation cases, four-node shell elements (S4R) with five integration points throughout the thickness were used to model the stiffened plates and impact blocks. High-strength struck impact blocks enable the use of rigid-body restrictions [10].
The element size of the mesh significantly influenced the numerical simulations—that is, the fracture strain. Therefore, mesh size convergence analyses were conducted with the objective of determining the optimal mesh size for the FE model. Five mesh sizes were applied to the prototype specimen, as shown in Table 2. The same mechanical properties and load case were applied to the numerical simulation until the specimen separated from the indenter, and the acceleration of the indenter was obtained. The simulation time and the corresponding resistance behaviors of the five mesh sizes were collected and compared. The results indicate that the mesh gradually converged from 100 mm to 15 mm. Compared with Case 5 (15 mm mesh model), the simulation deviation of Case 4 (20 mm mesh model) is minimal, while the time required is halved. Considering the simulation accuracy and calculation efficiency, the mesh size was selected as 20 mm for both the prototype stiffened plate and the impact block (RI = 800 mm) to sufficiently capture the large deformation characteristics, whereas the counterpart applied in the perfectly similar model with an overall scaling factor of 1/10 was 2 mm, to keep the mesh numbers the same as the prototype.
A revolving rigid part was used to model the semispherical impact block. The x-, y-, and z-axes correspond to the plate length, stiffener, and vertical directions, respectively. Additionally, the initial impact velocity placed at the center of gravity of the impact block was assigned in the vertical direction. Furthermore, the impact block was initially positioned to strike the stiffened plate at a 20 mm offset along the z-axis from the center of the plate, to guarantee convergence time during impact simulations.
Figure 4 illustrates the general model and constraints used in the numerical simulations. To match the experimental constraints, the boundary condition was selected to be fully clamped onto the four edges of the specimen. The contact of mild steel between the hemi-spherical indenter and the attached plate was modeled in Abaqus as General Contact, assuming a recommended friction coefficient of 0.23 [28], while the damping was neglected in the simulations. Because the boundary conditions and contact definition significantly influence dynamic behaviors in impact events, the same restrictions and properties were applied in all simulation cases.
The prototype structure was designed to be manufactured using a mild steel similar to NVA shipbuilding mild steel, a material that is typically ductile. Material properties were determined based on the previous research conducted by Hogstroem and Ringsberg [29]. Across all scenarios, the material was modeled using a nonlinear elastic–plastic constitutive model with isotropic hardening, following the relationship described in Equation (4). Additionally, these material properties account for strain rate effects, represented by the Cowper–Symonds equation with recommended coefficients for mild steel, as illustrated in Equation (5). Table 3 summarizes the material parameters related to nonlinear behavior. It is noted that the impact event focuses on the large deformation stage before failure.
σ = K ε n ,
σ d = σ 0 1 + ε ˙ D 1 / q ,

2.3. Dominant Behavior in Impact Event

In this section, the dominant behaviors during the impact of the prototype stiffened plate are investigated. Numerical simulations obeying the settings in Section 2.2 were conducted on the prototype stiffened plate to obtain the sectional force and moment at significant sections. The prototype stiffened plates were subjected to impact from a hemispherical indenter with a mass of 400 t and an initial velocity of 3.0 m/s, as listed in Table 1. The resistance behaviors characterized by a final plastic displacement in the z-direction of 398.1 mm and a peak acceleration applied in the indenter of 20,184 mm/s2 are plotted in Figure 5. The impact event focuses on the large deformation stage before failure. Additionally, it is illustrated that the acceleration and deformation initially increased and reached their peak, then gradually decreased until the impact indenter and structure separated.
Regarding impact as a typical local problem, the integrated stiffener unit under the impact indenter represents a significant resistance characteristic of the entire stiffened plate, which should be investigated. Furthermore, the center section and extreme end of the integrated stiffener are significant sections, because they are essential sections where the bending moment is maximum when subjected to an impact load at its midspan. The center section is denoted as S1, and the end section is denoted as S2, as shown in Figure 6.
In addition, the comparative results were normalized using the fully plastic bending moment M0 and fully plastic axial force N0. The plastic bending moment and fully plastic axial force of the integrated stiffener section can be obtained using the following formulas [6]:
M 0 = σ 0 S S ,
N 0 = σ 0 A S ,
where SS is the static moment to the plastic neutral axis which divides the sectional area into two parts equally; AS is the sectional area; and the flow stress σ0 is taken as the average value of the yield stress σY and ultimate stress σu, calculated as 441.5 MPa.
With respect to the case of the prototype stiffened plate, the sectional area (AS) is measured as 16,125 mm2, while the static moment (SS) amounts to 1,404,833 mm3. Consequently, the plastic limit bending moment and the fully plastic axial force of the integrated stiffener section in the prototype are determined to be 620,233,600 N·mm and 7,119,188 N, respectively. Figure 7 illustrates the normalized sectional moment and force obtained from the numerical simulations at S1 and S2 of the prototype specimen. With respect to the definition, M1, M2, and M3 are the bending moments around x-, y-, and z-axes, respectively, while M is the resultant (combined) moment. Similarly, F1, F2, and F3 are the sectional forces in the x-, y-, and z-directions, respectively, and F is the resultant force. Owing to the axis direction in the FE models shown in Figure 6, the negative axial force refers to the tensile force of the section.
The analysis revealed that the maximum components of the resultant moment and forces corresponded to the bending moment (M1) and axial force (F2) of the section. In particular, the bending moment (M1) applied in Section S1 was initially negative until t1 = 0.083 s, which corresponded to a displacement of 231.24 mm, which was approximately 58% of the maximum displacement during impact. This indicates that, in the first stage, the dominant behavior is bending, leading to significant resistance responses and subsequently influencing the final peak displacement and acceleration.
In addition, Figure 7 illustrates that the bending moment initially reached its peak, approaching the fully plastic moment M0, but gradually decreased as the membrane action became dominant in the section. Therefore, the geometric characteristics, particularly the static moment and sectional area, which govern the bending actions and membrane behavior should be primarily considered in the similarity method.

3. Similarity Methodology

3.1. The Scaling Law for Perfect Similar Stiffened Plates (Reference Model)

A prototype representing a stiffened plate extracted from an actual ship structure and subjected to a low-speed impact was considered. A perfectly similar scaled model made of the same material as the prototype was designed to exhibit geometric similarity with the prototype across all dimensions and is referred to as the reference model. Zhou [10] proposed a correction method for the impact velocity, considering dimensionless numbers associated with the impact velocity v0, dynamic flow stress σd, and structure mass MS. Although this method demonstrated significant improvements, it primarily focused on geometric parameters such as the plate length L and the corresponding overall scaling factor, while neglecting other dimensions.
Previous studies [6,22] have highlighted that the dynamic responses of stiffened plates involve a combination of bending and membrane behavior, which is extensively discussed in Section 2.3. In particular, the fully plastic bending moment, M0, and plastic normal force, N0, were identified as crucial factors in the energy-absorption mechanisms of these structures. The M0 and N0 for the stiffened plate can be computed using Equations (6) and (7). Hence, in situations where bending and membrane actions are the dominant behaviors, as governed by the sectional static moment SS and sectional area AS, it is essential to ensure consistency between the sectional static moment SS and sectional area AS of the scaled model and the prototype stiffener configuration.
Building on this foundation, the present method incorporates relevant quantities encompassing the geometric dimensions, including plate thickness and section attributes, represented by the sectional static moment (SS) and area (AS) of the integrated stiffener section. Because impact events affecting struck masses are localized concerns, it is reasonable to concentrate on the sectional geometric characteristics of a segment within a stiffened plate that includes both a stiffener and an attached plate delimited by two adjacent stiffeners, as shown in Figure 8a. Considering the deformation mode depicted in Figure 8b during impact, the axis used to compute the static moment SS was defined as the plastic neutral axis, dividing the sectional area of the integrated stiffener section into two equal parts.
The resistance responses of the structure are represented using a segment of the stiffened plate, which is referred to as an integrated stiffener. Additionally, the plastic deformation (δ) of the stiffened plate is considered as a characteristic parameter for capturing the dynamic plastic behavior during the impact event. Consequently, the plastic deformation of a stiffened plate with N stiffeners is hypothesized to be influenced by the aforementioned relevant parameters and can be expressed as follows:
δ = f ( L , h p , N , ρ , A , M 0 , σ , σ 0 , v 0 , M S , M I , A S , S S ) ,
By the observation of the low-velocity impact event in Section 2.3, the stress σ0 is introduced as an estimate of stress during impact, with the assumption of neglecting the strain rate effect. Therefore, using the initial velocity v0, stress σ0, and structure mass MS as fundamental quantities to form a series of dimensionless numbers, we obtain
M 0 M I v 0 2 Π 1 , A M I ρ v 0 2 L 2 Π 2 , ρ v 0 2 σ 0 Π 3 , σ σ 0 Π 4 , M I M S Π 5 ,   A S L 2 Π 6 , S S L 3 Π 7 ,
The establishment of similarity laws is based on the principle of equating the terms between a scaled model and a full-scale prototype [6]. These laws provide a structured foundation for establishing correlations between the dimensions of a scaled model designed in proportion to those of the prototype. This alignment of relevant terms within the laws facilitates the analysis and prediction of the prototype behavior through observations made from the scaled model. In the scenario of a perfectly similar scaled model, where the dimensions conform to a uniform scaling factor β, specific dimensionless quantities inherently fulfill the conditions of consistency. The pivotal scaling factors governing the attributes of the stiffened plates can be identified using the Buckingham procedure, as computed by Equation (1).
It is worth noting that the strain rate effect is neglected since it is not the primary focus of the proposed methodology. Therefore, consider a reference model with perfectly scaled dimensions and identical material properties, where Equation (1), encompassing Π1 to Π7, is applied:
M 0 m M I m v 0 m 2 Π 1 m = M 0 p M I p v 0 p 2 Π 1 p β v 0 = β σ 0 = 1 ,
A m M I m ρ m v 0 m 2 L m 2 Π 2 m = A p M I p ρ p v 0 p 2 L p 2 Π 2 p β A = β v 0 2 β = 1 β ,
ρ m v 0 m 2 σ 0 m Π 3 m = ρ p v 0 p 2 σ 0 p Π 3 p β v 0 = β σ 0 = 1 ,
  σ m σ 0 m Π 4 m = σ p σ 0 p Π 4 p β σ = β σ 0 = 1 ,
M Im M S m Π 5 m = M I p M S p Π 5 p β M I = β M S ,
A S m L m 2 Π 6 m = A S p L p 2 Π 6 p β A S = β 2 ,
S S m L m 3 Π 7 m = S S p L p 3 Π 7 p β S S = β 3 ,
Although the scaling factor was simplified owing to the perfect similarity of the reference model, the Buckingham procedure derived the relevant scaling factors for scaled model systems dealing with structures made of the same material. Consequently, the key scaling factors pertinent to the impact event were calculated and summarized in Table 4.
Utilizing these scaling factors facilitates the extrapolation of dynamic responses from a scaled model to a full-sized structure. It is imperative to emphasize that these factors are derived under the assumption that the scaled model adheres to perfect similarity, where the dimensions are proportionally scaled by the same scaling factor β. In essence, if geometric attributes, materials, and loading parameters are scaled to maintain identical input Π-terms for both the model and the prototype, then, as per the Buckingham theory, the nondimensional output will also be identical.

3.2. Correction for Thickness Distortion (Distorted Model I)

Distortion occurs when scaled models deviate from scaling according to the same factor, which is a common issue often observed in small-scale models owing to various constraints [6]. Extensive discussions on the characteristics of distorted scaled models can be found in the existing research [11,22]. Geometric distortions, especially in terms of plate thickness, as illustrated in Figure 9, are frequently encountered in scaled models, and these distortions can lead to performance deviations between the scaled model and the prototype structure.
In the proposed methodology, the scaled model, which exhibits the same overall scaling factor as the reference model in all dimensions except for the plate thickness, is designated as distorted model I. Consequently, building upon the similarity law introduced for the reference model and prototype in Section 3.1, the concept of distorted similarity in this section aims to compensate for the influence of the existing plate thickness distortion of distorted model I compared to that of the reference model. Here, the Buckingham procedure is applied to relate the distorted model I and the reference model using the same dimensionless number in Equation (9), where the subscript d1 refers to distorted model I. As detailed in Section 3.1, similarity is achieved when the dimensionless numbers in both systems are identical. The distortion scaling factor for any variable X between distorted model I and the reference model is defined as follows:
λ X = X d 1 / X m ,
In the context of distorted model I, despite the variations in the attached plate thickness, the geometric dimensions remain consistent with those of the reference model, which are expressed by the initial condition Xd1/Xm = 1, except for (hp)d1/(hp)m ≠ 1. This consistency inherently satisfies the major dimensionless numbers in Equation (9). Nonetheless, the deviation stemming from the difference in the attached plate thickness leads to distorted sectional geometric properties compared to the reference model. It is worth noting that the impact of the distorted plate thickness on the sectional geometric attributes is deemed negligible within this section, owing to practical experimental constraints that limit the extent of plate thickness distortion. Importantly, such a distortion is unlikely to significantly alter the predominant membrane behavior of the thin plate within the stiffened structure.
Furthermore, the strain rate approximation closely aligns distorted model I with the reference model, ensuring consistency between the initial velocities. This alignment is crucial for maintaining similarity between the two models. Consequently, the corrective approach for the thickness distortion focuses on the impact mass coupled with the dimensionless number Π 5 . Leveraging the Buckingham-Π theorem, the corrected impact mass is interconnected with the distorted geometry, as illustrated below:
Π 5 m = Π 5 d 1 M I M S m = M I M S d 1 λ M I = λ M S ,
M I d 1 = λ M I M I m = λ M S M I m ,
Equation (18) serves as the fundamental equation employed to address the discrepancy in the dynamic responses arising from plate thickness distortion, by adjusting the impact mass according to the distorted geometry. As a result, the dynamic responses of distorted model I closely resemble those of the prototype. In addition, several other scaling factors related to impact events can be derived using dimensionless numbers. Table 5 provides a comprehensive summary of the relationships between distorted model I and the reference model, where the length scaling factor is λ L = λ = 1 . By utilizing the scaling factors outlined in Table 4 and Table 5, the dynamic responses of distorted model I can be effectively extrapolated to the prototype.
To compensate for the influence of the plate thickness distortion, this method proposes a correction that focuses on adjusting the impact mass. The correction procedure for utilizing distorted model I to represent the response of the full-size model can be summarized as the following flowchart, Figure 10:
It is important to note that this procedure does not rely on data obtained from simulations. The design results of the scaled model were derived solely from the prototype structure and expected overall scaling factor.

3.3. Criteria for Distorted Stiffener Configuration (Distorted Model II)

Rolled and built-up T-type stiffeners are commonly used in the practical engineering of large-scale hull structures, as illustrated in Figure 2. However, replicating these T-type stiffeners in small-scale models is challenging, because of the significant welding deformations caused by the reduced stiffener thickness. To mitigate manufacturing complications, substituting T-type stiffeners with flat bars has become a prevalent practice in small-scale model testing. Nonetheless, such substitutions introduce discrepancies between the prototype and replicated stiffened plates. Consequently, the establishment of criteria that ensure that distorted stiffened plates with flat bars demonstrate a dynamic performance similar to that of their T-type counterparts is crucial.
To further explore and enhance the applicability of distorted similarity, this section introduces the concept of distorted model II, based on the foundation laid by distorted model I in Section 3.2. This new concept focuses on distorted stiffener configurations, as depicted in Figure 11. Distorted model II maintains consistent geometric dimensions with distorted model I, encompassing the attached plate length, thickness, and stiffener numbers and spacing, while deviating only in the stiffener configuration (using flat bars).
The replacement of a T-type stiffener with a flat bar stiffener results in distinct sectional geometric characteristic deviations and significantly affects the integrated stiffener behaviors. Consequently, it becomes imperative to establish a criterion ensuring that the dynamic responses in distorted model II closely resemble those of distorted model I, based on the sectional geometric attributes. Building on the framework of distorted similarity delineated in Section 3.2, a corrective criterion is established using the dimensionless numbers outlined in Equation (9). These dimensionless numbers are applied to both distorted model II and distorted model I, with the subscript d2 denoting the former. Meanwhile, the scaling factor for the distortion of any variable X between distorted model II and distorted model I is defined as follows:
η X = X d 2 / X d 1 ,
Therefore, distorted model II holds an overall scaling factor relationship, as in η L = η = 1 . Given identical overall dimensions (attached plate length) and convergent strain rates, an intrinsic consistency was confirmed for the initial velocity, as illustrated in Table 4.
Achieving perfect similarity by matching all dimensions with their counterparts in distorted model I appears unattainable for distorted model II, which is equipped with a flat-bar configuration. Here, it is possible to adjust the geometric parameters of the flat bar, thus accommodating the fulfillment of the pivotal governing parameters and attaining partial consistency. In light of the prominent influence of bending and membrane action, the correction approach focuses on preserving the dimensionless numbers Π 6 and Π 7 , which characterize the dynamic behaviors consistent with those of the distorted model I. Therefore, the dimensionless numbers Π 6 and Π 7 related to the sectional static moment SS and sectional area AS, respectively, are considered as follows:
A S d 2 L d 2 2 Π 6 d 2 = A S d 1 L d 1 2 Π 6 d 1 η A S = 1 ,
S S d 2 L d 2 3 Π 7 d 2 = S S d 1 L d 1 3 Π 7 d 1 η S S = 1 ,
It is evident that Equations (21) and (22) ensure the consistency of the other dimensionless numbers, including Π 5 , which is related to the impact mass. When the requirements in Equations (21) and (22) are met by distorted model II, similar dynamic responses between distorted model II and distorted model I can be guaranteed. Hence, the primary criterion for altering the stiffener configuration, Criterion 1, emphasizes the maintenance of a sectional area (Equation (21)) and static moments (Equation (22)) of the integrated stiffener consistent with distorted model I. Consequently, the input load case, involving the impact mass and initial velocity, remain the same as that of distorted model I. It is worth noting that the dimensions resulting from Criterion 1 for distorted model II often do not align with the standard steel sheet thickness, which approximates to the designed dimensions. Therefore, the sectional area of the designed distorted model II and distorted model I will not be strictly similar, which necessitates a correction to the impact mass based on the dimensionless number Π 5 :
Π 5 d 2 = Π 5 d 1 M I M S d 2 = M I M S d 1 η M I = η M S ,
M I d 2 = η M I M I d 1 = η M S M I d 1 ,
Thereby, the similarity approach, which ensures the equality of these terms between distorted model II and distorted model I, is utilized to address the distortion in the stiffener configuration and supplement the distorted similarity laws. The correction procedure for designing a distorted model (based on the corresponding distorted model) is summarized as follows:
  • First, calculate the dimensions of the distorted model II stiffeners configuration through the proposed criteria, according to the restrictions on the experimental and practical conditions:
    Criterion 1: To maintain a consistent sectional area Equation (21) and static moment Equation (22) with the corresponding distorted model I;
  • Establish distorted model II with the same attached plate and impact indenter dimensions and stiffener numbers as the corresponding distorted model I;
  • Calculate the corresponding scaling factor based on the detailed dimensions and corrected impact mass using Equation (24), if necessary;
  • Perform distorted model II with the new impact mass and the same initial velocity;
  • Reverse the simulated results to the corresponding distorted model I, then to the prototype.

4. Verification

To reliably verify the proposed similitude, numerical simulations were implemented using the Abaqus/Explicit finite element package (Version 6.14), which is considered an efficient method for solving short-term events, particularly impacts. The large-deformation resistance of thin-clamped stiffened plates of varying sizes struck by impact blocks was investigated. The characteristic behaviors, encompassing the maximum final plastic displacement and peak acceleration applied to the impact block, were subjected to further comparison.

4.1. Reference Model

Following the aforementioned settings, numerical simulations were conducted for a 1/10 scaled-down, perfectly similar model, designed based on the prototype illustrated in Section 2.1. In the simulation, the impact block of the system was subjected to the same initial velocity, whereas the impact mass was scaled down using Equation (14) as listed in Table 4. The resulting resistance acceleration versus plastic displacement responses were simulated and are presented in Table 6 and Figure 12. Here, the plastic displacement refers to the average value between the crest and trough of the oscillation stage in the response curve. Furthermore, the simulation results of the reference model are compared with the corresponding data of the prototype, which were reversed using Table 4. Additionally, it is illustrated that under reversed time, the acceleration and deformation history curves without structural failure performed identically to those of the prototype, as presented in Figure 5. Notably, the feature points of the reference model aligned remarkably well with those of the prototype, exhibiting a discrepancy of less than 1.03%. This alignment confirmed the efficacy of the proposed scaling law for a perfectly similar model.
In addition, the sectional moment and force of the corresponding section in the reference model were extracted from the numerical results. The definitions of the significant sections and components of the sectional moment and force align with those of the prototype, as described in Section 2.3. The fully plastic moment M0 and fully plastic force N0 are calculated as 620,233.6 N·mm and 71,191.9 N, respectively, using Equations (6) and (7). The normalized sectional moment M/M0 and force N/N0 of the reference model are shown in Figure 13.
In Section S1, the reference model exhibits a near-equivalent duration of negative M2 compared to the prototype. Moreover, the normalized sectional moment and force within the reference model closely mirrored those observed in the prototype, demonstrating a consistent resemblance in Sections S1 and S2. This correspondence suggests a similarity in the dominant actions between the reference model and the prototype. Consequently, the reference model conforming to the scaling law effectively replicates the resistance characteristics inherent in the prototype, as shown in Figure 12. Hence, this reference model serves as a benchmark for the subsequent design of the distorted models in the following sections.

4.2. Distorted Model I

This section delves into the verification of the scaling law for distorted model I, where the sole distinction lies in the attached plate thickness compared to the reference model. To this end, a sequence of distorted models I were developed based on the reference model, as described in Section 4.1. These models encompass a range of arbitrarily selected plate thicknesses spanning from 1.0 mm to 1.8 mm, corresponding to plate thickness distortion factors (hpd1/hpm) that extend from 0.7692 to 1.3846.
While maintaining the same plate length as that of the reference model, the impact block was designed to ensure congruence with its counterpart in the reference model in terms of dimensions. A comprehensive breakdown of the dimensions of the stiffened plate specimens and their corresponding impact blocks is presented in Table 7. Figure 14 provides an illustrative representation of distorted model I (model 2), including its associated impact block.
With the determined dimensions of the attached plates and stiffeners for each distorted model I, the structural mass can be calculated by substituting the geometric parameters from Table 7 into the equations. Subsequently, the structural mass factor is obtained using Equation (17), utilizing the structural mass of distorted model I and the reference model. This factor enables the corrected impact mass to be calculated using Equations (18) and (19). To ensure consistency, the numerical simulations were configured with identical boundary conditions and contact restrictions as those applied to the reference model, ensuring uniformity across all cases involving distorted specimens.
Two groups of distorted model I were established for comparative analysis: one with uncorrected load cases and the other with corrected load cases. In the uncorrected group, the load cases consisted of an impact mass of 0.4 t and initial impact velocity of 3.0 m/s, aligned with those of the reference model. In contrast, the corrected group applied load cases in which the impact mass was adjusted according to the procedure outlined in Equation (19). A summary of the loading cases employed in the two simulation groups is presented in Table 8.
Furthermore, Table 9 presents the resistance characteristics, including the plastic displacement and peak acceleration, for the reference model, uncorrected group, and corrected group. Figure 15 shows a visual comparison of these resistance behaviors. The results indicate that the correction procedure yields remarkably similar predictions for plastic displacement and peak acceleration, with absolute differences of less than 2.06%, which is a notable enhancement compared to the uncorrected group. Moreover, these history curves of the corrected group perfectly matched those of the reference model, offering valuable insights into the dynamic behavior of stiffened plates.

4.3. Distorted Model II

This section aims to validate the similarity when dealing with distorted model II, which involves stiffener configuration distortions through the substitution of flat bars for the original T-type stiffeners. Extending the distorted model outlined in Table 7, the corresponding distorted model was designed, featuring flat-bar stiffener configurations. Additionally, the impact blocks used in these models maintain the same geometric attributes as those of the distorted models I, featuring a radius of 80 mm and being subjected to a consistent initial impact velocity of 3 m/s.
Adhering to the criteria outlined in Section 3.3, the precise dimensions of the flat-bar stiffeners were determined to fulfill Criterion 1. The heights and thicknesses of the flat-bar stiffeners are adjusted to maintain a consistent static moment and sectional area of the integrated stiffener sections with the corresponding distorted models I. For instance, considering model 2 from Table 7 as an illustrative example, the associated distorted model II, denoted as M2-E, was designed with a flat-bar stiffener measuring 46.93 mm × 1.22 mm, signifying a height of 46.93 mm and a thickness of 1.22 mm. The static moment and sectional area of the integrated stiffener section in M2-E amount to 1396 mm3 and 153.26 mm2, respectively, closely approximating the values exhibited by the corresponding stiffener in model 2 (1396.97 mm3 and 153.25 mm2). A schematic depicting distorted model II M2-E, along with its accompanying impact block, is illustrated in Figure 16. The detailed dimensions and load cases of each distorted model (corresponding to the distorted model) are listed in Table 10. It is noted that the impact mass applied in each distorted model II is the same as the corresponding distorted model I due to the similar sectional area, as illustrated in Section 3.3.
The simulation cases were set up with the same boundary conditions and contact restrictions as those used for distorted model I. The maximum final plastic displacement and peak acceleration during impact for each model are listed in Table 11. Although the numerical results of the corresponding distorted model I are concluded in Table 9, they are included in Table 11 for reference purposes. In addition, Figure 17 presents the acceleration and displacement history curves, with solid lines denoting the reference models and dashed lines representing the distorted models.
The comparison between the distorted models II and the corresponding distorted models I, with equivalent plate thicknesses, reveals a pronounced consistency in resistance behavior during impact. The observed peak acceleration differences between the distorted models II and their corresponding distorted models I are within 2.91%, affirming the validity and reasonableness of the underlying assumption. Therefore, consistency suggests the successful alignment of geometric characteristics in the distorted stiffener configuration through the proposed similarity procedure and Criterion 1, resulting in an accurate replication of the impact response.

4.4. Case Study

In this section, we supplement the investigations with an array of simulation cases involving various stiffened prototype plates, aimed at scrutinizing the validation of the similarity procedure in addressing distorted model II. In compliance with shipbuilding structural guidelines, a series of prototype variations characterized by diverse dimensions of T-type stiffeners were meticulously crafted. An overarching scaling factor of 1/10 was consistently applied to all instances, and the detailed dimensions of these perfectly similar stiffened plates are summarized in Table 12. In each instance, the reference stiffened plates were subjected to an impact event initiated by a hemispherical indenter, endowed with a mass of 0.4 t and an initial velocity of 3.0 m/s.
Subsequently, the similarity procedure was employed to design the corresponding distorted models II, wherein the dimensions of the web were calculated to satisfy Criterion 1, along with the consistent load cases mirroring the reference models. The detailed dimensions of these distorted models are listed in Table 13. Utilizing identical solver settings consistent with the previous sections, numerical simulations were conducted for both the reference models and their corresponding distorted models. The resulting plastic displacements and peak accelerations are summarized and compared with the corresponding reference models in Table 13. The impact masses were adjusted using Equation (24) by substituting the dimensions into the equation. Since the sectional area of these distorted models closely matched that of the corresponding reference models, the impact mass remained approximately equal to the initial impact mass of 0.4 t in the reference models.
As a result, Figure 18 presents the displacement and acceleration results for all the cases. The reference models are indicated by solid lines, whereas the corresponding distorted models II adhering to Criterion 1 are represented by dashed lines of the same color.
As discussed in Section 4.1, during the initial stage, when the bending action predominates, the behavior was primarily governed by the static moment. As the deformation progressed, the stiffened plates primarily resisted the application of the membrane forces N0. Therefore, the distorted models in group E, designed to maintain both equivalent sectional areas and static moments, consistently exhibited a behavior similar to that of their reference models, as shown in Figure 18. In conclusion, this series of comparisons robustly demonstrates the efficacy and applicability of the proposed criterion for addressing prototypes equipped with common T-type stiffeners.

5. Discussion

5.1. Prototype Stiffened Plates Considering a Relatively Large Web Height

In various collision scenarios, the stiffened plates are subjected to vertical impact loads, resulting in in-plane loads borne by the stiffened web. Although the case study highlights the suitability of the proposed similarity procedure for designing distorted models with commonly suggested stiffeners in shipbuilding, it is important to consider that extreme structures with heights significantly greater than the recommended values may exist, rendering them susceptible to buckling.
In this study, a straightforward similarity procedure was introduced, primarily focusing on the plastic bending moment and membrane actions, while disregarding the intricate buckling phenomena exhibited by stiffeners during impact events. However, it is crucial to acknowledge that these complex buckling behaviors have a substantial influence on the resistance force and can result in unacceptable deviations when designing distorted scaled models. Therefore, in this section, an expanded criterion is proposed to address prototypes with significantly greater heights, although they may be rare, as they can occur in practical scenarios. Accordingly, an extreme reference model (RP-6) with a web height of 60 mm, which is much larger than the suggested structures, is designed. The detailed dimensions and geometric properties are listed in Table 14 and illustrated in Figure 19.
Additionally, the normalized sectional bending moment component M1 and axial force component F2 are collected from the numerical results, where the fully plastic moment and fully plastic force are 1,547,010 N·mm and 86,313 N, respectively, calculated based on Equations (6) and (7). Figure 20 illustrates the time-series curves, including the dynamic responses and normalized sectional moment and force results. The acceleration responses of RP-6 (red solid curve) initially exhibited a first wave crest at t1 = 0.000875 s, followed by a second wave crest at t2 = 0.010625 s, resulting from secondary buckling, and then a peak.
Figure 21 and 
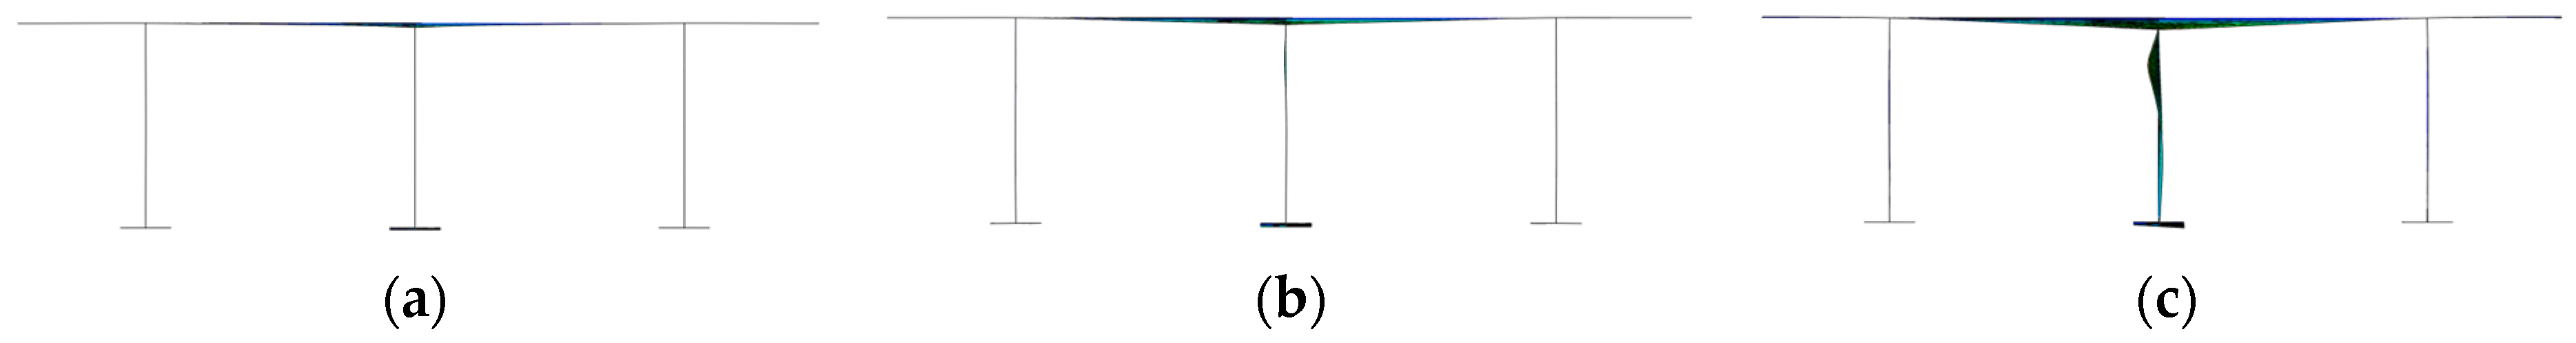
Figure 22 present the deformation of the center and two adjacent integrated stiffeners under the impact block seen from the cut-out section at the midspan of the stiffener, in accordance with the view direction depicted in Figure 19. An obvious buckling behavior of the stiffener web can be observed in 
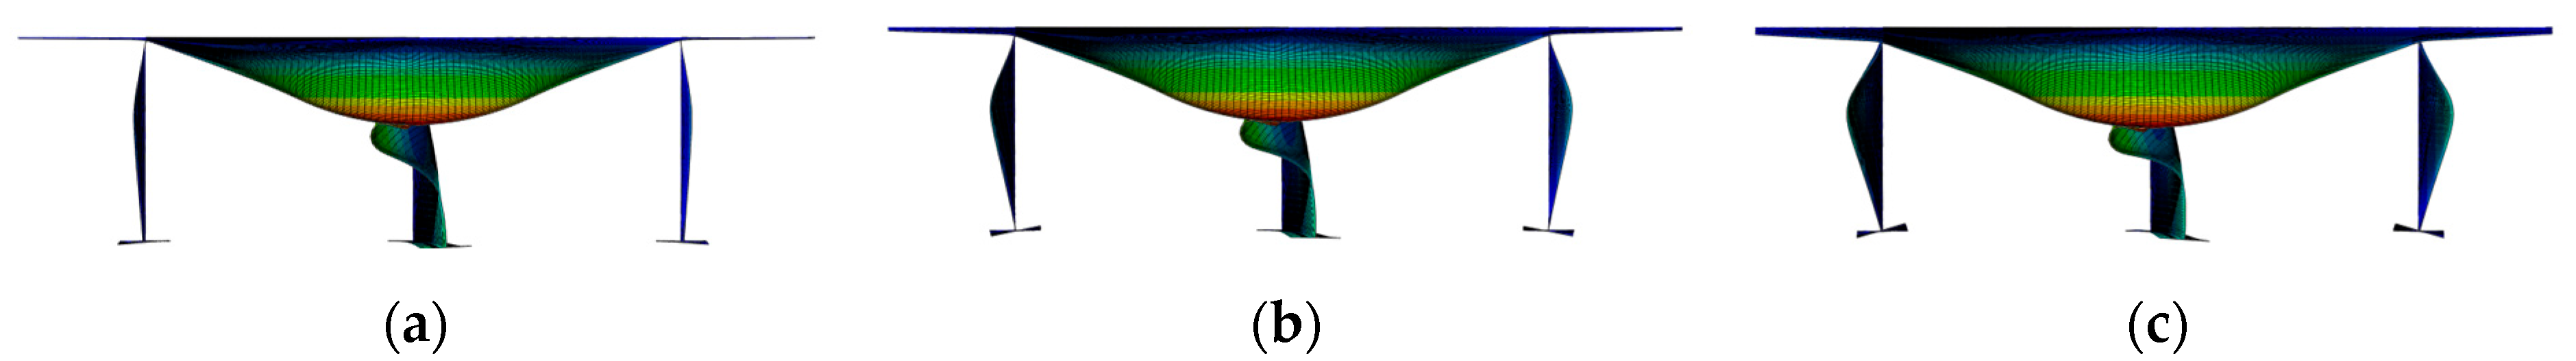
Figure 21, corresponding to the first wave crest. As the deformation progressed to a more significant stage, the stiffened plates began to resist, primarily through the application of membrane force. The second wave crest of RP-6 in Figure 20 appeared at t2 = 0.010625 s. During this stage, the stiffener web experienced heavy buckling, leading to a secondary buckle influencing not only the center stiffener but also the adjacent stiffeners, as shown in Figure 22. This behavior may contribute to a decrease in the structural rigidity, thereby influencing the occurrence of the second crest in the RP-6 results.
When a stiffener has an extremely slender web, it is more likely to behave as a web girder than traditional stiffeners. The deformations of web girders subjected to in-plane concentrated loads have been extensively investigated. Various simplified analytical methods have been proposed to predict the resistance of web girders, with a particular focus on different formulations of the fold-height parameter H [3,30]. Gao et al. [30] studied the behavior of a web girder subjected to an in-plane concentrated load. According to the analytical solution [30] for web girders, the resistance responses are significantly influenced by the web thickness. In addition, in the large-deformation stage, the dynamic behavior is dominated by membrane behavior rather than bending action.
Therefore, an expanded criterion, denoted as Criterion 2, was introduced to maintain the web thickness and sectional area as close to those of the reference model as possible, specifically for T-type stiffeners with very large web heights. To examine the effectiveness of the different design criteria, a series of distorted models obeying Criterion 1 and Criterion 2 were constructed based on RP-6, whose detailed dimensions and geometric properties are listed in 
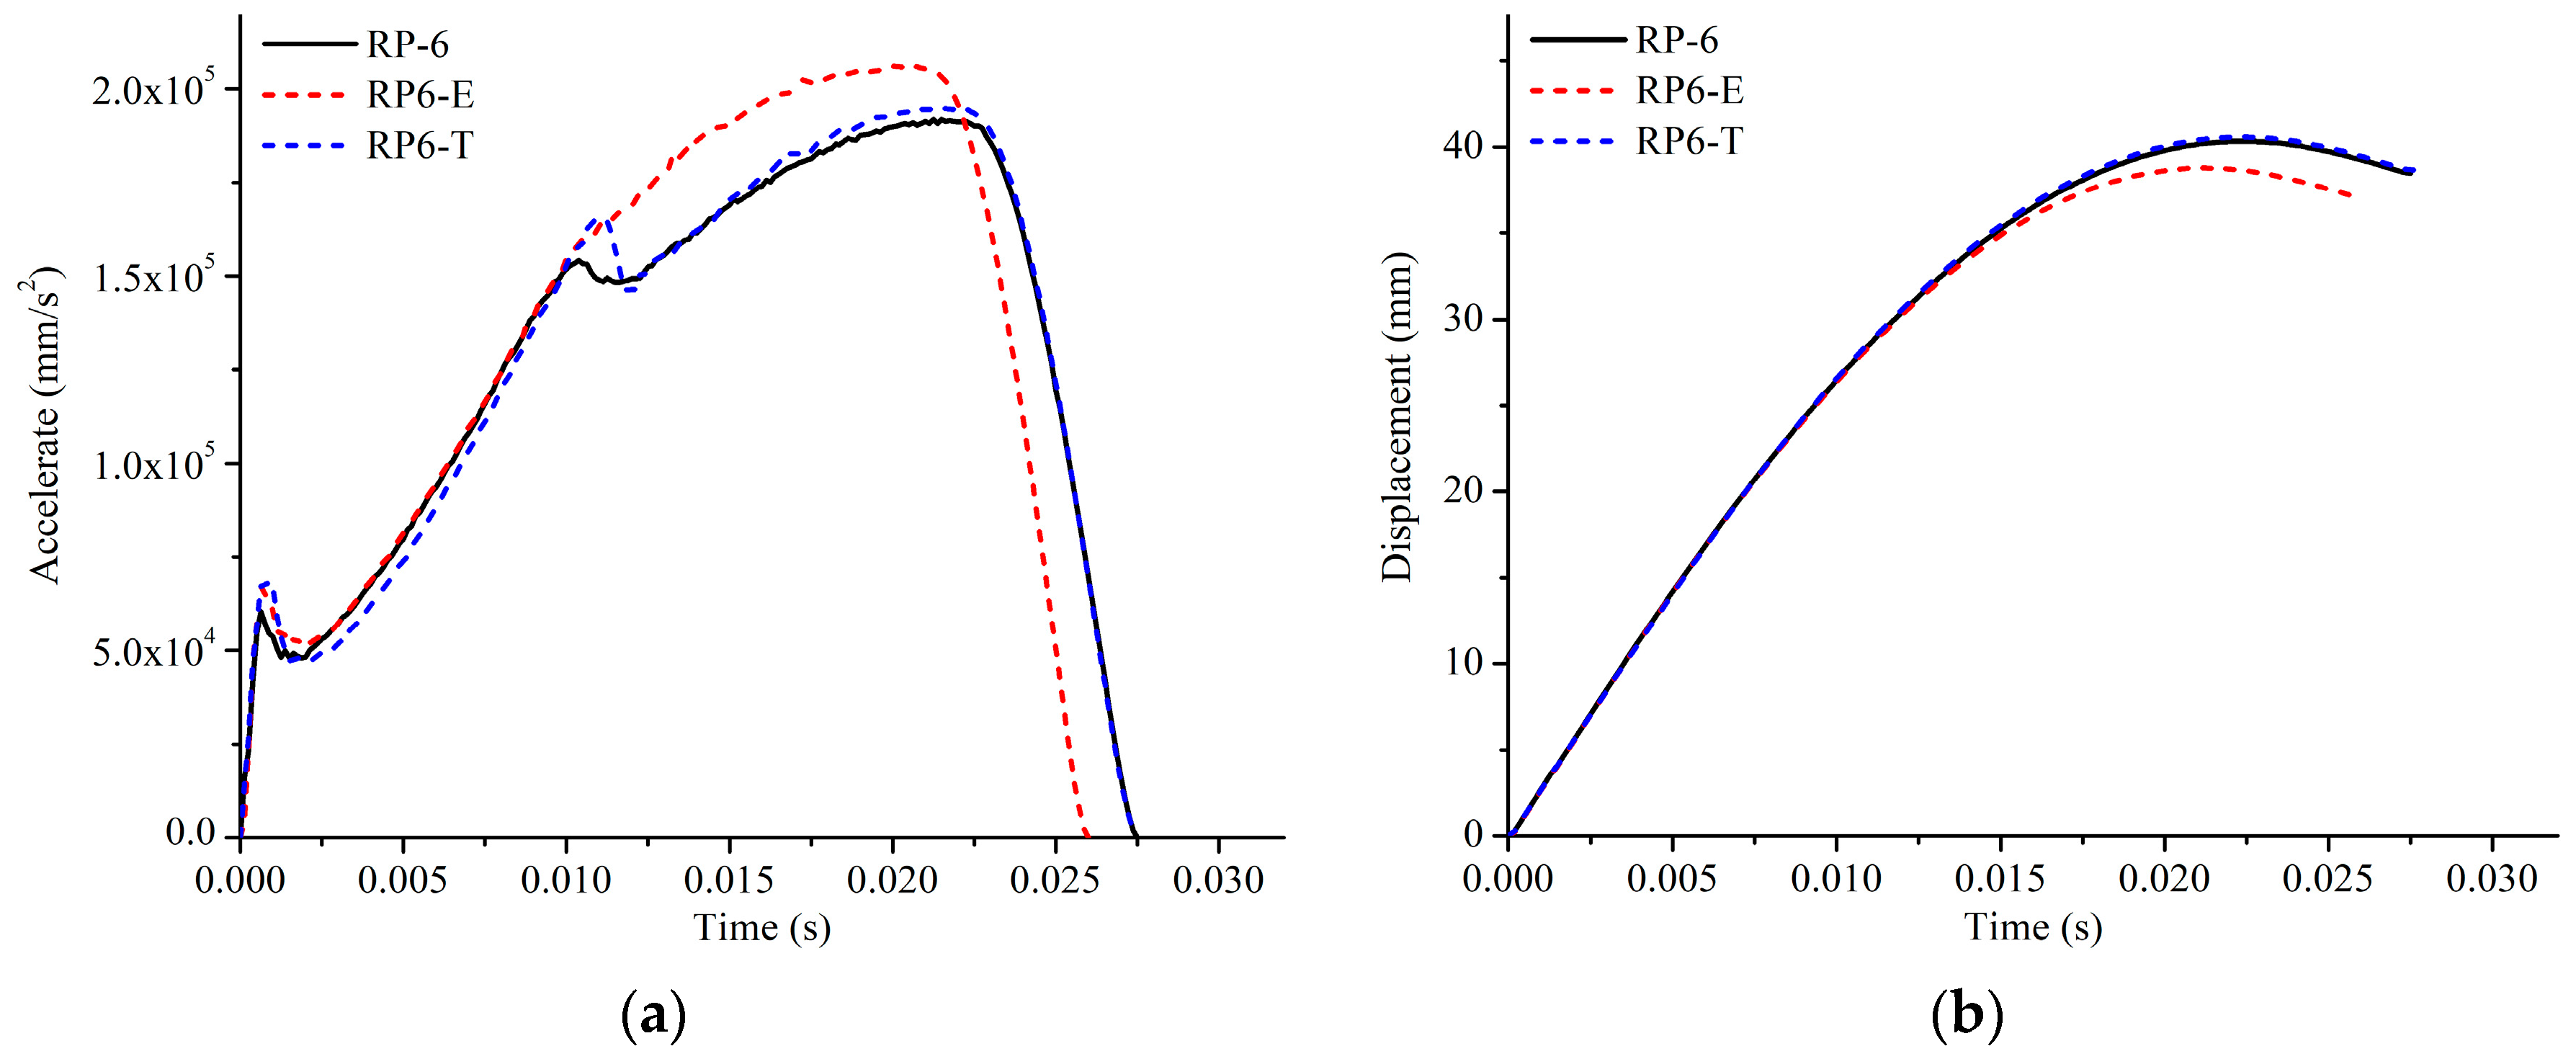
Table 15. Through preserving a consistent sectional area and static moment, the web dimensions of RP6-E were determined. Based on this, a distorted model, RP6-T, was created with a web thickness of 1.15 mm to maintain a consistent sectional area. The impact mass was calculated using Equations (23) and (24). Subsequently, numerical simulations were performed, the results of which are presented in Table 15. Furthermore, Figure 23 presents the acceleration and displacement history curves for the three simulation cases.
During the initial phase, a pronounced similarity to the reference model was observed in the distorted model RP6-E, which was characterized by a static moment and was sectional. However, as the impact event transitioned into a large deformation stage, RP6-E continued to display observable variations, as shown in Figure 23. Conversely, the distorted model RP6-T shows a behavior that closely mirrors that of the reference model, exhibiting a noticeable reduction in deviation compared to the other distorted models. In summary, it is deduced that the resistance force during impact, particularly during the substantial deformation stages, is significantly influenced by the web plate thickness. As a corollary, we propose Criterion 2 for reference models featuring larger web heights, urging the prioritization of aligning the web thickness as closely as possible to that of the reference model, followed by selecting a web height that maintains a consistent sectional area.

5.2. An Approximate Method to Estimate the Dominant Behavior during the Impact

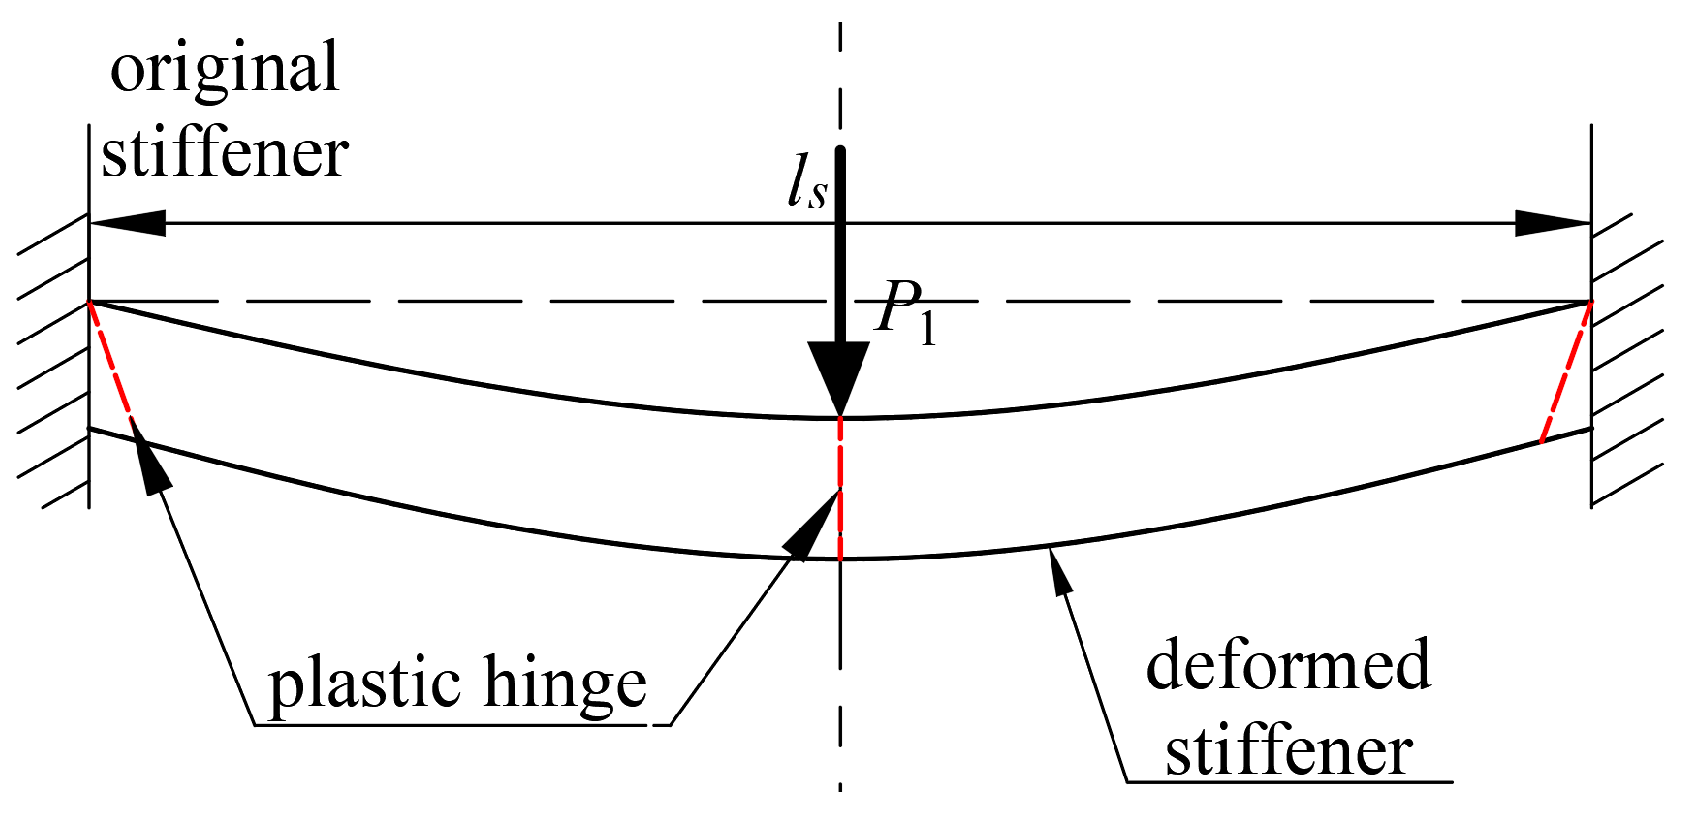
The effectiveness of the expanded criterion was verified for RP-6, which featured large web heights. However, it is crucial to establish clear conditions for determining suitable criteria for specific prototype structures based on their dominant behaviors. A straightforward method based on elastic–plastic theory was proposed to identify the dominant behavior of a prototype under impact loading. The static concentrated force that induces the plastic hinge formation for an integrated stiffener within a stiffened plate, as shown in Figure 24, can be estimated as follows:
M 0 = σ 0 S S = P 1 l S 8 P 1 = 8 σ 0 S S l S ,
where lS is the stiffener span length, and stress σ0 is taken as the average value of the yield stress σY and ultimate stress σu.
In addition, considerable research has been conducted on the buckling characteristics of web plates subjected to concentrated in-plane forces. Timoshenko [31] derived a formula for determining the critical buckling force (Pcr) of a rectangular plate with four simply supported edges subjected to a pair of concentrated compressive forces on opposite sides, as shown in Figure 25. The formula for a web plate during impact is expressed as follows:
P c r = 4 π D h w = π E t w 3 3 h w 1 ν 2 ,
where hw is the web girder depth and tw is the web girder thickness.
Given the specific boundary conditions and load case inherent in the analysis of the investigated stiffened plate, where a concentrated load was applied only from one side, it was imperative to modify the critical buckling force calculated from Equation (26). To achieve this, a coefficient derived from finite element (FE) results was introduced. By leveraging these numerical findings, a coefficient denoted as C = 1.324 is proposed to adaptively estimate the critical buckling force (Pcr-e) for the web plate in this study, as defined in Equation (27).
P c r e = C P c r = 1.324 P c r ,
Therefore, the ratio P1/Pcr-e, where P1 denotes the force that causes plastic hinge formation, is calculated to determine the threshold between the static moment-dominant and web thickness-dominant intervals Table 16 lists the relevant geometric parameters and analytical results for the static concentrated force P1, Pcr-e and ratio P1/Pcr-e. Based on the results of the finite element analysis, it is evident that when the ratio P1/Pcr-e of the reference model is less than 1.55 (RP-1~RP-5), the stiffener exhibits a more dominant behavior characterized by bending and membrane actions. In such cases, Criterion 1 was deemed more appropriate. Conversely, when the ratio P1/Pcr-e of the reference model exceeds 3.21 (RP-6), both the reference and distorted models exhibit a heavy buckle, functioning as a web girder. In these scenarios, Criterion 2 was more suitable, as shown in Table 16.

5.3. Criterion 3 for Prototype with an Intermediate Stiffener Web Height

With respect to the specified criteria for the intermediate range of the ratio P1/
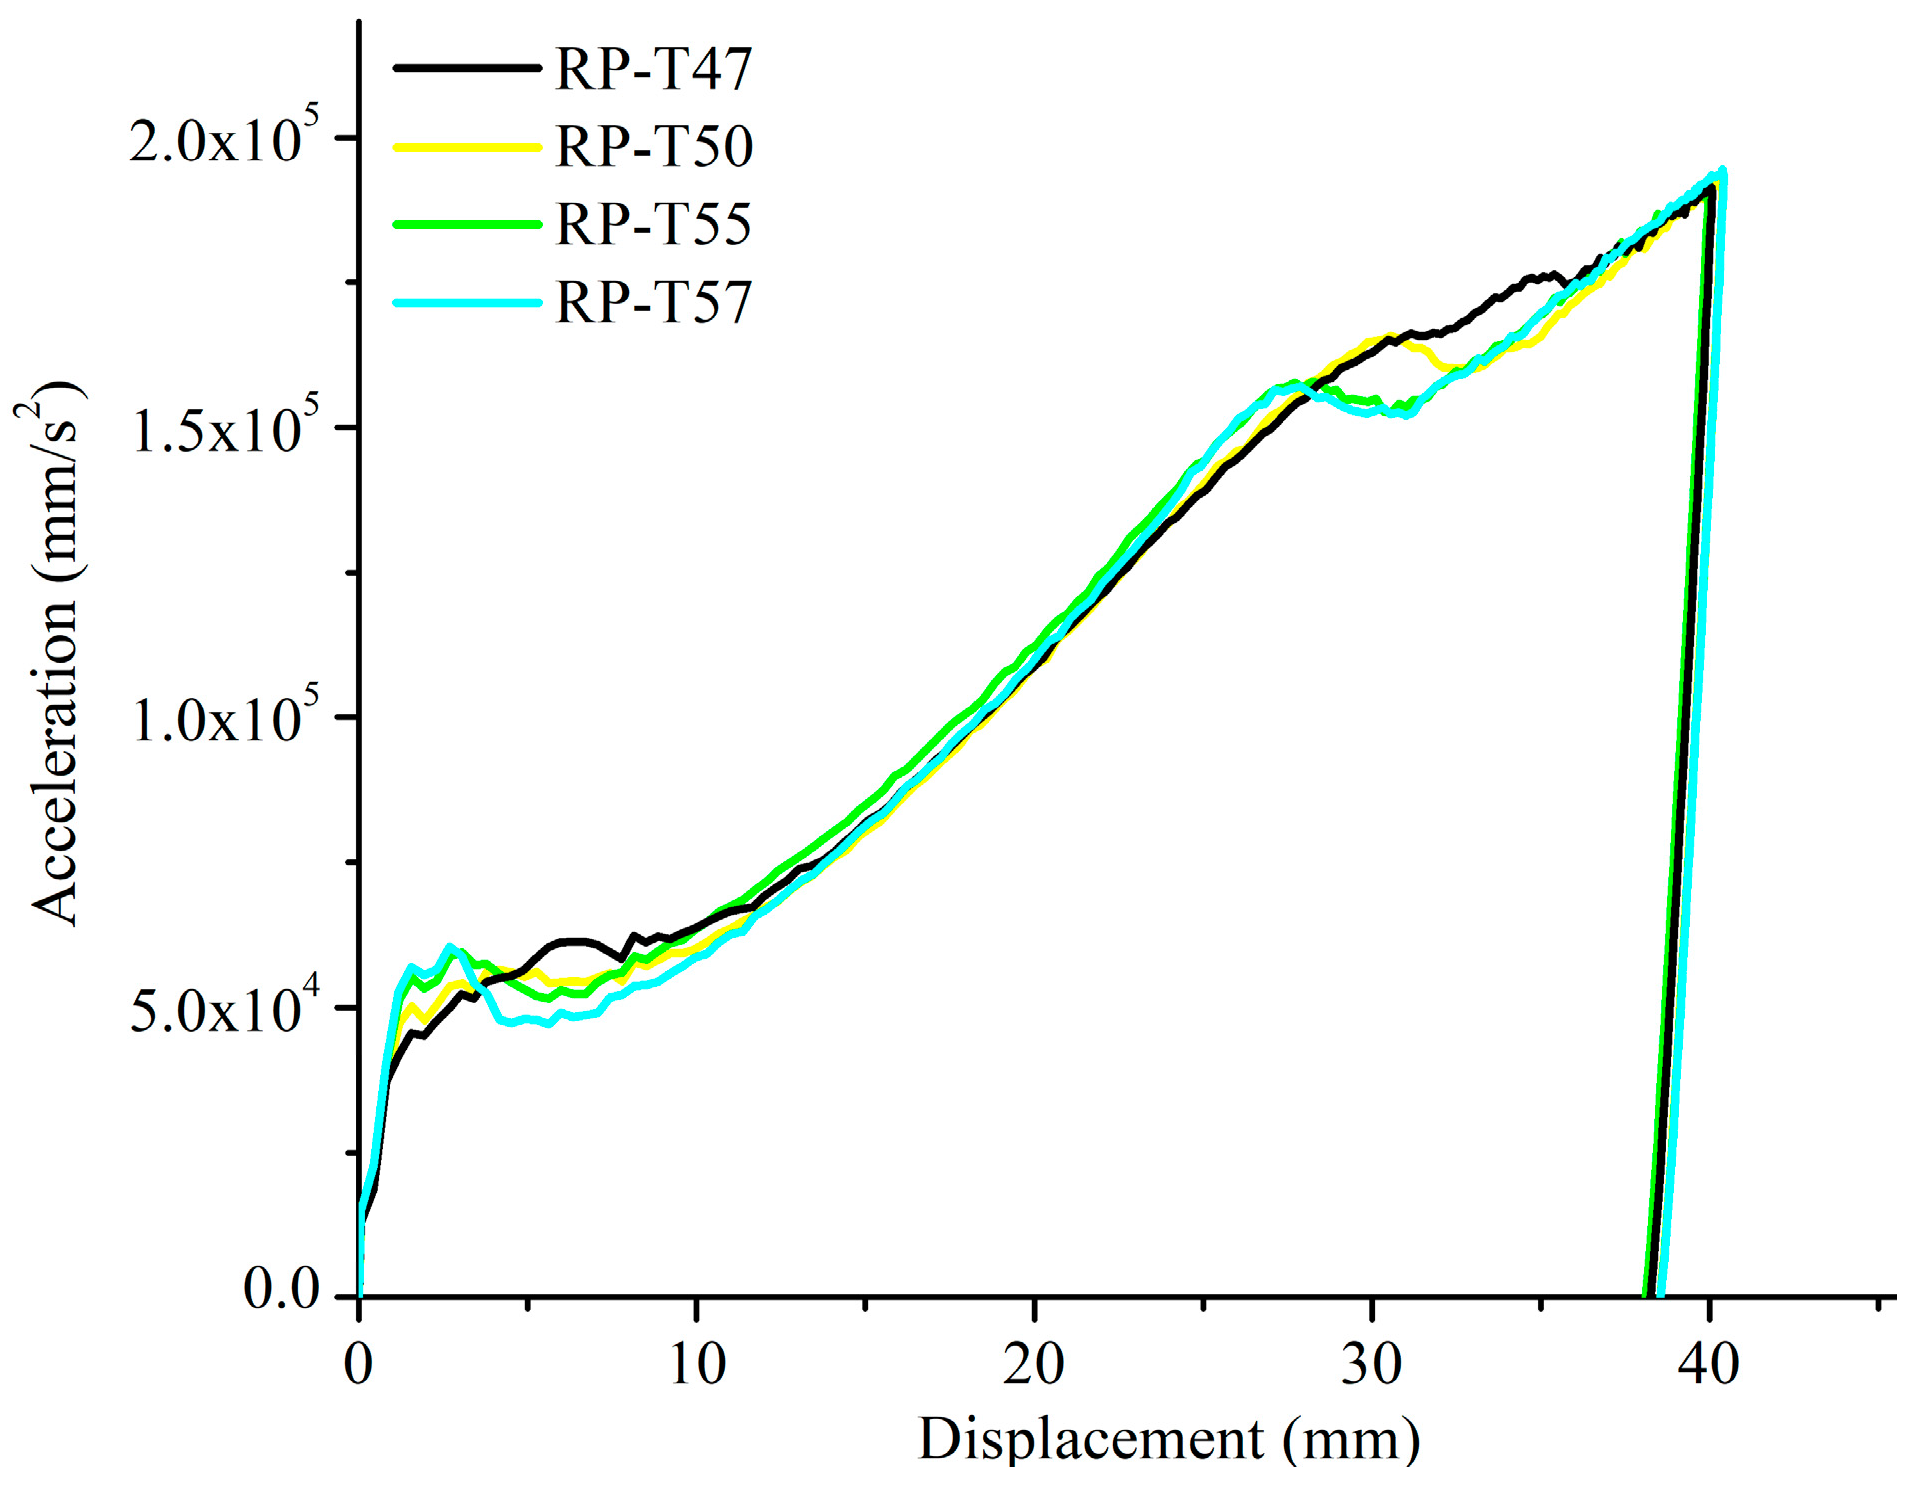
Pcr-e, spanning from 1.55 to 3.21, a distinct situation emerges warranting individual consideration. Within this intermediate range, prototypes are termed intermediate prototypes, and their corresponding perfectly similar models are referred to as intermediate reference models. To explore this range, reference models with web heights ranging from 47 mm to 57 mm are subjected to impact simulations under consistent conditions involving an impact mass of 0.4 t and an initial velocity of 3.0 m/s. The comprehensive details of the dimensions and numerical results for each reference model are illustrated in Table 17 and Figure 26. Furthermore, Figure 26 underscores the observation that the intermediate reference models, characterized by consistent web thicknesses, exhibit tendencies towards similar resistance behaviors, irrespective of the web depth and more obvious buckling behaviors as the web depth increases.
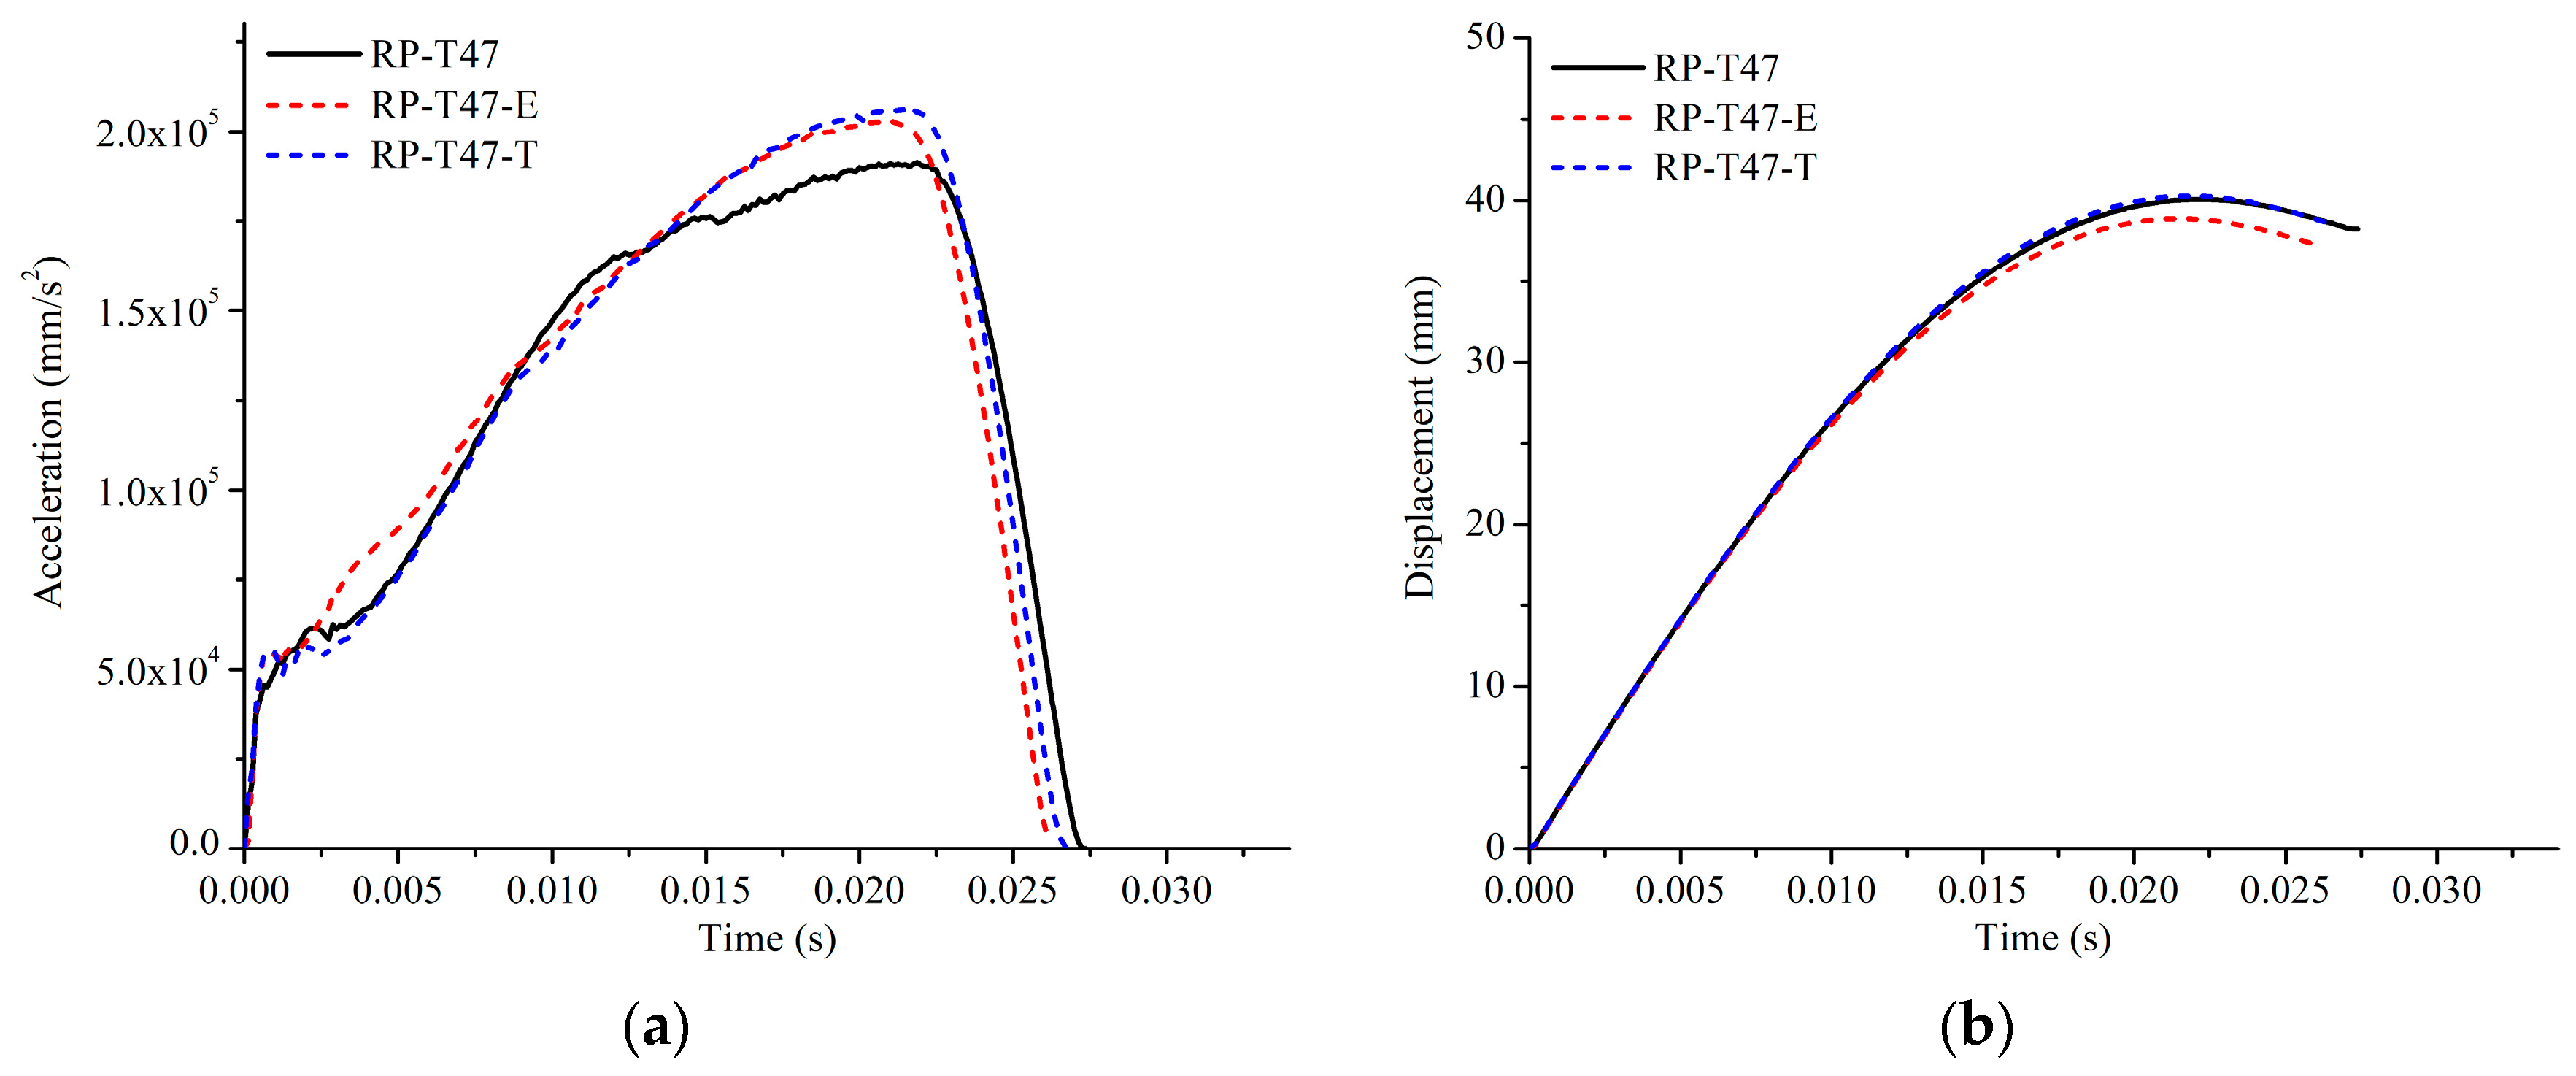
Furthermore, an investigation of distorted models related to the intermediate reference model RP-T47 was undertaken. These distorted models adhere to the proposed criteria, and comprehensive details regarding their dimensions are presented in Table 18. Similarly, RP-T47-E maintained sectional area and static moment consistent with RP-T47, whereas RP-T47-T developed with a constant web thickness of 1.15 mm, preserving the same sectional area as RP-T47. To maintain consistency, the impact mass was adjusted using Equations (23) and (24). Consequently, numerical simulations were conducted, and the results are presented in Table 18. Furthermore, Figure 27 presents the acceleration and displacement history curves for the three simulation cases.
The reference model RP-T47 experienced a notable buckling phenomenon, causing a sudden reduction in acceleration just before the peak crest (displacement = 30.48 mm), whereas the distorted models did not exhibit this behavior, leading to significant deviations. Consequently, the substantial deviations between these distorted models and the reference model demonstrate that the two proposed criteria are not suitable for intermediate models represented by RP-T47. This section presents an empirical method to determine the appropriate value of P1/Pcr-e, which forms the basis for Criterion 3 to address intermediate prototypes.
Importantly, owing to the different boundary conditions on the unloading side of the web plate, the suitable value of P1/Pcr-e for the flat-bar stiffener, corresponding to the static moment-dominant and web thickness-dominant intervals, differed from that of the T-type stiffener. Previous research indicates that prototypes with intermediate web height stiffeners tend to be web thickness-dominant. Consequently, the recommended value of the ratio P1/Pcr-e for the various prototypes should be related to the corresponding web thickness.
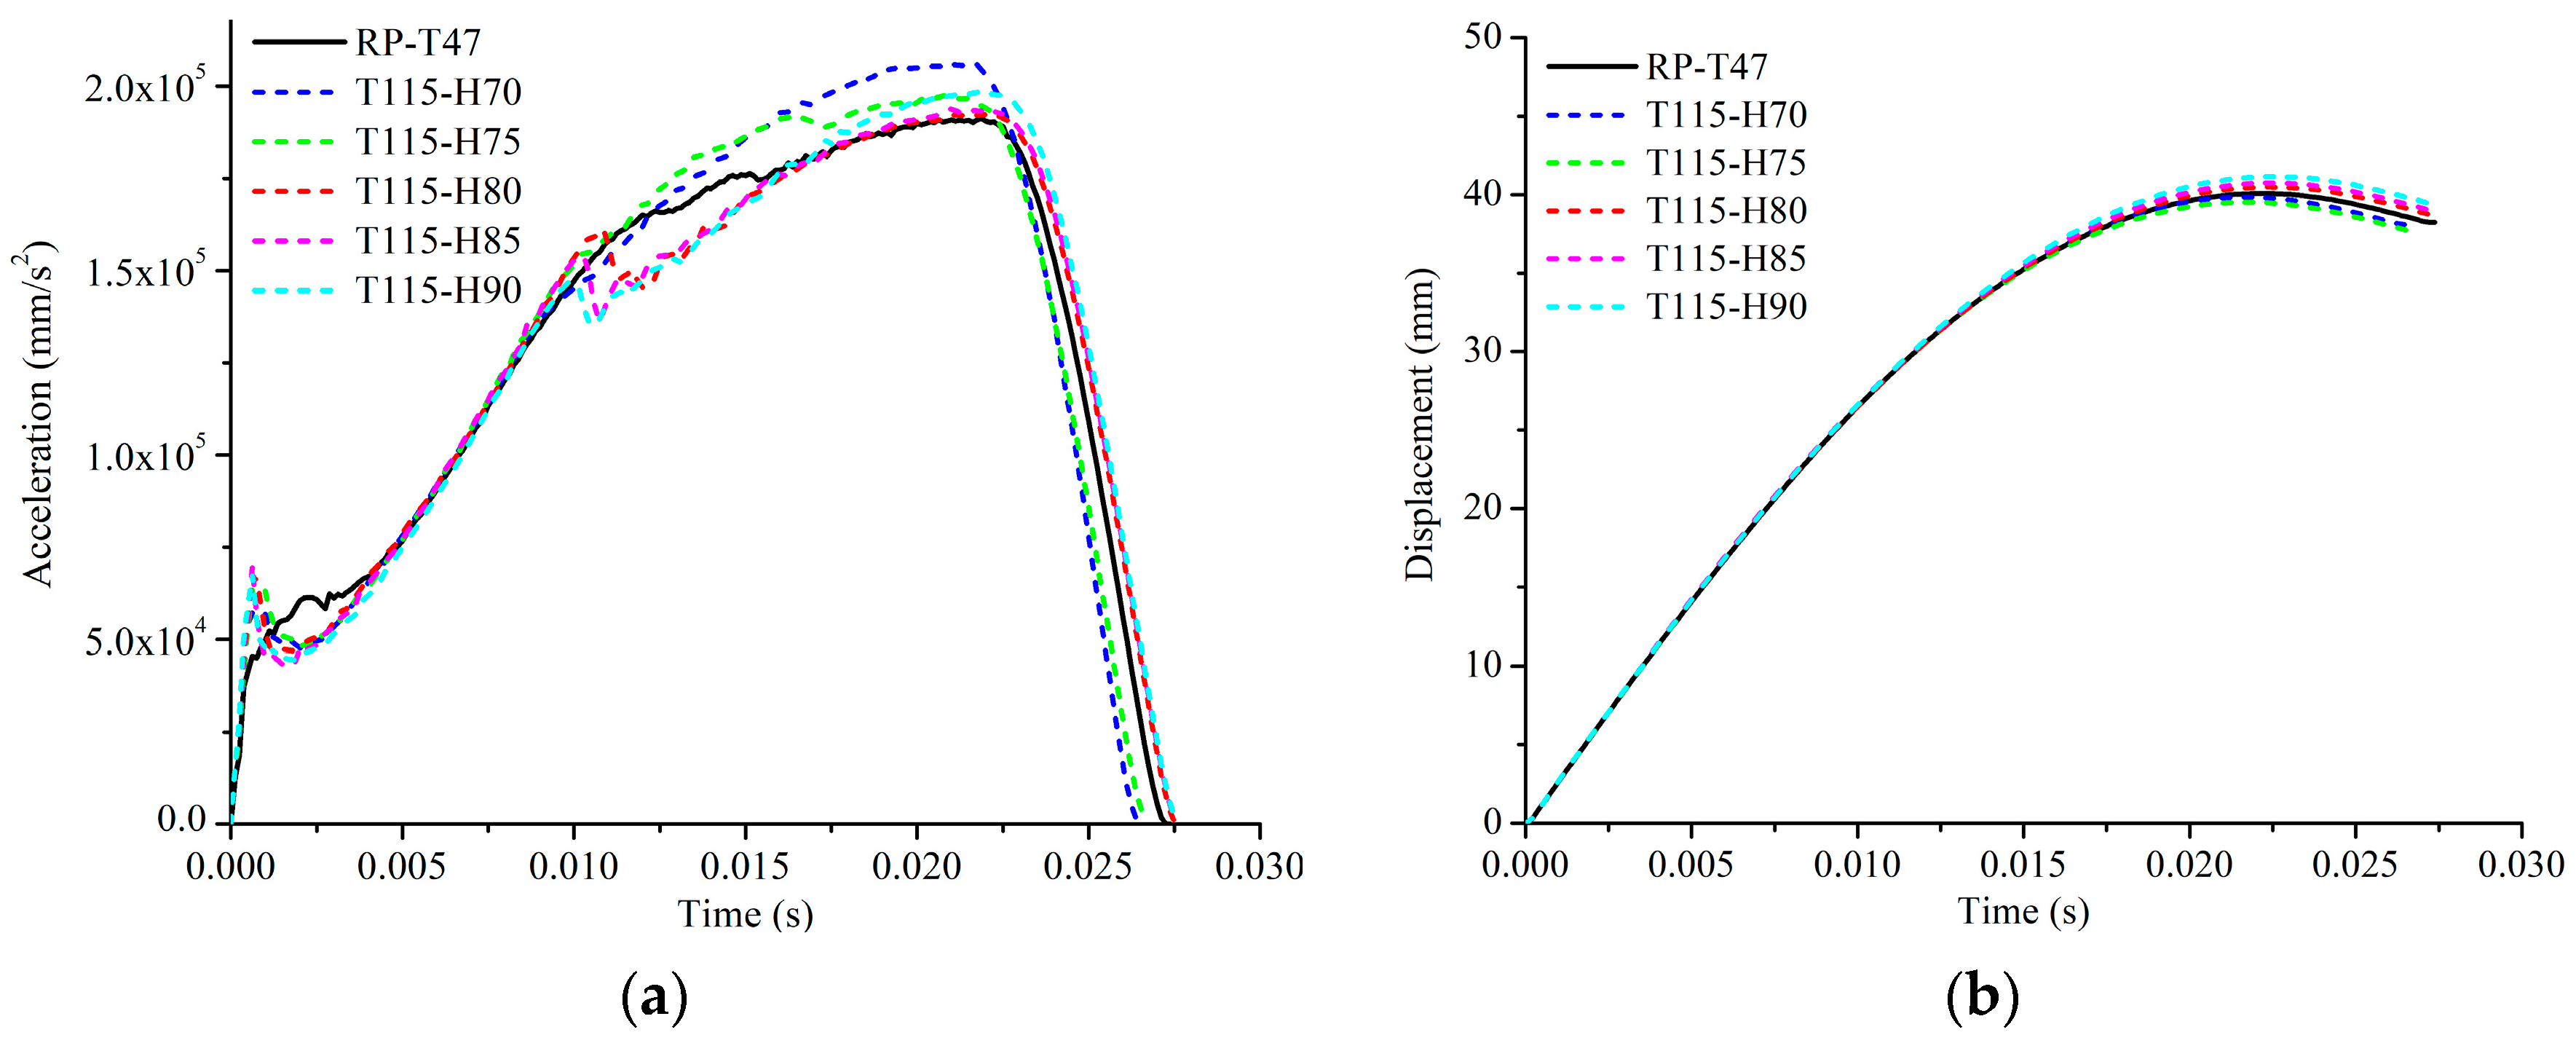
In this context, distorted models featuring flat-bar stiffeners, characterized by a web thickness of 1.15 mm and web heights ranging from 70 to 90 mm, were subjected to simulations. Table 19 provides detailed information on the dimensions and analytical results of the ratio P1/Pcr-e for these models. In this empirical investigation, the load case remains consistent across all simulations, involving an impact mass of 0.4 t and an impact velocity of 3.0 m/s. The corresponding numerical results are summarized and compared to RP-T47 (black solid line) and are presented in Table 19 and Figure 28.
Based on the finite element analysis results, it is apparent that the flat-bar stiffeners exhibit the most similar responses when the ratio P1/
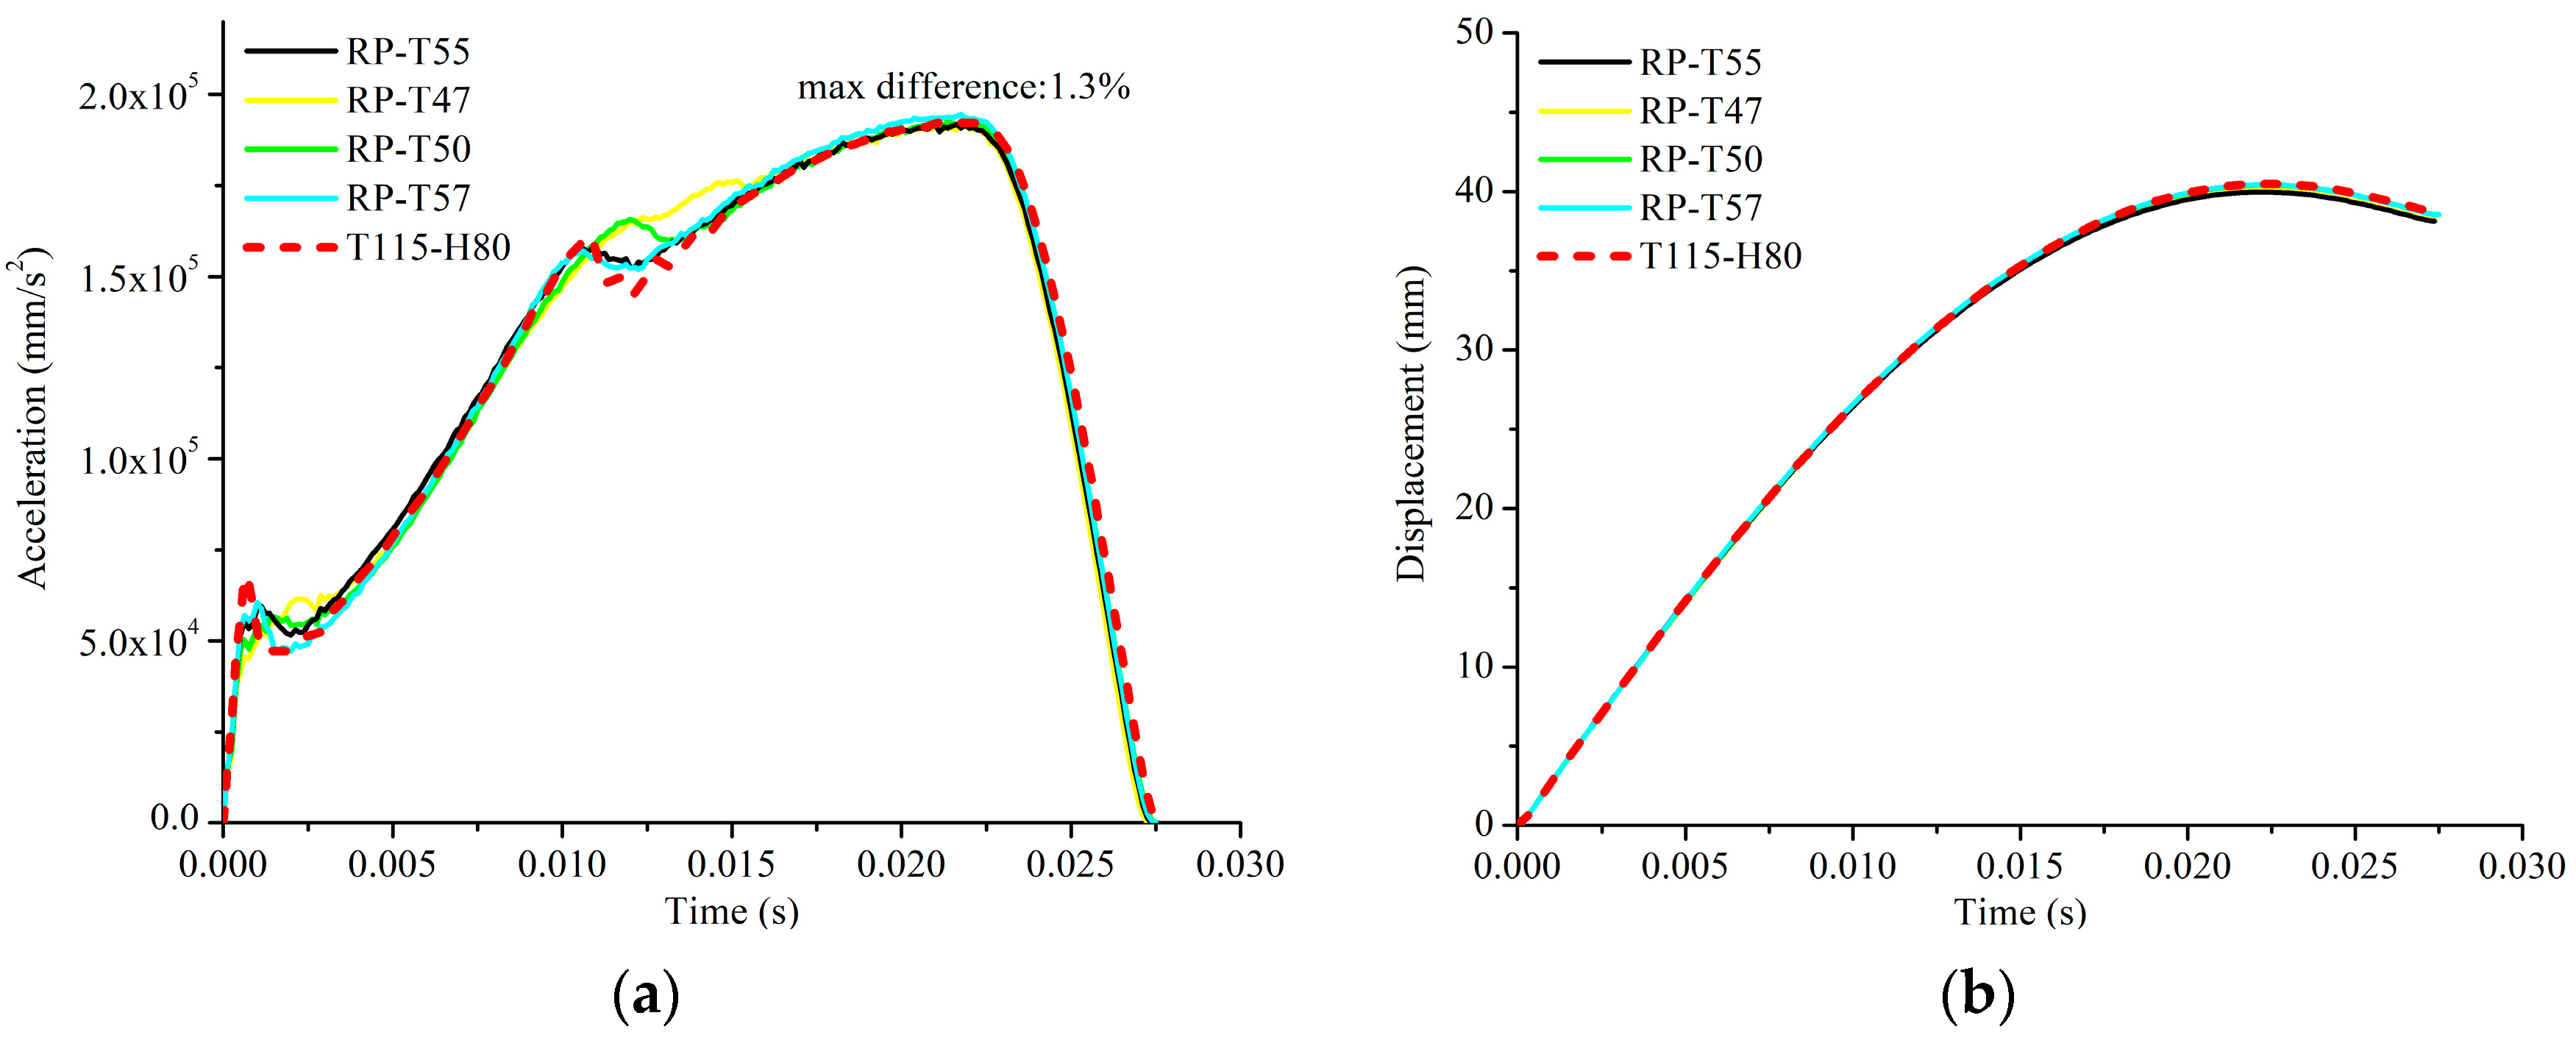
Pcr-e of the distorted model is 4.58 (T115-H80). Additionally, in Figure 29, the distorted model T115-H80 (red dashed line) is compared with the other intermediate reference models listed in Table 17. The maximum difference in the final displacement and peak acceleration between T115-H80 and the reference models was less than 1.30%.
Hence, it is recommended that the distorted model T115-H80, characterized by a ratio P1/Pcr-e of 4.58, aptly represents the dominant behavior within the intermediate range of the ratio P1/Pcr-e, spanning from 1.55 to 3.21, when the web thickness is 1.15 mm (see Table 16). Furthermore, by simplifying the sectional properties, the ratio P1/Pcr-e was inferred to be proportional to h w 3 / t w 2 . Under the identical procedure, the most suitable distorted model for the three supplementary groups of intermediate-stiffened plates reference models with consistent web thicknesses of 0.9 mm, 1.0 mm, and 1.1 mm were examined with various web heights. As a result, the minimum difference from the reference model was obtained by the web heights of 78 mm, 79 mm, and 80 mm, respectively, for the web thicknesses of 0.9 mm, 1.0 mm, and 1.1 mm, revealing a consistent trend in web height, primarily ranging from 78 to 80 mm, as shown in Figure 30. The blue square scatter represents the web height, and the blue circle scatters represent the ratio P1/Pcr-e of the most suitable distorted model across these groups.
Therefore, owing to the insensitivity of the web height in the previous group, the ratio P1/Pcr-e of the suggested distorted model was assumed to depend on the inverse square of the web thickness ( 1 / t w 2 ). As a result, an empirical equation for determining the ratio P1/Pcr-e of distorted models featuring flat-bar stiffeners in relation to the original web thickness of the reference model was assumed through previous numerical simulations as Equation (28) and illustrated in Figure 30.
P 1 / P c r e d = 0.8644 + 4.95 t w 2
Hence, Criterion 3 was devised based on the empirical equation, Equation (28), with the objective of adjusting the distorted models to possess a consistent web thickness and an appropriate ratio of P1/Pcr-e, while maintaining the same load case as the reference model.

5.4. Method of Corrected Similarity

Generally, three criteria were utilized to ensure that the significant geometric parameters of the stiffener remained consistent, which enabled a partial similarity in the dominant behavior and compensated for the distorted stiffener configuration in different situations.
Criterion 1: Maintain the sectional static moment and sectional area of the integrated stiffener consistent with the reference model; correct the impact mass using Equation (24) if necessary;
Criterion 2: Maintain the sectional area and web thickness of the integrated stiffener consistent with the reference model; correct the impact mass using Equation (24) if necessary;
Criterion 3: Maintain the web thickness of the integrated stiffener consistent with the reference model and the ratio P1/Pcr-e to satisfy the empirical equation, Equation (28), and maintain an impact mass consistent with the reference model.
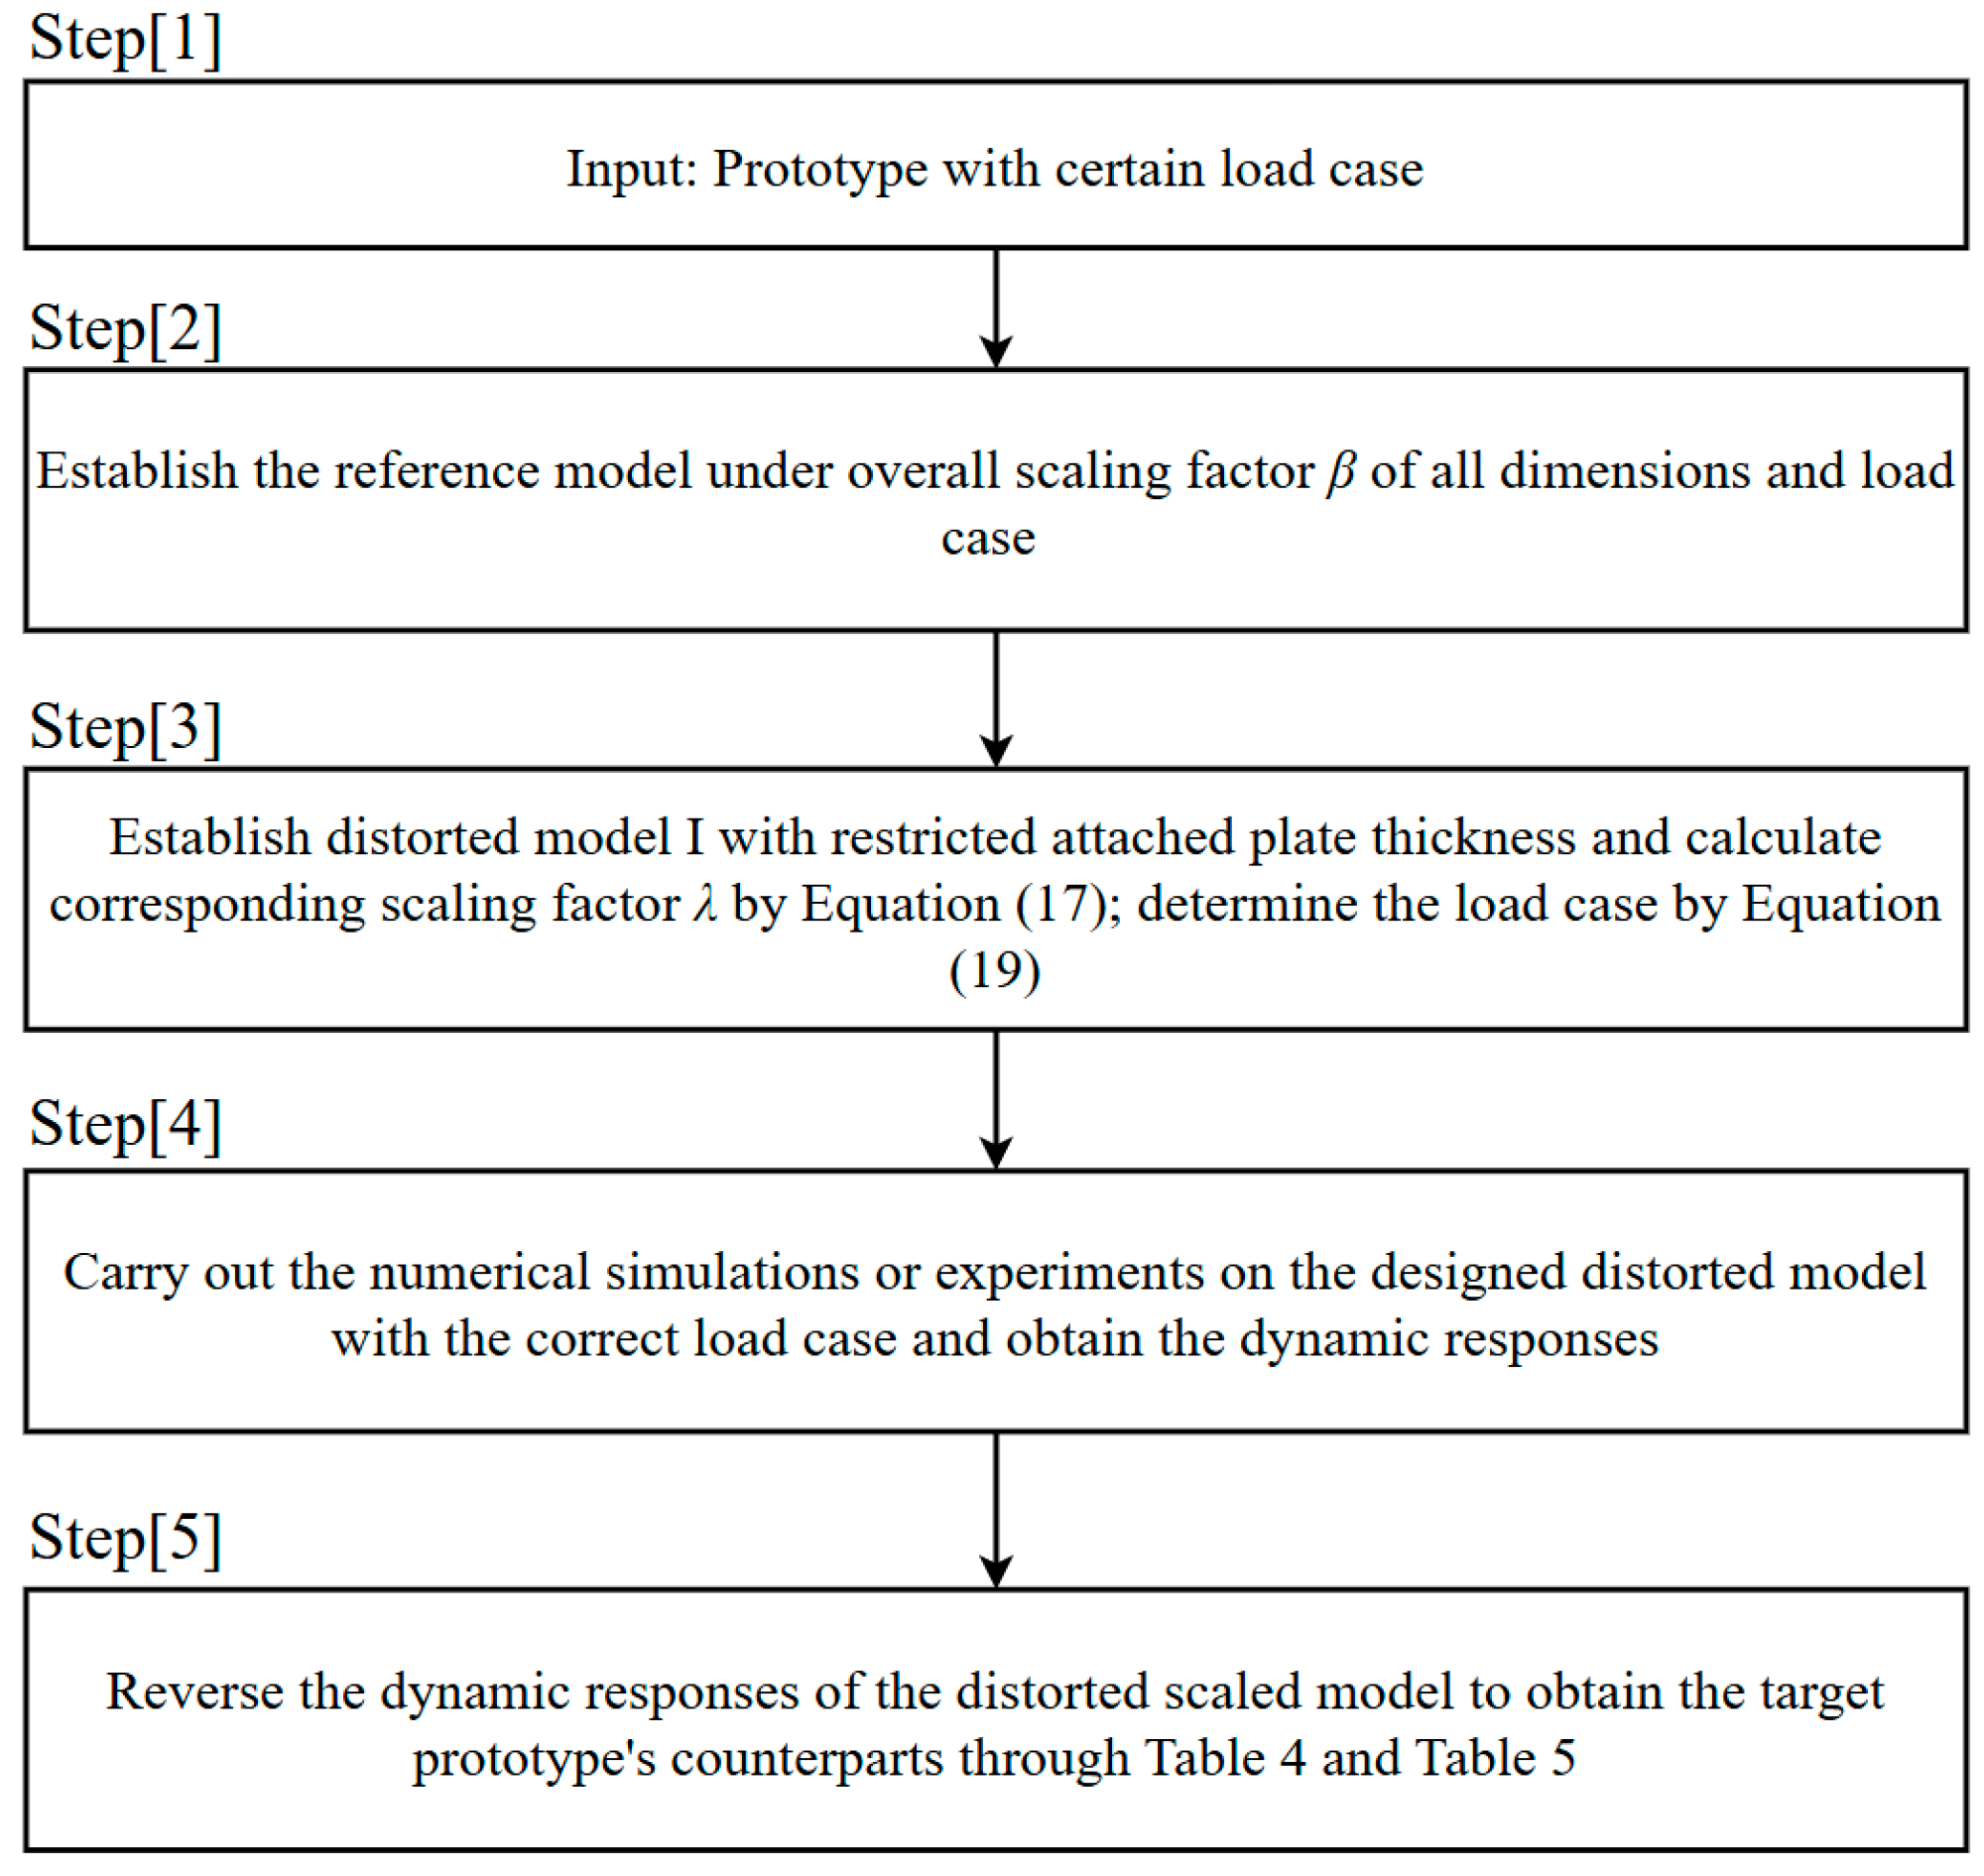
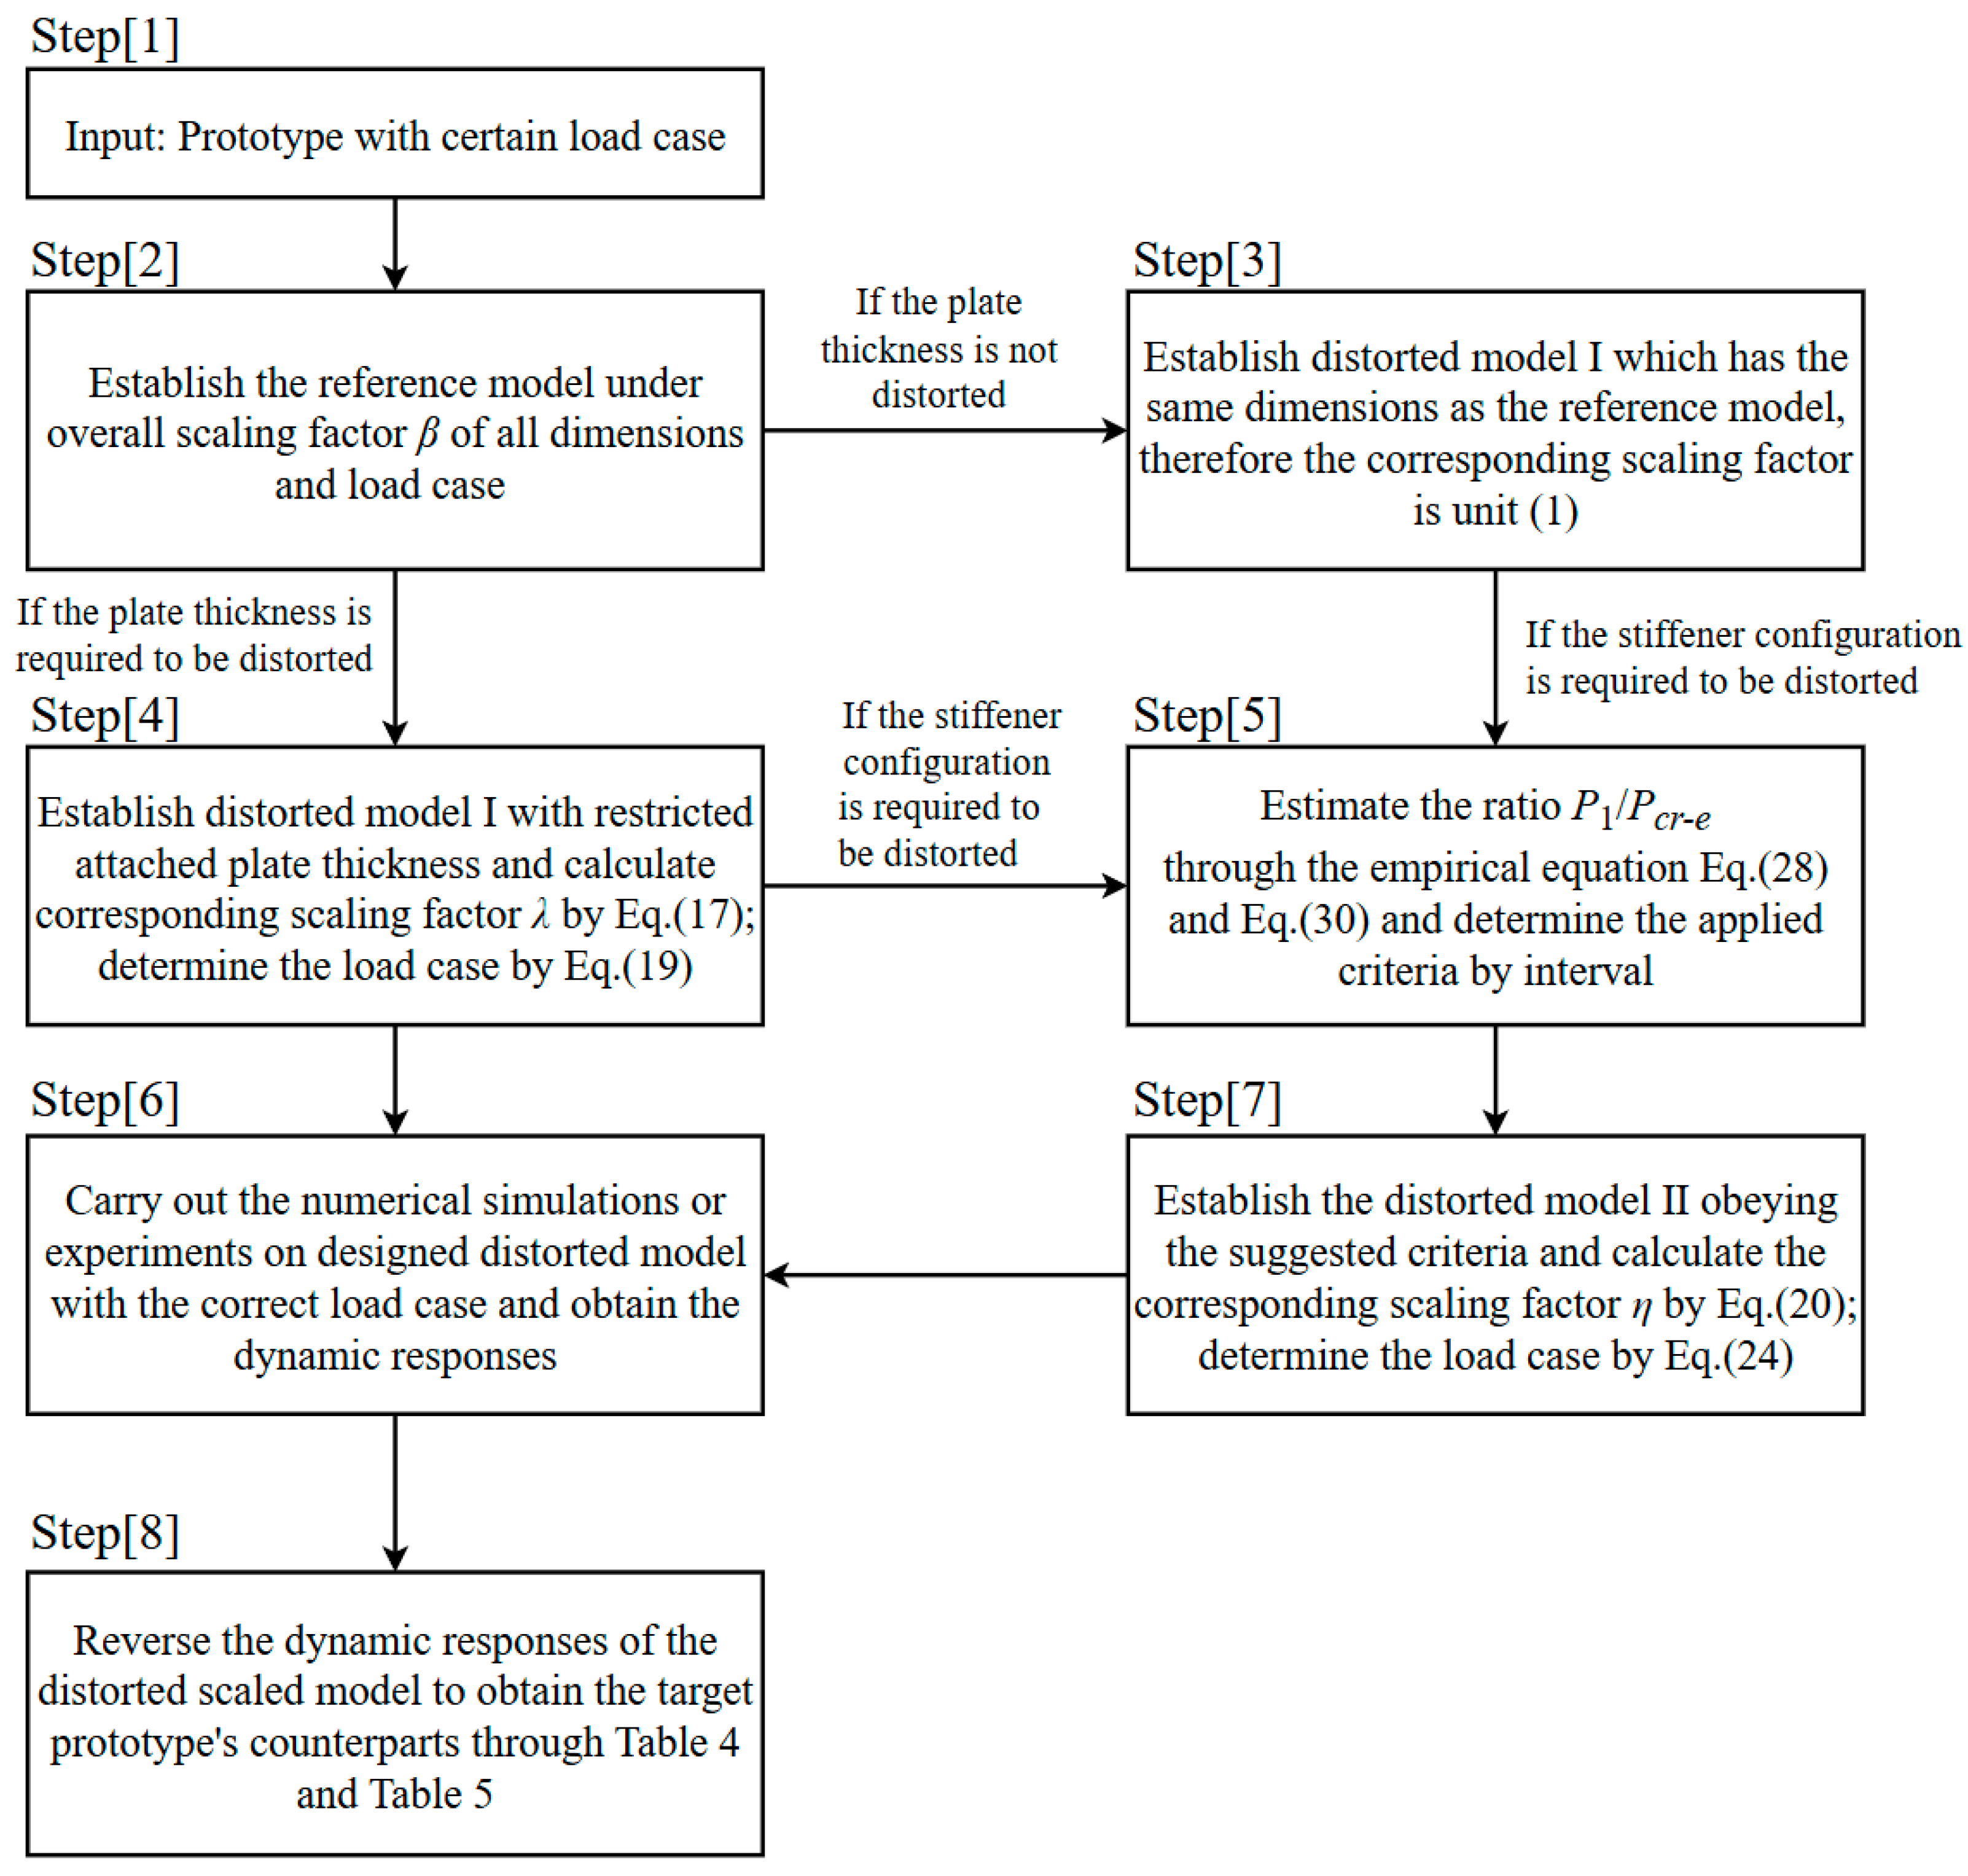
By addressing the complex distortion problem as two separate distortions, the correction procedure illustrated in flowchart Figure 31 facilitates comprehension and provides a visual representation.
The objective of the similarity procedure is to design a small-scale model exhibiting a reasonably distorted sectional configuration that differs from that of the prototype (Figure 31 [1]). This design is intended to be practical and attainable in experimental settings, making it convenient for conducting experiments. First of all, the target distorted small-scaled model provides a specific overall scaling factor β, which is determined as the ratio of the plate length of the prototype structure to the plate length of the target model. To ensure a perfect similarity between the target distorted small-scaled model and the prototype, the reference model is created with the same overall scaling factor β as the target distorted small-scaled model. This allows for a direct comparison and replication of their structural behavior and responses (Figure 31 [2]). The dimensions and load case of the reference model were identical, to be perfectly similar to those of the prototype. The related scaling factor between the reference model and prototype can be calculated using classic similarity laws, as presented in Table 4.
If the target distorted small-scaled model exhibits plate thickness distortion, the first step is to establish a distorted model I to account for the distorted thickness and calculate the corresponding scaling factor λ through Equation (17) (Figure 31 [4]). Once the designed distorted model I was established by incorporating the distorted plate thickness and stiffener dimensions consistent with the reference model, the next step was to determine the corrected load case for this model. This can be achieved using Equation (19), while ensuring that the impact velocity remains the same as that of the reference model. Subsequently, simulations or experiments are conducted on distorted model I to obtain its dynamic responses (Figure 31 [6]), which can be reversed to reflect the behavior of the prototype using Equation (17), Table 4 and Table 5 (Figure 31 [8]).
On the basis of distorted model I, if the target distorted small-scaled model features a different stiffener configuration, distorted model II should be established (Figure 31 [5]). This model maintains the same attached plate thickness as distorted model I but incorporates distorted flat-bar stiffeners whose dimensions are determined, meeting the selected criteria. By utilizing the empirical equations in Equations (25) and (27) to calculate the static concentrated force P1 and critical buckling force Pcr-e, a direct method for estimating the dominant behavior in the reference model was established based on the threshold ratio of P1/Pcr-e from 1.55 to 3.21. This threshold serves as a criterion for distinguishing between the dominance of the static moment and the web thickness in the model.
For the static moment-dominant structure (P1/Pcr-e < 1.55), Criterion 1 ensures that the dimensionless number Π 6 (the sectional area) and Π 7 (the static moment) are preserved, partially maintaining consistent geometric properties with the distorted model. For the web thickness-dominant structure (P1/Pcr-e > 3.21), Criterion 2 was employed, focusing on achieving consistency in the web thickness and sectional area, as per previous studies on web girders. It is important to note that for the intermediate range of P1/Pcr-e, specifically 1.55 to 3.21, the proposed criteria exhibit significant deviations when predicting the behaviors of the reference model. The empirical method, denoted as Criterion 3, to obtain a distorted model involves designing a proper flat bar that satisfies the empirical ratio P1/Pcr-e through Equation (28), while maintaining a consistent web thickness, to achieve a similar tendency in buckling behavior (Figure 31 [7]).
In the case where the target distorted small-scaled model exhibits distortion solely in the stiffener configuration, the corresponding distorted model I is established with dimensions identical to the reference model, resulting in a series of related scaling factors (λX) equal to 1, as previously defined (Figure 31 [3]). Subsequently, this distorted model I is subjected to the same correction procedure to calculate the ratio of P1/Pcr-e, as defined earlier (Figure 31 [5]). By implementing the same correction procedure stated in Figure 31 [7], distorted model II, featuring flat-bar stiffeners, is designed to meet the proper criteria based on the threshold ratio of P1/Pcr-e.
Consequently, the dynamic behaviors of distorted model II faithfully replicate those of distorted model I. Subsequently, the resistance responses can be employed to predict those of the prototype using Equation (17), along with reference to Table 4 and Table 5 (Figure 31 [8]).

6. Conclusions

This paper presents an investigation of an enhanced similarity law governing stiffened plates made of ductile material under impact loads before structural failure, employing an improved approach that incorporates double input parameters encompassing load case and geometry. In comparison to the existing methodologies, this approach offers a rapid and applicable methodology for accurately reproducing the dynamic responses of prototype stiffened plates that consist of thin plates, using distorted scaled models. This method expands the application range of similarity laws and enables distorted scaled models that meet experimental limitations to reflect prototypes’ resistance behaviors.
Two distinct concepts of distorted scaled models were introduced: distorted model I (characterized by a distorted attached plate thickness) and distorted model II (characterized by a distorted stiffener configuration). For the load case input parameters, both distorted models I and II were considered, thereby applying a correction to the impact mass using a factor derived from a dimensionless number associated with the structural mass. Moreover, three design criteria were formulated to govern the geometric attributes of the integrated stiffeners, emphasizing the restricted sectional static moment, area, and web thickness, which align with the corresponding dominant behaviors of the stiffened plate.
To further enhance the designing accuracy of distorted stiffener configurations according to the proposed criteria, an approximate semi-empirical method based on the elastic–plastic theory was introduced. This method employed the ratio P1/Pcr-e, which is linked to two critical forces: one driving the plastic hinge formation in the integrated stiffener section (P1) and the other representing the critical buckling force of the stiffener web plate (Pcr-e). Three distinct intervals of the P1/Pcr-e ratio were introduced, enabling the characterization of the varying dominant behaviors and their corresponding design criteria. Additionally, it is noted that careful discussion is required for the recommended value of the interval of ratio P1/Pcr-e to design the corresponding distorted model for prototypes with extreme dimensions, since it is based on empirical observations.
Thus, the enhanced similarity law demonstrated versatility, reliability, and accuracy through extensive investigations across a wide range of stiffened plates. The comprehensive analysis of dominant behaviors during impact events contributes to an improved understanding of the suitable criteria for designing distorted stiffener configurations.

Author Contributions

Conceptualization, H.Z. and T.O.; methodology, H.Z., T.O. and Y.K.; software, H.Z. and G.H.; validation, H.Z.; formal analysis, H.Z.; investigation, H.Z.; writing—original draft preparation, H.Z.; writing—review and editing, H.Z., T.O., Y.K. and D.W.; visualization, H.Z.; supervision, T.O., Y.K. and D.W. All authors have read and agreed to the published version of the manuscript.

Funding

This research received no external funding.

Institutional Review Board Statement

Not applicable.

Informed Consent Statement

Not applicable.

Data Availability Statement

The original contributions presented in the study are included in the article; further inquiries can be directed to the corresponding author.

Acknowledgments

The authors gratefully acknowledge the China Scholarship Council for supporting this study (Grant number: 202206230003).

Conflicts of Interest

The authors declare no conflicts of interest.

Correction Statement

This article had been republished with a minor correction to the existing affiliation number. This change does not affect the scientific content of the article.

Nomenclature

Roman symbolsGreek symbols
AAccelerationβOverall scaling factor
ASCross-sectional area of integrate stiffenerβXClassic scaling factor for X
bHalf-length of a web girderδDisplacement
b1One side length of a web girderεStrain
b2One side length of a web girderεfFracture strain
bfFlange breadthεnNecking strain
bpAttached plate breadth of integrate stiffener ε ˙ Strain rate
CEmpirical constantηXScaling factor for X in distorted model II
DCowper–Symonds coefficientλXScaling factor for X in distorted model I
DBBending stiffnessνPoisson’s ratio
EEnergyΠDimensionless numbers
FForceρDensity
FmMean resistance force of a web girderσStress
HFold height of a web girderσYYield stress
hfFlange thicknessσ0Quasi-static flow stress
hpAttached plate thicknessσdDynamic flow stress considering strain rate effect
hwStiffener web heightσuUltimate tensile strength
KStrength coefficient
LLength of plate
lSLength of stiffener
MIImpact massSubscripts
MSStructural mass()d1Distorted model I
M0Plastic bending moment for cross-sections()d2Distorted model II
NStiffeners number()mModel
N0Fully plastic axial force for cross-sections()pPrototype
nStrain-hardening index
qCowper–Symonds constant
P1Critical force which causes plastic hinge formation
PcrCritical buckling force
Pcr-eEmpirical critical buckling force
RIImpact indenter radius
SSStatic moment of integrate stiffener
TTime
twStiffener web thickness
v0Initial impact velocity

References

  1. Sun, B.; Hu, Z.; Wang, G. An analytical method for predicting the ship side structure response in raked bow collisions. Marine Struct. 2015, 41, 288–311. [Google Scholar] [CrossRef]
  2. Samuelides, M. Recent advances and future trends in structural crashworthiness of ship structures subjected to impact loads. Ships Offshore Struct. 2015, 10, 488–497. [Google Scholar] [CrossRef]
  3. Hong, L.; Amdahl, J. Crushing resistance of web girders in ship collision and grounding. Marine Struct. 2008, 21, 374–401. [Google Scholar] [CrossRef]
  4. Tavakoli, S.; Khojasteh, D.; Haghani, M.; Hirdaris, S. A review on the progress and research directions of ocean engineering. Ocean Eng. 2023, 272, 113617. [Google Scholar]
  5. Zhang, W.; Wang, Y.; Du, J.Y. Research on similarity of dynamic response of ship grillage subjected to transient load. Acta Armamentarii 2010, 31, 172–178. [Google Scholar]
  6. Jones, N. ProQuest. In Structural Impact, 2nd ed.; Cambridge University Press: New York, NY, USA, 2012. [Google Scholar]
  7. Buckingham, E. Model experiments and the forms of empirical equations. Trans. Amer. Soc. Mech. Eng. 1915, 37, 263–296. [Google Scholar] [CrossRef]
  8. Szirtes, T. Applied Dimensional Analysis and Modeling, 2nd ed; Butterworth-Heinemann: Oxford, UK, 2007; Volume 25, pp. 659–665. [Google Scholar]
  9. Barenblatt, G.I. Scaling; Cambridge University Press: Cambridge, UK, 2003. [Google Scholar]
  10. Zhou, H.; Wang, D. Corrected similarity laws of stiffened panels considering geometric distortion under low speed impact load. Ocean Eng. 2021, 240, 109937. [Google Scholar] [CrossRef]
  11. Oshiro, R.; Alves, M. Predicting the behaviour of structures under impact loads using geometrically distorted scaled models. J. Mech. Phys. Solids 2012, 60, 1330–1349. [Google Scholar] [CrossRef]
  12. Booth, E.; Collier, D.; Miles, J. Impact Scalability of Plated Steel Structures; Jones, N., Wierzbicki, T., Eds.; Structural Crashworthiness: London, UK, 1983; pp. 136–174. [Google Scholar]
  13. Oshiro, R.; Alves, M. Scaling impacted structures. Arch. Appl. Mech. 2004, 74, 130–145. [Google Scholar] [CrossRef]
  14. Alves, M.; Oshiro, R.E. Scaling the impact of a mass on a structure. Int. J. Impact Eng. 2006, 32, 1158–1173. [Google Scholar] [CrossRef]
  15. Oshiro, R.E.; Alves, M. Scaling of cylindrical shells under axial impact. Int. J. Impact Eng. 2007, 34, 89–103. [Google Scholar] [CrossRef]
  16. Wang, Z.; Kong, X.S.; Wu, W.G. Corrected similarity method for designing scaled-down stiffened plate subjected to compression load with improved processing feasibility. Thin-Walled Struct. 2023, 192, 111201. [Google Scholar] [CrossRef]
  17. Ma, H.; Kawamura, Y.; Okada, T.; Wang, D.; Hayakawa, G. A general scaled model design method of stiffened plate subjected to combined longitudinal compression and lateral pressure considering the ultimate strength and collapse modes. Marine Struct. 2023, 90, 103435. [Google Scholar] [CrossRef]
  18. Wang, Z.; Yuan, T.; Kong, X.S.; Wu, W. A universal similarity method and design procedure for buckling assessment of stiffened plates under compression load on real ships. Thin-Walled Struct. 2022, 181, 110025. [Google Scholar] [CrossRef]
  19. Yuan, T.; Yang, Y.; Kong, X.S.; Wu, W. Similarity criteria for the buckling process of stiffened plates subjected to compressive load. Thin-Walled Struct. 2021, 158, 107183. [Google Scholar] [CrossRef]
  20. Xu, M.C.; Song, Z.J.; Pan, J. Study on the similarity methods for the assessment of ultimate strength of stiffened panels under axial load based on tests and numerical simulations. Ocean Eng. 2021, 219, 108294. [Google Scholar] [CrossRef]
  21. Cho, U.; Dutson, A.J.; Wood, K.L.; Crawford, R.H. An advanced method to correlate scale models with distorted configurations. J. Mech. Des. 2005, 127, 78–85. [Google Scholar] [CrossRef]
  22. Mazzariol, L.M.; Alves, M. Similarity laws of structures under impact load: Geometric and material distortion. Int. J. Mech. Sci. 2019, 157–158, 633–647. [Google Scholar] [CrossRef]
  23. Kong, X.; Li, X.; Zheng, C.; Liu, F.; Wu, W.-G. Similarity considerations for scale-down model versus prototype on impact response of plates under blast loads. Int. J. Impact Eng. 2016, 1, 32–41. [Google Scholar] [CrossRef]
  24. Kong, X.; Zhou, H.; Kuang, Z.; Zheng, C.; Li, X.; Wu, W.; Guan, Z. Corrected method for scaling the dynamic response of stiffened plate subjected to blast load. Thin-Walled Struct. 2020, 159, 107214. [Google Scholar] [CrossRef]
  25. Cho, S.R.; Lee, H.S. Experimental and analytical investigations on the response of stiffened plates subjected to lateral collisions. Marine Struct. 2009, 22, 84–95. [Google Scholar] [CrossRef]
  26. Chang, X.; Xu, F.; Feng, W.; Li, X.; Liu, X. Similarity laws of geometric distortion for stiffened plate under low velocity impact loads. Thin-Walled Struct. 2024, 199, 111830. [Google Scholar] [CrossRef]
  27. Wang, S.; Xu, F.; Dai, Z. Suggestion of the DLV dimensionless number system to represent the scaled behavior of structures under impact loads. Arch. Appl. Mech. 2020, 90, 707–719. [Google Scholar]
  28. Ringsberg, J.W.; Amdahl, J.; Chen, B.Q.; Cho, S.R.; Ehlers, S.; Hu, Z.; Kubiczek, J.M.; Kõrgesaar, M.; Liu, B.; Marinatos, J.N.; et al. MARSTRUCT benchmark study on nonlinear FE simulation of an experiment of an indenter impact with a ship side-shell structure. Marine Struct. 2018, 59, 142–157. [Google Scholar] [CrossRef]
  29. Hogstroem, P.; Ringsberg, J.W. An extensive study of a ship’s survivability after collision—A parameter study of material characteristics, non-linear FEA and damage stability analyses. Marine Struct. 2012, 27, 1–28. [Google Scholar] [CrossRef]
  30. Gao, Z.; Song, Y.; Hu, Z. The resistance of ship web girders in collision and grounding. Math. Probl. Eng. 2014, 2014, 720542. [Google Scholar] [CrossRef]
  31. Timoshenko, S.P.; Gere, J.M. Theory of Elastic Stability, 2nd ed.; McGraw-Hill: New York, NY, USA, 1961; pp. 386–389. [Google Scholar]
Figure 1. Schematic of common distortions between prototype and scaled model.
Applsci 14 06265 g001
Figure 2. Ship bow-side collision scenario.
Applsci 14 06265 g002
Figure 3. Schematic and dimensions of prototype struck system (unit: mm).
Applsci 14 06265 g003
Figure 4. Assembly and restrictions of FE model.
Applsci 14 06265 g004
Figure 5. Displacement and acceleration applied in prototype stiffened plate.
Applsci 14 06265 g005
Figure 6. Schematic of significant sections.
Applsci 14 06265 g006
Figure 7. Normalized comparison of sectional moment and force (a) Sectional moment of S1; (b) sectional force of S1; (c) sectional moment of S2; (d) sectional force of S2.
Applsci 14 06265 g007
Figure 8. Sketch map of stiffened plate section (side view of center section): (a) Definition of the calculation segment of the stiffened plate center section; (b) deformation mode of the stiffened plate center section.
Applsci 14 06265 g008
Figure 9. Schematics of reference model and distorted model I.
Applsci 14 06265 g009
Figure 10. Correction procedure for distorted model I to replicate prototype.
Applsci 14 06265 g010
Figure 11. Schematics of distorted model I and distorted model II.
Applsci 14 06265 g011
Figure 12. Acceleration and displacement history curves of prototype and reference model.
Applsci 14 06265 g012
Figure 13. Normalized comparison of sectional moment and force (reference model). (a) Sectional moment of S1; (b) sectional force of S1; (c) sectional moment of S2; (d) sectional force of S2.
Applsci 14 06265 g013
Figure 14. Schematic of model 2 system (unit: mm).
Applsci 14 06265 g014
Figure 15. Acceleration and displacement time history curves of reference model and distorted model I. (a) Uncorrected group (acceleration); (b) corrected group (acceleration); (c) uncorrected group (displacement); (d) corrected group (displacement).
Applsci 14 06265 g015
Figure 16. Schematic of M2-E system (unit: mm).
Applsci 14 06265 g016
Figure 17. Acceleration and displacement time history curves. (a) Acceleration; (b) displacement.
Applsci 14 06265 g017
Figure 18. Acceleration and displacement time history curves. (a) Acceleration; (b) displacement.
Applsci 14 06265 g018
Figure 19. Schematic of RP-6 system (unit: mm).
Applsci 14 06265 g019
Figure 20. Time-series curves of distorted model and reference model (RP-6).
Applsci 14 06265 g020
Figure 21. Results around first crest of center stiffener. (a) Before t1 (0.00075 s); (b) after t1 (0.001 s); (c) after t1 (0.0015 s).
Applsci 14 06265 g021
Figure 22. Results for second crest of center stiffener and adjacent stiffeners. (a) Before t2 (0.010 s); (b) after t2 (0.011 s); (c) after t2 (0.011875 s).
Applsci 14 06265 g022
Figure 23. Comparison between distorted model and reference model. (a) Acceleration; (b) displacement.
Applsci 14 06265 g023
Figure 24. Schematic of static concentrated force P1.
Applsci 14 06265 g024
Figure 25. Schematic of a web plate with simply supported edges subjected to a pair of concentrated compressive forces on opposite sides.
Applsci 14 06265 g025
Figure 26. Comparison between intermediate reference models.
Applsci 14 06265 g026
Figure 27. Comparison between distorted and reference models (RP-T47-related). (a) Acceleration; (b) displacement.
Applsci 14 06265 g027
Figure 28. Comparison between distorted models and RP-T47. (a) Acceleration; (b) displacement.
Applsci 14 06265 g028
Figure 29. Comparison between T115-H80 and reference models. (a) Acceleration; (b) displacement.
Applsci 14 06265 g029
Figure 30. Comparison of empirical equation and numerical results of most appropriate distorted models.
Applsci 14 06265 g030
Figure 31. Correction procedure for distorted models to replica prototype.
Applsci 14 06265 g031
Table 1. Relevant parameters of prototype and reference model.
No. PrototypeReference Model
Geometry
dimensions
Attached plate dimension (mm)6400 × 3400640 × 340
Attached plate
thickness (mm)
131.3
Stiffener
dimension (mm)
350 × 11 125 × 15 35.0 × 1.1 12.5 × 1.5
Load caseMS (t)3.290210.00329
RI (mm)80080
v0 (m/s)33
MI (t)4000.4
Table 2. Comparison of simulation time and deviation of specimen with different mesh sizes.
UnitCase 1Case 2Case 3Case 4Case 5
Mesh sizemm10050302015
Normalized simulation time-0.1510.2140.3050.5641
Plastic displacementmm361.9373.4385.7398.1400.6
Difference-10.7%7.3%3.9%0.6%-
Peak accelerationmm/s221,232203,64720,19120,18420,300
Difference-4.4%1.7%0.6%0.6%-
Table 3. Mechanical properties and material parameters.
PropertySymbolUnitsValue
Mass densityρt/mm37.85 × 10−9
Young’s modulusEGPa206
Poisson’s ratioν-0.3
Yield stressσYMPa310
Strength coefficientKMPa730
Strain-hardening indexn-0.23
Necking strainεn-0.23
Fracture strainεf-0.35
Cowper–Symonds constantDs−140.4
Cowper–Symonds constantq-5
Table 4. Main scaling factors relating reference model and prototype.
VariableScaling FactorVariableScaling Factor
Length, L β L = β Energy, E β E = β 3
Impact mass, MI β M I = β 3 Force, F β F = β 2
Impact velocity, v0 β v 0 = 1 Displacement, δ β δ = β
Acceleration, A β A = 1 / β Stress, σ β σ = 1
Static moment SS β S S = β 3 Sectional area AS β A S = β 2
Table 5. Scaling factors relating distorted model I and reference model.
VariableScaling FactorVariableScaling Factor
Length, L1Energy, E λ E = λ M S
Impact mass, MI λ M I = λ M S Force, F λ F = λ M S
Impact velocity, v01Displacement, δ1
Acceleration, A1Stress, σ1
Table 6. Simulation results of prototype and reference model.
No.ItemUnitPrototypeReference Model
Load caseImpact velocity v0m/s33
Impact mass MIt4000.4
ResultsReversed plastic displacementmm398.14394.05
Difference -1.03%
Reversed peak acceleration mm/s220,18420,230
Difference -0.23%
Table 7. Relevant geometrical parameters of distorted model I.
No.ItemUnitModel 1Model 2Model 3Model 4Model 5
SpecimenAttached platemm640 × 340640 × 340640 × 340640 × 340640 × 340
Attached plate thicknessmm1.01.21.41.61.8
Stiffenermm 35.0 × 1.1 12.5 × 1.5 35.0 × 1.1 12.5 × 1.5 35.0 × 1.1 12.5 × 1.5 35.0 × 1.1 12.5 × 1.5 35.0 × 1.1 12.5 × 1.5
MSt0.00278 0.00312 0.00346 0.00380 0.00414
λ M S -0.8443 0.9481 1.0519 1.1557 1.2596
Impact blockRImm8080808080
v0m/s3.03.03.03.03.0
Table 10. Relevant parameters and loading cases of distorted model II (Criterion 1).
Group EDimensionsUnitM1-EM2-EM3-EM4-EM5-E
SpecimenAttached platemm640 × 340640 × 340640 × 340640 × 340640 × 340
Attached plate thicknessmm1.01.21.41.61.8
Stiffenermm46.93 × 1.2246.93 × 1.2246.93 × 1.2246.93 × 1.2246.93 × 1.22
MS-0.00278 0.00312 0.00346 0.00380 0.00414
η M S t1.0000 1.0000 1.0000 1.0000 1.0000
Impact RImm8080808080
blockv0m/s3.03.03.03.03.0
Load case η M I -1.0000 1.0000 1.0000 1.0000 1.0000
MIt0.3377 0.3792 0.4208 0.4623 0.5038
Table 12. Relevant geometrical parameters of reference models with different web sizes.
No.DimensionsUnitRP-1RP-2RP-3RP-4RP-5
SpecimenAttached platemm640 × 340640 × 340640 × 340640 × 340640 × 340
Attached plate thicknessmm1.31.31.31.31.3
Stiffenermm 30 × 1.00 9 × 1.60 35 × 1.10 10 × 1.70 40 × 1.15 10 × 1.60 43.5 × 1.15 15 × 1.50 45 × 1.15 15 × 1.50
hw/tw-30.00 31.82 34.78 37.83 39.13
Sectional areamm2148.4 159.5 166.0 176.5 178.3
Sectional static momentmm3950.0 1343.4 1634.9 2148.2 2258.6
(MS)mt0.00305 0.00326 0.00338 0.00358 0.00361
Load caseRImm8080808080
(MI)mt0.40000.40000.40000.40000.4000
(v0)mm/s3.00 3.00 3.00 3.00 3.00
ResultPlastic displacementmm42.40 39.9238.71 38.05 37.61
Peak acceleration mm/s2201,057 201,274199,627 198,628 197,391
Table 8. Loading cases of distorted model I.
No.ItemUnitModel 1Model 2Model 3Model 4Model 5
Uncorrected Group v0m/s3.03.03.03.03.0
λ M I -11111
MIt0.40000.40000.40000.40000.4000
Corrected Groupv0m/s3.03.03.03.03.0
λ M I -0.8443 0.9481 1.0519 1.1557 1.2596
MIt0.3377 0.3792 0.4208 0.4623 0.5038
Table 9. Loading cases of distorted model I.
No.ResultsUnitReference ModelModel 1Model 2Model 3Model 4Model 5
Uncorrected Group Plastic displacementmm39.4143.63 40.89 38.37 36.65 35.31
Difference--10.72%3.77%−2.62%−7.00%−10.40%
Peak accelerationmm/s2202,301184,551 196,695 206,696 217,748 227,705
Corrected GroupDifference --−8.77%−2.77%2.17%7.64%12.56%
Plastic displacementmm39.4139.78 39.70 39.51 39.75 39.63
Difference--0.95%0.75%0.27%0.88%0.57%
Peak accelerationmm/s2202,301198,136 201,432 203,220 205,054 205,238
Difference --−2.06%−0.43%0.45%1.36%1.45%
Table 11. Numerical results and difference from corresponding distorted model I.
No.ItemUnitModel 1Model 2Model 3Model 4Model 5
Distorted model IPlastic displacementmm39.78 39.70 39.51 39.75 39.63
Peak accelerationm/s2198,136 201,432 203,220 205,054 205,238
No.ItemUnitM1-EM2-EM3-EM4-EM5-E
Distorted model IIPlastic displacementmm40.70 40.24 40.66 40.79 40.64
Difference-2.30%1.36%2.91%2.61%2.55%
Peak accelerationm/s2198,729 200,924 202,999 205,366 205,343
Difference -0.30%−0.25%−0.11%0.15%0.05%
Table 13. Relevant geometrical parameters of distorted models II (Criterion 1).
No.DimensionsUnitRP-1-ERP-2-ERP-3-ERP-4-ERP-5-E
SpecimenAttached platemm640 × 340640 × 340640 × 340640 × 340640 × 340
Attached plate thicknessmm1.31.31.31.31.3
Stiffenermm40.36 × 1.146.25 × 1.250.82 × 1.2257.56 × 1.2659.01 × 1.26
Sectional areamm2148.4159.5166.0176.5178.4
Sectional static momentmm3952.41343.71637.52151.82258.6
(MS)d2t0.003050.003260.003380.003580.00361
(MS)d2/(MS)m-1.00001.00001.00001.00001.0004
Load caseRImm8080808080
(MI)d2/(MI)m-1.00001.00001.00001.00001.0004
MIt0.40000.40000.40000.40000.4002
(v0)d2m/s3.003.003.003.003.00
ResultPlastic displacementmm43.37 40.99 39.7238.1137.91
Difference 2.29%2.69%2.61%0.16%0.79%
Peak acceleration mm/s2200,182201,335203,103201,728203,710
Difference −0.44%0.03%1.74%1.56%3.20%
Table 14. Relevant geometrical parameters and results (RP-6).
No.DimensionsUnitRP-6
SpecimenAttached platemm640 × 340
Attached plate thicknessmm1.3
Stiffener dimensionsmm 60 × 1.15 15 × 1.50
Sectional areamm2195.5
Static moment mm33504.0
(MS)mt0.00393
Load CaseRImm80
MIt0.4000
(v0)mm/s3.0
ResultsPlastic displacementmm38.50
Peak accelerationmm/s2191,824
Table 16. Relevant parameters of reference models.
No.DimensionsUnitRP-1RP-2RP-3RP-4RP-5RP-6
Geometry dimensionsAttached platemm640 × 340640 × 340640 × 340640 × 340640 × 340640 × 340
Attached plate thickness mm1.31.31.31.31.31.3
Stiffener dimensionmm 30 × 1.00 9 × 1.60 35 × 1.10 10 × 1.70 40 × 1.15 10 × 1.60 43.5 × 1.15 15 × 1.50 45 × 1.15 15 × 1.50 60 × 1.15 15 × 1.50
Static momentmm3950.0 1343.4 1634.9 2148.2 2258.6 3504.0
Analytical comparisonP1N6929.6 9799.3 11,925.1 15,669.0 16,474.4 25,558.5
Pcr in TimoshenkoN7901.7 9014.7 9013.1 8287.9 8011.7 6008.7
Pcr-e (1.324Pcr)N10,461.8 11,935.5 11,933.4 10,973.2 10,607.4 7955.6
Load caseP1/Pcr-e-0.66 0.82 1.00 1.43 1.55 3.21
Suggested criterion 111112
Table 17. Relevant geometrical parameters and results (intermediate reference models).
No.ItemUnitRP-T47RP-T50RP-T55RP-T57
Geometry dimensionsAttached platemm640 × 340640 × 340640 × 340640 × 340
Attached plate thicknessmm1.31.31.31.3
Cross section dimensionmm 47 × 1.15 15 × 1.50 50 × 1.15 15 × 1.50 55 × 1.15 15 × 1.50 57 × 1.15 15 × 1.50
Static momentmm32409.8 3747.24221.94725.1
Analytical P1N17,577.3 19,294.2 22,322.3 23,591.8
comparisonPcr in TimoshenkoN7670.7 7210.5 6555.0 6325.0
Pcr-e (1.324Pcr)N10,156.1 9546.7 8678.8 8374.3
P1/Pcr-e-1.73 2.02 2.57 2.82
ResultsPlastic displacementmm38.27 38.56 38.13 38.57
Peak accelerationmm/s2191,251 192,594 191,688 194,377
Table 15. Relevant geometrical parameters and results (RP-6).
No.ItemUnitRP-6RP6-ERP6-T
SpecimenAttached platemm640 × 340640 × 340640 × 340
Attached plate thicknessmm1.31.31.3
Stiffenermm 60 × 1.15 15 × 1.50 75.12 × 1.21879.57 × 1.15
Sectional areamm2195.5 195.5 195.5
Static moment mm33504.0 3503.7 3707.7
(MS)mt0.00393 0.00393 0.00393
Load CaseRImm808080
(MI)d2/(MI)m -1.0000 1.0000
MIt0.4000 0.4000 0.4000
(v0)d2m/s3.03.03.0
ResultsPlastic displacementmm38.50 37.08 38.71
Difference--−3.70%0.55%
Peak accelerationmm/s2191,824 205,986 194,961
Difference --7.38%1.63%
Table 18. Relevant geometrical parameters and results (RP-T47-related).
No.ItemUnitRP-T47RP-T47-ERP-T47-T
SpecimenAttached platemm640 × 340640 × 340640 × 340
Attached plate thicknessmm1.31.31.3
Stiffenermm 47 × 1.15 15 × 1.50 61.24 × 1.2566.57 × 1.15
Sectional areamm2180.6 180.6 180.6
Static momentmm32409.8 2409.2 2613.4
Load CaseMIt0.4000 0.4000 0.4000
(v0)d2m/s3.03.03.0
ResultsPlastic displacementmm38.27 37.20 38.54
Difference- −2.79%0.71%
Peak accelerationmm/s2191,251 202,924 206,736
Difference - 6.10%8.10%
Table 19. Relevant parameters of distorted models.
No.ItemUnitT115-H70T115-H75T115-H80T115-H85T115-H90
Geometry dimensionsAttached platemm640 × 340640 × 340640 × 340640 × 340640 × 340
Attached plate thicknessmm1.31.31.31.31.3
Cross section dimensionmm70 × 1.1575 × 1.1580 × 1.1585 × 1.1590 × 1.15
Static momentmm32883.43301.03747.24221.94725.1
Analytical P1N21,031.724,077.827,332.230,794.7 34,465.4
comparisonPcr in TimoshenkoN5150.44807.04506.64241.5 4005.8
Pcr-e (1.324Pcr)N6819.16364.55966.75615.7 5303.7
P1/Pcr-e-3.083.784.585.48 6.50
ResultsPlastic displacementmm38.1137.7038.6338.8739.27
Peak accelerationmm/s2205,947197,710192,567193,985198,293
Disclaimer/Publisher’s Note: The statements, opinions and data contained in all publications are solely those of the individual author(s) and contributor(s) and not of MDPI and/or the editor(s). MDPI and/or the editor(s) disclaim responsibility for any injury to people or property resulting from any ideas, methods, instructions or products referred to in the content.

