Article

Integration of BIM Tools for the Facility Management of Railway Bridges

by
Sebastián Cavieres-Lagos
,
Felipe Muñoz La Rivera
*,
Edison Atencio
* and
Rodrigo F. Herrera
School of Civil Engineering, Pontificia Universidad Católica de Valparaíso, Av. Brasil 2147, Valparaíso 2340000, Chile
*
Authors to whom correspondence should be addressed.
Appl. Sci. 2024, 14(14), 6209; https://doi.org/10.3390/app14146209
Submission received: 5 June 2024 / Revised: 7 July 2024 / Accepted: 10 July 2024 / Published: 17 July 2024

Abstract

:
Current railway infrastructure maintenance work, which is mostly carried out by visual inspection, has a reactive approach, dissociated information, and limited follow-up. On the other hand, railway bridges, being critical infrastructures, require effective monitoring and maintenance to guarantee their safety and operation over time. The designed tool links a parametric BIM model in Revit® with an automated spreadsheet in MS Excel® through visual programming in Dynamo, generating BIM/data automation as an initial step towards a digital twin. This achieves a bidirectional flow to exchange data on the structural condition of elements. The procedure was applied to a railway bridge in use for over 100 years, representing its geometry and damage information according to technical standards. The value lies in laying the foundations for adopting preventive approaches for this key infrastructure. The BIM/data automation allows the BIM model to visually reflect the condition of the elements, depending on their damage, consolidate the inspection information, and generate a visual management tool. In conclusion, the designed BIM/data automation improves the monitoring of railway bridges compared to traditional methods, facilitating the interaction and relationship between the damage records and the actual bridge elements, laying the foundations for the construction of digital twins.

1. Introduction

Civil works are significant in the development of countries. Among them, transportation infrastructure facilitates the connectivity and movement of people, goods, and services across regions, being essential for modern society from economic, social, and environmental perspectives [1,2,3,4]. Given this importance, it becomes imperative to ensure the health of these structures over the years, maintaining and repairing these assets [3,5,6]. In recent years, there has been a technological revolution in the construction field called Building Information Modeling (BIM), which has attracted the attention of specialists in the construction field who deem it essential to harness this technology in various construction projects and think outside the box to fully utilize it. From this sentiment, the idea of Bridge Information Modeling (BrIM) then appeared, and it is similar to BIM except that BIM is all about buildings, while BrIM is all about bridges. It can be utilized in all the project’s phases [7,8,9]. Recent collapses of road bridges have led the technical–scientific community and society to reflect on the effectiveness of their management [10]. In this context, due to the high number of SES that need structural recovery, DNIT created in 2017 the Program for Maintenance and Rehabilitation of the Large Structures, called PROARTE, which became responsible for managing the maintenance and rehabilitation of these large structures. Within the scope of PROARTE, the Bridge Information Modeling (BrIM) methodology was implemented, establishing the technical criteria for the development of preliminary designs of bridges on the BrIM platform for bridge rehabilitation works [11,12,13,14] For the purpose of applying BrIM, an inspection is initially carried out at the SES to determine the degree of degradation of the structure, determine a management note for the structure, and then define a prioritization rule for which the bridge will be reinforced first, based on the standard ABNT NBR 9452 (2019) [15], DNIT-010 standard [16], and the ABNT NBR 7188 (2013) [17].
For many years, bridge management approaches and condition assessments have been based on long-established manual paperwork and information retained from on-site inspectors and engineers [17]. These approaches have been primarily paper-based and significantly limit the ability to be readily transferred to asset managers or be referred to after a few years. However, the development of Building Information Modeling (BIM) in recent years has led to a transformation in the digitization of structural assets and their information in the form of a digital twin, which, in the field of bridge engineering, pertains to the Bridge Information Modeling (BrIM) [13,18]. Chan et al. [8] were among the researchers who emphasized that it is currently essential for bridge owners to make use of BrIM as a database to store various sources and types of information such as bridge drawings, inspection records, rehabilitation activities, condition state of elements, records of remote sensors, and history of decisions with a timestamp and reference. In general, BrIM is a shared database/platform that often consists of the bridge geometrical 3D computer-aided design (CAD) models, as digital representations of the physical characteristics of the bridge assets, as well as non-geometrical information as digital documentation such as visual inspection reports, damage locations and maintenance histories, remote sensors’ records, diagnostic test results, elements’ materials, and other specifications [9,19]. With BrIM, this information can then be widely shared/disseminated amongst the stakeholders involved, assisting bridge managers and assessors as a reference for their future decisions. Despite the fact that BrIM is an innovative method for storing varied information, two concerns remain in terms of: (1) creating an accurate digital representation and collecting remote and reliable information, and (2) utilizing BrIM data for management purposes in a reliable Bridge Management System (BMS). However, despite technological advancements, timely maintenance is still commonly performed through visual inspection [6,20,21,22,23,24,25,26,27,28], which tends to be subjective, and thus, the accuracy of the results directly depends on the inspector’s skills and experience [20,21,22,24,26,29]. Railway infrastructure is considered crucial in many transportation systems, both for passenger and freight transport. Therefore, a decrease in service capacity (load or speed), a failure, or a partial closure of these systems can cause economic, social, and, consequently, public or private losses [4,5,6,24,30,31].
Currently, the monitoring and maintenance activities for railway infrastructures, particularly railway bridges, face various limitations associated with difficult access, associated hazards, lack of records of existing information, and large amounts of information in various formats such as spreadsheets, texts, and databases, among others [20,23,26,28,32,33]. This results in a lack of asset tracking, coupled with the fact that many railway bridges are nearing the end of their useful life, which ranges from 70 to 110 years in countries such as the United States, Canada, Japan, the United Kingdom, and other European countries [25,32,34,35,36]. Chile is not exempt from this problem, given that the nation’s first railway bridge, over the Maipo River, was put into service in mid-1859 [31]. Therefore, continuous and effective asset management is needed to record, ensure, and maintain public safety, investment, the functioning of structures, and, in turn, railway networks. If anomalies and/or failures are found, actions must be developed to resolve these issues [21,24,29,37,38]. Traditional and current methods of infrastructure monitoring are mostly governed by a reactive approach, without optimized planning for evident damages, which is not effective since reactive monitoring tasks tend to be more costly, both monetarily and structurally. In contrast, preventive monitoring involves simple but periodic interventions on the asset, reducing repair costs and increasing the structure’s safety and reliability [39,40,41,42].
There are technologies that, over the years, have mostly benefited design and construction processes, leaving behind the operation and maintenance stage of infrastructures [41,43,44]. These include BIM and digital twins, obviously associated with the era of Industry 4.0 [45,46,47]. In the literature, various definitions of Building Information Modeling (BIM) can be found, one of which is the 3D digital representation of the physical and functional characteristics of a facility [48]. By 2018, it was believed that the use of BIM in civil works was almost three years behind its use in buildings, with the United States leading the way, while Europe quickly adopted this technology for infrastructure design and management [49]. Regarding the definition of a digital twin, a similar situation occurs as with BIM. There are various definitions in the literature, but one that encompasses many and provides a general definition was proposed by Eric VanDerHorn and Sankaran Mahadevan in 2021, defining it as a visual representation of a physical system (and its associated environment and processes) updated through information exchange between physical and virtual systems [3,33,42,45,50,51,52]. Moreover, facility management allows incorporating these technologies, as it is a branch defined by the International Organization for Standardization (ISO) and the International Facility Management Association (IFMA), which aims to manage and improve the performance of buildings or civil works by integrating people, space, processes, and technologies [33,40,41,53], resulting in a considerable improvement in preventive asset monitoring management [33,40,41].
Given the panorama of difficulties and problems exhibited by railway infrastructure monitoring activities, which stem from difficult access to bridge elements and the bridge itself, time limitations to perform tasks without affecting daily rail traffic, loss of information due to large amounts of unclassified, unstructured documents being difficult to manage, the subjectivity of inspections that directly depend on the criteria of the workers in charge, and the reactive approach when tangible emergencies occur [20,21,22,23,24,26,28,29,32,33,40,43], novel methodologies and technologies that have been generalized in the architecture, engineering, construction, and operations (AECO) industry stand out, improving inspection processes of structures by better consolidating and managing information, with BIM being the most influential methodology in this context [33,41,44,45]. Even for digital twins, BIM methodology and models become indispensable, as they aid in providing an updated digital replica of the physical asset throughout its life cycle by connecting all its parameterized elements, improving inspection processes through their interoperability [42,52,54]. Furthermore, this digital or virtual replica is connected to a database for storage and to see how the digital twin evolves over time through its representation, allowing reducing the time and costs of updating facility management database systems in the operation and maintenance phase of structures [33,41,42,43,52]. The development and application of BIM and digital twin technology for the management of vehicular bridges offer significant advantages in the field of infrastructure monitoring and maintenance because having a digital replica allows visualizing and evaluating the variable performance of the asset over time, capturing its physical and functional attributes [3,33,44].
This study aims to address the significant challenges in the monitoring and maintenance of railway bridges by leveraging BIM and digital twin technologies. Despite the advancements in design and construction, the operation and maintenance stages of infrastructure management remain underdeveloped, often relying on subjective visual inspections and outdated methods. This research identifies a critical gap in the integration and interoperability of emerging digital technologies for infrastructure management applied in railway bridges, which are vital for transportation systems yet suffer from issues like difficult access, unstructured data, and the need for timely interventions. This research contributes to filling this gap by developing a BIM-based tool for generating digital twins, facilitating real-time data integration, and improving the decision-making process in the maintenance of railway bridges. This BIM-based tool is created from the integration of a parameterized BIM model and an automated data spreadsheet, along with a workflow that enables and facilitates interoperability from the BIM model and the automated data spreadsheet, establishing a bidirectional workflow, which allows the automatic import/export of information, thereby constituting the desired BIM tool, which can be used in the field for monitoring railway infrastructures.
The developed methodology was implemented on a railway bridge, as a case study, where the BIM model was parameterized to be applied in a real infrastructure inspection assessing the level of damage severity of the inspected elements. Moreover, this tool provides a visual summary of the results of the performed inspection, allowing simple and enhanced management and operation of the asset.
The remaining document is structured as follows: In Section 2, the research method guiding this research is presented, based on the design science research methodology (DSRM). Section 3 comprises the literature review sustaining this study, covering the state of the art in the inspection and monitoring of railway bridges, how BIM and data automation can support the first building block to achieving a digital twin, and concludes with a statement of the knowledge gaps and research objectives. Section 4 presents the development method to design the proposed solution. In Section 5, the case study is presented in order to show how this solution works in the real world. The results of this research are discussed in Section 6, which is followed by the conclusions in Section 7.

2. Materials and Methods

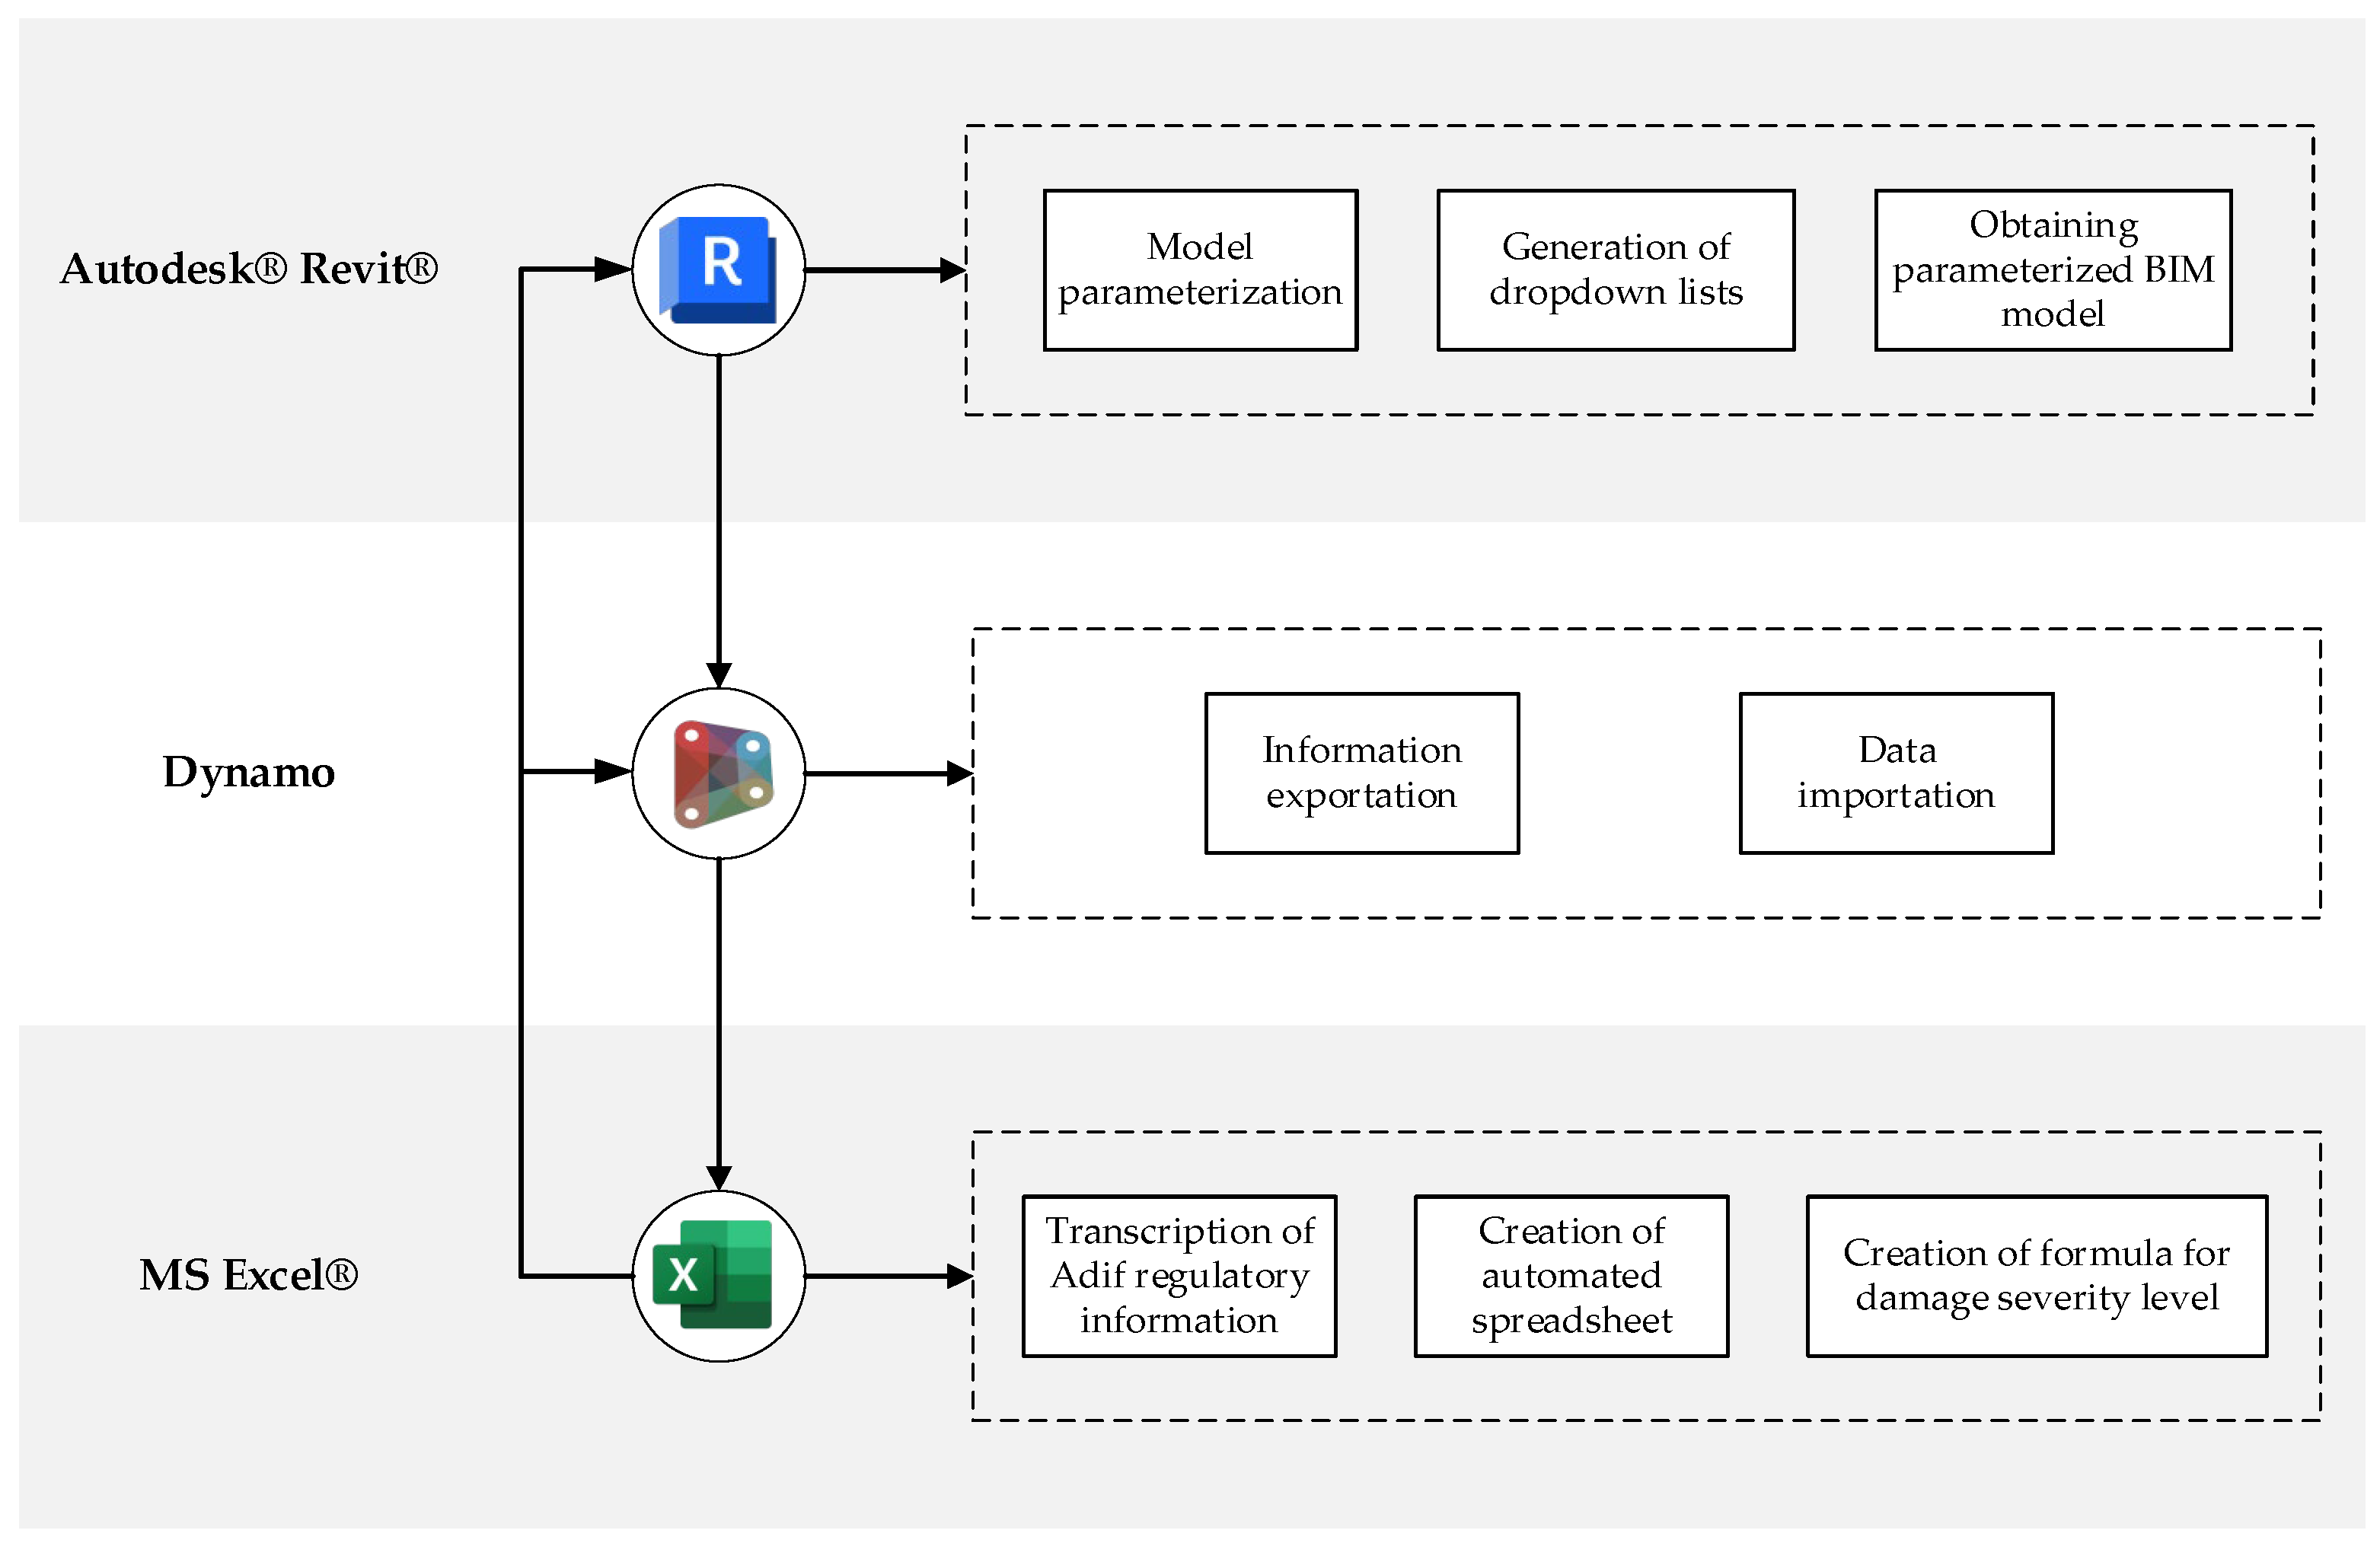
Below, in Figure 1, the flowchart of this research is presented, detailing the activities along with the tools used to conduct this study. The research employed the design science research methodology (DSRM), which is widely recognized for its ability to improve the understanding of information systems phenomena through the creation of technological artefacts that embody the solution to a previously defined problem. The choice of this methodology is due to its structured and systematic approach, which allows not only the identification and analysis of complex information systems problems, but also the development of practical solutions and their rigorous evaluation. This iterative process ensures that the results obtained are both theoretically relevant and applicable in real contexts [55,56]. This methodology comprises five phases: (1) Identification of observed problems; (2) Definition of the objectives of a potential solution; (3) Design and development; (4) Demonstration; and (5) Evaluation.
In the first phase, to identify the observed problems, a literature review was conducted using the Web of Science and Scopus databases, including relevant manuals and technical reports for the topics under study. The objective of the search was to identify and understand the difficulties of traditional railway bridge inspection methods and, in turn, to study in greater depth the concepts of BIM and digital twins and how these can improve the monitoring and maintenance of active works. Additionally, available software that enables the creation, modeling, programming, visualization, and any necessary action for the functioning of a digital twin was analyzed to select the most suitable tool for this research.
In the second phase, a potential solution was defined based on the information obtained in the first phase. This solution is rooted in the automation of a parameterized BIM model with a data spreadsheet as an initial step towards a digital twin for railway bridge monitoring, which allows for an understanding of the health status of the structure that is closer to reality than what is obtained with current monitoring methods, as well as better visualization of the monitoring conducted and more efficient management of the inspection and potential maintenance of the asset.
In the third phase, the design and development for the creation of the BIM tool for automation towards a digital twin for railway bridges was proposed, aiming to achieve more effective monitoring. This tool consists of an MS Excel® spreadsheet containing all the elements of a bridge, with their respective inspection criteria, which are composed of their corresponding damage categories and intensities. All the damage information is derived from the Adif technical standards manuals. Finally, this spreadsheet is linked with the chosen 3D visualization software (BIM software) to generate BIM/data automation, a link achieved through programming that connects each bridge element with its respective damage intensity. The link causes a color change in the elements according to their condition, allowing for the visualization of the overall state of the infrastructure.
In the fourth phase, the BIM/data automation tool for the generation of digital twins for railway bridge monitoring, designed earlier, was applied to a case study of a railway bridge in the commune of Limache in the Valparaíso region of Chile. Information was gathered about this bridge, including the BIM model, which was linked with the spreadsheet containing the criteria. Subsequently, the automation process was initiated to verify if the BIM model updated correctly, generating the visual changes, indicated by the color changes in the elements, which are essential for the inspection of the asset. If this update was successful, the final step in the demonstration phase was to compile a list of asset monitoring actions.
Finally, in the fifth phase, the developed BIM tool was tested to generate BIM/data automation as an initial step towards a digital twin, verifying that the interoperability of the data spreadsheet with the BIM model functioned correctly.

3. Literature Review

3.1. Inspection and Monitoring of Railway Bridges

The inspection of civil works involves the assessment of the physical and functional conditions of civil infrastructure systems such as buildings, roads, bridges, etc. Historically, it has been overshadowed by the construction phase of the same work [20,57], despite the fact that the operation and maintenance stage is the longest phase in the entire life cycle of AECO industry works [58]. Generally, infrastructure monitoring is carried out periodically through visual inspections, which tend to be prolonged, requiring the interruption of the regular functioning of the system. Consequently, these procedures are limited in terms of time and access requirements [6,20,21,22,23,27]. Additionally, asset monitoring programs are necessary due to uncertainties in environmental and mechanical conditions, material properties, and load history, as in the case of a bridge [59]. Therefore, monitoring activities are essential to maintain public and structural safety, trust, investment, and the durability of assets to ensure they reach their expected lifespan [3,5,21,22,37,38,60].
In railway bridge inspections, although new non-destructive techniques have helped update traditional inspection and maintenance methods [61,62,63], these methods still primarily rely on visual inspection. Being conducted visually by humans, the results are subjective, affecting their reliability and precision since they directly depend on the experience and skills of the personnel, which can vary depending on the inspector [20,21,22,25,26,29]. Other limitations of current methods include the dispersed nature of the data collected from monitoring activities across different data sources, which can lead to information loss. Moreover, maintenance planning is often performed at the element level, sometimes without a clear understanding of the entire infrastructure, being overly simplified, and the data entry into systems lacks a clear visual interface [26,30,43,44,64].
Additionally, in current methods, it has become common to perform these tasks only when real emergencies occur, adopting a reactive approach. This practice is ineffective since reactive maintenance tasks can cost three to four times more than the same repair activity if implemented as preventive and planned maintenance, which consists of simple but continuous actions over time [39,40,41]. In bridge management, previous research has developed approaches to determine the optimal timing of asset inspections and predicted future interventions to preserve the structural health of the bridge. However, these methods generally adhere to strategies that focus on understanding the repercussions of bridge failure, maintaining a reactive logic [41,65].
Since the failure or poor planning of asset maintenance tasks can lead to high safety, economic, and social costs, the AECO industry has leveraged technological advances in software, frameworks, and application tools to update asset management methods throughout their life cycle, particularly in the automation of facility management activities to improve work efficiency during the operation and maintenance phase. This is because more complex modeling tools are needed to model asset degradation and support the management decision-making process [22,33,35,42].

3.2. BIM/Data Automation as an Initial Step Towards a Digital Twin

With the technological advances of recent years that have given rise to the era of Industry 4.0, there has been a notable change in how the AECO industry manages its projects, moving towards digital transformation at different levels and, in turn, automating facility management activities to improve work efficiency during the operation and maintenance phase [33,41].
Before the advent of BIM, most facility management tasks used Autodesk® CAD (2024) files for asset management, but there are several problems with using these files for facility management, such as the lack of integrated correlational information in CAD drawings, inefficient coordination between different specialties, and complexity in interoperating with other software [43]. The application of BIM to infrastructures is effective for managing their life cycle, encompassing everything from the design stage to maintenance. In particular, implementing BIM in infrastructure has considerable potential to add value to asset management in the maintenance stage, that is, for facility management [66]. Digital twins, in turn, serve to virtually replicate the asset with parameterized models that evolve over time and remain synchronized with their physical counterpart through data collection instruments [42,48,52]. One advantage of this technology is that it allows interaction between physical components, products, or systems (depending on the case) in physical spaces and their corresponding virtual replicas in virtual spaces, integrating multiple physics and scales, and generally using sensors and/or current or historical data, enabling a complex virtual model that is the counterpart of the physical one [67]. Another advantage is that they help monitor anomalies, fatigue, geometric deformations, etc., in the physical twin [68]. Digital twins in facility management are also used for preventive maintenance of assets, improving decision-making, inspection task efficiency, and reducing safety, economic, and social costs [33,41,42,69]. The use of digital twins varies depending on the area where this technology is employed, as there is evidence of their use in the construction and monitoring of wind farms, for regional energy systems integrated into smart cities, for fault detection in buildings, and for supervising and managing construction progress [51,67,70,71,72].
Therefore, the technology to be used will be a BIM/data automation as an input for a digital twin that provides the significant advantages over traditional methods mentioned above. This BIM/data automation is considered in the literature as a Digital Shadow, which differs from digital twins by being a model fed by a unidirectional flow with the state of a physical asset, understood as a mere assignment of status data through measurement to a specific asset at a given point in time [52]. Although the greatest advantages come from digital twins, BIM/data automation also offers benefits such as interoperability, collaboration, and communication among stakeholders that BIM itself provides, reduction of information loss, improved data accessibility, reduced time and cost to update monitoring system databases, support in decision-making, among others [33,40,41,43,44].

3.3. Knowledge Gap and Research Objectives

Despite the potential benefits of automating a BIM model with a standardized database to create digital twins for asset monitoring, there are substantial challenges in effectively implementing these methods. Traditional approaches to monitoring and maintenance of railway bridges often rely on subjective visual inspections, leading to data dispersion and the lack of a comprehensive view of the infrastructure. Additionally, these methods typically follow reactive strategies rather than preventive ones, which limits their reliability, accuracy, and efficiency. This is in stark contrast to the advantages provided by BIM/data automation and digital twins, which offer enhanced interoperability, collaboration, reduction of information loss, improved data accessibility, support in decision-making, and the potential for continuous and preventive monitoring.
The primary knowledge gap lies in understanding how to effectively integrate BIM and digital twin technologies to overcome the limitations of traditional methods and fully leverage their benefits in the monitoring and maintenance of railway bridges. This research addresses this gap by proposing a systematic approach to integrate a BIM tool for the facility management of railway bridges, aiming to generate digital twins.
To achieve this, the research is guided by the following specific objectives:
(a) Identify the critical elements necessary for monitoring a railway bridge and the suitable BIM tools for generating digital twins.
(b) Design a comprehensive procedure for integrating BIM tools to automate data collection and management, serving as the foundation for digital twins in facility management.
(c) Implement and evaluate the developed BIM tool in a real-world case study to assess its effectiveness in generating digital twins and improving the monitoring and maintenance processes for railway bridges.
This study seeks to contribute to the knowledge by developing a practical framework for integrating BIM and digital twin technologies, demonstrating their potential to enhance the accuracy, efficiency, and reliability of railway bridge monitoring and maintenance.

4. Development Method

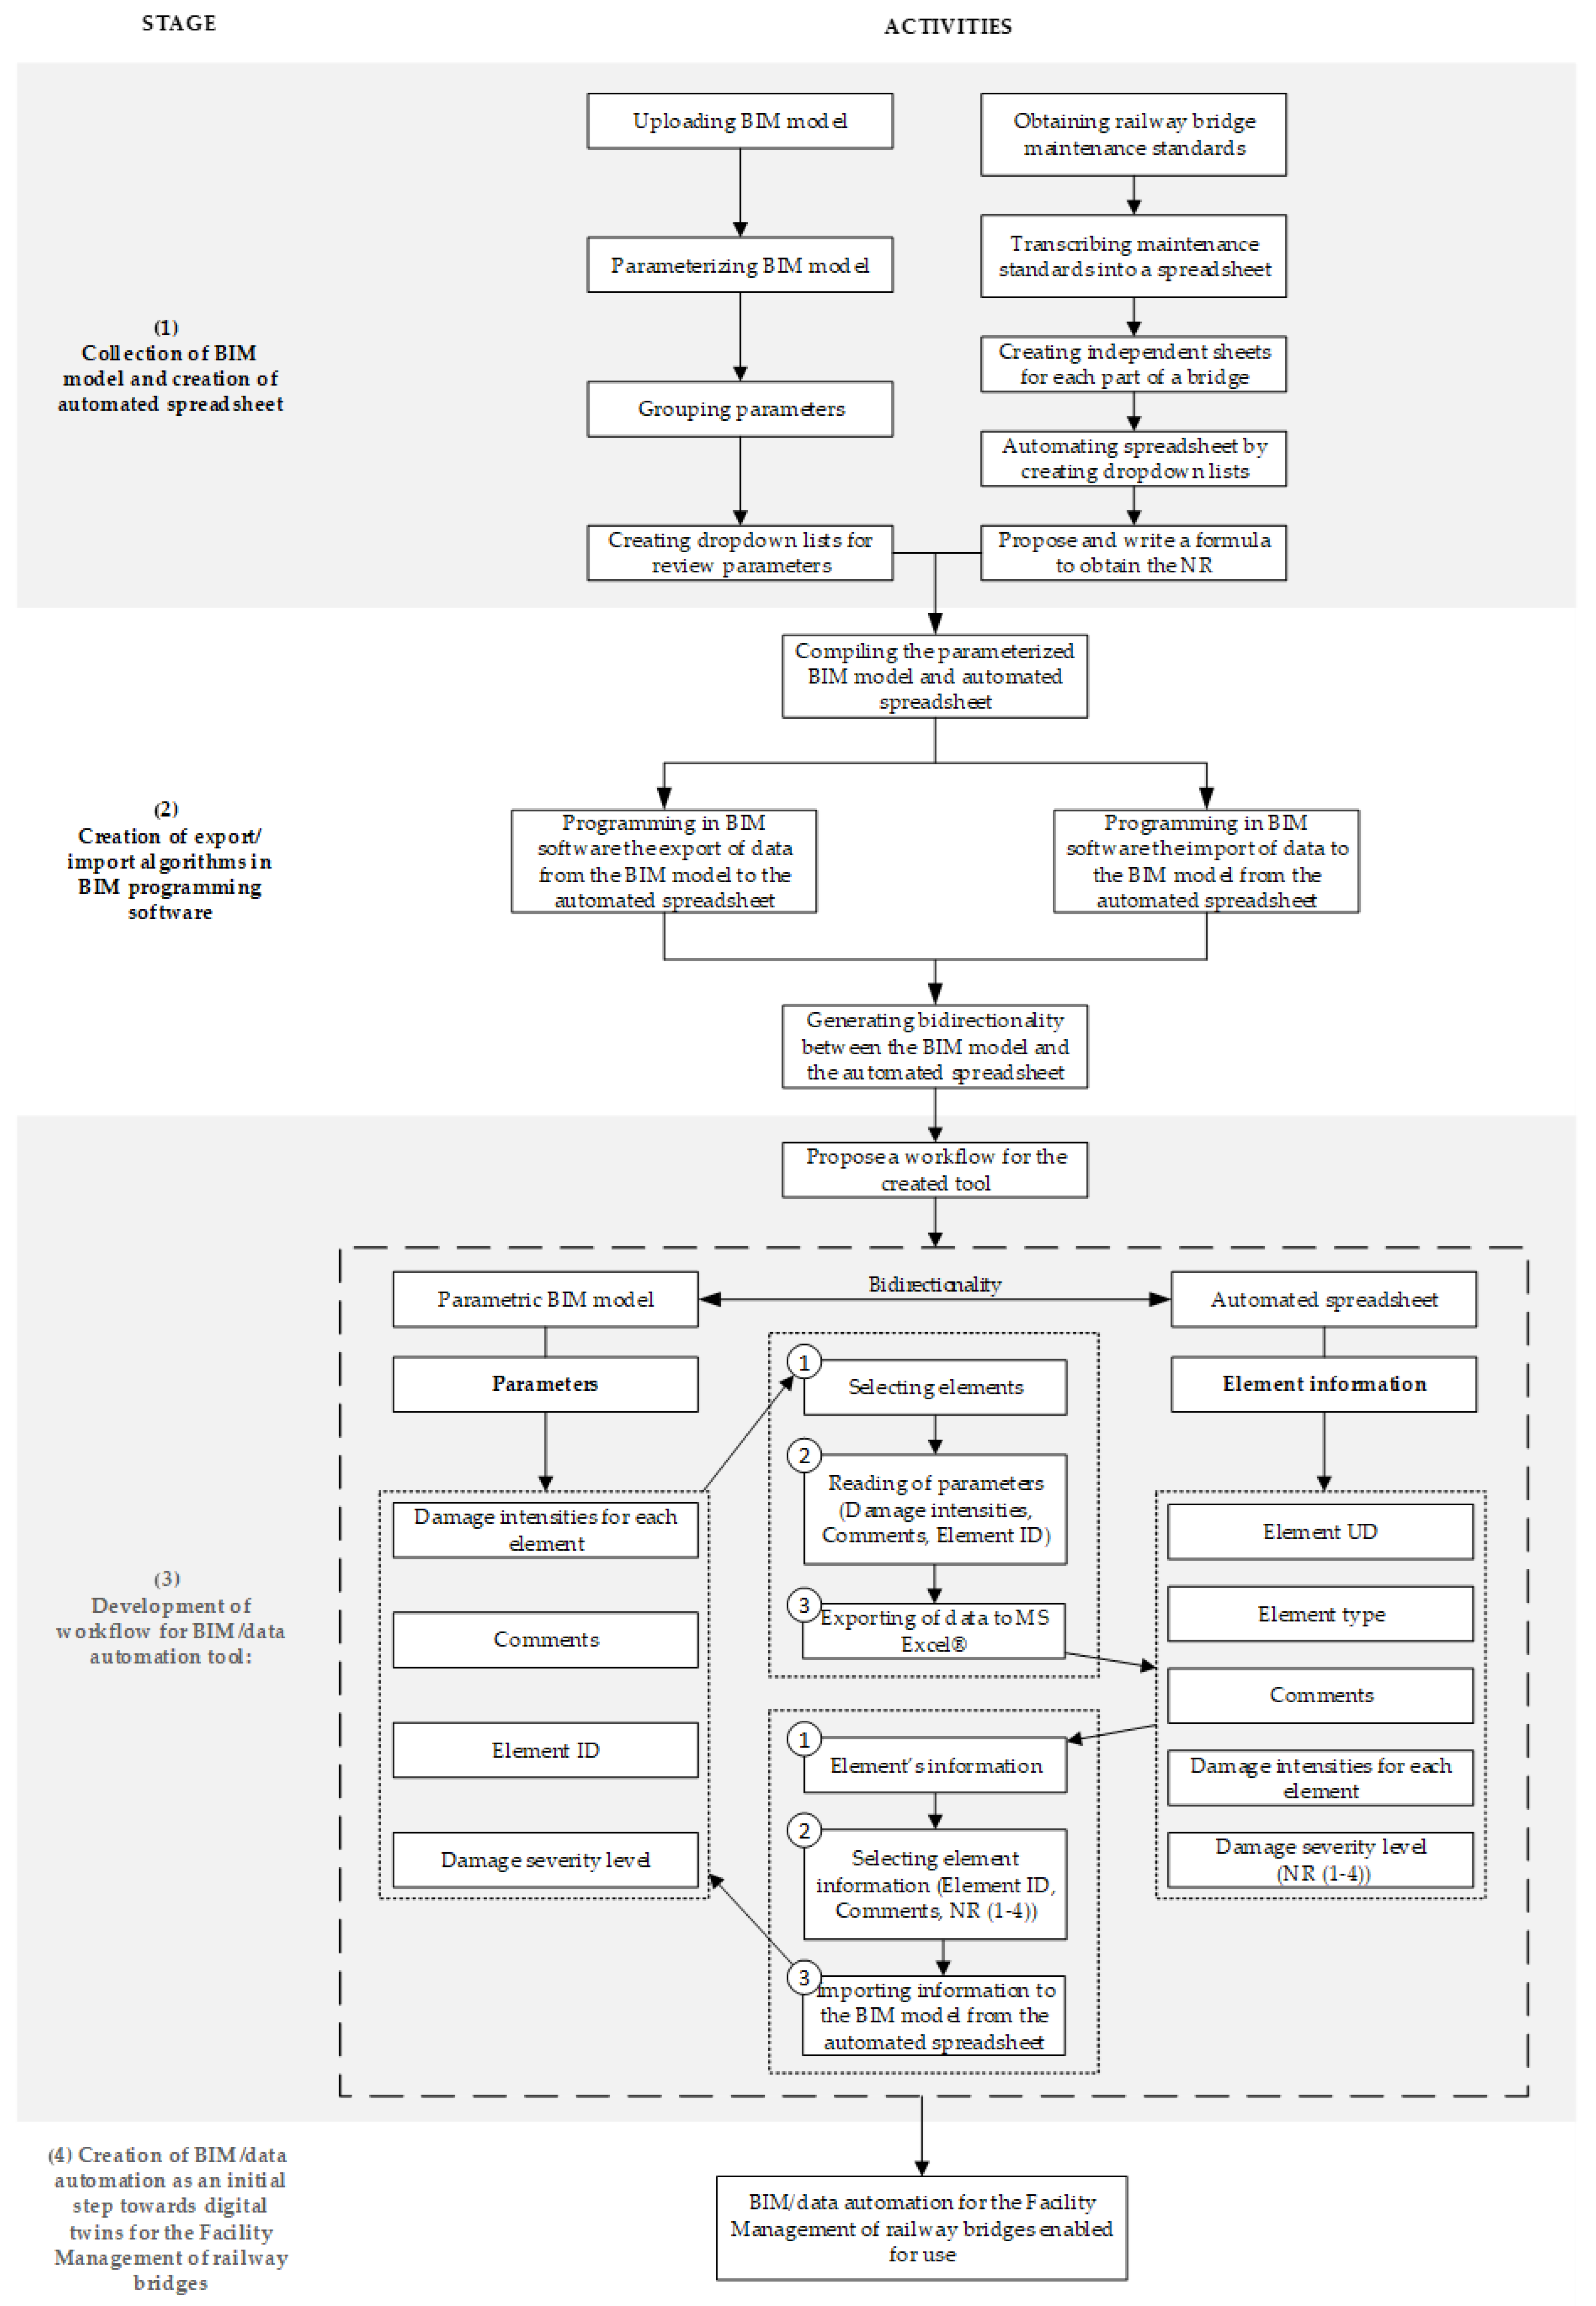
Figure 2 shows a proposed methodology for creating a BIM tool that generates automation between the parametric BIM model and a standardized database for the monitoring of railway bridges. The methodology consists of four stages: (1) Collection of the BIM model and creation of the automated spreadsheet in MS Excel®; (2) Creation of algorithms for the export and import of information using Dynamo; (3) Development of a workflow for the BIM/data automation tool; and (4) Confirmation of the BIM/data automation as an initial step towards digital twins for the facility management of railway bridges.
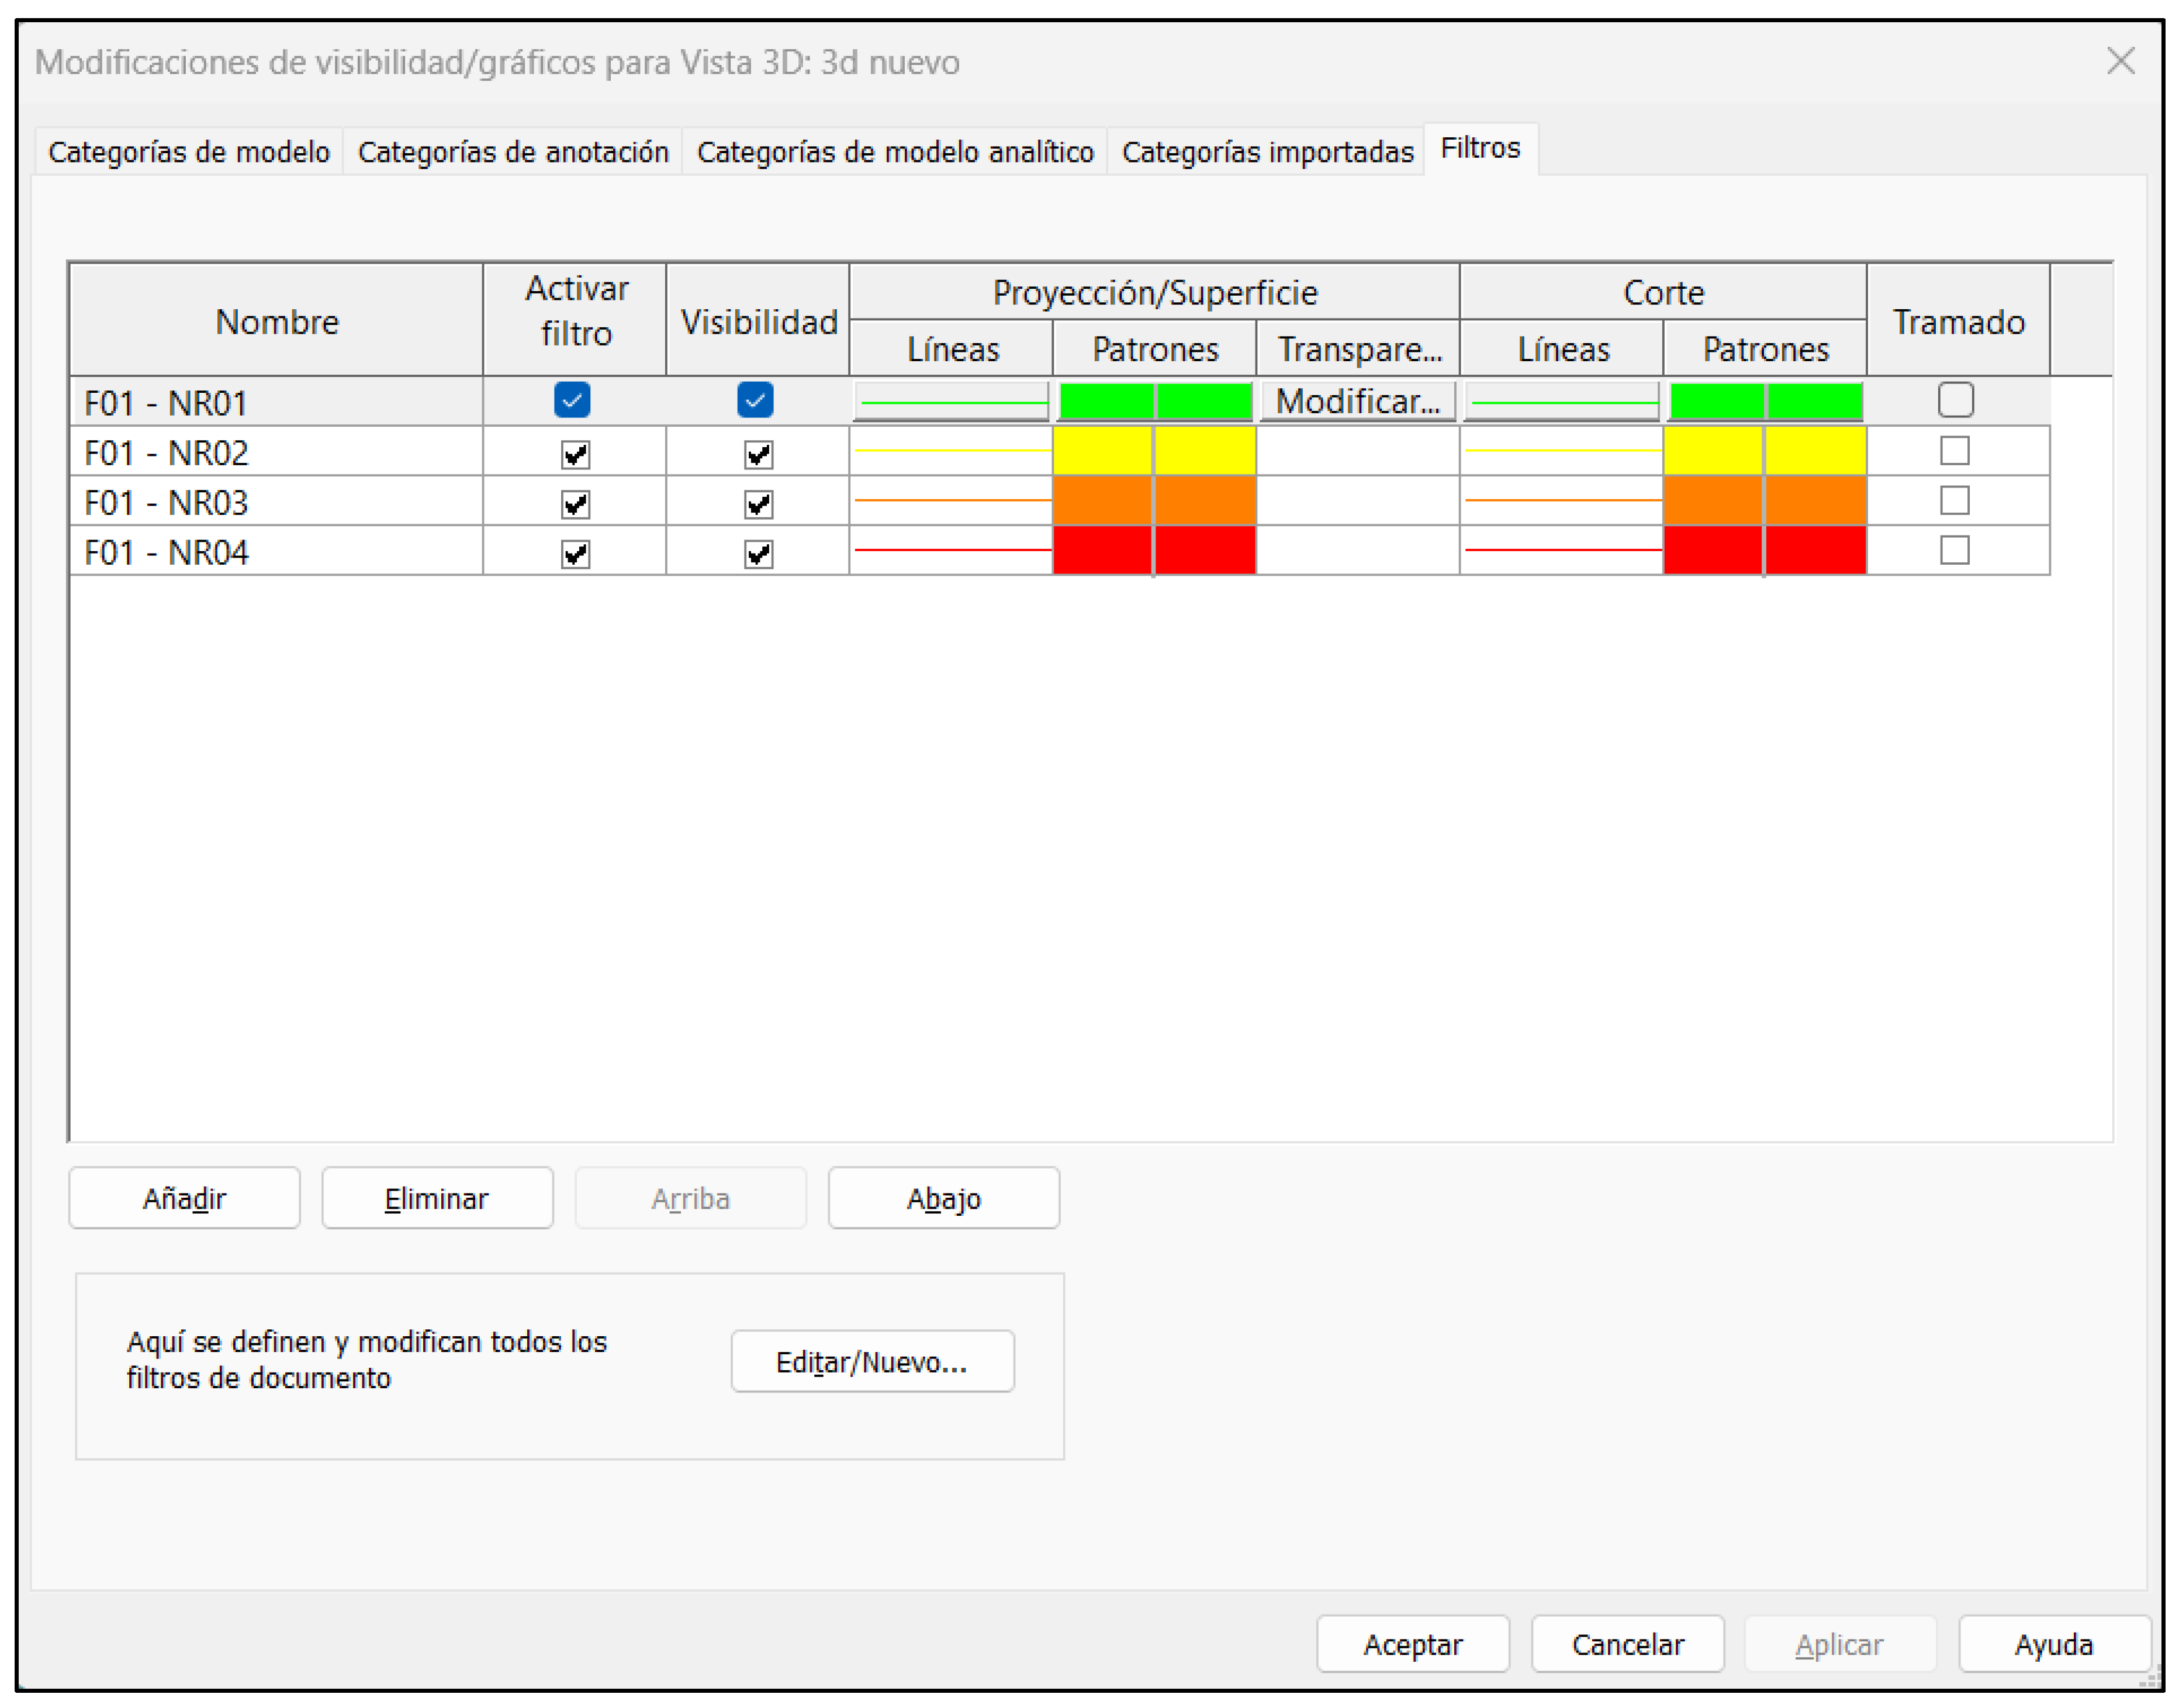
In the first stage, the damages to be inspected are defined along with their respective intensities and categories, parameters that are provided by the inspection standard. Thanks to the study of this monitoring regulation, it is possible to create an automated spreadsheet that will serve as a database, as it includes the intensities, categories, and parameters to inspect the bridge. This automated spreadsheet consists of dropdown lists for the intensities whose values vary depending on the damage situation of the elements. When an intensity is selected, the cell will obtain a color along with its respective intensity detail for each bridge element, ultimately providing the damage severity level, which is derived from a formula proposed for this research that weights all damage intensities of the element to give this value. This value determines the color that the element will have in the BIM model. Almost simultaneously, the BIM model of the infrastructure is parameterized in the BIM software for each bridge element with the damage intensity details, creating dropdown lists similarly to the spreadsheet. This ensures that when programming the automation between the automated spreadsheet and the BIM model, it is more accurate, avoiding errors, and ensuring that the information of the elements is consistent in both content and visualization during operation. In addition to parameterizing the model by adding the damage intensities, each element is assigned a variable named “damage severity level”, where the value calculated by the proposed formula will be stored. Finally, to ensure that the elements obtain a color according to their damage severity level, filters are created in the BIM software so that based on these values, the element takes on its respective color, allowing the visualization of the damage level of each element and, consequently, the overall state of the railway bridge.
The second stage focuses on creating algorithms to extract and import information between the parameterized model and the automated spreadsheet, using a BIM software extension that enables visual programming for this information exchange and flow, producing a bidirectional flow between both parts. Two separate programming files are created, one for extraction and one for import, but they are used together to generate the bidirectional flow.
The third stage involves creating a workflow for the BIM tool, which consists of implementing the programmed algorithms in a specific order for data transfer, starting with data export from the model to the spreadsheet and then importing information back to the model from the spreadsheet. This workflow order is explained because the automated spreadsheet serves as the data collection point, where the damage severity level value is obtained and imported into the model, generating the color change of the elements depending on their structural condition. Additionally, this order is followed because it is easier to conduct field inspections with the parameterized BIM model in a viewer that allows selecting bridge elements and recording the damage intensity and/or comments, rather than carrying out the inspection with the spreadsheet.
Finally, in the fourth stage, the BIM tool, consisting of BIM/data automation, is verified to ensure it functions without visualization, information, and/or programming errors, making it ready for use.

5. Case Study

5.1. Knowledge Gap and Research Objectives

The methodology described in the previous section was implemented on a mixed-type railway bridge. The bridge’s infrastructure (foundations, piers, and abutments) is made of reinforced concrete, while the superstructure consists of steel beams resting on the lintels of the piers, which are mostly concrete and to a lesser extent steel. In one section of the superstructure, there is a truss of steel beams. The bridge is located in the Limache commune, Valparaíso region of Chile. The bridge was inaugurated in February 1918 and originally consisted of a steel section alongside several wooden sections and reinforced concrete piers [73]. Currently, as mentioned earlier, the bridge’s superstructure is entirely steel, while the foundations, piers, and abutments remain reinforced concrete. Figure 3 shows parts of the bridge today, one of the section without trusses and another of the section with trusses.
The bridge has an approximate length of 350 m, allowing it to cross the Aconcagua River. Currently, freight trains run over this infrastructure, which, along with its many years of service, makes its maintenance crucial. Proper maintenance preserves and extends the bridge’s lifespan, preventing accidents and interruptions in freight routes that could impact the growth of the region and, consequently, the country.

5.2. Tool’s Implementation Process

To address the lack of modernization in traditional inspection methods, which result in information loss and potential economic, structural, and social losses, the integration of automation between a parameterized BIM model and an automated data spreadsheet is proposed, aiming towards a digital twin of the railway bridge. This integration seeks to manage its inspection more effectively by consolidating information from these activities, preventing data loss and dispersion, and achieving preventive monitoring of the asset. This BIM/data automation is based on a parameterized BIM model of the bridge and an automated spreadsheet containing information about the elements to be inspected. This will facilitate the visualization of the components and their structural condition during inspections and subsequent maintenance tasks. Both the BIM model and the spreadsheet categorize each part of the bridge according to the types of elements, allowing comments to be added for each element to record repair activities, additional anomalies, or any relevant notes.
Various tools can be employed to develop the proposed workflow and achieve the set objectives. For bridge modeling, different software options such as Autodesk Revit, OpenBridge and MicroStation from Bentley, and TEKLA are available. Autodesk Revit is widely recognized for its extensive use in the industry, offering a large user base and an active community that facilitates the exchange of knowledge and experiences. Its ease of connection with Excel through Dynamo allows for smooth, bidirectional, and efficient data integration, which is crucial for managing large volumes of information. On the other hand, OpenBridge and MicroStation from Bentley are specialized tools for transport infrastructure, standing out for their advanced capabilities in the design and analysis of bridges. TEKLA, known for its precision in structural modeling, primarily used for steel structures, offers robust tools for detailed construction, although its focus is more on the execution and manufacturing phase than on the integrated management of facilities. Therefore, considering these factors, Autodesk Revit was selected for this study due to its versatility, widespread adoption in the industry, and ease of data integration, making it an optimal choice for the objectives outlined in this paper. However, it is important to note that the proposed workflow can be replicated by users in various software tools, with the corresponding programming and integrations. Figure 4 shows the software used to implement the tool and the main actions developed within them.

5.3. Software Used to Generate BIM/Data Automation

Next, it is necessary to define the inspection criteria, such as the category and intensity of the damages, both of which are required to determine the severity level of the damages. This value represents each element of the bridge and is defined later on. To define the category and intensity of the damages, criteria used to create the automated MS Excel® spreadsheet, it is essential to refer to the document titled “Inspección Principal de Puentes de Ferrocarril” [74] by Adif, which is defined on its official website as “a public business entity under the Ministry of Transport, Mobility and Urban Agenda, playing a key role in promoting the railway sector, making the railway the preferred mode of transport and facilitating access to infrastructure on equal terms”.
The category of damage represents the significance of the consequences that, at its highest intensity, could impact the functionality and safety of the railway. The category of damage depends on its nature and the element affected by that damage, including the material it is made of. Some imperfections, at their highest intensity level, cause maximum severity, while other imperfections, even at their highest intensity, only cause intermediate levels of severity. Both types of imperfections can, as they intensify, lead to other deteriorations. The damage category ranges from one to four, where one is a damage category that, even at its maximum intensity, does not significantly affect the infrastructure, and four is a damage category that, at its highest intensity, can significantly impact the bridge.
On the other hand, the intensity of the damage refers to the extent or progression of the damage at the time of the inspection. The intensity value is determined by the user conducting the bridge monitoring, evaluating the progression of each identified damage on a scale from one to four, with one being the least advanced and four being the most advanced.
Table 1 and Table 2 show the names of the damages, along with their respective categories and intensities, for the shaft of the piers and the span beams, respectively. The mentioned tables are excerpts due to their original length.
On the other hand, the damage severity level refers, as the name implies, to how serious the defects in the elements are and whether they could compromise the structural health of the bridge. It is measured on a scale of four levels, which directly depends on the category and intensity of the damage. For this project, an equation is proposed to obtain the severity level of the damages for each bridge element to be inspected. This weighting is proposed to emphasize the value of the damage category since, as mentioned earlier, some deteriorations at their maximum intensity level generate a high severity level, while others at the same intensity level result in low or medium severity levels. However, this is only a proposal to determine the severity value of the elements; thus, it is possible that for other projects, a different equation that better fits that specific purpose may be used. The aforementioned Equation (1) is presented below:
N G = C a t 2 1 I n t 1 + C a t 2 2 I n t 2 + + C a t 2 n I n t n C a t 1 + C a t 2 + + C a t n
where:
NG = Damage severity level.
Cat = Damage category.
Int = Damage intensity.
Finally, the resulting value is rounded to obtain integer values on a scale of one to four. Table 3 describes the significance of each value that can be obtained for the damage severity level for each element of the railway infrastructure and shows the color that the element will carry in the 3D model.

5.4. Creation of an Automated MS Excel® Spreadsheet

With the categories, intensities, and severity levels of the damages, it is possible to create the automated MS Excel® spreadsheet. Initially, the information of all potential bridge elements is transferred so that an automated spreadsheet is available for any type of railway bridge, resulting in eight sheets containing the damage information. After transferring the information, individual sheets are created for each subsection of the bridge parts. For example, from the piers sheet, three new sheets are created: one for the lintel or support beam, another for the shaft, and a third for the foundations. This step results in a total of 27 sheets, where it is possible to select the damage intensities for each element using dropdown lists. These lists are automated with conditional formatting to change the cell color depending on the selected intensity, providing a better visualization of the damage state. This process also determines the severity level of damage for each element.
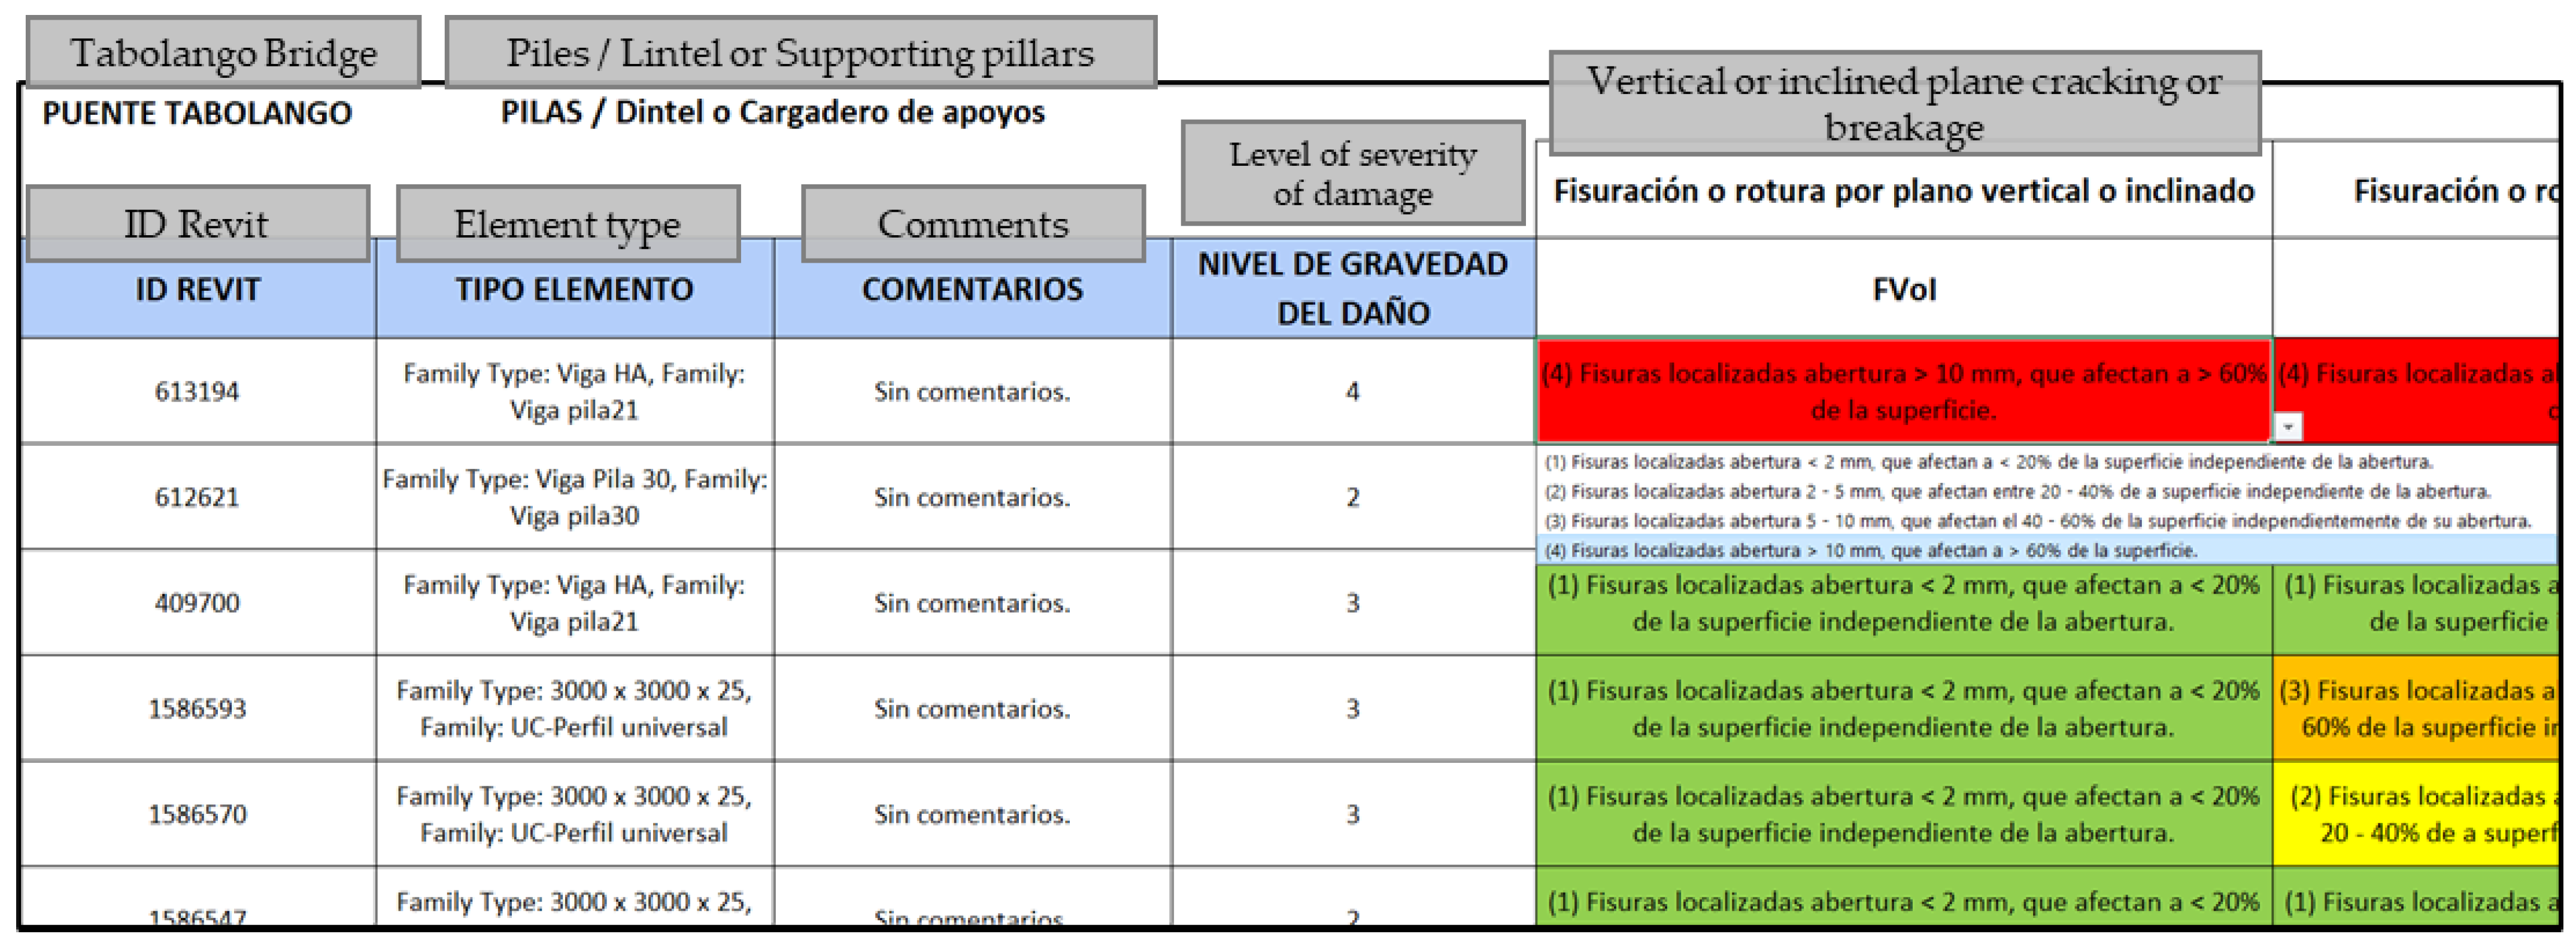
In addition to obtaining the severity levels, the sheets serve as information collectors, including the element ID, type of element, and any comments the user deems necessary. Figure 5 shows an excerpt from one sheet of the automated MS Excel® spreadsheet, illustrating all the previously described features.

5.5. Parameterization of the BIM Model

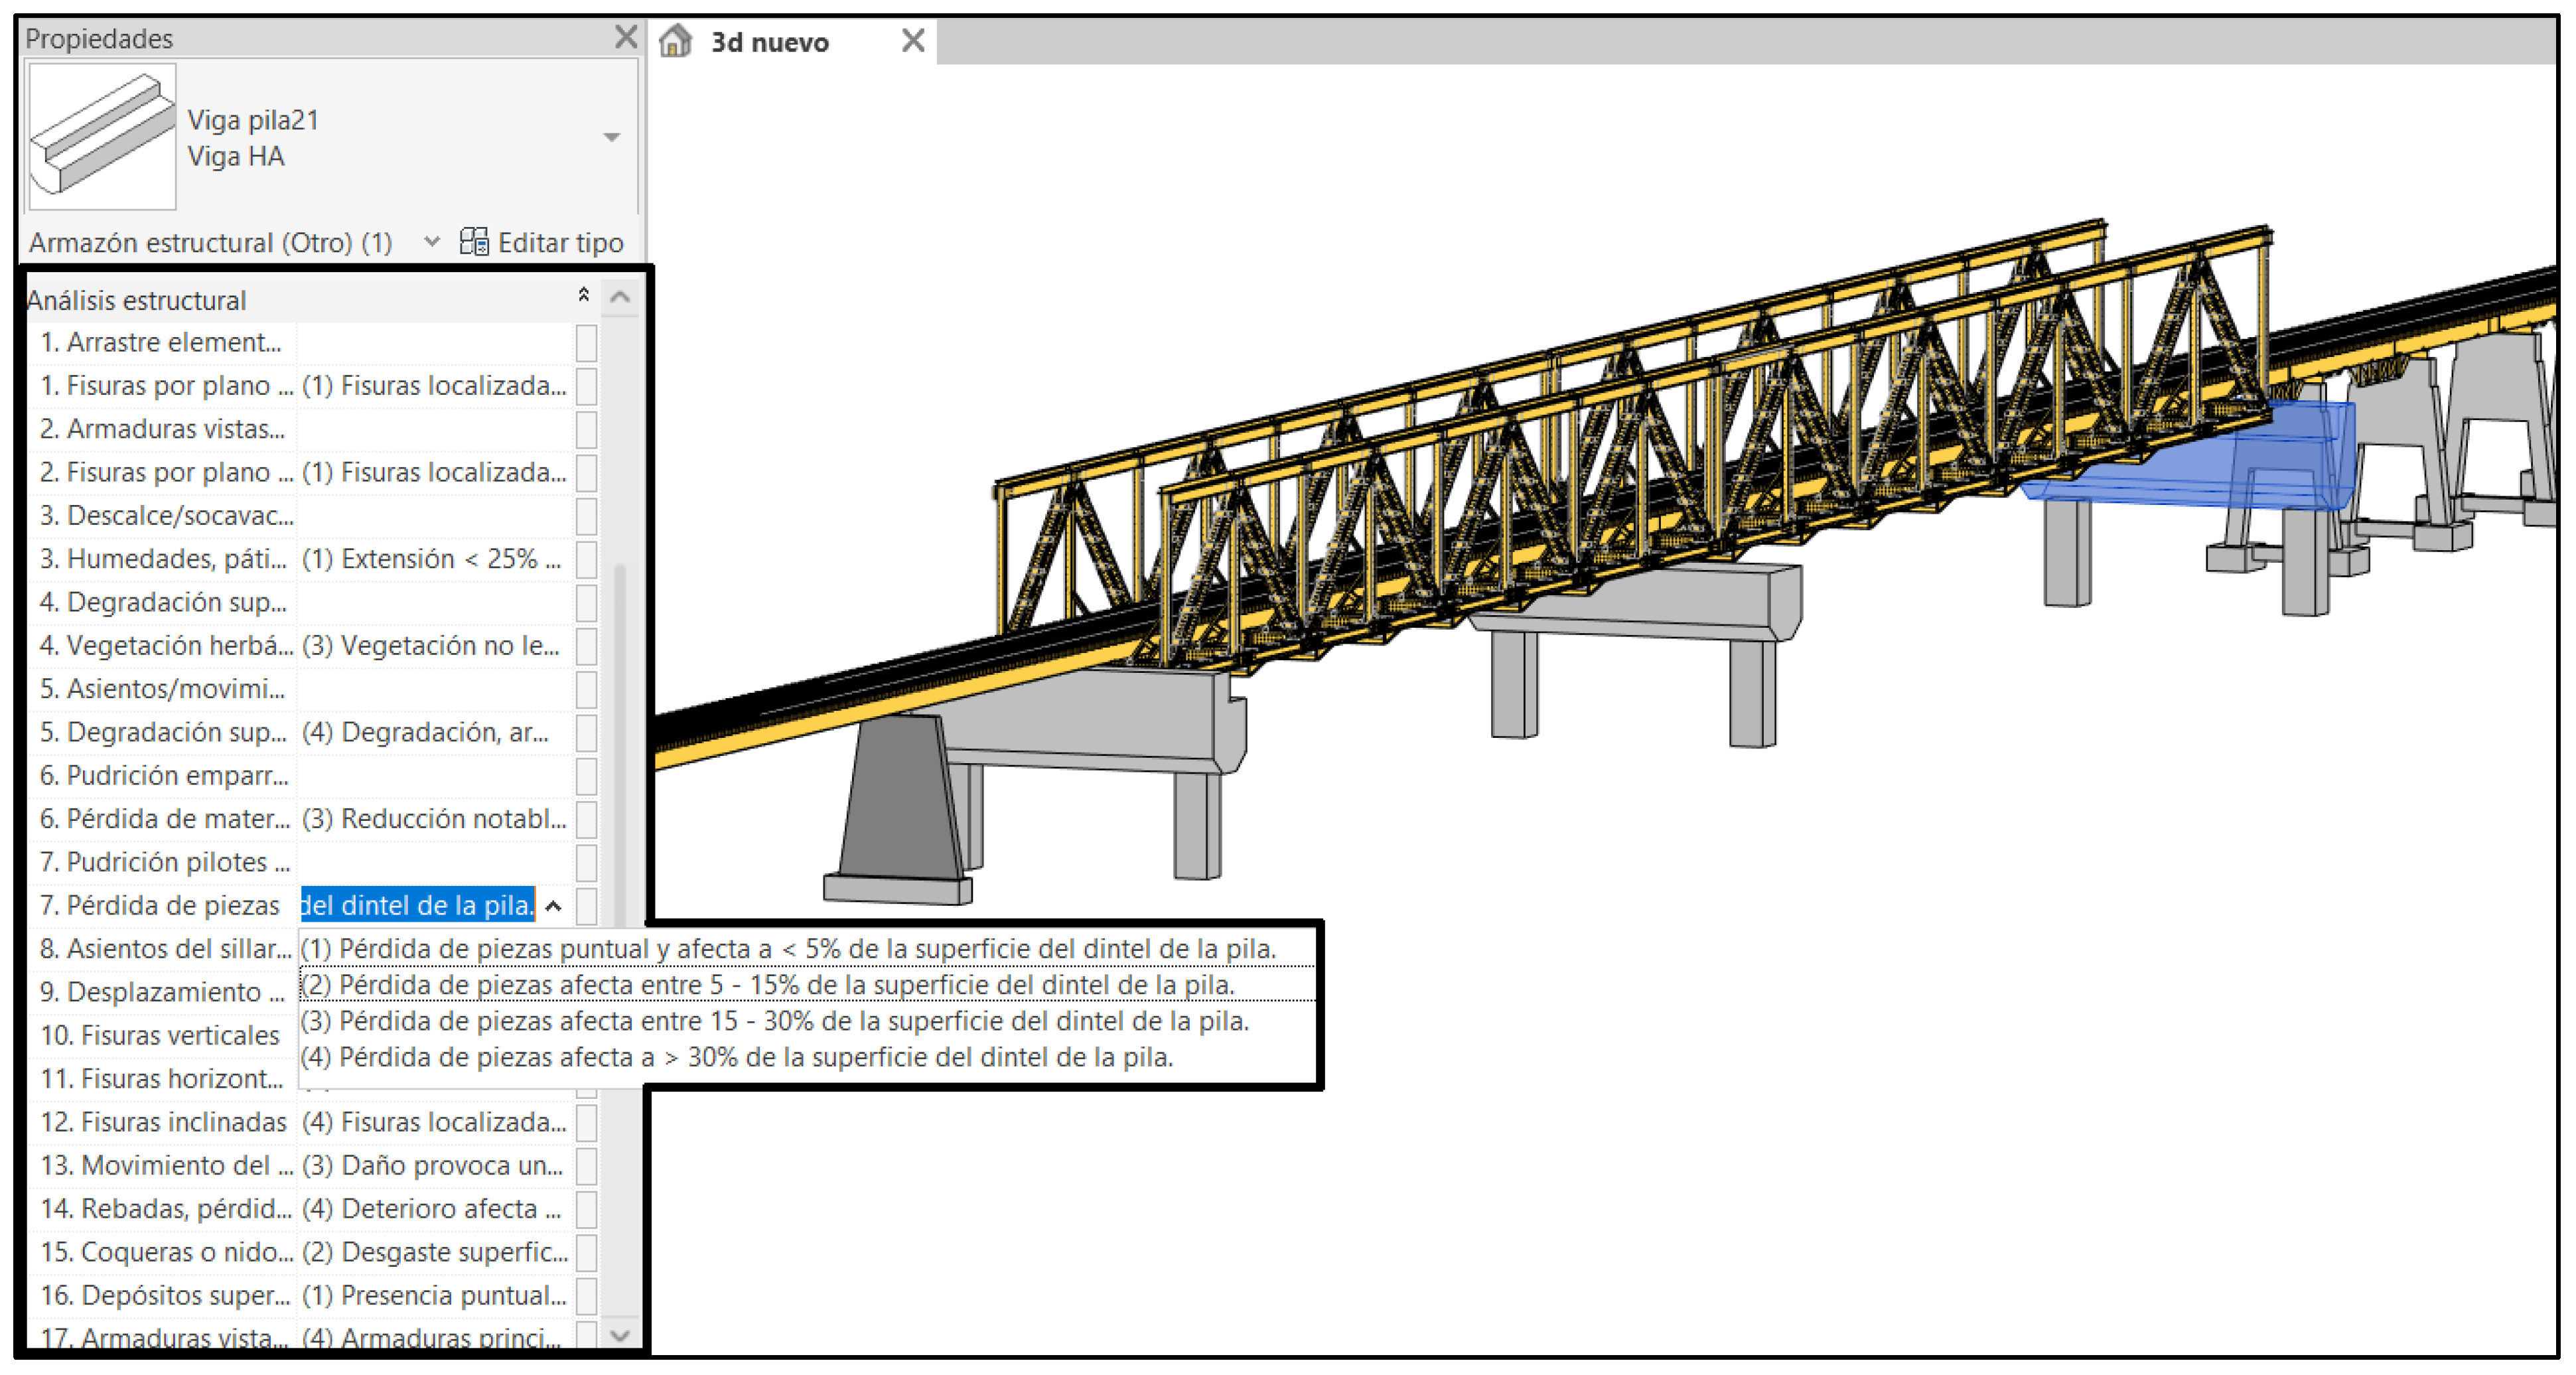
To achieve the BIM/data automation, it was necessary to parameterize the BIM model in Autodesk® Revit® software, creating parameters for the damages to be inspected based on the Adif manual. This ensures that the same information is available in both the BIM model and the spreadsheet. These parameters were grouped under the “Structural Analysis” list, a type of list that the software allows the user to create or modify, which organizes and groups the parameters for easier viewing and searching. The parameters were created and grouped with their respective damage names and intensities, shown in dropdown lists, so that the information and visualization are consistent with the automated spreadsheet.
Additionally, when these parameters are created, the name of the location to be inspected is added, as there may be overlaps in the damage names among the elements of the model, but with different functions. For example, beams (structural framing in Revit®) are mostly found in various subsections of the span, but some beams serve as lintels and/or foundations for the piers. Therefore, it is necessary to identify which damages need to be inspected in these cases. Figure 6 shows the parameters created in the form of dropdown lists within the “Structural Analysis” list. It also illustrates the issue of elements with different functions, leading to parameters with blank intensities, indicating that the inspection does not apply in those cases. It should be noted that if the user marks one of these parameters, the damage intensity would not influence the final result, the damage severity level, as these parameters originally marked as blank are not considered in the formula to obtain the final result.
Additionally, two complementary parameters to those from the Adif manual are created. The first is the “Element ID”, which helps locate a particular element in both the automated spreadsheet and the model. This parameter is grouped in the “Identity Data” list, which also includes original software parameters such as comments, image, and mark, with only comments being used for this project. Figure 7 shows this list with the specified parameters.
The second parameter created is the “NR (1–4)”, representing the risk level of the element, which can take integer values between one and four. This translates to the damage severity level of the element, a parameter grouped under the “Analysis Results” section. Its value is obtained directly from the automated spreadsheet, and once transferred to the BIM model, the element changes color. Figure 8 shows this parameter, which is currently “0”, as the BIM/data automation has not yet been performed.
To facilitate the visualization of the severity level values from the MS Excel® spreadsheet, which translate to the “NR (1–4)” value in the BIM model in Revit®, filters are created in the latter software based on the structural condition of the element. Figure 9 shows the filters created for a correct visualization of the structural condition of the elements.

5.6. Creation of BIM/Data Automation

To achieve the operation of the BIM/data automation, which will serve as the initial step towards a digital twin for monitoring the railway bridge, it was necessary for the automated MS Excel® spreadsheet and the parameterized BIM model in Autodesk® Revit® to be mutually integrated, so that the asset elements have the same information both in the spreadsheet and in the BIM model. To achieve this goal, effective information exchange between MS Excel® and Revit® is required, which is why the extension of the latter software called Dynamo is used. This extension is based on visual programming, which facilitates the creation of custom algorithms to process information by giving values, order, significance, or whatever is deemed appropriate to any element of the BIM model through graphical components called “nodes”.
The information exchange must be orderly and, at the same time, separated for each type of bridge part. For the case of the Tabolango bridge, the parts of the bridge that are programmed are six, which are the lintel, shaft, foundations (these three of the piles), the span, arch (both of the span), and finally the superstructure (belonging to non-structural elements). This means that six sheets of the 27 available are used from the automated spreadsheet.
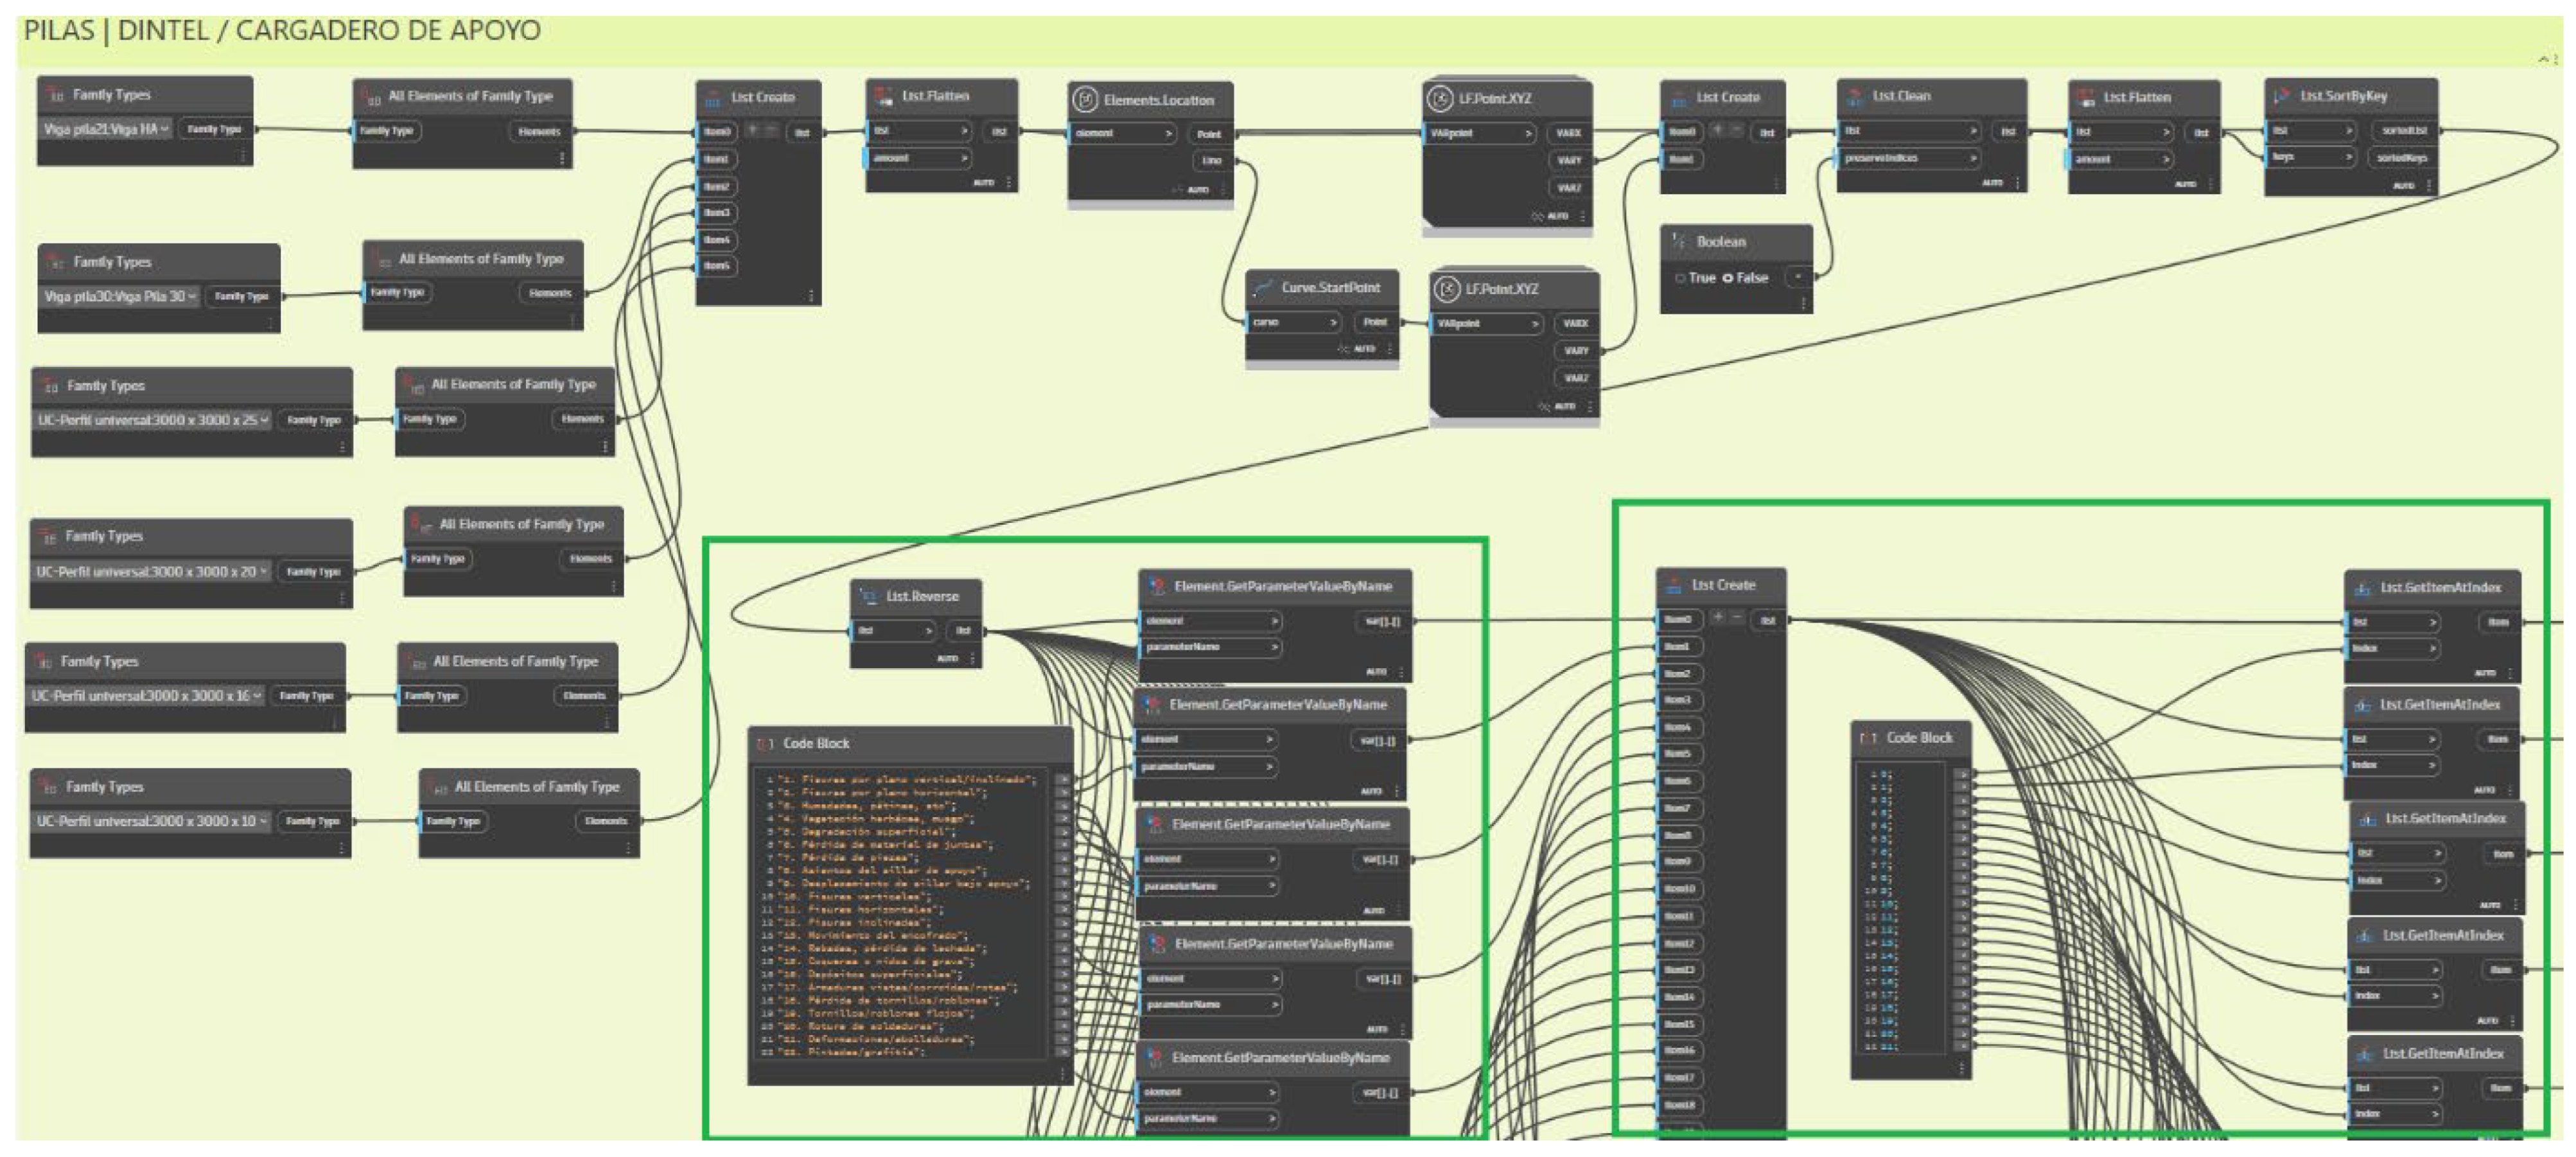
To start with visual programming in Dynamo, two groups must be defined, one where the information is selected and given a specific order so that the data flow is structured, and a second group where the collected information is organized in the spreadsheet. In the first group, the first step is to call the elements and give them an order given a parameter. For this, the “Family Types” and “All Elements of Family Types” nodes are used, which allow bringing the required elements from the model belonging to each section of the bridge. Consequently, it becomes imperative that the elements in the BIM model are well defined to avoid inaccuracies when ordering the elements. The number of aforementioned nodes depends exclusively on the number of families representing a part of the asset, such as the lintels, where for this case there are six families representing all of them in the model. Then, with the “List Create” node, a large list is generated with other lists that are flattened using the “List.Flatten” node, generating only one list with all the called elements. To give the aforementioned order, the “Elements.Location” and “LF.Point.XYZ” nodes are used to order the selected elements based on their coordinates, especially the Y coordinate, thus achieving ordering the elements from north to south since the bridge has that orientation. A list of elements and a list of coordinates are created again, using the “List.Create”, “List.Clean”, and “List.Flatten” nodes, respectively. With the list of elements and coordinates, the “List.SortByKey” node is used to sort the first list based on the values of the second, and if necessary, as in this example, the “List.Reverse” node is used to reverse the list to ensure that the elements are from north to south. Figure 10 shows an excerpt from the first part of this flow.
Once the elements are ordered, the “Element.GetParameterValueByName” node is used to obtain the value of one of the element’s parameters. Therefore, it is necessary to replicate this node as many times as needed to complete all the review parameters. The node has two inputs, the first being the elements in the ordered list, and the second being the names of the damages to be evaluated. Consequently, a “Code Block” node is created, which allows writing all the parameters to be reviewed. At the same time, the “Element.Id” nodes are used to obtain the element’s ID, “Element.ElementType” to deliver the type of element in question, and again “Element.GetParameterValueByName”, but this time with a “Code Block” that says “Comments”. Finally, a new list is created with as many sublists as there are parameters or damage names to review for the elements. The “List.GetItemAtIndex” node takes the value of the damage to be reviewed for each element from the last list created.
Finally, in the second group of the information flow, the “Data.ExportToExcel” node is used, which allows extracting the information of the elements found in the “List.GetItemAtIndex” nodes. Therefore, the values of the damages, the ID, the type, and the comments of each element of the bridge are extracted. Now, the inputs that are completed for the node are the “filePath” (Excel file where the data will go), “sheetName” (name of the file sheet), “startRow” (initial row for data writing), “startColumn” (initial column for data writing), and “data” (data to be written in the file sheet). It must be taken into account that for Dynamo, the initial row and column start at 0, while in Excel, the initial row and column start at 1. Therefore, this must be considered for the information transfer to be correct, avoiding errors in the automated sheet. Finally, the “file Path” node is used to select the MS Excel® file where the information will be transferred. Therefore, the last two nodes are connected to make the information flow effective. Figure 11 shows a part of the second group of the data extraction flow, since, with more than 20 “Data.ExportToExcel” nodes, it cannot be correctly visualized.
The flow depicted in Figure 10 and Figure 11 allows the complete transfer of element parameter information to the corresponding sheets of the automated spreadsheet in an organized manner, where it is possible to modify the information for comments and damage intensities, the latter through dropdown lists. This flow is replicated for the other parts of the bridge, following the same steps. Figure 12 shows an excerpt of the spreadsheet with the information extracted from Revit®.
Likewise, to establish a reciprocal communication between MS Excel® and Autodesk® Revit®, that is, to generate bidirectionality between both software tools, a new algorithm is created using Dynamo that makes it possible to incorporate information from MS Excel® into Revit®. In other words, the data edited in the sheets of the automated spreadsheet will be transferred to the BIM model, thereby keeping the model updated according to the inspections performed.
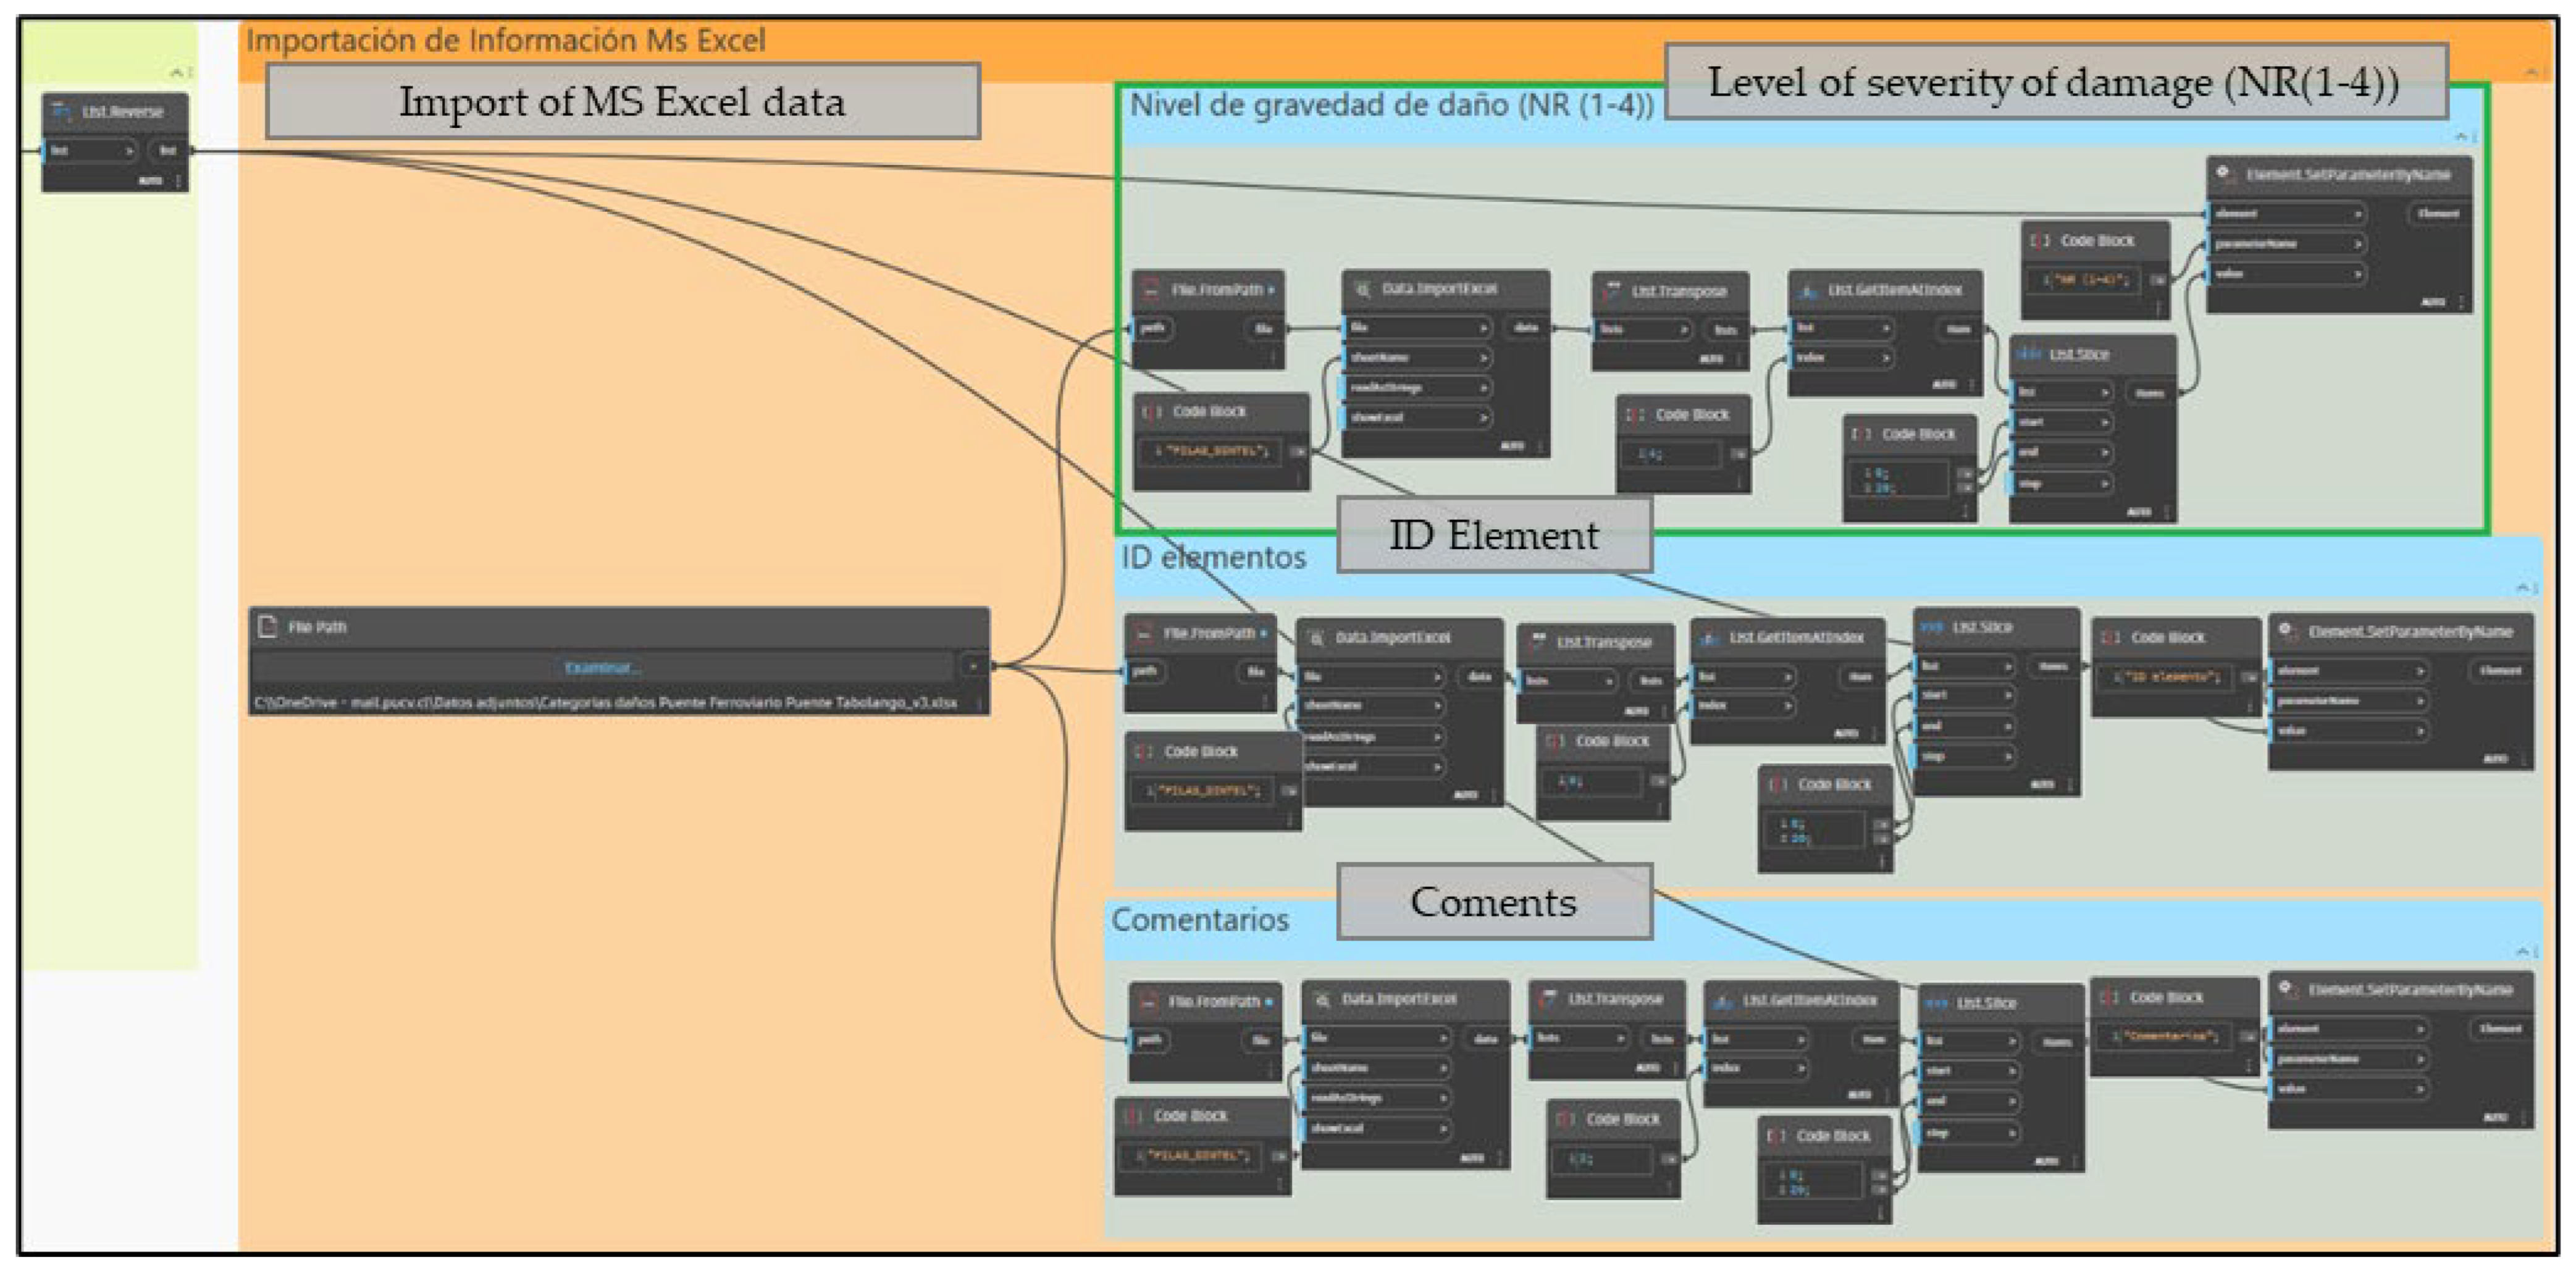
Just like the previous visual programming, two groups are created in the information flow. The first is to generate the same north-to-south order for the elements, and for this, the nodes used are exactly the same as those used in the information flow from Revit® to MS Excel®, from “Family Types” to “List.Reverse”, also employing the same information flow as shown in Figure 13.
The change begins in the second group of the flow, as from the “List.Reverse” node onward, which contains the elements ordered from north to south, it links with the “Element.SetParameterByName” node, which allows assigning a value to one of the element’s parameters. Therefore, in this group, three similar flows are created, changing the parameter to be imported from MS Excel® to the BIM model in Revit® (NR (1–4), ID, and comments). To obtain the values of the elements’ parameters, the “Data.ImportExcel” node is used, which allows reading data from a sheet of an MS Excel® file, that is, from the automated spreadsheet. This node serves to connect the ordered elements from the first group of this flow with the information imported from the automated spreadsheet, which comes from the “File Path” node that selects the MS Excel® file. These data from the spreadsheet are selected and ordered by the “List.Transpose”, “List.GetItemAtIndex”, and “List.Slice” nodes to be linked with the “Element.SetParameterByName” node, with the aim of assigning values to the elements’ parameters that come from the first group of the data import flow. Figure 14 shows this second group described in this paragraph.
The flow depicted in Figure 13 and Figure 14 allows for the transfer of information related to the severity level of the elements, which generates a color change for the component, as well as its corresponding comments and ID, both of which were previously exported from Autodesk® Revit® to MS Excel®, where it is possible to modify the comments but not the ID. This flow is replicated for the other parts of the bridge, following the same steps, changing the elements, sheet names, and locations from which the imported information will be read. Figure 15 shows the railway bridge after both information flows (Revit® to MS Excel® and MS Excel® to Revit®) have been executed, demonstrating the color changes of the bridge elements, as well as presenting the imported data for the ID and severity levels of the elements, along with the comments that can be modified both in the parametrized BIM model and in the automated spreadsheet.

6. Discussion

6.1. General Discussion

This research shows the potential of the designed BIM/data automation as an initial step towards digital twins. This connection between a parametric BIM model and an automated data spreadsheet achieves an updated visual representation of the asset’s condition, which facilitates informed decision-making and the planning of preventive maintenance tasks. Therefore, this BIM/data automation would significantly improve the inspection and maintenance processes for railway bridges.
One of the main contributions of this work is the integration of the parametrized BIM model with the automated data spreadsheet, which allows for clear visualization of the condition of each bridge element, thanks to the color changes generated automatically based on the severity level of the detected damages. This represents a substantial improvement compared to traditional visual inspection methods, which are subjective and prone to human error. It is worth noting that the inspection would still be visual, but the substantial difference is that now it could be carried out with the BIM model on-site, using software capable of visualizing it, where the reported damages of the elements would be selected along with the execution of the BIM/data automation to visualize the condition of the asset right there on-site, which generates a substantial improvement, as previously mentioned, compared to traditional methods.
Another significant achievement of this work is the integration of information, which is normally dispersed across different sources, historically making efficient asset management difficult. By centralizing inspection data in a single data source, the risk of information loss is significantly reduced, and access to historical records is improved. Additionally, the intuitive visualization of the condition of each element through color changes in the BIM model allows for a quick and accurate assessment of the infrastructure.
Another relevant aspect is the ability to perform preventive monitoring, in contrast to the reactive approaches of traditional inspection methods. By having an updated representation of the asset, professionals can anticipate and proactively address potential issues, even on-site when performing inspection tasks, thus avoiding higher costs associated with emergency repairs and/or maintenance.
While the primary focus of this research has been on railway bridges, the principles and tools developed here are not limited to this specific type of infrastructure. Building Information Modeling (BIM) and Bridge Information Modeling (BrIM) methodologies have been successfully applied to a variety of other infrastructure projects, demonstrating their versatility and effectiveness. For instance, BIM has been widely used in the management of buildings, including residential, commercial, and industrial facilities, enhancing the efficiency of maintenance operations and lifecycle management [75,76]. Similarly, the principles of BrIM can be extended to other types of large-scale infrastructure such as tunnels, dams, and highways, where the integration of 3D models and data management systems can significantly improve inspection, maintenance, and rehabilitation processes [77,78,79]. The concept of a digital twin, which underpins both BIM and BrIM, is also gaining traction in various sectors, including smart cities, where it is used for the management of urban infrastructure, energy systems, and utilities [80,81]. By adopting these methodologies, facility managers across different sectors can benefit from improved data integration, visualization, and decision-making capabilities, thereby enhancing the overall efficiency and sustainability of infrastructure management.
The following contributions and innovations are presented in this research:
  • BIM/Data automation: The paper presents the integration of a parametric BIM model in Revit® with an automated spreadsheet in MS Excel® through visual programming in Dynamo. This BIM/data automation serves as an initial step towards creating a digital twin for railway bridges, significantly advancing traditional maintenance methods based on static data that are often difficult to reuse and integrate into a lifecycle management system.
  • Bidirectional data exchange: The developed tool enables a bidirectional flow of information, allowing for the automatic import and export of data between the BIM model and the spreadsheet. This bidirectional exchange ensures that the structural condition of elements is accurately reflected in the BIM model based on real-time inspection data.
  • Enhanced visual management: The automation allows the BIM model to visually reflect the condition of bridge elements by changing their colors based on the severity of the damage. This visual representation provides a clear and immediate understanding of the structural health of the bridge, facilitating more informed decision-making.
  • Centralized information consolidation: By consolidating inspection data into a single, centralized source, the tool reduces the risk of information loss and improves data accessibility. This centralization streamlines the inspection process and enhances the efficiency of maintenance management.
  • Preventive monitoring: The integration of the BIM model and automated spreadsheet supports a preventive approach to bridge maintenance. By providing an up-to-date digital and navigable representation of the bridge’s condition, the tool enables proactive identification and mitigation of potential issues, reducing the need for costly reactive repairs.
  • Application in the case study: The methodology and tool were applied to a railway bridge in use, demonstrating the practical applicability and effectiveness of the proposed system. The case study highlights the tool’s capability to handle complex real-world scenarios and its potential for widespread adoption.
  • Foundation for digital twins: The research lays the groundwork for adopting digital twins in the monitoring and maintenance of railway bridges. Digital twins offer significant advantages, such as real-time monitoring, predictive maintenance, and improved decision-making processes.
  • Interoperability with related standards: The tool incorporates technical standards from Adif for defining damage categories and intensities, ensuring that the inspection criteria are aligned with established industry guidelines. This standardization enhances the reliability and accuracy of the inspection data. Additionally, using a reference standard with structured concepts enhances the scalability and interoperability of the tool, allowing for increased granularity, addition of new components, or expansion of the damage ontology.
  • Customizable and scalable tool: The automated spreadsheet is designed to be generic and applicable to any railway bridge, with the flexibility to adjust element names, parameters, and sheets according to specific projects. This scalability makes the tool adaptable to various types of infrastructure.

6.2. Practical Implications

The process designed in this research on the automation between the BIM model and the automated spreadsheet has practical applications in various areas related to the facility management of railway infrastructures:
  • Inspection and maintenance of railway bridges: The main application of the automation focuses on improving the processes of inspection, monitoring, and maintenance of railway bridges, particularly in inspection. By clearly visualizing the condition of each element and consolidating the information into a single source, decision-making regarding future maintenance actions is facilitated, following a preventive approach.
  • Facility management: This can be particularly useful for companies and organizations responsible for the FM of railway bridges, as well as being part of an integrated management system for such assets. By having precise and updated information about the condition of the bridges, resource allocation and planning of inspection and maintenance activities can be optimized, ensuring safety and continuity of service.
  • Training and education: The parametric BIM model and the visualization of the elements’ condition can be used as training and education tools for the personnel responsible for monitoring and maintaining railway bridges. This is of great value to professionals in charge of bridge inspections, as it provides an integrated platform to efficiently and accurately record and analyze data.
  • Documentation and historical record: It allows maintaining a detailed historical record of all inspections, detected damages, and maintenance actions carried out on a railway bridge. This information can be valuable for audits, research, long-term analysis, etc.

6.3. Limitations

Despite the advances and benefits of the designed tool, and in light of specific objective (c) stated at the beginning of this paper, it is necessary to consider the following limitations of this work:
  • The first limitation focuses on the damage intensities. This information available for each bridge element can be exported from Autodesk® Revit® to MS Excel®, but not the other way around. This is reflected in the proposed workflow of the tool because the spreadsheet contains all the damage intensities marked from the BIM model during the on-site visit, and the damage severity level value for each element is obtained, which is then imported into the model and changes the color of the elements. This is designed with the idea that during the on-site monitoring visit, it is more convenient to perform it with the help of software that allows the visualization of the BIM model, enabling the selection of damage intensities, rather than with the help of the automated spreadsheet on-site. However, if a change in intensity from MS Excel® is desired, it is possible to make the change and note it in the comments so that the intensity of the damage is modified in the model.
  • The second limitation lies in the bidirectionality of the project, as the reciprocity of the components is only total in the pile divisions, that is, in the support lintels, shafts, and foundations, while for the beams and arches of the span and the superstructure of the non-structural elements, it is not possible to export the damage intensity parameters because these components were not parameterized. However, the comments and ID of the elements do have the desired bidirectionality, and the damage severity level can be imported for all bridge components, which explains why all elements of the model have a value in the “NR (1–4)” parameter.
  • Although the automated spreadsheet is designed to be generic and applicable to any type of bridge, it is necessary to adjust the names of the elements, parameters, and sheets according to the specific case, which requires additional configuration effort.
These limitations open up opportunities for future research and improvements in this BIM/data automation to achieve a digital twin for the monitoring and maintenance of railway bridges.

7. Conclusions

This research has addressed the existing problems in traditional railway bridge inspection methods, which mainly rely on visual inspections. These inspections often result in dispersed information across various sources and formats, a lack of an integral view of the infrastructure, and reactive rather than preventive approaches. These limitations directly affect the reliability, accuracy, and efficiency of inspection processes and, in turn, maintenance, which can have significant implications in terms of costs, safety, and the lifespan of these critical infrastructures.
In contrast, the potential of integrating a parametric BIM model and an automated database to generate BIM/data automation as an initial step towards a digital twin offers a promising solution to overcome these limitations. The benefits of this technology include interoperability, collaboration, reduction of information loss, improved data accessibility, support in decision-making, and the possibility of continuous and preventive monitoring, significantly improving these processes in railway bridges.
  • In this context, the BIM/data automation designed in this research, which integrates a parametrized BIM model with an automated data spreadsheet created from the Adif inspection manual, has several key functionalities.
  • Clear visualization of the condition of each bridge element through automatic color changes based on the severity level of detected damages.
  • Consolidation and centralized management of all information related to the bridge inspection in a single data source, significantly reducing the risk of information loss.
  • Ability to export and import data bidirectionally between the BIM model and the data spreadsheet, facilitating the updating and synchronization of information.
  • Historical record of all inspections, detected damages, and possible maintenance actions carried out on the railway bridge.
  • Additionally, the same automated spreadsheet created in this research can be used for any railway bridge, only requiring configuration when programming in Dynamo.
While significant progress has been made, some limitations have been identified, such as the inability to directly export damage intensities from the automated spreadsheet to the BIM model and the lack of bidirectionality for the remaining bridge elements.
These limitations open up new lines of future research focused on overcoming these restrictions and expanding the scope and functionalities of this automation, potentially achieving a digital twin. Therefore, some future research lines could focus on addressing current limitations, such as the lack of complete bidirectionality in the export/import of damage intensities between the BIM model and the data spreadsheet, and exploring the integration of sensor technologies and real-time data collection to advance towards a digital twin of the railway bridge.
In summary, this research has demonstrated the potential of automation between a parametric BIM model and a data spreadsheet to significantly improve the inspection process for railway bridges. This designed BIM/data automation represents a significant advancement in this field, addressing several limitations of traditional methods and laying the foundation for the generation of future digital twins. However, there are still opportunities for improvement and additional research areas to fully leverage the potential of this technology in the management of critical infrastructures such as railway bridges.

Author Contributions

Software, S.C.-L.; Validation, F.M.L.R., E.A. and R.F.H.; Formal analysis, F.M.L.R. and E.A.; Investigation, S.C.-L.; Resources, F.M.L.R.; Writing—original draft, S.C.-L.; Writing—review & editing, F.M.L.R. and E.A.; Supervision, F.M.L.R., E.A. and R.F.H.; Project administration, F.M.L.R. All authors have read and agreed to the published version of the manuscript.

Funding

This research received no external funding.

Institutional Review Board Statement

Not applicable.

Informed Consent Statement

Not applicable.

Data Availability Statement

The data presented in this study are available on request from the corresponding author. The data are not publicly available due to privacy or ethical restrictions.

Conflicts of Interest

The authors declare no conflicts of interest.

References

  1. Frangopol, D.M.; Beck, A.T.; Bittencourt, T.N. Maintenance, monitoring, safety, risk and resilience of bridges and bridge networks. In Proceedings of the Eighth International Conference on Bridge Maintenance, Safety and Management (IABMAS 2016), Foz do Iguaçu, Brazil, 26–30 June 2016. [Google Scholar]
  2. Park, G.; Lee, J.H.; Yoon, H. Semantic structure from motion for railroad bridges using deep learning. Appl. Sci. 2021, 11, 4332. [Google Scholar] [CrossRef]
  3. Tita, E.E.; Watanabe, G.; Shao, P.; Arii, K. Development and Application of Digital Twin–BIM Technology for Bridge Management. Appl. Sci. 2023, 13, 7435. [Google Scholar] [CrossRef]
  4. Azhar, A.S.; Kudus, S.A.; Jamadin, A.; Mustaffa, N.K.; Sugiura, K. Recent vibration-based structural health monitoring on steel bridges: Systematic literature review. Ain Shams Eng. J. 2024, 15, 102501. [Google Scholar] [CrossRef]
  5. Tung, P.-C.; Hwang, Y.-R.; Wu, M.-C. The Development of a Mobile Manipulator Imaging System for Bridge Crack Inspection. Available online: www.elsevier.com/locate/autcon (accessed on 1 December 2023).
  6. Costa, B.J.A.; Figueiras, J.A. Evaluation of a strain monitoring system for existing steel railway bridges. J. Constr. Steel Res. 2012, 72, 179–191. [Google Scholar] [CrossRef]
  7. Sutter, B.; Lelevé, A.; Pham, M.T.; Gouin, O.; Jupille, N.; Kuhn, M.; Lulé, P.; Michaud, P.; Rémy, P. A semi-autonomous mobile robot for bridge inspection. Autom. Constr. 2018, 91, 111–119. [Google Scholar] [CrossRef]
  8. Chan, B.; Guan, H.; Hou, L.; Jo, J.; Blumenstein, M.; Wang, J. Defining a conceptual framework for the integration of modelling and advanced imaging for improving the reliability and efficiency of bridge assessments. J. Civ. Struct. Health Monit. 2016, 6, 703–714. [Google Scholar] [CrossRef]
  9. Mohammadi, M.; Rashidi, M.; Yu, Y.; Samali, B. Integration of TLS-derived Bridge Information Modeling (BrIM) with a Decision Support System (DSS) for digital twinning and asset management of bridge infrastructures. Comput. Ind. 2023, 147, 103881. [Google Scholar] [CrossRef]
  10. Bocchini, P.; Frangopol, D.M.; Ummenhofer, T.; Zinke, T. Resilience and Sustainability of Civil Infrastructure: Toward a Unified Approach. J. Infrastruct. Syst. 2014, 20, 04014004. [Google Scholar] [CrossRef]
  11. Girardet, A.; Boton, C. A parametric BIM approach to foster bridge project design and analysis. Autom. Constr. 2021, 126, 103679. [Google Scholar] [CrossRef]
  12. Tzortzinis, G.; Ai, C.; Breña, S.F.; Gerasimidis, S. Using 3D laser scanning for estimating the capacity of corroded steel bridge girders: Experiments, computations and analytical solutions. Eng. Struct. 2022, 265, 114407. [Google Scholar] [CrossRef]
  13. Kaewunruen, S.; Sresakoolchai, J.; Zhou, Z. Sustainability-based lifecycle management for bridge infrastructure using 6D BIM. Sustainability 2020, 12, 2436. [Google Scholar] [CrossRef]
  14. Chen, S.S.; Shirolé, A.M. Integration of Information and Automation Technologies in Bridge Engineering and Management: Extending the State of the Art. Transp. Res. Rec. J. Transp. Res. Board 2006, 1976, 2–12. [Google Scholar] [CrossRef]
  15. NBR9452—Arquivo para Impressão. Available online: https://pdfcoffee.com/nbr9452-arquivo-para-impressao-pdf-free.html (accessed on 9 July 2024).
  16. DNIT Inspeções em Pontes e Viadutos de Concreto Armado e Protendido—Procedimento. Available online: https://www.gov.br/dnit/pt-br/assuntos/planejamento-e-pesquisa/ipr/coletanea-de-normas/coletanea-de-normas/procedimento-pro/DNIT_010_2004_PRO (accessed on 9 July 2024).
  17. Brasileira, N. ABNT NBR. 2013. Available online: www.abnt.org.br (accessed on 9 July 2024).
  18. Perno, M.; Hvam, L.; Haug, A. Implementation of digital twins in the process industry: A systematic literature review of enablers and barriers. Comput. Ind. 2021, 134, 103558. [Google Scholar] [CrossRef]
  19. Mohammadi, M.; Rashidi, M.; Mousavi, V.; Yu, Y.; Samali, B. Application of TLS Method in Digitization of Bridge Infrastructures: A Path to BrIM Development. Remote Sens. 2022, 14, 1148. [Google Scholar] [CrossRef]
  20. Agnisarman, S.; Lopes, S.; Madathil, K.C.; Piratla, K.; Gramopadhye, A. A survey of automation-enabled human-in-the-loop systems for infrastructure visual inspection. Autom. Constr. 2018, 97, 52–76. [Google Scholar] [CrossRef]
  21. Omer, M.; Margetts, L.; Mosleh, M.H.; Cunningham, L.S. Inspection of Concrete Bridge Structures: Case Study Comparing Conventional Techniques with a Virtual Reality Approach. J. Bridg. Eng. 2021, 26, 05021010. [Google Scholar] [CrossRef]
  22. Muñoz-La Rivera, F.; Mora-Serrano, J.; Valero, I.; Oñate, E. Methodological-Technological Framework for Construction 4.0. Arch. Comput. Methods Eng. 2021, 28, 689–711. [Google Scholar] [CrossRef]
  23. Cano, M.; Pastor, J.L.; Tomás, R.; Riquelme, A.; Asensio, J.L. A New Methodology for Bridge Inspections in Linear Infrastructures from Optical Images and HD Videos Obtained by UAV. Remote Sens. 2022, 14, 1244. [Google Scholar] [CrossRef]
  24. Venglár, M.; Lamperová, K.; Sokol, M. Performance assessment of steel truss railway bridge with curved track. Acta Polytech. 2022, 62, 558–566. [Google Scholar] [CrossRef]
  25. Indika, W.A.; Wijesooriya, P.; Siriwardane, S.C.; Dissanayake, P.B.R.; Wijesooriya, P. Vibration measurement-based simple technique for structural appraisal of steel bridges. In Proceedings of the 5th International Conference on Computational Methods in Structural Dynamics and Earthquake Engineering Methods in Structural Dynamics and Earthquake Engineering, Crete Island, Greece, 25–27 May 2015. [Google Scholar] [CrossRef]
  26. Popescu, C.; Täljsten, B.; Blanksvärd, T.; Sas, G.; Jimenez, A.; Gärdin, D.C.; Elfgren, L.; Carolin, A. Optical methods and wireless sensors for monitoring of bridges. In IABSE Symposium, Guimaraes 2019: Towards a Resilient Built Environment Risk and Asset Management—Report; International Association for Bridge and Structural Engineering (IABSE): Zurich, Switzerland, 2019; pp. 1191–1198. [Google Scholar] [CrossRef]
  27. Aglietti, A.; Biagini, C.; Bongini, A.; Ottobri, P. Historic bridges monitoring through sensor data management with bim methodologies. In International Archives of the Photogrammetry, Remote Sensing and Spatial Information Sciences—ISPRS Archives; International Society for Photogrammetry and Remote Sensing: Bethesda, MD, USA, 2023; pp. 33–41. [Google Scholar] [CrossRef]
  28. Gharehbaghi, V.R.; Noroozinejad Farsangi, E.; Noori, M.; Yang, T.Y.; Li, S.; Nguyen, A.; Málaga-Chuquitaype, C.; Gardoni, P.; Mirjalili, S. A Critical Review on Structural Health Monitoring: Definitions, Methods, and Perspectives. Arch. Comput. Methods Eng. 2022, 29, 2209–2235. [Google Scholar] [CrossRef]
  29. Carnevale, M.; Collina, A.; Peirlinck, T. A feasibility study of the drive-by method for damage detection in railway bridges. Appl. Sci. 2019, 9, 160. [Google Scholar] [CrossRef]
  30. Samadi, D.; Taghaddos, H.; Nili, M.H.; Noghabaei, M. Development of a Bridge Maintenance System Using Bridge Information Modeling. Civ. Eng. Infrastruct. J. 2021, 54, 351–364. [Google Scholar] [CrossRef]
  31. Thomson, I.; Angerstein, D. Historia del Ferrocarril en Chile; DIBAM, Centro de Investigaciones Diego Barros Arana: Santiago, Chile, 2000. [Google Scholar]
  32. Luo, X.; Haya, H.; Inaba, T.; Shiotani, T.; Nakanishi, Y. Damage evaluation of railway structures by using train-induced AE. Constr. Build. Mater. 2004, 18, 215–223. [Google Scholar] [CrossRef]
  33. Zhao, J.; Feng, H.; Chen, Q.; de Soto, B.G. Developing a conceptual framework for the application of digital twin technologies to revamp building operation and maintenance processes. J. Build. Eng. 2022, 49, 104028. [Google Scholar] [CrossRef]
  34. Lebelt, P.; Gehrke, J. Korrosionsschutztechnologie für Montageschweißstöße einer feuerverzinkten Stahlbrücke. Stahlbau 2017, 86, 191–196. [Google Scholar] [CrossRef]
  35. Linh, B.; Le, H. Modelling Railway Bridge Asset Management. Proc. Inst. Mech. Eng. Part F J. Rail Rapid Transit 2013, 227, 644–656. [Google Scholar]
  36. Adasooriya, N.; Siriwardane, S.C. Remaining fatigue life estimation of railway bridge members subjected to time-dependent corrosion. In Proceedings of the IABSE Conference, Geneva 2015: Structural Engineering: Providing Solutions to Global Challenges—Report, Geneva, Switzerland, 23–25 September 2015; International Association for Bridge and Structural Engineering (IABSE): Zurich, Switzerland, 2015; pp. 1112–1119. [Google Scholar] [CrossRef]
  37. Calvert, G.; Neves, L.; Andrews, J.; Hamer, M. Multi-defect modelling of bridge deterioration using truncated inspection records. Reliab. Eng. Syst. Saf. 2020, 200, 106962. [Google Scholar] [CrossRef]
  38. Bujňák, J.; Gocál, J.; Hlinka, R. Assessment of Railway Steel Bridge Structures. Procedia Eng. 2016, 156, 75–82. [Google Scholar] [CrossRef]
  39. Akcamete, A.; Akinci, B.; Garrett, J.H. Potential Utilization of Building Information Models for Planning Maintenance Activities. 2010. Available online: https://www.researchgate.net/publication/260056325 (accessed on 9 July 2024).
  40. Salzano, A.; Parisi, C.M.; Acampa, G.; Nicolella, M. Existing assets maintenance management: Optimizing maintenance procedures and costs through BIM tools. Autom. Constr. 2023, 149, 104788. [Google Scholar] [CrossRef]
  41. Elyasi, N.; Bellini, A.; Klungseth, N.J. Digital transformation in facility management: An analysis of the challenges and benefits of implementing digital twins in the use phase of a building. In Proceedings of the IOP Conference Series: Earth and Environmental Science, Trondheim, Norway, 11 May 2023. [Google Scholar] [CrossRef]
  42. Torzoni, M.; Tezzele, M.; Mariani, S.; Manzoni, A.; Willcox, K.E. A digital twin framework for civil engineering structures. Comput. Methods Appl. Mech. Eng. 2024, 418, 116584. [Google Scholar] [CrossRef]
  43. Liu, Q.; Gao, T. The Information Requirements for Transportation Industry’s Facilities Management Based on BIM. Open Constr. Build. Technol. J. 2017, 11, 136–141. [Google Scholar] [CrossRef]
  44. Aladağ, H.; Demirdöğen, G.; Demirbağ, A.T.; Işık, Z. Understanding the perception differences on BIM adoption factors across the professions of AEC industry. Ain Shams Eng. J. 2023, 14, 102545. [Google Scholar] [CrossRef]
  45. El-Din, M.N.; Pereira, P.F.; Martins, J.P.; Ramos, N.M.M. Digital Twins for Construction Assets Using BIM Standard Specifications. Buildings 2022, 12, 2155. [Google Scholar] [CrossRef]
  46. Park, C.; Pour Rahimian, F.; Dawood, N.; Pedro, A.; Dongmin, L.; Hussain, R.; Soltani, M. Digitalization in Construction Recent Trends and Advances; Taylor & Francis: London, UK, 2023; ISBN 9781003408949. [Google Scholar] [CrossRef]
  47. Nhamage, S.A. Development of BIM-Based Digital Twin Model for Fatigue Assessment in Metallic Railway Bridges. U.Porto J. Eng. 2023, 9, 12–23. [Google Scholar] [CrossRef]
  48. Kaewunruen, S.; AbdelHadi, M.; Kongpuang, M.; Pansuk, W.; Remennikov, A.M. Digital Twins for Managing Railway Bridge Maintenance, Resilience, and Climate Change Adaptation. Sensors 2022, 23, 252. [Google Scholar] [CrossRef] [PubMed]
  49. Costin, A.; Adibfar, A.; Hu, H.; Chen, S.S. Building Information Modeling (BIM) for transportation infrastructure—Literature review, applications, challenges, and recommendations. Autom. Constr. 2018, 94, 257–281. [Google Scholar] [CrossRef]
  50. VanDerHorn, E.; Mahadevan, S. Digital Twin: Generalization, characterization and implementation. Decis. Support Syst. 2021, 145, 113524. [Google Scholar] [CrossRef]
  51. Kang, J.-S.; Chung, K.; Hong, E.J. Multimedia knowledge-based bridge health monitoring using digital twin. Multimed. Tools Appl. 2021, 80, 34609–34624. [Google Scholar] [CrossRef]
  52. Bergs, T.; Gierlings, S.; Auerbach, T.; Klink, A.; Schraknepper, D.; Augspurger, T. The concept of digital twin and digital shadow in manufacturing. Procedia CIRP 2021, 101, 81–84. [Google Scholar] [CrossRef]
  53. Hilal, M.; Maqsood, T.; Abdekhodaee, A. A scientometric analysis of BIM studies in facilities management. Int. J. Build. Pathol. Adapt. 2019, 37, 122–139. [Google Scholar] [CrossRef]
  54. Rosen, R.; von Wichert, G.; Lo, G.; Bettenhausen, K.D. About the importance of autonomy and digital twins for the future of manufacturing. IFAC-PapersOnLine 2015, 48, 567–572. [Google Scholar] [CrossRef]
  55. Lawrence, C.; Tuunanen, T.; Myers, M.D. Extending Design Science Research Methodology for a Multicultural World. In Proceedings of the Human Benefit through the Diffusion of Information Systems Design Science Research: IFIP WG 8.2/8.6 International Working Conference, Perth, Australia, 30 March–1 April 2010. [Google Scholar]
  56. Peffers, K.; Tuunanen, T.; Rossi, M. The Design Science Research Process: A Model for Producing and Presenting Information Systems Research. 2006. Available online: https://www.researchgate.net/publication/238077290 (accessed on 1 December 2023).
  57. Aldea, L.E.; Barquín, J.A.G. Historia y futuro del mantenimiento y la vigilancia de los puentes ferroviarios. Hormig. Acero 2021, 72, 151–161. [Google Scholar] [CrossRef]
  58. Zhang, A.; Yang, J.; Wang, F. Application and enabling digital twin technologies in the operation and maintenance stage of the AEC industry: A literature review. J. Build. Eng. 2023, 80, 107859. [Google Scholar] [CrossRef]
  59. Leander, J.; Andersson, A.; Karoumi, R. Enhanced assessment of the remaining service life of a steel railway bridge. Key Eng. Mater. 2009, 413–414, 245–252. [Google Scholar] [CrossRef]
  60. Ko, J.M.; Ni, Y.-Q. Technology developments in structural health monitoring of large-scale bridges. Eng. Struct. 2005, 27, 1715–1725. [Google Scholar] [CrossRef]
  61. Luo, X.; Haya, H.; Inaba, T.; Shiotani, T.; Nakanishi, Y. Secondary AE Techniques for Non-Destructive Inspection of Railway Structures. Q. Rep. RTRI 2003, 44, 154–159. [Google Scholar] [CrossRef]
  62. Akintunde, E.; Azam, S.E.; Linzell, D.G. Singular value decomposition and unsupervised machine learning for virtual strain sensing: Application to an operational railway bridge. Structures 2023, 58, 105417. [Google Scholar] [CrossRef]
  63. Frigui, F.; Faye, J.; Martin, C.; Dalverny, O.; Peres, F.; Judenherc, S. Global methodology for damage detection and localization in civil engineering structures. Eng. Struct. 2018, 171, 686–695. [Google Scholar] [CrossRef]
  64. Rakoczy, A.M. Estimation of the current structural reliability level of existing railway bridges and viaducts. Roads Bridges Drogi Mosty 2021, 20, 289–309. [Google Scholar] [CrossRef]
  65. Kale, A.; Kassa, Y.; Ricks, B.; Gandhi, R. A Comparative Assessment of Bridge Deck Wearing Surfaces: Performance, Deterioration, and Maintenance. Appl. Sci. 2023, 13, 10883. [Google Scholar] [CrossRef]
  66. Seo, M.B.; Lee, D. Development of railway infrastructure bim prototype libraries. Appl. Sci. 2020, 10, 8118. [Google Scholar] [CrossRef]
  67. Ospina-Bohórquez, A.; López-Rebollo, J.; Muñoz-Sánchez, P.; González-Aguilera, D. A Digital Twin for Monitoring the Construction of a Wind Farm. Infrastructures 2023, 8, 10. [Google Scholar] [CrossRef]
  68. Negri, E.; Fumagalli, L.; Macchi, M. A Review of the Roles of Digital Twin in CPS-based Production Systems. Procedia Manuf. 2017, 11, 939–948. [Google Scholar] [CrossRef]
  69. Opoku, D.-G.J.; Perera, S.; Osei-Kyei, R.; Rashidi, M. Digital twin application in the construction industry: A literature review. J. Build. Eng. 2021, 40, 102726. [Google Scholar] [CrossRef]
  70. Huang, W.; Zhang, Y.; Zeng, W. Development and application of digital twin technology for integrated regional energy systems in smart cities. Sustain. Comput. Inform. Syst. 2022, 36, 100781. [Google Scholar] [CrossRef]
  71. Hosamo, H.H.; Nielsen, H.K.; Alnmr, A.N.; Svennevig, P.R.; Svidt, K. A review of the Digital Twin technology for fault detection in buildings. Front. Built Environ. 2022, 8, 1013196. [Google Scholar] [CrossRef]
  72. Jiang, F.; Ma, L.; Broyd, T.; Chen, K. Digital twin and its implementations in the civil engineering sector. Autom. Constr. 2021, 130, 103838. [Google Scholar] [CrossRef]
  73. Anales del Instituto de Ingenieros de Chile. Puente Sobre el río Aconcagua en el Ferrocarril de San Pedro al Puerto de Quintero; Anales del Instituto de Ingenieros de Chile: Santiago, Chile, 2014; p. 504. Available online: https://rchdt.uchile.cl/index.php/AICH/article/view/33763 (accessed on 1 December 2023).
  74. ADIF. Inspección Principal de Puentes de Ferrocarril. NAP 2-4-1.0. Norma ADIF Plataforma. Segunda Edición: Enero 2023. Available online: https://drive.google.com/drive/folders/1FMI4yRUPQMK3AFyYt_FLKVnq07RC5NUf?usp=sharing (accessed on 9 July 2024).
  75. Volk, R.; Stengel, J.; Schultmann, F. Building Information Modeling (BIM) for existing buildings—Literature review and future needs. Autom. Constr. 2014, 38, 109–127. [Google Scholar] [CrossRef]
  76. Asare, K.A.B.; Liu, R.; Anumba, C.J. Building information modelling for airport facility management: The case of a US airport. Infrastruct. Asset Manag. 2024, 11, 3–14. [Google Scholar] [CrossRef]
  77. Zhou, Y.; Bao, T.; Shu, X.; Li, Y.; Li, Y. BIM and ontology-based knowledge management for dam safety monitoring. Autom. Constr. 2023, 145, 104649. [Google Scholar] [CrossRef]
  78. Zhang, L.; Wu, X.; Ding, L.; Skibniewski, M.J.; Lu, Y. Bim-Based Risk Identification System in tunnel construction. J. Civ. Eng. Manag. 2016, 22, 529–539. [Google Scholar] [CrossRef]
  79. Castañeda, K.; Sánchez, O.; Herrera, R.F.; Gómez-Cabrera, A.; Mejía, G. Building Information Modeling Uses and Complementary Technologies in Road Projects: A Systematic Review. Buildings 2024, 14, 563. [Google Scholar] [CrossRef]
  80. Liu, Z.; Chi, Z.; Osmani, M.; Demian, P. Blockchain and building information management (Bim) for sustainable building development within the context of smart cities. Sustainability 2021, 13, 2090. [Google Scholar] [CrossRef]
  81. Marzouk, M.; Othman, A. Planning utility infrastructure requirements for smart cities using the integration between BIM and GIS. Sustain. Cities Soc. 2020, 57, 102120. [Google Scholar] [CrossRef]
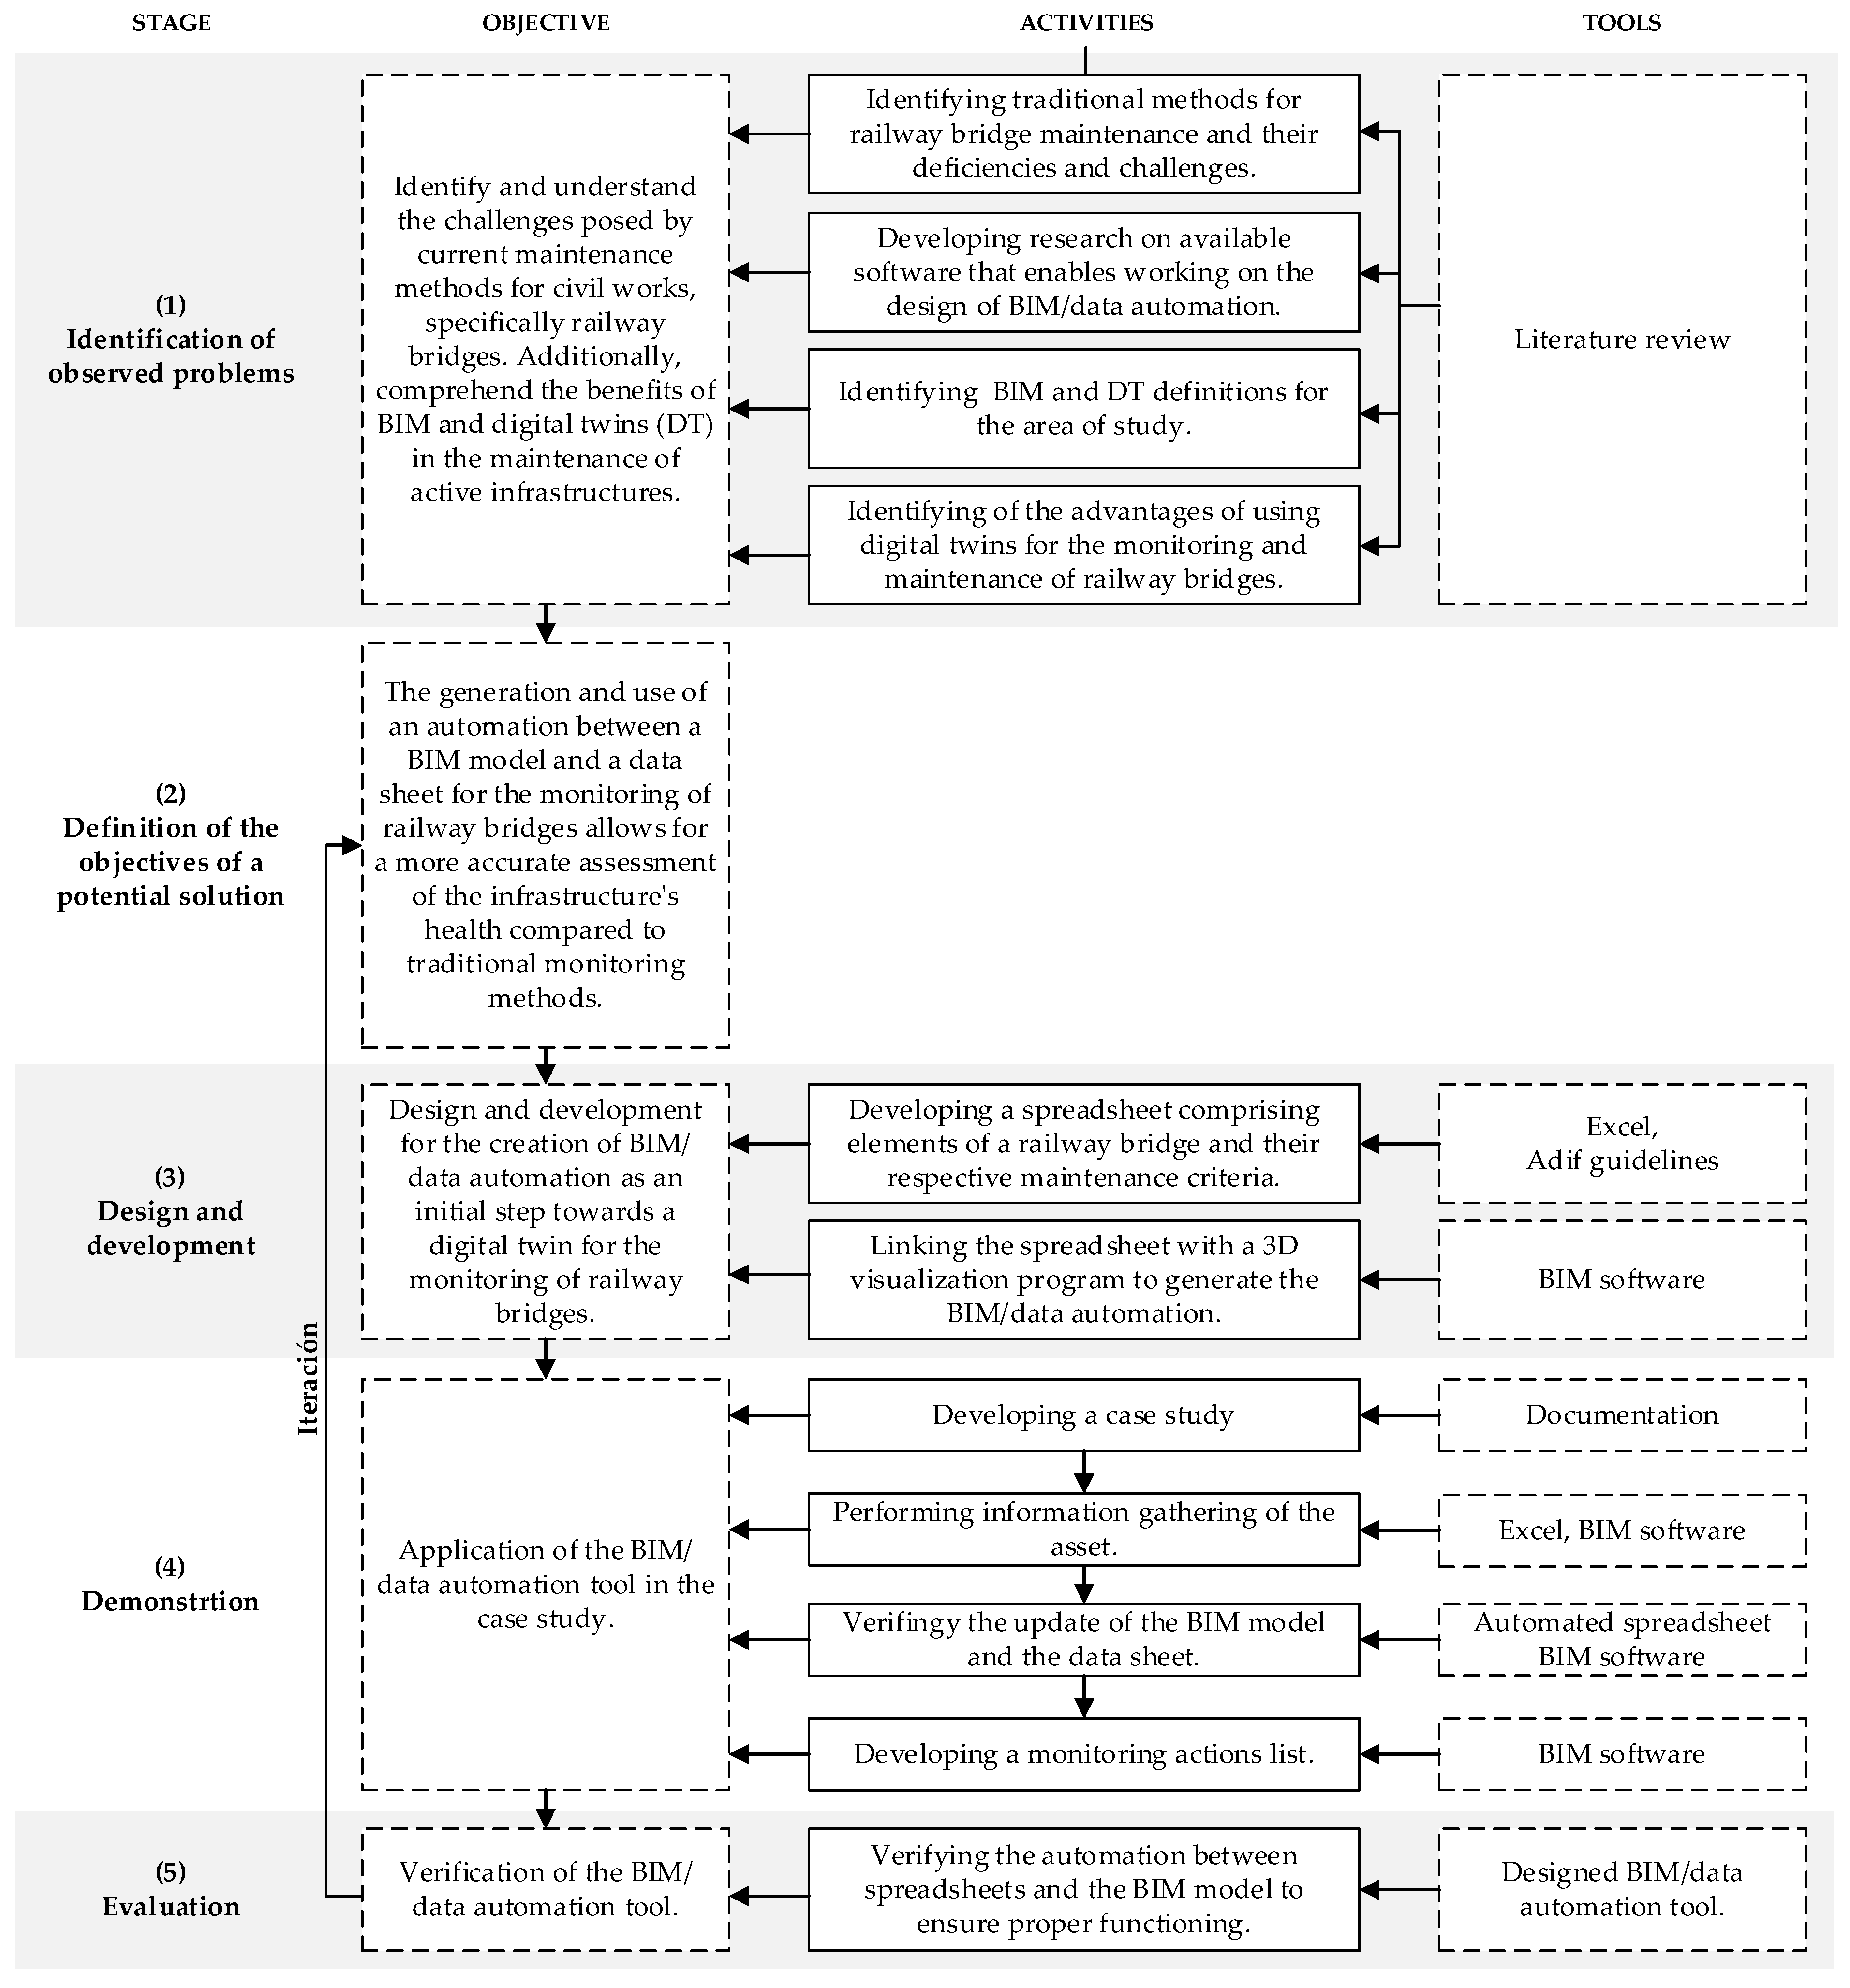
Figure 1. Research method.
Applsci 14 06209 g001
Figure 2. Flowchart of the developed methodology.
Applsci 14 06209 g002
Figure 3. Tabolango bridge.
Applsci 14 06209 g003
Figure 4. Software used to generate the BIM/data automation.
Applsci 14 06209 g004
Figure 5. Excerpt from the automated spreadsheet, pier lintels.
Applsci 14 06209 g005
Figure 6. Parameters of the bridge lintels.
Applsci 14 06209 g006
Figure 7. Identity data of the bridge elements.
Applsci 14 06209 g007
Figure 8. Analysis results.
Applsci 14 06209 g008
Figure 9. Filters created in visibility/graphics in Revit®.
Applsci 14 06209 g009
Figure 10. Excerpt of the first part of the data extraction flow from Revit® to MS Excel®, lintels of the piles.
Applsci 14 06209 g010
Figure 11. Excerpt from the second part of the data extraction flow from Revit® to MS Excel®, lintels of the piles.
Applsci 14 06209 g011
Figure 12. Excerpt from the automated spreadsheet, lintels of the piles.
Applsci 14 06209 g012
Figure 13. First part of the data import flow from MS Excel® to Revit®, lintels of the piles.
Applsci 14 06209 g013
Figure 14. Second part of the data import flow from MS Excel® to Revit®, lintels of the piles.
Applsci 14 06209 g014
Figure 15. Visualization of an excerpt from the parametrized BIM model with the imported information.
Applsci 14 06209 g015
Table 1. Excerpt of the inspection criteria for the pier shaft.
DamageCategoryDamage Intensity
Vertical cracks4(1) Localized cracks with an opening < 2 mm, affecting < 20% of the shaft height, regardless of the opening.
(2) Localized cracks with an opening of 2–5 mm, affecting between 20–40% of the shaft height, regardless of the opening.
(3) Localized cracks with an opening of 5–10 mm, affecting 40–60% of the shaft height, regardless of the opening.
(4) Localized cracks with an opening > 10 mm, affecting > 60% of the shaft height.
Moisture, patinas, crusts, or efflorescences2(1) Extent < 25% of the element’s surface (No other damage).
(2) Extent between 25–50% of the element’s surface, or there are other significant deteriorations.
(3) Extent between 50–75% of the element’s surface or associated medium-severity damage.
(4) Extent > 75% of the element’s surface, or there are other high-severity deteriorations.
Paintings/Graffiti1(1) Extent < 25% of the affected surface.
(2) Extent between 25–50% of the affected surface.
(3) Extent between 50–75% of the affected surface.
(4) Extent > 75% of the affected surface.
Rooted arboreal vegetation3(1) Woody vegetation in initial growth, causing no deterioration to the shaft.
(2) Woody vegetation causing slight deterioration.
(3) Woody vegetation causing medium deterioration.
(4) Woody vegetation causing severe deterioration.
Nesting, dirt2(1) Isolated presence of dirt or isolated deposits of small volume.
(2) Widespread presence of dirt on < 30% of the pile elements.
(3) Widespread presence of dirt on 30–60% of the pile elements.
(4) Widespread presence of dirt on > 60% of the pile elements.
Table 2. Excerpt of the inspection criteria for the span beam.
DamageCategoryDamage Intensity
Cracks perpendicular to the main axis of the beam4(1) Cracks not associated with bending stresses, with an opening < 0.40 mm.
(2) Cracks not associated with bending stresses, with an opening > 0.40 mm; cracks associated with bending stresses, with an opening < 1.00 mm or affecting < 40% of the beam’s depth.
(3) Cracks associated with bending stresses, with an opening between 1.00–3.00 mm or affecting 40–60% of the beam’s depth.
(4) Cracks associated with bending stresses with an opening > 3.00 mm or affecting > 60% of the beam’s depth.
Honeycombing or gravel nests2(1) Surface wear, affecting < 25% of the beam’s surface.
(2) Surface wear, slight reduction in concrete cover, affecting 25–50% of the beam’s surface.
(3) Noticeable reduction in concrete cover, affecting 50–75% of the beam’s surface.
(4) Degradation, visible rebar, affecting > 75% of the beam’s surface.
Herbaceous vegetation, moss, or lichens2(1) Non-woody vegetation covering < 25% of the beam’s surface.
(2) Non-woody vegetation covering 25–50% of the beam’s surface.
(3) Non-woody vegetation covering 50–75% of the beam’s surface.
(4) Non-woody vegetation covering > 75% of the beam’s surface
Deformations4(1) Visible deformation, but < 0.05% of the beam’s magnitude relative to its theoretical plane.
(2) Visible deformation, but between 0.05 and 0.10% of the beam’s magnitude relative to its theoretical plane.
(3) Visible deformation, but between 0.10 and 0.50% of the beam’s magnitude relative to its theoretical plane.
(4) Visible deformation, but > 0.50% of the beam’s magnitude relative to its theoretical plane.
Visible/corroded/broken rebar4(1) Visible secondary rebar.
(2) Visible main rebar or corroded secondary rebar with losses < 50% of the beam’s reinforcement.
(3) Corroded main rebar with losses < 10% of the main reinforcement section, or secondary rebar with losses ≥ 50%.
(4) Corroded main rebar with losses ≥ 10% of the main reinforcement section.
Table 3. Descripción niveles de gravedad del daño. Description of damage severity levels. The colors are associate of each level for visual representation in the spreadsheets and models.
Damage SeverityDescription
1Defects with no impact on the structural behavior of the asset, railway operations, or the durability or functionality of the asset.
2Defects with no impact on the structural behavior of the asset or railway operations but that undermine the durability or functionality of the asset.
3Defects indicating a pathological evolution that may affect the structural safety of the asset, the safety of the users, or railway operations.
4Defects affecting structural safety or railway operations. Speed limitation is required to maintain safety levels.
Disclaimer/Publisher’s Note: The statements, opinions and data contained in all publications are solely those of the individual author(s) and contributor(s) and not of MDPI and/or the editor(s). MDPI and/or the editor(s) disclaim responsibility for any injury to people or property resulting from any ideas, methods, instructions or products referred to in the content.