Article

Robust Bluetooth AoA Estimation for Indoor Localization Using Particle Filter Fusion

State Key Laboratory of Information Engineering in Surveying, Mapping and Remote Sensing, Wuhan University, Wuhan 430072, China
*
Author to whom correspondence should be addressed.
Appl. Sci. 2024, 14(14), 6208; https://doi.org/10.3390/app14146208
Submission received: 12 May 2024 / Revised: 11 July 2024 / Accepted: 11 July 2024 / Published: 17 July 2024
(This article belongs to the Special Issue Future Information & Communication Engineering 2024)

Abstract

:
With the growing demand for positioning services, angle-of-arrival (AoA) estimation or direction-finding (DF) has been widely investigated for applications in fifth-generation (5G) technologies. Many existing AoA estimation algorithms only require the measurement of the direction of the incident wave at the transmitter to obtain correct results. However, for most cellular systems, such as Bluetooth indoor positioning systems, due to multipath and non-line-of-sight (NLOS) propagation, indoor positioning accuracy is severely affected. In this paper, a comprehensive algorithm that combines radio measurements from Bluetooth AoA local navigation systems with indoor position estimates is investigated, which is obtained using particle filtering. This algorithm allows us to explore new optimized methods to reduce estimation errors in indoor positioning. First, particle filtering is used to predict the rough position of a moving target. Then, an algorithm with robust beam weighting is used to estimate the AoA of the multipath components. Based on this, a system of pseudo-linear equations for target positioning based on the probabilistic framework of PF and AoA measurement is derived. Theoretical analysis and simulation results show that the algorithm can improve the positioning accuracy by approximately 25.7% on average.

1. Introduction

Indoor positioning is a critical component of a positioning system [1] that provides information about the position of a moving target at any given moment. Global navigation satellite systems (GNSSs), including the Global Positioning System (GPS), GLONASS, and Galileo, perform well in outdoor environments but poorly in indoor environments because the GNSS signals cannot enter buildings [2,3]. Due to the limitations of GNSSs, the indoor positioning problem has attracted much attention from the industry and academia. Three-dimensional indoor localization is in urgent demand, and in order to solve the indoor localization problem, several localization systems have been proposed and implemented using different techniques and approaches, including the utilization of multi-sensor-based localization-related techniques [4,5]. Although many existing systems try to solve this problem using a wide variety of techniques, indoor positioning systems based on wireless sensor networks (WSNs) are one of the most adopted solutions, including some specific IEEE standard radio signals such as Wi-Fi, ZigBee, Bluetooth, UWB, and RFID [6,7,8,9], which have been widely used in many real-world applications such as medical monitoring, target tracking, navigation, emergency call services, and transport. The vast majority of solutions for such systems are solved by standard-ranging techniques such as Received Signal Strength (RSS) [10], Time of Arrival (TOA), Time Difference of Arrival (TDOA), and AoA [11].
In the application of fifth-generation (5G) technology, Bluetooth Low Energy (BLE) is a key wireless technology for IoT systems. It is widely used in consumer electronic devices due to its advantages in terms of cost, efficiency, and availability. The Bluetooth Core Specification v5.1 introduces new capabilities that support high-accuracy direction-finding. The Angle of Departure (AoD) represents the direction from which the signal is sent from the transmitting device, while the Angle of Arrival (AoA) represents the direction from which the signal reaches the receiving device. The article mentions that direction of arrival (DoA) positioning technology is based on the 2D plane to obtain the angle θ , while AoA mostly represents three-dimensional space angle estimation ( θ , φ ) . The Constant Tone Extension (CTE) [12] has been added to BLE packets. With the help of the Switched Antenna Array (SAA), BLE devices can estimate the direction of the incident wave by utilizing the phase difference information of the signals received by different sensors. This effectively enables Angle of Arrival (AoA) estimation, eliminating the reliance on signal time synchronization without excessive hardware cost. Multi-signal classification (MUSIC) algorithms based on subspace methods, as the most referenced approach [13], can provide highly accurate estimation under high signal-to-noise ratio (SNR) conditions. However, it still faces challenges associated with high computational complexity and sensitivity to noise due to multipath and non-line-of-sight (NLOS) propagation. To overcome this challenge, various improved MUSIC algorithms [14,15,16] and advanced subspace methods have been explored. For example, the root-MUSIC algorithm estimates the direction of arrival (DoA) by finding polynomial roots and exhibits superior complexity and resolution compared to MUSIC [17]. The literature [18] proposes a sectoral You music method to reduce the algorithm complexity and efficiently realize fast DoA estimation. A previous study [19] used the Support Vector Machine (SVM) algorithm to improve DoA estimation accuracy with a small sample size. Wang et al. [20] introduced a novel sparse Bayesian learning method that improves the estimation accuracy with a low signal-to-noise ratio and a limited number of snapshots. Another study [21] used support vector regression (SVR) for adaptive target detection to obtain a system model related to target azimuth and radar data features. In [22], a deep neural network (DNN) was used to achieve higher DoA estimation accuracy with lower algorithmic complexity. This study demonstrated the generalization and effectiveness of the algorithm in various scenarios. Barthelme and Utschick [23] used a neural network and subarray covariance matrices to estimate the covariance matrix of the entire array. This approach produced additional DoA estimation results for multiple targets. Of the above methods, the traditional subspace methods rely heavily on a priori knowledge, such as the number of targets, and face limitations in the absence of such knowledge. The Music and Capon algorithms lack effective handling of low signal-to-noise ratio signals highly susceptible to high noise components, which affects the accuracy of target DoA estimation. Algorithms such as SVM, SVR, and Bayesian methods achieve target direction estimation by fitting a complex mapping relationship between the incident direction of the signal and the signal features. However, as the signal-to-noise ratio decreases, noise significantly affects the signal, complicating the relationship between the incident angle and the signal. This situation requires many samples for accurate function fitting, which is challenging. As the sample size increases, the information redundancy intensifies, making machine learning algorithms unable to estimate the DoA accurately. These issues also hinder the effectiveness of large-scale models such as NNs and DNNs in DoA estimation. In most cellular localization systems, AoA is usually not used as a primary localization parameter but as a secondary one.
Particle filters (PFs), introduced [24] as a numerical approximation to the nonlinear Bayesian filtering problem, can robustly track objects moving with accurate trajectories while automatically maintaining tracking associations. It can approximate the system state’s posterior distribution even if the posterior’s exact form is unknown. It may require a large number of particles and a large number of computations to achieve acceptable accuracy. Although particle-filtering algorithms have a broad application background in the target tracking problem, the research on tracking and navigation for a pure direction angle is still in the exploratory stage. Most of the moving targets in space are localized by coordinate positions, and there is a nonlinear problem in the transformation of coordinate positions and direction angles in space. For the nonlinear interference factors, particle filtering provides a good solution.
In this paper, a spatial multipath array model is proposed by fusing particle filtering algorithms and AoA measurements, and the mathematical model is built in a single reflection scenario where the locations of the localization station and the reflector are known. The system combines a robust adaptive angle estimation algorithm with a priori knowledge of target motion into a probabilistic framework of PF to localize a moving target. The shortcoming of the traditional AoA algorithm, which only localizes the stationary signal source, has been overcome. Then, a weight calculation function based on the Gaussian function is designed to reasonably calculate the weights of the particles and reduce the particle scarcity. It is verified that our algorithm can realize the tracking navigation of the target, and the algorithm is robust to the nonlinear model of the moving target.

2. Array Model

The realm of Bluetooth signal transmission through wireless channels is a labyrinth of complexity. A comprehensive understanding of the physical environment is a prerequisite for establishing a mathematical model, a task that often proves challenging. To derive a practical parameterized model, we must resort to simplifying assumptions for signal transmission, primarily encompassing array assumptions and spatial source signal assumptions.
(1) Assumption of signal array:
The array elements are independent of each other and have the same characteristics. The signal received by each array element has nothing to do with its size. It is only related to its position, and each array element contains white noise independent of the signal.
(2) Assumption of spatial signal source:
The signal propagates in a straight line in a uniform medium with the same direction, and there is no multipath effect. The signal waveform can be regarded as a beam of plane waves compared with the array. Azimuth and elevation angles are commonly used to indicate the direction of the beam coming in three dimensions. Currently, commonly used signal arrays for 3D spatial direction angle estimation generally use L-type arrays, cross-cross arrays, face arrays, etc. In this paper, we mainly estimate the spatial direction angle of the signal source based on the L-type array.
Assume that K uncorrelated narrowband signals with the same carrier frequency act on the x- and y-axes of a homogeneous surface array of M array elements, and the line array is vertically formed. The isotropic array elements are aligned along the x- and y-axes in the direction of the arriving wave to form an equally spaced linear array. Among them, the spacing between the Bluetooth signal array elements is d , as shown in Figure 1.
θ i , ϕ i , ( i = 1 , , K ) is the angle of incidence, where θ i and ϕ i represent the azimuth and elevation angles of the i-th signal, respectively. For narrowband signals, the time delay can be converted to a phase shift, and the time delay of an array element at position x m m = 1 , 2 , , M concerning the first array element is
τ m k = 1 c x m sin ϕ k
and the spacing between every two neighboring array elements is d , for which there is Equation (2):
τ m k = d sin ϕ k c m 1
In the array, the first array element is located at the origin. Taking the position of the first array element as the reference point, at time t, the spatial signal representation of the i-th signal arriving at the sensor of the reference array element is as follows:
s i t = z i t e j ω 0 t , i = 1 , , K
where z i ( t ) denotes the i-th signal complex envelope containing the angle information of the spatial signal at the time t. e j ω 0 t represents the source carrier. When the signal is a narrowband acoustic source signal, it satisfies z i ( t τ ) z i ( t ) . Then s i ( t τ ) can be expressed as:
s i t τ = z i t τ e j ω 0 t τ z i t e j ω 0 t τ , i = 1 , , K
The vector that models the phase shift of each antenna based on AoA is generally referred to as the array streamer vector or the steering vector. x m ( t ) is denoted as the data received by the m-th array element in the array, as shown below:
x m ( t ) = i = 1 K s i ( t τ m i ) + n m ( t )
where τ m i represents the time delay from the i-th signal to the m-th array element with respect to the reference array element, and n m ( t ) represents the additive noise of the m-th array element. From the above, the received signals of the array on the x-axis and y-axis are, respectively:
X = A x S + N x Y = A y S + N y
where S C 1 × N represents the array signal data. N x C 1 × N , N y C 1 × N are the received noise, and the value of the orientation matrix A x C M × 1 is:
A x = 1 1 1 e j 2 π d cos θ 1 sin 1 / λ e j 2 π d cos θ 2 sin 2 / λ e j 2 π d cos θ K sin K / λ e j 2 π ( M 1 ) d cos θ 1 sin 1 / λ e j 2 π ( M 1 ) d cos θ 2 sin 2 / λ   e j 2 π ( M 1 ) d cos θ K sin K / λ
Since the x-axis and y-axis share the array at the origin, the orientation matrix A y C ( M 1 ) × 1 is represented as:
A y = 1 1 1 e j 2 π d cos θ 1 sin 1 / λ e j 2 π d cos θ 2 sin 2 / λ e j 2 π d cos θ K sin K / λ e j 2 π ( M 1 ) d cos θ 1 sin 1 / λ e j 2 π ( M 1 ) d cos θ 2 sin 2 / λ   e j 2 π ( M 1 ) d cos θ K sin K / λ
A x and A y are combined, as indicated below:
A = A x A y = a 1 , a 2 , , a K
Jointly, the corresponding representation of the signals received by the whole array can be obtained as follows:
G = A S t + N t
where S ( t ) and N ( t ) represent the K source signals and additive noise at time t, denoted as follows:
S ( t ) = s 1 ( t ) , s 2 ( t ) , , s K ( t ) T N ( t ) = n 1 ( t ) , n 2 ( t ) , , n M ( t ) T

3. Methods

3.1. MVDR

As one of the core tasks of array signal processing technology, beam forming can realize functions such as beam steering, interference and noise suppression, target identification and positioning, etc. The MVDR beamforming proposed by Capon is a commonly used algorithm [25], which weights and sums the output of the array and focuses the gain in one direction. The appropriate filter coefficients are chosen to minimize the average power at the array’s output under the constraint of the desired signal without distortion. Figure 2 shows the basic structure of the algorithm.
Assuming that the desired signal is undistorted, appropriate filter coefficients must be selected to minimize the average power of the array output. The MVDR weight optimization problem can be expressed as:
m i n w w H R i + n w   s . t . w H a 0 = 1
The above MVDR optimization problem can be solved using the Lagrange multiplier method as follows:
w o p t = R i + n 1 a 0 a 0 H R i + n 1 a 0
where w = ( w 1 , w M ) T is the complex weighting vector of the beamformer and R i + n 1 and a 0 represent the ideal interference plus noise covariance matrix and the precise desired signal steering vector. In practice, they are usually unavailable, so the sampled covariance matrix R ˜ 1 and the nominal guiding vector a ¯ 0 based on the array geometry computed are commonly used instead [26], and in this case, the MVDR beamformer is also referred to as the sampled covariance matrix inversion (SMI) beamformer [11]:
w S M I = a R ˜ 1 a ¯ 0 = R ˜ 1 a ¯ 0 a ¯ 0 H R ˜ 1 a ¯ 0
a = 1 a ¯ 0 H The output sequence of the beamformer is:
y k = w S M I H x k
The output SINR of the beamformer is:
S I N R E w H x s ( k ) x s H ( k ) w E w H x i + n ( k ) x i + n H ( k ) w = w H R s w w H R i + n w = σ 0 2 w H a 0 2 w H R i + n w ,
σ 0 2 = E s i ( k ) s i ( k ) H is the expected signal power. The array pattern of the Capon beamformer represents the response relationship between the complex weighted vector and the incident signal in a given direction.
Also known as the beam response, it can be expressed as:
B θ = w H a θ
The overall execution process steps of the MVDR algorithm, designed with a systematic approach, are as follows:
(1)
Conduct L snapshot observations of the signal source at time t and use the formula R k = 1 L i = 1 L G k i G k i H to construct a covariance matrix from the 2M − 1 signal data received by the array.
(2)
Calculate the inverse matrix or pseudo-inverse matrix of the covariance matrix to represent the relationship between signals.
(3)
Calculate the weight vector, which is the inverse matrix (or pseudo-inverse matrix) of the covariance matrix and the received signal.
(4)
Sort according to the size of the eigenroots, take the eigenvectors corresponding to the first K larger eigenvalues to form the signal subspace, and the remaining eigenvectors are the noise subspace.
(5)
Change ( θ , ϕ ) , and calculate the spectral function according to the formula to find the position of the maximum value, and then determine the source’s azimuth angle and elevation angle.

3.2. Particle Filter

Particle filtering (PF) stands out as a unique approach where a probability distribution is represented by a set of random samples, known as particles, drawn from the distribution. This method’s strength lies in its ability to easily model nonlinear transformations of random variables, making it a perfect fit for target-tracking problems. Particle filtering is a fusion of the Monte Carlo method and Bayesian estimation theory, serving as an approximate algorithm of Bayesian estimation based on sampling theory. The basic idea is to find a group of random samples with weights in the state space to approximate the conditional posterior probability density p x k z 1 : k , and replace E x k z 1 : k with the sample mean to obtain the minimum variance estimate of the state.
Furthermore, x k j , W k j j = 1 N (with N as the number of particles and W k as the weight of the particles) is the random variable describing the posterior probability p x k z 1 : k and is the normalized weight of the particle. The state estimation result at time k can be expressed as:
x ¯ k = j = 1 N x k j W ˜ k j
The update process of particles is divided into two parts; the update of x k j is sampled from the important density function q x k x 1 : k 1 j , z 1 : k . The update of u k j is obtained by a one-step transfer of the first-order Markov chain.
Using the prior probability density as the important density function, even if q x k J x k 1 J , z 1 : k = p x k j x k 1 j , the weight updating process can be described as W k j W ˜ k 1 j p z k x k j .

3.3. MVDR+PF Nonlinear Dynamical System Modeling

The particle filter algorithm needs to build a model of the system in order to predict its state. When the system model is challenging to obtain, an accurate model can be constructed by constructing an approximate model. This paper mainly implements the system model construction of moving targets in angle estimation navigation in the form of state equations and measurement equations.
  • Establishment of state equations
The motion of the target object generally includes uniform velocity motion and variable velocity motion. To better describe the operation of the object, the state of the target is described by the angular position quantity, angular velocity quantity, and angular acceleration quantity in this study. Assuming that the target object moves along a straight line in a short period, the sampling time is Δ T , the true azimuth angle of the target at the sampling moment k Δ T is θ ( k ) , the target’s movement speed is θ ˙ ( k ) , and the acceleration is θ ¨ ( k ) . The formula for the change in the target’s angular state can be expressed as:
θ ( k + 1 ) = θ ( k ) + θ ˙ ( k ) Δ T + 1 / 2 θ ¨ ( k ) Δ T 2 + 1 / 6 ν Δ T 3 θ ˙ ( k + 1 ) = θ ˙ ( k ) + θ ¨ ( k ) Δ T + 1 / 2 v Δ T 2 θ ¨ ( k + 1 ) = θ ¨ ( k ) + Δ T 𝒱
Among them, 𝒱 represents the process noise of the system, which is independent of the observation noise and satisfies the Gaussian distribution of 𝒱 N ( 0 , Q ) . Noise causes fluctuations in angle, angular velocity, and angular acceleration. The state space model of the target motion is obtained by combining the expressions, and the expression is as follows:
θ ( k + 1 ) θ ˙ ( k + 1 ) θ ¨ ( k + 1 ) = 1 Δ T 1 / 2 Δ T 2 0 1 Δ T 0 0 1 θ ( k ) θ ˙ ( k ) θ ¨ ( k ) + 1 / 6 Δ T 3 1 / 2 Δ T 2 Δ T 𝒱
We expand the signal source into three-dimensional space, and the target direction angle includes the azimuth angle and the elevation angle. The state x is expressed as:
x = [ θ , θ ˙ , θ ¨ , φ , φ ˙ , φ ¨ ] T
The state vector at time k is expressed as:
x k = A x k 1 + B ν
Among them, the state transition matrix is:
A = 1 Δ T 1 / 2 Δ T 2 0 1 Δ T 0 0 1 1 Δ T 1 / 2 Δ T 2 0 1 Δ T 0 0 1 ,   B = 1 / 6 Δ T 3 1 / 2 Δ T 2 Δ T 1 / 6 Δ T 3 1 / 2 Δ T 2 Δ T
  • Establishment of observation model
The observation model is another important model in the particle filter framework, which is expressed in the form of observation equations. The observation equation mainly solves the matching degree between the predicted state and the observed state of the moving target, and then updates the state prediction estimate of the target. Most observation models are obtained in the form of data collected by sensors. The DOA navigation and tracking method for moving targets collects signals containing status and noise information of moving targets through array sensors and builds a system observation model through the collected data. The corresponding representation is as follows:
G k = f x k , ω
Among them, x k represents the status information of the target at the time k of the system, and ω represents the observation noise, which is independent of the process noise. The establishment of the observation model of moving objects is based on the signal data received by the array. In this paper, the L-shaped array model is used as the signal model, and the original data of signal observation obtained are
G = A S ( t ) + N ( t )
where S ( t ) is the source signal, A is the steering matrix of the array, and N ( t ) is the observation noise of the array elements in the array. In actual situations, the signal is often collected in multiple snapshots to determine the effectiveness of the collected signal and the algorithm’s accuracy. Assuming that the signal is observed in snapshots at the time k , the observation output matrix of the array is:
G k = [ G ( k L + 1 ) ,       G ( k L + 2 ) ,       ,       G ( k L + L )
The covariance matrix of the original data can be obtained from the above formula, expressed as follows:
R k = 1 L G k G k H
The above equation represents the observation equation of the system. To further explain the quantities in the moving target DOA navigation and tracking algorithm based on the particle filter algorithm, the entire algorithm design mainly includes the relationship between three quantities: the observed value, the predicted value, and the actual value. The proper value represents the true direction position of the target source, the expected value represents the result value obtained by the particle filter algorithm, and the observed value is the measured value of the observation equation that reflects the size of the actual value. The relationship between the three is shown in Figure 3.
In summary, the equations of the system model in the moving target DOA navigation and tracking algorithm based on the particle filter algorithm represent the prior probability and conditional probability expressions in the particle filter algorithm. Among them, p x k x k 1 , p y k x k essentially represents the state equation and observation equation in this section. The robust angle estimation fusion algorithm proposed in this article uses the primary particle filter algorithm process as the basic implementation framework. The algorithm design is carried out by setting state conditions and parameters, which can be carried out in Figure 4.
1. Initialization
Assume there are particles N , the number of snapshots is L , and the total number of iterations is Y ;
For i = 1 : N , initialize the particle state, azimuth angle θ 0 ( i ) U [ 0 , π ] ;
The pitch angle φ 0 ( i ) U [ 0 , π / 2 ] , φ ˙ 0 ( i ) , θ 0 ˙ ( i ) N μ 0 , ε 0 2 , i = 1 , , N , U e 1 , e 2 is evenly distributed, N μ , ε 2 normal distribution, θ ¨ 0 ( i ) and φ ¨ 0 ( i ) are initialized to 0, and the weight value is 1/N;
2. Iteration: for i = 1 : Y
(a) Obtain observation data
For i = 1 : L ; obtain the observation data of the system through the array at time K, obtain the data covariance matrix according to R k = 1 L G k G k H ;
(b) Importance sampling stage
For the transfer equation according to status q x k ( i ) x 0 : k 1 ( i ) , Y 1 : k = p x k ( i ) x k 1 ( i ) carry out sampling θ k ( i ) , φ k ( i ) ,
For i = 1 : N ; update the weight of the particle based on the weight calculation formula W k x k ( i ) = W k 1 x k 1 ( i ) p y k x k
Normalize the weights of particles according to W ˜ k x k ( i ) = W k x k ( i ) i = 1 N W k x k ( i )
(c) Algorithm resampling stage
Resample the particle set x k ( i ) , w k x k ( i ) and reinitialize the weight values.
Get new particle set x k ( i ) , w k x k ( i )
(d) Result output
Output the prediction results according to x k = i = 1 N w k x k ( i ) x k ( i )
(e) Reinitialize weights
For i = 1 : N , reset the weight of the particles w k x k ( i ) = 1 N
3. End.

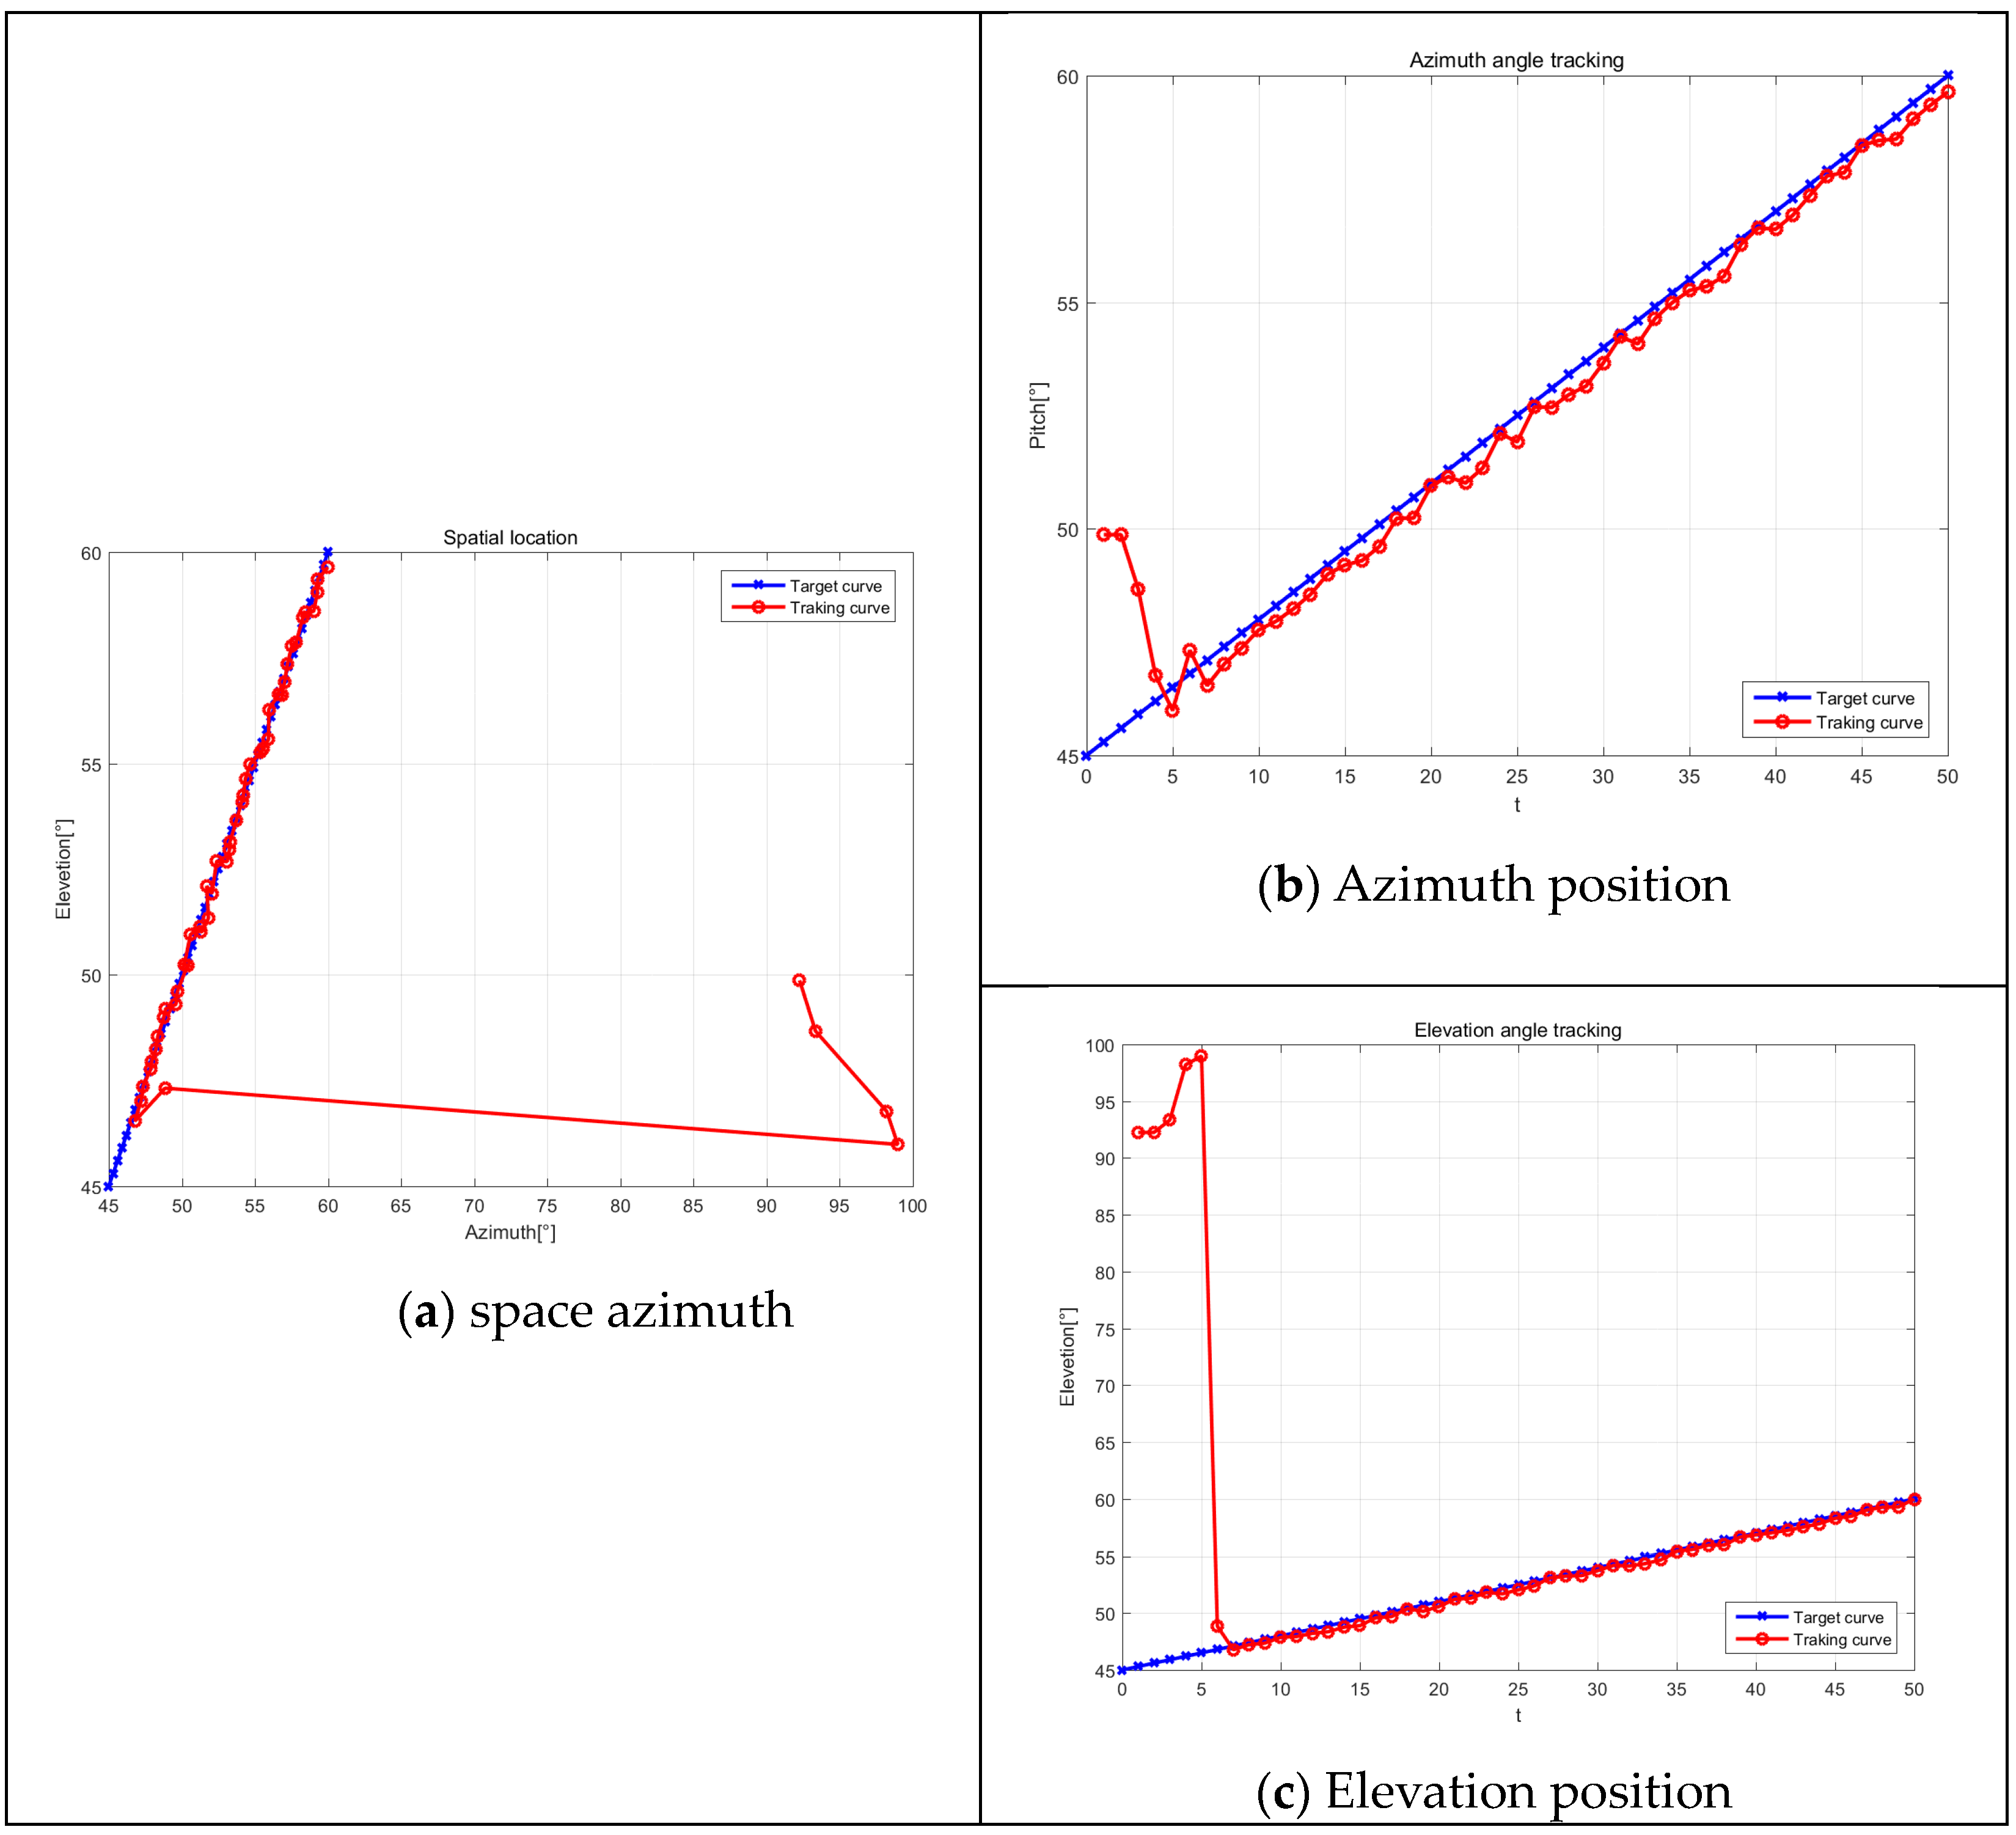
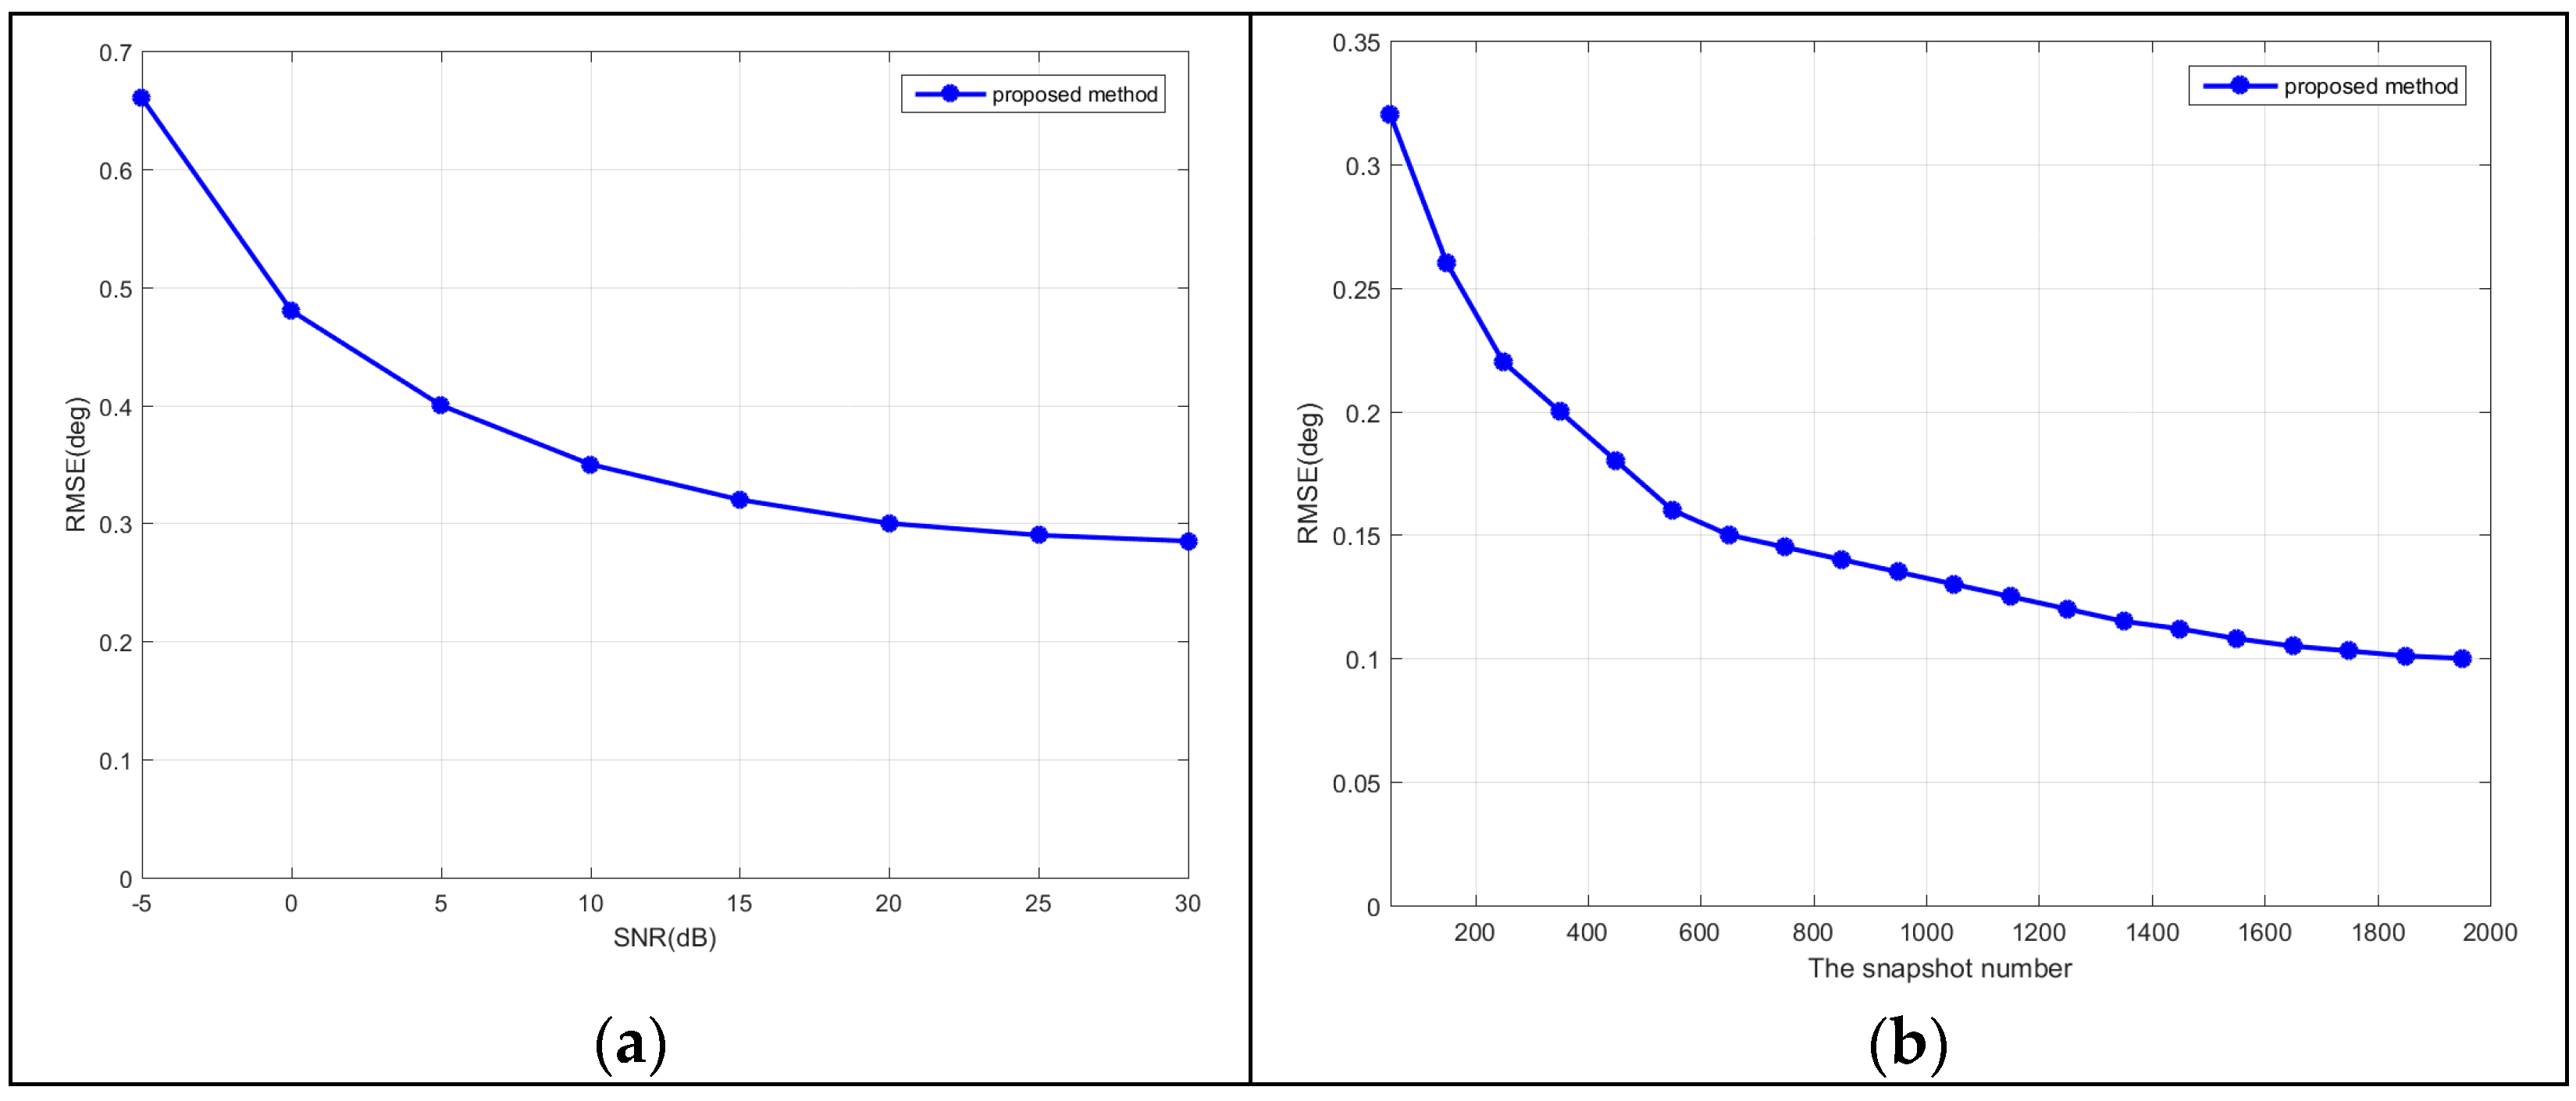
4. Simulation Experiments and Analyses

For the navigation and positioning problem based on moving targets, a simulation experiment was conducted to verify the effectiveness of the proposed algorithm. In this chapter, we tested the effectiveness of an improved Bluetooth AoA navigation algorithm. This algorithm combines particle filtering and the MUSIC algorithm, and we evaluated it through experimental simulation. The main aim of the simulation was to assess how the algorithm performs under different signal-to-noise ratios, numbers of snapshots, and numbers of particles when the target object moves at either a uniform or variable speed. The simulation experiment showed that, with a certain number of particles and snapshots, the improved algorithm can accurately and consistently navigate and track targets with uniform and variable speeds in space.
1. Simulation experiment on the impact of the target object’s uniform motion on the particle filter-based DOA navigation and tracking algorithm for moving targets.
Experimental conditions: L-shaped acoustic array, four array elements on each X-axis and Y-axis, and 0.2 m between array elements (the distance between array elements is greater than half the wavelength of the signal). The initial azimuth and elevation angles were set at (45°, 45°), and the wave signal was assumed to be a parallel wave. The number of snapshots was 256, the number of particles was 800, and observation noise was introduced with a signal-to-noise ratio of 10 dB.
The entire process was iterated over 50 steps. Figure 5a shows the deviation between the real trajectory of the target object in the spatial direction and the trajectory predicted by the algorithm. Figure 5b,c shows the relationship between the predicted angle and the true angle of each iteration from two angles: the azimuth angle and the overhead angle.
The results of the figure show that, except for the target’s starting position, the direction angle of the target object predicted by the algorithm deviated significantly, and the deviation between the predicted angle and the true angle at the remaining time is small. Therefore, it is concluded through simulation that under uniform speed conditions, the moving target DOA navigation and tracking algorithm based on particle filtering has good navigation and tracking performance for moving targets.
2. The effect of the target object under variable speed motion on the improved DOA navigation algorithm for Bluetooth signals based on particle filtering algorithm.
Experimental conditions: Assuming that the target object is stationary at the initial moment based on the conditions of Experiment 1, the initial velocity of each particle is modified to be 0.3°⁄s, and the acceleration is randomly transformed in the range of [−0.5, 0.5]. To better observe the tracking effect of the algorithm, the initial position of the particles is initialized as the real position. The simulation results are shown in Figure 6.
Figure 6a shows the deviation of the target object orientation trajectory and the algorithm-predicted trajectory in terms of the spatial orientation angle in the variable-speed condition. Figure 6b shows the prediction results of the algorithm’s azimuth and elevation angles on the target’s true angle under the variable speed condition. As can be seen from the change in the spatial angular position of the target in Figure 6a, the target object experienced accelerated motion, a decelerated motion process, and a reverse motion state during the whole moving process. In the simulation process, the trend of the direction change in the predicted curve and the trend of the target curve change is consistent, and the azimuth and elevation angles fluctuate around the actual value with small errors. It is concluded that in the case of variable speed motion of the target object, the algorithm can still predict the direction of the target correctly and track the target accurately.
3. The variation in RMSE with particles is assumed to be between the number of particles [100, 1000], the number of iterations is 20, and the number of particles increases by 50 each time compared to the previous one. In order to better observe the tracking effect of the algorithm, the initial position of the particle is initialized to be the actual position. The effect of the algorithm is judged by the root mean square (RMS) [24], and the corresponding formula for RMS is shown in Equation (28).
R m e s = 1 n 1 50 j = 1 50 [ P θ i T θ i 2 + P ϕ i T ϕ i 2 ]
where n represents the number of iterations the algorithm has gone through. P θ i and P ϕ i represent the predicted values of the azimuth and dip angles in step i ; T θ i and T ϕ i represent the real values of the azimuth and dip angles. The simulation results of the experiment are shown in Figure 7.
From Figure 7, it can be seen that with the increase in the number of particles, the error between the navigation trajectory and the actual trajectory becomes smaller and smaller and the localization accuracy is gradually improved. Comparing the RMSE values of the algorithm under the uniform speed condition and the variable speed condition, the accuracy of the algorithm under the uniform speed condition is higher, which means that the algorithm under the uniform speed condition is more likely to converge, which is in line with the actual situation. In the uniform speed condition, the algorithm results have been stabilized when the number of particles is 400. Under the variable speed condition, the algorithm starts to stabilize when the number of particles is 800, and the fluctuation of the algorithm is evident when the number of particles is less than 800. Therefore, the number of particles in Experiment 1 and Experiment 2 is chosen to be 800.
4. Examining the variation of RMSE of the algorithm proposed in this paper concerning the signal-to-noise ratio, the number of snapshots is taken as 1000, and the signal-to-noise ratio is varied from −5 dB to 30 dB; the number of particles is fixed at 800.
5. We examine the variation of RMSE of the algorithm proposed in this paper with the number of snapshots. The number of snapshots is between [50 and 2000], the number of iterations is 20, and the number of snapshots increases by 100 each time compared with the previous one. In order to better observe the tracking effect of the algorithm, the initial position of the particle is initialized to be the actual position; the remaining conditions are the same as in Experiment 1.
From Figure 8, it can be seen that the algorithm has good estimation accuracy when the signal-to-noise ratio ranges from 15 dB to 30 dB and the number of snapshots changes from 50 to 2000. The estimation accuracy of the algorithm becomes higher and higher as the signal-to-noise ratio and the number of snapshots increase. This is because the RMSE of the algorithm converges to the CRB bound as the signal-to-noise ratio and the number of snapshots increase.
6. The algorithm proposed in this paper is compared with two algorithms, single particle filter localization and angle estimation localization. Figure 9 shows the cumulative error distribution curves of the three algorithms. The CDF for horizontal localization is used as a performance metric for localization evaluation, defining the localization error as:
e = ( x ^ x t r u e ) 2 + ( y ^ y t r u e ) 2
From the figure, the localization performance of the proposed algorithm is better than that of the other two localization algorithms. The proposed method enables 90% of the users to locate within 3 m, while for the other two localization algorithms, the error is more than 5.6 m; the algorithm can improve the positioning accuracy by approximately 25.7% on average. From the CDF distribution curve, it can be seen that 47% of the target points are in LOS propagation. The proposed algorithm can fully estimate the target source location with the highest positioning accuracy.

5. Conclusions

Some of the attractive advantages of PF include its generality and ability to handle multimodal probability distributions and nonlinear functions. The system incorporates mvdr, a robust AoA estimation algorithm with a priori knowledge of the target’s motion model, into the probabilistic framework of the PF to achieve localization of a moving target. The system is first modeled from the target’s state equations as well as the observation equations. Through the system model, the target object’s behavioral information and the signal source’s transient information are combined to overcome the defects of the traditional DoA algorithm that only localizes the fixed signal source. Then, to reasonably calculate the weights of the particles and reduce the particle scarcity, a particle filtering weight calculation function based on the Gaussian function is designed to resample the function. The effectiveness of the algorithm is verified through simulation. It is verified that the algorithm can realize the tracking navigation of the target and is strongly robust to the nonlinear model of the moving target.
Although the algorithm’s feasibility is demonstrated through MATLAB simulation in this article, there are still several shortcomings in the algorithm’s research when compared to real-world conditions. There are numerous issues that need to be addressed in the future. The article outlines the future research directions as follows:
(1) In this paper, a particle filter-based algorithm for mobile target Bluetooth AoA navigation and tracking is proposed to address the challenge of tracking the movable trajectory of the target. It recognizes that coherent signal sources can interfere with Bluetooth AoA navigation and tracking technology. Therefore, it suggests that future work should consider the impact of coherent signals on the algorithm and propose effective methods to address this issue.
(2) Additionally, the paper examines the relationship between the spatial coordinates of the target object and its directional angle in space. It constructs a typical motion navigation trajectory for the target object and verifies the navigation and tracking algorithm through simulations in typical scenarios. Although the results demonstrate basic navigation and tracking of the target trajectory, the algorithm’s performance is less than satisfactory when the directional trajectory of the target object undergoes significant changes.
(3) When designing the particle filter-based mobile target Bluetooth AoA navigation tracking algorithm, it is assumed that the signal of a single target object exists. However, there is insufficient research on effectively extracting valid data when there are multiple targets, and real experimental verification is lacking. Real-world scenarios present more influencing factors compared to simulation scenarios, thus potentially affecting the algorithm in unexplored ways. To enhance the algorithm’s robustness, it is essential to incorporate more influencing factors and carry out real experimental tests.

Author Contributions

Conceptualization, R.C.; methodology, K.Q.; software, K.Q.; validation, R.C.; formal analysis, K.Q.; investigation, W.L.; resources, G.G.; data curation, K.Q.; writing—original draft preparation, K.Q.; writing—review and editing, Y.W.; visualization, Y.W.; supervision, G.G.; project administration, G.G.; funding acquisition, R.C. All authors have read and agreed to the published version of the manuscript.

Funding

This research was funded by the NSFC (grant no. 42201460) and the National Key Research and Development Program of China (grant nos. 2023YFB3906600).

Institutional Review Board Statement

Not applicable.

Informed Consent Statement

Not applicable.

Data Availability Statement

Data is unavailable due to privacy.

Conflicts of Interest

The authors declare no conflicts of interest.

References

  1. Mautz, R. Indoor Positioning Technologies. 2012. Available online: https://store.west-hn.com/wp-content/uploads/2022/05/Mautz-R.-Indoor-Positioning-Technologies.pdf (accessed on 10 July 2024).
  2. Alghisi, M. Integration of GNSS and 5G for Precise Urban Positioning. 2020. Available online: https://www.politesi.polimi.it/retrieve/04c68f47-3796-48ca-8dd3-15effc663cbb/2021_12_Alghisi.pdf (accessed on 21 December 2021).
  3. Laoudias, C.; Moreira, A.; Kim, S.; Lee, S.; Wirola, L.; Fischione, C. A survey of enabling technologies for network localization, tracking, and navigation. IEEE Commun. Surv. Tutor. 2018, 20, 3607–3644. [Google Scholar] [CrossRef]
  4. Chen, X.; Xie, Y.; Zhou, Z.; He, Y.; Wang, Q.; Chen, Z. An Indoor 3D Positioning Method Using Terrain Feature Matching for PDR Error Calibration. Electronics 2024, 13, 1468. [Google Scholar] [CrossRef]
  5. Nam, L.S. Pedestrian Navigation System in Mountainous non-GPS Environments. J. Inf. Commun. Converg. Eng. 2021, 19, 188–197. [Google Scholar] [CrossRef]
  6. Oguntala, G.; Abd-Alhameed, R.; Jones, S.; Noras, J.; Patwary, M.; Rodriguez, J. Indoor location identification technologies for real-time IoT-based applications: An inclusive survey. Comput. Sci. Rev. 2018, 30, 55–79. [Google Scholar] [CrossRef]
  7. Farahsari, P.S.; Farahzadi, A.; Rezazadeh, J.; Bagheri, A. A survey on indoor positioning systems for IoT-based applications. IEEE Internet Things J. 2022, 9, 7680–7699. [Google Scholar] [CrossRef]
  8. Zhuang, Y.; Zhang, C.; Huai, J.; Li, Y.; Chen, L.; Chen, R. Bluetooth localization technology: Principles, applications, and future trends. IEEE Internet Things J. 2022, 9, 23506–23524. [Google Scholar] [CrossRef]
  9. Natgunanathan, I.; Fernando, N.; Loke, S.W.; Weerasuriya, C. Bluetooth low energy mesh: Applications, considerations and current state-of-the-art. Sensors 2023, 23, 1826. [Google Scholar] [CrossRef]
  10. Radnosrati, K. Time of Flight Estimation for Radio Network Positioning; Linköping University Electronic Press: Linköping, Sweden, 2020; Volume 2054. [Google Scholar]
  11. Ramtohul, A.; Khedo, K.K. Mobile positioning techniques and systems: A comprehensive review. Mob. Inf. Syst. 2020, 2020, 1–18. [Google Scholar] [CrossRef]
  12. Pau, G.; Arena, F.; Gebremariam, Y.E.; You, I. Bluetooth 5.1: An analysis of direction finding capability for high-precision location services. Sensors 2021, 21, 3589. [Google Scholar] [CrossRef]
  13. Al-Tabatabaie, K.F. A new improved-music algorithm for high resolution direction of arrival detection. J. Theor. Appl. Inf. Technol. 2015, 72, 101–105. [Google Scholar]
  14. Gupta, P.; Kar, S.P. MUSIC and improved MUSIC algorithm to estimate direction of arrival. In Proceedings of the 2015 International Conference on Communications and Signal Processing (ICCSP), Melmaruvathur, India, 2–4 April 2015; IEEE: Piscataway, NJ, USA, 2015; pp. 0757–0761. [Google Scholar]
  15. Astely, D.; Ottersten, B. The effects of local scattering on direction of arrival estimation with MUSIC. IEEE Trans. Signal Process. 1999, 47, 3220–3234. [Google Scholar] [CrossRef]
  16. Abeida, H.; Delmas, J.P. MUSIC-like estimation of direction of arrival for noncircular sources. IEEE Trans. Signal Process. 2006, 54, 2678–2690. [Google Scholar] [CrossRef]
  17. Hwang, H.K.; Aliyazicioglu, Z.; Grice, M.; Yakovlev, A. Direction of arrival estimation using a root-MUSIC algorithm. In Proceedings of the International Multi Conference of Engineers and Computer Scientists, Hong Kong, China, 19–21 March 2008; Volume 2, pp. 19–21. [Google Scholar]
  18. Zhang, Y.; Psounis, K. Efficient indoor localization via switched-beam antennas. IEEE Trans. Mob. Comput. 2019, 19, 2101–2115. [Google Scholar] [CrossRef]
  19. Sun, F.Y.; Tian, Y.B.; Hu, G.B.; Shen, Q.Y. DOA estimation based on support vector machine ensemble. Int. J. Numer. Model. Electron. Netw. Devices Fields 2019, 32, e2614. [Google Scholar] [CrossRef]
  20. Wang, L.; Zhao, L.; Bi, G.; Wan, C.; Zhang, L.; Zhang, H. Novel wideband DOA estimation based on sparse Bayesian learning with Dirichlet process priors. IEEE Trans. Signal Process. 2015, 64, 275–289. [Google Scholar] [CrossRef]
  21. Shamshirband, S.; Petković, D.; Javidnia, H.; Gani, A. Sensor data fusion by support vector regression methodology—A comparative study. IEEE Sens. J. 2014, 15, 850–854. [Google Scholar] [CrossRef]
  22. Chen, M.; Gong, Y.; Mao, X. Deep neural network for estimation of direction of arrival with antenna array. IEEE Access 2020, 8, 140688–140698. [Google Scholar] [CrossRef]
  23. Barthelme, A.; Utschick, W. A machine learning approach to DoA estimation and model order selection for antenna arrays with subarray sampling. IEEE Trans. Signal Process. 2021, 69, 3075–3087. [Google Scholar] [CrossRef]
  24. Li, P.; Kadirkamanathan, V. Particle filtering based likelihood ratio approach to fault diagnosis in nonlinear stochastic systems. IEEE Trans. Syst. Man Cybern. Part C (Appl. Rev.) 2001, 31, 337–343. [Google Scholar]
  25. Harmanci, K.; Tabrikian, J.; Krolik, J.L. Relationships between adaptive minimum variance beamforming and optimal source localization. IEEE Trans. Signal Process. 2000, 48, 1–12. [Google Scholar] [CrossRef]
  26. Shi, J.; Wang, J.; Hsu, A.Y.; O’Neill, P.E.; Engman, E.T. Estimation of bare surface soil moisture and surface roughness parameter using L-band SAR image data. IEEE Trans. Geosci. Remote Sens. 1997, 35, 1254–1266. [Google Scholar]
Figure 1. Signal model of DOA estimation.
Applsci 14 06208 g001
Figure 2. Beamforming basic structure.
Applsci 14 06208 g002
Figure 3. Relationship between the three measures.
Applsci 14 06208 g003
Figure 4. Flowchart of the algorithm for MVDR+PF.
Applsci 14 06208 g004
Figure 5. Tracking results under uniform velocity conditions.
Applsci 14 06208 g005
Figure 6. Target navigation tracking results under variable speed conditions.
Applsci 14 06208 g006
Figure 7. Changes in the effect of the number of particles on the root mean square value of the algorithm under uniform and variable speed conditions.
Applsci 14 06208 g007
Figure 8. Variation in RMSE with signal-to-noise ratio and with the number of snapshots. (a) Variation in RMSE with signal-to-noise ratio. (b) Variation in RMSE with the number of snapshots.
Applsci 14 06208 g008
Figure 9. The cumulative error distribution curves of three algorithms.
Applsci 14 06208 g009
Disclaimer/Publisher’s Note: The statements, opinions and data contained in all publications are solely those of the individual author(s) and contributor(s) and not of MDPI and/or the editor(s). MDPI and/or the editor(s) disclaim responsibility for any injury to people or property resulting from any ideas, methods, instructions or products referred to in the content.

